Embed Size (px)
Citation preview

0
STATE OF MAINE DEPARTMENT OF PUBLIC SAFETY BUREAU OF HIGHWAY SAFETY
FEDERAL FISCAL YEAR 2011
ANNUAL HIGHWAY SAFETY REPORT
LAUREN V. STEWART DIRECTOR, BUREAU OF HIGHWAY SAFETY

0
Table of Contents
A Message from the Director……………………………………………………...…1
Introduction…………………………………………………………………………..2
Executive Summary………………………………………………………………….4
Federal Fiscal Year 2011 Initiatives…..……………………………………..4
Federal Fiscal Year 2011 Challenges………………………………………..7
Performance Goals……………………………………………………………….…..8
Occupant Protection…………………….……………………………… ……….…..10
Child Passenger Safety………………………………………………….……..…….13
Teen Drivers….…………………………………………………………….………...24
Impaired Driving……………………………………………………….…………….30
Traffic Records…………………………………………………………..…………...34
Speed and Aggressive Driving……………………………………………...………...37
Motorcycle Safety………...………………………………………………...………...39
Paid and Earned Media…………………………………………………..…….….….41
Noteworthy Programs…………………………………………….………..………....46
Legislative Summary…………………………………………………………………50
Fiscal Year Summary………………………………………………………………....52
Appendix A: Motor Vehicle Crash Data……………………...……………..….…….53
Appendix B: Attitudinal and Observational Surveys…………………………………69

1
A Message from the Director The mission of the Department of Public Safety, Bureau of Highway Safety Office is to reduce fatalities, injuries, and economic losses resulting from motor vehicle crashes on Maine roadways. Our efforts are based on the concept that any death or injury is one too many and that traffic crashes are not accidents, but are preventable. I am pleased to submit this Annual Report for Federal Fiscal Year 2011. This report fulfills the Section 402 grant requirements with the National Highway Traffic Safety Administration (NHTSA) and highlights the many achievements and accomplishments of the State Highway Safety Office. I would like to thank the staff of the Highway Safety Office for all of their efforts to improve highway safety and for their assistance in grant application and report development. I would also like to thank all of our many partners in highway safety: those in federal and state departments as well as municipal and county law enforcement, fire and EMS departments and numerous not-for-profit agencies. We work together to represent the public in addressing our highway safety priorities. Over the years, the Highway Safety Office has championed many positive changes in highway safety behavior. We have seen steady decreases in motor vehicle crashes and fatalities, strengthened laws and public education and awareness, and renewed our commitment of working together with our partners to achieve the goals set out in our Highway Safety Plans.
Lauren V. Stewart, Director Maine Bureau of Highway Safety

2
Introduction The Maine Bureau of Highway Safety (MeBHS), established in accordance with the Highway Safety Act of 1966, is the focal point for highway safety in Maine and is the only agency in Maine with the sole responsibility to promote safer roadways. The MeBHS is a Bureau within the Maine Department of Public Safety. MeBHS currently consists of seven full-time employees all dedicated to ensuring safe motor transportation for everyone traveling on Maine roads and highways. MeBHS provides leadership and state and federal financial resources to develop, promote and coordinate programs designed to influence public and private policy, make systemic changes and heighten public awareness of highway safety issues.
The overall goal of the MeBHS is to reduce the rate of motor vehicle crashes in Maine that result in death, injuries, and property damage. Through the administration of federal funding from the National Highway Traffic Safety Administration, the Federal Highway Administration and State Highway funds, MeBHS impacted each of the major NHTSA priority program areas in Federal Fiscal Year 2011:
· · · · ·
Impaired Driving Occupant Protection Child Passenger Safety Traffic Records Police Traffic Services
Through additional programs developed after extensive state data analysis, we also impacted the areas of motorcycle safety, speed, and operating after suspension. We believe that through committed partnerships with others interested in highway safety, through a data driven approach to program planning, through public information and education, and with coordinated enforcement activities, we can achieve our goal to reduce fatalities and injuries. This Annual Report reflects our efforts to impact traffic safety in areas including occupant protection, impaired driving, child passenger safety, motorcycles, public education and information, and traffic records for Federal Fiscal Year 2011 (October 1, 2010 – September 30, 2011). Maine Bureau of Highway Safety Contact: Lauren V. Stewart, Director Maine Department of Public Safety Bureau of Highway Safety 164 State House Station Augusta, Maine 04333-0164 207-626-3840 207-287-3430 [email protected] www.maine.gov/dps/bhs Report Submitted: December 15, 2011

3
Governor: Paul R. LePage Commissioner, Dept. of Public Safety John E. Morris Director, Highway Safety Office Lauren V. Stewart Contract Grant Specialist: Laura Nichols Highway Safety Coordinators: Carl Hallman
Michelle Ward Johannah Oberg
Planning and Research Associate II: Janet Cummings Administrative Assistant: vacant Accounting Technician: Security and Employment Service Center Law Enforcement Liaison: Robert Annese

4
Executive Summary Federal Fiscal Year 2011 Initiatives
·
F
Maine Chiefs Challenge
or the fifth year in a row, MeBHS sponsored the Maine Law Enforcement Challenge. Nineteen law enforcement agencies submitted applications for this year’s Challenge: eleven local police departments and sheriffs’ agencies, and eight Maine State Police troops. The applications were judged in categories based on a department’s size. Applications were then forwarded to the International Association of Chiefs of Police National Challenge for judging. The Maine State Police scored first place in their division and the Sagadahoc County Sheriff’s Office placed third in their division. This was the third time that the Sagadahoc County Sheriff’s Office took third place in the national competition.
· Click It or Ticket/Buckle Up. No Excuses! Enforcement and Education
The MeBHS offered Maine law enforcement agencies sub-grant awards to participate in this year’s May and June Click It or Ticket/Buckle Up. No Excuses! Enforcement and Education Campaign. There were 75 law enforcement agencies who participated this year. Over 3,200 seatbelt tickets and warnings were issued during this two week campaign that ran in conjunction with the national crackdown period.
· Child Passenger Safety Inspection Stations and Distribution Sites
The Maine Child Safety Seat Program is unique in that it partners with agencies throughout the state to distribute car seats to families who need them, thus providing an important service to local communities. In 2011, a total of 1,641 child safety car seats, including car bed harness and pad kits, were ordered by MeBHS and sent directly to distribution sites around the state.
· Drunk Driving. Over the Limit. Under Arrest. Enforcement and Education
In 2011, MeBHS offered a two month High Visibility Impaired Driving Enforcement Campaign. During the campaign, which included the two week national impaired driving crackdown of August 19 to September 5, 2011, 60 law enforcement agencies participated in enforcing Maine’s tough impaired driving laws. Departments conducted dedicated details that resulted in 94 operating under the influence arrests.
· Speed Enforcement
The MeBHS conducted an analysis on statewide speed related crashes and their locations, then selected 14 law enforcement agencies from those locations to participate in this year’s Speed Enforcement Campaign. There were 4 sheriffs’ offices, 9 police departments and 3 Maine State Police troops who focused on speed enforcement from May 1 through September 5, 2011. Law enforcement officers wrote 2,055 speed summons during this campaign.

5
· Seatbelt Convincer Program
An estimated 6,400 people of all ages were provided with safety belt information through a variety of events where the MeBHS’s two Seatbelt Convincer units and one Rollover Simulator were on display.
· Ma
A
ine Crash Reporting System
newly revised crash reporting form was launched in January 2011. The new form allows officers enhanced options for data collection and a more user friendly format. All crash reports are submitted electronically from all Maine law enforcement agencies. The new form will allow us to gather and track more detailed information regarding crash causations including distracted driving.
·
·
·
·
Maine Driving Dynamics
The state’s defensive driving course, Maine Driving Dynamics, is a five hour defensive driving course that offers drivers the opportunity to improve their defensive driving abilities. Over 2,400 students took the class in 2011, up from 1,500 students in 2010.
Traffic Records Coordinating Committee
The Maine Traffic Records Coordinating Committee plays a major role in ensuring that a statewide traffic safety information system improvement program is successfully completed. As such, the Committee works together to determine deficiencies in existing traffic records systems and recommends and funds enhancement projects that will net the State the most results. These projects include measures to increase the timeliness, accuracy, completeness, uniformity, integration and accessibility of all crash records and data.
Statewide Observational Survey
The MeBHS contracted with the University of Maine Muskie School of Public Service for the 2011 NHTSA approved occupant protection observational seatbelt usage survey, which was conducted immediately following the two week “Click It or Ticket/Buckle Up. No Excuses!” seatbelt enforcement campaign in May and June 2011. The survey recorded observations at the 120 sites around the state that have been used in past years, plus an additional 36 sites that were primarily rural road segments. The 2011 seatbelt usage rate is 81.6%.
Bureau of Motor Vehicles Awareness and Attitudinal Surveys
As part of a joint effort to develop traffic safety performance measures for states and federal agencies, a GHSA and NHTSA working group identified a basic set of questions that could be used in periodic surveys that track driver attitudes and awareness concerning impaired driving, seat belt use, speeding, and distracted driving. This report was also used to determine general public awareness of the recently enacted primary belt law. The MeBHS contracted with the University of Maine Muskie School of Public Service to conduct three waves of surveys at eight Maine Bureau of Motor Vehicles (BMV) offices. Survey results reveal that the public is aware of the main feature of the primary belt law (that they can be stopped and ticketed simply for not wearing their seatbelt).

6
· SAFETEA-LU Administration
The staff of the Bureau of Highway Safety administers grants of over 2 million dollars in federal highway safety funds annually from several federal funding sources. These funds are administered under an approved highway safety plan developed from detailed data analysis of the State’s most imperative highway safety problems. Funds are used at the state and local community level to enhance behavioral traffic safety initiatives and results.
· November Seatbelt Enforcement Campaign
The campaign ran from November 15-28, 2010, the same period as the national seat belt enforcement crackdown period. This year’s participation rate increased from 31 agencies in the prior year to 49 agencies in 2010. The campaign resulted in 7,263 traffic stops, 2,438 seat belt summons, and 3,388 hours of dedicated overtime hours worked, averaging 1.97 traffic stops per hour.
· Holiday High Visibility Impaired Driving Enforcement Forty-two participating law enforcement agencies, an increase from last year’s 31 participants, conducted impaired driving enforcement details during MeBHS’s third year High Visibility Holiday OUI Enforcement Campaign that ran from November 22, 2010 through January 31, 2011. There were 259 operating under the influence arrests made during that time period, a 61% increase from last year’s 157 arrests made during the same campaign.
· F
ord Driving Skills for Life
MeBHS worked with Ford Driving Skills for Life to bring their program to Maine. In September 2011, Ford Driving Skills for Life visited Scarborough High School and Bonny Eagle High School. Students and faculty at both sites benefited from the teen driver safety program.
· D
riving Simulators
MeBHS was awarded a $20,000 grant from Ford Motor Company for the purchase of two driving simulators. These portable simulators include the hardware and software “One Simple Decision” which is specific to theteen driving issues of impaired and distracted driving. The simulators allow students to experience multiple driving scenarios which focus on the problems of distracted and impaired driving. MeBHS has taken the simulators to five high schools. Approximately 1,000 students have been able to use the simulators.
· Teen Driver Awareness Program
MeBHS’s Law Enforcement Liaison worked closely with AAA of Northern New England to produce a 2 hour Teen Driver Awareness Program which focuses on Graduated Drivers Licenses, Impaired Driving, Distracted Driving, Seat Belts and Parental Involvement. A one day Train-the-trainer class was designed to instruct school resource officers and school liaison officers on presenting this comprehensive program to pre-permitted and newly permitted teen drivers ages 14-16 and their parents. To date, 70 School Resource Officers have been trained in the Program and use of the Simulators.

7
Federal Fiscal Year 2011 Challenges
·
·
·
Young Drivers
Developing methods to reach teens and their parents to reduce the over-representation of teen drivers in fatal and serious injury crashes
Safe Communities
Developing increased participation at the local grass roots level regarding prevention activities to reduce highway crashes
Traffic Safety Resource Prosecutor Establishing a Traffic Safety Resource Prosecutor in the state

8
Performance Goals
In 2009, the NHTSA and the Governor’s Highway Safety Association (GHSA) released a minimum set of performance measures to be used by States and Federal agencies in the development and implementation of behavioral highway safety plans and programs. The minimum set of performance goals contains 14 measures: ten core outcome measures, one core behavior measure and three activity measures. The measures cover the major areas common to State highway safety plans and use existing state data systems. The Core Outcome Measures reported on this year’s Annual Report represent the measures established for Maine for Federal Fiscal Year 2011.
Core Outcome Measures Traffic Fatalities (FARS) C-1) To decrease traffic fatalities by 5% from the 5 year average of 170.8 for 2005-2009 to 162.3 by December 31, 2014. Serious Traffic Injuries (State Crash Data Files) C-2) To decrease serious traffic injuries 5% from the 5 year average of 920 for 2005-2009 to 874 by December 31, 2014. Mileage Death Rate (FARS) C-3a) To decrease the mileage death rate 5% from the 5 year average of 1.14 for 2005- 2009 to 1.08 by December 31, 2014. Rural Mileage Death Rate C-3b) To decrease the rural mileage death rate 5% from the 5 year average of 1.38 for 2005-2009 to 1.31 by December 31, 2014. Urban Mileage Death Rate C-3c) To decrease the urban mileage death rate 5% from the 5 year average of .48 for 2005-2009 to .45 by December 31, 2014. Unrestrained Passenger Vehicle Occupant Fatalities (FARS) C-4) To decrease unrestrained passenger vehicle occupant fatalities by 5% from the 5 year average of 62.6 for 2005-2009 to 59.5 by December 31, 2014. Alcohol Impaired Driving Fatalities (FARS) C-5) To decrease alcohol impaired driving fatalities by 5% from the 5 year average for 2005-2009 of 48 to 45.6 by December 31, 2014. Speeding Related Fatalities (FARS) C-6) To decrease speeding related fatalities by 5% from the 5 year average of 69.4 for 2005-2009 to 66 by December 31, 2014.

9
Motorcyclist Fatalities (FARS) C-7) To decrease motorcyclist fatalities by 5% from the 5 year average of 20.6 for 2005-2009 to 19.6 by December 31, 2014. Unhelmeted Motorcyclist Fatalities (FARS) C-8) To decrease unhelmeted motorcyclist fatalities by 5% from the 5 year average of 14.4 for 2005-2009 to 13.7 by December 31, 2014. Drivers Age 20 or Younger Involved in Fatal Crashes (FARS) C-9) To decrease drivers age 20 or younger involved in fatal crashes by 5% from the 5 year average of 20.6 for 2005-2009 to 19.6 by December 31, 2014. Pedestrian Fatalities (FARS) C-10) To reduce pedestrian fatalities by 10% from the 5 year average of 10.4 for 2005-2009 to 9.4 by December 31, 2014. Behavior Measure Seat Belt Usage Rate (Observed Seat Belt Use Survey) B-1) To increase statewide seat belt compliance by 2% from the 2009 survey results from 82.6% to 84.3% by December 31, 2014. Activity Measures A-1) To monitor seat belt citations issued during grant-funded enforcement activities. A-2) To monitor impaired driving arrests made during grant-funded enforcement activities. A-3) To monitor speeding citations issued during grant-funded enforcement activities.
Refer to Appendix A: Motor Vehicle Crash Data, Page 53, for supporting crash data for these Performance Goals. Additional information can be found at the Maine Transportation Safety Coalition’s website at www.themtsc.org .

10
Occupant Protection Problem Maine’s seatbelt usage rate peaked at 83% in 2008. Since then, there has been a gradual decline in the observed use of seat belts. The 2011 seatbelt usage rate stands at 81.6%. Objective The overall goal of Maine’s Occupant Protection Program is to increase safety belt use for all occupants, thereby decreasing deaths and injuries resulting from unrestrained motor vehicle crashes. In 2010, there were 123 fatalities involving passenger vehicles. Forty-one occupants were unrestrained, representing nearly 43% of fatalities involving passenger vehicles. This is an increase of over 10% from 2008, when the number of fatalities involving passenger vehicles was 108.
Figure 1. Seatbelt Usage Data
59%
82.6%75%
84%
50%55%60%65%70%75%80%85%90%95%
100%
2002 2004 2005 2006 2007 2008 2009
Perc
ent w
earin
g se
at b
elts
MaineUS
Safety Belt Usage
Source: Maine Strategic Highway Safety Plan, 2011 edition
Goals These goals were established for FFY 2010 in the FFY 2011 Highway Safety Plan:

11
To increase statewide seat belt compliance by 2% from the 2009 survey results from 82.6% to 84.3% by December 31, 2014. Progress In 2011, the seatbelt usage rate was 81.6%. To decrease unrestrained passenger vehicle occupant fatalities by 5% from the 5 year average of 62.6 for 2005-2009 to 59.5 by December 31, 2014. Progress The five year average from 2006-2010 for unrestrained passenger vehicle occupant fatalities is 55.4%. Strategies November High Visibility Enforcement and Education
The third year of MeBHS’s High Visibility Seatbelt Enforcement and Education Campaign saw a great law enforcement participation rate, increasing to 49 agencies from 31 agencies the prior year. The campaign ran from November 15-28, 2010, the same period as the national seat belt enforcement crackdown period. This campaign resulted in 7,263 traffic stops, 2,438 seat belt summons, and 3,388 hours of dedicated overtime hours worked, averaging 1.97 traffic stops per hour. The total seat belt enforcement federal funds expended by participating agencies totaled $135,400. This campaign was a resounding success, especially in such a short enforcement period. Click It or Ticket/Buckle Up, No Excuses! High Visibility Seatbelt Enforcement Campaign
The annual “Buckle Up, No Excuses!” seat belt education and enforcement campaign ran in conjunction with the national enforcement period of May 23 to June 5. This year, 75 law enforcement agencies participated in this campaign: 8 county Sheriff’s offices, 66 municipal police departments, and the Maine State Police. MeBHS offered an eight-pack of Power Flare PF-200 Safety Lights for use at motor vehicle crash scenes as an incentive for any law enforcement agency who participated in this year’s campaign. During the seatbelt enforcement period 3,270 seat belt tickets were issued and 8,819 vehicles were stopped. The number of combined average stops for all agencies was 2.29 stops per hour. Participating agencies spent $143,446 in federal funds for this seat belt enforcement effort. A cost analysis of this enforcement reveals that the enforcement campaign cost equaled $43.87 per ticket.
Statewide Observational and Attitudinal Surveys

12
A NHTSA approved occupant protection observational survey was conducted in June 2011, immediately after the “Buckle Up. No Excuses!” campaign. This survey showed an overall voluntary seat belt usage rate gradual decrease to 81.6%, down from 82.0% in 2010. Survey observations were recorded at the same 120 sites as in previous years. Two new components of the observational study that were introduced in 2008 were continued in this year’s survey. A selection of 36 additional sites composed of primarily rural road segments was chosen for observations. Also, motorcycle helmet use was recorded. Based on speculation that the high visibility enforcement campaign conducted by law enforcement around the state coupled with a statewide media campaign alerting the public of the primary belt law and the enforcement campaign might temporarily lead to an increased use rate, at least during the time of the campaign and shortly after, a full observation study was conducted again in September 2009. That study showed that use rates did drop by 2.12%. The result of this additional study led to continuing MeBHS’s heightened media coverage and enforcement awareness during the 2010 Holiday Enforcement Seatbelt Campaign. This year, to determine if the general public was aware of the enacted primary belt law, MeBHS’s contracted surveyor, the University of Maine Muskie School of Public Service, conducted three waves of surveys of drivers at eight Maine Bureau of Motor Vehicles (BMV) offices. The surveys showed that the public was aware of the main feature of the primary belt law, i.e., that they can be stopped and ticketed simply for not wearing their seat belts.
Copies of both the observational survey and the BMV survey results are included with this Annual Report. Convincer & Rollover Education Program
The MeBHS funds a highly successful seat belt education program through Atlantic Partners, EMS, formerly known as the Mid-Coast EMS Council, Inc., using the Convincer and the Rollover simulators and a highway safety display. In 2011, this program was made available at venues including: elementary, middle and high schools, colleges, health and safety fairs, corporate and military events, community festivals and fairs, conferences, and driver education classes. An estimated 6,400 people were given safety belt information through the variety of activities. Future Strategies Continue to provide grant funding to Maine law enforcement agencies to participate in the May and November NHTSA Click It Or Ticket national safety belt high visibility enforcement crackdown periods. Grant funding will be provided for dedicated overtime safety belt enforcement details and public education. In conjunction with the University of Southern Maine’s Muskie School of Public Service, conduct observational and attitudinal surveys to determine safety belt use in Maine. Funding Source

13
Federal Section 402 and 405 funds

14
Child Passenger Safety Problem Safe Kids Worldwide released a study observing the misuse of 3,442 child restraint systems in six states, with approximately 73 percent of restraint systems showed at least one critical misuse. 84 percent of child restraint systems showed critical misuses. Booster seat misuse was 41 percent. The most common form of misuses for all restraint systems included loose vehicle seat belt attachment to the restraint system and loose harness straps securing the child to the restraint system.
Objective The Maine Child Passenger Safety (CPS) Program provides leadership and coordination of CPS activities throughout the State. The Program provides leadership for all aspects of the state’s CPS Program and activities sufficient in number and quality to serve Maine’s children and families effectively and efficiently. Goals Reduce the percentage of child passenger safety seat misuse Educate the public on the importance of proper child passenger safety restraint use. Strategies Maine Child Passenger Safety Law Maine’s Child Passenger Safety (CPS) law is one of the strongest in the country. The law requires:
·
·
·
·
Children who weigh less than 40 lbs. ride in a child safety seat;
Children who weigh at least 40 lbs., but less than 80 lbs. and are less than 8 years old, ride in a federally approved child restraint system;
Children who are more than 8 years old and less than 18 years old and more than 4 feet 9 inches in height be properly secured in a safety belt and;
Children under 12 years old and who weigh less than 100 lbs. be properly secured in the back seat of the vehicle, if possible.

15
Maine Distribution Site Program The Maine Child Safety Seat Program is unique in that it partners with agencies throughout the state to distribute car seats to families who need them, thus providing an important service to local communities. The program provides an average of 1,600 child safety seats annually. Currently our program consists of approximately 35 distribution sites located throughout the state. Each site distributes child safety car seats to eligible families in that community or area. Distribution sites are required to employ a certified CPS Technician. Maine Inspection Site Program Currently there are approximately 35 inspection sites located throughout Maine. These sites provide parents with education about keeping their child safe when riding in the car by correctly using a child safety seat or safety belt. One-on-one lessons are offered by a certified CPS Technician explaining the correct use and installation of car safety seats and safety belts.
Child Safety Car Seat Purchases This year’s child safety seat grant covered costs associated with providing child safety car seats to approximately 35 distribution sites located throughout Maine. The child safety car seat orders were placed monthly by the sites. During the time period of October 1, 2010 through September 30, 2011, a total of 1,641 child safety car seats, including car bed harness and pad kits were ordered by MeBHS and sent directly to distribution sites, with the purchasing cost totaling $137,233.38 in federal funds. The type of child safety car seats provided consisted of: Cosco Scenera 4 HNS POS, Graco Turbo Booster, Graco Turbo Booster Backless, Evenflo Titan Factory Elite, Evenflo Kid No Back Booster, Evenflo Generations 65, Graco SnugRide-Commercial, Graco Nautilus, On Board Infant Car Seat, Chicco Key Fit 30, Cosco Pronto, Combi Navette, Evenflo Generations,Generations 65 Palermo, GR Toddler Nautilus, Sightseer, Express Car Seat and Angel Ride pad and harness kits. Child Passenger Safety Coordinator The Maine Child Passenger Safety (CPS) Coordinator provided leadership and coordination of CPS activities throughout the state to better serve Maine’s children and families effectively and efficiently. Activities of the CPS Coordinator for this grant period include some, but not all, of the following: ·
· · · ·
Conducted site visits to meet technicians/instructors, familiarize with each site and discuss any questions, needs or concerns Developed site agreements (i.e., distribution site and inspection station) for legal review Updated/changed numerous forms for release with the agreements Developed CPS Manual for release with the agreements Suspended Advisory Council and reinstituted it as a quarterly Steering Committee

16
·
·
· ·
· ·
· ·
· · · · · ·
· · · · · · ·
· ·
Established separate monthly working groups to continue as needed to discuss and plan for various aspects of CPS (i.e., technician mentoring, booster seat curriculum, CPS conference, and public outreach) Developed an agenda and held a CPS Annual Meeting for all available technicians/instructors to offer updates and CEU Held one CPS training Discontinued Instructor Agreements indefinitely, certified technicians/instructors are to follow recertification guidelines Revised pay structure for CPS activities Drafted letters to all monthly seat check site that were requesting BHS assistance that the Bureau would be discontinuing financial support Redirected funding of monthly Car Seat Events to better serve the State of Maine as a whole Developed Roving Special Community Events to provide Seat Check Events across the entire state annually (i.e., 2 events in Aroostook County, 2 in Washington County/eastern Maine, 2 in western Maine, and 2 in southern Maine) Developed language for mock scenario seat sign-offs with best case scenario expectations Developed a roving instructor option for technicians needing seat sign-offs before expiring Coordinated the Statewide Child Passenger Safety Program Researched possible areas to establish additional distribution sites Started analyzing distribution sites for effectiveness and need Attended Lifesavers Conference 2011 to obtain the necessary training and knowledge related to the CPS Coordinator position Manage statewide Child Passenger Safety Program resources Developed idea for information to be collected at Distribution Sites via an online database Worked with IT to design Distribution Site database concept Ensured new CPS information and updates were shared as appropriate Increased communication from both the distribution sites, inspection sites and CPS Technicians Revised CPS Technician contact database for accuracy via use of the data provided by Safe Kids Supported technicians financially to provide CPS education at the community level in local health fairs and extra events Attended Injury Prevention Workgroup representing child passenger safety in Maine Attended the Maine Transportation Safety Coalition (MTSC) representing child passenger safety in Maine
Class Instructors and the MeBHS CPS Coordinator at the Child Passenger Safety Training in September.

17
Child Passenger Safety Technician Certification Classes One NHTSA National Standardized Child Passenger Safety Technician Certification Class was held during this grant period. A total of 23 students attended and passed this intense training. The class was instructed by a team of 7 rotating CPS Instructors and 1 CPS Technician Class Assistant. The NHTSA National Standardized Child Passenger Safety Technician training course is four days long and included lectures, discussions, role playing and hands-on practice with a wide variety of child safety seats and vehicle seat belt systems. It is designed to teach through learning, practicing, and explaining the technical skills to serve as a child passenger safety resource for one’s organization, community and state.
Successful completion of this training provides an individual with national certification as a Child Passenger Safety Technician for two years. Students must pass both written and open book quizzes and hands-on skills testing. An additional requirement for successful completion is active participation in a car seat check up event on the final day of training.
CPS Annual Meeting The State Coordinator emailed an agenda to the CPS Community for an informational and technical technician meeting. The meeting included CPS technicians as guest speakers. CPS Technical Update Class One CPS Technical Update Class was held during the annual CPS meeting in which 31 students attended, including seven instructors. Monthly Car Seat Fittings Besides the inspection stations, there were 10 monthly seat check fitting locations available to the public on set schedules around the state. Child Passenger Safety Public Awareness Outreach CPS Exhibit Tables were on display across the state in conjunction with the health and safety fairs. Each table was staffed by a Certified CPS Technician who answered questions and provided education information to parents.
Nursing students (in yellow) with a MeBHS CPS Instructor at the Kennebec Valley Community College Health Fair

18
Child Passenger Safety National Conference The Maine CPS Training Coordinator attended the Lifesaver’s Conference in Phoenix, Arizona in March and Kidz in Motion (KIM) Conference in Orlando, Florida in June. Conference attendance was to focus on child passenger safety issues. CPS Training Trailer The MeBHS CPS training trailer has been re-inventoried. Future Strategies Develop comprehensive performance standards for child passenger safety instructors and technicians Develop standard operating guidelines for child passenger safety inspection and distribution sites Develop a car bed loaner program with State of Maine hospitals Promote a dedicated outreach program to educate Maine minority populations regarding the benefits of using safety belts and child restraints. This project may include production of print materials and paid media. Increase education to parents regarding child occupant protection/passenger safety for the age group of 8-12. Decrease the reliance on federal funds to fully support the Maine CPS program Funding Source Federal Section 2011, 402, and 405 funds

19
Maine Inspection Station Site Directory
*sites highlighted in yellow have scheduled car seat check events free to the public BANGOR EMMC 489 State Street Bangor, ME 04402 Located in Penobscot County (207) 973-4849 Please call to make an appointment
-OR- Penquis 262 Harlow Street Bangor, ME 04401 Located in Penobscot County (207) 973-3505 Please call to make an appointment BATH Bath Police Department 250 Water Street Bath, ME 04530 Located in Sagadahoc County (207) 443-5563 Please call to make an appointment BELFAST WCAP/Belfast Fire Department 273 Main Street Belfast, ME 04915 Located in Waldo County (207) 338-6809 Ext 313 Second
Thursday every month
9:00AM-1:00PM BIDDEFORD Biddeford Police Department 39 Alfred Street Biddeford, ME 04005 Located in York County 207-282-5127 Please call to make an appointment
CUMBERLAND Cumberland Fire Department 366 Tuttle Road Cumberland, ME 04021 Located in Cumberland County Phone: (207) 829-5421 ext 202 Please call to make an appointment ELIOT Eliot Police Department 27 Dixon Road Eliot, ME 03903 Located in York County Phone: (207) 439-1179 Please call to make an appointment FALMOUTH Falmouth Fire-EMS Department 8 Bucknam Road Falmouth, ME 04105 Located in Cumberland County (207)781-2610 1st Thursday of the month, 3:00PM-6:00PM FARMINGTON NorthStar EMS 111 Franklin Health Commons Farmington, ME 04101 Located in Franklin County (207) 779-2402 Please call to make an appointment FREEPORT Freeport Police Department 16 Main Street Freeport, ME 04032 Located in Cumberland County Phone: (207) 865-4800 Please call to make an appointment

20
GORHAM Gorham Fire Department 270 Main Street Gorham, ME 04038 Located in Cumberland County (207) 939-8175 Third Thursday of the month 1:00PM-5:00PM LEWISTON CMMC 300 Main Street Lewiston, ME 04240 Located in Androscoggin County (207) 795-2695 Please call to make an appointment
-OR-
Sister’s of Charity Health Systems Women’s Health Associates 330 Sabattus Street Lewiston, ME 04240 (207)777-4300 Please call to make an appointment
-OR- United Ambulance 338 East Avenue Lewiston, ME 04240 (207)795-2695 Third Thursday of the month 2:00PM-6:00PM MACHIAS Down East Community Hospital Family First: PATT RR1 Box 11 Machias, ME 04654 Located in Washington County (207) 255-0438 Please call to make an appointment
MILBRIDGE Washington Hancock Community Agency 2 Maple Street Milbridge, ME 04658 Located in Washington County (207) 546-2698 Ext 3371 Please call to make an appointment NORWAY Norway Fire Department 19 Danforth Street Norway, ME 04268 10:00AM-2:00PM May 7, August 20, November 12 (207) 743-1562 Ext 6951 -OR- Stephens Memorial Hospital 181 Main Street Norway, ME Located in Oxford County (207) 743-1562 Ext 138 Please call to make an appointment PRESQUE ISLE Presque Isle Fire Department 43 North State Street, Suite A Presque Isle, ME 04769 Located in Aroostook County (207) 769-0881 Please call to make an appointment ROCKLAND Fuller Auto Mall 179 Camden Street Rockland, ME 04841 Third Saturday of every month 9:00AM-1:00PM

21
ROCKPORT Penobscot Bay Medical Center 6 Glen Cove Drive Rockport, ME 04856 Located in Knox County (207) 596-8343 or 596-8711 Please call to make an appointment SCARBOROUGH Scarborough Police Department 246 US Route 1 Scarborough, ME 04074 Located in Cumberland County (207) 883-7760 Ext 115 Please call to make an appointment SOUTH BERWICK South Berwick Police Department 180 Main Street South Berwick, Maine 03908 Located in York County (207) 384-2254 Please call to make an appointment SOUTH PORTLAND South Portland Police Department 30 Anthoine Street South Portland, Me 04106 Please call to make an appointment -OR- South Portland Fire Department 34 James Baka Dr, South Portland, Me 04106 Second Wednesday of every month 10:00 AM – 2:00 PM Phone: 207-799-5511
WATERVILLE Central Maine Chrysler 300 Kennedy Memorial Drive Waterville, ME 04901 Located in Kennebec County (207) 622-4378 1
st Wednesday of the month
10:00AM - 1:00PM WELLS Wells Police Department 1563 Post Road Wells, ME 04090 Located in York County (207) 646-9354 Please call to make an appointment WESTBROOK Westbrook PD 570 Main Street Westbrook, ME 04092 Located in Cumberland County (207) 854-0644 Ext 523 Please call to make an appointment WINDHAM Windham Fire/Rescue Department 718 Roosevelt Trail Windham, ME 04062 Located in Cumberland County (207) 892-1911 3rd Saturday of the month, 10:00 AM–2:00 PM YORK York Beach Fire Station 18 Railroad Avenue York, ME 03910 Located in York County (207) 363-1014 (Fire Department) (207) 363-4444 (Police Department) Please call to make an appointment

21
Maine Child Passenger Safety Distribution Site List All Sites are by Appointment only
Site with BHS program LATCH manual AUGUSTA HealthReach Network-WIC Leslie Keith 263 Water Street, Suite 400 Augusta, ME 04330 (207) 621-6202
BANGOR EMMC Jason Horr 489 State Street Bangor, ME 04402 (207) 973-4849
BELFAST WCAP Dawn Bryant/Lucy Salisbury PO Box 130 9 Field Street, Suite 309 Belfast, ME 04915 (207)338-3827 Ext 211/ 338-4769 Ext 313
BIDDEFORD The Birthing Suite at Southern Maine Medical Center Rebecca Sevigny/Alicia Bradbury One Medical Center Drive Biddeford, ME 04005 (207) 283-7350
BUCKSPORT Bucksport Regional Health Center Lesa Gross 110 Broadway Bucksport, ME 04416 (207) 469-7371
CARIBOU Cary Medical Center Gayle Dayringer Maternal/Child Department 163 Van Buren Road Caribou, ME 04736 (207) 498-1166 ELIOT Eliot Police Department Candice Noble 27 Dixon Road Eliot, ME 03903 (207) 439-1179
FARMINGTON Franklin Memorial Hospital. Peter Wade 111 Franklin Health Commons Farmington, ME 04938 (207) 779-2402 (207) 778-4868 / 491-1122 HOULTON Houlton Band of Maliseet Indians Health Department Valerie Polchies 88 Bell Road, Suite 2 RR #3, Box 460 Houlton, ME 04730 (207) 532-2240
Stepping Stones Kim McLaughlin 2 High Street Houlton, ME 04730 (207) 532-1092

22
LEWISTON CMMC (LATCH to be shared with St. Mary’s) June Turcotte 300 Main Street Lewiston, ME 04240 (207) 795-2695
St. Mary’s Sisters of Charity Health System Ashley Harps/Terri Whalen Women's Health Associates 330 Sabattus Street Lewiston, ME 04240 (207) 777-4300
LUBEC Regional Medical Center at Lubec Patricia Fallon 43 South Lubec Road Lubec, ME 04652 (207) 733-1090 Ext 3118 MACHIAS Down East Community Hospital Family First: PATT Jane Brissette 11 Hospital Drive Machias, ME 04654 (207) 255-0348
MILBRIDGE Washington Hancock Community Agency Nancy Burgess 2 Maple Street Milbridge, ME 04658 (207) 546-2698 Ext 3371
NORWAY Norway Fire Department Carol Welsh 19 Danforth Street Norway, ME 04268
OR Stephens Memorial Hospital 181 Main Street Norway, ME 04268 (207) 743-1562 Ext 6951
OLD TOWN Penobscot Indian Nation Health Center Patrick Amenas 23 Wabanaki Way Old Town, ME 04468 (207) 817-7416
PORTLAND MMC-Division of Trauma Bonnie Butt 887 Congress Street, Suite 210 Portland, ME 04102 (207) 661-7076
PRESQUE ISLE The Aroostook Medical Center Sarah Beaulieu 140 Academy Street Presque Isle, ME 04769 (207) 768-4160
Micmac Health Department Georgie Smart 8 Northern Road Presque Isle, ME 04769 (207) 764-7219 ROCKPORT Penobscot Bay Medical Center Nola Metcalf OB/GYN Unit 7 Glen Cove Drive Rockport, ME 04856 (207) 596-8343
SKOWHEGAN Redington-Fairview General Hospital Sherri Bedard 46 Fairview Avenue Skowhegan, ME 04976 (207) 474-5121 Ext 427

23
WATERVILLE HealthReach Network-WIC Leslie Keith 63 Eustis Parkway Waterville, ME 04901 (207) 872-1593
WESTBROOK Woodford’s Family Service Wendy Enright 15 Saunders Way Suite 9000 Westbrook, ME 04062 (207) 878-9663

24
Teen Drivers
Problems Teenagers contribute to and suffer from the consequences of motor vehicle crashes at a disproportionate rate. Drivers between the ages of 15-20 are 6.3 percent of all licensed drivers in the United States, but are involved in 12.9 percent of all fatal crashes. Studies have concluded that crash rates are highest during a teen’s first few hundred miles on the road. Thirty-two percent of total Maine traffic deaths involve younger drivers. Eleven percent of Maine’s crash fatalities involve drivers aged 16 to 18. Teen drivers are involved in an annual average of 16 fatal crashes that result in 19 deaths. More than 90 alcohol or drug-related crashes occur annually (5.5% of all alcohol/drug related crashes). In 2011, 22 young drivers have died in crashes on Maine roads. This past year, MeBHS continued working with several agencies to identify new strategies to combat this growing problem. Objectives Develop a statewide teen driver safety strategic plan. Promote safe teen driving in Maine. Implement community based programs. Goal To decrease drivers age 20 or younger involved in fatal crashes by 5% from the 5 year average of 20.6 for 2005-2009 to 19.6 by December 31, 2014. Progress The five year average from 2006-2010 for drivers age 20 or younger involved in fatal crashes is 22.2.
7.7%

25
Figure 2. Maine 16-20 Year Old Driver Fatal Crash Data
2003 2004 2005 2006 2007 2008 2009 2010 Total Number of Fatalities - All Ages 207 194 169 188 183 155 159 161 Total Number of Crashes - All Ages 186 178 151 168 170 144 153 144 Total Number of 16-20 Year Old Drivers 33 39 34 37 26 18 20 24 Total Number of Deceased 16-20 Year Olds 21 36 27 32 28 15 17 22 Total Number of Deceased 16-20 Year Old Drivers 13 21 16 23 13 12 11 16 Number of Fatal Crashes involving 16-20 YO Drivers 33 39 34 37 26 17 15 24 Number of Deaths caused by 16-20 YO Drivers 39 50 41 47 28 18 16 27 Number of Deceased Drivers (16-20) with a Positive BAC 3 7 5 8 5 4 3 4 Number of Deceased Drivers (16-20) Using a Seat Belt 3 5 6 4 4 8 5 6 Contributing causation factors with teen drivers are as follows: Unsafe speed or going too fast for road conditions Crossing center line or run off road Driver Inexperience Driver Inattention
Source: FARS
Strategies Teen Driver Safety Committee In Maine, about 17,000 16-18 year olds have a driver’s license. One in five of those teens will be involved in a crash this year. The Teen Driver Safety Committee was created to develop goals, strategies and activities to combat teen crashes and fatalities. The Maine Teen Driver Safety Committee (TDSC), convened in late 2008, is comprised of individuals representing the following departments: Bureau of Highway Safety, Maine State Police, Office of Substance Abuse, Bureau of Motor Vehicles, AAA Northern New England, Maine Injury Prevention Program, Health Council of Northern New England and the Maine Department of Transportation. A major component of the TDSC’S work was the development of a statewide teen driver safety strategic plan. The plan and the objectives and activities it contains are intended to be used as a resource in a larger comprehensive community based effort to effectively address teen driver safety issues. A strong partnership of community leaders and stakeholders is critical in order to be successful. The TDSC is available to provide support and technical assistance as requested.
2010 Teen Driving Goal, Objectives and Strategies The Maine Teen Driver Safety Committee has developed a teen driver safety work plan to be integrated and utilized by agencies at the local, county, or state level interested in addressing teen driver issues. This Committee developed a sample of activities for the strategies provided below. These activities, although they can be implemented at the local, county or state level, are intended to be a guide in the development of a community based effort.

26
In order to encourage and enhance the opportunity for success, the Committee feels strongly that this works needs to be implemented by community partners and stakeholders, with technical assistance provided by the Committee as requested. Goal: Promote safe teen driving in Maine Target Audience: 16-18 year old drivers Objective 1: Integrate a variety of partners and stakeholders to participate in the Teen Driver Safety Committee (TDSC) activities: Strategy 1.1: Recruit partners and stakeholders to implement the TDSC work plan Activity: Create fact sheet describing the work of the TDSC Activity: Create and maintain a partner and stakeholder distribution list Strategy 1.2: Provide partners and stakeholders the most current research and evidence based teen driver safety focused programs Activity: Develop a directory of the most current research and evidence based teen driver safety information and programs Activity: Collect and distribute related crash data involving teens Strategy 1.3: Create a Maine focused teen driving safety awareness toolkit for use and distribution at the local and state levels Activity: Research other states for already developed toolkits Strategy 1.4: Create an evaluation plan for the use of the TDS Awareness toolkit Objective 2: Increase parental involvement in developing a safe teen driver: Strategy 2.1: Provide parent focused education regarding teen driver issues Topics: Current Graduated Driver License (GDL) and state laws Modeling good driving habits Setting rules and consequences for actions Monitoring teen driver behaviors Activities: Brainstorm various venues to promote parental education Create parent-based website to include information listed above Create fact sheets on the issues identified above Objective 3: Decrease teen driving related crashes, injuries and fatalities due to alcohol and other drugs: Strategy 3.1: Develop outreach and education for current and future drivers on the laws and risk pertaining to driving while under the influence of alcohol and drugs

27
Strategy 3.2: Develop outreach and education venues for family members and other influencers on the laws pertaining to driving while under the influence of alcohol and drugs Strategy 3.3: Support an increase in law enforcement efforts Strategy 3.4: Collaborate with court systems working with DUI and juveniles Objective 4: Decrease teen driving related crashes, injuries and fatalities due to unsafe speed: Strategy 4.1: Develop outreach and education for current and future drivers on the laws and risks pertaining to speeding Strategy 4.2: Develop outreach and education venues for family members and other influencers on the laws and risk pertaining to speeding Strategy 4.3: Support an increase in law enforcement efforts Objective 5: Decrease teen driving related crashes, injuries and fatalities due to lack of seatbelt use: Strategy 5.1: Develop outreach and education for current and future drivers on the laws and risks pertaining to driving unbelted Strategy 5.2: Develop outreach and education venues for family members and other influencers on the laws and risk pertaining to driving unbelted Strategy 5.3: Support an increase in law enforcement efforts Objective 6: Decrease teen driving related crashes, injuries and fatalities due distractions: Strategy 6.1: Develop outreach and education for current and future drivers on the laws and risks pertaining to distracted driving Strategy 6.2: Develop outreach and education venues for family members and other influencers on the laws and risk pertaining to distracted driving Strategy 6.3: Support an increase in law enforcement efforts Objective 7: Decrease teen driving related crashes, injuries and fatalities due to late night driving: Strategy 7.1: Develop outreach and education for current and future drivers on the laws and risks pertaining to late night driving Strategy 7.2: Develop outreach and education venues for family members and other influencers on the laws and risk pertaining to late night driving Strategy 7.3: Support an increase in law enforcement efforts

28
Teen Driver Awareness Program MeBHS’s Law Enforcement Liaison (LEL) worked closely with AAA of Northern New England to produce a 2- hour Teen Driver Awareness Program which focused on Graduated Drivers Licenses, Impaired Driving, Distracted Driving, Seat Belts and Parental Involvement. The Program targets teens, ages 14-16, and their parents to address these issues and heighten awareness of the causes of teen driving fatalities and crashes. In conjunction with the Program, the LEL authored a grant to Ford and the GHSA which gave the MeBHS $20,000 to purchase two driving simulators which are used to augment the lessons being taught in the classroom. The simulators contain software, “One Simple Decision”, which is specific to the teen driving issues of impaired and distracted driving. To date, MeBHS has trained 70 School Resource Officers in the Program and use of the simulators. The Teen Driver Awareness Program has been taken to various high schools, businesses and trainings around the state to demonstrate the simulators and train law enforcement on the simulators’ use. The MeBHS has demonstrated the simulators at five different high schools, including Scarborough High School and Bonny Eagle High School, both of which were selected to participate in the Ford Driving Skills for Life event. Approximately 900-1,000 students were able to view and experience the driving simulators to date. The simulators have also been used by various businesses including Central Maine Power, Maine Department of Transportation and other organizations at safety day events. Ford Driving Skills for Life In September the MeBHS attended two successful Ford Driving Skills for Life teen driving skills programs. Ford brought their program to the Scarborough and Bonny Eagle High Schools, where more than 150 students participated in hands-on skills lessons with experienced race car drivers. During the two events, MeBHS interacted with more than 500 students as they used the new driving simulators.
Future Strategies

29
16-24 Year Old Driver Crashes
8000
9000
10000
11000
12000
13000
14000
15000
16000
2001 2002 2003 2004 2005 2006 2007 2008 2009 2010
Num
ber
of C
rash
es
16-24 Year Old Fatalities
20
30
40
50
60
70
80
90
2001 2002 2003 2004 2005 2006 2007 2008 2009 2010
Num
ber
of F
atal
ities
Provide funding for select Maine law enforcement agencies to participate in a first year Teen Driver Seat Belt Enforcement Campaign that runs for two weeks before the national Click It or Ticket campaign period in May. Funding Source Federal Section 402 and 405 funds
Figure 3. Teen Driver Crash Data
Source: Maine Transportation Safety Coalition
Impaired Driving Program

30
Impaired Driving Fatalities (Alcohol)
20
30
40
50
60
70
80
2001 2002 2003 2004 2005 2006 2007 2008 2009 2010
Nu
mb
er o
f F
atal
itie
s
Problem Maine’s alcohol-related fatalities were 60% of all fatalities during the mid-1970’s to 1980, but improved to a level of around 20% in 2002-2003. Since then, the percent of alcohol-related fatalities has risen to about 30%. The recent fatality trend reflects an overall increase. In 2010, Maine had 38 alcohol-related fatal crashes and 30 of these fatal crashes had drivers with a Blood Alcohol Content (BAC) of .08 or higher. Maine is slightly below the FARS (Fatality Analysis Reporting System) national rate of 32% (2008). Attention also needs to be focused on drug-impaired drivers. Objective Maine’s 2011 Impaired Driving Program focused on reducing alcohol-related fatalities by targeting high crash locations. Using police crash data, MeBHS was able to identify these high crash locations and partner with law enforcement to increase patrols in those areas. Goal To decrease alcohol impaired driving fatalities by 5% from the 5 year average for 2005-2009 of 48 to 45.6 by December 31, 2014. Progress The five year average from 2006-2010 for alcohol impaired driving fatalities is 45.6.
Figure 4. Alcohol Involved Crash Fatalities in Maine
Source: Maine Transportation Safety Coalition
Strategies Holiday High Visibility Impaired Driving Enforcement

31
As part of MeBHS’s third year Holiday Enforcement Campaign in 2010, 42 participating law enforcement agencies, an increase from last year’s 31 participants, conducted impaired driving enforcement details from November 22, 2010 through January 31, 2011. There were 259 operating under the influence arrests made during that time period, a 61% increase from last year’s 157 arrests made during the same campaign. Officers working overtime details accrued 3,858 hours of overtime, and conducted 7,716 traffic stops, equaling 2 stops per hour. This is a 37% increase from the number of stops made during last year’s campaign. Thirty-one roadblocks were conducted. During this enforcement period, $166,598 in federal funds was expended. The cost per OUI arrest was $643.24. 2011 High Visibility Impaired Driving Enforcement Campaign
The use of dedicated enforcement strategies combined with public awareness and education are key components to reducing the injuries and deaths attributed to impaired driving. In addition, local community programs must continue to put forth their independent efforts to reduce impaired driving crashes. Sending the message to the public that impaired driving will not be tolerated is essential. This year’s High Visibility Impaired Driving Enforcement Campaign ran from July 1 to September 5, 2011, which included the two week national enforcement crackdown of August 19 to September 5. There were 60 law enforcement agencies who participated this year: 52 police departments, 7 Sheriffs’ offices and the Maine State Police. Departments could apply for up to$5,000 in federal funds. This year, $221,233.00 was awarded (financial data from Maine State Police not included) to departments and $185,602.36 was expended. There were a total of 231 impaired driving arrests made during this campaign and 94 impaired driving arrests during the national campaign. Departments conducted 3,636 hours of overtime and made 12,774 traffic stops, or 3.51 traffic stops per hour.
Figure 5. Alcohol Related Fatalities By Year and County
Source: FARS statistics Drug Recognition Expert Program There are currently 84 active Drug Recognition Experts in Maine, up from 80 last year. The Maine Criminal Justice Academy (MCJA) ran another DRE school in March of 2011. Eighteen students graduated from the
Alcohol-Related Fatalities*: 2010 45 2009 50 2008 46 2007 69 2006 65
Top 10 Counties for Alcohol-Related Fatalities (2010):
Cumberland 6 Washington 5 York 5 Somerset 4 Franklin 3 Hancock 3 Knox 3 Penobscot 3 Androscoggin 2 Aroostook 2

32
class although only 14 completed the certification process. Two moved to agencies in another state during the process, and two did not complete the required work to become certified. The MCJA certified 3 new instructors that attended the DRE Instructor school in 2010 and assisted with the DRE class and certification evaluations in 2011. The Department of Human Services Health and Environmental Testing Lab (HETL) has estimated that 291 urine samples have been received from DREs for analysis in FFY2011. The MCJA started using an instant field test for certification evaluations for this class which cut down substantially the number of training samples submitted to the HETL. Officer Robert Libby of the South Portland Police Department and Sergeant Edwin Finnegan of the Rockland Police Department attended the 17th Annual IACP Training Conference on Drugs, Alcohol and Impaired Driving in Montreal, Canada, in July 2011. Upon their return, they assisted in the development and instruction of the 2011 mandatory DRE refresher training at the MCJA. The training was held on September 8 at the Academy. The guest speaker, for the second year in a row, was Don Decker, a senior DRE instructor from Massachusetts and the Regional IACP Representative who spoke on synthetic drugs. Carl Hallman and Robert Annese from MeBHS provided an overview on MeBHS initiatives. The class was very well attended with 54 DREs and instructors participating. Standardized Field Sobriety Testing (SFST) The MCJA conducted or processed 11 full SFST student classes with 116 students attending. Additionally, 5 SFST 4 hour Refresher classes statewide with 13 students attending were processed.
Several small changes to the SFST field notebooks which were received from the vendor this spring were made and distributed to agencies that needed them. The current supply is anticipated to last through 2012. All new cadets get a copy during their SFST training at the MCJA. Intoxilyzers Over the past three years the MCJA has been transitioning into a new Intoxilyzer recertification process. Beginning January 1, 2012, about 700 certification cards, representing approximately one third of all operators, will be issued. The cards will expire December 31,2014. Operators have 6 months prior to expiration to complete the recertification process. The MCJA worked with Acadia National Park, CMI and Bob Morgner to develop an Intoxilyzer 8000 training program that would meet the needs of Acadia's current equipment. An instructor development program was offered at MCJA for a limited group of instructors that would teach the curriculum for National Park Rangers. Drug Impairment Training for Educational Professionals (DITEP) This International Association of Chiefs of Police (IACP) sponsored program teaches educational professionals how to identify drug use in students. The second part of the program teaches key school staff how to conduct

33
Impaired Driver Crashes (Alcohol)
1000
1200
1400
1600
1800
2000
2001 2002 2003 2004 2005 2006 2007 2008 2009 2010
Num
ber
of C
rash
es
Impaired Driving Fatalities (Alcohol)
20
30
40
50
60
70
80
2001 2002 2003 2004 2005 2006 2007 2008 2009 2010
Num
ber
of F
atal
ities
evaluations on students identified as being impaired. The goal of the program is to reduce drug use by students and keep drug impaired students off the roads. The MCJA had schools in Bangor and York County participate in DITEP programs this year. Future Strategies Increase public awareness of drug impaired driving through media campaigns, press releases and signage. Continue law enforcement training in Advanced Roadside Impaired Driving Enforcement (ARIDE). Continue discussions with the Attorney General regarding a Traffic Safety Resource Prosecutor (TSRP). Increase blood/breath sample collection ability in rural areas. Can be accomplished by purchasing new breath testing instruments, training officers as phlebotomists for blood draws, contracting with local EMS personnel, or any combination thereof. Continue to provide grant funding to Maine law enforcement agencies to participate in the August and December NHTSA Drive Sober or Get Pulled Over national impaired driving enforcement crackdown periods. Grant funding will be provided for dedicated overtime impaired driving enforcement details and public education. Develop a Regional Impaired Driving Enforcement (RIDE) Team. This pilot program will recruit selected volunteers from state, county and municipal law enforcement agencies within Cumberland County who have demonstrated an expertise in the detection, apprehension and prosecution of impaired drivers. The RIDE Team will conduct numerous saturation patrols and sobriety checkpoints throughout the County during FY 2012. Funding Source Federal Section 402 and 410 funds Figure 6. Alcohol Related Crash and Fatalities
Source: Maine Strategic Highway Safety Plan, 2011 edition
Traffic Records Problem

34
A complete traffic records program is necessary for planning (problem identification), operational management or control, and evaluation of a state’s highway safety activities The MeBHS and its partners collect and use traffic records data to identify highway safety problems, problem areas, to select the best possible countermeasures, and to evaluate the effectiveness of these efforts. The role of traffic records in highway safety has been substantially increasing since the creation of the Federal Section 408 grant program under SAFETEA-LU. Objective Traffic records and traffic safety data form the decision-making basis for the setting of policy and the selection of projects and programs to improve the safety of our state’s highways. Gathering, processing and reporting all data pertaining to the traffic safety activities in an accurate and timely fashion is a primary objective of the MeBHS. To accomplish this objective, the MeBHS has established a permanent Traffic Records coordinating committee (TRCC). Goal The goal of Maine’s Traffic Records Coordinating Committee (TRCC) is to continue to develop a comprehensive traffic records system that provides timely, complete, accurate and usable traffic records data so that we may analyze and address our highest priority traffic safety issues. Strategies Maine's TRCC partners have made significant progress in improving Maine's traffic records systems. These successes include:
·
·
·
·
·
Completed statewide deployment of Maine's Electronic EMS Run Report System (all services have been required to submit electronically as of 4/1/09). Ongoing training and data quality improvement efforts continue.
Bureau of Motor Vehicles (BMV) continued migration of business functions to a new computer system
BMV completed the electronic transfer of registration data from municipalities project which resulted in improved efficiencies and reduction in submission times,
BMV's Online Rapid Renewal Registration system was upgraded to register trailer fleets and additional municipalities began using the online system,
Maine Crash Report Form was redesigned based on MMUCC Revision 3 which will result in a significant increase in MMUCC compliance for Maine's crash data, and

35
Maine Crashes By Year
25,000
27,000
29,00031,000
33,000
35,000
37,000
39,000
2001
2002
2003
2004
2005
2006
2007
2008
2009
2010
Num
ber o
f Cra
shes
Crash Rates
175
200
225
250
275
300
2001 2002 2003 2004 2005 2006 2007 2008 2009 2010C
rash
es/H
MV
M
MaineU.S.Linear (Maine)
· Maine's Crash Reporting System technology upgrade has been deployed and all but one agency is using the new form.
Figure 7. Crashes and Fatalities Data
Source: Maine Transportation Safety Coalition
Source: Maine Strategic Highway Safety Plan, 2011 edition
Future Strategies

36
Future projects have been identified in the State’s approved Traffic Records Plan for 2011. In order to continue to be eligible to received Section 408 federal funds for traffic data and records purposes, the State must undergo traffic records assessments every five years. Maine’s Traffic Records Assessment was conducted April 25-29, 2011. A copy of the final assessment report is available upon request. Funding Source Federal Section 402 and 408 funds, and Maine State Highway funds and other funds

37
Speed and Aggressive Driving
Problem Speed is cited as a factor in an average of 6,100 crashes per year. Speed-related crashes account for 19% of total crashes and 42% of total fatalities. The biggest concern with excessive speed is it can lead to other driver errors and serious injuries. Adjusting speed for weather-related road conditions is a problem. Unsafe speed was noted in 3,500 crashes on snowy, slushy or icy road surfaces, and another 700 occurred on wet road surfaces. Objective MeBHS is working with Maine law enforcement agencies to fund dedicated overtime details to combat the increase of speeders on Maine roads. Enforcement can be one of the most effective means of improving driver behavior, especially as it relates to speeders. Goal Decrease speeding related fatalities by 5% from the 5 year average of 69.4 for 2005-2009 to 66 by December 31, 2014. Progress The five year average from 2006-2010 for speeding related fatalities is 68.8. Strategies 2011 Speed Enforcement Campaign The MeBHS conducted an analysis on statewide speed related crashes and their locations, then selected 14 law enforcement agencies from those locations to participate in this year’s Speed Enforcement Campaign. Agencies could request up to $5,000 in federal grant funds for their speed enforcement details. There were 4 sheriffs’ offices, 9 police departments and 3 Maine State Police troops who focused on speed enforcement from May 1 through September 5, 2011. Departments spent a total of $57,495, which was 89% of the total funds awarded ($64,568). Officers worked 1,881 overtime hours and made 4,768 traffic stops, which equals2.53 stops an hour. Law enforcement officers wrote 2,055 speed summons. The average cost of a speed summons was $70.00.

38
Future Strategies Sustain the high visibility enforcement outside of the national crackdowns Continue to produce and/or distribute public service announcements via television, web, and radio that emphasize speed and its effect on public safety. Funding Source Federal Section 402 funds
Figure 8. Speeding Facts for Maine
Source: Maine Strategic Highway Safety Plan, 2011 edition

39
Motorcycle Safety Problem Motorcycle crashes resulted in 18 fatalities in 2010, which was a decrease from 23 fatalities in 2009. In 2009, motorcycle crashes decreased and fatalities increased. Ten year crash and fatality trends are increasing. Motorcycle registrations have also steadily increased during this period. Motorcycle crash aspects include:
o Helmets were not worn by about 2/3 of the riders killed. o Leading age group of motorcycle operator fatalities is 26-54 o Eleven of the 24 fatal motorcycle crashes were single vehicle occurrences. o There is an increase in motorcycle ownership in the 40 and above age group
and an increase in motorcycle rider fatalities in that age group during the last 10 years. Objective Educate the public on the importance of motorcycle safety for both motorcycle riders and the motoring public. Goals Decrease motorcyclist fatalities by 5% from the 5 year average of 20.6 for 2005-2009 to 19.6 by December 31, 2014. Progress The five year average from 2006-2010 for motorcyclist fatalities is 21. Decrease unhelmeted motorcyclist fatalities by 5% from the 5 year average of 14.4 for 2005-2009 to 13.7 by December 31, 2014. Progress The five year average from 2006-2010 for unhelmeted motorcyclist fatalities is 14.6. Strategies Bureau of Motor Vehicles Branch Office Media The MeBHS is pursuing partnering with the Bureau of Motor Vehicles’ (BMV) branch offices to play MeBHS radio and television media spots on the branch offices’ televisions. These television are located in the waiting areas of all BMV branch offices.

40
Motorcycle Crashes
400
450
500
550
600
650
700
2001 2002 2003 2004 2005 2006 2007 2008 2009 2010
Num
ber
of C
rash
es
Motorcycle Fatalities
5
10
15
20
25
2001 2002 2003 2004 2005 2006 2007 2008 2009 2010
Nu
mb
er o
f F
atal
itie
s
Figure 9: Motorcycle Crashes and Fatalities in Maine
Source: Maine Transportation Safety Coalition Future Strategies Continue partnership with the Bureau of Motor Vehicles’ (BMV) branch offices to play MeBHS radio and television media spots on the branch offices’ televisions. These television are located in the waiting areas of all BMV branch offices.
Funding Source Federal Section 402 and 2010 funds

41
Paid and Earned Media Objective/Goal To increase seat belt use, proper use of child passenger safety restraints, reduce motorcycle fatalities, reduce impaired driving, speeding, and distracted driving through use of a statewide media campaign. Strategies “Survive Your Drive” Media Campaign In 2009, the MeBHS hired a full-service media relations firm to develop a statewide highway safety media campaign. The firm, NL Partners, continued the “Survive Your Drive” campaign into FFY2011. The campaign was designed to raise driver awareness about the importance of safe driving and to help drivers avoid behaviors that lead to fatal crashes on Maine highways. The campaign covers all aspects of highway safety, including impaired driving, speed, seatbelt use, and teen drivers. The MeBHS worked with NL Partners to retag existing spots created by other states. The MeBHS now has television spots that discuss child passenger safety, impaired driving, seatbelt usage, motorcycles, teen drivers, and speed. The MeBHS radio spots address child passenger safety, impaired driving, seatbelt use, and motorcycles. MeBHS pursued social networking this year through ad space on Facebook. Four ads were developed that addressed teen driving, speeding, and impaired driving. Facebook users can click the ads and are taken to the MeBHS website, where further information on each topic is available.

42
Earned Media Earned media played a key role to MeBHS’s media campaign in 2011. Law enforcement agencies who participated in the MeBHS’s enforcement campaigns were asked to make use of all types of earned media to alert each agency’s community of the enforcement efforts. Agencies conducted television and radio interviews, sent out press releases, posted news releases on department websites and Facebook pages, and used roadway signage to alert motorists of enforcement periods. Sport Marketing Campaign MeBHS contracted with Alliance Sport Marketing for Federal Fiscal Year 2011 to develop and implement a statewide sport marketing campaign. The campaign involved multiple sport venues around the state, including Maine’s seven asphalt motorsports venues, one minor league baseball team (the Portland Sea Dogs), one minor league hockey team (the Portland Pirates), and the University of Maine athletics (covering football, men’s and women’s basketball, baseball, and men’s and women’s hockey seasons). The campaign covered more than thirteen sports seasons.
Alliance Sport Marketing developed and had premium venue signage installed in each of the ten venues, ensured at least two public address announcements were made during each event in each venue, organized a highway safety night at each venue, placed the MeBHS logo on schedule posters for each race track, and played safety messages on websites for minor league baseball, minor league hockey, and University of Maine athletics’ websites. The highway safety nights featuring the “You’ve Been Ticketed” promotion at each venue were a big success. Each “You’ve Been Ticketed” promotion involved many highway safety partners working together at each venue. Local law enforcement would monitor the venue parking lot and reward drivers that were buckled up as they entered the parking lot with a “ticket”. That ticket could be redeemed for a highway safety t-shirt at the MeBHS booth at the venue. MeBHS staff and law enforcement liaison manned the booth, distributing the t-shirts as well as highway safety pamphlets, car seat inspection and distribution site flyers, and other educational material. The MeBHS Seatbelt Convincer was available at many events for fans’ use. The following recap lists each venue, signage, and highway safety night that was part of this first year campaign: Beech Ridge Motor Speedway, Scarborough: The track displayed a 4’ x 22’ sign on the second turn featuring the Survive Your Drive. Buckle Up. No Excuses! messaging. Schedule posters were distributed at the track’s first few events, three public address announcements were read at

43
each event, and the track hosted the Highway Safety Night on July 23. Oxford Plains Speedway, Oxford: The track displayed a 12’ x 24’ sign on turn three featuring the Survive Your Drive. Buckle Up. No Excuses! messaging. Schedule posters were distributed at the track’s first few events and at local restaurants, three public address announcements were read at each event, and the track hosted the Highway Safety Night on July 2 as well as an additional event on July 24 during the TD Bank 250 race.
Richmond Karting Speedway, Richmond: the track displayed a 7’ x 18’ sign on the back straight away featuring the Survive Your Drive. Buckle Up. No Excuses! messaging. Schedule posters were distributed at the track’s first few events, three public address announcements were read at each event, and the track hosted the Highway Safety Night on July 30. Speedway 95, Hermon: The track displayed two 10’ x 20’ signs on the back straight away featuring the Survive Your Drive. Buckle Up. No Excuses! messaging. Schedule posters were distributed at the track’s first few events, three public address announcements were read at each event, and the track hosted the Highway Safety Night on July 30. Spud Speedway, Caribou: The track displayed a 8’ x 12’ sign featuring the Survive
Your Drive. Buckle Up. No Excuses! messaging. Schedule posters were distributed at the track’s first few events and inserted in the Aroostook Republican newspaper, three public address announcements were read at each event, and the track hosted the Highway Safety Night on the July 2 Independence Day weekend race. Unity Raceway, Unity: The track displayed an 8’ x 16’ sign on the leaderboard, a 4’ x 8’ sign on the winner’s circle, a 4’ x 8’ sign on the main entrance, and a 4’ x 8’ sign on the grandstands featuring the Survive Your Drive. Buckle Up. No Excuses! messaging. Schedule posters were distributed at the track’s first few events, three public address announcements were read at each event, and the track hosted the Highway Safety Night on July 22.
Portland Pirates hockey team, Portland: The arena displayed two 8’ signs on the dasher boards on each side of the rink. The signs featured the Survive Your Drive. Buckle Up. No Excuses! messaging. MeBHS had a logo link featured on the Pirates’ website, three public address announcements read at each event, and the team hosted the Highway Safety Night on November 20. The Highway Safety Night was promoted in the Portland Press Herald newspaper leading up to the game. Portland Sea Dogs baseball team, Portland: The ballpark displayed a 8’ x 16’ sign on the outfield fence featuring the
Survive Your Drive. Buckle Up. No Excuses! messaging. MeBHS had a logo link featured on the Sea Dogs’ website, three public address announcements read at each event, and the team hosted the Highway Safety Night

44
on July 29. The Highway Safety Night featured an eight year old boy who was saved by his helmet in a bicycle accident; the boy threw out a ceremonial first pitch at that day’s game. University of Maine, Orono (UMO): The University of Maine Black Bear Athletics partnered with MeBHS to promote seat belt usage at many of their sporting events during the year. UMO football games featured exit signage over each of the Alfond Stadium exits, reminding fans to Buckle Up. No Excuses! On November 20, the football team promoted highway safety with the You’ve Been Ticketed promotion. UMO’s Alfond Arena hosts both the UMO hockey and basketball teams. That arena featured exit signage for all events as well as a dasher board sign for the nationally ranked Black Bears hockey games. During the basketball games the Survive Your Drive. Buckle Up. No Excuses! Sign was prominently displayed courtside. The hockey program hosted the Highway Safety Night on January 28, while the basketball team hosted their night on March 8. the Black Bear baseball team displayed a 7’ x 20’ outfield fence sign at Mahaney Diamond that featured the Survive Your Drive. Buckle Up. No Excuses! messaging. The baseball team, which reached the NCAA tournament, hosted their Highway Safety Night on May 15. In addition to the signage and promotion nights, three highway safety messages were read at each UMO event and the Survive Your Drive. Buckle Up Black Bear Fans. No Excuses! message was displayed on the UMO athletics website.
Future Strategies Add existing distracted driving media to the media play schedule. Continue supporting the MeBHS and NHTSA mobilizations with paid and earned media. Funding Source Federal Section 402 and 406 funds

45

46
Noteworthy Programs 2011 Maine Law Enforcement Challenge For the fifth year in a row, the MeBHS sponsored the Maine Law Enforcement Challenge. The Law Enforcement Challenge is an opportunity for a law enforcement agency to showcase its community traffic safety programs. The challenge is conducted at a state level where similar-sized agencies compete against each other. There were 19 applicants this year: 11 police departments and sheriffs’ agencies as well as 8 Maine State Police troops. There were three scoring categories for the Challenge: 5 small police departments or Sheriffs offices 6 large police departments or Sheriffs offices 8 Maine State Police Troops Winners and prizes for the small departments:
1st Place Lisbon Police Department All Traffic Solutions Speed Shield 12 inch Radar Display Traffic Recorder Applied Concepts Stalker DSR-2X Radar 2nd Place Presque Isle Police Department All Traffic Solutions Speed Shield 12 Inch Radar Display Traffic Recorder 3rd Place Rockland Police Department Watchguard COP VU Video Camera (3) body worn video Winners and prizes for the large departments: 1st Place York Police Department All Traffic Solutions Speed Shield 12 inch Radar Display Traffic Recorder Applied Concepts Stalker DSR-2X Radar 2nd Place Wells Police Department All Traffic Solutions Speed Shield 12 Inch Radar Display Traffic Recorder 3rd Place Augusta Police Department (3) Three Watchguard COP VU body worn video Maine State Police 1st Place Troop B (3) Three Kustom Signal Pro III Lasers

47
2nd Place Troop D (2) Two Kustom Signal Pro III Lasers 3rd Place Troop G (3) Three Watchguard COP VU body worn video All departments who did not place in their category received five 5.11 Tactical Light for Life flashlights. An awards luncheon for this year’s Challenge was held at the Hilton Garden Inn Riverwatch in Auburn on August 16, 2011. Over 50 people attended. The guest speakers were Public Safety Commissioner John Morris and the MeBHS Director Lauren Stewart. All applications were sent to the International Chiefs of Police National Challenge and were judged on a national level. The Maine State Police scored first place in their division and the Sagadahoc County Sheriff’s Office placed third in their division. The Sagadahoc County Sheriff’s Office has taken third place three times in the national competition.
Lisbon PD Officer Darin Estes York PD Chief Doug Bracy receives a plaque from receives a plaque from DPS Commissioner John Morris for DPS Commissioner John Morris for taking first place in the small dept. division taking first place in the large dept. division

48
Partnerships and the Strategic Highway Safety Plan MeBHS has partnered with the Maine Department of Transportation, Maine Turnpike Authority, Department of Health and Human Services, state law enforcement agencies and many others in working toward the identified initiatives within the statewide Strategic Highway Safety Plan (SHSP) to substantially reduce the number of injuries and deaths related to crashes on our highways. MeBHS will continue to explore new partnerships and continue to strengthen existing partnerships with more agencies (governmental and non-governmental, local, state, law enforcement and non-law enforcement) in our efforts to increase our chances of affecting behavioral changes and educating Maine citizens about all matters related to behavioral traffic safety. The SHSP Planning Committee is involved in updating the SHSP. Maine Driving Dynamics Maine Driving Dynamics (MDD) is a Maine sponsored five-hour defensive driving course that offers all drivers the opportunity to improve their defensive driving abilities. The course includes discussion of collision avoidance techniques, safety issues, driver habits and attitudes, and the basic elements that constantly challenge drivers on Maine's highways. MDD is taught by a certified Maine Driving Dynamics instructor in a format that engages students with lectures, videos, and class discussion/participation. Those completing the course will receive a three-point credit on their driving record and students 55 and older can receive an insurance discount from their insurer. MeBHS believes students are safer drivers after completing this course. They leave the class with a new and unique way of looking at the driving experience. The course is offered to the public several times each month at various locations around the state. MDD is sponsored by MeBHS in partnership with local and regional adult education organizations. The course is also offered on site to private companies. Law Enforcement Liaison The MeBHS Law Enforcement Liaison Robert Annese works with Maine law enforcement agencies to increase participation in MeBHS enforcement campaigns, assists law enforcement agencies with grant paperwork requirements, conducts trainings at the Maine Criminal Justice Academy, helps the MeBHS organized media events, and represents the MeBHS on many committees and at several meetings throughout the state and country. The current LEL contract goes through 2012. Implied Consent Program The MeBHS is responsible for Maine’s Implied Consent program. Under Maine’s Implied Consent law, a driver shall submit to and complete a test to determine an alcohol level and drug concentration by analysis of blood, breath or urine. This test may be given at any time that authorities have probable cause to administer it. If a driver refuses to take such a test for alcohol or drugs, that individual’s driver’s license will be immediately suspended for a period of up to six years.

49
Maine uses the Intoxilyzer 5000 units, which are managed by the Department of Health and Human Services’ Health and Environmental Testing Laboratory (HETL). HETL is responsible for calibrating all the Intoxilyzers in use in the state. The MeBHS provides funding for the salary of the HETL chemist who manages and maintains the units. The chemist is also an expert witness who is called on frequently for court cases involving use of an Intoxilyzer. There are currently 80 Intoxilyzers in use around the state. These units are strategically located at police departments around Maine that are easily accessible by all Maine law enforcement. Wells Police Department Cop Card Program The Wells Police Department instituted a Cop Card program to raise public awareness and public support for the police and traffic safety programs in Wells. Federal funds were used to create and produce cards that had a picture of an officer with a traffic safety message on the back of the card. There were 28 different trading cards that were distributed at schools, the town hall, senior centers, and community events.

50
Legislative Summary More information on these laws may be found at http://www.maine.gov/legis/opla/enactlawnew.htm . Chapter 13 – LD 50 An Act to Allow Provisional Drivers to Transport Persons under Guardianship and Children of Active Military Personnel A provisional driver may only carry passengers who are of the immediate family. “Immediate family” is expanded to include the following persons living with the immediate family: (1) a foreign exchange student, (2) a person who is under court-appointed guardianship of an immediate family member, and (3) a child whose parent is deployed for military service and is under guardianship of an immediate family member. Amends 29-A, section 1311, sub-section 1, paragraph A Chapter 156 – LD 1005 An Act to Clarify the Standard of Proof for Traffic Infractions The burden of proof that a traffic infraction has occurred is on the State and must be established by a standard of a preponderance of the evidence. (This bill started out to establish the standard of proof as clear and convincing evidence, a standard higher than a preponderance but still less than proof beyond a reasonable doubt.) Enacts 29-A section 103, sub-section 4 Chapter 159 – LD 1098 An Act to Increase Accountability for the Most Serious Offenders of Laws Prohibiting Operating under the Influence of Drugs and Alcohol Has either a prior conviction for a Class B or Class C crime under this section or a prior criminal homicide conviction involving or resulting from the operation of a motor vehicle while OUI. For purposes of this subparagraph, the 10-year limitation specified in section 2402 and Title 17-A, subsection 9-A, subsection 3 does not apply to the prior criminal homicide conviction. Amends 29-A section 2411, sub-section 1-A, paragraph D Chapter 165 – LD 1454 An Act to Allow Police Officers to Operate Mobile Command Units without a Special License A law enforcement officer who is a member of an organized municipal, state or federal law enforcement department is permitted to operate a commercial motor vehicle as a mobile command unit. “Mobile command unit” means a motor vehicle designed and used by a law enforcement agency primarily as a command and control platform for emergency response. Amends 29-A section 1252, sub-section 1, paragraph C Chapter 167 – LD 221 An Act to Make Changes to the Motorcycle Inspection Sticker Requirements An official inspection sticker must be affixed to the rear of the motorcycle on the registration plate. The sticker must be located so that it is completely visible from the rear of the motorcycle. If the registration plate is reassigned to another motorcycle, the certificate of inspection and the official inspection sticker expire upon reassignment. Amends 29-A section 1758, sub-section 3

51
Chapter 207 – LD 736 An Act to Prohibit Texting While Driving This is a new statute. It prohibits a person from operating a vehicle while engaging in text messaging. It is a traffic infraction for which a fine of not less than $100 may be adjudged. “Text messaging” is defined as reading or manually composing electronic communications, including text messages, instant messages or e-mails, using a portable electronic device. “Text messaging” does not include using a global positioning or navigation system. “Portable electronic device” means any portable electronic device that is not part of the operating equipment of a vehicle, including but not limited to an electronic game, device for sending or receiving e-mail, text messaging device, cellular telephone and computer. “Cellular telephone” means a device used to access wireless telephone service. Enacts 29-A section 2119 Chapter 390 – LD 1167 An Act to Protect the Privacy of Persons Involved in Reportable Motor Vehicle Accidents Notwithstanding current law that permits the public disclosure of the date, time and location of a crash and the names and addresses of operators, owners, injured persons, witnesses and the investigating officer, crash data of a personally identifying nature contained in the database maintained by the State Police does not constitute “public records” for purposes of the Freedom of Access law. Such information may not be publicly disseminated. Data not of a personally identifying nature may be disseminated. “Personally identifying data” means an individual’s name, residential and post office box mailing address, social security number, date of birth and driver’s license number, vehicle registration number, insurance policy number, information contained in any free text data field of a crash report, and any other information contained in a data field of a crash report that may be used to identify a person. Any other information constitutes “nonpersonally identifying data”. Enacts 29-A section 2251, sub-section 7-A Amends 29-A section 2251, sub-section 7 Chapter 415 – LD 1557 An Act to Raise the Speed Limit on Interstate 95 between the City of Old Town and the Town of Houlton The title says it all- the speed limit on I-95 after September 28, 2011, will be 75 mph. Amends 29-A section 2052, sub-section 6

52
Fiscal Year Summary FFY11 Financial Summary of Expenditures as of 12/5/11
402 405 163 406 408 410 2010 2011 Total % of Total
P&A $129,151 $2,045 $4,446 $135,643 5.69%
Traffic Records $44,475 $424,818 $469,293 19.68%
Impaired Driving $14,220 $378,382 $392,602 16.46%
Occupant Protection $369,297 $215,679 $584,975 24.53%
Ped/Bicycle Safety $0 $0 0.00%
Police Traffic Services $230,600 $230,600 9.67%
EMS $0 $0 0.00%
Child Restraint $108,354 $92,010 $200,364 8.40%
Paid Advertising $0 $371,355 $371,355 15.57%
Motorcycle $0 $0 $0 0.00%
TOTAL $896,096 $215,679 $0 $373,401 $424,818 $382,828 $0 $92,010 $2,384,832 100.00%

53
Appendix A
Supporting Motor Vehicle Crash Data

54
Maine Motor Vehicle Crash Data
Source: FARS and MDOT
U.S. Fatality Rate: 2006: 1.42 fatalities per 100 million VMT 2007: 1.36 fatalities per 100 million VMT 2008: 1.25 fatalities per 100 million VMT 2009: 1.16 fatalities per 100 million VMT 2010: 1.10 fatalities per 100 million VMT
Maine Fatality Rate: 2006: 1.25 fatalities per 100 million VMT 2007: 1.22 fatalities per 100 million VMT 2008: 1.08 fatalities per 100 million VMT 2009: 1.10 fatalities per 100 million VMT 2010: 1.11 fatalities per 100 million VMT Fatalities by County (2010):
Cumberland 25 York 24 Hancock 14 Penobscot 13 Androscoggin 12 Aroostook 11 Waldo 10 Somerset 8 Franklin 8 Kennebec 7 Knox 7 Washington 6 Oxford 5 Lincoln 4 Sagadahoc 4 Piscataquis 3
New England Region Motor Vehicle Crash Fatalities 2010: Connecticut 319 Massachusetts 314 Maine 161 New Hampshire 128 Vermont 71 Rhode Island 66

55
In 2010, 32,788 people were killed in the U.S. in motor vehicle crashes. In Maine, motor vehicle crashes killed 161 people. Maine had over 27,000 total reportable crashes in 2010, down from 33,118 reportable crashes in 2009.
MAINE MOTOR VEHICLE CRASH DATA
FROM 1980-2010 TOTAL FATAL ALCOHOL SPEED NUMBER OF
YEAR CRASHES CRASHES INVOLVEMENT INVOLVEMENT PEOPLE KILLED
1980 27,910 234 157 (60.2%) 261 1981 26,698 186 127 (60.2%) 211 1982 30,522 151 84 (50.6%) 166 1983 31,375 198 127 (56.7%) 224 1984 34,544 211 125 (53.9%) 232 1985 36,799 189 110 (53.4%) 206 1986 40,378 190 108 (50.5%) 214 1987 43,201 212 114 (49.1%) 232 1988 40,764 231 89 (34.8%) 256 1989 43,498 175 61 (32.1%) 190 1990 37,468 196 81 (38%) 213 1991 35,046 181 73 (35.6%) 205 1992 35,548 189 85 (39.7%) 214 1993 37,819 168 74 (40%) 185 1994 37,561 167 65 (34.4%) 74 (39%) 189 1995 38,512 171 51 (27.1%) 71 (37%) 188 1996 39,760 156 55 (32.5%) 76 (45%) 169 1997 42,510 172 63 (32.8%) 71 (37%) 192 1998 40,877 176 50 (26%) 79 (41%) 192 1999 39,024 168 51 (28.2%) 79 (43%) 181 2000 37,251 159 46 (27.2%) 74 (43%) 169 2001 37,580 170 49 (25.5%) 73 (38%) 192 2002 36,979 186 42 (19.4%) 83 (38.42%) 216 2003 35,652 186 57 (27.53%) 79 (38.16%) 207 2004 35,226 178 60 (30.92%) 90 (46%) 194 2005 34,196 151 55 (32.5%) 86 (50%) 169 2006 36,403 168 64 (34.0%) 61 (32%) 188 2007 33,077 170 71 (38.7%) 85 (46%) 183 2008 31,330 144 39 (27%) 49 (34%) 155 2009 33,118 153 50 (32%) 59 (38%) 159 2010 27,884 144 38 (26%) 70 (48%) 161
Source: FARS Data and MDOT

56
Crash Data / Trends
5 Year Averages Progress Report Data 2006-2010 2001 2002 2003 2004 2005 2006 2007 2008 2009 2010 C-1: Fatalities (Actual) 192 216 207 194 169 188 183 155 159 161 C-2: # of Serious Injuries 1,222 1,237 1,091 1,119 1,030 996 978 862 732 775 C-3a: Fatality Rate /100 million VMT 1.3 1.5 1.4 1.3 1.1 1.2 1.22 1.08 1.10 1.11 C-3b: Rural Mileage Death Rate 1.56 1.50 1.49 1.51 1.08 1.32 1.23 C-3c: Urban Mileage Death Rate 0.53 0.19 0.59 0.45 0.64 0.51 0.79 C-4: # of Unrestrained Passenger Vehicle Occupant Fatalities 78 72 87 75 64 65 76 45 50 41 C-5: # of Fatalities Involving Driver or Motorcycle Operator w/ > .08 BAC 54 40 56 50 47 46 61 42 44 35 C-6: # of Speeding-Related Fatalities 73 83 79 90 86 61 86 53 61 83 C-7: # of Motorcyclist Fatalities 14 13 20 22 15 23 23 18 23 18 C-8: # of Unhelmeted Motorcyclist Fatalities 5 8 12 11 9 17 15 14 17 10 C-9: # of Drivers Age 20 or Younger Involved in Fatal Crashes 17 21 13 21 16 23 25 19 20 24 C-10: # of Pedestrian Fatalities 12 14 13 10 9 10 10 12 11 12 B-1: % Observed Belt Use for Passenger Vehicles - Front Seat Outboard Occupants 59.0% 59.2% 59.2% 72.3% 75.8% 77.2% 79.8% 83.0% 82.6% 82% A-1: # of Seat Belt Citations Issued During Grant-Funded Enforcement Activities 0 245 0 2166 2568 1725 1566 5997 6,650 9856 A-2: # of Impaired Driving Arrests Made During Grant-Funded Enforcement Activities 269 272 321 275 330 301 359 506 545 456 A-3: # of Speeding Citations Issued During Grant-Funded Enforcement Activities 0 0 0 0 0 3312 2947 3963 4887 11,732
Source: FARS, MDOT, MeBHS campaign statistics

57
Goal: C-1: Fatalities (Actual) Reduce 5 year average by 5% by December 2015
Baseline 5 year average of 169.2 to 160.74
Goal: C-2: # Serious Injuries Reduce 5 year average by 5% by December 2015 Baseline 5 year average of 920 to 874

58
Goal: C-3a: Fatality Rate Reduce 5 year average by 5% by December 2015
Baseline 5 year average of 1.14 to 1.18
Goal: C-3b Rural Mileage Death Rate Reduce 5 year average by 5% by December 2015
Baseline 5 year average of 1.33 to 1.26

59
Goal: C-3c Urban Mileage Death Rate Reduce 5 year average by 5% by December 2015 Baseline 5 year average of .60 to .57 Urban Mileage Death Rate for Maine
Goal: C-4 Unrestrained Fatalities Reduce 5 year average by 5% by December 2015
Baseline 5 year average of 55.4 to 52.6

60
Goal: C-5 Fatalities at .08 or Above Reduce 5 year average by 5% by December 2015
Baseline 5 year average of 45.6 to 43.3
Goal: C-6 Speeding Related Fatalities Reduce 5 year average by 5% by December 2015
Baseline 5 year average of 69.8 to 65.4

61
Goal: C-7 Motorcycle Fatalities Reduce 5 year average by 5% by December 2015
Baseline 5 year average of 21 to 20
Goal: C-8 Unhelmeted Motorcyclists Reduce 5 year average by 5% by December 2015 Baseline 5 year average of 14.6 to 13.9

62
Goal: C-9 Drivers 20 & Under Reduce 5 year average by 5% by December 2015
Baseline 5 year average of 22.2 to 21.1
Goal: C-10: Pedestrian Fatalities Reduce 5 year average by 10% by December 2015 Baseline 5 year average of 11 to 10.5

63
Goal: B-1: Observed Belt Use Increase Seat Belt Useage by 2% to 83.6% by December 2015 Baseline Based on 2010 survey data
Goal: A-1: # Seat Belt Citation Monitor Baseline 5 year average of 5159

64
Goal: A-2: Impaired Driving Arrests Monitor Baseline 5 year average of 433
Goal: A-3: Speeding Citations Monitor Baseline 5 year average of 5367

65
Maine Lane Departure 2001-2010
8000850090009500
100001050011000115001200012500
2001 2002 2003 2004 2005 2006 2007 2008 2009 2010
Nu
mb
er
of
Cra
sh
es
Maine Lane Departure Fatalities 2001-2010
100
110
120
130
140
150
2001 2002 2003 2004 2005 2006 2007 2008 2009 2010
Nu
mb
er
of
Fata
liti
es

66
Illegal/Unsafe Speed Crashes
4000
4500
5000
5500
6000
6500
7000
7500
2001 2002 2003 2004 2005 2006 2007 2008 2009 2010
Nu
mb
er
of
Cra
sh
es
Illegal/Unsafe Speed Fatalities
505560657075808590
2001 2002 2003 2004 2005 2006 2007 2008 2009 2010
Nu
mb
er
of
Fata
liti
es

67
Distracted Driving Crashes
9000
10000
11000
12000
13000
14000
15000
2001 2002 2003 2004 2005 2006 2007 2008 2009 2010
Nu
mb
er
of
Cra
sh
es
Distracted Driving Fatalities
20
30
40
50
60
70
80
90
2001 2002 2003 2004 2005 2006 2007 2008 2009 2010
Nu
mb
er
of
Fata
liti
es

68
Mature Driver Crashes (65+)
4200
4400
4600
4800
5000
5200
5400
2001 2002 2003 2004 2005 2006 2007 2008 2009 2010
Num
ber o
f Cra
shes
Mature Fatalities (65+)
10
20
30
40
50
60
70
2001 2002 2003 2004 2005 2006 2007 2008 2009 2010
Num
ber o
f Fat
aliti
es

69
Source: Maine Strategic Highway Safety Plan

70
Appendix B:
Driver Awareness Surveys in Maine, June 2011
Safety Belt Use in Maine 2011

71
Driver Awareness Surveys in Maine, June 2011
September 28, 2011
Prepared for:
The University of Southern Maine Portland, Maine
Prepared by:
William A. Leaf and Neil K. Chaudhary
Preusser Research Group, Inc. Trumbull, Connecticut

9/28/2011 - 1 -
Introduction Maine is one of 16 States to have upgraded their seat belt law to primary enforcement since 1997. As of July 2008, 26 States, the District of Columbia and Puerto Rico had primary enforcement laws. Having a primary seat belt law allows law enforcement to issue a belt citation upon observation of a seat belt violation alone. With secondary seat belt laws, police must first observe another violation (e.g. speeding) before being able to issue a seat belt citation. The primary belt law in Maine went into effect September 20, 2007, with an educational grace period to April 1, 2008. In 2008, NHTSA conducted a three-part evaluation of the implementation and effects of the new primary belt law (Chaudhary, Tison, and Casanova, 2010). In 2009 and in 2010, an additional survey of driver knowledge was conducted (Leaf and Chaudhary, 2009; Leaf and Chaudhary, 2010). Because the driver knowledge measurement described in this report is a continuation of the work reported previously, this document quotes liberally from those reports. Primary laws have been associated with a higher percentage of observed seat belt use (e.g. Ulmer et al., 1995). In 2008, States with primary laws had an average observed seat belt usage rate about 9 percentage points higher than those with secondary laws (based on NHTSA, 2009). Seat belt use saves lives. It is estimated that nearly half of passenger vehicle fatalities involving unbelted occupants would be prevented if they had been properly restrained. In practice, changes from secondary to primary belt laws have led, along with greater belt use, to fewer traffic fatalities. For example, in late 1999 and early 2000, Alabama, Michigan, and New Jersey changed their laws from secondary to primary. Chaudhary (in review) reported that these laws increased seat belt use among fatally injured front seat occupants of motor vehicles and also decreased the number of fatalities. Similar effects were seen with other States as they passed belt use laws – belt use increased but fatalities did not drop as much as expected. One explanation was that the drivers who were buckling up were drivers who were already relatively safe drivers and the risky drivers, more likely to be involved in a crash, remained unrestrained. Thus, those most in need of seat belts were least likely to buckle up. Preusser, Williams, and Lund (1986) showed support for this contention. In their study, researchers went to bars in New York State several months after the New York seat belt law went into effect. Seat belt observations occurring on roadways near taverns showed that 43 percent of drivers during the day were belted but that observed belt use dropped to 36 percent at night, at the same location. Furthermore, drivers most likely to be drinking (and therefore constituted a higher risk) had even lower belt use. Indeed, drivers arriving or leaving bar parking lots at night had a 24 percent belt use rate. One of the key features, of course, of a primary belt law is that the general public is aware of the law and perceives a high probability of being stopped and ticketed for not being restrained. Chaudhary et al. (2010) conducted three waves of surveys of drivers at Maine Bureau of Motor Vehicles (BMV) offices. They showed that the public was aware of the main feature of the primary belt law, i.e., that they can be stopped and ticketed simply for not wearing their seat belts. Knowledge remained high in June 2009 and 2010 (Leaf and Chaudhary, 2009; Leaf and Chaudhary, 2010).

9/28/2011 - 2 -
This report repeats the Chaudhary et al. methodology to examine the evolution of driver knowledge and attitudes a year after they were last assessed, 38 months after Maine’s primary belt law began to be enforced. Some results from the earlier reports are included here for perspective. The survey used in this iteration, as the one in 2010, was modified to extend driver knowledge measurement to the topics of drinking and driving, speeding, and cell phone use. Method Surveys were conducted in eight Bureau of Motor Vehicle (BMV) offices across the state of Maine: Augusta, Bangor, Ellsworth, Kennebunk, Mexico, Portland, Rockland, and South Portland. The offices were selected to provide a representative sampling of Maine drivers. Surveys were conducted from July 8, 2011, through July 15, 2011, shortly after the Nationwide Click It or Ticket campaign, which was conducted around the Memorial Day holiday. The methods were identical to those in Chaudhary et al. (2010). Each individual completing a survey was required to be a licensed driver in the state of Maine. While individuals were waiting to be called at a station, they were approached and asked if they held a valid Maine license. Once qualified, they were asked to complete the anonymous survey. The survey consisted of 17 questions on one side of a single sheet of paper. A copy of the survey is included as Appendix A. Surveys prior to 2010 were entirely about the primary seat belt law, new at those times. The last two surveys began with driver background questions: age, sex, home zip code, and amount of driving and primary vehicle type. In addition there were:
·
·
·
·
4 questions on seat belt use, enforcement, and enforcement publicity; 3 questions on drinking and driving and enforcement; 3 questions on speeding and enforcement; and 2 questions on cell phone use.
The scope of the current survey reflected major topics of emphasis within the Maine highway safety office.

9/28/2011 - 3 -
Results Demographics
A total of 1,661 driver surveys were completed across the eight BMV offices. Forty-six percent were male, 54 percent female. Two percent were under 18 years of age; 14 percent were 18-25; 14 percent were 26-34; 27 percent were 35-49; 19 percent were 50-59; and 24 percent were age 60 or older. Eighteen percent drove less than 5000 miles/year; 28 percent drove 5000-10,000 miles/year; 28 percent drove 10,001-15,000 miles/year; and 26 percent drove more than 15,000 miles/year. Fifty-two percent drove passenger cars; 17 percent drove pickup trucks; 19 percent drove SUVs; 4 percent drove minivans; 2 percent drove full-size vans; and 5 percent drove other or multiple kinds of vehicles.
Belt Use Self-reported belt use has increased steadily from the three measurements in 2008 to July 2011. The distribution of July 2011 belt use reports is given in Table 1; comparative values over the six waves are shown in Figure 1. Note that the actual belt use, measured at 120 sites statewide, was nearly constant at 81 percent in June 2008 and June 2009 and 82 percent in June 2010 and June 2011.
Table 1. Driver reports: How often they use seat belts
How often wear belts? Number Percent Always 1,395 84.1% Nearly always 149 9.0% Sometimes 72 4.3% Seldom 26 1.6% Never 16 1.0% TOTAL N 1,658

9/28/2011 - 4 -
Figure 1. How often do you use seat belts?
Drivers were asked how their current seat belt use compared to their belt use in recent years. This year’s results are shown in Table 2 and, along with the preceding four waves, in Figure 2. About 60 percent of drivers in the first four waves indicated that their belt use was unchanged; this increased to 64 percent in 2010 and 68 percent in 2011. These increases were nearly matched by decreases in the “more often” responses, about 17 percent in the first four waves, 14 percent in 2010, and just 11 percent in 2011. The consistency of these reports is independent of actual belt use, which rose about seven percent over the three waves in 2008 before stabilizing in June 2008 through June 2011. About one-third of drivers report increased belt use even though the overall belt use numbers are quite steady.
Table 2. Driver reports: Belt use compared to “last couple of years”
How often wear belts? Number Percent Much less often 19 1.2% Less often 6 .4% About the same 1,109 68.3% More often 176 10.8% Much more often 313 19.3% TOTAL N 1,623

9/28/2011 - 5 -
Figure 2. Compared to the last couple of years, do you now wear your seat belt … Drivers also rated what they thought their chances were of getting a seat belt ticket if they drove without wearing their seat belt. Just one-third (34.1 percent) felt that they would be ticketed always or nearly always if they were not properly buckled up. This is nearly identical to 2010 but down significantly from June 2008 and June 2009, when 46 percent and 47 percent, respectively, of drivers thought so. Compared with June 2010, other proportions of drivers were nearly unchanged: those who thought they would be ticketed sometimes (43 percent to 44 percent), seldom (17 percent both years), or never (5 percent both years).
Table 3. Driver reports: Chances of getting a ticket if driving unbelted …
Chances of getting a ticket? Number Percent Always 312 19.0% Nearly always 248 15.1% Sometimes 726 44.1% Seldom 277 16.8% Never 83 5.0% TOTAL N 1,646
Awareness of Enforcement and Media Seat Belt Efforts The next survey questions asked drivers what they had seen or heard recently about using seat belts. Note that these surveys were administered about a month after the annual CIOT program,

9/28/2011 - 6 -
which emphasizes media messages and highly visible enforcement. Survey timing was nearly identical in 2010, but awareness dropped in 2011. The first question asked, “In the past 60 days, have you seen or heard about extra enforcement where police were looking at seat belt use?” Just over half (53 percent) said they had, compared with nearly 2 in 3 (65 percent) in 2010. Those who had indicated a general awareness were asked to check where they had seen or heard something and what message theme(s) they recalled. The results are summarized in Tables 4 and 5 below. 2010 values are also presented for comparison. Television was the most cited medium, by 26 percent of all respondents, followed by radio (18 percent), newspaper (11 percent), police checkpoints (6 percent), posters (4 percent), and a web site (1 percent). “Other” medium was selected by 8 percent of the respondents, nearly all of them explaining they heard about it from someone else (e.g., friend, people, or word of mouth).

9/28/2011 - 7 -
Table 4. Where did they see or hear about extra seat belt enforcement (check all that apply)
2010 2011 Where see/hear about seat belts * Number Percent Number Percent Newspaper 204 12.8% 182 11.0% Radio 411 25.7% 295 17.9% Television 579 36.2% 435 26.3% Poster 63 3.9% 59 3.6% Web site 20 1.3% 24 1.5% Police checkpoint 113 7.1% 99 6.0% Other 143 8.9% 124 7.5% TOTAL N RESPONDENTS 1,600 1,661
* Respondents could check more than one; percents do not need to add to 100%. The most mentioned theme of the messages, by 39 percent of the respondents, was Click It or Ticket, which was the national theme. Seventeen percent identified Buckle Up. No Excuses! as the theme they had heard. Smaller numbers recognized Drunk driving. Over the limit. Under arrest. (7 percent) and Survive your drive (3 percent). Four percent checked Other, but no more than one or two respondents mentioned any specific theme.
Table 5. If yes, what did it say?
2010 2011 What did the messages say? Number Percent Number Percent Click it or ticket 836 52.3% 642 38.9% Drunk driving. Over the limit. Under arrest 116 7.3% 114 6.9% Buckle up. No excuses! 311 19.4% 276 16.7% Survive your drive 42 2.6% 52 3.1% Other 53 3.3% 63 3.8% TOTAL N RESPONDENTS 1,600 1,652
Self-Reported Belt Use and Other Factors The surveys provide the opportunity to examine belt use, as reported by the respondents, as related to demographic characteristics and other factors in the surveys. These are the subjects of Tables 6 and 7. Males report lower belt use than females, consistent with belt use observations. Drivers ages 18-25 reported lowest belt use, followed by drivers ages 26-39. Drivers under 18, though infrequent in the surveys, report belt use as high as do drivers ages 40-49. Drivers ages 50 and higher report the highest belt use. The few drivers who report using their seat belts less or much less than recently are very unlikely to report buckling up compared to others. Drivers who report “about the same” are most likely to

9/28/2011 - 8 -
buckle up, followed by those who report “much more often”. Drivers who report buckling up “more often” are, oddly enough, relatively unlikely to report buckling up. This pattern was also seen in 2010. There are no significant differences in reported seat belt use between different miles driven categories or the BMV offices.
Table 6. Demographics and self-reported belt use
Factor Total N Self-Reported Seat Belt Use (percent)
Always Nearly always Sometimes Seldom Never
Sex *** Male Female
750 898
77.3% 89.6%
12.9% 5.8%
6.3% 2.8%
2.0% 1.2%
1.5% 0.6%
Age *** Under 18 18-25 26-34 35-49 50-59 60 or older
35 238 228 449 312 392
85.7% 71.0% 76.8% 84.2% 90.4% 91.3%
8.6% 16.8% 13.2% 7.8% 6.4% 5.1%
5.7% 7.6% 6.6% 4.2% 3.2% 2.0%
0.0% 3.4% 2.2% 2.7% 0.0% 0.3%
0.0% 1.3% 1.3% 1.1% 0.0% 1.3%
Miles driven, last year Less than 5000 5000-10,000 10,001-15,000 More than 15,000
295 471 462 424
85.8% 87.3% 83.5% 80.0%
7.8% 8.1% 10.0% 9.9%
4.4% 3.6% 3.7% 5.9%
1.0% 0.4% 1.5% 3.3%
1.0% 0.6% 1.3% 0.9%
Vehicle driven most often *** Passenger car Pickup truck SUV Minivan Full-sized van Other
869 288 321 74 30 76
87.2% 72.6% 86.3% 91.9% 83.3% 76.3%
7.2% 14.6% 9.3% 4.1% 3.3% 13.2%
3.9% 8.7% 1.2% 1.4% 6.7% 7.9%
1.0% 2.8% 2.2% 1.4% 3.3% 0.0%
0.6% 1.4% 0.9% 1.4% 3.3% 2.6%
How often use belt now vs. recent years *** Much less often, less often About the same More often Much more often
23 1,109 176 313
39.1% 90.9% 50.0% 81.2%
21.7% 4.0% 26.7% 16.9%
8.7% 3.0% 18.8% 1.3%
8.7% 1.4% 4.5% 0.0%
21.7% 0.7% 0.0% 0.6%
BMV Office Augusta Bangor Ellsworth Kennebunk Mexico Portland Rockland South Portland
225 273 170 199 126 225 165 149
84.9% 78.0% 81.8% 89.4% 85.7% 82.2% 88.4% 85.5%
8.9% 11.7% 10.0% 4.5% 10.3% 10.2% 4.4% 12.1%
4.0% 5.9% 5.3% 2.5% 2.4% 5.5% 4.9% 2.4%
0.9% 2.9% 1.8% 2.5% 0.8% 1.5% 1.3% 0.0%
1.3% 1.5% 1.2% 1.0% 0.8% 0.7% 0.9% 0.0%
*** p < .001

9/28/2011 - 9 -
Drivers who think the chances of being ticketed if unbelted are “always” or “never” are more likely to report always wearing their belts, but the drivers believing there is no chance of being ticketed also are most likely to report never wearing their belts.
People aware of extra seat belt enforcement within the 60 days before the survey or who recognized “Click It or Ticket” were somewhat less likely to report always using their seat belts and somewhat more likely to report the lower levels of belt use. It may be that people less likely to wear their belts are more sensitive to noticing such campaigns, and it is not clear how these differences relate to the actual effectiveness of the campaign. These differences were of marginal statistical significance.
Table 7. Awareness of seat belt campaigns and self-reported belt use
Factor Total N Self-Reported Seat Belt Use (percent)
Always Nearly always Sometimes Seldom Never
Chances of getting ticket if unbelted *** Always Nearly always Sometimes Seldom Never
310 248 725 277 83
92.6% 80.2% 83.2% 79.1% 89.2%
3.2% 12.9% 9.5% 12.3% 3.6%
2.6% 5.6% 4.8% 4.7% 2.4%
0.6% 1.2% 1.7% 3.2% 0.0%
1.0% 0.0% 0.8% 0.7% 4.8%
Past 60 days, seen/heard about extra seat belt enforcement * Yes No
876 773
81.8% 87.5%
10.6% 7.2%
4.3% 3.5%
1.9% 1.2%
1.3% 0.6%
Recognized Click It or Ticket Yes No
640 1,018
81.1% 86.1%
10.9% 7.8%
4.8% 4.0%
1.9% 1.4%
1.3% 0.8%
* p < .05; *** p < .001

9/28/2011 - 10 -
Drinking and Driving Three questions addressed the issue of drinking and driving. The first asked how often within the last 60 days the respondent had driven within two hours after drinking alcoholic beverages. Seven out of eight (87.8 percent) report never doing so. Just 2.8 percent report doing so once and 3.1 percent twice; other responses range from 3 to 10 times with outlier responses including to 30 (n = 4), 40 (n = 1), and 60 (n = 1). The results are summarized in Table 8 below. Females are more likely than males to never drive after drinking (91 percent vs. 85 percent). All drivers less than 18 report never driving after drinking. Drivers 18-25 and 26-34 are less likely to never drive after drinking than drivers 35 and over (80-84 percent vs. 90-92 percent). Also, drivers who report always wearing seat belts are more likely to never drive after drinking (89 percent) than drivers who report less frequent belt use (83 percent). Drivers who report driving the least (< 5000 miles/year) more often never drove after drinking (94 percent) than drivers who drove more miles (86-88 percent). There were no differences in reported driving after drinking by type of vehicle driven (not shown).
Table 8. Self-reported driving within two hours after drinking in the last 60 days
Factor Total N Frequency, drive after drinking in 60
days (percent) Never 1-2 times 3 or more
Total 1,621 88.4% 6.6% 5.0% Sex *** Male Female
734 877
85.3% 90.9%
7.1% 6.3%
7.6% 2.9%
Age *** Less than 18 18 – 25 26 – 34 35 – 49 50 – 59 60 or older
34 232 226 439 308 378
100.0% 80.2% 84.1% 89.7% 91.6% 90.7%
0.0% 9.5% 10.2% 5.7% 5.5% 5.3%
0.0% 10.3% 5.8% 4.6% 2.9% 4.0%
Miles driven, last year * Less than 5000 5000-10,000 10,001-15,000 More than 15,000
287 457 453 419
94.4% 87.7% 87.4% 86.2%
3.1% 6.6% 7.3% 8.4%
2.4% 5.7% 5.3% 5.5%
Self-Reported Seat Belt Use ** Always All other
1,359 259
89.5% 83.0%
6.2% 8.5%
4.3% 8.5%
* p < .05; ** p < .01; *** p < .001

9/28/2011 - 11 -
Overall, 42 percent of respondents felt that the likelihood of being arrested if driving impaired was Always or Nearly always. Almost half felt they would be arrested Sometimes. Few thought impaired drivers had very low chances of being apprehended; just 5 percent answered Seldom, 1 percent Never. Details are given in Table 9. Nearly three in four drivers (69 percent) report seeing or hearing about impaired driving enforcement within the last six weeks. Those drivers felt the likelihood of arrest for impaired driving was higher than did the drivers who had not seen recent enforcement messages. In general, females felt the odds of arrest for impaired driving were higher than did males, and young drivers felt the odds were higher than did older drivers. Drivers who drove the fewest miles tended to believe arrest for DWI is more likely. There were no differences by vehicle type most frequently driven or self-reported levels of seat belt use (all not shown).
Table 9. Awareness of impaired driving enforcement and perceived likelihood of arrest
Factor Total N
Perceived likelihood of arrest if driving impaired (percent)
Always Nearly always Sometimes Seldom Never
Total 1,645 17.6% 24.9% 51.1% 5.0% 1.0% Past 60 days, seen/heard about extra drink-driving enforcement *** Yes No
1136 509
17.9% 17.1%
28.3% 17.3%
48.7% 56.4%
4.1% 6.9%
0.6% 1.8%
*** p < .001
Speeding Overall, 8 in 9 drivers admitted driving more than 35 mph on roads with a 30 mph speed limit at least occasionally. Three percent said they did it Always, and 10 percent said they did it Nearly always. Most (43 percent and 33 percent) reported doing it Sometimes or Seldom. Just 12 percent said they never did so. Though males admitted going over 35 mph slightly more than females, the difference was not significant. Drivers ages 18-35 were more likely to speed than older drivers and drivers under 18; drivers age 60 and older were least likely to speed. The more miles they drove, drivers were more likely to speed Sometimes or more. Self-reported speeding was not related to type of vehicle. Drivers who always used their seat belts were less likely to speed than other drivers. The details are shown in Table 10.

9/28/2011 - 12 -
Table 10. Self-reported driving more than 5 mph over 30 mph speed limit
Factor Total N How often drive over 35 in 30 mph zone (percent)
Always Nearly always Sometimes Seldom Never
Total 1,650 2.6% 9.9% 43.0% 32.7% 11.8% Sex Male Female
744 895
3.2% 2.1%
10.6% 9.4%
43.8% 42.7%
32.4% 33.0%
9.9% 12.8%
Age *** Under 18 18-25 26-34 35-49 50-59 60 or older
35 239 226 446 309 390
2.9% 7.9% 3.5% 1.6% 1.3% 1.0%
8.6% 23.8% 11.9% 6.3% 7.1% 6.7%
42.9% 41.0% 41.2% 44.2% 45.3% 42.3%
31.4% 20.1% 31.4% 35.4% 32.7% 38.2%
14.3% 7.1% 11.9% 12.6% 13.6% 11.8%
Miles driven, last year ** Less than 5000 5000-10,000 10,001-15,000 More than 15,000
292 469 461 422
3.1% 2.6% 2.8% 2.1%
10.3% 9.2% 8.2% 11.8%
32.2% 44.3% 44.5% 47.4%
36.6% 32.4% 33.4% 30.1%
17.8% 11.5% 11.1% 8.5%
Vehicle driven most often Passenger car Pickup truck SUV Minivan Full-sized van Other
863 149 320 74 30 39
3.1% 3.5% 1.3% 1.4% 0.0% 0.0%
10.5% 5.9% 11.9% 4.1% 20.0% 15.4%
40.9% 47.7% 45.0% 48.6% 30.0% 38.5%
32.4% 32.8% 31.9% 32.4% 40.0% 38.5%
13.0% 10.1% 10.0% 13.5% 10.0% 7.7%
Self-Reported Seat Belt Use *** Always All other
1,385 262
1.5% 8.4%
8.2% 18.3%
43.0% 43.1%
34.4% 24.0%
12.8% 6.1%
** p < .01; *** p < .001 Drivers were very ready to believe speeding results in tickets. For driving over the speed limit, 8 percent of drivers reported believing the offense would Always result in a ticket, and another 21 percent felt it would Nearly always produce a ticket. Just 1 percent felt it would never result in a ticket. Drivers who more often drive over the speed limit were less likely to believe such behavior results in tickets. About half of all drivers (52 percent) reported seeing or hearing about heightened police enforcement of speeding laws. They were much more likely to also report high likelihood of being ticketed for exceeding the speed limit. Details are show in Table 11.
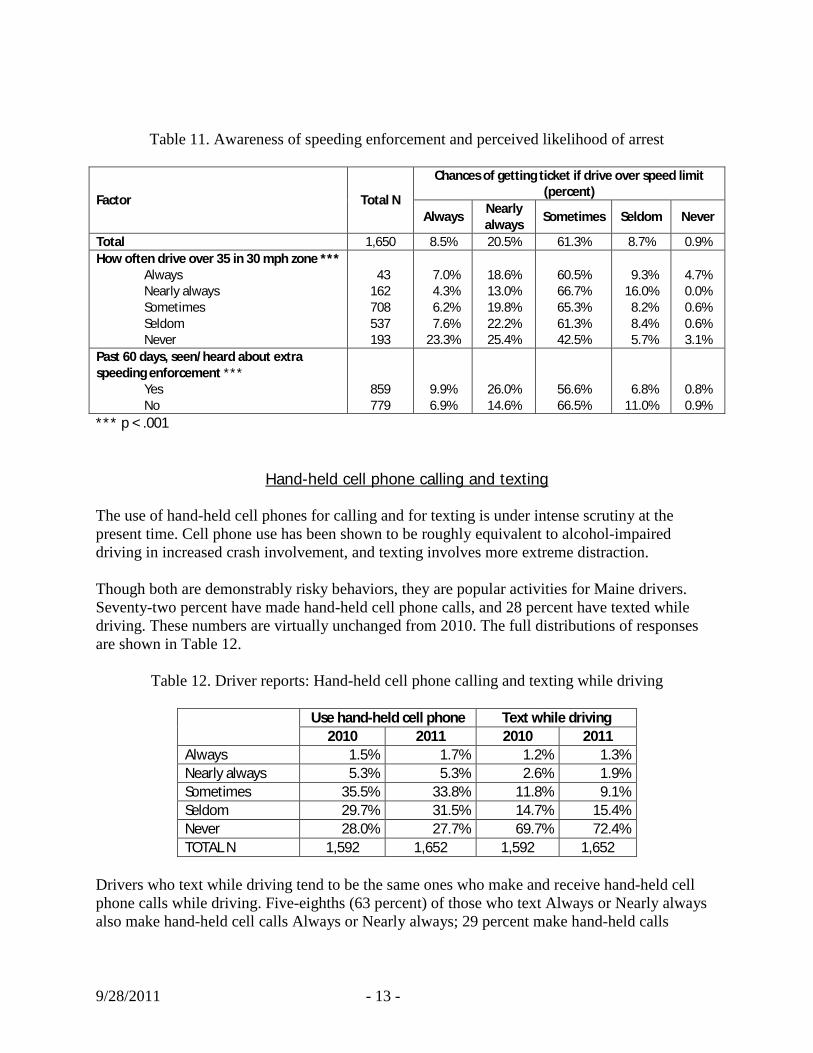
9/28/2011 - 13 -
Table 11. Awareness of speeding enforcement and perceived likelihood of arrest
Factor Total N
Chances of getting ticket if drive over speed limit (percent)
Always Nearly always Sometimes Seldom Never
Total 1,650 8.5% 20.5% 61.3% 8.7% 0.9% How often drive over 35 in 30 mph zone *** Always Nearly always Sometimes Seldom Never
43 162 708 537 193
7.0% 4.3% 6.2% 7.6% 23.3%
18.6% 13.0% 19.8% 22.2% 25.4%
60.5% 66.7% 65.3% 61.3% 42.5%
9.3% 16.0% 8.2% 8.4% 5.7%
4.7% 0.0% 0.6% 0.6% 3.1%
Past 60 days, seen/heard about extra speeding enforcement *** Yes No
859 779
9.9% 6.9%
26.0% 14.6%
56.6% 66.5%
6.8% 11.0%
0.8% 0.9%
*** p < .001
Hand-held cell phone calling and texting The use of hand-held cell phones for calling and for texting is under intense scrutiny at the present time. Cell phone use has been shown to be roughly equivalent to alcohol-impaired driving in increased crash involvement, and texting involves more extreme distraction. Though both are demonstrably risky behaviors, they are popular activities for Maine drivers. Seventy-two percent have made hand-held cell phone calls, and 28 percent have texted while driving. These numbers are virtually unchanged from 2010. The full distributions of responses are shown in Table 12.
Table 12. Driver reports: Hand-held cell phone calling and texting while driving
Use hand-held cell phone Text while driving 2010 2011 2010 2011
Always 1.5% 1.7% 1.2% 1.3% Nearly always 5.3% 5.3% 2.6% 1.9% Sometimes 35.5% 33.8% 11.8% 9.1% Seldom 29.7% 31.5% 14.7% 15.4% Never 28.0% 27.7% 69.7% 72.4% TOTAL N 1,592 1,652 1,592 1,652
Drivers who text while driving tend to be the same ones who make and receive hand-held cell phone calls while driving. Five-eighths (63 percent) of those who text Always or Nearly always also make hand-held cell calls Always or Nearly always; 29 percent make hand-held calls

9/28/2011 - 14 -
Sometimes. Ninety-nine percent of those who Never make hand-held cell phone calls also Never text. As shown in Table 13, there was no difference in hand-held cell phone use by sex. With the exception of under-18 drivers, hand-held cell phone use was greatest for drivers ages 18-34 and dropped off with increasing age. Under-18 drivers Always or Nearly always used hand-held cell phones as much as anyone but also had very high rates of Never using the devices. Hand-held cell phone use was least for drivers with less than 5000 miles driven last year and increased with mileage; it’s important to emphasize that the measure is of the rate of phone use, not the total number of calls. Hand-held cell phone use was greatest for full-sized van and other-vehicle drivers, less for drivers of all other specific vehicle types. Drivers who always wore seat belts used hand-held cell phones much less than drivers who used their seat belts less often.
Table 13. Self-reported talking on hand-held cell phone when driving
Factor Total N
How often talk on hand-held cell phone when driving (percent)
Always Nearly always Sometimes Seldom Never
Sex Male Female
745 896
2.1% 1.3%
5.8% 4.9%
36.4% 31.8%
31.0% 31.9%
24.7% 30.0%
Age *** Under 18 18-25 26-34 35-49 50-59 60 or older
35 239 227 446 308 392
5.7% 4.2% 3.1% 1.3% 0.3% 0.5%
8.6% 10.5% 11.0% 4.5% 1.9% 2.0%
8.6% 48.5% 43.2% 41.3% 34.4% 12.8%
28.6% 25.5% 30.0% 30.9% 38.3% 31.6%
48.6% 11.3% 12.8% 22.0% 25.0% 53.1%
Miles driven, last year *** Less than 5000 5000-10,000 10,001-15,000 More than 15,000
293 469 462 422
0.7% 1.3% 1.9% 2.6%
3.8% 3.2% 5.0% 9.0%
18.1% 29.9% 38.7% 43.8%
30.7% 34.5% 32.7% 27.3%
46.8% 31.1% 21.6% 17.3%
Vehicle driven most often *** Passenger car Pickup truck SUV Minivan Full-sized van Other
866 285 321 74 29 39
1.3% 2.1% 1.9% 0.0% 3.4% 2.6%
4.4% 5.3% 6.2% 4.1% 13.8% 15.4%
31.4% 40.4% 35.8% 36.5% 37.9% 23.1%
34.8% 26.0% 30.8% 29.7% 20.7% 12.8%
28.2% 26.3% 25.2% 29.7% 24.1% 46.2%
Self-Reported Seat Belt Use *** Always All other
1,388 261
0.8% 6.5%
4.0% 11.9%
32.2% 42.1%
33.5% 21.1%
29.5% 18.4%
*** p < .001 Patterns were similar for texting, though at lower levels of activity than hand-held cell phone use (not shown). Texting did not vary by sex or by type of vehicle. Texting was at highest levels for drivers ages 18-25 and gradually decreased with age. Some drivers under 18 texted frequently,

9/28/2011 - 15 -
but most never texted, similar to drivers in their 40s. The rate of texting became more frequent as miles driven increased. Finally, texting was less frequent for drivers who always wore seat belts. Discussion In eight Maine Bureau of Motor Vehicles offices in July 2011, 1,661 drivers with valid Maine driver’s licenses completed one-page surveys. Drivers were surveyed about their knowledge of recent campaigns to increase awareness and compliance as well as their own attitudes and belt use. They were also surveyed about drinking and driving, speeding, and texting and calling using hand-held cell phones. This survey is an extension of five earlier surveys. The first four looked exclusively at seat belt laws, campaigns, and use; the fifth, in 2010, had expanded scope identical to the current survey. Two surveys were conducted in 2008 just before and after April 1, 2008, which was the time that Maine’s primary seat belt law first began to be enforced. The third of those surveys was done in early June 2008, after the national CIOT enforcement and media campaign, and the fourth was done in early June 2009, also just after the CIOT emphasis. The fifth survey was done in early July 2010, about 6 weeks after CIOT, exactly the same as the current survey in 2011. Overall seat belt use in passenger vehicles, as measured by Maine in Section 157-compliant observations, was nearly unchanged over the three years: 83.0 percent in 2008, 82.6 percent in 2009, 82.0 percent in 2010, and 81.6 percent in 2011. Most drivers reported high personal use of seat belts (84 percent “always” and 9 percent “nearly always”), consistent with actual statewide use. Although actual statewide belt use was unchanged since 2008, drivers consistently reported using their seatbelts more than the year before: for the first five waves (three in 2008, one in 2009, and one in 2010), about 61 percent of drivers reported “about the same” belt use as in the preceding year, about 16 percent reported “more often”, and about 20 percent reported “much more often.” This year, the figures were similar, at 68 percent, 11 percent, and 19 percent, respectively. While some of this optimism corresponds to real improvement – with Maine’s adoption of its primary law there was an increase of about 7 percentage points from February 2008 to June 2008 – this pattern of reported improvement was virtually identical across the six waves, suggesting more of a persistent positive outlook than a discerning view of reality. Many drivers (39 percent) were aware of the CIOT campaign completed several weeks before the surveys were administered, down from 52 percent in 2010, suggesting the campaign may have been less visible this year. In addition, however, 17 percent recognized the “Buckle Up. No Excuses!” campaign that was used in 2007 and 2008 to publicize the new primary law but not more recently. Differences in reported seat belt use reinforced observed belt use differences and offered interesting additional patterns. By their own reports, males buckle up less, as do drivers ages 18-39, and pickup drivers. Drivers who buckle up least are those who perceive no enforcement and no chance of being ticketed. Awareness, of seat belt enforcement efforts or campaigns such as CIOT, is not a reliable predictor of belt use.

9/28/2011 - 16 -
The current survey repeated the broader focus of the 2010 survey by looking at impaired driving, speeding, and cell phone use. Very few drivers report driving within two hours after drinking alcohol, though males and younger drivers more often did this. It should be noted that this behavior, as described, is not illegal. While driving with any alcohol in one’s system increases crash risk, a single drink 1-2 hours before driving is likely to produce a BAC of .02 g/dl or less, well below the legal per se limit (.08). Questions which tap into the frequency of legally impaired driving, opinions about it, and expectations of the risk of arrest, could be a useful extension of these more general questions. There were three questions in the survey about the perceived likelihood of arrest given particular behaviors. Answers were positively correlated, with intercorrelations between .37 and .44, suggesting a general view of the level of police enforcement of traffic laws, not unreasonable. However, taken literally, the responses to those questions could be characterized as wildly unrealistic. It is not the case that always or nearly always: 1) if one drives without a seat belt one will be issued a ticket (answered by 34 percent of drivers); 2) if one drives after having drunk an unspecified amount of alcohol one will be arrested (answered by 43 percent); or 3) if one drives at any speed over the speed limit one will be ticketed (answered by 29 percent). It would be very interesting to try to understand what people think they are responding to, and what they believe, in order to better the relationship between enforcement, perceived enforcement, and behavior. Overall, the results of these surveys are useful measures of the effectiveness of seat belt use campaigns in reaching the public. They also provide detailed information about characteristics of people who use seat belts regularly and those who don’t and may point to ways to continue to increase the public’s use of seat belts. Expanding them to include other key traffic safety issues such as alcohol, speed, and distracted driving, provides information about attitudes and behaviors in these areas and allows for the unique study of common patterns within individuals.

9/28/2011 - 17 -
References Chaudhary, NK (in review). Evaluation of the Alabama, Michigan and New Jersey Safety Belt
Law Change to Primary Enforcement. Chaudhary, NK, Tison, J, & Casanova, TM (2010). Evaluation of Maine's Safety Belt Law
Change from Secondary to Primary Enforcement. Final Report, National Highway Traffic Safety Administration, Washington, DC. DOT HS 811 259.
Chaudhary, NK, Tison, J, & Casanova, TM (2010). The effects of Maine’s Change to Primary
Seat Belt Law on Seat Belt Use and Public Perception and Awareness. Traffic Injury Prevention, 11:165-172.
Leaf, WA & Chaudhary, NK (2009). Driver Awareness Surveys in Maine, June 2009. Report to
the University of Southern Maine, November, 2009. Leaf, WA & Chaudhary, NK (2009). Driver Awareness Surveys in Maine, June 2010. Report to
the University of Southern Maine, September, 2010. NHTSA (2009). Traffic Safety Facts: Occupant Protection, 2008 Data, DOT HS 811 160. Preusser, DF, Williams, AF, & Lund, AK (1986). Seat belt use among New York bar patrons.
Journal of public health policy, 7, 470-9. Ulmer, RG, Preusser, CW, & Preusser, DF (1995). Evaluation of California’s safety belt law
change from secondary to primary enforcement. Journal of Safety Research, 26 , 213-220.

1
Appendix A The survey is given in its entirety on the next page.

2
This Driver Licensing Office is assisting in a vehicle safety study. Your answers to the following questions are voluntary and anonymous. Please complete the survey and then put it in the drop box. 1. Your sex: Male Female
2. Your age: □ Under 18 □ 18-25 □ 26-34 □ 35-49 □ 50-59 □ 60 Plus
3. Your Zip Code: _______________________
4. Abo□ut how many miles did you drive last year?
Less than 5,000 □ 5,000 to 10,000 □ 10,001 to 15,000 □ More than 15,000
5. Wha□t type of vehicle do you drive most often?
Passenger car □ Pickup truck □ Sport utility vehicle □ Minivan □ Full van □ Other
6. How□ often do you use
□ seat belts when you drive or ride in a car, van, sport utility vehicle or pickup?
Always Nearly always □ Sometimes □ Seldom □ Never
7. Com□pared to the last couple
□ of years, would y
□ou say you now wear your seat belt:
Much less often Less often About the same □ More often □ Much more often
8. Wha□t do you think the
□ chances are of gettin
□g a ticket if you don't wear your seat belt?
Always Nearly always Sometimes □ Seldom □ Never
9. In th□e past 60 days, hav
□e you seen or heard about extra enforcement where police were looking at seat belt use?
Yes No
If yes□
, where did you□ see or hea
□r about i
□t? (Check all that apply):
Newspaper Radio TV Poster □ Web site □ Police checkpoint □ Other ______________
If yes□
, what did it say: Click It or Ticket □
□ □ Drunk Driving. Over the Limit. Under Arrest □ Buckle Up. No Excuses!
Survive Your Drive Other ___________________________________________________________
10. In the past 60 days, how many times have you driven a motor vehicle within 2 hours after drinking alcoholic beverages? ___________ (number of times)
11. In the past 60 days, have you read, seen o□r heard anythin
□g about police enforcement of alcohol impaired
driving (or drunk driving) laws? Yes No
12. Wha□t do you think the
□ chances are of som
□eone getting arrested
□ if they drive after drinking?
Always Nearly always Sometimes Seldom □ Never
13. On a□ local road with a
□ speed limit of 30 mp
□h, how often do you d
□rive faster than 35 mph?
Always Nearly always Sometimes Seldom □ Never
14. In th□e past 60 days, h
□ave you read, seen or heard anything about police enforcement of speed laws?
Yes No
15. Wha□t do you think the
□ chances are of gettin
□g a ticket if you drive
□ over the speed limit?
Always Nearly always Sometimes Seldom □ Never
16. How□ often do you talk
□ on a hand-held cellu
□lar phone when you drive?
Always Nearly always Sometimes □ Seldom □ Never
17. How□ often do you sen
□d text messages or e
□mails on a hand-held
□ cellular phone w
□hen you drive?
Always Nearly always Sometimes Seldom Never
□ □

Safety Belt Use in Maine 2011
Al Leighton and Margaret Gormley
Survey Research Center, Muskie School of Public Service University of Southern Maine
September 30, 2011
Submitted to:
Bureau of Highway Safety
State of Maine 164 State House Station
Augusta, Maine 04333-0164

Safety Belt Use in Maine, 2011
Prepared for the Bureau of Highway Safety, Department of Public Safety, State of Maine; by Survey Research Center, Muskie School of Public Service, University of Southern Maine, Portland, Maine September, 2011
2
Table of Contents
ACKNOWLEDGMENTS .......................................................................................4
EXECUTIVE SUMMARY ......................................................................................5
INTRODUCTION ................................................................................................. 10
METHODOLOGY ................................................................................................ 11
Road sections selected as observation sites ...................................... 12
Sampling ................................................................................................. 12
Weighting ................................................................................................ 12
Observation times and days .................................................................. 12
Observer training .................................................................................... 13
OBSERVATION STUDY FINDINGS ................................................................... 14
Overview: Compliance with the law ...................................................... 14
Gender differences ................................................................................. 14
Seating position ...................................................................................... 14
Urban/rural differences .......................................................................... 14
Type of vehicle ........................................................................................ 14
Passenger use related to use by driver ................................................ 15
Comparison with other states ............................................................... 15
Day of the week ...................................................................................... 15
Time of day.............................................................................................. 15
Weather conditions ................................................................................ 15
Comparison of 2011 with 2009 and 2010 .............................................. 15
Summary ................................................................................................. 16
NEW RURAL SITES ........................................................................................... 17 MOTORCYCLE HELMET USE ........................................................................... 20

Safety Belt Use in Maine, 2011
Prepared for the Bureau of Highway Safety, Department of Public Safety, State of Maine; by Survey Research Center, Muskie School of Public Service, University of Southern Maine, Portland, Maine September, 2011
3
End Notes .......................................................................................................... 21 List of Tables ..................................................................................................... 22 Tables 1-20 ......................................................................................................... 23
History of Occupant Protection Laws ............................................................. 40
2010 Observation Form .................................................................................... 41

Safety Belt Use in Maine, 2011
4 Prepared for the Bureau of Highway Safety, Department of Public Safety, State of Maine; by Survey Research Center, Muskie School of Public Service, University of Southern Maine, Portland, Maine September, 2011
ACKNOWLEDGMENTS
We would like to thank several people who were helpful in conducting this study. Lauren Stewart,
Director, Bureau of Highway Safety worked with us on behalf of the Maine Bureau of Highway
Safety. Gerry Audibert and Ed Beckwith at the Maine Department of Transportation provided all
of the traffic data and location information for each of the observation sites. We especially want to
express our appreciation for all of the efforts of Bill Leaf and Tara Casanova at the Preusser
Research Group in Trumbull, Connecticut. Their attention to detail regarding the data analysis
and training of observers has been crucial to the success of the project.
Finally, we thank the tremendous contributions of the Survey Research Center
observers: Margaret Gormley, Ann Charlton, Sharleen Garvey, Rob Kardell, Michael
Mulkeen and Donna Somma.
Al Leighton, Margaret Gormley
Survey Research Center
Muskie School of Public Service
University of Southern Maine

Safety Belt Use in Maine, 2011
5 Prepared for the Bureau of Highway Safety, Department of Public Safety, State of Maine; by Survey Research Center, Muskie School of Public Service, University of Southern Maine, Portland, Maine September, 2011
EXECUTIVE SUMMARY
Since 1986, the Maine Bureau of Highway Safety has periodically had an observation study of safety belt
use in Maine conducted to determine the level of compliance in the state. For the year 2011, the Survey
Research Center (SRC) at the Muskie School of Public Service, University of Southern Maine, with
assistance from the Preusser Research Group of Trumbull, Connecticut, conducted the study and
produced this report of the findings. Research results from this study provide the official measure of belt
use in Maine and provide valuable information regarding the success of the state’s efforts to educate the
public about the importance of safety belt use. Furthermore, increased seatbelt use can lead to additional
funding from the National Highway Traffic Safety Administration (NHTSA).
In 2011, in order to obtain an accurate measure of change in use rates over time, observations were
recorded at the same 120 sites as in previous years. In the vast majority of cases, observations were
conducted on the same day of the week and at the same time of day as in recent years; frequently, the
same observer went to the same site. A probability based sampling method was utilized to select the 120
segments to be observed. Among the locations chosen were sites on I-95, I-295, and the Maine Turnpike.
As a result, all types of roads and traffic were observed. As in all prior studies, visual observations were
made to determine the extent of use.
In addition, two new components of the observational study were introduced recently. An additional
selection of 36 primarily rural road segments was chosen for observations. See “New Rural Sites” on
page 17 for details of these findings. Also, motorcycle helmet use was recorded again in 2011. Results of
those observations are reported in the “Motorcycle Helmet Use” section on page 20.
Beginning in April 2008, drivers of vehicles could be stopped and ticketed for not being properly belted (in
previous years, the law required police to observe another infraction in order to stop a vehicle and issue a
ticket for not using a seatbelt). This study is now the fourth to measure the impact of the new primary
enforcement law and will provide comparisons between the baseline measures recorded three years ago
and the current year.
For the past seven years and again this year, the observations were done immediately after a major
campaign to raise awareness of Maine’s seatbelt laws. Radio ads about seatbelt use received heavy air
play in many parts of the state. In addition, many police departments conducted a coordinated and highly
visible enforcement campaign. We have speculated in the past that these steps might temporarily lead to
an increased use rate, at least during the time of the campaign and shortly after. Several steps have been
taken to examine the extent of any possible “drop off” in use rates. In 2009 the full observation study was
conducted again during the month of September. In addition, several “mini” studies of a sub-sample of

Safety Belt Use in Maine, 2011
6 Prepared for the Bureau of Highway Safety, Department of Public Safety, State of Maine; by Survey Research Center, Muskie School of Public Service, University of Southern Maine, Portland, Maine September, 2011
sites have been conducted each year during the month of April. In each case, the drop in use rates was
found to be very modest (see “Safety Belt Use in Maine, September 2009” for more details).
In 1998 NHTSA developed new methods and standardized guidelines for measuring seat belt use. As a
result, use rates can now be compared between states more accurately than was the case in the past.
This study meets all of the applicable NHTSA criteria. It also follows the NHTSA guidelines regarding
sample selection. Under these guidelines, sites selected must represent 85% of the state’s population; in
Maine, that requires sampling from the 10 counties with the highest population. See Table 11 for the list
of counties studied.
Road sections selected as observation sites. Observations of seatbelt use were conducted at 120
sites from the 10 counties (see Table 11 for a full list of towns selected). Sites were selected following a
probability-based sampling procedure developed by the Preusser Research Group and approved by
NHTSA on July 26, 2004. Restraint use was recorded for 21,879 drivers and front seat passengers in
16,935 vehicles (in the 2010- study, 15,758 vehicles and 20,444 occupants were recorded).
Sampling and estimating protocols. In 1998, NHTSA began to institute new standardized sampling and
estimating protocols for all states to follow in their safety belt use studies. These procedures were
developed to ensure comparability among findings from state to state. The new estimation formulae are
intended to provide each state with very precise estimates of their statewide belt use rates. These
formulae provide a statistically sound method to calculate weights that will help adjust sample data to
better reflect the volume and types of traffic found in all roads in a state, not just those selected for
observation. Since 2004, Maine’s sampling procedures have been based primarily on traffic data known
as the Daily Vehicle Miles Traveled (DVMT) for each county in the State. These data provide a measure
of the volume of traffic at each road segment in Maine.
One of the results of adopting new estimation methods is that the findings since 2004 are not entirely
comparable to those from previous years. Different methods can produce different results, which is why
NHTSA has adopted the new standardized methods. We support the use of the new estimation approach
and NHTSA’s efforts to bring consistency and uniformity to all of the states but remind readers that,
because of these changes, results from this year’s study are not quite equivalent to those conducted prior
to 2004.
Subgroup analyses. This report includes findings from several subgroups, such as for different seating
positions, type of vehicle, etc. We urge readers to keep in mind that some of these groups have lower
numbers and, therefore, the point estimates of their use rates are less precise than those for the entire
sample.

Safety Belt Use in Maine, 2011
7 Prepared for the Bureau of Highway Safety, Department of Public Safety, State of Maine; by Survey Research Center, Muskie School of Public Service, University of Southern Maine, Portland, Maine September, 2011
OBSERVATION STUDY FINDINGS
Overview: Compliance with the law. The overall restraint use decreased slightly in 2010, to 81.6%. We
note, however, that this change is not statistically significant as the sampling methodology can be
expected to produce estimates that range from a lower limit of 80.06% to 83.13%; the decrease of 0.4%
is well within that range. In 2002, the statewide use rate was only 59%. By 2007, that rate had increased
to 79.8%. This year, passengers have a higher use rate than drivers. Table A shows changes in the rates
for drivers and passengers for the three most recent years.
Table A
Comparison of seat belt usage rates statewide:
Occupants Observed 2011 Study
2010 Study
2009 Study
All Vehicle Occupants 81.6% 82.0% 82.6%
All Drivers 81.2% 82.1% 82.7%
All Front Passenger Seat Occupants 83.1% 81.5% 82.4%

Safety Belt Use in Maine, 2011
8 Prepared for the Bureau of Highway Safety, Department of Public Safety, State of Maine; by Survey Research Center, Muskie School of Public Service, University of Southern Maine, Portland, Maine September, 2011
Gender differences. Women in particular show substantial compliance with seatbelt laws. Table B shows
gender differences for 2009, 2010, and 2011.
Table B
Comparison of seat belt usage rates by gender:
Gender 2011 Study
2010 Study
2009 Study
Male Driver 78.2% 79.6% 80.3%
Female Driver 86.2% 86.2% 86.3%
Male Passenger 76.1% 72.2% 74.4%
Female Passenger 87.0% 86.4% 86.1%
Passengers’ use of safety belts related to use by driver. As with prior studies, belt use of passengers
is strongly correlated with the practices of the drivers. When drivers use their safety belts, other
occupants of the vehicle (who are most likely friends or family of the driver) are more than two and a half
times as likely to use their belts as they are when the driver is not using a belt (91.8% vs.34.9%).
Comparison with other states. While Maine’s safety belt use has improved considerably since 1995,
other states have increased their use as well1. As a result, the state remained near the bottom nationally
until recent years. In 1995, Maine’s rate of 50% was the fifth from the bottom of a list of all 50 states, the
District of Colombia, and Puerto Rico. By 1997, Maine’s use rate had risen only to number 352. In 2010,
only 14 states reported lower use rates than Maine. Because NHTSA has not yet released the 2011 use
rates for all states, it is not possible to report where Maine now stands, but the state use rate in 2011 is
more than 3 percentage points lower than the 2010 national average.
Type of vehicle. As has been the case in every study conducted in Maine, people in pickup trucks have
the lowest use rates, at 71.4%. While this is a substantial increase from the 39.7% reported in 2002, it
continues to be an area where considerable improvement is still possible. Cars, SUVs, and vans have
use rates of 85.0%, 84.1%, and 83.5%, respectively.

Safety Belt Use in Maine, 2011
9 Prepared for the Bureau of Highway Safety, Department of Public Safety, State of Maine; by Survey Research Center, Muskie School of Public Service, University of Southern Maine, Portland, Maine September, 2011
SUMMARY
Safety belt use in Maine has increased markedly since 1991, when only a third of people aged 16 and
over were belted. (Another change in study methods should be noted here: In all of the studies conducted
during the 1990s, information for all vehicle occupants, including children, was recorded, as well as the
estimated age of each individual. Since 2004, children are no longer included for observations, nor is age
estimated. See SRC’s report “Child Safety Seat Use in Maine 2007” for details regarding recent safety
seat and seat belt use among children in Maine.) Given that this year shows a slight decline from
previous years, it is clear that some groups, particularly males, still have room for a great deal of
improvement.
The impact of safety belt use is significant. Research published by NHTSA in 2008 stated that, when
properly used, lap/shoulder safety belts reduce the risk of fatal injury to front-seat passenger car
occupants by 45%; they reduce the risk of moderate-to-critical injury by 50%. The safety effect is even
greater for light truck occupants, where safety belts reduce the risk of fatal injury by 60% and moderate-
to-critical injury by 65%. The same study estimates that over 15,000 lives were saved by using safety
belts in the year 2006.3 It is research findings such as these that provide much of the impetus for
continuing efforts to increase seatbelt use in Maine and the nation.
This year’s study was conducted immediately after a major enforcement and publicity campaign meant to
inform the public of the new seatbelt law, and to increase safety belt usage. The rest of this report
describes how the 2011 study was implemented and presents the key findings. It also shows
comparisons between 2011 and the previous two studies. The project was conducted thanks to a contract
between the Bureau of Highway Safety, Department of Public Safety, State of Maine, and the Survey
Research Center at the Muskie School of Public Service, University of Southern Maine (USM), along with
a subcontract between USM and the Preusser Research Group in Trumbull, Connecticut.
Portland, Maine
September 30, 2011

Safety Belt Use in Maine, 2011
10 Prepared for the Bureau of Highway Safety, Department of Public Safety, State of Maine; by Survey Research Center, Muskie School of Public Service, University of Southern Maine, Portland, Maine September, 2011
INTRODUCTION
The impact of seatbelt use is substantial. Research reported by NHTSA in 2008 found that lap/shoulder
belts reduce the risk of fatal injury to front-seat passenger car occupants by 45 percent and the risk of
moderate-to-critical injury by 50 percent. Seat belts are even more effective for light-truck occupants,
reducing the fatality risk by 60 percent and the moderate-to-critical injury risk by 65 percent. In 2006, seat
belts saved the lives of an estimated 15,383 vehicle occupants age 5 and older.4 Nationally, about 85% of
all motorists now use their safety belts.5
Prior to 1996, when mandatory seatbelt laws for adults went into effect, Maine motorists used their
seatbelts at a rate only about half of the national rate.6 In November 1995, Maine voters narrowly
approved a referendum establishing a secondary enforcement law requiring almost all people to wear
safety belts or use child restraint devices. Since then, use rates in Maine have improved a great deal. The
study here reports on results from an observation study conducted in 2011, three years after Maine’s new
primary enforcement law began to be implemented. (Although the new law went into effect on September
20, 2007, ticketing didn’t begin until April 1, 2008, to allow time for the state to raise public awareness of
the law.) The data contained in this report are used to provide the Bureau of Highway Safety and the
National Highway Traffic Safety Administration the current use rates and a measure of changing use
patterns over time.
The research project was conducted by the Survey Research Center of the Muskie School of Public
Service at the University of Southern Maine, under a contract with the Maine Bureau of Highway Safety,
Department of Public Safety, State of Maine. The study was designed to determine the rate of safety
restraint use in Maine as part of the development of a statewide comprehensive highway safety plan as
required by NHTSA. It incorporates the standardized design requirements developed by NHTSA in an
effort to ensure reliability and comparability of findings between each of the states.

Safety Belt Use in Maine, 2011
11 Prepared for the Bureau of Highway Safety, Department of Public Safety, State of Maine; by Survey Research Center, Muskie School of Public Service, University of Southern Maine, Portland, Maine September, 2011
METHODOLOGY
In 2004, a number of methodological changes were introduced in the observation study. These include
the selection of road segments for observation, instead of controlled intersections; observation of moving
vehicles, rather than stopped vehicles; observations on the Maine Turnpike and interstates; and the end
of the practice of recording use for infants, children, and young teenagers (and the related practice of
estimating ages of occupants). All of these changes have continued this year. While all previous studies
have met NHTSA guidelines and represent the official state use rates, the effect of these changes means
that direct comparisons may not be entirely accurate between studies conducted prior to 2004 and those
conducted since. The following is a description of the changes that were implemented and their potential
impact.
The biggest change in protocols in 2004 was that of sampling from all road segments on all types of
roads rather than only selecting controlled intersections, as had been the practice up until 2004. It is
possible that only recording cars and trucks at traffic signals is not representative of all traffic in the state.
For instance, it may be that people traveling on roads with enough traffic to warrant a traffic signal are
more likely to buckle up than those on less busy sections of roads. Or it might be that, where there are
red lights to slow traffic down, people feel less need to use their belts. In either case, the presence of a
traffic signal might affect use rates at each site; recording usage only at signalized intersections could
affect the statewide measure of use. Similarly, including traffic on highways affects the results. A great
deal of Maine’s traffic is on the turnpike and interstates. Not including any of that traffic, which may have
different use patterns, potentially impacted use rates measured. With the new protocols, the presence of
traffic lights and absence of highway driving is no longer a factor in the estimates reported.
The next most significant change that took effect in 2004 was the observation of moving vehicles. Here it
must be stated that recording use of occupants in moving cars and trucks is more difficult than observing
stopped vehicles. There are several factors that make it harder—tinted windows, glare of sunlight, dark
seatbelts on dark clothing, etc., not to mention the speed of cars on some roads. Several years of field
experience, in Maine and in all of the other states, along with consistent training of observers, have found
that these are barriers that can be overcome.
In addition to these methodological adjustments, another important factor is the highly advertised and
visible awareness and enforcement campaign that was conducted immediately before the current study
was begun. While this seems to have the effect of at least temporarily boosting people’s likelihood of
using safety belts, the September 2009 study that was conducted by the Muskie School and Preusser
Research Group shortly after the campaign ended found the impact to be only a modest one.

Safety Belt Use in Maine, 2011
12 Prepared for the Bureau of Highway Safety, Department of Public Safety, State of Maine; by Survey Research Center, Muskie School of Public Service, University of Southern Maine, Portland, Maine September, 2011
Road sections selected as observation sites. Observation sites must allow the opportunity for a
reasonably representative flow of multi-purpose traffic, while allowing observers a safe viewing position
from which to observe and record belt use of occupants in each vehicle. Observers were given
descriptions of the road segment to observe (e.g., “in Auburn, on Minot Avenue, between Heath Lane and
Garfield Road”). They were also told which direction of traffic to observe. They then were able to find the
most advantageous spot on the road segment from which to observe. They were instructed to only
include vehicles that had actually passed through the first identifier of the description (in the example
above, the intersection of Minot Avenue and Heath Lane). Observations were conducted from a single
point on each segment. In all, observations of 16,935 passenger vehicles and the use or nonuse by
21,879 occupants was recorded. A list of the towns and cities selected appears as Table 11.
Sampling. The sites to be observed were selected by the Preusser Research Group of Trumbull, Conn.
The sampling design was developed to ensure compliance with NHTSA’s standardized guidelines. The
sampling process was designed to provide a confidence level of 95% with an acceptable margin of error
of plus or minus 3%. This resulted in a final sample size of 120 road segments. The probability of a road
segment being selected was proportional to the traffic volume measured in average daily vehicle-miles
traveled (DVMT) on each road segment, according to Maine Department of Transportation data. Again in
2011, the same 120 sites were observed as in 2004 through 2010.
Weighting. Consistent with NHTSA guidelines, the data were weighted to reflect the sampling design and
the average traffic volume at the selected road segments. The weighting simply adjusts the actual
number of vehicles observed to reflect the expected number of vehicles, based on the traffic volume
where the segment is located, and combines the site data in a way that represents statewide traffic
volumes.
Observation times and days. Observations were made at 120 locations throughout the state for 45
minutes each, on a structured schedule of observation times and days that would maximize the
opportunity to study variations in restraint use by time and by day of the week. Road segments were
randomly assigned to a day and time for observations, although consideration had to be given for trips to
locations that required lengthy travel times. Each day and time had an equal probability of selection. All
observations were done during daylight hours. Approximately 85% of the 2011 observations were done
on the same day and time as the 2004 through 2010 observations. Those few that were done on a
different day or time (due to weather, schedules, etc), were done at comparable times. For instance, a
site that was observed in 2010 on a Tuesday morning could be done this year on a Wednesday or
Thursday morning, but not on a Saturday morning, because travel patterns may be different on the
weekend.

Safety Belt Use in Maine, 2011
13 Prepared for the Bureau of Highway Safety, Department of Public Safety, State of Maine; by Survey Research Center, Muskie School of Public Service, University of Southern Maine, Portland, Maine September, 2011
Many roads have two or more lanes of traffic in each direction. In those cases, the observation period
was divided by the number of lanes, and each lane was observed for the proportional length of time. For
example, a road with three lanes would require that each lane be observed for 15 minutes (three lanes
times 15 minutes each equals 45 minutes, the full observation period).
Observation assignments were made across a schedule of time slots that began at 7:00 a.m. and ended
at 6:15 p.m. They were conducted from June 6 to June 25, 2011 (by design, the observations are
scheduled to be completed before the Fourth of July holiday, as traffic patterns may be significantly
different during that weekend).
Observer training. Observers were trained by Tara Casanova from the Preusser Research Group. They
were trained to observe proper shoulder belt use (vs. improper or no use) of the driver and, if present, a
right front seat passenger (infants were excluded). Observations were made for private passenger
vehicles only. These were the same methods used in Maine in previous years and in numerous other
seatbelt observation efforts. The training involved written material, oral presentation, and field practice.
The field practice was conducted on Forest Avenue in Portland, near the SRC office. The practice
observations were crucial. Results were reviewed and analyzed for accuracy and consistency; no
observers were allowed to begin until their practice observations met training standards.

Safety Belt Use in Maine, 2011
14 Prepared for the Bureau of Highway Safety, Department of Public Safety, State of Maine; by Survey Research Center, Muskie School of Public Service, University of Southern Maine, Portland, Maine September, 2011
OBSERVATION STUDY FINDINGS
Overview: Compliance with the law. The latest use figures show a very slight decline in the proportion
of Maine’s population buckling up, at 81.6% overall. Given that the drop in use was less than one
percentage point, the rate can be considered to be essentially unchanged from last year. While the use of
safety belts has improved considerably from earlier years, most states still have higher use rates. In order
to raise rates relative to other states, it seems likely that Maine will continue to require an on-going effort
of education and enforcement.
Gender differences. The female use rate has been consistently higher than that of males; that pattern
continues in 2011. While 86.5% of all female occupants were restrained; only 77.8% of males were using
their seatbelts. The female use rate was essentially unchanged from 2010 but male use dropped by
almost one percentage point (78.5% in 2010).
Seating position. In 2011, 81.2% of drivers were using seatbelts and 83.1% of passengers were using
theirs. This reverses the pattern of the past two years in which drivers have had a higher rate of belt use
than passengers.
Urban/rural differences. The belt use rate in urban counties (Androscoggin, Cumberland, Kennebec,
Penobscot, and York) remains higher than in rural counties, at 84.8% and 82.7% respectively. The gap
between the two areas has narrowed considerably, however, with a difference of only about 2 percentage
points for the second year in a row. (Note: due to the statistical difficulties of weighting data by ten
different counties, various road types, and traffic volume at all road segments, these data are not
weighted). In a reflection of changing population patterns in the state, 62% of the segments selected were
in the 5 urban counties. Due to the higher traffic volume in those areas, 74% of occupants observed were
in urban counties, and 26% were in the rural counties.
Type of vehicle. There is one clear difference in driver safety belt use rates according to the type of
vehicle the driver is operating. At 70.6%, drivers of pickup trucks have a considerably lower use rate than
any of the other types of vehicles (see Table 7 for use rates of all occupants by vehicle type). It is likely
that the selection of a vehicle and the decision of whether to buckle up or not are both related to gender,
age, lifestyle and other factors, so this may not be a surprising finding; it certainly has been consistent
over the years. With implementation of the primary enforcement law, however, drivers in pickup trucks
had shown strong improvement, going from 68.6% in 2007 to the 74.5% mark in 2009 before dropping
back each of the past 2 years.

Safety Belt Use in Maine, 2011
15 Prepared for the Bureau of Highway Safety, Department of Public Safety, State of Maine; by Survey Research Center, Muskie School of Public Service, University of Southern Maine, Portland, Maine September, 2011
Passenger use related to use by driver. As in all prior studies, buckling up is a friend and family affair.
When drivers use their safety belts, other occupants of the vehicle (who are most likely friends or family of
the driver) are more than two and a half times as likely to use their belts as they are when the driver is not
using a belt 91.8% vs. 34.9%; see Table 8.
Comparison with other states. While Maine’s use rate has improved since 2002, other states have also
improved.7 The net result is that Maine is now in the middle of the range in national standings. As of this
writing, NHTSA has not released 2011 rates, so Table 10 only reports changes in use rates from 2009 to
2010. Although final comparisons between states can not yet be made, the 2010 findings in Table 10
suggest that Maine will likely be near the middle or a little above when the state by state listing for 2011 is
complete.
Day of week. Observations were conducted on all days of the week, and while there are slight variations
in safety belt usage across the days (Table 7), there is no readily apparent pattern to the findings. The
assignment of days and times of observation to the sites was systematic and unbiased, but the number of
observations obtained on each day varied considerably because the traffic volume at the selected sites
varied. Use rates are highest on Saturdays (86.8 %) and lowest on Wednesdays, at 83.0% (NOTE: these
are based on unweighted data).
Time of day. Safety belt use varies throughout the day (Table 7). The highest rates are at 7:45 a.m.
(87.3%), followed by 5:30 p.m. (87.2%) and 10:45 a.m. (85.7%). The lowest rates occur at 10:00 a.m.
(78.2%) and 12:15 p.m., at 80.5%. Time of day rates have also varied from year to year.
Weather and road conditions. Good weather conditions prevailed throughout most of the study period.
As a result, more observations were conducted in sunny and clear weather this year than in most years.
Overall, 67.9% of vehicles were observed in sunny and clear weather and 28.0% while it was cloudy. The
rest were done during rainy weather. There was some variation in use rates; sunny weather had 83.6%
use but cloudy weather saw 85.4% use, while light rain had 87.2%. (see Table 7).
Comparison of 2011 with 2010 and 2009 data. Several studies in Maine have now been conducted for
the Bureau of Highway Safety of the Maine Department of Public Safety. The first was done by Northeast
Research for the School of Public Health of the Boston University Medical School.8 The next four were
conducted by the Muskie School’s Survey Research Center.9 The year 2002 study was completed by
CSI® Santa Rita Research Center.1

Safety Belt Use in Maine, 2011
16 Prepared for the Bureau of Highway Safety, Department of Public Safety, State of Maine; by Survey Research Center, Muskie School of Public Service, University of Southern Maine, Portland, Maine September, 2011
The 2011 study is now the twelfth conducted by the Muskie School. As described in the Methodology
section, there were a number of major changes in the study design that were implemented in 2004. In
addition, over the years other changes have been made, so direct comparisons between years may not
be entirely appropriate.
In 2002, overall compliance stood at approximately 59%. At that time, the rate for people over 18 was
also 59%. Beginning in 2004, only adults were recorded (although it is likely that some mid- to older-teens
were inadvertently included). The rate for 2007 had increased to 80% and to 83% in 2008. In the three
years since, Maine’s use rate has dropped to the current 81.6%.
This year, passengers are again more likely to use their seatbelts than drivers, 83.1% and 81.2%,
respectively. Previous trends had seen a higher use rate for passengers than drivers for several years,
until 2008 when drivers surpassed passengers in use for two years.
A comparison of male drivers to female drivers over the three studies shows that the significant
improvement among males has leveled off. For the year 2009, male drivers had a use rate of 79.4% and
females had a rate of 86.4%. In 2010, the comparable figures were 79.6% for males and 86.2% for
females. The current use rates of 78.2% for males and 86.2% for females demonstrate that the “gender
gap” continues to exist.
SUMMARY
During the early to mid-nineties, seatbelt use in Maine increased substantially. By 1997, however, that
trend had ended. From then through 2002, there was no overall increase and even some declines in
certain areas. The years of increase correspond to a time when a number of changes were made in
seatbelt laws in the state—in 1989, the law was expanded to require all occupants age 4 to 19 to use
restraints. In 1993, fines for violations were increased. And most importantly, in 1995, a statewide
referendum requiring all adults 19 and older to use safety belts was passed. From 1995 through 2006,
there were no major revisions to Maine’s belt laws. With the implementation of the new primary
enforcement law, Maine’s safety belt use rates showed increases in some but not all categories.
It is important to note, however, that this year’s study has again found slight declines in some important
areas. Both overall use and use by males have declined slightly, for instance. The 2011 study was the
fourth to measure the impact of the new primary enforcement law. Future studies may help to establish
whether additional steps are necessary to ensure that Maine’s level of safety in passenger vehicles will
be improved and maintained.

Safety Belt Use in Maine, 2011
17 Prepared for the Bureau of Highway Safety, Department of Public Safety, State of Maine; by Survey Research Center, Muskie School of Public Service, University of Southern Maine, Portland, Maine September, 2011
NEW RURAL SITES
For several years, NHTSA guidelines have allowed states to observe traffic in the counties that,
collectively, make up 85% of the state’s population. This policy is based on the understanding that the
population and traffic volume of the remaining counties are so low that including them would have almost
no effect on the overall rates. In the interest of efficiency, the guidelines take this fact into account.
In Maine, this has meant that Franklin, Lincoln, Piscataquis, Sagadahoc, Waldo, and Washington
counties were not included for observations. In 2009, for the first time, a sample of sites was selected
from these six counties for an independent examination of belt use in rural areas. That examination was
continued in 2010 and 2011. We emphasize that these observations are separate from the official
findings that were covered in the earlier sections of this report; those ten counties continue to make up
the official belt use for the state of Maine.
PRG selected six sites in each of the six counties. The sampling process was designed to provide
observation sites on each of the specified road types. All observations were conducted by the same
Observers, following the same observation methods as for the full 120 sites that make up the official
Maine belt use study. The following pages present key findings from the rural sites study.
Table C
Comparison of seat belt usage rates, statewide and rural
Occupants Observed June 2011,
statewide
June 2011, rural
All Vehicle Occupants 81.6% 78.5
%
All Drivers 81.2% 77.5
%
All Front Passenger Seat Occupants 83.1% 81.7
%

Safety Belt Use in Maine, 2011
18 Prepared for the Bureau of Highway Safety, Department of Public Safety, State of Maine; by Survey Research Center, Muskie School of Public Service, University of Southern Maine, Portland, Maine September, 2011
Table D
Comparison of seat belt usage rates by gender:
Gender June 2011, statewide
June 2011, rural
Male Driver 78.2% 74.0%
Female Driver 86.2% 85.0%
Male Passenger 76.1% 72.6%
Female Passenger 87.0% 85.6%
RURAL OBSERVATION STUDY FINDINGS
Overview: Compliance with the law. Vehicle occupants in rural areas buckle up less frequently than the
statewide average, 78.5% overall, up from 75.8% in 2010. While we present both rural and statewide
figures in the following tables, we wish to point out that some of the rural subgroups (female passengers,
day of the week, etc) have very low numbers of observations and are thus subject to greater ranges of
potential sampling error.
Gender differences. As in the state as a whole, seatbelt use among female vehicle occupants in rural
locations is higher than that of males. While 85.4% of rural female occupants used their seatbelts, only
73.8% of rural male occupants did so. This shows a substantial increase among rural women from 2010,
when 79.9% were using their seatbelts. The usage rate among rural male drivers (74.0%) was nine
percentage points below that of rural female drivers (85.0%). An even greater disparity in usage was
observed between male passengers (72.6%) and female passengers (85.6%) in rural locations.
Seating position. Seatbelt usage of passengers in rural locations was considerably higher than that of
drivers, 81.7% and 77.5%, respectively.
Type of vehicle. As in the statewide study, pickup truck drivers in rural areas have the lowest rates of
seatbelt use; at 62.7% (see Table 18).

Safety Belt Use in Maine, 2011
19 Prepared for the Bureau of Highway Safety, Department of Public Safety, State of Maine; by Survey Research Center, Muskie School of Public Service, University of Southern Maine, Portland, Maine September, 2011
Passenger use related to use by driver. Similar to statewide trends, passengers in rural areas are more
likely to buckle up if drivers do so. A majority of passengers (93.6%) were belted when the driver of their
vehicle was also belted. When the driver was not belted, only 33.7% of passengers buckled up (see
Table 19).
Day of week. Observations of seatbelt use in rural areas were conducted on all days of the week (see
Table 18). Unlike the statewide study, usage rates varied significantly across days of the week, from an
average of 86.1% on Thursdays to an average of 73.8% on Wednesdays. Again, the number of
observations obtained on each day varied considerably due to traffic volume at the selected sites.
Time of day. Safety belt use varied throughout the day in the rural observations (Table 18). The highest
rates were at 9:15 and 10:45 a.m. (87.2% each) and the lowest rates were at 10:00 a.m. (69.8%).
Weather and road conditions. Overall, 73.0% of vehicles in rural areas were observed in sunny and
clear weather and 27.0%% while it was cloudy or raining. Rainy weather saw 81.2% use, sunny weather
had 80.4% use, and cloudy weather was 77.9% use (see Table 18).
Overall, use rates in these rural counties increased nearly 3 percentage points from 2010. The current
rate of 78.5% is more than 3 percentage points below the official state rate.

Safety Belt Use in Maine, 2011
20 Prepared for the Bureau of Highway Safety, Department of Public Safety, State of Maine; by Survey Research Center, Muskie School of Public Service, University of Southern Maine, Portland, Maine September, 2011
MOTORCYCLE HELMET USE
This year marks the third time in as many years that we included observations of motorcycle helmet use.
There was no sampling protocol specific to motorcycle traffic volume; rather, we simply included
observations for all motorcycles seen at the sites that had been selected for the seatbelt use sample. This
resulted in recording the helmet use and non-use of 646 drivers and 113 passengers. Tables E and F
present the key findings.
Table E
Comparison of motorcycle helmet usage rates statewide
Occupants Observed June 2011
All Motorcycle Occupants 54.8% (N=759)
All Drivers 53.9% (N=646)
All Passengers 60.2%
(N=113)
Table F
Comparison of motorcycle helmet usage rates by gender:
Gender June 2011
Male Driver 52.9% (N=612)
Female Driver 69.7% (N=33)
Male Passenger 100.0% (N=3)
Female Passenger 58.7% (N=109)

Safety Belt Use in Maine, 2011
21 Prepared for the Bureau of Highway Safety, Department of Public Safety, State of Maine; by Survey Research Center, Muskie School of Public Service, University of Southern Maine, Portland, Maine September, 2011
ENDNOTES 1 U.S. Department of Transportation, National Highway Traffic Safety Administration, Traffic Safety Facts 2011, Research Note, DOT HS 811 493. 2 Al Leighton and Erika Ziller, Safety Belt Use in Maine 1998, Edmund S. Muskie Institute of Public Affairs, University of Southern Maine, prepared for the Bureau of Highway Safety, Department of Public Safety, State of Maine, April 1999. 3 U.S. Department of Transportation, National Highway Traffic Safety Administration, 2006 Motor Vehicle Occupant Protection Facts, August 2008, DOT HS 810 654. 4 U.S. Department of Transportation, National Highway Traffic Safety Administration, 2006 Motor Vehicle Occupant Protection Facts, August 2008, DOT HS 810 654. 5 U.S. Department of Transportation, National Highway Traffic Safety Administration, Traffic Safety Facts 2011, Research Note, DOT HS 811 493. 6 Al Leighton, Erika Ziller and Suzanne K. Hart, Safety Belt Use in Maine 1995, Edmund S. Muskie Institute of Public Affairs, University of Southern Maine, prepared for the Bureau of Highway Safety, Department of Public Safety, State of Maine, 1995; Suzanne K. Hart, Child Restraint Device and Safety Belt Use in Maine, 1991, Edmund S. Muskie Institute of Public Affairs, University of Southern Maine, prepared for the Bureau of Highway Safety, Department of Public Safety, State of Maine, August 1992; and Deidre Hungerford, David Kovenock, and James Sorg, Maine Seat Belt Use Observation Study, February, 1986: Preliminary Summary, Northeast Research, Orono, Maine, 1986. 7 U.S. Department of Transportation, National Highway Traffic Safety Administration, Traffic Safety Facts 20117, Research Note, DOT HS 811 493. 8 U.S. Department of Transportation, National Highway Traffic Safety Administration, Traffic Safety Facts 2011, Research Note, DOT HS 811 493. 9 Deidre Hungerford, David Kovenock, and James Sorg, Maine Seat Belt Use Observation Study, February, 1986: Preliminary Summary, Northeast Research, Orono, Maine, 1986. 10 Al Leighton, Erika Ziller and Suzanne K. Hart, Safety Belt Use in Maine 1991, 1995, 1997, 1998, Edmund S. Muskie Institute of Public Affairs, University of Southern Maine, prepared for the Bureau of Highway Safety, Department of Public Safety, State of Maine, 1992, 1995, 1997, 1999. 11 Ash Bose, Safety Belt Use in Maine 2002, CSI Santa Rita Research Center, Communication Software, Inc., Arizona, December, 2002.

Safety Belt Use in Maine, 2011
22 Prepared for the Bureau of Highway Safety, Department of Public Safety, State of Maine; by Survey Research Center, Muskie School of Public Service, University of Southern Maine, Portland, Maine September, 2011
List of Tables 2010 Maine Safety Belt Use Observation Study
Table 1: Restraint Use, All Persons
Table 2: All Persons, by Seating Position
Table 3: Restraint Use, Males Table 4: Males, by Seating Position
Table 5: Restraint Use, Females
Table 6: Females, by Seating Position
Table 7: Percentage of Drivers Wearing Safety Belts Under Selected Conditions:
·
·
·
·
Type of vehicle
Day of the week
Weather
Time of observation
Table 8: Passenger Belt Use/Nonuse Compared to Driver Belt Use/Nonuse
Table 9: Restraint Use All Occupants, All Vehicles, by Urban and Rural Counties Table 10: Observed Safety Belt Use Rates Reported to NHTSA by States
Table 11: Locations of Intersections at Which Observations Were Conducted
New Rural Sites Tables
Table 12: Restraint Use, All Persons
Table 13: All Persons, by Seating Position Table 14: Restraint Use, Males
Table 15: Males, by Seating Position
Table 16: Restraint Use, Females
Table 17: Females, by Seating Position Table 18: Percentage of Drivers Wearing Safety Belts Under Selected Conditions:
·
·
·
·
Type of vehicle
Day of the week
Weather
Time of observation
Table 19: Passenger Belt Use/Nonuse Compared to Driver Belt Use/Nonuse Table 20: Locations of Intersections at Which Observations Were Conducted

Safety Belt Use in Maine, 2011
23 Prepared for the Bureau of Highway Safety, Department of Public Safety, State of Maine; by Survey Research Center, Muskie School of Public Service, University of Southern Maine, Portland, Maine September, 2011
TABLE 1
Restraint Use in Passenger Vehicles Statewide
Maine, 2011
All Persons
All Persons
Lap/Shoulder 81.6%
No Restraint 18.4%
No. Vehicles = 16,935; No. Persons = 21,879
TABLE 2
Restraint Use in Passenger Vehicles
Statewide By Seating Position
Maine, 2011
All Persons
Driver Passenger
Lap/Shoulder 81.2% Lap/Shoulder 83.1%
No Restraint 18.8% No Restraint 16.9%
N = 16,935 N = 4,944

Safety Belt Use in Maine, 2011
24 Prepared for the Bureau of Highway Safety, Department of Public Safety, State of Maine; by Survey Research Center, Muskie School of Public Service, University of Southern Maine, Portland, Maine September, 2011
TABLE 3
Restraint Use in Passenger Vehicles Statewide
Maine, 2011
Males
All Males
Lap/Shoulder 77.8%
No Restraint 22.2%
N = 11,755
TABLE 4
Restraint Use in Passenger Vehicles Statewide
By seating position
Maine, 2011
Males
Driver Passenger
Lap/Shoulder 78.2% Lap/Shoulder 76.1%
No Restraint 21.8% No Restraint 23.9%
N = 10,053 N = 1,702

Safety Belt Use in Maine, 2011
25 Prepared for the Bureau of Highway Safety, Department of Public Safety, State of Maine; by Survey Research Center, Muskie School of Public Service, University of Southern Maine, Portland, Maine September, 2011
TABLE 5
Restraint Use in Passenger Vehicles Statewide
Maine, 2011
Females
All Females
Lap/Shoulder 86.5%
No Restraint 13.5%
N = 10,069
TABLE 6
Restraint Use in Passenger Vehicles Statewide
By seating position
Maine, 2011
Females
Driver Passenger
Lap/Shoulder 86.2% Lap/Shoulder 87.0%
No Restraint 13.8% No Restraint 13.0%
N = 6,853 N = 3,216

Safety Belt Use in Maine, 2011
26 Prepared for the Bureau of Highway Safety, Department of Public Safety, State of Maine; by Survey Research Center, Muskie School of Public Service, University of Southern Maine, Portland, Maine September, 2011
TABLE 7
Percentage of Drivers Wearing Safety Belts Under Selected Conditions
Statewide
Maine, 2011
Type of Vehicle
Vehicle Type Belt Use
Car (N =8,475) 85.0%
SUV (N =3,996) 84.1%
Van (N =1,327) 83.5%
Truck (N =3,108) 71.4%
Day of the Week (Note: data in the rest of this table Percent of Drivers are not weighted) Wearing Safety Belts Monday (N = 2,391) 84.2%
Tuesday (N = 2,242) 83.2% Wednesday (N =2,896) 83.0% Thursday (N = 2,543) 84.2% Friday (N = 2,528) 84.5% Saturday (N =2,411) 86.8% Sunday (N = 1,924) 83.7%

Safety Belt Use in Maine, 2011
27 Prepared for the Bureau of Highway Safety, Department of Public Safety, State of Maine; by Survey Research Center, Muskie School of Public Service, University of Southern Maine, Portland, Maine September, 2011
Table 7, cont’d Percent of Drivers Weather10 Wearing Safety Belts
Sunny/Clear (N = 11,501) 83.6%
Raining (N = 689) 87.2%
Cloudy (N = 4,745) 85.4%
Fog (N = 0) --
Wet/Not Raining (N = 0) -- ____________________ 1 Observations of Sunny/Clear and Cloudy imply the roads are dry. Raining corresponds to light rain occurring during the observations (data are not collected in heavy rain) and thus the roads are wet. Start Time of Observation Percent of Drivers Wearing Safety Belts
7:00 a.m. (N = 906) 85.2%
7:45 a.m. (N =1,426) 87.3%
8:30 a.m. (N = 730) 82.1%
9:15 a.m. (N = 787) 85.4%
10:00 a.m. (N = 490) 78.2%
10:45 a.m. (N = 982) 85.7%
11:30 a.m. (N = 1,055) 83.6%
12:15 p.m. (N = 816) 80.5%
1:00 p.m. (N = 1,527) 85.2%
1:45 p.m. (N = 1,470) 82.2%
2:30 p.m. (N = 1,135) 83.1%
3:15 p.m. (N = 1,520) 83.1%
4:00 p.m. (N = 1,414) 83.6%
4:45 p.m. (N = 1,092) 85.2%
5:30 p.m. (N = 1,585) 87.2%

Safety Belt Use in Maine, 2011
28 Prepared for the Bureau of Highway Safety, Department of Public Safety, State of Maine; by Survey Research Center, Muskie School of Public Service, University of Southern Maine, Portland, Maine September, 2011
TABLE 8
Passenger belt use/nonuse compared to Driver belt use/nonuse
NOTE: Data in this table are NOT weighted
Maine, 2011
When the driver IS wearing a belt
Driver Passenger
NOT APPLICABLE Lap/Shoulder 91.8%
No Restraint 8.2%
N = Not Applicable N = 4,305
When the driver is NOT wearing a belt
Driver Passenger
NOT APPLICABLE Lap/Shoulder 34.9%
No Restraint 65.1%
N = Not Applicable N = 639

Safety Belt Use in Maine, 2011
29 Prepared for the Bureau of Highway Safety, Department of Public Safety, State of Maine; by Survey Research Center, Muskie School of Public Service, University of Southern Maine, Portland, Maine September, 2011
TABLE 9
Restraint Use All Occupants, All Vehicles Grouped by Observation Sites in Urban and Rural Counties
NOTE: Data in this table are NOT weighted
Maine, 2011
RESTRAINT TYPE URBAN N %
RURAL N %
STATEWIDE N %
Lap/Shoulder Belt 13,737 84.8 4,652 82.7 18,389 84.3
No Lap/Shoulder Belt 2,463 15.2 972 17.3 3,435 15.7
Lap/Shoulder Belt TOTAL 16,200 100.0 5,624 100.0 21,824 100.0

Safety Belt Use in Maine, 2011
30 Prepared for the Bureau of Highway Safety, Department of Public Safety, State of Maine; by Survey Research Center, Muskie School of Public Service, University of Southern Maine, Portland, Maine September, 2011
TABLE 10 Observed Safety Belt Use Rates Reported by States to NHTSA
2009 and 2010
State 2009 2010
State 2009 2010
Alabama 90% 91% Montana 79% 79% Alaska 86% 87% Nebraska 85% 84% Arizona 81% 82% Nevada 91% 93% Arkansas 74% 78% New Hampshire 69% 72% California 95% 96% New Jersey 93% 94% Colorado 81% 83% New Mexico 90% 90% Connecticut 86% 88% New York 88% 90% Delaware 88% 91% North Carolina 90% 90% District of Columbia 93% 92% North Dakota 82% 75% Florida 85% 87% Ohio 84% 84% Georgia 89% 90% Oklahoma 84% 86% Hawaii 98% 98% Oregon 97% 97% Idaho 79% 78% Pennsylvania 88% 86% Illinois 92% 93% Rhode Island 75% 78% Indiana 93% 92% South Carolina 82% 85% Iowa 93% 93% South Dakota 72% 75% Kansas 77% 82% Tennessee 81% 87% Kentucky 80% 80% Texas 93% 94% Louisiana 75% 76% Utah 86% 89% Maine 83% 82% Vermont 85% 85% Maryland 94% 95% Virginia 82% 81% Massachusetts 74% 74% Washington 96% 98% Michigan 98% 95% West Virginia 87% 82% Minnesota 90% 92% Wisconsin 74% 79% Mississippi 76% 81% Wyoming 68% 79% Missouri 77% 76% Puerto Rico 92% NA
Source: U.S. Department of Transportation, National Highway Traffic Safety Administration, Traffic Safety Facts, July 2011, Research Note DOT HS 811 493. 1 Rates in states with primary belt enforcement laws appear in boldface. Primary Enforcement: Allows police to stop and cite motorists simply for not wearing seat belts. Secondary Enforcement: Motorists must be stopped for another reason in order to receive a seat belt citation.

Safety Belt Use in Maine, 2011
31 Prepared for the Bureau of Highway Safety, Department of Public Safety, State of Maine; by Survey Research Center, Muskie School of Public Service, University of Southern Maine, Portland, Maine September, 2011
TABLE 11
Maine 2010 Observation Sites List
1. Cumberland County (18) 1. Portland (4) 2. Freeport (3) 3. Westbrook (3) 4. South Portland (2) 5. Casco (1) 6. Cumberland (1) 7. Gray (1) 8. Raymond (1) 9. Scarborough (1) 10. Windham (1) 2. York (16) 1. Saco (3) 2. Biddeford (2) 3. Kittery (2) 4. North Berwick (2) 5. Wells (2) 6. Acton (1) 7. Eliot (1) 8. Lyman (1) 9. Sanford (1) 10. Shapleigh (1) 3. Penobscot (15) 1. Bangor (5) 2. Brewer (1) 3. Carmel (1) 4. Hermon (1) 5. Holden (1) 6. Howland (1) 7. Mattawamkeag (1) 8. Millinocket (1) 9. Old Town (1) 10. Orono (1) 11. Plymouth (1)
4. Kennebec (13) 1. Augusta (2) 2. Sidney (2) 3. Waterville (2) 4. China (1) 5. Hallowell (1) 6. Monmouth (1) 7. Oakland (1) 8. Pittston (1) 9. Readfield (1) 10. West Gardiner (1) 5. Androscoggin (12) 1. Auburn (3) 2. Lewiston (3) 3. Sabattus (3) 4. Livermore Falls (1) 5. Poland (1) 6. Turner (1) 6. Aroostook (12) 1. Caribou (3) 2. Ashland (1) 3. Fort Fairfield (1) 4. Hodgdon (1) 5. Limestone (1) 6. Masardis (1) 7. Sherman (1) 8. Van Buren (1) 9. Wade (1) 10. Woodland (1)
7. Hancock (9)
1. Bar Harbor (1) 2. Ellsworth (2) 3. Stonington (2) 4. Bucksport (1) 5. Dedham (1) 6. Deer Isle (1) 7. Township 28 (1) 8. Oxford (9) 1. Fryeburg (3) 2. Greenwood (1) 3. Hebron (1) 4. Norway (1) 5. Rumford (1) 6. Sumner (1) 7. West Paris (1) 9. Somerset (9) 1. Fairfield (2) 2. Anson (1) 3. Caratunk (1) 4. Harmony (1) 5. Madison (1) 6. Norridgewock (1) 7. Pittsfield (1) 8. Starks (1) 10.Knox (7) 1. Rockport (3) 2. Rockland (2) 3. S. Thomaston (1) 4. Thomaston (1)

Safety Belt Use in Maine, 2011
32 Prepared for the Bureau of Highway Safety, Department of Public Safety, State of Maine; by Survey Research Center, Muskie School of Public Service, University of Southern Maine, Portland, Maine September, 2011
TABLE 12
Restraint Use in Passenger Vehicles Rural
Maine, June 2011
All Persons
All Persons
Lap/Shoulder 78.5%
No Restraint 21.5%
No. Vehicles = 3,321; No. Persons = 4,292
TABLE 13
Restraint Use in Passenger Vehicles Rural
By Seating Position
Maine, June 2011
All Persons
Driver Passenger
Lap/Shoulder 77.5% Lap/Shoulder 81.7%
No Restraint 22.5% No Restraint 18.3%
N = 3,317 N = 975

Safety Belt Use in Maine, 2011
33 Prepared for the Bureau of Highway Safety, Department of Public Safety, State of Maine; by Survey Research Center, Muskie School of Public Service, University of Southern Maine, Portland, Maine September, 2011
TABLE 14
Restraint Use in Passenger Vehicles Rural
Maine, June 2011
Males
All Males
Lap/Shoulder 73.8%
No Restraint 26.2%
N = 2,390
TABLE 15
Restraint Use in Passenger Vehicles Rural
By seating position
Maine, June 2011
Males
Driver Passenger
Lap/Shoulder 74.0% Lap/Shoulder 72.6%
No Restraint 26.0% No Restraint 27.4%
N = 2,069 N = 321

Safety Belt Use in Maine, 2011
34 Prepared for the Bureau of Highway Safety, Department of Public Safety, State of Maine; by Survey Research Center, Muskie School of Public Service, University of Southern Maine, Portland, Maine September, 2011
TABLE 16
Restraint Use in Passenger Vehicles Rural
Maine, June 2011
Females
All Females
Lap/Shoulder 85.4%
No Restraint 14.6%
N = 1,902
TABLE 17
Restraint Use in Passenger Vehicles Rural
By Seating Position
Maine, June 2011
Females
Driver Passenger
Lap/Shoulder 85.0% Lap/Shoulder 85.6%
No Restraint 15.0% No Restraint 14.4%
N = 1,248 N = 654

Safety Belt Use in Maine, 2011
35 Prepared for the Bureau of Highway Safety, Department of Public Safety, State of Maine; by Survey Research Center, Muskie School of Public Service, University of Southern Maine, Portland, Maine September, 2011
TABLE 18
Percentage of Drivers Wearing Safety Belts Under Selected Conditions
Rural
Maine, June 2011
Type of Vehicle
Vehicle Type Belt Use
Car (N = 1,583) 80.1%
SUV (N = 719) 82.2%
Van (N = 265) 87.3%
Truck (N = 750) 62.7%
Table 18, cont’d Day of the Week (Note: data in the rest of this table Percent of Drivers are not weighted) Wearing Safety Belts Monday (N = 137) 75.2%
Tuesday (N = 820) 79.2% Wednesday (N = 252) 73.8% Thursday (N = 617) 86.1% Friday (N = 597) 82.4% Saturday (N = 602) 77.4% Sunday (N = 292) 78.1%

Safety Belt Use in Maine, 2011
36 Prepared for the Bureau of Highway Safety, Department of Public Safety, State of Maine; by Survey Research Center, Muskie School of Public Service, University of Southern Maine, Portland, Maine September, 2011
Percent of Drivers Weather11 Wearing Safety Belts
Sunny/Clear (N =2,420 ) 80.4%
Raining (N = 346) 81.2%
Cloudy (N = 551) 77.9%
Fog (N = 0) -
Wet/Not Raining (N = 0) -
____________________ 2 Observations of Sunny/Clear and Cloudy imply the roads are dry. Raining corresponds to light rain occurring during the observations (data are not collected in heavy rain) and thus the roads are wet.

Safety Belt Use in Maine, 2011
37 Prepared for the Bureau of Highway Safety, Department of Public Safety, State of Maine; by Survey Research Center, Muskie School of Public Service, University of Southern Maine, Portland, Maine September, 2011
Table 18, cont’d Start Time of Observation Percent of Drivers Wearing Safety Belts
7:00 a.m. (N = 226) 78.3%
7:45 a.m. (N = 172 79.7%
8:30 a.m. (N = 157) 80.9%
9:15 a.m. (N = 242) 87.2%
10:00 a.m. (N = 53) 69.8%
10:45 a.m. (N = 196) 87.2%
11:30 a.m. (N = 330) 82.7%
12:15 p.m. (N = 88) 75.0%
1:00 p.m. (N = 659) 83.9%
1:45 p.m. (N = 385) 73.8%
2:30 p.m. (N = 178) 83.7%
3:15 p.m. (N = 168) 70.2%
4:00 p.m. (N = 312) 75.3%
4:45 p.m. (N = 117) 79.5%
5:30 p.m. (N = 34) 70.6%

Safety Belt Use in Maine, 2011
38 Prepared for the Bureau of Highway Safety, Department of Public Safety, State of Maine; by Survey Research Center, Muskie School of Public Service, University of Southern Maine, Portland, Maine September, 2011
TABLE 19
Passenger Belt Use/Nonuse Compared to Driver Belt Use/Nonuse
Rural NOTE: Data in this table are NOT weighted
Maine, June 2011
When the driver IS wearing a belt
Driver Passenger
NOT APPLICABLE Lap/Shoulder 93.6%
No Restraint 6.4%
N = Not Applicable N = 809
When the driver is NOT wearing a belt
Driver Passenger
NOT APPLICABLE Lap/Shoulder 33.7%
No Restraint 66.3%
N = Not Applicable N = 166

Safety Belt Use in Maine, 2011
39 Prepared for the Bureau of Highway Safety, Department of Public Safety, State of Maine; by Survey Research Center, Muskie School of Public Service, University of Southern Maine, Portland, Maine September, 2011
TABLE 20 Maine 2010 Observation Sites List
Rural
1.Franklin County (6) 1. Wilton (2) 2. New Vineyard (1) 3. Jay (1) 4. Industry (1) 5. Chesterville (1) 2. Lincoln (6) 1. Wiscasset (1) 2. Boothbay Harbor (1) 3. Damariscotta (1) 4. Jefferson (1) 5. Bristol (1) 6. Waldoboro (1) 3. Piscataquis (6) 1. Milo (2) 2. Monson (1) 3. Greenville (1) 4. Parkman (1) 5. Willimantic (1)
4. Sagadahoc (6) 1. Bowdoinham (1) 2. Richmond (1) 3. Topsham (1) 4. Woolwich (1) 5. Bath (1) 6. Bowdoin (1) 5. Waldo (6) 1. Belfast (2) 2. Frankfort (1) 3. Searsport (1) 4. Liberty (1) 5. Unity (1) 6. Washington (6) 1. Jonesboro (1) 2. Calais (1) 3. East Machias (1) 4. Topsfield (1) 5. Perry (1) 6. Crawford (1)

Safety Belt Use in Maine, 2011
40 Prepared for the Bureau of Highway Safety, Department of Public Safety, State of Maine; by Survey Research Center, Muskie School of Public Service, University of Southern Maine, Portland, Maine September, 2011
History of Occupant Protection Laws
EFFECTIVE DATES LAWS 09-20-07 Primary enforcement law takes effect; ticketing began on April 1, 2008. 01-01-03 The operator is responsible for ensuring that a child (from 40 pounds but less than 80
pounds and less than 8 years of age) is properly secured in a federally approved child restraint system.
09-19-97 The operator is responsible for securing persons under age 18 in a safety belt/seat.
Persons 18 years and older are responsible for securing themselves. 09-19-97 A law enforcement officer may take enforcement action against an operator or passenger
18 years or age or older who fails to wear a seat belt only if the officer detains the operator for a suspected violation of another law. The requirement that the operator must receive a fine for the other violation in order to be subject to a penalty for the seat belt violation has been deleted.
01-01-95 With the implementation of Title 29A, the child safety seat law and seat belt law were
combined into one law. 12-27-95 A statewide referendum requiring adults 19 and older to use safety belts passed on
11-07-95. The law could be enforced only if the police officer had detained the operator of a motor vehicle for a suspected violation of another law.
07-94 Driver made responsible for securing children under 4 years in a child safety seat. 10-13-93 Penalty changed from fine of $25 for first violation and $50 for each subsequent violation
for those aged 0 to 4 to traffic infraction (up to $500 fine). 10-13-93 Penalty changed from fine of $25 for first violation and $200 for each subsequent violation
for those 4 to 19 to traffic infraction (up to $500 fine). 09-29-87 Children aged 4 to 13 years must be secured in a child safety seat or safety belt. 09-30-89 Law expanded to include children 4 to 16 years. 10-09-91 Law expanded to include persons 4 to 19 years. 09-23-83 Children aged 0 to 4 years must be secured in a child safety seat.

Safety Belt Use in Maine, 2011
1 Prepared for the Bureau of Highway Safety, Department of Public Safety, State of Maine; by Survey Research Center, Muskie School of Public Service, University of Southern Maine, Portland, Maine September, 2011
Maine Seat Belt Observation Form
SITE NUMBER:__________ SITE:______________________________________________________ NOTES:________________________________________________________________________________ WEATHER CONDITIONS DATE: _______ - _______ - _______ DAY OF WEEK: _________________ 1 Clear / Sunny 4 Fog 2 Light Rain 5 Clear but Wet 3 Cloudy DIRECTION OF TRAFFIC FLOW (Circle one): N S E W START TIME:_____________ (Observation period will last exactly 45 minutes) DRIVER PASSENGER DRIVER PASSENGER
Veh. #
Vehicle C = car T = truck S = suv V = van
Sex M = male F = female U = unsure
Use + = yes - = no U = unsure
Sex M = male F = female U = unsure
Use + = yes - = no U = unsure
Veh. #
Vehicle C = car T = truck S = suv V = van
Sex M = male F = female U = unsure
Use + = yes - = no U = unsure
Sex M = male F = female U = unsure
Use + = yes - = no U = unsure
1 36
2 37
3 38
4 39
5 40
6 41
7 42
8 43
9 44
10 45
11 46
12 47
13 48
14 49
15 50
16 51
17 52
18 53
19 54
20 55
21 56
22 57
23 58
24 59
25 60
26 61
27 62
28 63
29 64
30 65
31 66
32 67
33 68
34 69
35 70
MAINE SEAT BELT SURVEY FORM 2004 Page:_______ of________

Safety Belt Use in Maine, 2011
2 Prepared for the Bureau of Highway Safety, Department of Public Safety, State of Maine; by Survey Research Center, Muskie School of Public Service, University of Southern Maine, Portland, Maine September, 2011