Embed Size (px)
Citation preview

0
STATE OF MAINE DEPARTMENT OF PUBLIC SAFETY
BUREAU OF HIGHWAY SAFETY
FEDERAL FISCAL YEAR 2012
ANNUAL HIGHWAY SAFETY REPORT
LAUREN V. STEWART
DIRECTOR, BUREAU OF HIGHWAY SAFETY

0
Table of Contents
A Message from the Director……………………………………………………...…1
Introduction…………………………………………………………………………..2
Executive Summary………………………………………………………………….4
Federal Fiscal Year 2012 Initiatives…..……………………………………..4
Federal Fiscal Year 2012 Challenges………………………………………..7
Performance Goals……………………………………………………………….…..8
Occupant Protection…………………….……………………………… ……….…..10
Child Passenger Safety………………………………………………….……..…….14
Teen Drivers….…………………………………………………………….………...24
Impaired Driving……………………………………………………….…………….32
Traffic Records…………………………………………………………..…………...38
Illegal/Unsafe Speed and Aggressive Driving……………………………...………...40
Motorcycle Safety………...………………………………………………...………...42
Paid and Earned Media…………………………………………………..…….….….45
Noteworthy Programs…………………………………………….………..………....52
Legislative Summary…………………………………………………………………58
Fiscal Year Summary………………………………………………………………....59
Appendix A: Motor Vehicle Crash Data……………………...……………..….…….60
Appendix B: Attitudinal and Observational Surveys…………………………………75

1
A Message from the Director The mission of the Department of Public Safety, Bureau of Highway Safety Office is to reduce fatalities, injuries, and economic losses resulting from motor vehicle crashes on Maine roadways. Our efforts are based on the concept that any death or injury is one too many and that traffic crashes are not accidents, but are preventable. I am pleased to submit this Annual Report for Federal Fiscal Year 2012. This report fulfills the Section 402 grant requirements with the National Highway Traffic Safety Administration (NHTSA) and highlights the many achievements and accomplishments of the State Highway Safety Office. I would like to thank the staff of the Highway Safety Office for all of their efforts to improve highway safety and for their assistance in grant application and report development. I would also like to thank our many partners in highway safety: those in federal and state departments as well as municipal and county law enforcement, fire and EMS departments and numerous not-for-profit agencies. We work together to represent the public in addressing our highway safety priorities.
Lauren V. Stewart, Director Maine Bureau of Highway Safety

2
Introduction The Maine Bureau of Highway Safety (MeBHS), established in accordance with the Highway Safety Act of 1966, is the focal point for highway safety in Maine and is the only agency in Maine with the sole responsibility to promote safer roadways. The MeBHS is a Bureau within the Maine Department of Public Safety. MeBHS currently consists of seven full-time employees all dedicated to ensuring safe motor transportation for everyone traveling on Maine roads and highways. MeBHS provides leadership and state and federal financial resources to develop, promote and coordinate programs designed to influence public and private policy, make systemic changes and heighten public awareness of highway safety issues.
The overall goal of the MeBHS is to reduce the rate of motor vehicle crashes in Maine that result in death, injuries, and property damage. Through the administration of federal funding from the National Highway Traffic Safety Administration, the Federal Highway Administration and State Highway funds, MeBHS impacted each of the major NHTSA priority program areas in Federal Fiscal Year 2012:
• Impaired Driving
• Occupant Protection
• Child Passenger Safety
• Traffic Records
• Police Traffic Services Through additional programs developed after extensive state data analysis, we also impacted the areas of motorcycle safety, speed, operating after suspension, and driver distraction. We believe that through committed partnerships with others interested in highway safety, through a data driven approach to program planning, through public information and education, and with coordinated enforcement activities, we can achieve our goal to reduce fatalities and injuries. This Annual Report reflects our efforts to impact traffic safety in areas including occupant protection, impaired driving, child passenger safety, motorcycles, public education and information, and traffic records for Federal Fiscal Year 2012 (October 1, 2011 – September 30, 2012). Maine Bureau of Highway Safety Contact: Lauren V. Stewart, Director Maine Department of Public Safety Bureau of Highway Safety 164 State House Station Augusta, Maine 04333-0164 207-626-3840 [email protected] www.maine.gov/dps/bhs Report Submitted: December 19, 2012

3
Governor: Paul R. LePage Commissioner, Dept. of Public Safety John E. Morris Director, Highway Safety Office Lauren V. Stewart Contract Grant Specialist: Laura Nichols Highway Safety Coordinators: Carl Hallman
Michelle Ward Johannah Oberg
Planning and Research Associate II: Janet Cummings Administrative Assistant: Angela Roberts Accounting Technician: Security and Employment Service Center Law Enforcement Liaison: Robert Annese

4
Executive Summary
Federal Fiscal Year 2012 Initiatives
• Click It or Ticket/Buckle Up. No Excuses! Enforcement and Education
The MeBHS offered Maine law enforcement agencies sub-grant awards to participate in this year’s May and June Click It or Ticket/Buckle Up. No Excuses! Enforcement and Education Campaign. There were 60 law enforcement agencies who participated this year. Over 2,900 seatbelt tickets and warnings were issued during this two week campaign that ran in conjunction with the national crackdown period.
• Teen Driver Awareness Program
The Teen Driver Awareness Program is designed to educate pre-permitted teens, newly permitted teens and their parents in the areas of graduated driver licenses, seat belt usage, impaired driving, distracted driving and parental involvement (in the learning to drive process). During the 2011-2012 school year, 94 facilitators made presentations and used MeBHS’s two driving simulators to instruct approximately 2,300 high school students. The MeBHS was invited to make presentations at various schools, three conferences and a number of employee safety briefings for both State agencies and private companies. An additional 400 adults and parents have been reached through this program to date.
• Intoxilyzer 8000
In January 2012, MeBHS worked closely with the Maine Criminal Justice Academy and the Department of Health and Human Services’ Health and Environmental Testing Laboratory to procure new evidential breath alcohol testing instruments for use in Maine’s Implied Consent program. MeBHS secured the Intoxilyzer 8000 to replace the outdated Intoxilyzer 5000EN. In September, 92 Intoxilyzer 8000s were ordered. These instruments will be calibrated and phased into use in Maine by spring of 2013.
• Child Passenger Safety Inspection Stations and Distribution Sites
The Maine Child Safety Seat Program is unique in that it partners with agencies throughout the state to distribute car seats to families who meet income eligible guidelines, thus providing an important service to local communities. In 2012, a total of 1,429 child safety car seats, including car bed harness and pad kits, were ordered by MeBHS and sent directly to distribution sites around the state.
• Drive Sober or Get Pulled Over Enforcement and Education
In 2012, MeBHS offered a two month High Visibility Impaired Driving Enforcement Campaign. During the campaign, which included the two week national impaired driving crackdown of August 17 to September 3, 2012, 46 law enforcement agencies participated in enforcing Maine’s tough impaired driving laws. Departments conducted dedicated details that resulted in 216 operating under the influence arrests.

5
• Speed Enforcement
The MeBHS conducted an analysis on statewide speed related crashes and their locations, then selected 15 law enforcement agencies from those locations to participate in this second year data driven Speed Enforcement Campaign. The focused speed enforcement operated from May 1 through September 15, 2012. Law enforcement officers wrote 1,232 speed summons during this campaign.
• Seatbelt Convincer Program
An estimated 8,300 people of all ages were provided with safety belt information through a variety of events where MeBHS’s two Seatbelt Convincer units and one Rollover Simulator were on display.
• Maine Driving Dynamics
The state’s defensive driving course, Maine Driving Dynamics, is a five hour defensive driving course that offers drivers the opportunity to improve their defensive driving abilities. Over 2,500 students took the class in 2012, an increase from 2,400 students in 2011.
• Traffic Records Coordinating Committee
The Maine Traffic Records Coordinating Committee plays a major role in ensuring that a statewide traffic safety information system improvement program is successfully completed. As such, the Committee works together to determine deficiencies in existing traffic records systems and recommends and funds enhancement projects that will net the State the most results. These projects include measures to increase the timeliness, accuracy, completeness, uniformity, integration and accessibility of all crash records and data.
• Statewide Observational Survey
The MeBHS contracted with the University of Maine Muskie School of Public Service for the 2012 occupant protection observational seatbelt usage survey, which was conducted immediately following the two week “Click It or Ticket/Buckle Up. No Excuses!” seatbelt enforcement campaign in May and June 2012. In 2012, NHTSA implemented a new standardized method for conducting seatbelt observations in each state. For the first time, the number of traffic fatalities in each county was utilized in the site selection process. In Maine, 12 of the 16 counties were included for observations, representing approximately 90% of all vehicular fatalities in the state. A probability based sampling method was utilized to select the 127 segments to be observed. The 2012 seatbelt usage rate is 84.4%. This year drivers had a higher use rate than passengers.
• Bureau of Motor Vehicles Awareness and Attitudinal Survey
As part of a joint effort to develop traffic safety performance measures for states and federal agencies, a GHSA and NHTSA working group identified a basic set of questions that could be used in periodic surveys that track driver attitudes and awareness concerning impaired driving, seat belt use, speeding, and distracted driving. This report was also used to determine general public awareness of the recently enacted primary belt law. The MeBHS contracted with the University of Maine Muskie School of Public Service to conduct three waves of surveys at eight Maine Bureau of Motor Vehicles offices. Most
6
drivers reported high personal use of seat belts (83 percent “always” and 10 percent “nearly always”), consistent with actual statewide use.
• Holiday High Visibility Impaired Driving Enforcement Forty-seven participating law enforcement agencies, an increase from last year’s forty-two participants, conducted impaired driving enforcement details during MeBHS’s third year High Visibility Holiday OUI Enforcement Campaign that ran from November 4, 2011 through January 2, 2012. There were 222 operating under the influence arrests made during that time period.
• Regional Impaired Driving Enforcement (RIDE) Team
The Regional Impaired Driving Enforcement (RIDE) Team was formed and initiated in April 2012. This pilot program recruited selected volunteers from state, county and municipal agencies within Cumberland County who have demonstrated an expertise in the detection, apprehension and prosecution of impaired drivers. The RIDE Team exists to raise awareness, educate the public and make the roadways of Cumberland County safer for its citizens through the strict enforcement of Maine’s impaired driving statutes. To date, 12 saturation patrols and/or sobriety checkpoints have resulted in contacts with 2,772 operators and 40 impaired driving arrests.
• “No Text Zone” Campaign
MeBHS partnered with Maine’s CBS affiliate station WGME and Renys, a Maine retail chain, in the “No Text Zone” campaign. The campaign urges people to sign a pledge to make their vehicles a no text zone. Over 1,000 people have taken the pledge to date. Stickers that advertise the “No Text Zone” pledge have been received by over 20,000 people since July.

7
Federal Fiscal Year 2012 Challenges
• Young Drivers and Mature Drivers
These two groups continue to account for 32% and 30%, respectively, of Maine’s fatal crashes. Each category has its own challenges; therefore, the MeBHS has championed a Teen Driver Safety Committee and participates in an Older Driver Safety Committee.
• Safe Communities
Developing increased participation at the local grass roots level to increase prevention activities to reduce highway crashes is an ongoing challenge. In 2012 MeBHS sought proposals for a community grant program to begin October 1, 2012. This first year program received a favorable response and small grant awards were made to local communities.
• Traffic Safety Resource Prosecutor
Alcohol and drug impaired driving cases and fatal motor vehicle crashes require additional specialized training. A state level TSRP, which many other states have, would provide that specialized resource to assist prosecutors prepare for trial.
• Unbelted Fatalities
Despite Maine’s primary enforcement law for seat belt compliance, 45% of occupants in fatal motor vehicle crashes in 2011 were unbelted.
Maine has updated its Strategic Highway Safety Plan for 2012. Please see our Plan for more information on challenges and strategies.

8
Performance Goals
In 2009, the NHTSA and the Governor’s Highway Safety Association (GHSA) released a minimum set of performance measures to be used by States and Federal agencies in the development and implementation of behavioral highway safety plans and programs. The minimum set of performance goals contains 14 measures: ten core outcome measures, one core behavior measure and three activity measures. The measures cover the major areas common to State highway safety plans and use existing state data systems. The Core Outcome Measures reported on this year’s Annual Report represent the measures established for Maine for Federal Fiscal Year 2012.
Core Outcome Measures
Traffic Fatalities (FARS) C-1) To decrease traffic fatalities by 5% from the 5 year average of 169.2 for 2006-2010 to 160.74 by December 31, 2015. Serious Traffic Injuries (State Crash Data Files) C-2) To decrease serious traffic injuries 5% from the 5 year average of 868.6 for 2006-2010 to 825.17 by December 31, 2015. Mileage Death Rate (FARS) C-3a) To decrease the mileage death rate 5% from the 5 year average of 1.14 for 2006- 2010 to 1.08 by December 31, 2015. Rural Mileage Death Rate C-3b) To decrease the rural mileage death rate 5% from the 5 year average of 1.33 for 2006-2010 to 1.26 by December 31, 2015. Urban Mileage Death Rate C-3c) To decrease the urban mileage death rate 5% from the 5 year average of .60 for 2006-2010 to .57 by December 31, 2015. Unrestrained Passenger Vehicle Occupant Fatalities (FARS) C-4) To decrease unrestrained passenger vehicle occupant fatalities by 5% from the 5 year average of 55.4 for 2006-2010 to 52.6 by December 31, 2015. Alcohol Impaired Driving Fatalities (FARS) C-5) To decrease alcohol impaired driving fatalities by 5% from the 5 year average for 2006-2010 of 45.6 to 43.3 by December 31, 2015. Speeding Related Fatalities (FARS) C-6) To decrease speeding related fatalities by 5% from the 5 year average of 68.8 for 2006-2010 to 65.4 by December 31, 2015.

9
Motorcyclist Fatalities (FARS) C-7) To decrease motorcyclist fatalities by 5% from the 5 year average of 21 for 2006-2010 to 20 by December 31, 2015. Unhelmeted Motorcyclist Fatalities (FARS) C-8) To decrease unhelmeted motorcyclist fatalities by 5% from the 5 year average of 14.6 for 2006-2010 to 13.9 by December 31, 2015. Drivers Age 20 or Younger Involved in Fatal Crashes (FARS) C-9) To decrease drivers age 20 or younger involved in fatal crashes by 5% from the 5 year average of 22.2 for 2006-2010 to 21.1 by December 31, 2015. Pedestrian Fatalities (FARS) C-10) To reduce pedestrian fatalities by 10% from the 5 year average of 11 for 2006-2010 to 10.5 by December 31, 2015. Behavior Measure Seat Belt Usage Rate (Observed Seat Belt Use Survey) B-1) To increase statewide seat belt compliance by 2% from the 2010 survey results from 82.0% to 83.6% by December 31, 2015. Activity Measures A-1) To monitor seat belt citations issued during grant-funded enforcement activities. A-2) To monitor impaired driving arrests made during grant-funded enforcement activities. A-3) To monitor speeding citations issued during grant-funded enforcement activities.

10
Occupant Protection
Problem In 2008, Maine’s seatbelt usage rate peaked at 83%. In the years following there was a gradual decline in the observed use of seat belts. However, in 2012 the seatbelt usage rate increased to the highest rate on record. The 2012 seatbelt usage rate stands at 84.4%. This is slightly below the national average of 86%.
Objective The overall goal of Maine’s Occupant Protection Program is to increase safety belt use for all occupants, thereby decreasing deaths and injuries resulting from unrestrained motor vehicle crashes. In 2011, there were 136 fatalities involving passenger vehicles. Forty occupants were unrestrained, representing nearly 45% of fatalities involving passenger vehicles. This is a decrease of over 10% from 2008, when the number of fatalities involving passenger vehicles was 108.
Figure 1. Seatbelt Usage Data
Source: Maine DOT and FARS
Goals
These goals were established for FFY 2012 in the FFY 2012 Highway Safety Plan: To increase statewide seat belt compliance by 2% from the 2010 survey results from 82.0% to 83.6% by December 31, 2015. Progress In 2012, the seatbelt usage rate is 84.4%. To decrease unrestrained passenger vehicle occupant fatalities by 5% from the 5 year average of 55.4 for 2006-2010 to 52.6 by December 31, 2015.
Progress The five year average from 2007-2011 for unrestrained passenger vehicle occupant fatalities is 50.4%.
11
Strategies Click It or Ticket/Buckle Up, No Excuses! High Visibility Seatbelt Enforcement Campaign
The annual “Buckle Up. No Excuses!” seat belt education and enforcement campaign ran in conjunction with the national enforcement period from May 21 to June 3. This year, 60 law enforcement agencies participated, compared to 75 agencies that participated last year. The participating agencies were comprised of 54 police departments, 5 county sheriff offices, and 7 troops from the Maine State Police. This year MeBHS again offered an incentive to participating agencies who qualified. The incentive was the Power Flare PF200 Safety Lights (an 8-pack) to use at motor vehicle crash scenes. In order to qualify, agencies were required to run half their details at night, have at least 40 hours of overtime, submit the paperwork before July 7 and provide accurate paperwork. There were 44 agencies, or 73%, who qualified for the incentive. During the enforcement period, 7,302 vehicles were stopped during 3,141 hours of overtime enforcement details. There were 2,289 vehicles stopped and 1,095 seat belt summons issued at night. The stops per hour were 2.3. The amount of federal funds expended was $125,534.92. 2,900 seat belt summons were issued, compared to 3,270 summonses issued last year during the campaign. Additional charges included: 12 operating under the influence of alcohol/drug, 39 drug arrests, 44 warrant of arrest, and 104 operating after suspensions.
Statewide Observational and Attitudinal Surveys
The Survey Research Center (SRC) at the Muskie School of Public Service, University of Southern Maine, with assistance from the Preusser Research Group of Trumbull, Connecticut, conducted the 2012 Maine Observational and Attitudinal Surveys. The Muskie School has conducted these surveys for the MeBHS since 1986. In 2012, NHTSA began implementing a new standardized method for conducting seatbelt observations in each state. For the first time, the number of traffic fatalities in each county was utilized in the site selection process. Whereas in previous years, the counties in which observations took place were chosen to represent at least 85% of the state’s population, the new guidelines are designed to choose the counties that represent at least 85% of the vehicular fatalities in the state. In Maine, 12 of 16 counties were included for observations, representing approximately 90% of all vehicular fatalities in the state. A probability based sampling method was utilized to select the 127 segments to be observed. Among the locations chosen were sites on I-95, I-295, and the Maine Turnpike. As a result, all types of roads and traffic were observed. As in all prior studies, visual observations were made to determine the extent of use.
12
These new procedures were developed to ensure comparability among findings from state to state. The new estimation formulae are intended to provide each state with very precise estimates of their statewide belt use rates. These formulae provide a statistically sound method to calculate weights that will help adjust sample data to better reflect the volume and types of traffic found in all roads in a state, not just those selected for observation. Maine’s sampling procedures are now based primarily on the number of vehicular fatalities in each county, and on traffic data known as the Daily Vehicle Miles Traveled (DVMT) for each county in the State. DVMT data provide a measure of the volume of traffic at each road segment in Maine. One of the results of adopting new estimation methods is that the findings from 2012 are not entirely comparable to those from previous years. Different methods can produce different results, which is why NHTSA has adopted the new standardized methods. The Muskie School supports the use of the new estimation approach and NHTSA’s efforts to bring consistency and uniformity to all of the states but point out that because of these changes, results from this year’s study are not quite equivalent to those conducted in previous years. This year’s survey was conducted in June 2012 immediately after the “Click It or Ticket/Buckle Up. No Excuses!” campaign. This survey showed an overall voluntary seat belt usage rate increase to 84.4%, up from 81.6% in 2011. While Maine’s safety belt use has improved considerably over the years, other states have increased their use as well. As a result, the state remained near the bottom nationally until recent years. In 1995, Maine’s rate of 50% was the fifth from the bottom of a list of all 50 states, the District of Colombia, and Puerto Rico. By 2011, there still were only 11 reporting lower use rates than Maine. Maine’s use rate in 2012 is now equal to the 2011 national average. This marks the first time that Maine’s statewide use rate has matched the previous year’s national rate. The nationwide seatbelt use rate for 2012 is 86%. Nighttime Belt Use Survey Research using NHTSA’S Fatality Analysis Reporting System (FARS) indicates that seat belt use among fatally injured front seat occupants of passenger vehicles declines nationally across the hours of night. Belt use is uniformly highest during daytime hours (5 a.m. – 2:59 p.m.), declines steadily from 3 p.m. to late evening, and is at its lowest from midnight to 4:59 a.m. In 2008, daytime and nighttime belt use was measured at 40 “mini-survey” sites. In three time periods (before primary law enforcement began; immediately after primary enforcement began; and immediately after normal Click It or Ticket enforcement), belt use rose consistently, day and night. The current study continues the previous methodology to examine nighttime belt use in 2012, approximately four years after Maine’s primary law took effect with enforcement. This study is one of a number of coordinated seat belt use measurements being undertaken by the State. Night belt use in 2012 was more than 8 percentage points higher than during the comparable time periods in 2008 – 2011, a statistically significant increase. This is contrasted with the relatively stable belt use values from 2008 through 2011.
Attitudinal Survey One of the key features of a primary belt law is that the general public is aware of the law and perceives a high probability of being stopped and ticketed for not being restrained. Chaudhary et al. (2010) conducted three waves of surveys of drivers at Maine Bureau of Motor Vehicles (BMV) offices. They showed that the public was aware of the main feature of the primary belt law, i.e., that they can be stopped and ticketed simply for not

13
wearing their seat belts. Knowledge remained high in June 2009, 2010, and 2011 (Leaf and Chaudhary, 2009; Leaf and Chaudhary, 2010; Leaf and Chaudhary, 2011). In 2012, the same methodology was used to examine the evolution of driver knowledge and attitudes a year after they were last assessed, 50 months after Maine’s primary belt law began to be enforced. The survey used in this iteration, as the ones in 2010 and 2011, was modified to extend driver knowledge measurement to the topics of drinking and driving, speeding, and cell phone use. Most drivers reported high personal use of seat belts (83 percent “always” and 10 percent “nearly always”), consistent with actual statewide use. Awareness of MeBHS media messaging increased slightly in 2012. Copies of the observational, night time, and attitudinal survey reports are included with this Annual Report. Convincer & Rollover Education Program
The MeBHS funds a highly successful seat belt education program through Atlantic Partners, EMS, formerly known as the Mid-Coast EMS Council, Inc., using the Convincer and the Rollover simulators and a highway safety display. In 2012, this program was made available at venues including: elementary, middle and high schools, colleges, health and safety fairs, corporate and military events, community festivals and fairs, conferences, and driver education classes. An estimated 8,300 people were given safety belt information through the variety of activities.
Future Strategies Continue to provide grant funding to Maine law enforcement agencies to participate in the May “Click It Or Ticket” national safety belt high visibility enforcement crackdown periods. Grant funding will be provided for dedicated overtime safety belt enforcement details and public education. In conjunction with the University of Southern Maine’s Muskie School of Public Service, conduct observational and attitudinal surveys to determine safety belt use in Maine.
Funding Source Federal Section 402 and 405 funds

14
Child Passenger Safety
Problem Safe Kids Worldwide released a study observing the misuse of 3,442 child restraint systems in six states, with approximately 73 percent of restraint systems showed at least one critical misuse. 84 percent of child restraint systems showed critical misuses. Booster seat misuse was 41 percent. The most common form of misuses for all restraint systems included loose vehicle seat belt attachment to the restraint system and loose harness straps securing the child to the restraint system.
Objective The Maine Child Passenger Safety (CPS) Program provides leadership and coordination of CPS activities throughout the State. The Program provides leadership for all aspects of the state’s CPS Program and activities sufficient in number and quality to serve Maine’s children and families effectively and efficiently.
Goals Reduce the percentage of child passenger safety seat misuse Educate the public on the importance of proper child passenger safety restraint use.
Strategies Maine Child Passenger Safety Law Maine’s Child Passenger Safety (CPS) law is one of the strongest in the country. The law requires:
• Children who weigh less than 40 lbs. ride in a child safety seat;
• Children who weigh at least 40 lbs., but less than 80 lbs. and are less than 8 years old, ride in a federally approved child restraint system;
• Children who are more than 8 years old and less than 18 years old and more than 4 feet 9 inches in height be properly secured in a safety belt and;
• Children under 12 years old and who weigh less than 100 lbs. be properly secured in the back seat of the vehicle, if possible.

15
Maine Distribution Site Program The Maine Child Safety Seat Program is unique in that it partners with agencies throughout the state to distribute car seats to families who need them, thus providing an important service to local communities. The program provides an average of 1,500 child safety seats annually. Currently the MeBHS program consists of approximately 35 distribution sites located throughout the state. Each site distributes child safety car seats to eligible families in that community or area. Distribution sites are required to employ a certified CPS Technician. Maine Inspection Site Program Currently there are approximately 25 inspection sites located throughout Maine. These sites provide parents with education about keeping their child safe when riding in the car by correctly using a child safety seat or safety belt. One-on-one lessons are offered by a certified CPS Technician explaining the correct use and installation of car safety seats and safety belts. A reported 250 child restraints have been checked statewide this past year, and it is anticipated that the number of seats checked will significantly increase in the next year due to tightened reporting guidelines instituted late this year.
Child Safety Car Seat Purchases This year’s child safety seat grant covered costs associated with providing child safety car seats to approximately 35 distribution sites located throughout Maine. The child safety car seat orders were placed monthly by the sites. During the time period of October 1, 2011 through September 30, 2012, a total of 1,429 child safety car seats, including car bed harness and pad kits, were ordered by MeBHS and sent directly to distribution sites The cost of purchasing car seats and supplies was approximately $97,000.00 in federal funds. The type of child safety car seats provided consisted of: Cosco Scenera, Graco Turbo Booster, Graco Turbo Booster Backless, Evenflo Titan Factory Elite, Evenflo Tribute Factory Select, Evenflo Tribute 5, Evenflo Kid No Back Booster, Evenflo Generations 65, Evenflo SecureKid 200,Graco SnugRide-Commercial, Graco Nautilus, Cosco Pronto, Combi Navette, Evenflo Generations, Angel Ride pad and harness kits. Car seat levelers (noodles) were also available for technicians. Child Passenger Safety Coordinator The Maine Child Passenger Safety (CPS) Coordinator provided leadership and coordination of CPS activities throughout the state to better serve Maine’s children and families effectively and efficiently. Activities of the CPS Coordinator for this grant period include some, but not all, of the following:
• Coordinated the Statewide Child Passenger Safety Program
• Developed comprehensive performance standards for child passenger safety instructors and technicians
• Conducted site visits to meet technicians/instructors, review forms and procedure and discuss any questions, needs or concerns

16
• Developed formal site agreements (i.e., distribution site and inspection station)
• Updated/changed forms as needed for CPS activities
• Updated and added to CPS Manual
• Developed and finalized a Technician Mentoring Program
• Developed and piloted a CPS Booster Seat Curriculum
• Ongoing CPS conference planning
• Developed an agenda and held a CPS Annual Meeting for all available technicians/instructors to offer updates and CEU
• Held 5 CPS Certification Courses and 1 Course Renewal Class
• Held 6 CEU training opportunities across Maine in the north, east, south, and western geographic regions
• Held Roving Seat Check Events across Maine in north, east, south, and western regions
• Supported technicians financially to provide CPS education at the community level in local health fairs and extra events
• Provided a roving instructor to assist technicians with seat sign-offs before expiring
• Finalized CPS car seat tracking database with IT to be developed for use by all distribution locations to track recipient information
• Drafted and mailed thank you letters to all host locations that offered training and seat check opportunities around the State
• Drafted and mailed thank you letters to all distribution and inspection locations around the State for their involvement educating the public
• In ongoing discussion with certain facilities concerning their becoming distribution sites
• Attended Lifesavers Conference 2012 to obtain the necessary training and knowledge related to the CPS Coordinator position
• Manage statewide Child Passenger Safety Program resources
• Ensured new CPS information and updates were shared as appropriate Child Passenger Safety Technician Certification Classes Five NHTSA National Standardized Child Passenger Safety Technician Certification Classes were held during this grant period. A total of 57 students attended and 56 passed this intense training. One NHTSA National Standardized Child Passenger Technician Course Renewal Class was held this grant period. A total of 7 students attended and passed this intense renewal option. There were different course formats offering the NHTSA National Standardized Child Passenger Safety Technician training course. All trainings met the 32 hour requirements and included lectures, discussions, role playing and hands-on practice with a wide variety of child safety seats and vehicle seat belt systems. It is designed to teach through learning, practicing, and explaining the technical skills to serve as a child passenger safety resource for one’s organization, community and state.
Successful completion of this training provides an individual with national certification as a Child Passenger Safety Technician for two years. Students must pass both written and open book quizzes and hands-on skills testing. An additional requirement for successful completion is active participation in a car seat check up event on the final day of training.

17
CPS Annual Meeting The State Coordinator emailed an agenda to the CPS Community for an informational and technical technician meeting. The meeting included CPS instructors as guest speakers. CPS Technical Update Class Six CPS Technical Update Classes were held across Maine throughout the year. Monthly Car Seat Fittings Besides the inspection stations, there were 5 car seat check events across the Maine available to the public on set schedules. Child Passenger Safety National Conference The Maine CPS Training Coordinator attended the Lifesaver’s Conference in Orlando, Florida in June and the North Carolina CPS Conference in March. Conference attendance was to focus on child passenger safety issues. CPS Training Trailer and Supplies The MeBHS CPS training trailer has been reorganized. The Bureau purchased 3 car topper tents for use during outside car seat check events. The Bureau also purchased 4 dial-a-belt training seats and an additional Stand up Sophia for use teaching the Booster Curriculum to 1st and 2nd grade classrooms around the State of Maine. Supplies will also be used for other activities, as needed.
Future Strategies Develop a car bed loaner program with State of Maine hospitals. Promote a dedicated outreach program to educate Maine minority populations regarding the benefits of using safety belts and child restraints. This project may include production of print materials and paid media. Increase education to parents regarding child occupant protection/passenger safety for the age group of 8-12. Decrease the reliance on federal funds to fully support the Maine CPS program.
Funding Source
Federal Section 2011, 402, and 405 funds

18
19

20

21

22

23
24
Teen Drivers
Problems
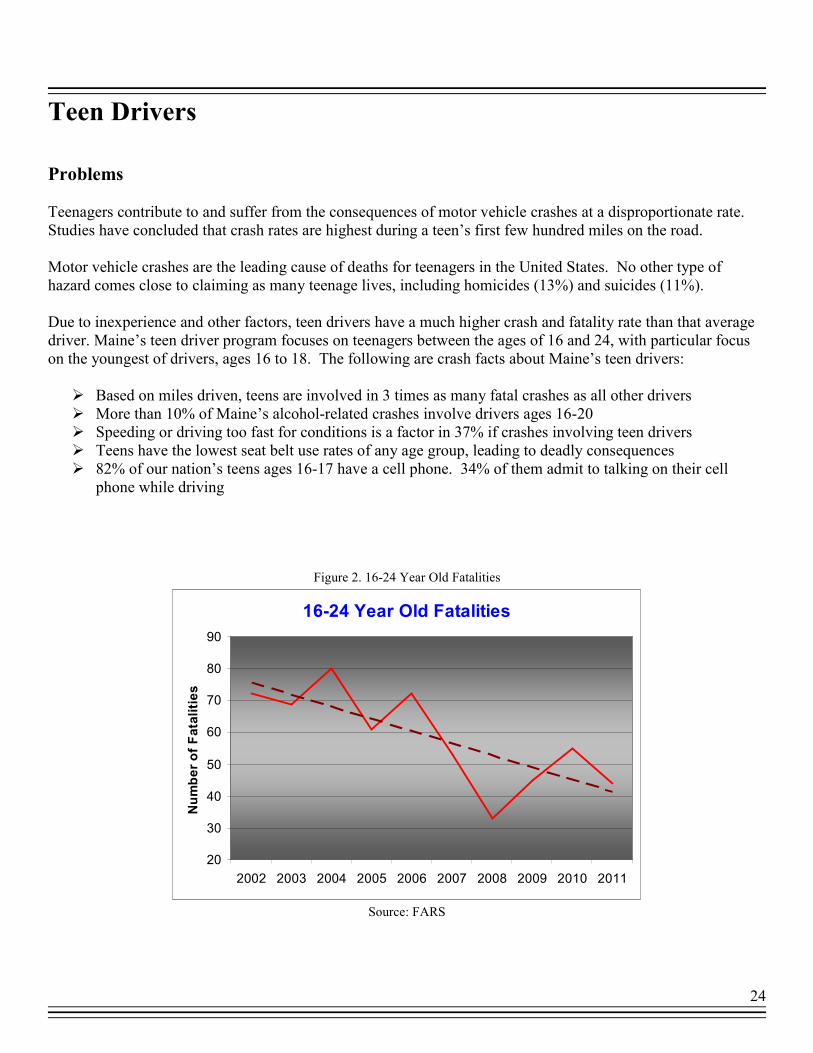
Teenagers contribute to and suffer from the consequences of motor vehicle crashes at a disproportionate rate. Studies have concluded that crash rates are highest during a teen’s first few hundred miles on the road. Motor vehicle crashes are the leading cause of deaths for teenagers in the United States. No other type of hazard comes close to claiming as many teenage lives, including homicides (13%) and suicides (11%). Due to inexperience and other factors, teen drivers have a much higher crash and fatality rate than that average driver. Maine’s teen driver program focuses on teenagers between the ages of 16 and 24, with particular focus on the youngest of drivers, ages 16 to 18. The following are crash facts about Maine’s teen drivers:
� Based on miles driven, teens are involved in 3 times as many fatal crashes as all other drivers � More than 10% of Maine’s alcohol-related crashes involve drivers ages 16-20 � Speeding or driving too fast for conditions is a factor in 37% if crashes involving teen drivers � Teens have the lowest seat belt use rates of any age group, leading to deadly consequences � 82% of our nation’s teens ages 16-17 have a cell phone. 34% of them admit to talking on their cell
phone while driving
Figure 2. 16-24 Year Old Fatalities
16-24 Year Old Fatalities
20
30
40
50
60
70
80
90
2002 2003 2004 2005 2006 2007 2008 2009 2010 2011
Number of Fatalities
Source: FARS
25
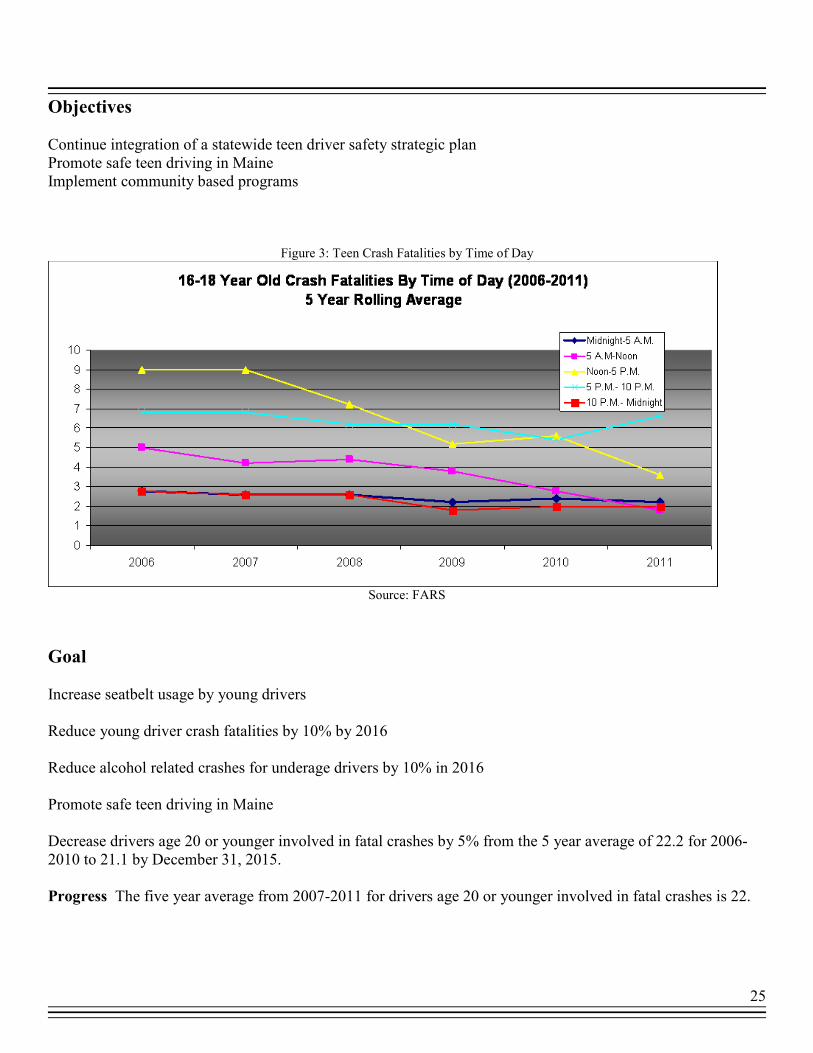
Objectives Continue integration of a statewide teen driver safety strategic plan Promote safe teen driving in Maine Implement community based programs
Figure 3: Teen Crash Fatalities by Time of Day
Source: FARS
Goal Increase seatbelt usage by young drivers Reduce young driver crash fatalities by 10% by 2016 Reduce alcohol related crashes for underage drivers by 10% in 2016 Promote safe teen driving in Maine
Decrease drivers age 20 or younger involved in fatal crashes by 5% from the 5 year average of 22.2 for 2006-2010 to 21.1 by December 31, 2015. Progress The five year average from 2007-2011 for drivers age 20 or younger involved in fatal crashes is 22.

26
Figure 4. Maine 16-20 Year Old Driver Fatal Crash Data
2003 2004 2005 2006 2007 2008 2009 2010 2011
Total Number of Fatalities - All Ages 207 194 169 188 183 155 159 161 136
Total Number of Crashes - All Ages 186 178 151 168 170 144 153 144 125
Total Number of 16-20 Year Old Drivers 33 39 34 37 26 18 20 24 22
Total Number of Deceased 16-20 Year Olds 21 36 27 32 28 15 17 22 17
Total Number of Deceased 16-20 Year Old Drivers 13 21 16 23 13 12 11 16 14
Number of Fatal Crashes involving 16-20 YO Drivers 33 39 34 37 26 17 15 24 22
Number of Deaths caused by 16-20 YO Drivers 39 50 41 47 28 18 16 27 19
Number of Deceased Drivers (16-20) with a Positive BAC 3 7 5 8 5 4 3 4 3
Number of Deceased Drivers (16-20) Using a Seat Belt 3 5 6 4 4 8 5 6 12
Contributing causation factors with teen drivers are as follows:
16 of the 22 crashes were speed related
2 of the 22 crashes involved distracted driving
Operating vehicle in erratic, reckless or negligent manner
Operator inexperience
Passing where prohibited by posted signs
Failure to obey actual traffic signs and or traffic control devices
Source: FARS
Strategies Bureau of Motor Vehicles’ Parents/Teen Driving Guidebook Project In 2010, MeBHS provided grant funding to the Bureau of Motor Vehicles to create a Parent/Teen Driving guide entitled “Safe Driving-A Parent’s Guide to Teach Teens”. As the State of Maine has had a parental involvement component as part of the basic driver education for a number of years and was one of the first states to implement such a requirement, the goal of this project was to provide parents with a tool that would assist them in working with their young driver prior to the licensing process. The guide book, which is provided by the driving instructors at the end of the course, offers tips for parents on how to approach their young driver and make the learning process positive. The guide book provides driving lesson guides, with a progress checklist, that can be reviewed by the parent and young driver. It also provides talking points surrounding road responsibility and driving under the influence. In addition, there is a section allocated to the Graduated Driver License (GDL) system. The guide book was well received by the driving instructors and parents. In 2012, new legislation was enacted regarding the Graduated Drivers License law to encourage safer teen driving. As the new legislation strengthened the original GDL, revisions had to be made to the Parent/Teen Driving guide book to include the various GDL law changes.

27
Teen Driver Safety Committee The Maine Teen Driver Safety Committee (TDSC) was convened in 2008 at the request of the MeBHS Director. The TDSC is comprised of individuals representing Maine state agencies including the Department of Public Safety, MeBHS, Department of Transportation, Department of Health and Human Services, Bureau of Motor Vehicles, and organizations such as AAA Northern New England. As part of its work, the TDSC developed a teen driver safety strategic plan. The plan contains sample activities for each identified strategy and is intended to be one component of a comprehensive community-based effort to address teen driver safety issues. In order to enhance the opportunity for success, the TDSC will serve as a partner, providing technical assistance and attending the recently formed Underage Drinking Task Force monthly meetings, facilitated through the Office of Substance Abuse. As stated in the past Annual Reports, the TDSC has developed a teen driver safety work plan (indicated below) to be integrated and utilized by agencies at the local, county, or state level interested in addressing teen driver issues. Teen Driving Goal, Objectives and Strategies The Maine Teen Driver Safety Committee has developed a teen driver safety work plan to be integrated and utilized by agencies at the local, county, or state level interested in addressing teen driver issues. This Committee developed a sample of activities for the strategies provided below. These activities, although they can be implemented at the local, county or state level, are intended to be a guide in the development of a community based effort. In order to encourage and enhance the opportunity for success, the Committee feels strongly that this works needs to be implemented by community partners and stakeholders, with technical assistance provided by the Committee as requested. Goal: Promote safe teen driving in Maine Target Audience: 16-18 year old drivers Objective 1: Integrate a variety of partners and stakeholders to participate in the Teen Driver Safety Committee (TDSC) activities: Strategy 1.1: Recruit partners and stakeholders to implement the TDSC work plan Activity: Create fact sheet describing the work of the TDSC Activity: Create and maintain a partner and stakeholder distribution list Strategy 1.2: Provide partners and stakeholders the most current research and evidence based teen driver safety focused programs

28
Activity: Develop a directory of the most current research and evidence based teen driver safety information and programs Activity: Collect and distribute related crash data involving teens Strategy 1.3: Create a Maine focused teen driving safety awareness toolkit for use and distribution at the local and state levels Activity: Research other states for already developed toolkits Strategy 1.4: Create an evaluation plan for the use of the TDS Awareness toolkit Objective 2: Increase parental involvement in developing a safe teen driver: Strategy 2.1: Provide parent focused education regarding teen driver issues Topics: Current Graduated Driver License (GDL) and state laws Modeling good driving habits Setting rules and consequences for actions Monitoring teen driver behaviors Activities: Brainstorm various venues to promote parental education Create parent-based website to include information listed above Create fact sheets on the issues identified above Objective 3: Decrease teen driving related crashes, injuries and fatalities due to alcohol and other drugs: Strategy 3.1: Develop outreach and education for current and future drivers on the laws and risk pertaining to driving while under the influence of alcohol and drugs Strategy 3.2: Develop outreach and education venues for family members and other influencers on the laws pertaining to driving while under the influence of alcohol and drugs Strategy 3.3: Support an increase in law enforcement efforts Strategy 3.4: Collaborate with court systems working with DUI and juveniles Objective 4: Decrease teen driving related crashes, injuries and fatalities due to unsafe speed: Strategy 4.1: Develop outreach and education for current and future drivers on the laws and risks pertaining to speeding Strategy 4.2: Develop outreach and education venues for family members and other influencers on the laws and risk pertaining to speeding Strategy 4.3: Support an increase in law enforcement efforts

29
Objective 5: Decrease teen driving related crashes, injuries and fatalities due to lack of seatbelt use: Strategy 5.1: Develop outreach and education for current and future drivers on the laws and risks pertaining to driving unbelted Strategy 5.2: Develop outreach and education venues for family members and other influencers on the laws and risk pertaining to driving unbelted Strategy 5.3: Support an increase in law enforcement efforts Objective 6: Decrease teen driving related crashes, injuries and fatalities due distractions: Strategy 6.1: Develop outreach and education for current and future drivers on the laws and risks pertaining to distracted driving Strategy 6.2: Develop outreach and education venues for family members and other influencers on the laws and risk pertaining to distracted driving Strategy 6.3: Support an increase in law enforcement efforts Objective 7: Decrease teen driving related crashes, injuries and fatalities due to late night driving: Strategy 7.1: Develop outreach and education for current and future drivers on the laws and risks pertaining to late night driving Strategy 7.2: Develop outreach and education venues for family members and other influencers on the laws and risk pertaining to late night driving Strategy 7.3: Support an increase in law enforcement efforts The following activities took place in 2012 related to the Maine Teen Driver Safety Committee Strategic work plan:
� A list of driver safety resources and links has been compiled and included on the Maine Transportation Safety Coalition (MTSC) website
� National Youth Traffic Safety Event was held at the Auburn Mall in Auburn on May 11, 2012. Participants included: Bureau of Highway Safety, State Farm Insurance, Bureau of Motor Vehicles, officers from the Auburn and Lewiston Police Departments, AAA and Kendra Smith, representing Justice4Jefff.org and Savespeed4thetrack.org. Over 30 teens took part in the driving simulator exercises. Emma Libby, a 14 year old stock car racer from the Bangor area, attended the event. Emma promotes safe driving on the roads and keeping speed on the track. MeBHS provided promotional teen safety items when speaking with teen drivers and parents. Roy’s Driving School of Auburn provided golf carts and driving instructors to demonstrate and discuss the dangers of drunk driving and distracted driving.
� County and statewide driving related survey data completed by teens provided by Maine Youth Drug and Alcohol Use Survey (MYDAUS) was distributed upon request.

30
� The 2011 Northeast Transportation Safety conference: “Toward Zero Deaths, Building on Success” was held on November 8-9 in Freeport. Over 100 individuals attended from as far away as Ohio. Topics included: Teen Texting While Driving Initiative in Cumberland County-presented by Alex Hughes, City of Portland and Teen Driving Issues presented by Officer Rocco Navarro of South Portland Police Department and Officer Owen Davis of York Police Department.
Teen Driver Awareness Program The Teen Driver Awareness Program (TDAP) has been up and running since August 2011. The TDAP was launched utilizing grant funding from the Ford Motor Corporation and the Governors Highway Safety Association. The TDAP was developed in conjunction with AAA of Northern New England and is designed to educate pre-permitted teens, newly permitted teens and their parents in the areas of Graduated Driver Licenses, Seat Belt Usage, Impaired Driving, Distracted Driving and Parental Involvement (in the learning to drive process). MeBHS also includes an additional training section on Underage Drinking and Enforcement of Underage Drinking Laws for the facilitators. In 2011, the MeBHS purchased two driving simulators through a grant received from Ford Motor Corporation and the Governors Highway Safety Association. These simulators contain the software “One Simple Decision”, which is specific to the teen driving issues of impaired and distracted driving. The simulators are used to augment the lessons taught in classrooms and at presentations around the state. The MeBHS, along with AAA of Northern New England and the Maine Office of Substance Abuse, has presented six workshops around the State to train law enforcement officers on presentation of the TDAP and use of the two driving simulators. Currently, 94 officers and school resource officers are facilitators in the TDAP. The following agencies have utilized the TDAP and the Simulators during the past school year: Bath PD (3 times) Kennebunk PD Lewiston PD (3 times) Cumberland PD Lisbon PD (3 times) Paris PD (2 times) Portland PD (2 times) Norway PD Saco PD Lincoln SO Gorham PD (3 times) Waldoboro PD (2 times) Sabattus PD (2 times) Maine State Police (3 times) These facilitators have made presentations and used the simulators to instruct approximately 2,300 high school students during the 2011-2012 school year. In addition, MeBHS staff have been invited to make presentations at various schools, three conferences and a number of employee safety briefings for both State agencies and private companies. These include: Scarborough, Bonny Eagle, York, Winslow, Noble, Greeley, Corbin, Maranacook, Windham. Mt. Valley, Cony, Chevrus, and Nokomis High Schools; the Northeast Transportation Safety Conference, the Maine Youth Action Network Conference and the Maine Driver & Traffic Safety Education Association Conference; Central Maine Power Company, Maine Department of Transportation, Maine Department of Environmental Protection, MidCoast Hospital, UPS, and the University of Maine – Gorham. When totaled, these presentations have afforded the MeBHS contact with over 1,500 students and 400 adults/parents.

31
The Program has received positive feedback and high acclaim from facilitators, students, parents and school administrators. The 2012-2013 school year has only begun and MeBHS is receiving more requests for use of the simulators by facilitators and invitations for presentations from schools, state agencies and civic groups.
High School Students Utilizing Simulators
Future Strategies Create a TDSC introductory outreach letter that will be forwarded to other partners and organizations explaining what the committee has done and what the goals are for the future. Organizations and partners who will receive the letter and teen/parent tool kit include: District of Health Coordinators, Healthy Maine Partnerships (HMP’s), Maine Drug Enforcement Agency, Adult Education offices, Maine Association Health Education, school resource officers, Child Passenger Safety contacts (hospitals, fire departments, EMT’s), Maine Motor Transport Association (MMTA), driver instructors, law enforcement, municipalities and Maine Municipal Association (MMA).
Funding Source
Federal Section 402 and 405 funds
Figure 5. Teen Fatalities by Hour of Day
Teen Fatalities By Hour of Day
0
5
10
15
20
25
1 A
.M.
2 A
.M.
3 A
.M.
4 A
.M.
5 A
.M.
6 A
.M.
7 A
.M.
8 A
.M.
9 A
.M.
10 A
.M.
11 A
.M.
Noon
1 P
.M.
2 P
.M.
3 P
.M.
4 P
.M.
5 P
.M.
6 P
.M.
7 P
.M.
8 P
.M.
9 P
.M.
10 P
.M.
11 P
.M.
Mid
nig
ht
Source: FARS

32
Impaired Driving Fatalities (Alcohol)
20
30
40
50
60
70
80
2001 2002 2003 2004 2005 2006 2007 2008 2009 2010
Num
ber of Fatalities
Impaired Driving Program
Problem Maine’s alcohol-related fatalities were 60% of all fatalities during the mid-1970’s to 1980, but improved to a level of around 20% in 2002-2003. Since then, the percent of alcohol-related fatalities has risen to about 30%. The recent fatality trend reflects an overall increase. In 2011, Maine had 38 alcohol-related fatal crashes and 23 of these fatal crashes had drivers with a Blood Alcohol Content (BAC) of .08 or higher. Maine is slightly below the FARS (Fatality Analysis Reporting System) national rate of 32% (2008). Attention also needs to be focused on drug-impaired drivers.
Objective Maine’s 2012 Impaired Driving Program focused on reducing alcohol-related fatalities by targeting high crash locations. Using police crash data, MeBHS was able to identify these high crash locations and partner with law enforcement to increase patrols in those areas.
Goal
To decrease alcohol impaired driving fatalities by 5% from the 5 year average for 2006-2010 of 45.6 to 43.3 by December 31, 2015. Progress The five year average from 2007-2011 for alcohol impaired driving fatalities is 41.
Figure 6. Alcohol Involved Crash Fatalities in Maine
Source: Maine Transportation Safety Coalition

33
Strategies Holiday High Visibility Impaired Driving Enforcement
MeBHS’s fourth year Holiday Enforcement Campaign gave overtime grants to 47 law enforcement agencies, an increase from last year’s 42 participants, to conduct impaired driving enforcement details from November 4, 2011 to January 2, 2012. There were 41 police departments, 5 county sheriffs offices, and 8 Maine State Police troops who participated. There was 222 operating under the influence arrests made during that time period, a decrease of 15% from last year’s 256 arrests made during the same period. The law enforcement officers worked a total of 3,157 hours of overtime and conducted 7,273 traffic stops, which is equivalent to 2.30 stops an hour. There were 16 impaired driving roadblocks conducted. There were 15 arrest warrants, 92 drug charges, and 77 operating after suspension arrests made. During this enforcement campaign, $153,945.45 in federal funds was expended. 2012 High Visibility Impaired Driving Enforcement Campaign
The use of dedicated enforcement strategies combined with public awareness and education are key components to reducing the injuries and deaths attributed to impaired driving. In addition, local community programs must continue to put forth their independent efforts to reduce impaired driving crashes. Sending the message to the public that impaired driving will not be tolerated is essential. The 2012 High Visibility Impaired Driving Enforcement Campaign began July 1 and ended September 3, 2012, which included the two week national “Drive Sober or Get Pulled Over” crackdown campaign from August 17 to September 3. There were 46 law enforcement agencies participating this year: 39 police departments, 6 county sheriffs’ offices, and the Maine State Police with 7 troops. (Note the final data and financial information from the Maine State Police has not been finalized at report time) The project had a maximum funding of $5,000.00 per law enforcement agency. Last year’s campaign had 60 departments participating and 231 operating under the influence arrests were made. Data on this year’s campaign: Funds expended $173,337.16 Hours worked 4005 Operating under the influence arrests 216 Number of traffic stops 10,551 Stops per hour 2.7 Operating after suspension arrests 93 Warrants of arrests 28 Drug arrests 76 The two week national campaign produced: Funds expended $67,672.00 Hours worked 1,731 Operating under the influence arrests 100 Number of traffic stops 5,982 Stops per hour 3.4

34
Figure 7. Alcohol Related Fatalities By Year and County
Source: FARS statistics
Drug Recognition Expert Program There are currently 72 active Drug Recognition Experts in Maine, down from 84 last year. The Maine Criminal Justice Academy (MCJA) will be offering another DRE school in February of 2013. Three candidates are expected to attend the DRE Instructor School in December 2012. The Department of Human Services Health and Environmental Testing Lab (HETL) has estimated that 250 urine samples have been received from DREs for analysis as of the date of this report. The MCJA continues to require DREs to enter their evaluations in the National DRE Database. The database is very helpful in tracking individual DRE performance and allows the MCJA to process recertification applications more efficiently. The MCJA is still working through some data entry frustrations although NHTSA has made improvements to the system since last year. In August of 2012, Lieutenant Thomas Reagan of the Bangor Police Department and Officer Rachel Horning of the Kittery (formerly Saco) Police Department attended the 18th Annual IACP Training Conference on Drugs, Alcohol and Impaired Driving in Seattle, Washington. Lt. Reagan was chosen to present an overview of bath salts at the conference. Upon their return, they assisted in the development and instruction of the 2012 mandatory DRE refresher training at the MCJA. The training was held on September 4 at the Academy. The guest speaker, for the third year in a row, was Don Decker, a senior DRE instructor from Massachusetts and our Regional IACP Representative who spoke on Drug Abuse that Mimics Medical Conditions. Laura Nichols from MeBHS provided an overview on the new Intoxilyzer 8000. Tom Reagan and Rachel Horning discussed several conference updates, bath salts update, synthetic drug trends and concealment of drugs/drug paraphernalia. Robert Libby reviewed changes to the national database, Jim Lyman from MCJA discussed the new MeBHS website as a resource for impaired driving information, and Steve Pierce answered questions related to the HETL. The class was very well attended with 50 DREs and instructors participating. Jim Lyman, training coordinator at the MCJA, has been working with senior DRE instructors and the Maine Bureau of Motor Vehicles to implement procedures and forms for the new drug impaired driving law.
Alcohol-Related Fatalities*:
2011 39 2010 45
2009 50
2008 46 2007 69
Top 10 Counties for Alcohol-Related Fatalities
(2011): Penobscot 7
Aroostook 5 Androscoggin 5
Kennebec 5
Cumberland 4 Somerset 4
York 4 Hancock 2
Franklin 1 Lincoln 1

35
This year the MCJA nominated Lt. Tom Reagan of the Bangor Police Department for the Elks 2011 Enrique
Camarena Award for his commitment to drug abuse education and enforcement. Reagan was presented with both the State and National award in 2012. The MCJA has been working with senior instructors to develop a lesson plan on Drug Recognition and Impairment. The topic was chosen as a mandatory topic for all Maine law enforcement officers to attend in 2013. The MCJA will be working with Justice Planning and Management Associates (JPMA) to create the on-line training format for the lesson. Standardized Field Sobriety Testing (SFST) The Maine Criminal Justice Academy (MCJA) conducted or processed 10 full SFST student classes with 107 students attending. The MCJA processed 12 SFST (4 hour) Refresher classes statewide with 60 students attending. The MCJA also held 2 SFST Instructor Development classes with 10 students attending. The student instructors helped senior instructors teach the SFST curriculum in a live class for course completion. Intoxilyzers Part of the MeBHS’s management of Maine’s Implied Consent program involves the purchase, distribution, and maintenance of evidential breath alcohol measurement instruments. The current instruments, Intoxilyzer 5000EN, have been in use for over ten years, are difficult to properly maintain and are outdated. In January 2012, MeBHS began the process of procuring new instruments. MeBHS worked closely with the MCJA and the Department of Health and Human Services’ Health and Environmental Testing Laboratory to determine what instrument would be the most beneficial to the state. Following the state’s procurement process, MeBHS secured the Intoxilyzer 8000 to replace the outdated Intoxilyzer 5000EN. In September, 92 Intoxilyzer 8000s were ordered. These instruments will be calibrated and phased into use in early 2013. The MCJA has scheduled a Train the Trainer class for senior instructors in November and anticipate having all instructors trained on the new Intoxilyzer 8000s by the end of the year. Operator training is scheduled to begin in January 2013. It is estimated that the entire Maine law enforcement community will be using the Intoxilyzer 8000s by the spring of 2013. On January 1, 2012, about 600 Intoxilyzer certification cards, representing approximately one third of all operators, were issued under the Maine Criminal Justice Academy’s (MCJA) new recertification process. Now all operators expire at the end of the year in their three year cycle. The MCJA has been discussing a longer certification period or perhaps issuing a non-lapsing certification. Advanced Roadside Impaired Driver Enforcement (ARIDE) The Maine Criminal Justice Academy (MCJA) offered two ARIDE classes this year which were held at MCJA and Gorham PD. A total of 39 students attended the two day training.

36
Impaired Driving Task Force The Impaired Driving Task Force (IDTF) has been meeting on a regular quarterly schedule and is addressing relevant issues and concerns brought by members. Recently, the IDTF tackled the problem of a lack of training for prosecutors in the area of preparing for and presenting cases involving drug impaired drivers. By working in collaboration with the Maine Prosecutors Association, the IDTF was able to provide the MeBHS Law Enforcement Liaison and two primary DRE Instructors for a workshop session at the Annual Prosecutor’s Conference on October 17, 2012. This workshop focused on the extensive training program to become a DRE, problems that hinder prosecution of these cases and instruction on questioning a DRE on the witness stand. The workshop was well received and led to a lively discussion between the audience and the presenters. It was agreed that more of this type of training should be included in future conferences. Regional Impaired Driving Enforcement (RIDE) Team The Regional Impaired Driving Enforcement (RIDE) Team was formed and initiated in April 2012. This pilot program recruited selected volunteers from state, county and municipal agencies within Cumberland County who have demonstrated an expertise in the detection, apprehension and prosecution of impaired drivers. The Team is made up of 2 Troopers from the Maine State Police, 2 Deputies from the Cumberland County Sheriff’s Office and 13 Municipal Officers from the communities of Scarborough, Falmouth, Windham, Cape Elizabeth, Gorham, Westbrook, Cumberland, Yarmouth, Bridgton, and Brunswick. These officers, their agencies and the Chief Executive Officers have made a commitment to raise the awareness, educate the public and make the roadways of Cumberland County safer for its citizens through the strict enforcement of Maine’s Impaired Driving Statutes. To date, the 12 Saturation Patrols and/or Sobriety Checkpoints have resulted in contacts with 2,772 operators. These contacts have led to: 40 Arrests for Impaired Driving (39 for alcohol, 1 for drugs) 7 Warning for Impaired Driving (BAC test <.08) 2 Juvenile OUI (<18 years of age) 7 Arrests for Possession of Drugs 7 Arrests for Operating After Suspension 2 Arrests for Outstanding Warrants 29 Citations for Various Traffic Infractions 861 Warnings for Various Traffic Infractions The pilot program has been well received and supported by both the motoring public and the targeted communities. MeBHS would like to see this program continue into the next year and possibly expand to include another Regional Team in an additional location in Maine.
R.I.D.E. Team Press Conference R.I.D.E Team Checkpoint in Casco at the Falmouth Police Dept.
37
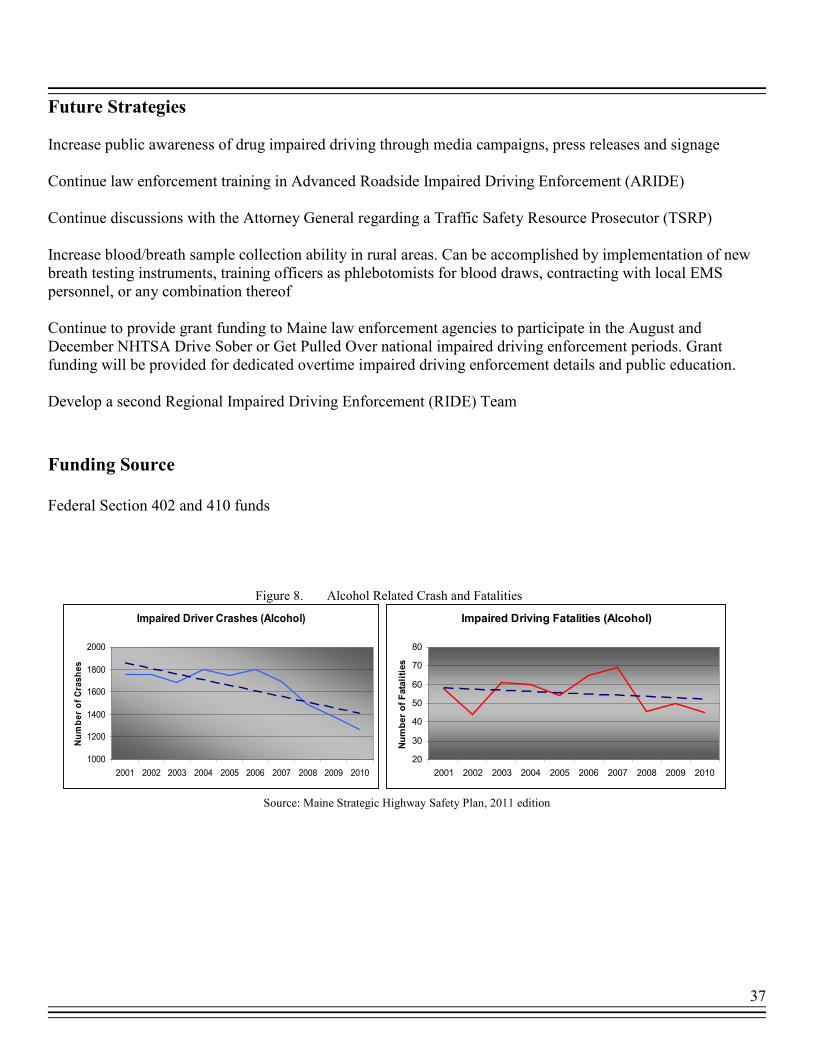
Impaired Driver Crashes (Alcohol)
1000
1200
1400
1600
1800
2000
2001 2002 2003 2004 2005 2006 2007 2008 2009 2010
Number of Crashes
Impaired Driving Fatalities (Alcohol)
20
30
40
50
60
70
80
2001 2002 2003 2004 2005 2006 2007 2008 2009 2010
Number of Fatalities
Future Strategies Increase public awareness of drug impaired driving through media campaigns, press releases and signage Continue law enforcement training in Advanced Roadside Impaired Driving Enforcement (ARIDE) Continue discussions with the Attorney General regarding a Traffic Safety Resource Prosecutor (TSRP) Increase blood/breath sample collection ability in rural areas. Can be accomplished by implementation of new breath testing instruments, training officers as phlebotomists for blood draws, contracting with local EMS personnel, or any combination thereof Continue to provide grant funding to Maine law enforcement agencies to participate in the August and December NHTSA Drive Sober or Get Pulled Over national impaired driving enforcement periods. Grant funding will be provided for dedicated overtime impaired driving enforcement details and public education. Develop a second Regional Impaired Driving Enforcement (RIDE) Team
Funding Source
Federal Section 402 and 410 funds Figure 8. Alcohol Related Crash and Fatalities
Source: Maine Strategic Highway Safety Plan, 2011 edition

38
Traffic Records
Problem A complete traffic records program is necessary for planning (problem identification), operational management or control, and evaluation of a state’s highway safety activities. The MeBHS and its partners collect and use traffic records data to identify highway safety problems, problem areas, to select the best possible countermeasures, and to evaluate the effectiveness of these efforts. The role of traffic records in highway safety has been substantially increasing since the creation of the Federal Section 408 grant program under SAFETEA-LU.
Objective Traffic records and traffic safety data form the decision-making basis for the setting of policy and the selection of projects and programs to improve the safety of our state’s highways. Gathering, processing and reporting all data pertaining to the traffic safety activities in an accurate and timely fashion is a primary objective of the MeBHS. To accomplish this objective, the MeBHS has established a permanent Traffic Records coordinating committee (TRCC).
Goal
The goal of Maine’s Traffic Records Coordinating Committee (TRCC) is to continue to develop a comprehensive traffic records system that provides timely, complete, accurate and usable traffic records data so that we may analyze and address our highest priority traffic safety issues.
Strategies Maine's TRCC partners have made significant progress in improving Maine's traffic records systems. These successes include:
• Completed statewide deployment of Maine's Electronic EMS Run Report System (all services have been required to submit electronically as of 4/1/09). Ongoing training and data quality improvement efforts continue.
• Bureau of Motor Vehicles (BMV) continued migration of business functions to a new computer system
• BMV completed the electronic transfer of registration data from municipalities project which resulted in improved efficiencies and reduction in submission times
• BMV's Online Rapid Renewal Registration system was upgraded to register trailer fleets and additional municipalities began using the online system

39
Maine Crashes By Year
25,000
27,000
29,000
31,000
33,000
35,000
37,000
39,000
2001
2002
2003
2004
2005
2006
2007
2008
2009
2010
Number of Crashes
Crash Rates
175
200
225
250
275
300
2001 2002 2003 2004 2005 2006 2007 2008 2009 2010
Cra
shes/H
MVM
MaineU.S.Linear (Maine)
• Maine Crash Report Form was redesigned based on MMUCC Revision 3 which will result in a significant increase in MMUCC compliance for Maine's crash data
• Maine's Crash Reporting System technology upgrade was deployed in January of 2011. This upgrade allows for the capture of more information including specific causes for distraction.
Figure 9. Crashes and Fatalities Data
Source: Maine Transportation Safety Coalition
Source: Maine Strategic Highway Safety Plan, 2011 edition
Future Strategies Future projects have been identified in the State’s approved Traffic Records Plan for 2012. Those projects include funding for collection of electronic citation data, a Maine specific CODES project and public access to crash records and data analysis. In order to continue to be eligible to receive federal funds for traffic data and records purposes, the State must undergo traffic records assessments every five years. Maine’s Traffic Records Assessment was conducted April 25-29, 2011. A copy of the final assessment report is available upon request.
Funding Source Federal Section 402 and 408 funds, and Maine State Highway funds and other funds

40
Illegal/Unsafe Speed and Aggressive Driving
Problem Speed is cited as a factor in an average of 6,100 crashes per year. In 2011, speed-related crashes accounted for 49% of total crashes and 50% of total fatalities. The biggest concern with excessive speed is it can lead to other driver errors and serious injuries. Adjusting speed for weather-related road conditions is a problem. Unsafe speed was noted in 3,500 crashes on snowy, slushy or icy road surfaces, and another 700 occurred on wet road surfaces.
Objective MeBHS is working with Maine law enforcement agencies to fund dedicated overtime details to combat the increase of speeders on Maine roads. Enforcement can be one of the most effective means of improving driver behavior, especially as it relates to speeders.
Goal To decrease speeding related fatalities by 5% from the 5 year average of 68.8 for 2006-2010 to 65.4 by December 31, 2015. Progress The five year average from 2007-2011 for speeding related fatalities is 70.4.
Strategies 2012 Speed Enforcement Campaign The 2012 Speed Enforcement Campaign was a second year pilot study. In 2011, MeBHS conducted an analysis on the highest number of speed related crashes in the state. MeBHS then chose 15 agencies to participate in the 2011 Speed Enforcement Campaign. The same 15 agencies were invited to participate in the second year study. The MeBHS conducted a meeting with the project directors from the 15 agencies and provided them with speed crash data from their respective towns, counties, and troop areas. A time analysis was also done providing them with high crash speed times and dates. A map was created to indicate where the speed related crashes were occurring in their respected areas. The agencies used this data in their enforcement efforts. The 2012 project started May 1 and ended September 15. Due to manpower issues, only 13 law enforcement agencies were able to participate in this year’s campaign once the campaign began. A maximum funding cap of $5,000.00 per agency was determined. The Maine State Police conducted speed enforcement under the separate SAFE (Strategic Area Focused Enforcement) Program.

41
The statistical data for this year’s campaign follows (Maine State Police data not available at report time): Funds expended $54,411.42 Hours worked 1,249 Traffic stops 2,898 Stops per hour 2.41 Number of speeding summons 1,232 In comparing the data from 2011 (including the Maine State Police): Funds expended $80,424.00 Hours worked 1,897 Traffic stops 4,788 Stops per hour 2.45 Number of speeding summons 2,063 The 2012 program had fewer agencies participating. The number of speed summons issued by the agencies during this year’s program decreased by 40%.
Future Strategies Sustain high visibility enforcement in data-driven locations Continue to produce and/or distribute public service announcements via television, web, and radio that emphasize speed and its effect on public safety.
Funding Source
Federal Section 402 funds
Figure 10. Speeding Facts for Maine
Source: Maine Strategic Highway Safety Plan, 2011 edition

42
Motorcycle Safety
Problem Motorcycle crashes resulted in 15 fatalities in 2011, which was a decrease from 19 fatalities in 2010. In 2011, motorcycle crashes and fatalities decreased from 2010. Motorcycle crash data from 2011 include:
o Helmets were not worn by 73 of of the 90 riders killed o Leading age group of motorcycle operator fatalities is 25-34 o Nine of the 15 fatal motorcycle crashes were single vehicle occurrences
Objective Educate the public on the importance of motorcycle safety for both motorcycle riders and the motoring public.
Goals To decrease motorcyclist fatalities by 5% from the 5 year average of 21 for 2006-2010 to 20 by December 31, 2015. Progress The five year average from 2007-2011 for motorcyclist fatalities is 19.4. To decrease unhelmeted motorcyclist fatalities by 5% from the 5 year average of 14.6 for 2006-2010 to 13.9 by December 31, 2015. Progress The five year average from 2007-2011 for unhelmeted motorcyclist fatalities is 13.4.
Strategies Bureau of Motor Vehicles Branch Office Media The MeBHS has partnered with the Bureau of Motor Vehicles’ (BMV) branch offices to play MeBHS television media spots on the branch offices’ televisions. These televisions are located in the waiting areas of all BMV branch offices. The media spots airing include two motorcycle public service announcements, MeBHS’s newest television spots. There are approximately 500,000 visitors to a BMV branch office annually. MeBHS has the opportunity to reach a great number of people at a very low cost through this partnership with BMV.
43
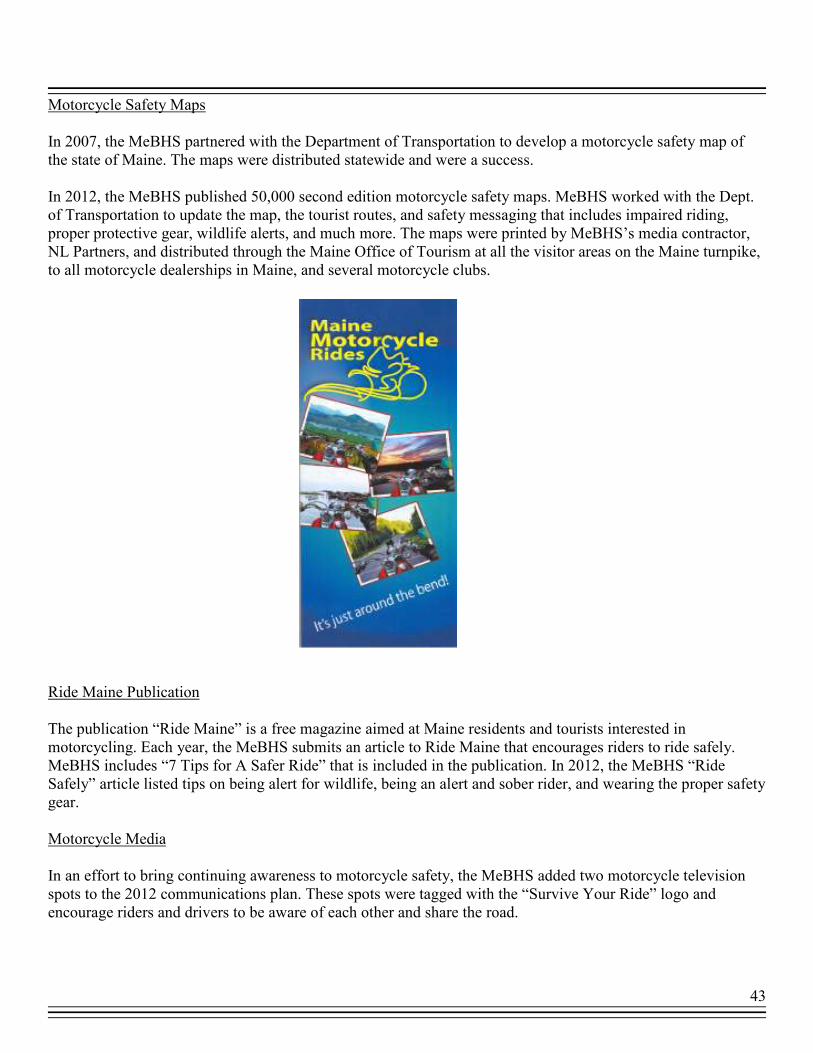
Motorcycle Safety Maps In 2007, the MeBHS partnered with the Department of Transportation to develop a motorcycle safety map of the state of Maine. The maps were distributed statewide and were a success. In 2012, the MeBHS published 50,000 second edition motorcycle safety maps. MeBHS worked with the Dept. of Transportation to update the map, the tourist routes, and safety messaging that includes impaired riding, proper protective gear, wildlife alerts, and much more. The maps were printed by MeBHS’s media contractor, NL Partners, and distributed through the Maine Office of Tourism at all the visitor areas on the Maine turnpike, to all motorcycle dealerships in Maine, and several motorcycle clubs. Ride Maine Publication The publication “Ride Maine” is a free magazine aimed at Maine residents and tourists interested in motorcycling. Each year, the MeBHS submits an article to Ride Maine that encourages riders to ride safely. MeBHS includes “7 Tips for A Safer Ride” that is included in the publication. In 2012, the MeBHS “Ride Safely” article listed tips on being alert for wildlife, being an alert and sober rider, and wearing the proper safety gear. Motorcycle Media In an effort to bring continuing awareness to motorcycle safety, the MeBHS added two motorcycle television spots to the 2012 communications plan. These spots were tagged with the “Survive Your Ride” logo and encourage riders and drivers to be aware of each other and share the road.

44
Motorcycle Crashes
400
450
500
550
600
650
700
2001 2002 2003 2004 2005 2006 2007 2008 2009 2010
Number of Crashes
Motorcycle Fatalities
5
10
15
20
25
2001 2002 2003 2004 2005 2006 2007 2008 2009 2010
Number of Fatalities
Figure 11: Motorcycle Crashes and Fatalities in Maine
Future Strategies Continue Share the Road education for motorcyclists Continue partnership with the Bureau of Motor Vehicles to educate motorcyclists on safe riding
Funding Source
Federal Section 402 and 2010 funds

45
Paid and Earned Media
Objective/Goal
To increase seat belt use, proper use of child passenger safety restraints, reduce motorcycle fatalities, reduce impaired driving, speeding, and distracted driving through use of a statewide media campaign.
Strategies
“Survive Your Drive” Media Campaign In 2009, the MeBHS hired a full-service media relations firm to develop a statewide highway safety media campaign. The firm, NL Partners, continued the campaign “Survive Your Drive” into FFY2011. MeBHS contracted with NL Partners again in FFY 2012 and continued the “Survive Your Drive” theme for the statewide media campaign. The “Survive Your Drive” campaign is designed to raise driver awareness about the importance of safe driving and to help drivers avoid behaviors that lead to fatal crashes on Maine highways. The campaign covers all aspects of highway safety, including impaired driving, speed, seatbelt use, teen drivers, and distracted driving. The MeBHS worked with NL Partners to retag existing spots created by other states. The MeBHS now has television spots that discuss child passenger safety, distracted driving, impaired driving, seatbelt usage, motorcycles, teen drivers, and speed. The MeBHS radio spots address child passenger safety, impaired driving, seatbelt use, and motorcycles. MeBHS continued developing a social media presence on Facebook this year. MeBHS has used Facebook to announce grant opportunities, community events, car seat check-up events, national safety weeks, post pictures of events, and encourage fans to be safe and responsible drivers. MeBHS and NL Partners worked with Maine Dept. of Transportation to release a second edition motorcycle safety map. The map of Maine includes multiple safety messages, suggested rides, information on Maine motorcycle dealerships and provides an easy-to-read overview of motorcycle crashes and fatalities in Maine. The map is distributed through the Maine Office of Tourism at the visitor centers on the Maine Turnpike, through motorcycle dealerships and clubs, and are made available to the public upon request. NL Partners hires Critical Insights to conduct the Critical Insights on MaineTM Tracking Survey, a comprehensive, statewide public opinion survey of registered voters which covers a variety of topics of interest to business, government, and the general public. Among those who reportedly saw or heard at least one category ad in the past year, awareness of messages with the theme of “Don’t be a distracted driver/Don’t use a cell phone or text while driving” currently stands at 73%. This is a sharp improvement from 59% last spring and has doubled since the Spring 2011 wave (when awareness was at 36%) and has tripled since the Fall 2010 wave of measurement (when awareness stood at 23%).

46
Overall survey results show an increase of message retention in 2012. This is a positive report and reinforces the media campaign and message dissemination avenues that MeBHS has pursued over the past few years.
Figure 12. Survey Responses to: “What were the messages of the ad(s) that you saw or heard?
What was the ad about?”
Source: Critical Insights on Maine Tracking Survey Fall 2012
“No Text Zone” Campaign MeBHS partnered with Maine’s CBS affiliate station WGME and Renys, a Maine retail chain, in the multi-platform “No Text Zone” Campaign. The campaign, developed by WGME, encourages viewers to make their vehicles a no text zone. MeBHS recorded several public service announcements that air on WGME. WGME’s website features many MeBHS advertisements that click through to MeBHS’s website. WGME developed a “No Text Zone” website where members of the public can take a pledge to keep their vehicles a no text zone. Renys is giving away one $100 store gift certificate to a pledge participant each month. Renys shoppers can pick up “No Text Zone” stickers at all Renys locations. These stickers can then be affixed to people’s vehicles. There is an increasing number of vehicles on Maine roads that are promoting the “No Text Zone” message.

47
Over 1,000 people have taken the pledge to date. Stickers that advertise the “No Text Zone” pledge (image above is the sticker) have been received by over 20,000 people since July. Over 609,000 impressions have been displayed on the WGME.com website; the impressions promote both the “No Text Zone” campaign and MeBHS.
Earned Media Earned media was an important component of MeBHS’s media campaign in 2012. Law enforcement agencies who participated in the MeBHS’s enforcement campaigns were asked to make use of all types of earned media to alert each agency’s community of the enforcement efforts. Agencies conducted television and radio interviews, sent out press releases, posted news releases on department websites and Facebook pages, and used roadway signage to alert motorists of enforcement periods. Sport Marketing Campaign MeBHS continued contracting with Alliance Sport Marketing for Federal Fiscal Year 2012 to develop and implement additional components of statewide sport marketing campaign that began in FFY2011. The campaign involved multiple sport venues around the state, including Maine’s seven asphalt motorsports venues, one minor league baseball team (the Portland Sea Dogs), one minor league hockey team (the Portland Pirates), and the University of Maine athletics (covering football, men’s and women’s basketball, baseball, and men’s and women’s hockey seasons). The campaign covered more than thirteen sports seasons.
Alliance Sport Marketing developed and ensured at least two public address announcements were made during each event in each venue, organized a highway safety night at each venue, placed the MeBHS logo on schedule posters for each race track, and played safety messages on websites for minor league baseball, minor league hockey, and University of Maine athletics’ websites. The highway safety nights featuring the “You’ve Been Ticketed” promotion at each venue were a big success. Each “You’ve Been Ticketed” promotion involved many highway safety partners

48
working together at each venue. Local law enforcement monitored the venue parking lot and rewarded drivers that were buckled up as they entered the parking lot with a “ticket”. That ticket could be redeemed for a highway safety t-shirt at the MeBHS booth at the venue. Alliance Sport Marketing staff manned the booth, distributing the t-shirts as well as highway safety pamphlets, car seat inspection and distribution site flyers, and other educational material. The MeBHS Seatbelt Convincer was available at many events for fans’ use. In FFY 2013, Alliance Sport Marketing and MeBHS will expand the sport marketing campaign into Maine high schools to bring a challenge to students to stop distracted driving. MeBHS and Alliance Sport Marketing will also develop a motorcycle campaign that will kick off in conjunction with the national motorcycle safety month.
Future Strategies Add existing distracted driving media to the media play schedule. Continue supporting the MeBHS and NHTSA mobilizations with paid and earned media.
Funding Source Federal Section 402 and 406 funds

49
Media Schedule Developed by MeBHS for Use by BHS Contractor The following guideline was used to place media spots into rotation during state and national
media campaigns
MeBHS 2012-2013 Communications Calendar
Highlighted dates should have media air time purchased
and proper MeBHS spots airing
APRIL MAY JUNE
S M T W T F S S M T W T F S S M T W T F S
1 2 3 4 5 6 7 1 2 3 4 5 1 2
8 9 10 11 12 13 14 6 7 8 9 10 11 12 3 4 5 6 7 8 9
15 16 17 18 19 20 21 13 14 15 16 17 18 19 10 11 12 13 14 15 16
22 23 24 25 26 27 28 20 21 22 23 24 25 26 17 18 19 20 21 22 23
29 30 27 28 29 30 31 24 25 26 27 28 29 30
JULY AUGUST SEPTEMBER
S M T W T F S S M T W T F S S M T W T F S
1 2 3 4 5 6 7 1 2 3 4 1
8 9 10 11 12 13 14 5 6 7 8 9 10 11 2 3 4 5 6 7 8
15 16 17 18 19 20 21 12 13 14 15 16 17 18 9 10 11 12 13 14 15
22 23 24 25 26 27 28 19 20 21 22 23 24 25 16 17 18 19 20 21 22
29 30 31 26 27 28 29 30 31 23 24 25 26 27 28 29
30
OCTOBER NOVEMBER DECEMBER
S M T W T F S S M T W T F S S M T W T F S
1 2 3 4 5 6 1 2 3 1
7 8 9 10 11 12 13 4 5 6 7 8 9 10 2 3 4 5 6 7 8
14 15 16 17 18 19 20 11 12 13 14 15 16 17 9 10 11 12 13 14 15
21 22 23 24 25 26 27 18 19 20 21 22 23 24 16 17 18 19 20 21 22
28 29 30 31 25 26 27 28 29 30 23 24 25 26 27 28 29
30 31
JANUARY FEBRUARY MARCH
S M T W T F S S M T W T F S S M T W T F S
1 2 3 4 5 1 2 1 2
6 7 8 9 10 11 12 3 4 5 6 7 8 9 3 4 5 6 7 8 9
13 14 15 16 17 18 19 10 11 12 13 14 15 16 10 11 12 13 14 15 16
20 21 22 23 24 25 26 17 18 19 20 21 22 23 17 18 19 20 21 22 23
27 28 29 30 31 24 25 26 27 28 24 25 26 27 28 29 30
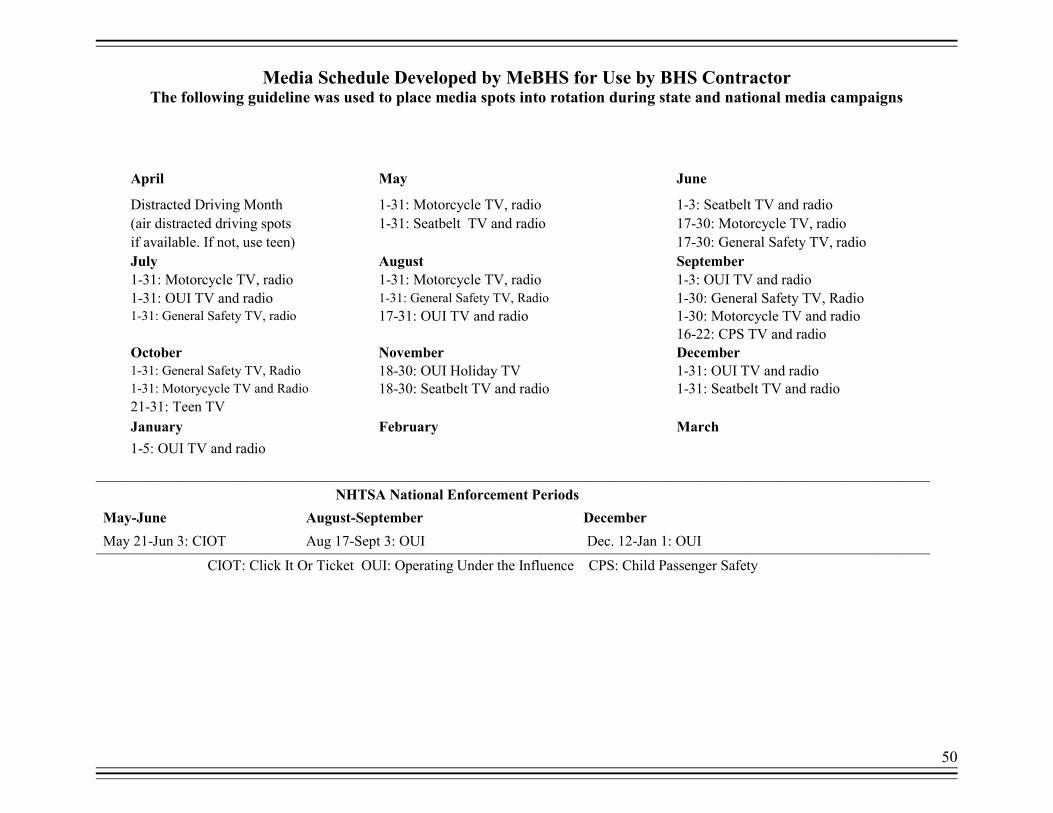
50
Media Schedule Developed by MeBHS for Use by BHS Contractor The following guideline was used to place media spots into rotation during state and national media campaigns
April May
June
Distracted Driving Month 1-31: Motorcycle TV, radio 1-3: Seatbelt TV and radio
(air distracted driving spots 1-31: Seatbelt TV and radio 17-30: Motorcycle TV, radio
if available. If not, use teen) 17-30: General Safety TV, radio
July August September
1-31: Motorcycle TV, radio 1-31: Motorcycle TV, radio 1-3: OUI TV and radio
1-31: OUI TV and radio 1-31: General Safety TV, Radio 1-30: General Safety TV, Radio
1-31: General Safety TV, radio 17-31: OUI TV and radio 1-30: Motorcycle TV and radio
16-22: CPS TV and radio
October November December
1-31: General Safety TV, Radio 18-30: OUI Holiday TV 1-31: OUI TV and radio
1-31: Motorycycle TV and Radio 18-30: Seatbelt TV and radio 1-31: Seatbelt TV and radio
21-31: Teen TV
January February March
1-5: OUI TV and radio
NHTSA National Enforcement Periods
May-June August-September December
May 21-Jun 3: CIOT Aug 17-Sept 3: OUI Dec. 12-Jan 1: OUI
CIOT: Click It Or Ticket OUI: Operating Under the Influence CPS: Child Passenger Safety

51
**Contract with media firm expired in late 2011. MeBHS followed state request for proposal process in early 2012 to hire a media firm.

52
Noteworthy Programs Partnerships and the Strategic Highway Safety Plan MeBHS has partnered with the Maine Department of Transportation, Maine Turnpike Authority, Department of Health and Human Services, state law enforcement agencies and many others in working toward the identified initiatives within the statewide Strategic Highway Safety Plan (SHSP) to substantially reduce the number of injuries and deaths related to crashes on our highways. MeBHS will continue to explore new partnerships and continue to strengthen existing partnerships with more agencies (governmental and non-governmental, local, state, law enforcement and non-law enforcement) in our efforts to increase our chances of affecting behavioral changes and educating Maine citizens about all matters related to behavioral traffic safety. The SHSP Planning Committee is involved in updating the SHSP. Maine Driving Dynamics Maine Driving Dynamics (MDD) is a Maine sponsored five-hour defensive driving course that offers all drivers the opportunity to improve their defensive driving abilities. The course includes discussion of collision avoidance techniques, safety issues, driver habits and attitudes, and the basic elements that constantly challenge drivers on Maine's highways. MDD is taught by a certified Maine Driving Dynamics instructor in a format that engages students with lectures, videos, and class discussion/participation. Those completing the course will receive a three-point credit on their driving record and students 55 and older can receive an insurance discount from their insurer. During FFY 2012, MDD underwent a total update of the curriculum. A committee was formed and consisted of instructors who brought ideas and suggestions to BHS to strengthen the MDD program. The new program rolled out in March of 2012 and has had much success and positive feedback. Over 300 classes have taken place in both public and private venues and the class continues to be a success assisting Maine drivers to become more aware and defensive drivers. MeBHS believes students are safer drivers after completing this course. They leave the class with a new and unique way of looking at the driving experience. The course is offered to the public several times each month at various locations around the state. MDD is sponsored by MeBHS in partnership with local and regional adult education organizations. The course is also offered on site to private companies. In FFY 2012, approximately 2,500 students participated in the course and received a credit on their license and/or discount on their insurance. Law Enforcement Liaison The MeBHS Law Enforcement Liaison works with Maine law enforcement agencies to increase participation in MeBHS enforcement campaigns, assists law enforcement agencies with grant paperwork requirements, conducts trainings at the Maine Criminal Justice Academy, helps the MeBHS organized media events, and represents the MeBHS on many committees and at several meetings throughout the state and country. The LEL
53
has developed several programs this year that will be instrumental in achieving the performance goals established in the Highway Safety Plan. The current LEL contract goes through 2014. Implied Consent Program The MeBHS is responsible for Maine’s Implied Consent program. Under Maine’s Implied Consent law, a driver shall submit to and complete a test to determine an alcohol level and drug concentration by analysis of blood, breath or urine. This test may be given at any time that authorities have probable cause to administer it. If a driver refuses to take such a test for alcohol or drugs, that individual’s driver’s license will be immediately suspended for a period of up to six years. Maine currently uses the Intoxilyzer 5000 units, which are managed by the Department of Health and Human Services’ Health and Environmental Testing Laboratory (HETL). HETL is responsible for calibrating all the Intoxilyzers in use in the state. The MeBHS provides funding for the salary of the HETL chemist who manages and maintains the units. The chemist is also an expert witness who is called on frequently for court cases involving use of an Intoxilyzer. Maine will be transitioning to the Intoxilyzer 8000 units in the winter and spring of 2013. There are currently 80 Intoxilyzers in use around the state. These units are strategically located at police departments around Maine that are easily accessible by all Maine law enforcement. MeBHS is evaluating the location of each Intoxilyzer location and will make any necessary changes as part of the rollout of the Intoxilyzer 8000 units. Police Phlebotomy Project The MeBHS has been working on the development of a curriculum and program to train Drug Recognition Experts to become Blood Technicians. The MeBHS’s Law Enforcement Liaison originally began to work with the Kennebec Valley Community College in hopes that a program could be set up at all the Community Colleges in the State system. A change in the administration has necessitated the exploration of other avenues for this training. The MeBHS Law Enforcement Liaison is now working with Southern Maine EMS, which has provided such training in the past. Additional partners in this endeavor include the Maine Department of Health and Human Services Laboratory personnel and the Maine Criminal Justice Academy. The Lesson Plan for the three day certification program is nearly complete and MeBHS anticipates the first training session will be held in late January or early February of 2013. Operating After Suspension Program Statistics show that 7.4 % of all fatal motor vehicle crashes involved suspended drivers. In an effort to curb the effect of suspended drivers, two law enforcement agencies received grants to conduct overtime details aimed at operating after suspension violators. Both grants began on May 1 and ended on September 15, 2012; each department received $5,000.00. The goal was to arrest drivers for operating a motor vehicle while under suspension. The enforcement method was three-pronged: targeted suspended drivers were sought out at their residential locations and place of work; at district court where they travel to and from court appearances; and

54
two-man patrol units where the officer, who is the passenger, utilizes the mobile data terminal to indentify drivers operating after suspended. York Police Department spent $4,546.52, 90% of the funds, and arrested 12 drivers for operating under suspension. The cost per arrest is $378.87. York PD was very successful with this project. They have participated in this program for three years. Sanford Police Department spent $3,188.35, 63% of the funds, and arrested 3 drivers for operating after suspension. The cost per arrest is $1,062.78. Their lack of success is attributed to manpower shortage, as details were not filled, limited contacts on patrol, and compliance of OAS drivers not driving to court. Mature Drivers The MeBHS recognizes that Maine has the oldest state by median age and understands the unique driving issues that pertain to mature drivers. MeBHS in conjunction with AAA of Northern New England, Maine Bureau of Motor Vehicles and other stakeholders in the medical industry have joined together to form the Maine Senior Driver Coalition. This committee works to promote Car Fit programs as recommended. The Committee is also focusing on raising awareness of the risks and problems that mature drivers face in a rural state that has limited public transportation options available.
Maine Transportation Safety Coalition
The History of the Maine Transportation Safety Coalition
The formation of the MTSC began through Maine’s Safety Management System (SMS) being initiated by the Maine Department of Transportation. One aspect to this SMS effort was the formation of an Education Subcommittee. Through the efforts of this subcommittee and the collaborative efforts of various other transportation safety advocates, the first ever Maine Transportation Safety Conference was held in May 1997. This conference, Moving Kids Safely, identified both further concerns as well as opportunities. These concerns and opportunities brought about the formation of the MTSC.
Today the Maine Transportation Safety Coalition continues to be active in serving as both a resource for those interested in transportation safety and a promoter of transportation safety initiatives. For more information, visit www.themtsc.org The MTSC has been working on developing/creating a sustainable strategic plan. The draft is outlined below. Mission of the Organization:
The Safest Roadways in the Country
The MTSC fulfills its mission by achieving the following goals:

55
Goal 1 The MTSC is sustainable.
Objective 1: Maintain targeted membership diversity Activities:
• Survey current and potential members to assess organizational needs to maintain and/or secure MTSC membership.
• Recruit and retain public and private sector members (individuals and organizations).
• Encourage consistent and active member participation to meetings and on MTSC activities.
• Plan and conduct annual MTSC meeting, at which time new officers are elected.
• Plan and conduct annual MTSC membership meeting. Objective 2: Stabilize funding for MTSC infrastructure
Activities:
• Identify / maintain current funding supporting MTSC
• Identify funding opportunities to support MTSC projects
• Utilize current and explore new partnerships to support MTSC projects Objective 3: Maintain MTSC organizational infrastructure
Activities:
• Annually review, update, and follow MTSC Bylaws
• Annually review and update MTSC Strategic Plan
• Integrate MTSC Strategic Plan into MTSC Bylaws
• Create and review annual strategic report card to monitor progress Objective 4: Support the implementation of transportation related projects via MTSC member expertise of training, data, technical assistance, and resources.
Activities:
• Use Maine based data to inform and educate MTSC members about transportation related issues.
• Develop selection criteria to prioritize and select MTSC projects i.e. budget, data, funding, partners, evidence based, evaluation
• Determine budget required for implementation and evaluation of project
• Identify resources required to implement project i.e. funding, partners Goal 2 The MTSC is a recognized transportation safety resource for legislators, stakeholders, partners and the
general public.
Objective 1: Serve as forum for transportation safety advocates. Activities:
• Conduct monthly MTSC meetings (statewide) – ensuring educational component at each meeting
• Encourage member discussion and input at MTSC meetings and events.
• Solicit individuals and organizations for transportation articles for inclusion in quarterly MTSC newsletter

56
• Participate as planning member for annual Northeast Transportation Safety Conference
• Maintain and disseminate schedule of upcoming partner workshops, conferences, webinars
• Create MTSC Speaker’s Bureau
• Facilitate the collaboration of stakeholders, partners etc. at the local, and state levels to enhance support for
Objective 2: Collaborate with groups within Maine to identify transportation safety solutions.
Activities:
• Identify local, state, and national venues to provide information on transportation related issues, such as workshops, conferences etc.
• Provide transportation related data upon request
• Provide MTSC resources to promote transportation safety work including data, and training opportunities
• Link disparate populations to culturally competent educational opportunities and safety information.
• Routinely disseminate transportation data to policymakers and other partners Objective 3: Promote the implementation and evaluation of transportation safety interventions using evidence informed programs.
Activities:
• Research evidence informed transportation safety interventions
• Develop linkages at the local, state, and national levels to disseminate available transportation related interventions
• Facilitate the collaboration of safety advocates representing diverse populations to enhance support for the implementation of evidence informed transportation interventions
• Contribute to the implementation and evaluation of evidence informed transportation programs
• Share evaluation findings with stakeholders
The efforts of the MTSC have included:
• Promotion of Safe Communities • Establishment of a seat belt initiative • Development of a Transportation Safety Resource Guide
"The Status of Transportation Safety in Maine" • The 2011 Northeast Transportation Safety conference: “Toward Zero Deaths, Building on Success” was
held on November 8 & 9 in Freeport, Maine. Over 100 individuals attended from as far away as Ohio. Topics included: Teen Texting While Driving Initiative in Cumberland County-presented by Alex Hughes, City of Portland and Teen Driving Issues presented by Officer Rocco Navarro of South Portland Police Department and Officer Owen Davis of York Police Department.
• The MTSC Annual meeting was held on June 7 at the Coastal Maine Botanical Gardens in Boothbay. Safety Champion awards were presented to:

57
Secretary of State, Charlie Summers for his efforts to address the safety concerns surrounding young drivers. Secretary of State Charlie Summers announced a campaign to have “Conversations With the Communities”, a public discussion regarding ways to improve the safety of Maine’s young drivers. In addition to “Conversations with the Communities” the Secretary of State convened a Technical Review Panel (TRP) to evaluate the findings and develop an action plan to address teen driving laws and modernization of the driver education curriculum which had not changed since 1997. Secretary Summers presented the findings and recommendations from the TRP and Conversations with Communities with the Joint Standing Committee on Transportation who then worked quickly to draft a bill in the last few weeks of the session LD1912 “An Act To Encourage Responsible Teen Driving”.
WCSH 6 and Community Sponsors: Moody’s Auto Body, Berlin City & AAA for their efforts to develop a public awareness campaign to help change driver behavior by promoting a monthly safe driving message supported by public service announcements and news stories. The News Center approached AAA, Moody’s Auto Body and Berlin City to help sponsor the “Drive for Safety Campaign”. http://www.wcsh6.com/life/community/drive_for_safety/default.aspx
Lt. Tom Reagan of the Bangor Police Department for his leadership in teaching the communities about bath salts and his extensive expanded knowledge of Maine’s DITEP training (Drug Impaired Training for Education Professionals). Lt. Reagan’s status as a Drug Recognition Expert Instructor has resulted in providing instruction to dozens of Maine law enforcement officers, as well as officers in other states such as Florida, Maryland, Arizona, Missouri, and South Carolina. Lt. Reagan developed a training curriculum and travelled throughout the state and into Canada to educate law enforcement, medical personnel, and members of the public as to the dangers of these drugs, and to instruct them on how to appropriately handle people who experience the psychosis, paranoia, and excited delirium caused by them.
Duane Brunell received the MTSC Member of the Year award. Duane has been the foundation of the MTSC, assisting in educating other New England states on how to create their own state MTSC and the benefits of such an organization.

58
Legislative Summary
More information on Maine laws may be found at http://www.maine.gov/legis/opla/enactlawnew.htm .
Chapter 654 LD 1912
An Act to Encourage Responsible Teen Driving
This bill extends the period of restrictions imposed on intermediate driver's licenses and increases the fines and terms of license suspension for violations of the conditions and restrictions for intermediate and juvenile provisional license holders. The bill increases the reinstatement fees for violations of the juvenile provisional licensing laws. A person holding a juvenile provisional license or who is less than 21 years of age whose license is suspended for a moving violation is required to complete a defensive driving course; if a person's provisional license is suspended for a specified violation, the person must pass a physical examination.

59
Fiscal Year Summary
FFY12 Financial Summary of Expenditures (as of 12/18/12)
402 405 163 406 408 410 2010 2011 Total % of Total
P&A $ 135,470 $9,220 $18,351 $163,040 5.75%
Traffic Records $ 1,161 $376,692 $377,853 13.33%
Impaired Driving $ 149,074 $888,710 $1,037,784 36.62%
Occupant Protection $ 241,079 $ 224,727 $465,806 16.44%
Ped/Bicycle Safety $ - $ - 0.00%
Police Traffic Services $259,387 $259,387 9.15%
EMS $ - $ - 0.00%
Child Restraint $56,966 $100,110 $157,075 5.54%
Paid Advertising $ 80,172 $187,106 $267,278 9.43%
Motorcycle $ - $105,779 $105,779 3.73%
TOTAL $923,308 $224,727 $0 $196,326 $376,692 $907,061 $105,779 $100,110 $2,834,003 100.00%
Police Traffic Services
9.15%
Occupant Protection
16.44%
Impaired Driving 36.62%
Traffic Records 13.33%
P&A 5.75%Motorcycle 3.73%
Child Restraint 5.54%
Paid Advertising 9.43%P&A
Traffic Records
Impaired Driving
Occupant Protection
Police Traffic Services
Child Restraint
Paid Advertising
Motorcycle

60
Appendix A
Supporting Motor Vehicle Crash Data
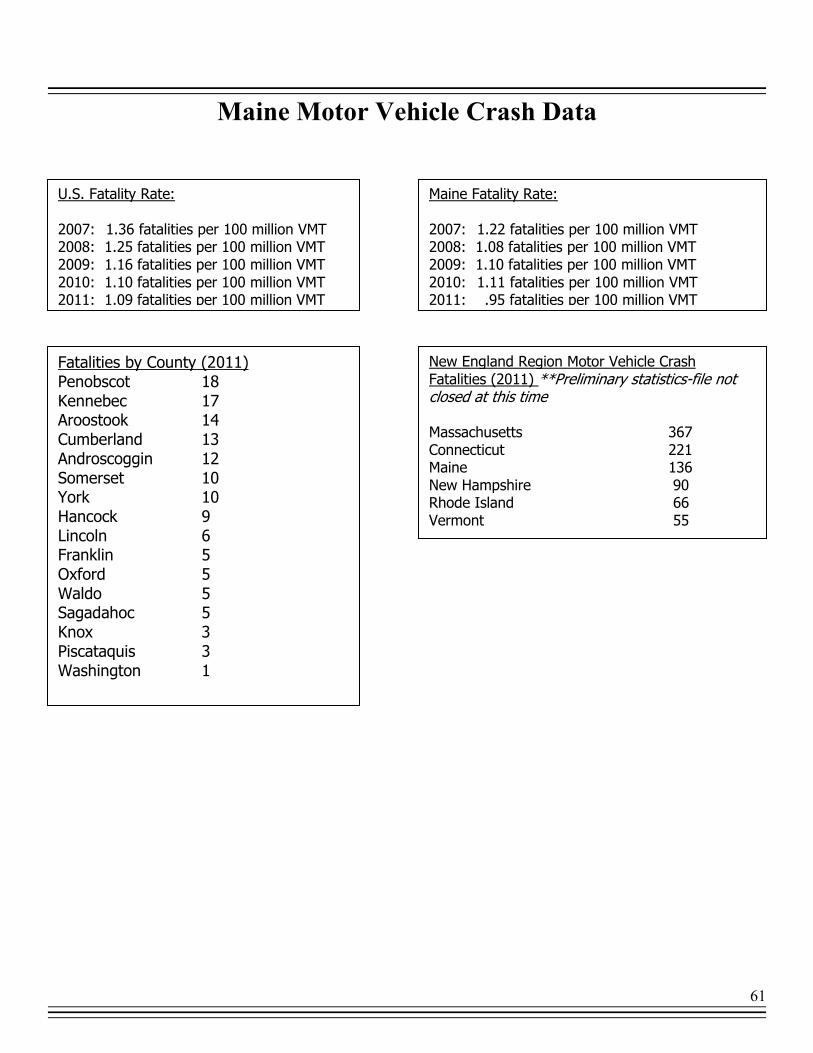
61
Maine Motor Vehicle Crash Data
U.S. Fatality Rate: 2007: 1.36 fatalities per 100 million VMT 2008: 1.25 fatalities per 100 million VMT 2009: 1.16 fatalities per 100 million VMT 2010: 1.10 fatalities per 100 million VMT 2011: 1.09 fatalities per 100 million VMT
Maine Fatality Rate: 2007: 1.22 fatalities per 100 million VMT 2008: 1.08 fatalities per 100 million VMT 2009: 1.10 fatalities per 100 million VMT 2010: 1.11 fatalities per 100 million VMT 2011: .95 fatalities per 100 million VMT
Fatalities by County (2011) Penobscot 18 Kennebec 17 Aroostook 14 Cumberland 13 Androscoggin 12 Somerset 10 York 10 Hancock 9 Lincoln 6 Franklin 5 Oxford 5 Waldo 5 Sagadahoc 5 Knox 3 Piscataquis 3 Washington 1
New England Region Motor Vehicle Crash Fatalities (2011) **Preliminary statistics-file not closed at this time Massachusetts 367 Connecticut 221 Maine 136 New Hampshire 90 Rhode Island 66 Vermont 55

62
Crash Data / Trends
Performance Goals use an average of 2007-2011 data
2002 2003 2004 2005 2006 2007 2008 2009 2010 2011
C-1: Fatalities (Actual) 216 207 194 169 188 183 155 159 161 136
C-2: # of Serious Injuries 1,237 1,091 1,119 1,030 996 978 862 732 775 867
C-3a: Fatality Rate /100 million VMT 1.50 1.40 1.30 1.10 1.20 1.22 1.08 1.10 1.11 0.95
C-3b: Rural Mileage Death Rate 1.56 1.50 1.49 1.51 1.08 1.32 1.23 1.15
C-3c: Urban Mileage Death Rate 0.53 0.19 0.59 0.45 0.64 0.51 0.79 0.43
C-4: # of Unrestrained Passenger Vehicle Occupant Fatalities
72 87 75 64 65 76 45 50 41 40
C-5: # of Fatalities Involving Driver or Motorcycle Operator w/ > .08 BAC
40 56 50 47 46 61 42 44 35 23
C-6: # of Speeding-Related Fatalities
83 79 90 86 61 86 53 61 83 69
C-7: # of Motorcyclist Fatalities 13 20 22 15 23 23 18 23 18 15
C-8: # of Unhelmeted Motorcyclist Fatalities
8 12 11 9 17 15 14 17 10 11
C-9: # of Drivers Age 20 or Younger Involved in Fatal Crashes
21 13 21 16 23 25 19 20 24 22
C-10: # of Pedestrian Fatalities 14 13 10 9 10 10 12 11 12 11
B-1: % Observed Belt Use for Passenger Vehicles - Front Seat Outboard Occupants
59.2% 59.2% 72.3% 75.8% 77.2% 79.8% 83.0% 82.6% 82.0% 81.6%
A-1: # of Seat Belt Citations Issued During Grant-Funded Enforcement Activities
245 0 2,166 2,568 1,725 1,566 5,997 6,650 9,856 3,332
A-2: # of Impaired Driving Arrests Made During Grant-Funded Enforcement Activities
272 321 275 330 301 359 506 545 456 503
A-3: # of Speeding Citations Issued During Grant-Funded Enforcement Activities
0 0 0 0 3,312 2,947 3,963 4,887 11,732 2,382

63
Goal: C-1: Fatalities (Actual)
Baseline
Goal: C-2: # Serious Injuries
Baseline

64
Goal: C-3a: Fatality Rate
Baseline
Goal: C-3b Rural Mileage Death Rate
Baseline

65
Goal: C-3c Urban Mileage Death Rate
Baseline
Urban Mileage Death Rate for Maine
Goal: C-4 Unrestrained Fatalities
Baseline

66
Goal: C-5 Fatalities at .08 or Above
Baseline
Goal: C-6 Speeding Related Fatalities
Baseline

67
Goal: C-7 Motorcycle Fatalities
Baseline
Goal: C-8 Unhelmeted Motorcyclists
Baseline

68
Goal: C-9 Drivers 20 & Under
Baseline
Goal: C-10: Pedestrian Fatalities
Baseline

69
Goal: B-1: Observed Belt Use
Baseline
Goal: A-1: # Seat Belt Citation
Baseline

70
Goal: A-2: Impaired Driving Arrests
Baseline
Goal: A-3: Speeding Citations
Baseline

71
Maine Lane Departure 2001-2010
8000
8500
9000
9500
10000
10500
11000
11500
12000
12500
2001 2002 2003 2004 2005 2006 2007 2008 2009 2010
Num
ber of Cra
shes
Maine Lane Departure Fatalities 2001-2010
100
110
120
130
140
150
2001 2002 2003 2004 2005 2006 2007 2008 2009 2010
Num
ber of Fata
lities

72
Illegal/Unsafe Speed Crashes
4000
4500
5000
5500
6000
6500
7000
7500
2001 2002 2003 2004 2005 2006 2007 2008 2009 2010
Num
ber of Cra
shes
Illegal/Unsafe Speed Fatalities
50
55
60
65
70
75
80
85
90
2001 2002 2003 2004 2005 2006 2007 2008 2009 2010
Num
ber of Fata
lities

73
Distracted Driving Crashes
9000
10000
11000
12000
13000
14000
15000
2001 2002 2003 2004 2005 2006 2007 2008 2009 2010
Num
ber of Cra
shes
Distracted Driving Fatalities
20
30
40
50
60
70
80
90
2001 2002 2003 2004 2005 2006 2007 2008 2009 2010
Num
ber of Fata
lities

74
Mature Driver Crashes (65+)
4200
4400
4600
4800
5000
5200
5400
2001 2002 2003 2004 2005 2006 2007 2008 2009 2010
Number of Crashes
Mature Fatalities (65+)
10
20
30
40
50
60
70
2001 2002 2003 2004 2005 2006 2007 2008 2009 2010
Number of Fatalities
Source: Maine Strategic Highway Safety Plan

75
Appendix B:
Driver Awareness Surveys in Maine, July 2012
Night Seat Belt Use in Maine, June 2012
Seatbelt Use Final Report 2012 (separate report)

76
Driver Awareness Surveys in Maine, July 2012
Prepared for:
The University of Southern Maine Portland, Maine
Prepared by:
William A. Leaf and Neil K. Chaudhary
Preusser Research Group, Inc. Trumbull, Connecticut
September 2012

9/28/2012 - 1 -
Introduction Maine is one of 22 States to have upgraded their seat belt law to primary enforcement since 1997. As of July 2012, 32 States, the District of Columbia, and Puerto Rico had primary enforcement laws. Having a primary seat belt law allows law enforcement to issue a belt citation upon observation of a seat belt violation alone. With secondary seat belt laws, police must first observe another violation (e.g. speeding) before being able to issue a seat belt citation. The primary belt law in Maine went into effect September 20, 2007, with an educational grace period to April 1, 2008. In 2008, NHTSA conducted a three-part evaluation of the implementation and effects of the new primary belt law (Chaudhary, Tison, and Casanova, 2010). In 2009, 2010, and 2011, an additional survey of driver knowledge was conducted (Leaf and Chaudhary, 2009; Leaf and Chaudhary, 2010; Leaf and Chaudhary, 2011). Because the driver knowledge measurement described in this report is a continuation of the work reported previously, this document quotes liberally from those reports. Primary laws have been associated with a higher percentage of observed seat belt use (e.g. Ulmer et al., 1995). In 2008, States with primary laws had an average observed seat belt usage rate about 9 percentage points higher than those with secondary laws (based on NHTSA, 2009). Seat belt use saves lives. It is estimated that nearly half of passenger vehicle fatalities involving unbelted occupants would be prevented if they had been properly restrained. In practice, changes from secondary to primary belt laws have led, along with greater belt use, to fewer traffic fatalities. For example, in late 1999 and early 2000, Alabama, Michigan, and New Jersey changed their laws from secondary to primary. Chaudhary (in review) reported that these laws increased seat belt use among fatally injured front seat occupants of motor vehicles and also decreased the number of fatalities. Similar effects were seen with other States as they passed belt use laws – belt use increased but fatalities did not drop as much as expected. One explanation was that the drivers who were buckling up were drivers who were already relatively safe drivers and the risky drivers, more likely to be involved in a crash, remained unrestrained. Thus, those most in need of seat belts were least likely to buckle up. Preusser, Williams, and Lund (1986) showed support for this contention. In their study, researchers went to bars in New York State several months after the New York seat belt law went into effect. Seat belt observations occurring on roadways near taverns showed that 43 percent of drivers during the day were belted but that observed belt use dropped to 36 percent at night, at the same location. Furthermore, drivers most likely to be drinking (and therefore constituted a higher risk) had even lower belt use. Indeed, drivers arriving or leaving bar parking lots at night had a 24 percent belt use rate. One of the key features, of course, of a primary belt law is that the general public is aware of the law and perceives a high probability of being stopped and ticketed for not being restrained. Chaudhary et al. (2010) conducted three waves of surveys of drivers at Maine Bureau of Motor Vehicles (BMV) offices. They showed that the public was aware of the main feature of the primary belt law, i.e., that they can be stopped and ticketed simply for not wearing their seat belts. Knowledge remained high in June 2009, 2010, and 2011 (Leaf and Chaudhary, 2009; Leaf and Chaudhary, 2010; Leaf and Chaudhary, 2011). This report repeats the Chaudhary et al. (2010) methodology to examine the evolution of driver knowledge and attitudes a year after they were last assessed, 50 months after Maine’s primary belt law began to be enforced.

9/28/2012 - 2 -
Some results from the earlier reports are included here for perspective. The survey used in this iteration, as the ones in 2010 and 2011, was modified to extend driver knowledge measurement to the topics of drinking and driving, speeding, and cell phone use. Method Surveys were conducted in eight Bureau of Motor Vehicle (BMV) offices across the state of Maine: Augusta, Bangor, Ellsworth, Kennebunk, Mexico, Portland, Rockland, and South Portland. The offices were selected to provide a representative sampling of Maine drivers. Surveys were conducted from June 28, 2012, through July 17, 2012 (most from July 9 – July 17), shortly after the Nationwide Click It or Ticket campaign, which was conducted around the Memorial Day holiday. The methods were identical to those in Chaudhary et al. (2010). Each individual completing a survey was required to be a licensed driver in the state of Maine. While individuals were waiting to be called at a station, they were approached and asked if they held a valid Maine license. Once qualified, they were asked to complete the anonymous survey. The survey consisted of 17 questions on one side of a single sheet of paper. A copy of the survey is included as Appendix A. Surveys prior to 2010 were entirely about the primary seat belt law, new at those times. The last three surveys, including the current one, began with driver background questions: age, sex, home zip code, and amount of driving and primary vehicle type. In addition there were:
• 4 questions on seat belt use, enforcement, and enforcement publicity;
• 3 questions on drinking and driving and enforcement;
• 3 questions on speeding and enforcement; and
• 2 questions on cell phone use. The scope of the current survey reflected major topics of emphasis within the Maine highway safety office.
Results
Demographics A total of 1,602 driver surveys were completed across the eight BMV offices. Half (49.7 percent) of drivers were male, half (50.3 percent) female. Two percent were under 18 years of age; 13 percent were 18-25; 15 percent were 26-34; 27 percent were 35-49; 20 percent were 50-59; and 23 percent were age 60 or older. Eighteen percent drove less than 5000 miles/year; 28 percent drove 5000-10,000 miles/year; 28 percent drove 10,001-15,000 miles/year; and 26 percent drove more than 15,000 miles/year. Fifty-one percent drove passenger cars; 17 percent drove pickup trucks; 19 percent drove SUVs; 5 percent drove minivans; 1 percent drove full-size vans; and 6 percent drove other or multiple kinds of vehicles. These numbers are virtually identical to those in the 2011 survey sample.
Reported Belt Use Self-reported belt use increased steadily from the three measurements in 2008 to July 2011 and is nearly unchanged from 2011 to 2012. The distribution of July 2012 and July 2011 belt use self-reports is given in Table 1; comparative values over the seven waves are shown in Figure 1. Note that the actual belt use,

9/28/2012 - 3 -
measured at 120 sites statewide, was nearly constant at 81 percent in June 2008 and June 2009 and 82 percent in June 2010 and June 2011; with the new observational survey and 127 sites statewide, June 2012 observed belt use was 84 percent.
Table 1. Driver reports: How often they use seat belts
July 2011 July 2012 How often wear belts?
Number Percent Number Percent
Always 1,395 84.1% 1,329 83.0%
Nearly always 149 9.0% 160 10.0%
Sometimes 72 4.3% 73 4.6%
Seldom 26 1.6% 19 1.2%
Never 16 1.0% 20 1.2%
TOTAL N 1,658 1,601
70%
15%10%
4% 2%
71%
16%
8%4% 2%
72%
16%
8%3% 2%
77%
14%
5%3% 1%
81%
11%
5%2% 1%
84%
9%
4%2% 1%
83%
10%
5%1% 1%
0%
10%
20%
30%
40%
50%
60%
70%
80%
90%
Always Nearly always Sometimes Seldom Never
Feb-08
Apr-08
Jun-08
Jun-09
Jul-10
Jul-11
Jul-12
Figure 1. How often do you use seat belts? Drivers were asked how their current seat belt use compared to their belt use in recent years. This year’s and last year’s results are shown in Table 2 and, along with the preceding six waves, in Figure 2. About 60 percent of drivers in the first four waves indicated that their belt use was unchanged; this increased to 64 percent in 2010, 68 percent in 2011, and 69 percent in 2012. These increases were nearly matched by decreases in the “more often” responses, about 17 percent in the first four waves, 14 percent in 2010, and just 11 percent in 2011 and 2012. The consistency of these reports is independent of actual belt use, which rose about seven percent over the three waves in 2008 before stabilizing in June 2008 through June 2011 and rising again in June 2012. About one-fourth to one-third of drivers report increased belt use even though the overall belt use numbers are quite steady. Wave after wave, only about 2 percent of drivers admit to wearing belts less often.

9/28/2012 - 4 -
Table 2. Driver reports: Belt use compared to “last couple of years”
July 2011 July 2012 How often wear belts?
Number Percent Number Percent
Much less often 19 1.2% 14 0.9%
Less often 6 0.4% 18 1.1%
About the same 1,109 68.3% 1,093 69.4%
More often 176 10.8% 177 11.2%
Much more often 313 19.3% 274 17.4%
TOTAL N 1,623 1,576
1% 1%
61%
18% 19%
1% 1%
62%
17%19%
1% 2%
59%
17%21%
1% 1%
61%
16%
21%
1% 1%
64%
14%
20%
1% 0%
68%
11%
19%
1% 1%
69%
11%
17%
0%
10%
20%
30%
40%
50%
60%
70%
80%
Much less often Less often About the same More often Much more often
Feb-08
Apr-08
Jun-08
Jun-09
Jul-10
Jul-11
Jul-12
Figure 2. Compared to the last couple of years, do you now wear your seat belt … Drivers also rated what they thought their chances were of getting a seat belt ticket if they drove without wearing their seat belt. More than one-third (38.9 percent) felt that they would be ticketed “always” or “nearly always” if they were not properly buckled up. This is higher than 2010 and 2011 but down significantly from June 2008 and June 2009, when 46 percent and 47 percent, respectively, of drivers thought so. Compared with June 2011, fewer drivers thought they would be ticketed “sometimes” (40 percent vs. 44 percent) and about the same number thought they would be ticketed “seldom” (16 percent vs. 17 percent) or “never” (5 percent both years).

9/28/2012 - 5 -
Table 3. Driver reports: Chances of getting a ticket if driving unbelted …
July 2011 July 2012 Chances of getting a ticket?
Number Percent Number Percent
Always 312 19.0% 360 22.7%
Nearly always 248 15.1% 257 16.2%
Sometimes 726 44.1% 630 39.7%
Seldom 277 16.8% 256 16.1%
Never 83 5.0% 83 5.2%
TOTAL N 1,646 1,586
Awareness of Enforcement and Media Seat Belt Efforts The next survey questions asked drivers what they had seen or heard recently about using seat belts. Note that these surveys were administered about six weeks after the annual CIOT program, which emphasizes media messages and highly visible enforcement. Survey timing was nearly identical in 2010 and 2011, but awareness dropped in 2011 before rebounding somewhat in 2012. The first question asked, “In the past 60 days, have you seen or heard about extra enforcement where police were looking at seat belt use?” Nearly 3 in 5 (58 percent) said they had, compared with just 53 percent in 2011 and 65 percent in 2010. Those who had indicated a general awareness were asked to check where they had seen or heard something and what message theme(s) they recalled. The results are summarized in Tables 4 and 5 below. 2011 values are also presented for comparison. Television was the most cited medium, by 35 percent of all respondents, followed by radio (20 percent), newspaper (11 percent), police checkpoints (5 percent), posters (3 percent), and web sites (1 percent). “Other” medium was selected by 8 percent of the respondents, nearly all of them explaining they heard about it from someone else (e.g., friend, people, or word of mouth).
Table 4. Where did they see or hear about extra seat belt enforcement (check all that apply)
July 2011 July 2012 Where see/hear about seat belts *
Number Number Number Percent
Newspaper 182 11.0% 174 10.9%
Radio 295 17.9% 325 20.3%
Television 435 26.3% 558 34.8%
Poster 59 3.6% 49 3.1%
Web site 24 1.5% 27 1.7%
Police checkpoint 99 6.0% 83 5.2%
Other 124 7.5% 130 8.1%
TOTAL N RESPONDENTS 1,661 1,602
* Respondents could check more than one; percents do not need to add to 100%.

9/28/2012 - 6 -
The most mentioned theme of the messages, by 46 percent of the respondents, was Click It or Ticket, which was the national theme that had been emphasized around Memorial Day. Seventeen percent identified Buckle Up.
No Excuses! as the theme they had heard. Smaller numbers recognized Drive sober or get pulled over, a new campaign not yet used in Maine (4 percent) and Survive your drive (4 percent). Three percent checked “other”, but no more than one or two respondents mentioned any specific theme.
Table 5. If yes, what did it say?
July 2011 July 2012 What did the messages say?
Number Percent Number Percent
Click it or ticket 642 38.9% 739 46.1%
Drive sober or get pulled over 114 6.9% 67 4.2%
Buckle up. No excuses! 276 16.7% 279 17.4%
Survive your drive 52 3.1% 71 4.4%
Other 63 3.8% 46 2.9%
TOTAL N RESPONDENTS 1,652 1,602
Self-Reported Belt Use and Other Factors The surveys provide the opportunity to examine belt use, as reported by the respondents, as related to demographic characteristics and other factors in the surveys. These are the subjects of Tables 6 and 7. Males report lower belt use than females, consistent with belt use observations. Drivers ages 18-25 reported lowest belt use, followed by drivers ages 26-39. Drivers under 18, though infrequent in the surveys, report higher belt use, followed by drivers ages 40-49. Drivers ages 50 and higher report the highest belt use. Drivers of pickup trucks are less likely to report buckling up than drivers of other vehicle types, consistent with results seen in actual belt use surveys. The few drivers who report using their seat belts less or much less than recently are very unlikely to report buckling up compared to others. Drivers who report “about the same” or “much more often” are most likely to buckle up. Drivers who report buckling up “more often” are, oddly enough, relatively unlikely to report buckling up. This pattern was also seen in 2010 and 2011. There are no significant differences in reported seat belt use between different miles driven categories. Drivers in the Kennebunk BMV office were most likely to report always buckling up, and drivers in the Bangor office least likely.

9/28/2012 - 7 -
Table 6. Demographics and self-reported belt use
Self-Reported Seat Belt Use (percent)
Factor Total N Always
Nearly
always Sometimes Seldom Never
Sex ***
Male
Female
789
796
78.7%
87.4%
12.7%
7.5%
4.8%
4.0%
2.2%
0.3%
1.6%
0.8%
Age ***
Under 18
18-25
26-34
35-49
50-59
60 or older
29
214
236
437
318
363
79.3%
67.8%
73.7%
86.3%
87.1%
90.6%
13.8%
15.9%
15.7%
6.2%
8.8%
8.3%
0.0%
12.1%
5.9%
4.6%
3.1%
0.8%
3.4%
3.7%
2.5%
0.7%
0.0%
0.3%
3.4%
0.5%
2.1%
2.3%
0.9%
0.0%
Miles driven, last year
Less than 5000
5000-10,000
10,001-15,000
More than 15,000
292
446
444
413
86.3%
82.7%
82.4%
81.4%
9.2%
10.1%
9.9%
10.7%
3.4%
4.7%
4.5%
5.3%
0.7%
1.3%
1.4%
1.2%
0.3%
1.1%
1.8%
1.5%
Vehicle driven most often ***
Passenger car
Pickup truck
SUV
Minivan
Full-sized van
Other
817
277
300
85
21
101
85.9%
67.5%
88.0%
90.6%
90.5%
79.2%
9.4%
17.7%
6.3%
4.7%
4.8%
9.9%
3.7%
7.9%
3.3%
1.2%
4.8%
8.9%
0.4%
3.6%
1.0%
2.4%
0.0%
1.0%
0.6%
3.2%
1.3%
1.2%
0.0%
1.0%
How often use belt now vs. recent years ***
Much less often
Less often
About the same
More often
Much more often
14
18
1,093
177
274
64.3%
33.3%
87.6%
52.0%
87.6%
7.1%
11.1%
5.7%
35.6%
11.7%
0.0%
27.8%
4.0%
11.9%
0.7%
0.0%
27.8%
1.2%
0.6%
0.0%
28.6%
0.0%
1.5%
0.0%
0.0%
BMV Office **
Augusta
Bangor
Ellsworth
Kennebunk
Mexico
Portland
Rockland
South Portland
216
201
214
200
144
224
186
216
82.4%
75.1%
82.7%
91.0%
86.1%
84.4%
82.8%
80.6%
9.7%
10.0%
9.3%
7.0%
9.0%
9.4%
13.4%
12.0%
4.2%
10.9%
4.2%
0.5%
3.5%
4.0%
3.8%
5.1%
2.8%
1.5%
0.9%
0.5%
1.4%
1.3%
0.0%
0.9%
0.9%
2.5%
2.8%
1.0%
0.0%
0.9%
0.0%
1.4%
** p < .01; *** p < .001
Drivers who think the chances of being ticketed if unbelted are “always” or “never” are more likely to report
always wearing their belts, followed by drivers who believe the chance of being ticketed is “nearly always” or
“sometimes”. Drivers believing there is “seldom” a chance of being ticketed are least likely to report “always”
using their belts and most likely to report “seldom” or “never” wearing their belts.

9/28/2012 - 8 -
People who were aware of extra seat belt enforcement within the 60 days before the survey or who recognized
Click It or Ticket were somewhat less likely to report always using their seat belts and somewhat more likely to
report the lower levels of belt use. It may be that people less likely to wear their belts are more sensitive to
noticing such campaigns, and it is not clear how these differences relate to the actual effectiveness of the
campaign. These differences were of marginal statistical significance.
Table 7. Awareness of seat belt campaigns and self-reported belt use
Self-Reported Seat Belt Use (percent)
Factor Total N Always
Nearly
always Sometimes Seldom Never
Chances of getting ticket if unbelted ***
Always
Nearly always
Sometimes
Seldom
Never
360
257
630
256
83
92.5%
80.2%
81.3%
72.3%
94.0%
3.6%
14.4%
12.9%
10.9%
1.2%
2.8%
5.1%
3.7%
9.4%
3.6%
0.8%
0.0%
1.3%
3.1%
0.0%
0.3%
0.4%
1.0%
4.3%
1.2%
Past 60 days, seen/heard about extra seat
belt enforcement
Yes
No
934
667
80.8%
86.1%
10.8%
8.8%
5.4%
3.4%
1.5%
0.7%
1.5%
0.9%
Recognized Click It or Ticket
Yes
No
739
862
80.6%
85.0%
10.6%
9.5%
5.5%
3.7%
1.6%
0.8%
1.6%
0.9%
*** p < .001
Drinking and Driving Three questions addressed the issue of drinking and driving. The first asked how often within the last 60 days the respondent had driven within two hours after drinking alcoholic beverages. Seven out of eight (86.0 percent) report never doing so, 7.2 percent report drinking and driving once or twice, and 6.8 percent report doing so three or more times. The results are summarized in Table 8 below. Females are more likely than males to never drive after drinking (91 percent vs. 81 percent). Only one driver under age 18 (out of 28) reports driving after drinking. Drivers 18-25 are most likely to report driving after drinking, followed by those 26-34; drivers 35 and over were least likely to drive after drinking. Also, drivers who report always wearing seat belts are more likely to never drive after drinking (89 percent) than drivers who report less belt use (83 percent). Drivers who report driving the least (< 5000 miles/year) more often never drove after drinking (96 percent) than drivers who drove more miles (82-85 percent). There were no differences in reported driving after drinking by type of vehicle driven (not shown). Drivers in the Mexico BMV office most often never drove after drinking (95 percent); the rate of never driving after drinking was relatively uniform in the other offices, ranging from 83 percent to 87 percent (not shown).

9/28/2012 - 9 -
Table 8. Self-reported driving within two hours after drinking in the last 60 days
Frequency, drive after drinking in 60
days (percent) Factor Total N
Never 1-2 times 3 or more
Total 1,554 86.0% 7.2% 6.8%
Sex ***
Male
Female
763
777
81.4%
90.7%
8.4%
5.9%
10.2%
3.3%
Age **
Less than 18
18 – 25
26 – 34
35 – 49
50 – 59
60 or older
28
211
228
428
308
347
96.4%
75.8%
83.3%
86.7%
88.0%
90.2%
3.6%
11.8%
9.6%
7.0%
5.8%
4.6%
0.0%
12.3%
7.0%
6.3%
6.2%
5.2%
Miles driven, last year ***
Less than 5000
5000-10,000
10,001-15,000
More than 15,000
280
431
436
401
96.1%
85.4%
82.1%
84.0%
3.2%
7.7%
10.3%
6.0%
0.7%
7.0%
7.6%
10.0%
Self-Reported Seat Belt Use ***
Always
All other
1,294
260
87.2%
79.6%
7.2%
7.3%
5.6%
13.1%
* p < .05; ** p < .01; *** p < .001
Overall, 47 percent of respondents felt that the likelihood of being arrested if driving impaired was “always” or “nearly always”. Almost half (48 percent) felt they would be arrested “sometimes”. Few thought impaired drivers had very low chances of being apprehended; just 4 percent answered “seldom”, 1 percent “never”. Details are given in Table 9. Nearly seven in ten drivers (69 percent) report seeing or hearing about impaired driving enforcement within the last 60 days. Those drivers felt the likelihood of arrest for impaired driving was slightly higher than did the drivers who had not seen recent enforcement messages, though the difference was not statistically significant. In general, females felt the odds of arrest for impaired driving were higher than did males, and young drivers felt the odds were higher than did older drivers. Drivers who drove the fewest miles tended to believe arrest for DWI is more likely. There were no differences by vehicle type most frequently driven or self-reported levels of seat belt use (all not shown).

9/28/2012 - 10 -
Table 9. Awareness of impaired driving enforcement and perceived likelihood of arrest
Perceived likelihood of arrest if driving impaired
(percent) Factor Total N
Always Nearly
always Sometimes Seldom Never
Total 1,597 21.3% 25.7% 47.8% 4.3% 1.0%
Past 60 days, seen/heard about extra drink-
driving enforcement
Yes
No
1,108
482
22.1%
19.3%
26.7%
23.2%
46.8%
50.2%
3.8%
5.4%
0.6%
1.9%
Speeding Overall, 8 in 9 drivers admitted driving more than 35 mph on roads with a 30 mph speed limit at least occasionally. Four percent said they did it “always”, and 10 percent said they did it “nearly always”. Most (42 percent and 32 percent) reported doing it “sometimes” or “seldom”. Just 12 percent said they “never” did so. Though males admitted going over 35 mph slightly more than females, the difference was not significant. Drivers ages 18-35 were more likely to speed than older drivers and drivers under 18; drivers age 60 and older were least likely to speed. Drivers who drove less than 5000 miles/year were more likely to speed “seldom” or “never”. Self-reported speeding was not related to type of vehicle. Drivers who always used their seat belts were less likely to speed than other drivers. The details are shown in Table 10.

9/28/2012 - 11 -
Table 10. Self-reported driving more than 5 mph over 30 mph speed limit
How often drive over 35 in 30 mph zone (percent)
Factor Total N Always
Nearly
always Sometimes Seldom Never
Total 1,597 3.7% 10.1% 42.4% 32.2% 11.6%
Sex
Male
Female
787
794
3.7%
3.8%
11.7%
8.7%
41.7%
43.1%
31.1%
33.0%
11.8%
11.5%
Age ***
Under 18
18-25
26-34
35-49
50-59
60 or older
29
214
235
437
317
361
3.4%
7.0%
4.3%
4.1%
2.2%
1.9%
13.8%
19.2%
10.2%
10.5%
7.6%
6.4%
37.9%
39.7%
43.4%
45.5%
42.6%
40.2%
27.6%
26.6%
33.6%
28.6%
34.4%
36.8%
17.2%
7.5%
8.5%
11.2%
13.2%
14.7%
Miles driven, last year ***
Less than 5000
5000-10,000
10,001-15,000
More than 15,000
291
445
443
413
2.4%
4.3%
4.1%
3.6%
10.3%
9.0%
9.3%
12.3%
30.6%
44.0%
43.1%
47.7%
37.1%
29.9%
36.3%
26.9%
19.6%
12.8%
7.2%
9.4%
Vehicle driven most often
Passenger car
Pickup truck
SUV
Minivan
Full-sized van
Other
815
277
300
85
21
99
3.7%
5.1%
2.7%
0.0%
4.8%
6.1%
10.9%
9.0%
10.7%
9.4%
4.8%
7.1%
40.7%
46.9%
43.3%
36.5%
38.1%
46.5%
33.7%
29.6%
33.0%
32.9%
33.3%
23.2%
10.9%
9.4%
10.3%
21.2%
19.0%
17.2%
Self-Reported Seat Belt Use ***
Always
All other
1,325
272
3.4%
5.1%
8.5%
18.0%
41.5%
46.7%
33.6%
25.4%
13.0%
4.8%
*** p < .001
Drivers were very ready to believe speeding results in tickets. For driving over the speed limit, 11 percent of drivers reported believing the offense would “always” result in a ticket, and another 22 percent felt it would “nearly always” produce a ticket. Just 1 percent felt it would “never” result in a ticket. Drivers who more often drive over the speed limit were less likely to believe such behavior results in tickets; drivers who report never driving over the speed limit were most likely to believe it would “always” result in a ticket. About half of all drivers (53 percent) reported seeing or hearing about heightened police enforcement of speeding laws. They were much more likely to also report high likelihood of being ticketed for exceeding the speed limit. Details are show in Table 11.

9/28/2012 - 12 -
Table 11. Awareness of speeding enforcement and perceived likelihood of arrest
Chances of getting ticket if drive over speed limit
(percent) Factor Total N
Always Nearly
always Sometimes Seldom Never
Total 1,589 10.5% 22.0% 57.9% 8.6% 0.9%
How often drive over 35 in 30 mph zone ***
Always
Nearly always
Sometimes
Seldom
Never
58
161
676
514
180
10.3%
2.5%
8.3%
8.9%
30.6%
13.8%
17.4%
18.2%
27.8%
26.7%
53.4%
61.5%
65.5%
55.8%
33.3%
19.0%
18.6%
7.4%
6.8%
6.1%
3.4%
0.0%
0.6%
0.6%
3.3%
Past 60 days, seen/heard about extra
speeding enforcement ***
Yes
No
841
743
13.0%
7.9%
26.2%
17.4%
54.3%
61.9%
5.6%
12.0%
1.0%
0.8%
*** p < .001
Hand-held cell phone calling and texting The use of hand-held cell phones for calling and for texting is under intense scrutiny at the present time. Cell phone use has been shown to be roughly equivalent to alcohol-impaired driving in increased crash involvement, and texting involves more extreme distraction. Though both are demonstrably risky behaviors, they are popular activities for Maine drivers. Seventy-one percent have made hand-held cell phone calls, and 27 percent have texted while driving. These numbers are virtually unchanged from 2010 and 2011. The full distributions of responses from 2011 and 2012 are shown in Table 12.
Table 12. Driver reports: Hand-held cell phone calling and texting while driving
Use hand-held cell phone Text while driving
July 2011 July 2012 July 2011 July 2012
Always 1.7% 2.2% 1.3% 0.7%
Nearly always 5.3% 4.1% 1.9% 1.0%
Sometimes 33.8% 33.8% 9.1% 9.7%
Seldom 31.5% 31.2% 15.4% 15.3%
Never 27.7% 28.7% 72.4% 73.3%
TOTAL N 1,652 1,594 1,652 1,594
Drivers who text while driving tend to be the same ones who make and receive hand-held cell phone calls while driving. Of those who “always” or “nearly always” make hand-held cell calls, 56 percent also text “always” or “nearly always”; 22 percent of those who make hand-held calls “sometimes” also text “always” or “nearly always”. Ninety-eight percent of those who “never” make hand-held cell phone calls also “never” text.

9/28/2012 - 13 -
As shown in Table 13, there was no difference in hand-held cell phone use by sex. With the exception of under-18 drivers, hand-held cell phone use was greatest for drivers ages 18-34 and dropped off with increasing age. Under-18 drivers “always” or “nearly always” used hand-held cell phones as much as anyone but also had very high rates of “never” using the devices. Hand-held cell phone use was least for drivers with less than 5000 miles driven last year and increased with mileage; it’s important to emphasize that the measure is of the rate of phone use, not the total number of calls. Hand-held cell phone use was generally consistent across vehicle types, unlike 2011, when full-size van drivers were more likely to use cell phones. Drivers who always wore seat belts used hand-held cell phones much less than drivers who used their seat belts less often.
Table 13. Self-reported talking on hand-held cell phone when driving
How often talk on hand-held cell phone when driving
(percent) Factor Total N
Always Nearly
always Sometimes Seldom Never
Total 1,594 2.2% 4.1% 33.8% 31.2% 28.7%
Sex
Male
Female
783
795
2.8%
1.6%
4.5%
3.8%
33.8%
34.3%
31.5%
31.1%
27.3%
29.2%
Age ***
Under 18
18-25
26-34
35-49
50-59
60 or older
28
214
236
436
316
360
0.0%
4.7%
2.5%
3.4%
0.6%
0.6%
0.0%
6.5%
8.9%
4.6%
3.2%
0.0%
21.4%
45.3%
37.3%
41.7%
32.9%
16.9%
17.9%
24.8%
37.3%
29.6%
36.4%
29.4%
60.7%
18.7%
14.0%
20.6%
26.9%
53.1%
Miles driven, last year ***
Less than 5000
5000-10,000
10,001-15,000
More than 15,000
290
444
442
412
2.1%
1.4%
1.1%
4.4%
1.4%
2.7%
6.8%
4.6%
19.3%
33.1%
38.9%
39.3%
24.5%
31.5%
31.7%
35.0%
52.8%
31.3%
21.5%
16.7%
Vehicle driven most often
Passenger car
Pickup truck
SUV
Minivan
Full-sized van
Other
814
276
298
84
21
101
1.7%
4.7%
2.0%
1.2%
0.0%
1.0%
4.2%
3.3%
5.0%
4.8%
4.8%
2.0%
33.7%
35.9%
36.2%
28.6%
19.0%
29.7%
28.9%
31.5%
33.2%
40.5%
47.6%
32.7%
31.6%
24.6%
23.5%
25.0%
28.6%
34.7%
Self-Reported Seat Belt Use ***
Always
All other
1,322
272
1.2%
7.0%
3.6%
6.3%
31.7%
44.1%
32.5%
25.4%
31.0%
17.3%
*** p < .001
Patterns were similar for texting, though at lower levels of activity than hand-held cell phone use (not shown). Texting did not vary by sex or by type of vehicle. Texting was at highest levels for drivers ages 18-25 and gradually decreased with age. Most drivers under 18 never texted, similar to drivers in their 40s and older. The rate of texting became more frequent as miles driven increased. Finally, texting was less frequent for drivers who always wore seat belts.

9/28/2012 - 14 -
Discussion In eight Maine Bureau of Motor Vehicles offices in July 2012, 1,602 drivers with valid Maine driver’s licenses completed one-page surveys. Drivers were surveyed about their knowledge of recent campaigns to increase awareness and compliance as well as their own attitudes and belt use. They were also surveyed about drinking and driving, speeding, and texting and calling using hand-held cell phones. This survey is an extension of six earlier surveys. The first four looked exclusively at seat belt laws, campaigns, and use; the fifth and sixth, in 2010 and 2011, had expanded scope identical to the current survey. Two surveys were conducted in 2008 just before and after April 1, 2008, which was the time that Maine’s primary seat belt law first began to be enforced. The third of those surveys was done in early June 2008, after the national CIOT enforcement and media campaign, and the fourth was done in early June 2009, also just after the CIOT emphasis. The fifth survey was done in early July 2010, about 6 weeks after CIOT, as were the 2011 survey and the current survey in 2012. Overall seat belt use in passenger vehicles, as measured by Maine in NHTSA-approved observation designs, was nearly unchanged over the first three years: 83.0 percent in 2008, 82.6 percent in 2009, 82.0 percent in 2010, and 81.6 percent in 2011, and (with a new survey design) rose to 84.4 percent in 2012. Most drivers reported high personal use of seat belts (83 percent “always” and 10 percent “nearly always”), consistent with actual statewide use. Although actual statewide belt use was nearly stable since 2008, drivers regularly reported using their seatbelts more than the year before: for the first five waves (three in 2008, one in 2009, and one in 2010), about 61 percent of drivers reported “about the same” belt use as in the preceding year, about 16 percent reported “more often”, and about 20 percent reported “much more often.” In 2011, the figures were 68 percent, 11 percent, and 19 percent, respectively. This year, figures were 69 percent, 11 percent, and 17 percent, respectively. While some of this optimism corresponds to real improvement – with Maine’s adoption of its primary law there was an increase of about 7 percentage points from February 2008 to June 2008 – this pattern of reported improvement was virtually identical across the seven waves, suggesting more of a persistent positive outlook than a discerning view of reality. Nearly half of the drivers (46 percent) were aware of the CIOT campaign completed several weeks before the surveys were administered, up from 39 percent in 2011, suggesting the campaign may have been more visible this year. In addition, 17 percent recognized the Buckle Up. No Excuses! slogan that has been used for several years to help publicize the primary enforcement law. Differences in reported seat belt use reinforced observed belt use differences and offered interesting additional patterns. By their own reports, males buckle up less, as do drivers ages 18-39, and pickup drivers. Drivers who buckle up least are those who perceive no enforcement and no chance of being ticketed. Awareness of seat belt enforcement efforts or campaigns such as CIOT is not a reliable predictor of belt use. The current survey repeated the broader focus of the 2010 and 2011 surveys by looking at impaired driving, speeding, and cell phone use. Very few drivers report driving within two hours after drinking alcohol, though males and younger drivers more often did this. It should be noted that this behavior, as described, is not illegal. While driving with any alcohol in one’s system increases crash risk, a single drink 1-2 hours before driving is likely to produce a BAC of .02 g/dl or less, well below the legal per se limit (.08). Questions which tap into the frequency of legally impaired

9/28/2012 - 15 -
driving, opinions about it, and expectations of the risk of arrest, could be a useful extension of these more general questions. There were three questions in the survey about the perceived likelihood of arrest given particular behaviors. Answers were positively correlated, with intercorrelations between .425 and .465, suggesting a general view of the level of police enforcement of traffic laws, not unreasonable. However, taken literally, the responses to those questions could be characterized as wildly unrealistic. It is not the case that always or nearly always: 1) if one drives without a seat belt one will be issued a ticket (answered by 39 percent of drivers); 2) if one drives after having drunk an unspecified amount of alcohol one will be arrested (answered by 68 percent); or 3) if one drives at any speed over the speed limit one will be ticketed (answered by 33 percent). It would be very interesting to try to understand what people think they are responding to, and what they believe, in order to better understand the relationship between enforcement, perceived enforcement, and behavior. Overall, the results of these surveys are useful measures of the effectiveness of seat belt use campaigns in reaching the public. They also provide detailed information about characteristics of people who use seat belts regularly and those who don’t and may point to ways to continue to increase the public’s use of seat belts. Expanding them to include other key traffic safety issues such as alcohol, speed, and distracted driving, provides information about attitudes and behaviors in these areas and allows for the unique study of common patterns within individuals.

9/28/2012 - 16 -
References Chaudhary, NK (in review). Evaluation of the Alabama, Michigan and New Jersey Safety Belt Law Change to
Primary Enforcement. Chaudhary, NK, Tison, J, & Casanova, TM (2010). Evaluation of Maine's Safety Belt Law Change from
Secondary to Primary Enforcement. Final Report, National Highway Traffic Safety Administration, Washington, DC. DOT HS 811 259.
Chaudhary, NK, Tison, J, & Casanova, TM (2010). The effects of Maine’s Change to Primary Seat Belt Law on
Seat Belt Use and Public Perception and Awareness. Traffic Injury Prevention, 11:165-172. Leaf, WA & Chaudhary, NK (2009). Driver Awareness Surveys in Maine, June 2009. Report to the University
of Southern Maine, November, 2009. Leaf, WA & Chaudhary, NK (2010). Driver Awareness Surveys in Maine, July 2010. Report to the University
of Southern Maine, September, 2010. Leaf, WA & Chaudhary, NK (2010). Driver Awareness Surveys in Maine, July 2011. Report to the University
of Southern Maine, September, 2011. NHTSA (2009). Traffic Safety Facts: Occupant Protection, 2008 Data, DOT HS 811 160. Preusser, DF, Williams, AF, & Lund, AK (1986). Seat belt use among New York bar patrons.
Journal of public health policy, 7, 470-9. Ulmer, RG, Preusser, CW, & Preusser, DF (1995). Evaluation of California’s safety belt law change from
secondary to primary enforcement. Journal of Safety Research, 26 , 213-220.

9/28/2012 - 17 -
Appendix A The survey is given in its entirety on the next page.

9/28/2012 - 18 -
This Driver Licensing Office is assisting in a vehicle safety study. Your answers to the following questions are voluntary and anonymous. Please complete the survey and then put it in the drop box.
1. Your sex: Male Female
2. Your age: Under 18 18-25 26-34 35-49 50-59 60 Plus
3. Your Zip Code: _______________________
4. About how many miles did you drive last year?
Less than 5,000 5,000 to 10,000 10,001 to 15,000 More than 15,000
5. What type of vehicle do you drive most often?
Passenger car Pickup truck Sport utility vehicle Minivan Full van Other
6. How often do you use seat belts when you drive or ride in a car, van, sport utility vehicle or pickup?
Always Nearly always Sometimes Seldom Never
7. Compared to the last couple of years, would you say you now wear your seat belt:
Much less often Less often About the same More often Much more often
8. What do you think the chances are of getting a ticket if you don't wear your seat belt?
Always Nearly always Sometimes Seldom Never
9. In the past 60 days, have you seen or heard about extra enforcement where police were looking at seat belt use?
Yes No
If yes, where did you see or hear about it? (Check all that apply):
Newspaper Radio TV Poster Web site Police checkpoint Other ______________
If yes, what did it say:
Click It or Ticket Drive sober or get pulled over Buckle Up. No Excuses!
Survive Your Drive Other ___________________________________________________________
10. In the past 60 days, how many times have you driven a motor vehicle within 2 hours after drinking alcoholic beverages? ___________ (number of times)
11. In the past 60 days, have you read, seen or heard anything about police enforcement of alcohol impaired driving (or drunk driving) laws?
Yes No
12. What do you think the chances are of someone getting arrested if they drive after drinking?
Always Nearly always Sometimes Seldom Never
13. On a local road with a speed limit of 30 mph, how often do you drive faster than 35 mph?
Always Nearly always Sometimes Seldom Never
14. In the past 60 days, have you read, seen or heard anything about police enforcement of speed laws?
Yes No
15. What do you think the chances are of getting a ticket if you drive over the speed limit?
Always Nearly always Sometimes Seldom Never
16. How often do you talk on a hand-held cellular phone when you drive? Always Nearly always Sometimes Seldom Never
17. How often do you send text messages or emails on a hand-held cellular phone when you drive?
Always Nearly always Sometimes Seldom Never

9/30/2012 - 1 -
Night Seat Belt Use in Maine, June 2012
Prepared for:
The University of Southern Maine Portland, Maine
Prepared by:
William A. Leaf, Neil K. Chaudhary and Tara Casanova
Preusser Research Group, Inc. Trumbull, Connecticut
September 30, 2012

9/30/2012 - 2 -
Introduction Maine is one of 22 States to have upgraded their seat belt law to primary enforcement since 1997. A primary belt law in Maine went into effect September 20, 2007, with an educational grace period to April 1, 2008. In 2008, NHTSA conducted a three-part evaluation of the implementation and effects of the new primary belt law (Chaudhary, Tison, & Casanova, 2010a). Because the night belt use measurement described in this report is a continuation of their work, this document quotes liberally from the Chaudhary et al. report. Primary laws have been associated with a higher percentage of observed seat belt use (e.g. Ulmer, Preusser, & Preusser, 1995). In 2008, States with primary laws had an average observed seat belt usage rate about 9 percentage points higher than those with secondary laws (based on NHTSA, 2009). Seat belt use saves lives. It is estimated that nearly half of passenger vehicle fatalities involving unbelted occupants would be prevented if they had been properly restrained. In practice, changes from secondary to primary belt laws have led, along with greater belt use, to fewer traffic fatalities. For example, in late 1999 and early 2000, Alabama, Michigan, and New Jersey changed their laws from secondary to primary. Chaudhary (in review) reported that these laws led to increased seat belt use among fatally injured front seat occupants of motor vehicles and also decreased numbers of fatalities. Similar effects were seen with other States as they passed belt use laws – belt use increased and fatalities decreased. However, fatalities did not drop as much as expected. One explanation was that the drivers who were buckling up were drivers who were already relatively safe drivers and that the risky drivers, more likely to be involved in a crash, remained unrestrained. Thus, those most in need of seat belts were least likely to buckle up. Preusser, Williams, and Lund (1986) showed support for this contention. In their study, researchers went to bars in New York State several months after the New York seat belt law went into effect. Seat belt observations occurring on roadways near taverns showed that 43 percent of drivers during the day were belted but that observed belt use at the same locations dropped to 36 percent at night. Furthermore, drivers most likely to be drinking (and therefore constituted a higher risk) had even lower belt use. Indeed, drivers arriving or leaving bar parking lots at night had a 24 percent belt use rate.
Day versus Night Seat Belt Use Research using National Highway Traffic Safety Administration’s (NHTSA) Fatality Analysis Reporting System (FARS) indicates that seat belt use among fatally injured front seat occupants of passenger vehicles declines nationally across the hours of night (Chaudhary & Preusser, 2006). Figure 1 shows this effect for the State of Maine using 2002-2008 FARS data. Belt use is uniformly highest during daytime hours (5 a.m. – 2:59 p.m.), declines steadily from 3 p.m. to late evening, and is at its lowest from midnight to 4:59 a.m.

9/30/2012 - 3 -
0%
10%
20%
30%
40%
50%
60%
70%
Noon
1:00 PM
2:00 PM
3:00 PM
4:00 PM
5:00 PM
6:00 PM
7:00 PM
8:00 PM
9:00 PM
10:00 PM
11:00 PM
Midnight
1:00 AM
2:00 AM
3:00 AM
4:00 AM
5:00 AM
6:00 AM
7:00 AM
8:00 AM
9:00 AM
10:00 AM
11:00 AM
Percent Belted
Figure 1. Percent belt use among fatally injured occupants of passenger vehicles by hour, Maine, 2002-2008
Similarly, nighttime fatalities are disproportionately frequent compared to the amount of nighttime driving. In 2007, about 26 percent of all motor vehicle fatalities occurred between the hours of 10:00 p.m. and 3:59 a.m., according to FARS, but this time period likely has less than 15 percent of daily traffic volume (Hallenbeck, 1997). Chaudhary and Preusser (2006) compared daytime and nighttime seat belt use in Connecticut, using the State’s Section 157-compliant sites, and found that daytime belt use was about 7 percentage points higher than nighttime (83 percent vs. 77 percent). Solomon, Chaudhary, and Preusser (2007) showed a similar day to night difference in New Mexico using similar observation techniques and New Mexico’s daytime statewide seat belt use site locations. This study showed that nighttime seat belt use was 6.2 percentage points lower than daytime seat belt use. Masten (2007) studied the role of primary law upgrade on nighttime seat belt use using FARS. In all but one of six states that changed their law from secondary to primary, he found an increase in seat belt use among fatally injured occupants; in several states that increase was greater at night than during the day. In 2008, along with Maine’s change from secondary to primary to enforced primary belt law, Chaudhary et al. (2010a, 2010b) examined changes in daytime seat belt use and in nighttime seat belt use. Daytime belt use was measured at 40 “mini-survey” sites and nighttime belt use was measured at the sites used here, the subset of the mini-survey sites with actual nighttime traffic. In three time periods (before primary law enforcement began; immediately after primary enforcement began; and immediately after normal Click It or Ticket (CIOT) enforcement), they found that belt use rose consistently, day and night. Daytime belt use for the 40-site mini-survey rose from 77 percent to 79 percent to 84 percent. Nighttime belt use was always lower than daytime, but nighttime use rose as much or more, from 69 percent to 77 percent to 81 percent. Changes were statistically significant. In June 2009 with the same methodology, Maine’s belt use was measured at 83 percent daytime and 80 percent nighttime, virtually unchanged from the year before. In June 2010, again with the same methodology, Maine’s

9/30/2012 - 4 -
belt use was 82 percent daytime and about 77 percent nighttime. In 2011, the figures were 82 percent daytime and 79 percent nighttime. The current study continues the previous methodology to examine nighttime belt use in 2012, approximately four years after Maine’s primary law took effect with enforcement. This study is one of a number of coordinated seat belt use measurements being undertaken by the State.
Method Maine’s pre-2012 statewide Section 157-compliant seat belt use survey design included 120 observation sites in 10 of the 16 counties; the design was developed in 2004. A subset of 40 of those sites in 6 counties was used for “mini” surveys from 2008 - 2010. The 40 sites were chosen to be representative of the full 120-site design in terms of urban and rural locations and road function categories. Chaudhary et al. (2010) used those 40 sites for daytime and nighttime observations in 2008 in order to be able to directly compare day and night belt usage. They found that 13 of the sites, at night, had fewer than 5 observations per 45-minute observation period in each of the three observation waves. In order to minimize the impact of these very low volume sites on the overall measures, they were dropped from nighttime belt use calculations (and day-night belt use comparisons were based only on the remaining 27 sites). Those 27 sites were used in 2009, 2010, 2011, and again in the current study for nighttime observations. To maximize the comparability of data from these observations to previous measures, belt use was observed according to the same day of week and time of day schedule as had been used previously. Site information, including county name, city/town/area identifier, exact roadway location, date, day of week, time, weather condition, and direction of traffic flow and lane(s) was documented. Each one-page data collection form had space to record information on 70 vehicles, the driver of that vehicle, and the outboard front seat passenger, if any. Multiple pages could be used to record belt use in any observation session as needed. Preusser Research Group provided experienced observers, trained to follow the procedures shown in Appendix A. Observers were trained to observe proper shoulder belt use (vs. improper or no use) of the driver and, if present, a right front seat passenger. Observations were made for non-commercial passenger vehicles only. These were the same methods used in Maine in previous years and for daytime belt use observations and in numerous other seatbelt observation efforts. Observers were given descriptions of the road segment and the direction of traffic to be observed. Guidance was also provided as to the exact location from which observations should be made. Observers had the option of adjusting their location within the road segment if conditions made the recommended location unusable or unrepresentative (e.g., construction, nearby traffic rerouting), but they did not need to do so for any of these observations. Many roads had two or more lanes of traffic. In such situations, the observation period (45 minutes) was divided by the number of lanes, each lane being observed for the proportional length of time. For example, a road with three lanes would require that each lane be observed for 15 minutes. Observations were made for 45 minutes on a structured schedule of observation times and days. The schedule was designed to maximize the opportunity to study variations in restraint use by time of day and by day of week (e.g. day/night, weekday/weekend). Nighttime observation assignments were made across a schedule beginning at 9:00 p.m. and ending at 2:45 a.m. Road segments were randomly assigned to a day of week and time of day for observations, although consideration was given for trips to locations that required lengthy travel times. Each day and time had an equal probability of selection. Observations were generally done on the same day and time

9/30/2012 - 5 -
as previous year’s statewide CIOT observations. For those few that were done on a different day or time (due to weather, schedules, etc.), observations were done at comparable times. For instance, a site that was observed in 2011 on Tuesday evening could be done this year on Wednesday or Thursday evening, but not on Saturday evening, because travel patterns may be different on the weekend. Night belt observations were observed based on weekday (Sunday night-Thursday night) and weekend (Friday and Saturday night) schedules. When needed, military grade night vision goggles and 1 million candle-power handheld infrared spotlights were used. Two staff members were needed for these observations. One staff member (observer) would observe belt use through the night vision goggles while shining the infrared light at the vehicle. This person would also call out the data while the other staff member (recorder) would write down information on the observation data sheet.
Results Data were collected post-CIOT, from June 4, 2012, through June 9, 2012. One site had just a single observation (belted). The numbers of observed occupants at the other sites ranged from 3 to 354. In all, there were 1,181 passenger vehicle drivers along with 304 passengers, or 1,485 occupants in all. Belt use was calculated as the average of the 28 site belt use percentages. Overall belt use was 87.6 percent. The standard error of measurement was calculated as the standard error of the means; it was 1.74 percent. The 95% confidence interval for the statewide night belt use value was 84 percent – 91 percent. Table 1 places these observations in context with those made in 2008 (Chaudhary et al., 2010), 2009, 2010, and 2011. Night belt use in 2012 was more than 8 percentage points higher than during the comparable time periods in 2008 – 2011, a statistically significant increase. This is contrasted with the relatively stable belt use values from 2008 through 2011.

9/30/2012 - 6 -
Table 1. Statewide night belt use, by wave
Obs. Dates Condition Night Belt Use
Wave 1 2/24 – 3/1/2008 Pre-enforcement 69.3%
Wave 2 4/25 – 5/3/2008 Post-enforcement 76.9%
Wave 3 5/30 – 6/12/2008 Post-CIOT 81.2%
Wave 4 5/30 – 6/13/2009 Post-CIOT 80.1%
Wave 5 6/6-6/12/2010 Post-CIOT 77.1%
Wave 6 6/3-6/11/2011 Post-CIOT 79.0%
Wave 7 6/4-6/9/2012 Post-CIOT 87.6%
The key reason for the difference between 2012 and earlier years is that groups which typically have lower belt use rates, in particular pickup occupants, had rates that were much higher, much more similar to those of other groups. These patterns are shown in Table 2, on the next page, which refers only to the 2012 observations. In particular:
• Seat belt use did not vary much across roadway types, with values ranging from 86 percent (Expressways, Rural other arterials, and Collectors) up to 88 percent (Urban other arterials); typically belt use is highest on Expressways and lower for lower volume roadways, especially Collectors.
• Seat belt use is lowest for occupants of pickup trucks, but the difference is relatively small, 82 percent vs. 86 percent – 91 percent for other passenger vehicle types.
• Female occupants buckle up 7 percentage points more than male occupants, a typical finding.
• Male drivers buckle up 6 percentage points less than male passengers; female drivers buckle up 2.5 percentage points less than female passengers.
• Typically, males in pickup trucks are the least likely group to buckle up; in this survey, however, their belt use rate was about the same as males in other vehicle types.

9/30/2012 - 7 -
Table 2. Night belt use, June 2011, by road type, vehicle type, person type, and role1
Road Functional Class Category N Night Belt Use
Expressways 485 85.7%
Urban Other Arterials 586 87.7%
Rural Other Arterials 320 85.9%
Collectors 95 86.3%
Vehicle Type
Passenger Cars 850 86.0%
Pickups 196 81.6%
SUVs 331 90.6%
Vans 108 88.0%
Sex x Driver-Passenger
Male Drivers 735 82.7%
Female Drivers 442 89.8%
Male Passengers 108 88.9%
Female Passengers 196 92.3%
Sex
Male 843 83.5%
Female 638 90.6%
Driver-Passenger
Driver 1181 85.4%
Passenger 304 91.1% 1 Figures are raw percentages.
Discussion Until this year, night seat belt use has remained relatively stable since primary belt use enforcement began in April 2008, ranging from 81.2 percent in June 2008 to 77.1 percent in June 2010. This year’s value of 87.6% is a statistically significant increase. The change is due to major improvements in belt use in groups that typically perform worse than average. Most importantly, pickup occupants wore belts at nearly the same rate as occupants of other vehicles. Observed belt use was also high on Collectors, normally lower than other road types, and the male-female difference was less than seen in recent surveys. This year, for the first time, the nighttime belt use rate in Maine is slightly higher than the daytime belt use value, though the difference is not statistically significant. The daytime value, 84.4 percent, was measured at the same time but using a new survey design meeting the NHTSA criteria revised in 2011 for 2012 surveys. The daytime design included 12 counties, 127 sites, and, for the first time, local road sites. Thus the surveys do not sample exactly equivalent portions of the state’s roadway traffic. Nevertheless, the fact that nighttime use measured slightly higher than daytime use is remarkable. The difference is due entirely to pickup occupants, who in the daytime survey had belt use values 10 percentage points lower than occupants of other vehicle types. The similarity of the daytime and nighttime figures is in sharp contrast to the difference in belt use by Maine fatalities in Figure 1, where average daytime belt use of over 50 percent (by fatally injured passenger vehicle

9/30/2012 - 8 -
occupants) dropped to below 40 percent from 9 p.m. to midnight and about 20 percent after midnight. This lends support to previous findings that many nighttime fatalities are drawn from high-risk subpopulations, e.g., impaired drivers, that are particularly unlikely to buckle up and are much more likely to be out in late night hours. In 2002-2008, 175 passenger vehicle fatalities were unbuckled between 9 p.m. and 4:59 a.m., an average of 25 per year. It is likely that about half of them, 12-13 per year, would not have died if they had been properly restrained. Most of these fatalities occurred before Maine’s primary seat belt law, and night belt use has risen by about twenty percentage points after the new law, a very positive outcome. However, targeted efforts to increase the seat belt use of all night drivers and their passengers could further improve compliance and reduce fatalities.

9/30/2012 - 9 -
References Chaudhary, NK. (in review). Evaluation of the Alabama, Michigan and New Jersey Safety Belt Law Change to
Primary Enforcement. Chaudhary, NK & Preusser, DF. 2006. Connecticut nighttime safety belt use. Journal of Safety Research, 37,
353-358.
Chaudhary, NK, Tison, J, and Casanova, TM. 2010a. Evaluation of Maine's Safety Belt Law Change from
Secondary to Primary Enforcement. Final Report, National Highway Traffic Safety Administration, Washington, DC. DOT HS 811 259.
Chaudhary, NK, Tison, J, and Casanova, TM. 2010b. The effects of Maine’s Change to Primary Seat Belt Law
on Seat Belt Use and Public Perception and Awareness. Traffic Injury Prevention, 11:165-172. Hallenbeck, ME, Smith, B, Cornell-Martinez, & Wilkinson, J. 1997. Vehicle Volume Distributions by
Classification, FHWA-PL-97-025. Masten, SV. 2007. Do states upgrading to primary enforcement of safety belt laws experience increased
daytime and nighttime belt use? Accident Analysis and Prevention, 39, 1131-1139. NHTSA. 2009. Traffic Safety Facts: Occupant Protection, 2008 Data, DOT HS 811 160. Preusser DF, Williams AF, & Lund AK. 1986. Seat belt use among New York bar patrons. Journal of public
health policy, 7, 470-9. Solomon, MG, Chaudhary, NK, & Preusser, DF. 2007. Daytime and Nighttime Safety Belt Use at Selected Sites
in New Mexico. Final Report, National Highway Traffic Safety Administration, Washington, DC. DOT HS 810 705.
Ulmer, RG, Preusser, CW, & Preusser, DF. 1995. Evaluation of California’s safety belt law change from
secondary to primary enforcement. Journal of Safety Research, 26, 213-220.

Appendix A
SEAT BELT OBSERVATION INSTRUCTIONS
• Eligible vehicles need to have at least, but not more than, four tires and be one of the following: Private or “self-proprietor” passenger automobile, pickup truck, sport utility vehicle (SUV), jeep, minivan, or full-size van. Pickup trucks should be coded “truck.” Jeeps, Broncos, Blazers, and other vehicles of similar type should be coded “SUV.” Minivans and full-size vans should be coded “van.” Eligible vehicles should be observed regardless of the state in which they are registered.
• Do Not Include in your observations vehicles with more than four tires, buses, motorcycles, commercial vehicles, emergency vehicles such as police, fire, and ambulance, vehicles with mounted colored lights, government vehicles, and taxis. Do include qualified vehicles with small business markings, e.g., a removable magnetic sign like “Joe’s Plumbing.”
• Belt use will be observed for front seat occupants only. Observe and record data for the driver and passenger in the right front seat. If there is more than one front seat passenger, observe only the “outside” passenger. Do not record data for passengers in the back seat or for a third passenger riding in the middle of the front seat.
• If a child is present in the front seat in a child restraint seat, do not record anything. However, children riding in the front seat, regardless of age, who are not in child restraint seats should be observed as any other front seat passenger.
• Each observation period will last for 45 minutes. The following procedures will be used in conducting observations of belt use: 1. As you observe an eligible vehicle, record the type of vehicle (car, truck, sport utility, van) and the sex (male or female) and
restrained by shoulder belt (yes or no) of the front seat occupants (driver and front seat “outside” passenger only). 2. If you notice a lap belt in use without a shoulder belt, it should be recorded as not restrained. Only shoulder belts are to be
counted. 3. If the vehicle is equipped with shoulder belts but the person has the shoulder strap under his/her arm or behind the back, this
should be recorded as not restrained. 4. Observe traffic in each lane for an equal amount of time, and in the direction specified, throughout the 45-minute observation
time period. 5. In many situations, it will be possible to observe every vehicle in the designated lane. However, if traffic is moving too fast to
observe every vehicle, you should determine a focal point up the road in the appropriate lane. Observe the next vehicle to pass the focal point after the last vehicle has been coded.
6. Do not observe if it is raining, or if there is fog or inclement weather. If you arrive at a site and it begins to rain, do not collect
data in the rain. Find a dry place and wait 15 minutes for weather to clear. If the weather clears, start observing again and extend the observation period to make up for the time missed. Otherwise, the site will be rescheduled. (Note: rain means heavy, consistent rain, not light fog, or drizzle, or mist).
7. If more than one data sheet is used, staple the sheets together at the end of the observation period and note the number of sheets
used in the space provided at the bottom of the data form. Indicate on the form each time the observed lane changes. It may happen that the site you are assigned to observe is seriously compromised due to construction or heavy traffic. If this occurs you may move one block in any direction on the same street such that you are observing the same flow of traffic that would typically have been observed had there been no construction. If moving one block will not solve the problem, then do not observe. The site will be rescheduled for a future date OR an alternate site will be selected for immediate observation.