Embed Size (px)
Citation preview
STATE OF IN
EQU
ALITY R
eproductive, maternal, new
born and child health
ISBN 978 92 4 156490 8
STATE OF INEQUALITYReproductive, maternal,
newborn and child health
I N T E R A C T I V E V I S U A L I Z AT I O N O F H E A LT H D ATA
DEPARTMENT OF HEALTH STATISTICS AND INFORMATION SYSTEMS
WORLD HEALTH ORGANIZATION20, AVENUE APPIA
CH-1211 GENEVA 27SWITZERLAND
GENDER, EQUITY AND HUMAN RIGHTS TEAM
Everyone Everywhere Always
h t t p : / / w w w . w h o . i n t / g h o / h e a l t h _ e q u i t y / r e p o r t _ 2 0 1 5 / WHO

E V E R Y O N E E V E R Y W H E R E A L W A Y S
E V E R Y O N E E V E R Y W H E R E A L W A Y S
STATE OF INEQUALITYReproductive, maternal,
newborn and child health
I N T E R A C T I V E V I S U A L I Z AT I O N O F H E A LT H D ATA

WHO Library Cataloguing-in-Publication Data
State of inequality: reproductive, maternal, newborn and child health
I.World Health Organization.
ISBN 978 92 4 156490 8
Subject headings are available from the WHO institutional repository
© World Health Organization 2015
All rights reserved. Publications of the World Health Organization are available on the WHO website (www.who.int) or can be purchased from WHO Press, World Health Organization, 20 Avenue Appia, 1211 Geneva 27, Switzerland (tel.: +41 22 791 3264; fax: +41 22 791 4857; e-mail: [email protected]).
Requests for permission to reproduce or translate WHO publications — whether for sale or for non-commercial distribution — should be addressed to WHO Press through the WHO website (www.who.int/about/licensing/copyright_form/en/index.html).
The designations employed and the presentation of the material in this publication do not imply the expression of any opinion whatsoever on the part of the World Health Organization concerning the legal status of any country, territory, city or area or of its authorities, or concerning the delimitation of its frontiers or boundaries. Dotted and dashed lines on maps represent approximate border lines for which there may not yet be full agreement.
The mention of specific companies or of certain manufacturers’ products does not imply that they are endorsed or recommended by the World Health Organization in preference to others of a similar nature that are not mentioned. Errors and omissions excepted, the names of proprietary products are distinguished by initial capital letters.
All reasonable precautions have been taken by the World Health Organization to verify the information contained in this publication. However, the published material is being distributed without warranty of any kind, either expressed or implied. The responsibility for the interpretation and use of the material lies with the reader. In no event shall the World Health Organization be liable for damages arising from its use.
Design and layout by L’IV Com Sàrl, Villars-sous-Yens, Switzerland.
Printed in Luxembourg.

Foreword . . . . . . . . . . . . . . . . . . . . . . . . . . . . . . . . . . . . . . . . . . . . . . . . . . . . . . . . . . . . . . . . . viii
Acknowledgements . . . . . . . . . . . . . . . . . . . . . . . . . . . . . . . . . . . . . . . . . . . . . . . . . . . . . . . . x
Executive summary . . . . . . . . . . . . . . . . . . . . . . . . . . . . . . . . . . . . . . . . . . . . . . . . . . . . . . . xii
1. Introduction . . . . . . . . . . . . . . . . . . . . . . . . . . . . . . . . . . . . . . . . . . . . . . . . . . . . . . . . . . . . . 1
2. Background . . . . . . . . . . . . . . . . . . . . . . . . . . . . . . . . . . . . . . . . . . . . . . . . . . . . . . . . . . . . . 32.1 Inequality . . . . . . . . . . . . . . . . . . . . . . . . . . . . . . . . . . . . . . . . . . . . . . . . . . . . . . . . . . . . . 32.2 Health inequality . . . . . . . . . . . . . . . . . . . . . . . . . . . . . . . . . . . . . . . . . . . . . . . . . . . . . . . . 42.3 Reproductive, maternal, newborn and child health . . . . . . . . . . . . . . . . . . . . . . . . . . . . . . 5
3. Monitoring the state of inequality in RMNCH . . . . . . . . . . . . . . . . . . . . . . . . . . . . . . 93.1 Data . . . . . . . . . . . . . . . . . . . . . . . . . . . . . . . . . . . . . . . . . . . . . . . . . . . . . . . . . . . . . . . . 10
3.1.1 Data sources . . . . . . . . . . . . . . . . . . . . . . . . . . . . . . . . . . . . . . . . . . . . . . . . . . . . . 103.1.2 Health indicator data . . . . . . . . . . . . . . . . . . . . . . . . . . . . . . . . . . . . . . . . . . . . . . . 103.1.3 Dimension of inequality data . . . . . . . . . . . . . . . . . . . . . . . . . . . . . . . . . . . . . . . . . 103.1.4 Country selection . . . . . . . . . . . . . . . . . . . . . . . . . . . . . . . . . . . . . . . . . . . . . . . . . . 12
3.2 Analysis . . . . . . . . . . . . . . . . . . . . . . . . . . . . . . . . . . . . . . . . . . . . . . . . . . . . . . . . . . . . . . 133.2.1 Data disaggregation . . . . . . . . . . . . . . . . . . . . . . . . . . . . . . . . . . . . . . . . . . . . . . . . 133.2.2 Summary measures . . . . . . . . . . . . . . . . . . . . . . . . . . . . . . . . . . . . . . . . . . . . . . . . 13
3.3 Reporting . . . . . . . . . . . . . . . . . . . . . . . . . . . . . . . . . . . . . . . . . . . . . . . . . . . . . . . . . . . . . 163.3.1 Data visualization . . . . . . . . . . . . . . . . . . . . . . . . . . . . . . . . . . . . . . . . . . . . . . . . . 163.3.2 Feature stories . . . . . . . . . . . . . . . . . . . . . . . . . . . . . . . . . . . . . . . . . . . . . . . . . . . . 17
4. The state of inequality in RMNCH: stories from low- and middle-income countries . . . . . . . . . . . . . . . . . . . . . . . . . . . . . . . . . . . . . . . . . . . . . . . . 19
4.1 Reproductive health interventions . . . . . . . . . . . . . . . . . . . . . . . . . . . . . . . . . . . . . . . . . . 204.2 Maternal health interventions . . . . . . . . . . . . . . . . . . . . . . . . . . . . . . . . . . . . . . . . . . . . . 244.3 Care-seeking for sick children . . . . . . . . . . . . . . . . . . . . . . . . . . . . . . . . . . . . . . . . . . . . . 294.4 Childhood immunization . . . . . . . . . . . . . . . . . . . . . . . . . . . . . . . . . . . . . . . . . . . . . . . . 334.5 Child malnutrition . . . . . . . . . . . . . . . . . . . . . . . . . . . . . . . . . . . . . . . . . . . . . . . . . . . . . . 374.6 Child mortality. . . . . . . . . . . . . . . . . . . . . . . . . . . . . . . . . . . . . . . . . . . . . . . . . . . . . . . . . 414.7 RMNCH interventions, combined . . . . . . . . . . . . . . . . . . . . . . . . . . . . . . . . . . . . . . . . . . 454.8 Potential for improvement in RMNCH interventions . . . . . . . . . . . . . . . . . . . . . . . . . . . . 50
Table of contents
iii

5. Reporting the state of inequality: taking stock . . . . . . . . . . . . . . . . . . . . . . . . . . . . 555.1 The importance of data disaggregation . . . . . . . . . . . . . . . . . . . . . . . . . . . . . . . . . . . . . . 565.2 Equity orientation of policies, programmes and practices . . . . . . . . . . . . . . . . . . . . . . . . 575.3 Equity-oriented health information systems . . . . . . . . . . . . . . . . . . . . . . . . . . . . . . . . . . 585.4 Reducing inequality across health topics and the post-2015 sustainable development agenda . . . . . . . . . . . . . . . . . . . . . . . . . . . . . . . . . . . . . . . . . . . . . . . . . . . . 59
References . . . . . . . . . . . . . . . . . . . . . . . . . . . . . . . . . . . . . . . . . . . . . . . . . . . . . . . . . . . . . . . . 61
Appendices . . . . . . . . . . . . . . . . . . . . . . . . . . . . . . . . . . . . . . . . . . . . . . . . . . . . . . . . . . . . . . . 65Appendix 1. Data and analysis methods . . . . . . . . . . . . . . . . . . . . . . . . . . . . . . . . . . . . . . . . . . 65Appendix 2. Assessing health inequality: methodological considerations . . . . . . . . . . . . . . . . . 72Appendix 3. Visualizing disaggregated data using maps . . . . . . . . . . . . . . . . . . . . . . . . . . . . . . 76Appendix 4. Guide to interpreting the visuals used in this report . . . . . . . . . . . . . . . . . . . . . . . . 78Appendix 5. Interactive visualization of health data . . . . . . . . . . . . . . . . . . . . . . . . . . . . . . . . . . 81Appendix 6. Additional interactive visuals: references for further data exploration . . . . . . . . . . 83Appendix 7. Patterns of inequality . . . . . . . . . . . . . . . . . . . . . . . . . . . . . . . . . . . . . . . . . . . . . . . 85
Supplementary tables . . . . . . . . . . . . . . . . . . . . . . . . . . . . . . . . . . . . . . . . . . . . . . . . . . . . . 87
Index . . . . . . . . . . . . . . . . . . . . . . . . . . . . . . . . . . . . . . . . . . . . . . . . . . . . . . . . . . . . . . . . . . . . 100
STATE OF INEQUALITY: REPRODUCTIVE, MATERNAL, NEWBORN AND CHILD HEALTH
iv

FiguresFigure 4.1 Contraceptive prevalence (modern methods) by woman’s education
in 71 low- and middle-income countries: latest situation (DHS and MICS 2005–2013) . . . . . . . . . . . . . . . . . . . . . . . . . . . . . . . . . . . . . . . . . . . . . . . . . . . . . . 21
Figure 4.2 Contraceptive prevalence (modern methods) by woman’s education in 38 low- and middle-income countries: change over time (DHS and MICS 1995–2004 and 2005–2013) . . . . . . . . . . . . . . . . . . . . . . . . . . . . . . . . . . . . . . . . . 22
Figure 4.3 Births attended by skilled health personnel by economic status in 30 low-income and 53 middle-income countries: latest situation (DHS and MICS 2005–2013) . . . . . . . . . . . . . . . . . . . . . . . . . . . . . . . . . . . . . . . . . 25
Figure 4.4 Births attended by skilled health personnel in 83 low- and middle-income countries (national average and within-country economic-related inequality): latest situation (DHS and MICS 2005–2013) . . . . . . . . . . . . . . . . . . . . . . . . . . . . . 26
Figure 4.5 Births attended by skilled health personnel: change over time in national average (absolute change) and in the poorest compared with the richest quintile (absolute excess change) in 42 low- and middle-income countries (DHS and MICS 1995–2004 and 2005–2013) . . . . . . . . . . . . . . . . . . . . 27
Figure 4.6 Children aged less than five years with pneumonia symptoms taken to a health facility by place of residence in 72 low- and middle-income countries: latest situation (DHS and MICS 2005–2013) . . . . . . . . . . . . . . . . . . . . . 30
Figure 4.7 Children aged less than five years with pneumonia symptoms taken to a health facility: change over time in national average (absolute change) and in rural compared with urban areas (absolute excess change) in 33 low- and middle-income countries (DHS and MICS 1995–2004 and 2005–2013) . . . . . . . . . . . . . . . . . . . . . . . . . . . . . . . . . . . . . . . . . . . . . . . . . . . 31
Figure 4.8 DTP3 immunization coverage among one-year-olds by economic status in 78 low- and middle-income countries: latest situation (DHS and MICS 2005–2013) . . . . . . . . . . . . . . . . . . . . . . . . . . . . . . . . . . . . . . . . . 34
Figure 4.9 DTP3 immunization coverage among one-year-olds: change over time in national average (absolute change) and in the poorest compared with the richest quintile (absolute excess change) in 41 low- and middle-income countries (DHS and MICS 1995–2004 and 2005–2013) . . . . . . . . 35
Figure 4.10 Stunting prevalence in children aged less than five years by mother’s education in 30 low-income and 36 middle-income countries: latest situation (DHS and MICS 2005–2013) . . . . . . . . . . . . . . . . . . . . . . . . . . . . . . . . . . 38
Figure 4.11 Stunting prevalence in children aged less than five years: change over time in national average (absolute change) and in the least-educated compared with the most-educated subgroup (absolute excess change) in 29 low- and middle-income countries (DHS and MICS 1995–2004 and 2005–2013) . . . . . . . . . . . . . . . . . . . . . . . . . . . . . . . . . . . . . . . . . . . . . . . . . . . 39
Figure 4.12 Under-five mortality rates by place of residence in 54 low- and middle-income countries: latest situation (DHS 2005–2013) . . . . . . . . . . . . . . . . . 42
Figure 4.13 Under-five mortality rates: change over time in national average (absolute change) and in rural compared with urban areas (absolute excess change) in 37 low- and middle-income countries (DHS 1995– 2004 and 2005–2013) . . . . . . . . . . . . . . . . . . . . . . . . . . . . . . . . . . . . . . . . . . . . . . 44
TABLE OF CONTENTS
v
Figure 4.14 RMNCH composite coverage index by multiple dimensions of inequality in low- and middle-income countries: latest situation (DHS and MICS 2005–2013) . . . . . . . . . . . . . . . . . . . . . . . . . . . . . . . . . . . . . . . . . 46
Figure 4.15 Potential for improvement in RMNCH intervention coverage by eliminating within-country economic-related inequality in Egypt (DHS 2008) and Niger (DHS 2012) . . . . . . . . . . . . . . . . . . . . . . . . . . . . . . . . . . . . 52
Figure 5.1 Under-five mortality rate doubly disaggregated by place of residence and economic status in Benin (DHS 2006) . . . . . . . . . . . . . . . . . . . . . . . . . . . . . . . 57
Figure A2.1 Antenatal care coverage (at least four visits) by woman’s education in Indonesia (DHS 2002 and 2012) . . . . . . . . . . . . . . . . . . . . . . . . . . . . . . . . . . . . . 73
Figure A2.2 Proportion of women aged 15–49 years with a live birth within three years preceding the survey by education in Indonesia (DHS 2002 and 2012) . . . . . . . . . . . . . . . . . . . . . . . . . . . . . . . . . . . . . . . . . . . . . . . . . . . . . . . . 74
Figure A3.1 Stunting prevalence in children aged less than five years by mother’s education in 74 low- and middle-income countries: latest situation (DHS and MICS 2005–2013) . . . . . . . . . . . . . . . . . . . . . . . . . . . . . . . . . . . . . . . . . 76
Figure A7.1 Patterns of inequality in health intervention coverage by economic status . . . . . . . 85
TablesTable 2.1 Development initiatives and RMNCH: a recent history . . . . . . . . . . . . . . . . . . . . . . . 6Table 3.1 Selected RMNCH indicators used in this report . . . . . . . . . . . . . . . . . . . . . . . . . . . 11Table 3.2 Health indicator categories and relevant dimensions of inequality . . . . . . . . . . . . . 11Table 3.3 The calculation of selected summary measures and their application
in this report . . . . . . . . . . . . . . . . . . . . . . . . . . . . . . . . . . . . . . . . . . . . . . . . . . . . . . 14Table 4.1 Potential for improvement in national RMNCH intervention coverage by
eliminating within-country economic-related inequality (population attributable risk) in low- and middle-income countries with available data (DHS and MICS 2005–2013) . . . . . . . . . . . . . . . . . . . . . . . . . . . . . . . . . . . . . . . . . 50
Table A1.1 Health determinants included in correlation analyses with RMNCH indicators, grouped according to the EQuity-oriented Analysis of Linkages between health and other sectors (EQuAL) Framework . . . . . . . . . . . . . . 68
Table A1.2 Difference and ratio summary measure calculations by dimension of inequality . . . . . . . . . . . . . . . . . . . . . . . . . . . . . . . . . . . . . . . . . . . . . . . . . . . . . . . 69
Table A2.1 Guide to interpreting annual absolute excess change estimates . . . . . . . . . . . . . . . 75Table A4.1 Interpreting the visuals used in this report . . . . . . . . . . . . . . . . . . . . . . . . . . . . . . . . 78Table A5.1 Best practices in interactive visualization of data . . . . . . . . . . . . . . . . . . . . . . . . . . . 82
STATE OF INEQUALITY: REPRODUCTIVE, MATERNAL, NEWBORN AND CHILD HEALTH
vi
Interactive visualsInteractive visual 1. Reproductive health interventions . . . . . . . . . . . . . . . . . . . . . . . . . . . . . . 23Interactive visual 2. Maternal health interventions . . . . . . . . . . . . . . . . . . . . . . . . . . . . . . . . . 28Interactive visual 3. Care-seeking for sick children . . . . . . . . . . . . . . . . . . . . . . . . . . . . . . . . . . 32Interactive visual 4. Childhood immunization . . . . . . . . . . . . . . . . . . . . . . . . . . . . . . . . . . . . . 36Interactive visual 5. Child malnutrition . . . . . . . . . . . . . . . . . . . . . . . . . . . . . . . . . . . . . . . . . . . 40Interactive visual 6. Child mortality . . . . . . . . . . . . . . . . . . . . . . . . . . . . . . . . . . . . . . . . . . . . . 44Interactive visual 7. RMNCH composite coverage index . . . . . . . . . . . . . . . . . . . . . . . . . . . . . 49Interactive visual 8. Potential for improvement in RMNCH interventions . . . . . . . . . . . . . . . . 53Interactive visual 9. Determinants of RMNCH . . . . . . . . . . . . . . . . . . . . . . . . . . . . . . . . . . . . . 56Interactive visual A1. Equity country profiles . . . . . . . . . . . . . . . . . . . . . . . . . . . . . . . . . . . . . . . 83Interactive visual A2. Maps . . . . . . . . . . . . . . . . . . . . . . . . . . . . . . . . . . . . . . . . . . . . . . . . . . . . 83Interactive visual A3. Reference tables . . . . . . . . . . . . . . . . . . . . . . . . . . . . . . . . . . . . . . . . . . . . 83Interactive visual A4. RMNCH interventions . . . . . . . . . . . . . . . . . . . . . . . . . . . . . . . . . . . . . . . 84
Video clipsVideo clip 1. Health inequality is multidimensional . . . . . . . . . . . . . . . . . . . . . . . . . . . . . . . . . . 12Video clip 2. Benchmarking puts inequality in context . . . . . . . . . . . . . . . . . . . . . . . . . . . . . . . . 17Video clip 3. Health inequalities are widespread . . . . . . . . . . . . . . . . . . . . . . . . . . . . . . . . . . . . 77Video clip 4. Health inequalities inform policies, programmes and practices . . . . . . . . . . . . . . . 86
Frequently used abbreviationsBCG one dose of Bacille Calmette-Guérin vaccineDHS Demographic and Health SurveyDTP3 three doses of the combined diphtheria, tetanus toxoid and pertussis vaccineMICS Multiple Indicator Cluster SurveyRMNCH reproductive, maternal, newborn and child health
TABLE OF CONTENTS
vii

2015 is the target year for the Millennium Development Goals, marking both the end of an ambitious 15-year effort to improve the lives of the world’s poorest, but also a time for new beginnings, with opportunities to refocus, renew and revitalize the approach of successive global development initiatives. The post-2015 sustainable development agenda aims to build upon and expand the unfinished work of the Millennium Development Goals, and to adopt a broader perspective that includes all countries. The report of the Open Working Group on Sustainable Development Goals, endorsed by the United Nations General Assembly in 2014, emphasizes the importance of poverty eradication, environmental sustainability, inclusive growth, equality and a people-centred agenda for sustainable development. The Secretary-General’s synthesis report on the post-2015 sustainable development agenda, The road to dignity by 2030: ending poverty, transforming all lives and protecting the planet, describes a renewed paradigm for sustainable development based on six elements: dignity, people, prosperity, planet, justice and partnership.
A sense of optimism prevails – now is the time to take inequity more seriously and create a world where every person enjoys a basic standard of well-being.
At this important juncture, and under the banner of the post-2015 sustainable development agenda, the World Health Organization supports universal health coverage as the means to ensure that high-quality, essential health services are available and affordable to all. When universal health coverage is pursued through progressive realization it upholds principles of fairness and equity, setting the course for realizing the right to health. In the words of World Health Organization Director-General Margaret Chan, “universal health coverage is the single most powerful concept that public health has to offer”.
Achieving equity in health requires a commitment to monitoring health inequalities which, in turn, necessitates strong, equity-oriented health information systems. High-quality data and robust monitoring systems ensure that efforts can be targeted appropriately and that progress can be tracked. Countries must strengthen health information systems to generate better data and evidence to measure progress.
Integral to the health inequality monitoring process is the task of reporting data in a meaningful way. This State of inequality report exemplifies effective reporting practices, featuring the topic of reproductive, maternal, newborn and child health. The report addresses the challenge of how to best communicate a large and complex body of data in a manner that is comprehensible, flexible and appealing to a wide readership.
Foreword
viii

Feature stories provide an in-depth look at the state of inequality for selected indicators and highlight key observations in reproductive health interventions, maternal health interventions, care-seeking for sick children, childhood immunization, child malnutrition and child mortality. Perhaps most notable, however, is the innovative use of electronic visualization technology. Story-point dashboards, for instance, guide the reader through a succession of visuals where readers can use interactive tools to further explore, sort and filter the data. Similarly, interactive maps and tables engage readers in customizing how data are viewed.
The report reveals that significant inequalities exist in low- and middle-income countries in the area of reproductive, maternal, newborn and child health. The good health of women, infants and children is essential for sustainable development, and there is still much work to be done. Discussions will increasingly call into question how efforts to improve reproductive, maternal, newborn and child health can achieve early and accelerated progress among those who are falling behind.
This State of inequality report helps to focus the monitoring and reporting of health inequalities, and provides comprehensive information on the state of inequality in reproductive, maternal, newborn and child health in low- and middle-income countries.
Flavia Bustreo Assistant Director-General Family, Women’s and Children’s Health ClusterWorld Health Organization
Marie-Paule Kieny Assistant Director-General Health Systems and Innovation ClusterWorld Health Organization
FOREWORD
ix
Ahmad Reza Hosseinpoor, Nicole Bergen and Anne Schlotheuber (World Health Organization, Geneva, Switzerland) conceptualized the report, wrote the first draft and prepared the electronic interactive components. Ahmad Reza Hosseinpoor coordinated the overall development of the report.
The disaggregated data used in the report are the product of a reanalysis of survey micro-data by Aluisio JD Barros, Cesar Victora, Giovanny Araújo, Maria Clara Restrepo and Kerry Wong at the International Center for Equity in Health based in the Federal University of Pelotas, Pelotas, Brazil. Further data analyses, including the calculation of summary measures and data preparation for the interactive visuals, were conducted by Anne Schlotheuber and Ahmad Reza Hosseinpoor.
A number of individuals reviewed the interactive dashboards and provided comments, including, in alphabetical order, Stephen Few (Perceptual Edge, Berkeley, United States of America), Katherine Rowell (HealthDataViz, Newton, United States of America) and Michael Wong (Partnership for Maternal, Newborn & Child Health, Geneva, Switzerland), as well as several World Health Organization staff members: Fiona Gore, Jessica Ho, Doris Ma Fat, Annet Mahanani, Liliana Pievaroli, Gretchen Stevens, Hazim Timimi (World Health Organization, Geneva, Switzerland) and Ramon Martinez (World Health Organization, Washington DC, United States of America). Florence Rusciano (World Health Organization, Geneva, Switzerland) provided advice on the preparation of interactive maps and developed the maps in Figure A3.1. Humna Amjad (intern, World Health Organization, Geneva, Switzerland) contributed to the development of the video clips.
The report benefited from the contributions of a number of World Health Organization programme staff. The following individuals reviewed sections of the report and provided comments according to their area of expertise in reproductive, maternal, newborn and/or child health (acknowledged in alphabetical order): Monika Barbara Bloessner, Elaine Borghi, Cynthia Boschi Pinto, Doris Chou, Marta Gacic-Dobo, Anna Gruending, Rajat Kholsa, Matthews Mathai, Ann-Beth Moller, Shamim Ahmad Qazi, Lale Say, Kamel Senouci and Nicole Valentine (World Health Organization, Geneva, Switzerland).
Aluisio JD Barros, Cesar Victora (Federal University of Pelotas, Pelotas, Brazil), Ties Boerma, Somnath Chatterji, Theadora Koller, Veronica Magar (World Health Organization, Geneva, Switzerland) and Amit Prasad (World Health Organization, Kobe, Japan) reviewed the report in full.
Acknowledgements
x

Petra Schuster provided valuable administrative support.
Ann Morgan provided copy-editing support, AvisAnne Julien proofread the document and Liza Furnival prepared the index.
Funding for the project was provided in part by the Rockefeller Foundation and the Norwegian Agency for Development Cooperation (Norad).
This work is the product of a collaboration between the World Health Organization Department of Health Statistics and Information Systems; the World Health Organization Gender, Equity and Human Rights Team; and the International Center for Equity in Health, Federal University of Pelotas, Pelotas, Brazil.
ACKNOWLEDGEMENTS
xi

The State of inequality: reproductive, maternal, newborn and child health report delivers both promising and disappointing messages about the situation in low- and middle-income countries. On the one hand, within-country inequalities have narrowed, with a tendency for national improvements driven by faster improvements in disadvantaged subgroups. In certain indicators and countries, these improvements have been substantial. On the other hand, however, inequalities still persist in most reproductive, maternal, newborn and child health (RMNCH) indicators. The extent of within-country inequality differed by dimension of inequality and by country, country income group and geographical region. There is still much progress to be made in reducing inequalities in RMNCH.
The State of inequality: reproductive, maternal, newborn and child health report looks at the state of inequality in health, answering key questions: according to the latest available data, what is the status of inequality across and within countries? How have levels of health changed in population subgroups over time?
The objective of this report is to showcase best practices in reporting the state of inequality in low- and middle-income countries using high-quality data, sound and transparent analysis methods, and user-oriented, comprehensive reporting.
This report encompasses the latest status of inequality and changes over time across 23 RMNCH indicators, disaggregated by four dimensions of inequality (economic status, education, place of residence and sex). It draws on data from 86 low- and middle-income countries from all world regions. In a subset of 42 low- and middle-income countries (where data availability permitted), it was also possible to assess how the extent of inequality had changed over time.
The use of effective reporting practices helps to convey clear, salient messages about the state of inequality. Visualization technology facilitates the presentation and interpretation of large amounts of data, as results can be displayed using interactive, customizable views.
REPORTING ON INEQUALITIES IN RMNCH
Overall, inequalities were to the detriment of women, infants and children in disadvantaged population subgroups; that is, the poorest, the least educated and those residing in rural areas had lower health intervention coverage and worse health outcomes than the more advantaged. In a minority of cases, child health interventions or outcomes were unequal between boys and girls.
Executive summary
xii

Latest situation of inequalityThe latest situation of inequality in RMNCH revealed inequalities across low- and middle-income countries in terms of national figures. Within-country inequality differed across health indicators. Maternal health intervention indicators demonstrated pronounced within-country inequalities. The largest gaps in coverage – between the richest and poorest, the most and least educated, and urban and rural areas – were reported for births attended by skilled health personnel, followed by antenatal care coverage (at least four visits). Inequalities were also reported in antenatal care coverage (at least one visit), though to a lesser extent than the two above-mentioned maternal health interventions.
• Theproportionofbirths attended by skilled health personnel differed by up to 80 percentage points between the richest and poorest subgroups; this difference was 37 percentage points or higher in half of countries.
• Inhalfofcountries,antenatal care coverage (at least four visits) differed by at least 25 percentage points between both the most and least educated, and the richest and poorest.
• Antenatal care coverage (at least one visit) was at least 10 percentage points higher among women in the richest subgroup than those in the poorest subgroup in half of countries.
Reproductive health intervention indicators also indicated a situation of inequality.
• Theuse of modern contraception was at least twice as high among women with secondary schooling or higher than among women with no education in nearly half of countries.
Immunization indicators demonstrated low to moderate coverage gaps across different dimensions of inequality.
• Countriesdemonstratedno–orverylowlevelsof–sex-relatedinequalityinimmunizationcoverage.The difference in immunization coverage between boys and girls did not exceed 10 percentage points in any study country.
• LookingatBCG, polio, measles and DTP3 immunization among one-year-olds, in each case there was a difference of less than 5 percentage points between coverage in rural and urban areas in half of countries.
• Overonethirdofcountriesreportedagapoflessthan5percentagepointsbetweenBCG immunization coverage in the richest and poorest subgroups.
Indicators related to care-seeking for sick children showed higher inequality in care-seeking for pneumonia symptoms than for diarrhoea. (Note that estimates were subject to small sample sizes, and results were highly variable across countries.) There were divergent patterns across countries in the level of inequality in the early initiation of breastfeeding.
• Inhalfofcountries,therewasat leastan18percentagepointgapincare-seeking for children with pneumonia symptoms between the poorest and richest subgroups.
• Aboutthesamenumberofcountriesreportedpro-poorinequalityinearly initiation of breastfeeding (higher prevalence of breastfeeding in the poorest than in the richest subgroup) as reported pro-rich inequality (higher prevalence in the richest than in the poorest subgroup). Overall, there was no prevailing pattern in economic-related inequality in breastfeeding practices across countries.
EXECUTIVE SUMMARY
xiii

Inequalities were also reported in child health outcomes. Under-five mortality rate and stunting prevalence in children aged less than five years demonstrated particularly high levels of inequality by economic status, education, place of residence and, to a lesser extent, sex.
• Alargemajorityofcountriesreportedahigherunder-five mortality rate in rural than in urban areas. In half of countries, the difference between rural and urban areas exceeded 16 deaths per 1000 live births.
• Stunting prevalence in children aged less than five years was elevated by as much as 39 percentage points in the children of mothers with no education compared with those children whose mothers had attended secondary school or higher. In half of countries, the education-related difference between these two subgroups was 15 percentage points or more.
Change in inequality over timeInequalities in health are not static, but change over time. Looking at changes over a period of about 10 years, global figures indicated improvements at the national level in many areas of RMNCH. Also, countries tended to report gains that were faster in disadvantaged subgroups than in advantaged subgroups, which is desirable for the reduction of inequalities. The patterns of change in inequality over time varied by health indicator, and according to country and dimension of inequality.
For example, among the immunization indicators, improvements at the national level tended to be accompanied by gains in the disadvantaged subgroups that outpaced those in the advantaged subgroups.
• Inhalf of countries, thechanges inpolio and DTP3 immunization coverage among one-year-olds indicated situations that were pro-poor, favouring children in the poorest subgroup over the richest by a margin of at least 9 percentage points over 10 years.
For a given indicator, the change in inequality over time sometimes varied across the dimensions of inequality.
• Demand for family planning satisfied, for example, showed substantial progress in narrowing education-related inequality over the past 10 years, with increases in the no education subgroup exceeding increases among those who attended secondary school or higher by at least 9 percentage points in half of countries. The gains in reducing place-of-residence inequality, however, were slower, with progress in rural areas outpacing that in urban areas by at least 3 percentage points over the 10-year period in half of countries.
Overall, the change over time in child mortality indicators indicated improved national averages and narrowing inequalities, particularly for under-five mortality. Child malnutrition indicators reported a similar tendency towards decreasing national averages; however, there was little change in the level of existing inequality.
• Theunder-five mortality rate decreased more rapidly in the poorest than in the richest subgroup, by a margin of at least 26 deaths per 1000 live births over a 10-year period.
• Comparingthepaceofchangeinstunting prevalence among children aged less than five years in the poorest and richest subgroups revealed divergent patterns across study countries. Several countries reported a strong pro-poor situation (changes in prevalence favoured the poorest subgroup) whereas several other countries reported a pro-rich situation (changes in prevalence favoured the richest subgroup). Overall, there was little indication that economic-related inequality in stunting prevalence had decreased globally.
STATE OF INEQUALITY: REPRODUCTIVE, MATERNAL, NEWBORN AND CHILD HEALTH
xiv
The composite coverage index is a single indicator that summarizes the level of coverage across the spectrum of RMNCH interventions. It includes eight indicators: demand for family planning satisfied; antenatal care coverage (at least one visit); births attended by skilled health personnel; BCG immunization coverage among one-year-olds; measles immunization coverage among one-year-olds; DTP3 immunization coverage among one-year-olds; children aged less than five years with diarrhoea receiving oral rehydration therapy and continued feeding; and children aged less than five years with pneumonia symptoms taken to a health facility. Overall, more than half of countries reported composite coverage index values of 70% or more. The level of RMNCH interventions coverage varied substantially across countries, ranging from under 40% to nearly 90%.
Within-country inequality existed according to different dimensions of inequality, and variations were observed by country.• Therewasapoorest-to-richestdifferenceofatleast20percentagepointsinhalfofcountries;themaximumeconomic-
related difference in combined RMNCH interventions coverage was over 60 percentage points. • Thosewithsecondaryschoolingorhighereducationreportedcompositecoverageindexlevelsofupto46percentage
points greater than those with no education. • Therural-to-urbangapincoveragewasover10percentagepointsinhalfofcountries.
Nationally, the coverage levels of RMNCH interventions increased over the past decade; this was usually accompanied by faster improvements in the most-disadvantaged subgroups, though there was variation by country.• Halfofcountriesreportedanincreaseincoveragethatwasatleast6percentagepointshigherinthepoorestthanin
therichestsubgroupoveraperiodof10years.• Countriesreportedcoverageincreasesinalleducationsubgroups,withthenoeducationsubgroupoutpacingthosewith
secondaryschoolingorhigherbyuptoamaximumof18percentagepointsover10years.• Inmostcountries,therural-to-urbangapincoveragenarrowed,withfasterimprovementsinruralthaninurbanareas
byamarginof4percentagepointsorhigherover10yearsinhalfofcountries.
THE COMPOSITE COVERAGE INDEX
Implications of health inequality monitoringWhile current national averages and improvements over time are important indications of progress on a global level, reporting inequalities within countries reveals the different experiences of rural and urban residents, the poor and the rich, the educated and the non-educated, and females and males. Monitoring the state of inequality, which includes tracking the change over time, unravels how progress in national averages is realized by population subgroups. Establishing goals and targets that specify a reduction in inequality encourages the orientation of policies, programmes and practices to promote health in disadvantaged subgroups. Without a dedicated focus on equity, efforts to improve health risk perpetuating or intensifying within-country inequality, even as increases in national coverage are achieved.
Equity-oriented health information systems are the foundation for monitoring health inequality. When health information systems are equity oriented they have the tools available to collect, analyse and report data about health inequality. Building capacity for health inequality monitoring requires developing, strengthening and/or expanding equity-oriented health information systems at the national level.
Health inequality monitoring is an essential step towards achieving health equity. It has broad applications and can be conducted across diverse health topics. Applying the best practices in health inequality monitoring presents an opportunity to share the state of inequality with stakeholders, indicate areas in need of improvement and track progress over time.
EXECUTIVE SUMMARY
xv

E V E R Y O N E E V E R Y W H E R E A L W A Y S
E V E R Y O N E E V E R Y W H E R E A L W A Y S
IntroductionThis report, State of inequality: reproductive, maternal, newborn and child health, was developed to demonstrate best practices in reporting the results of health inequality monitoring, and to introduce innovative, interactive ways for audiences to explore inequality data. The report draws on data about reproductive, maternal, newborn and child health (RMNCH) in low- and middle-income countries – an important topic in global health – but the approach and underlying concepts can be applied to any health topic.
Using comparable and publically available data from 86 low- and middle-income countries, this report showcases sound and transparent analytical methods and user-oriented, comprehensive reporting practices. The report is novel because it adopts an expansive scope, presenting harmonized data for a wide selection of RMNCH indicators and allowing comparisons to be made across countries and over time. In addition, electronic visualization components provide readers with a unique opportunity to explore the data in ways appropriate to their needs and interests; customized data views and outputs can be created for setting-specific benchmarking and reporting purposes.
The report was primarily developed for those who work with health information systems and have basic skills in interpreting health-related data. This encompasses a broad audience of technical staff (for example, in ministries of health), public health professionals, policy-makers, researchers, students and others. The content and principles contained within this report have relevance to those interested in health inequality monitoring, health data communication, novel applications of interactive technologies and the state of inequality in RMNCH. Readers are not required to have specialized knowledge about health inequality nor experience with interactive visualization technologies to engage with this report.
The report is comprised of five chapters with accompanying appendices, supplementary tables and electronic visualization components.
1
1

Readers are first introduced to the concept of inequality and the importance of monitoring inequalities in health. A brief overview of current issues in RMNCH is presented to familiarize readers with the relevance of the topic at hand (Chapter 2).
Next, the approach to monitoring the state of inequality is discussed, covering specific matters such as data, analysis and reporting methods (Chapter 3). The State of inequality: reproductive, maternal, newborn and child health report uses the latest available disaggregated data about RMNCH from the World Health Organization (WHO) Health Equity Monitor database to derive and report estimates for 23 RMNCH indicators. Data are disaggregated by four dimensions of inequality: economic status, education level, place of residence and sex (1).
The main body of the report is devoted to a series of feature stories about inequalities in RMNCH (Chapter 4). These have been selected to provide readers with an insight into some of the key messages about inequalities in health among women, mothers, newborns and children.
Eight selected feature stories illustrate the state of inequality in RMNCH.• Contraceptiveuseiscomparedamongwomenwithdifferinglevelsofeducation.• Thepercentageofbabiesdeliveredbyskilledhealthpersonnelispresentedbywealthquintile.• Care-seekingforsickchildrenwithpneumoniasymptomsiscomparedbetweenruralandurbanareas.• Thecoverageofthreedosesofthecombineddiphtheria,tetanustoxoidandpertussisvaccine(DTP3)amongone-year-
olds is explored in subgroups of differing economic status. • Theprevalenceofstuntinginchildrenunderfiveyearsofageispresentedaccordingtomother’seducationlevel.• Therateofunder-fivemortalityiscomparedbetweenchildrenlivinginruralandurbanareas.• Acompositeindexofhealthinterventionsiscontrastedacrosseducationlevels,wealthquintilesandplacesofresidence.• Thepotentialforimprovementinthecoverageofhealthinterventionsthatcouldbeachievedbyeliminatingwithin-
country inequality is explored.
FEATURE STORIES ABOUT THE STATE OF INEQUALITY IN RMNCH
Conventional means of data visualization, such as static tables, graphs and maps, are presented in the report to illustrate the feature stories, while a multitude of other findings can be uncovered in the interactive visualization components that accompany each feature story. Readers can engage with these interactive visuals to animate the data behind feature stories and construct displays relevant to their own interests and needs.
The report concludes with a reflection on the state of inequality and reiterates the importance of health inequality monitoring and effective reporting as a means to inform health policies, programmes and practices (Chapter 5). Capacity-building for health inequality monitoring requires the equity orientation of health information systems, with improved collection, analysis and reporting of health data that are disaggregated by population subgroups. Health inequality monitoring is a growing priority on the global health agenda, particularly with the movement towards the progressive realization of universal health coverage. Reports about the state of inequality are warranted across all health topics.
STATE OF INEQUALITY: REPRODUCTIVE, MATERNAL, NEWBORN AND CHILD HEALTH
2
Background2.1 InequalityInequalities exist in many areas and can be measured using various indicators. Often, inequalities are quantified by comparing the national average value of an indicator across countries. Such national figures, however, do not account for inequalities that exist within countries, that is, between the different subgroups that comprise the national population. In addition to cross-country inequality, it is important to also consider within-country inequality, which captures the different experiences of men and women, boys and girls, rural and urban residents, the rich and the poor, the young and the old, the educated and the non-educated, etc.
Until recently, development goals and agendas have lacked a systematic focus on the reduction of within-country inequality. Emphasis has tended to be placed on improving the overall national situation (that is, the national average), with too little attention devoted to narrowing the gaps that exist between subgroups of the population. The Millennium Development Goals (MDGs), adopted in the year 2000, called for improvements in national averages, but did not address how efforts to achieve the goals might affect within-country inequality. While a country may be on track to achieve national MDG targets, the situation with respect to some subgroups of the population may have stagnated or even worsened over time. In the absence of inequality monitoring, it remains unknown whether countries have narrowed or widened the gap between the advantaged and the disadvantaged. Acknowledging this deficit, several subsequent initiatives have emerged that promote the practice of monitoring the state of inequality alongside actions to attain the targets specified in the MDGs.
The emerging post-2015 sustainable development agenda, which will be adopted at the United Nations summit in September 2015, cites equity as a central principle of the renewed global development goals and targets. Learning from the oversights of the past, the post-2015 development agenda recognizes the monitoring and reduction of inequalities as a global priority (2). Identifying and understanding inequalities helps to pinpoint the key drivers of inequity and, in turn, informs targeted action to improve the situation of the disadvantaged.
2
3

Inequalities are perpetuated when certain subgroups are routinely subject to discrimination, human rights violations and other structural barriers related to cultural, economic, environmental, political and social domains. These effects cumulate in stalled progress or deteriorating situations, which reinforce vulnerability, powerlessness and disadvantage. Unless actions are taken to benefit the most disadvantaged, they will continue to fall further behind. Efforts to achieve equity and reduce inequalities are warranted not only for the sake of social justice and human rights, but also because of the concomitant social, political and economic benefits.
2.2 Health inequality The health of the world’s population is in a state of inequality. That is to say, there are vastly different stories to tell about a person’s health depending on where they live, their level of education, and whether they are rich or poor, etc. Describing the state of inequality in health compares the experiences of population subgroups of different social classes, ages and sex. It sheds light on questions such as: how do mortality rates differ between rural and urban areas? Do the richest members of a population have better access to skilled health personnel than the poorest? Is there a difference between the levels of malnutrition among children born to women with higher versus lower levels of education? Finding answers to these – and similar – questions helps to identify those differences in health that are unjust, and is an important first step towards promoting health equity and the right to health.
Calling attention to the importance of health equity is neither a new, nor novel practice. The right to health is a fundamental human right, as affirmed in the WHO 1946 constitution and in numerous legally binding human rights conventions (3). Ensuring that all individuals of a population have the opportunity to realize the right to health sets nations on a course to develop and thrive. The Declaration of Alma-Ata, adopted in 1978, was among the first major international proclamations that identified the need for urgent action “to protect and promote the health of all people of the world” and recognize the inequalities in health that exist, both between countries and within them (4). The Global Strategy for Health for All was subsequently adopted by the World Health Assembly in 1981, prioritizing the achievement of equity in the way that health resources and health care are distributed and accessed (5).
Ahumanrightsbasedapproachtopromotinghealthisguidedbythekeyprinciplesofavailability;accessibility;acceptabilityand quality of facilities and services; participation; equality and non-discrimination; and accountability (6).
A HUMAN RIGHTS APPROACH TO PROMOTING HEALTH
More recently, this call to promote health among disadvantaged populations has been echoed through other important global initiatives, notably the Commission on Social Determinants of Health (7), and the Rio Political Declaration on Social Determinants of Health (8). Increasingly, global initiatives are orienting towards establishing health inequality monitoring practices and recommending tangible actions to reduce health inequalities, with a focus on accountability and results.
STATE OF INEQUALITY: REPRODUCTIVE, MATERNAL, NEWBORN AND CHILD HEALTH
4
The inclusion of universal health coverage as part of the health-related post-2015 sustainable development agenda puts equity at the forefront of a major global movement (9). The concept of universal health coverage encompasses two components: all people should be able to obtain high-quality, essential health interventions, which they should be able to access without experiencing undue financial hardship. Proposed targets for universal health coverage are that all populations achieve a minimum of 80% coverage of essential health interventions and 100% financial protection (9). The reduction of inequalities in both components – coverage of health interventions and financial protection – is key for the progressive realization of universal health coverage (10, 11). From the initial implementation of universal health coverage through to its realization, ongoing monitoring of the state of inequality is vital to ensure that disadvantaged populations are identified and prioritized.
Health inequalities are observable differences in health between subgroups of a population. Subgroups can be defined by demographic, geographic or socioeconomic factors such as age, economic status, education, place of residence and sex. Inequalities exist wherever there are differences in health indicators between subgroups. When health data are disaggregated – broken down by subgroups – they reveal differences between social groups that might have otherwise remained hidden behind the overall average.
Health inequity is a normative concept, defined as the avoidable and/or unjust differences in health between population subgroups. Statements about health equity involve a judgement about what is deemed to be right, fair or acceptable in a society. Measuring and monitoring health inequalities is a starting point from which health equity can be evaluated.
Toillustrate,socioeconomicdifferencesinunder-fivemortalityrates–basedon,forexample,economicstatusormother’seducation level – suggest a situation where inequality represents an inequity. The interpretation of sex-related inequality in under-five mortality, however, is more complex because under-five mortality rates tend to be higher in boys due to biological reasons that are not related to gender discrimination (12). Thus, an observed inequality may not constitute a situation of inequity.
INEQUALITY IN HEALTH VERSUS INEQUITY IN HEALTH
2.3 Reproductive, maternal, newborn and child healthInfancy, childhood and women’s childbearing years are widely recognized as critical junctures for lifelong health, and by extension, thriving and productive populations. Any level of preventable maternal or child mortality is unacceptable, and inequities associated with RMNCH interventions and outcomes warrant action. Improving RMNCH is the explicit focus of countless initiatives at regional, national and subnational levels, and is a priority area for international health and development organizations, such as WHO, World Bank, the United Nations Children’s Fund and the United Nations Population Fund (Table 2.1).
2. BACKGROUND
5
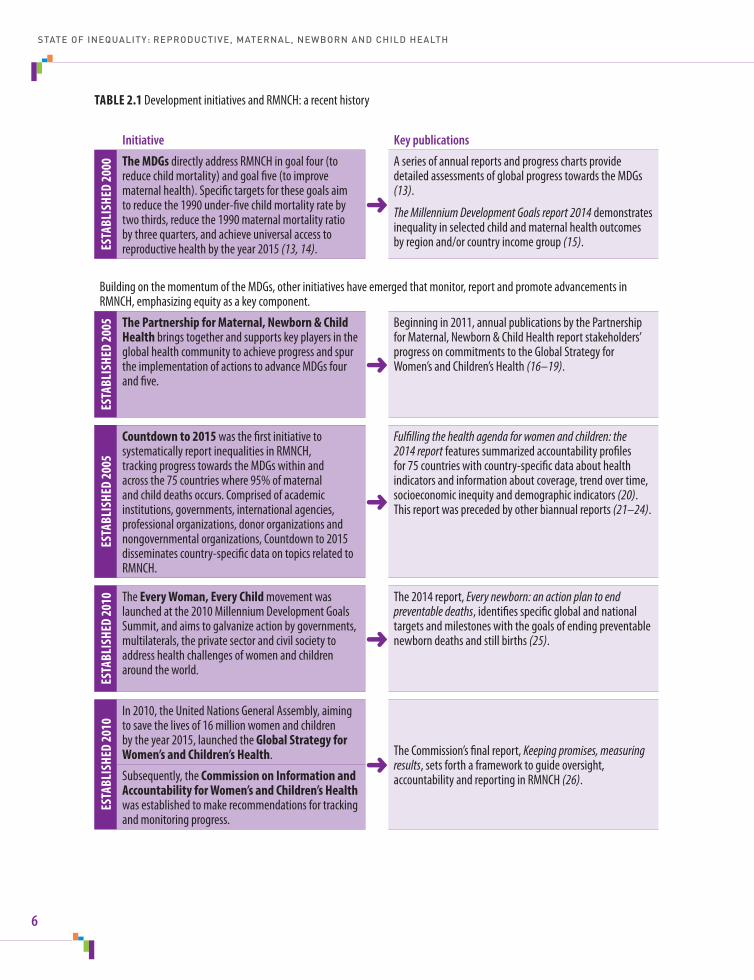
TABLE 2.1 Development initiatives and RMNCH: a recent history
Initiative Key publications
ESTA
BLIS
HED
2000 The MDGs directly address RMNCH in goal four (to
reduce child mortality) and goal five (to improve maternal health). Specific targets for these goals aim toreducethe1990under-fivechildmortalityratebytwothirds,reducethe1990maternalmortalityratioby three quarters, and achieve universal access to reproductivehealthbytheyear2015(13, 14).
➜
Aseriesofannualreportsandprogresschartsprovidedetailed assessments of global progress towards the MDGs (13).
The Millennium Development Goals report 2014 demonstrates inequality in selected child and maternal health outcomes by region and/or country income group (15).
Building on the momentum of the MDGs, other initiatives have emerged that monitor, report and promote advancements in RMNCH, emphasizing equity as a key component.
ESTA
BLIS
HED
2005 The Partnership for Maternal, Newborn & Child
Health brings together and supports key players in the global health community to achieve progress and spur the implementation of actions to advance MDGs four and five.
➜
Beginningin2011,annualpublicationsbythePartnershipforMaternal,Newborn&ChildHealthreportstakeholders’progress on commitments to the Global Strategy for Women’sandChildren’sHealth(16–19).
ESTA
BLIS
HED
2005
Countdown to 2015 was the first initiative to systematically report inequalities in RMNCH, tracking progress towards the MDGs within and acrossthe75countrieswhere95%ofmaternaland child deaths occurs. Comprised of academic institutions, governments, international agencies, professional organizations, donor organizations and nongovernmentalorganizations,Countdownto2015disseminates country-specific data on topics related to RMNCH.
➜
Fulfilling the health agenda for women and children: the 2014 report features summarized accountability profiles for75countrieswithcountry-specificdataabouthealthindicators and information about coverage, trend over time, socioeconomic inequity and demographic indicators (20). This report was preceded by other biannual reports (21–24).
ESTA
BLIS
HED
2010 The Every Woman, Every Child movement was
launchedatthe2010MillenniumDevelopmentGoalsSummit, and aims to galvanize action by governments, multilaterals, the private sector and civil society to address health challenges of women and children around the world.
➜
The2014report,Every newborn: an action plan to end preventable deaths, identifies specific global and national targets and milestones with the goals of ending preventable newborn deaths and still births (25).
ESTA
BLIS
HED
2010
In2010,theUnitedNationsGeneralAssembly,aimingtosavethelivesof16millionwomenandchildrenbytheyear2015,launchedtheGlobal Strategy for Women’s and Children’s Health.
➜TheCommission’sfinalreport,Keeping promises, measuring results, sets forth a framework to guide oversight, accountability and reporting in RMNCH (26).Subsequently, the Commission on Information and
Accountability for Women’s and Children’s Health was established to make recommendations for tracking and monitoring progress.
STATE OF INEQUALITY: REPRODUCTIVE, MATERNAL, NEWBORN AND CHILD HEALTH
6
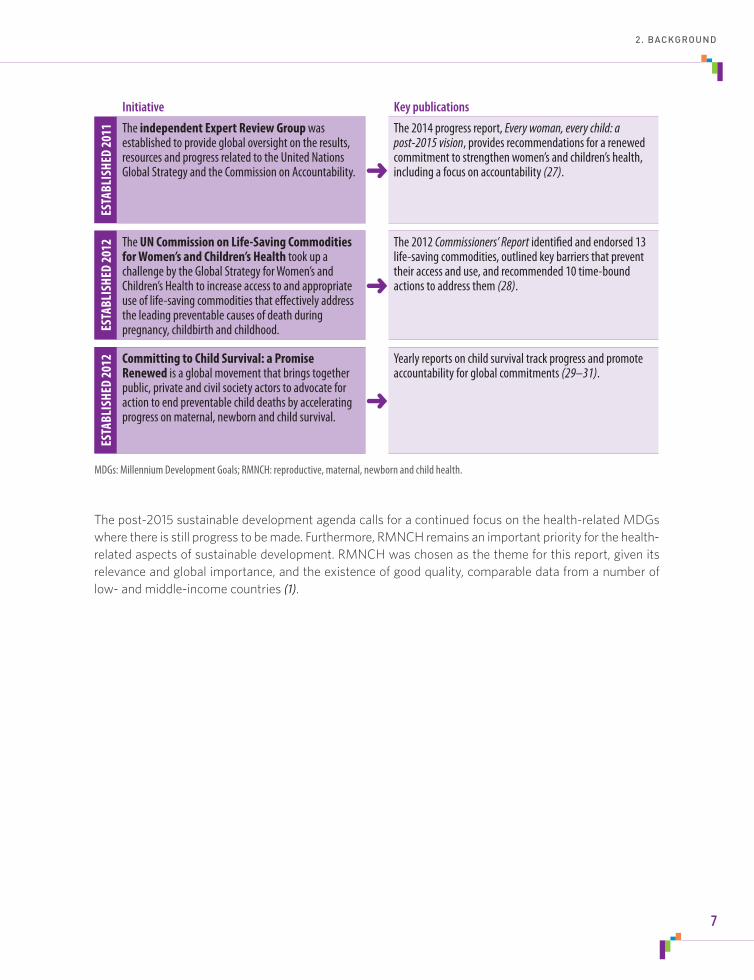
The post-2015 sustainable development agenda calls for a continued focus on the health-related MDGs where there is still progress to be made. Furthermore, RMNCH remains an important priority for the health-related aspects of sustainable development. RMNCH was chosen as the theme for this report, given its relevance and global importance, and the existence of good quality, comparable data from a number of low- and middle-income countries (1).
Initiative Key publicationsES
TABL
ISHE
D 20
11 The independent Expert Review Group was established to provide global oversight on the results, resourcesandprogressrelatedtotheUnitedNationsGlobalStrategyandtheCommissiononAccountability. ➜
The2014progressreport,Every woman, every child: a post-2015 vision, provides recommendations for a renewed commitmenttostrengthenwomen’sandchildren’shealth,including a focus on accountability (27).
ESTA
BLIS
HED
2012 The UN Commission on Life-Saving Commodities
for Women’s and Children’s Health took up a challengebytheGlobalStrategyforWomen’sandChildren’sHealthtoincreaseaccesstoandappropriateuse of life-saving commodities that effectively address the leading preventable causes of death during pregnancy, childbirth and childhood.
➜
The2012Commissioners’ Reportidentifiedandendorsed13life-saving commodities, outlined key barriers that prevent theiraccessanduse,andrecommended10time-boundactions to address them (28).
ESTA
BLIS
HED
2012 Committing to Child Survival: a Promise
Renewed is a global movement that brings together public, private and civil society actors to advocate for action to end preventable child deaths by accelerating progress on maternal, newborn and child survival.
➜
Yearly reports on child survival track progress and promote accountability for global commitments (29–31).
MDGs: Millennium Development Goals; RMNCH: reproductive, maternal, newborn and child health.
2. BACKGROUND
7

E V E R Y O N E E V E R Y W H E R E A L W A Y S

Monitoring the state of inequality in RMNCHAn understanding of the state of inequality reveals gaps in population health and lends insight into how policies, programmes and practices can be aligned to promote the ideal of health for all. This report presents selected examples of the state of inequality in low- and middle-income countries, highlighting important and relevant stories in RMNCH.
A complete assessment of the state of inequality should detail both the latest situation and change over time. Together, data about the current and past state of inequality in a country indicate how a country has progressed and is performing.
• Descriptionsofthelatestsituationofinequalityanswerthequestion:accordingtothelatestavailabledata, what is the status of inequality within a country?
• Investigationsofchangeovertimeusethelatestavailabledataandcomparabledatafromthepasttoexplore the question: how has the state of inequality changed?
First and foremost, reporting the state of inequality in RMNCH requires that relevant and comparable data be available from reliable sources for a number of countries. Then, these data must be analysed appropriately and presented in a meaningful way.
Comprehensive and transparent reporting provides the target audience with all the information necessary to understand the strengths, limitations and assumptions of the data and analytical methods that underlie the validity of the conclusions. In presenting this information, this report gives readers an appreciation of the steps and complexities involved in conducting health inequality monitoring.
3E V E R Y O N E E V E R Y W H E R E A L W A Y S
9

3.1 Data Two types of data are required for measuring within-country health inequality: data about “health indicators” that describe an individual’s experience of health (in terms of health intervention coverage and health outcomes) and data about “dimensions of inequality” that allow populations to be organized into subgroups according to their demographic, geographic and/or socioeconomic characteristics. Ideally, data sources should provide health indicator and dimension of inequality data that are reliable, of high quality and comparable across settings and over time.
3.1.1 Data sourcesThe health indicator and dimension of inequality data used in this report were sourced from Demographic and Health Surveys (DHS) and Multiple Indicator Cluster Surveys (MICS). DHS and MICS are large-scale, nationally representative household health surveys that are routinely conducted in low- and middle-income countries. Standardized questionnaires are used to collect information through face-to-face interviews with women aged 15–49 years. These surveys provide all the data required for health inequality monitoring – data about multiple health indicators, as well as data that allow disaggregation of health data according to a given dimension of inequality. By virtue of their design, DHS and MICS data have high comparability between settings and over time.
Further details about the data used here are available in Appendix 1.
3.1.2 Health indicator dataTwenty-three health indicators were selected to explore the state of inequality in RMNCH in this report, covering reproductive health interventions, maternal health interventions, newborn and child health interventions, child malnutrition and child mortality. These health indicators represent an array of diverse indicators within the topic, and were selected on the basis of data availability and relevancy, as evidenced by their inclusion in previous RMNCH initiatives (1, 20). The selected indicators are listed in Table 3.1. A detailed description of each indicator is available in Supplementary table S1 (appended to this report).
3.1.3 Dimension of inequality dataData on economic status, education level, place of residence and sex are used to categorize populations according to dimensions of inequality. These four dimensions of inequality represent common sources of discrimination, and can be widely applied to populations in low- and middle-income countries.
Economic status is described in terms of a household wealth index, which accounts for ownership of certain household items and access to specific services. On the basis of the wealth index, populations are categorized into five subgroups, the quintile with the lowest scores representing the poorest members of the population and the quintile with the highest, the richest (32). Education as a dimension of inequality reflects the level of education attained by a woman (in the case of the reproductive and maternal health interventions) or by a child’s mother (in the case of the newborn and child health indicators). Three subgroups are specified: no education, primary school education and secondary school or higher education. Place of residence (rural or urban) and child sex (female or male) each consist of two subgroups.
With the exception of the composite coverage index and the reproductive and maternal health indicators, analyses of health inequalities may be conducted according to all four dimensions of inequality (Table 3.2).
STATE OF INEQUALITY: REPRODUCTIVE, MATERNAL, NEWBORN AND CHILD HEALTH
10

TABLE 3.1 Selected RMNCH indicators used in this report
Category Indicator
Reproductive health interventions Contraceptive prevalence – modern and traditional methods (%)Contraceptive prevalence – modern methods (%)Demand for family planning satisfied (%)*
Maternal health interventions Antenatalcarecoverage–atleastonevisit(%)*Antenatalcarecoverage–atleastfourvisits(%)Births attended by skilled health personnel (%)*
Newborn and child health interventions Early initiation of breastfeeding (%)Childrenaged6–59monthswhoreceivedvitaminAsupplementation(%)BCG immunization coverage among one-year-olds (%)*Measles immunization coverage among one-year-olds (%)*Polio immunization coverage among one-year-olds (%)DTP3 immunization coverage among one-year-olds (%)*Full immunization coverage among one-year-olds (%)Children aged less than five years with diarrhoea receiving oral rehydration salts (%)Children aged less than five years with diarrhoea receiving oral rehydration therapy and continued feeding (%)*Children aged less than five years with pneumonia symptoms taken to a health facility (%)*
RMNCH interventions, combined Composite coverage index (%)
Child malnutrition Stunting prevalence in children aged less than five years (%)Underweightprevalenceinchildrenagedlessthanfiveyears(%)Wasting prevalence in children aged less than five years (%)
Child mortality Neonatalmortalityrate(deathsper1000livebirths)Infantmortalityrate(deathsper1000livebirths)Under-fivemortalityrate(deathsper1000livebirths)
BCG: one dose of Bacille Calmette-Guérin vaccine; DTP3: three doses of the combined diphtheria, tetanus toxoid and pertussis vaccine; RMNCH: reproductive, maternal, newborn and child health.* Indicator is part of the composite coverage index.
TABLE 3.2 Health indicator categories and relevant dimensions of inequality
Health indicator category(number of indicators) Economic status Education
Place of residence Sex
Reproductive health interventions (3) ✔ ✔ ✔
Maternal health interventions (3) ✔ ✔ ✔
Newborn and child health interventions (10) ✔ ✔ ✔ ✔
RMNCH interventions, combined (1) ✔ ✔ ✔
Child malnutrition (3) ✔ ✔ ✔ ✔
Child mortality (3) ✔ ✔ ✔ ✔
RMNCH: reproductive, maternal, newborn and child health.
3.1. DATA
11

3.1.4 Country selectionOverall, this report covers 86 low- and middle-income countries that have comparable data from recent surveys (either DHS or MICS) conducted between 2005 and 2013. These countries span all WHO regions. For 42 of these 86 countries, survey data are also available for a previous time point (that is, between 1995 and 2004), allowing for an assessment of the change within countries over a period of about 10 years. A full list of study countries, with details of survey type and year is given in Supplementary table S2 (appended to this report).
Afghanistan,Albania,Armenia,*Azerbaijan,Bangladesh,*Belarus,Belize,Benin,*Bhutan,Bolivia(PlurinationalStateof),*BosniaandHerzegovina,BurkinaFaso,*Burundi,Cambodia,*Cameroon,*CentralAfricanRepublic,Colombia,*Comoros,Congo,CostaRica,Côted’Ivoire,*Cuba,DemocraticRepublicoftheCongo,Djibouti,DominicanRepublic,*Egypt,*Ethiopia,*Gabon,* Gambia, Georgia, Ghana,* Guinea,* Guinea-Bissau, Guyana, Haiti,* Honduras, India,* Indonesia,* Iraq, Jamaica, Jordan,*Kazakhstan,*Kenya,*Kyrgyzstan,*LaoPeople’sDemocraticRepublic,Lesotho,*Liberia,Madagascar,*Malawi,*Maldives, Mali,* Mauritania, Mongolia, Montenegro, Mozambique,* Namibia,* Nepal,* Niger,* Nigeria,* Pakistan, Peru,* Philippines,* Republic of Moldova, Rwanda,* Sao Tome and Principe, Senegal,* Serbia, Sierra Leone, Somalia, Suriname, Swaziland,SyrianArabRepublic,Tajikistan,Thailand,TheformerYugoslavRepublicofMacedonia,Timor-Leste,Togo,*Uganda,*Ukraine,UnitedRepublicofTanzania,*Uzbekistan,*Vanuatu,VietNam,*Yemen,Zambia,*Zimbabwe*
*Denotes the 42 countries included in analyses of change over time.
STUDY COUNTRIES INCLUDED IN THIS REPORT
VIDEO CLIP 1. HEALTH INEQUALITY IS MULTIDIMENSIONAL
Watch a short video clip to explore the question: how do subgroup variations in under-five mortality rates differ between low-income countries and middle-income countries?
AVAILABLE ON CD/USB SCAN HERE
I n t e r a c t I v e v I s u a l I z at I o n o f H e a lt H D at a
ISBN 978 92 4 156491 5
© copyright world health organization, 2015. for free distribution.
World HealtH organization20, avenue appia
CH-1211 geneva 27SWitzerland
state of InequalItyreproductive, maternal,
newborn and child health
http://www.who.int/gho/health_equity/report_2015/
www.who.int/gho/health_equity/videos/en/
STATE OF INEQUALITY: REPRODUCTIVE, MATERNAL, NEWBORN AND CHILD HEALTH
12

3.2 Analysis The starting point for analysing health inequalities is data disaggregation. Disaggregated data show the level of health in each subgroup of a given dimension of inequality across each country, and can be used to explore the latest status of health inequality or change in inequality over time. In preparing this report, analyses of disaggregated data were done to capture the latest situation of inequality in RMNCH indicators, and then to determine how inequalities have changed over time.
For convenience and ease of understanding, health inequalities may be quantified in terms of summary measures; such measures build on disaggregated data, combining estimates of a given health indicator for two or more subgroups into a single numerical figure. Summary measures of inequality may be applied to assess the latest situation or change over time.
More details about the analysis methods used in this report are available in Appendix 1, and other methodological considerations are discussed more fully in Appendix 2.
3.2.1 Data disaggregationDrawing from household health surveys, disaggregated data for each of the health indicators can be generated. For example, data about stunting prevalence in children aged less than five years, an indicator of child malnutrition, may be broken down by the mother’s level of education. Assessing disaggregated data helps to answer questions such as: how did stunting vary between the education subgroups in a particular country? How do levels of stunting vary across countries for a given education subgroup?
Looking at disaggregated data over time helps to assess progress within subgroups and to compare progress between subgroups. Again, considering child stunting prevalence by mother’s education level, an analysis of disaggregated data from two or more time points helps to address questions such as: for a given country, did stunting prevalence increase or decrease in the least educated? The most educated? Were decreases in child stunting prevalence faster in the no education subgroup than in the secondary school or higher subgroup?
3.2.2 Summary measuresSummary measures are used to represent the degree of inequality in a health indicator across population subgroups in a single numerical figure. A number of summary measures are used throughout this report, namely difference, ratio, population attributable risk and absolute excess change (Table 3.3).
Difference and ratio are simple measures of inequality, expressing inequalities between two population subgroups. For example, difference and ratio can be applied to show inequality in under-five mortality rates by place of residence. For a given country, difference can be quantified by subtracting the urban from the rural rate; this provides an estimate of the absolute place-of-residence inequality. Relative place-of-residence inequality may be quantified by calculating the ratio of the urban to rural rates. Note that for dimensions of inequality that have more than two subgroups, such as economic status or education, difference and ratio measures often make comparisons between the most-advantaged and the most-disadvantaged subgroups.
3.2. ANALYSIS
13

TABLE 3.3 The calculation of selected summary measures and their application in this report
Summary measure Calculation Application
Difference(absolute inequality)*
The level of health intervention coverage in the most-disadvantaged subgroup is subtracted from health intervention coverage in the most-advantaged subgroup (or vice versa for child malnutrition and child mortality indicators).
Alldimensionsofinequality:economicstatus, education, place of residence, sexAllhealthindicators
Ratio(relative inequality)*
The level of health intervention coverage in the most-advantaged subgroup is divided by health intervention coverage in the most-disadvantaged subgroup (or vice versa for child malnutrition and child mortality indicators).
Alldimensionsofinequality:economicstatus, education, place of residence, sexAllhealthindicators
Population attributable risk (potential for improvement in national coverage)
The calculation shows the possible improvement in coverage by eliminating within-country inequality related to economic status, education or place of residence.
The national level of coverage is subtracted from the level of coverage in the most-advantaged subgroup.
Economic status, education and place of residenceHealth intervention indicators
Absoluteexcesschange** The absolute change in the most-advantaged subgroup is subtracted from the absolute change in the most-disadvantaged subgroup.
Alldimensionsofinequality:economicstatus, education, place of residence, sexAllhealthindicators
*FurtherdetailsaboutthesecalculationsareavailableinAppendixtableA1.2.**InformationabouthowtointerpretexcesschangeisprovidedinAppendix2.Reference subgroups for difference and ratio were selected based on convenience of data interpretation (that is, providing positive values for difference calculations and values above one for ratio calculations). For example, the poorest/no education/rural/males subgroups tended to have higher child mortality or higher prevalence of child malnutrition than the richest/secondary school or higher/urban/females subgroups, respectively. In the case of sex, this selection does not represent an assumed advantage of one sex over the other.
Absolutemeasuresofinequality,suchasdifference,reflectthemagnitudeofthedifferenceinhealthstatusbetweentwosubgroups.Forexample,DTP3immunizationcoverageof100%inonesubgroupand50%inanothersubgroupwouldmeanthatthereisanabsolutedifferenceincoverageof50percentagepoints.
Relative measures of inequality, such as ratio, are calculated as the quotient between two subgroups. For example, DTP3 immunizationcoverageof100%inonesubgroupand50%inanothersubgroupwouldgeneratearatioof2,implyingthat coverage in one group is twice that in the other.
ABSOLUTE VERSUS RELATIVE MEASURES OF INEQUALITY
STATE OF INEQUALITY: REPRODUCTIVE, MATERNAL, NEWBORN AND CHILD HEALTH
14

The population attributable risk takes into account the situation in all subgroups (the whole population). For health intervention indicators, this measure is based on the principle that each subgroup has the potential to achieve the same coverage as the most-advantaged subgroup. The measure can be interpreted as the potential for improvement in the national average of health intervention coverage that could be achieved by eliminating within-country inequality related to economic status, education or place of residence. In this report, population attributable risk is applied to assess the latest situation of inequality.
The absolute excess change summary measure can be used to answer questions such as: how much faster (or slower) was the change in the health indicator in the most-disadvantaged group compared with the most-advantaged group? This summary measure is applied to compare the change in a health indicator over time between two subgroups, building on the absolute change experienced by each of the two subgroups.
Absolute change shows how coverage in a single subgroup has changed over time. For example, the annual absolute change in contraceptive use among women in a given education subgroup can be calculated as the prevalence in the most recent survey minus the prevalence in an older survey, divided by the number of years between the two surveys. In this example, the annual absolute change is expressed in units of percentage points per year. From here, annual absolute excess change is calculated as the annual absolute change in the no education subgroup (the most disadvantaged) minus the annual absolute change in the secondary school or higher subgroup (the most advantaged). A positive excess change value indicates that the pace of change in contraceptive use over time was more favourable among women with no education compared with women who had attended secondary school or higher. In most cases, this means that contraceptive use increased faster in the disadvantaged subgroup (women with no education) than in the advantaged subgroup (women with secondary school or higher), which is a desired situation that indicates narrowing inequality. Other possible scenarios are explored in Appendix 2.
When assessing the extent of inequality across multiple study countries, the median value (middle point) of disaggregated data (or summary measures) is a useful statistic for summarizing the situation across a set of countries. For instance, the median value of multiple country estimates of stunting within the no education subgroup could be compared with the median value of multiple country estimates within the primary school subgroup and the secondary school or higher subgroup. This type of analysis helps to answer questions such as: did median stunting prevalence vary between education levels across countries? Was the median prevalence of stunting in the no education subgroup lower than the median prevalence in the secondary school or higher subgroup?
MEDIAN VALUES
3.2. ANALYSIS
15
3.3 ReportingReporting on health inequality provides information to a diverse group of stakeholders – policy-makers, technical staff in ministries of health, health professionals (including public health professionals), academics and others – and informs the development of equity-oriented policies, programmes and practices. Inequality data should be reported in a manner that considers not only what content is most relevant to the target audience, but also how that content can be effectively presented to that audience.
Considerations for assessing and reporting health inequality data are discussed in Appendix 2.
3.3.1 Data visualizationOne of the primary aims of this report is to showcase best practices in data visualization. The effective use of visual displays of health data helps to add meaning to otherwise cumbersome and complex datasets. Visual displays can communicate large amounts of information efficiently by accelerating and deepening understanding. Three common tools used to present data are tables, graphs and maps. Tables present data comprehensively, and are appropriate for situations where the audience requires precise information, such as exact numerical figures. Graphs highlight key messages, and may draw upon attributes such as colour, shading, shapes, lines, sizing and/or patterns of arrangement to deliver those messages. Maps are useful for presenting data with a geographical component, and can be effective for the visualization of disaggregated data. Appendix 3 provides an example of maps displaying stunting prevalence among children, disaggregated according to the mother’s level of education.
Throughout the report, both conventional and interactive data visuals have been employed to enhance the communication of the state of inequality in RMNCH. Conventional data visualization refers to the static visuals that appear throughout the text and appendices of this report, including tables, maps and graphs. Interactive data visualization features include story-points, as well as interactive country profiles, maps and reference tables. Tables, graphs and maps can be prepared as static (conventional) data visuals or as interactive features.
A guide to interpreting the primary types of visuals that are used in this report is provided in Appendix 4.
➜ Adashboard in an interactive visual is the term to describe the view that consolidates and presents multiple types of related data and information on a single screen. Often the components of a single dashboard are interconnected, and users may filter or highlight multiple components of the dashboard by clicking on one selection.
➜ Story-point is a feature that links several dashboards together in sequence, allowing users to be guided through data views and information in a story-like arrangement.
Forinformationabouttechniquesemployedininteractivedatavisualization,pleaserefertoAppendix5.
INTERACTIVE DATA VISUALIZATION TERMINOLOGY
STATE OF INEQUALITY: REPRODUCTIVE, MATERNAL, NEWBORN AND CHILD HEALTH
16

3.3.2 Feature storiesChapter 4 of this report contains a series of feature stories that describe current patterns and trends in the state of inequality in RMNCH. The stories highlight the latest situation and change over time with respect to selected RMNCH indicators and dimensions of inequality, illustrating how health inequality data can be interpreted and reported for a particular topic. Alongside each of the feature stories, conventional visuals (figures) illustrate key findings; additionally, interactive visuals can be accessed that expand upon the information presented in the feature stories, and allow further exploration RMNCH indicator data. Thus, readers can explore the underlying data, customizing the dashboards and engaging in benchmarking according to their interests. The feature stories presented here represent only a small sample of stories that can be told about the state of inequality in RMNCH.
Benchmarkingconsidersonecountry’sstatusinamultinationalcontext,drawingcomparisonswithothercountriesofthesame geographical region and/or economic situation. Benchmarking helps to answer the questions: how does the latest situation of inequality in one country compare among a group of countries with similar characteristics? Did inequality in onecountryincreaseordecreaseinthesamedirectionasothercountries?Andwasthepacefasterorslower?
BENCHMARKING
VIDEO CLIP 2. BENCHMARKING PUTS INEQUALITY IN CONTEXT
Watch a short video clip to explore the question: which countries increased modern contraceptive use at the national level and also decreased the place-of-residence inequality in this health intervention?
AVAILABLE ON CD/USB SCAN HERE
I n t e r a c t I v e v I s u a l I z at I o n o f H e a lt H D at a
ISBN 978 92 4 156491 5
© copyright world health organization, 2015. for free distribution.
World HealtH organization20, avenue appia
CH-1211 geneva 27SWitzerland
state of InequalItyreproductive, maternal,
newborn and child health
http://www.who.int/gho/health_equity/report_2015/
In Chapter 4, each feature story is linked to an interactive visual; these contain a large bank of data specific to the indicators of the featured RMNCH subtopic. Links to additional interactive components, including country profiles, maps, reference tablesandacomprehensiveinteractivevisualofallRMNCHinterventions,areavailableinAppendix6.
LinkstointeractivevisualscanbefoundinthegreenboxesthroughoutChapters4and5andAppendix6.AllinteractivevisualsarecontainedontheCDorUSBthataccompaniesthisreport,andcanbeviewedoffline.InteractivevisualscanbeaccessedonlinebyscanningtheQRcodeorfollowingtheURLprovided.
ACCESSING INTERACTIVE VISUALS
www.who.int/gho/health_equity/videos/en/
3.3. REPORTING
17

E V E R Y O N E E V E R Y W H E R E A L W A Y S
The state of inequality in RMNCH: stories from low- and middle-income countriesInequality in RMNCH is pervasive. Women, mothers, infants and children from low- and middle-income countries have a wide range of health experiences that are often correlated with underlying demographic, geographic and socioeconomic characteristics.
Inequalities were present in most RMNCH indicators across countries (as evidenced by the wide range in national estimates for various health indicators) and within countries (as evidenced by the range in subgroup estimates for various health indicators). There was also evidence of large variations in the level of within-country inequalities across countries.
Certain aspects of the state of inequality in RMNCH, however, are more optimistic. Change-over-time analyses demonstrated that improvements were frequently realized both nationally and in population subgroups. A comparison of the pace of change in disadvantaged subgroups versus advantaged subgroups often revealed faster improvements among the most disadvantaged. This suggests that, although inequalities in RMNCH still persist, they have narrowed over time.
4E V E R Y O N E E V E R Y W H E R E A L W A Y S
19

4.1 Reproductive health interventions Voluntary and effective use of contraception enables women to better make family planning decisions and helps to reduce maternal and infant deaths. Other benefits of contraceptive use include gains in women’s empowerment and equality, and increased opportunities for women to participate in educational, economic and development activities that benefit society and themselves (33). In 2012, contraceptive use was estimated to have prevented 218 million unintended pregnancies in developing countries; additionally, contraceptive use averted 55 million unplanned births, 138 million abortions, 25 million miscarriages and 118 000 maternal deaths (34).
Acknowledging that the unmet need for contraception is highest among the marginalized and the disadvantaged, reproductive health initiatives must appropriately support gender equality and prioritize the poor and other disadvantaged subgroups (35).
FEATURE STORY
EDUCATION-RELATED INEQUALITY IN MODERN CONTRACEPTIVE USE
MODERN CONTRACEPTIVE USE84low-andmiddle-incomestudycountries,DHSandMICS2005–2013 In half of study countries, at least one in three women reported using modern methods of contraception; nearly one quarter of study countries reported levels of modern contraceptive use of 50% or higher. Use was much lower (10% or less) in one tenth of study countries. Modern contraceptive use across study countries ranged from 1.2% in Somalia to 75.1% in Thailand.
LATEST SITUATION: BY EDUCATION LEVEL71low-andmiddle-incomestudycountries,DHSandMICS2005–2013
The use of modern methods of contraception tended to be lowest in women with no education, and generally increased across education levels. This pattern was evident in many of the study countries. The median values of contraceptive prevalence for each of the three education subgroups are compared in Figure 4.1, which illustrates greater prevalence of modern contraceptive use in subgroups with higher levels of education. Ethiopia is highlighted as one example of a country that demonstrated a gradient pattern of contraceptive use across education subgroups.
The gap in modern contraceptive use between the most- and least-educated women was substantial in many study countries. For example, in half of study countries, the prevalence of modern contraceptive use in the secondary school or higher subgroup exceeded the prevalence in the no education subgroup by over 14 percentage points. In the Central African Republic, Guinea-Bissau and Nigeria, contraceptive use among women in the highest education category was at least 10 times greater than that among women with no education.
STATE OF INEQUALITY: REPRODUCTIVE, MATERNAL, NEWBORN AND CHILD HEALTH
20

Large education-related inequalities in modern contraceptive use were not reported by all countries. Some countries reported relatively low levels of education-related inequality: Cambodia and the Dominican Republic, for example, had a difference of less than 1 percentage point between contraceptive use in the secondary school or higher subgroup and the no education subgroup. Bhutan, Maldives, Nepal and Viet Nam demonstrated higher usage among women with no education, with contraceptive use at least 7 percentage points higher in the no education subgroup than in the secondary school or higher subgroup.
The magnitude of inequality in modern contraceptive use did not appear to be associated with the national level of usage. For example, the overall prevalence of modern contraceptive use averaged around 35% in both the Plurinational State of Bolivia and Cambodia; whereas disaggregated data for Cambodia showed little education-related inequality, the Plurinational State of Bolivia reported a marked education-related difference in contraceptive use (usage was 21.0 percentage points greater among women with secondary schooling or higher than women with no education).
No education Primary school Secondary school +
0
10
20
30
40
50
60
70
80
90
100
Cov
erag
e (%
)
18.9
29.9
35.3
Circles indicate countries – each study country is represented on the graph by three circles. Horizontal lines indicate the median value (middle point) for each subgroup. Light grey bandsindicatetheinterquartilerange(middle50%ofstudycountryestimates).Highlighted country: Ethiopia.
FIGURE 4.1Contraceptiveprevalence(modernmethods)bywoman’seducationin71low-andmiddle-incomecountries:latestsituation(DHSandMICS2005–2013)
4.1. REPRODUCTIVE HEALTH INTERVENTIONS
21

No education Secondary school +
-2
-1
0
1
2
3
4
Ann
ual a
bsol
ute
chan
ge (p
erce
ntag
e po
ints
)
Change over time
-2
-1
0
1
2
3
4
Ann
ual a
bsol
ute
exce
ss c
hang
e (p
erce
ntag
e po
ints
)Excess change over time
Comparing change in no education with change in secondary school +
1.9
1.3
0.6
Circles indicate countries – each study country is represented by two circles in the change over time graph on the left (one for no education and one for secondary school or higher), and one circle on the excess change over time graph on the right. Horizontal lines indicate the median value (middle point) for each subgroup. Light grey bandsindicatetheinterquartilerange(middle50%ofstudycountryestimates).Highlighted country:Zambia.
FIGURE 4.2Contraceptiveprevalence(modernmethods)bywoman’seducationin38low-andmiddle-incomecountries:changeovertime(DHSandMICS1995–2004and2005–2013)
CHANGE OVER TIME: BY EDUCATION LEVEL38low-andmiddle-incomestudycountries,DHSandMICS1995–2004and2005–2013
The majority of low- and middle-income study countries included in change-over-time analyses reported national increases in modern contraceptive use between the two survey periods. Rwanda reported an especially elevated increase in the national prevalence of modern contraceptive use of 4.1 percentage points per year.
In most countries, the pace of increase in contraceptive use tended to be faster – or otherwise favourable – among women with no education than in women with secondary schooling or higher. In Zambia, for instance, the annual absolute increase was faster in the no education subgroup (1.9 percentage points per year) than the secondary school or higher subgroup (1.3 percentage points per year), resulting in a positive annual absolute excess change of 0.6 percentage points (Figure 4.2: highlighted circles).
The median absolute increase in contraceptive use across all study countries was 0.7 percentage points per year in the no education subgroup, and 0.2 percentage points per year in the secondary school or higher subgroup; the median absolute excess change was positive, reflecting a tendency for faster increases in contraceptive use among women in the no education subgroup (Figure 4.2).
STATE OF INEQUALITY: REPRODUCTIVE, MATERNAL, NEWBORN AND CHILD HEALTH
22
OTHER KEY FINDINGS: INEQUALITY IN REPRODUCTIVE HEALTH INTERVENTIONS
• Inoverhalfofstudycountries,thedemandforfamilyplanningsatisfiedwasatleast17percentagepointshigher among women with secondary school or higher education than in women with no education.
• Nearlyone thirdofstudycountries reportedconsiderableeconomic-related inequality in theuseofmodern and traditional contraception, with prevalence values at least twice as high in the richest compared with the poorest quintile of households.
• Overa10-yearperiod,moststudycountriesdemonstrated increasingnational levelsofdemandforfamily planning satisfied. In nearly half of study countries, increased national prevalence was realized alongside faster improvements in the poorest subgroups compared with the richest subgroups.
http://www.who.int/gho/health_equity/report_2015/
INTERACTIVE VISUAL 1. REPRODUCTIVE HEALTH INTERVENTIONS
Electronic visualization components accompany this report to enable independent data exploration and benchmarking.
This story-point interactive visual guides you through the state of inequality in this feature story and other reproductive health intervention indicators.
I n t e r a c t I v e v I s u a l I z at I o n o f H e a lt H D at a
ISBN 978 92 4 156491 5
© copyright world health organization, 2015. for free distribution.
World HealtH organization20, avenue appia
CH-1211 geneva 27SWitzerland
state of InequalItyreproductive, maternal,
newborn and child health
http://www.who.int/gho/health_equity/report_2015/
AVAILABLE ON CD/USB SCAN HERE
4.1. REPRODUCTIVE HEALTH INTERVENTIONS
23
4.2 Maternal health interventions Each year hundreds of thousands of women die for reasons related to pregnancy and child birth (36). Given that the risk of maternal death is highest immediately postpartum and in the following 24–48 hours, the presence of skilled health personnel during childbirth is a key intervention for preventing maternal and newborn deaths. In 2012, about 40 million births in developing regions were not attended by skilled health personnel (15).
Inequalities in maternal health have been widely acknowledged, both across countries (15, 37, 38) and within countries (1, 39). The proportion of births attended by skilled health personnel has been identified as the maternal health intervention indicator with the most pronounced economic-related inequality (39). Thus, improving on the coverage of this health intervention is a priority for initiatives that aim to promote maternal health.
FEATURE STORY
ECONOMIC-RELATED INEQUALITY IN BIRTHS ATTENDED BY SKILLED HEALTH PERSONNEL
BIRTHS ATTENDED BY SKILLED HEALTH PERSONNEL85low-andmiddle-incomestudycountries,DHSandMICS2005–2013 Almost half of low- and middle-income study countries reported that at least 80% of live births were attended by skilled health personnel; however, there was wide variation in the proportion of attended births across countries. Generally, the proportion of births attended by skilled health personnel was much lower across low-income countries than in middle-income countries. Study countries in the WHO European Region demonstrated little cross-country inequality in the proportion of births attended by skilled health personnel, with complete – or very high – levels of coverage for this intervention across all countries. The proportion of births attended by skilled health personnel in study countries of other regions, however, ranged from less than 12% to nearly 100%.
LATEST SITUATION: BY ECONOMIC STATUS83low-andmiddle-incomestudycountries,DHSandMICS2005–2013
Overall, the proportion of births attended by skilled health personnel increased with rising economic status: poorer subgroups typically experienced lower levels of skilled birth attendance than richer subgroups. This relationship was more pronounced in low-income study countries than in middle-income study countries. In low-income countries, the median coverage for this intervention ranged from 33.7% in the poorest to 89.0% in the richest quintile, whereas in the middle-income countries it ranged from 76.5% in the poorest to 98.1% in the richest quintile (Figure 4.3). Most study countries (90%) reported coverage of over 80% in the richest quintile, whereas only 30% of study countries reported this level of coverage in the poorest quintile.
STATE OF INEQUALITY: REPRODUCTIVE, MATERNAL, NEWBORN AND CHILD HEALTH
24

The variation in the proportion of births attended by skilled personnel was larger among the poorer quintiles of countries. Taking the group of middle-income study countries as an example, the interquartile range (middle 50% of study country estimates) was 58.9 percentage points in the poorest quintile of households, 26.3 percentage points in the middle quintile and 4.7 percentage points in the richest quintile (Figure 4.3).
Figure 4.4 plots economic-related inequality in skilled birth attendance (calculated as the difference in coverage between the richest and poorest quintiles, in percentage points, for each country) alongside national coverage. A clustering pattern of countries by WHO region can be observed. For example, most of the study countries from the WHO European Region demonstrated low or no economic-related inequality in skilled birth attendance alongside high or complete national coverage (Figure 4.4: grey triangles). Conversely, many countries from the WHO African Region reported high levels of economic-related inequality while national levels of skilled birth attendance spanned a wide range (Figure 4.4: brown circles).
Quintile 1(poorest) Quintile 2 Quintile 3 Quintile 4 Quintile 5
(richest)
0
10
20
30
40
50
60
70
80
90
100
Cov
erag
e (%
)
Low-income study countriesQuintile 1(poorest) Quintile 2 Quintile 3 Quintile 4 Quintile 5
(richest)
0
10
20
30
40
50
60
70
80
90
100
Cov
erag
e (%
)
Middle-income study countries
Within each subgroup, the top and bottom lines indicate maximum and minimum values, the centre line indicates the median value (middle point) and the light grey boxindicatestheinterquartilerange(middle50%ofstudycountryestimates).
FIGURE 4.3Birthsattendedbyskilledhealthpersonnelbyeconomicstatusin30low-incomeand53middle-incomecountries:latestsituation(DHSandMICS2005–2013)
4.2. MATERNAL HEALTH INTERVENTIONS
25

CHANGE OVER TIME: BY ECONOMIC STATUS42low-andmiddle-incomestudycountries,DHSandMICS1995–2004and2005–2013
The national proportion of births attended by skilled health personnel increased over the 10-year period between surveys in the majority of study countries (Figure 4.5: all countries to the right of the vertical grey zero line). Half of study countries reported an absolute increase in national coverage for this intervention of at least 1 percentage point per year, which translates into a 10 (or more) percentage point increase over 10 years (Figure 4.5: all countries to the right of the vertical orange median line).
Study countries reported variation in the pace of change between the poorest and richest subgroups in the proportion of births attended by skilled health personnel. In more than half of study countries, the annual absolute excess change was positive, reflecting a pro-poor trend of increasing coverage favouring the most disadvantaged (Figure 4.5: countries above the horizontal grey zero line).
Considering the pace of change in subgroups alongside change in national averages, about half of study countries reported a desirable situation: improved national average with increases in the poorest quintile outpacing the change in the richest quintile (Figure 4.5: countries in the top right quadrant – above and to the right of the grey zero lines). Several countries reported no change in national coverage and/or in economic-related inequality. For example, in Jordan and Kazakhstan there was no change in either national coverage or in economic-related inequality because these countries reported complete coverage at both time points.
0 10 20 30 40 50 60 70 80 90 100National average (%)
0
10
20
30
40
50
60
70
80
Diff
eren
ce b
etw
een
the
riche
st a
nd th
e po
ores
t qui
ntile
(per
cent
age
poin
ts)
Coloured shapes indicate countries – each study country is represented on the graph by one coloured shape. Each type of shape represents one WHO region. Dashed orange lines indicate the median values (middle points).
FIGURE 4.4 Births attended by skilled health personnel in 83 low- and middle-income countries (national average and within-countryeconomic-relatedinequality):latestsituation(DHSandMICS2005–2013)
AfricanRegion; RegionoftheAmericas; South-EastAsiaRegion; European Region; Eastern Mediterranean Region; Western Pacific Region
STATE OF INEQUALITY: REPRODUCTIVE, MATERNAL, NEWBORN AND CHILD HEALTH
26

OTHER KEY FINDINGS: INEQUALITY IN MATERNAL HEALTH INTERVENTIONS
• Forallthreedimensionsofinequality(economicstatus,educationandplaceofresidence),thelowestlevels of inequalities were reported for antenatal care coverage (at least one visit), followed by antenatal care coverage (at least four visits), and then births attended by skilled health personnel.
• Halfofstudycountriesreportedtheprevalenceofbirthsattendedbyskilledhealthpersonneltobeatleast 20 percentage points higher in urban than in rural areas.
• Onequarterofstudycountriesreportedthatantenatalcarecoverage(atleastfourvisits)wasatleasttwice as high in women with secondary schooling or higher than in women with no education.
• Inmoststudycountries,maternalhealthinterventionsdemonstratedfasterimprovements–ormorefavourable changes – in the most-disadvantaged subgroups (the poorest, the least educated and rural residents) over a 10-year period.
-3 -2 -1 0 1 2 3 4 5Annual absolute change in national average (percentage points)
-4
-3
-2
-1
0
1
2
3
4
Ann
ual a
bsol
ute
chan
ge in
the
poor
est c
ompa
red
with
the
riche
st q
uint
ile(p
erce
ntag
e po
ints
)
Kazakhstan
Jordan
Decrease in national averagePro-poor change
Decrease in national averagePro-rich change
Increase in national averagePro-rich change
Increase in national averagePro-poor change
Coloured shapes indicate countries – each study country is represented on the graph by one coloured shape. Each type of shape represents one WHO region. Dashed orange lines indicate the median values (middle points).
FIGURE 4.5 Births attended by skilled health personnel: change over time in national average (absolute change) and in the poorest comparedwiththerichestquintile(absoluteexcesschange)in42low-andmiddle-incomecountries(DHSandMICS1995–2004and2005–2013)
AfricanRegion; RegionoftheAmericas; South-EastAsiaRegion; European Region; Eastern Mediterranean Region; Western Pacific Region
4.2. MATERNAL HEALTH INTERVENTIONS
27

http://www.who.int/gho/health_equity/report_2015/
INTERACTIVE VISUAL 2. MATERNAL HEALTH INTERVENTIONS
Electronic visualization components accompany this report to enable independent data exploration and benchmarking.
This story-point interactive visual guides you through the state of inequality in this feature story and other maternal health intervention indicators.
AVAILABLE ON CD/USB SCAN HERE
I n t e r a c t I v e v I s u a l I z at I o n o f H e a lt H D at a
ISBN 978 92 4 156491 5
© copyright world health organization, 2015. for free distribution.
World HealtH organization20, avenue appia
CH-1211 geneva 27SWitzerland
state of InequalItyreproductive, maternal,
newborn and child health
http://www.who.int/gho/health_equity/report_2015/
STATE OF INEQUALITY: REPRODUCTIVE, MATERNAL, NEWBORN AND CHILD HEALTH
28

4.3 Care-seeking for sick childrenMany of the deaths in children under the age of five years could be averted by early, low-cost, appropriate interventions in the home or community. Unfortunately, many countries fall short in making these early interventions widely available, and large numbers of sick children do not have contact with health facilities.
Pneumonia is a major cause of death in children under five years of age, and the leading infectious cause of death in children under five years (40). It accounts for 15% of child deaths, and resulted in an estimated 935 000 deaths in children under five years in 2013 (41). Treatment for pneumonia with antibiotics is well established, safe and effective, yet many children who need these drugs fail to receive them.
Initiatives to end preventable childhood deaths due to pneumonia and diarrhoea build on the principles of protecting children by promoting good health practices from birth, preventing ill health and intervening early with appropriate treatments.
FEATURE STORY
PLACE-OF-RESIDENCE INEQUALITY IN CARE-SEEKING FOR CHILDREN WITH PNEUMONIA SYMPTOMS
CHILDREN AGED LESS THAN FIVE YEARS WITH PNEUMONIA SYMPTOMS TAKEN TO A HEALTH FACILITY85low-andmiddle-incomestudycountries,DHSandMICS2005–2013 In about 1 in 10 countries, at least 80% of children under five years of age with pneumonia symptoms was taken to a health facility. However, nearly one third of study countries had low rates of care-seeking, around 50% or less. The national prevalence of care-seeking for children with pneumonia symptoms ranged from 13.0% in Somalia to 96.5% in Cuba.
LATEST SITUATION: BY PLACE OF RESIDENCE 72low-andmiddle-incomestudycountries,DHSandMICS2005–2013 When disaggregated by place of residence, the prevalence of care-seeking for children with pneumonia symptoms differed greatly between rural and urban areas. Three quarters of low- and middle-income study countries reported a higher level of care-seeking in urban than in rural areas. While 14% of study countries reported the prevalence of care-seeking to be at least 80% in urban areas, only 6% of study countries achieved this level of coverage in rural areas.
The variation in care-seeking behaviour across study countries was less extreme among urban than among rural residents, as indicated by the smaller size of the interquartile range (middle 50% of study country estimates). The interquartile range for urban areas was 19.8 percentage points, whereas for rural areas, the interquartile range was 30.7 percentage points (Figure 4.6: light grey boxes).
4.3. CARE-SEEKING FOR SICK CHILDREN
29

Almost one in five study countries reported the prevalence of care-seeking for children with pneumonia symptoms to be at least 20 percentage points higher in urban than in rural areas. The largest absolute inequality was reported by Guinea, where the level of care-seeking was 40.1 percentage points higher in the urban than in the rural subgroup.
Pro-urban inequality, however, was not always the case. In a minority of study countries, levels of care-seeking were higher in rural than in urban areas (pro-rural). Countries such as Bosnia and Herzegovina, Cuba, Serbia and Thailand reported an optimal overall situation, with low place-of-residence absolute inequality (5 percentage points or less) and national coverage exceeding 80%.
CHANGE OVER TIME: BY PLACE OF RESIDENCE33low-andmiddle-incomestudycountries,DHSandMICS1995–2004and2005–2013
Many countries reported improved national levels of care-seeking for children with pneumonia symptoms, with increases in both rural and urban areas. Overall, half of study countries saw care-seeking increase by at least 10 percentage points in rural areas over 10 years. Of all study countries, the fastest rural improvement was a 46.0 percentage point increase over 10 years, achieved in Malawi. Across urban areas, the median improvement in the prevalence of care-seeking for children with pneumonia symptoms was about 6 percentage points over 10 years. The most pronounced urban gain was reported in Rwanda, with an increase of 51.3 percentage points over 10 years.
Rural Urban
0
10
20
30
40
50
60
70
80
90
100
Cov
erag
e (%
)
Within each subgroup, the top and bottom lines indicate maximum and minimum values, the centre line indicates the median value (middle point) and the light grey boxindicatestheinterquartilerange(middle50%ofstudycountryestimates).
FIGURE 4.6 Children aged less than five years with pneumonia symptoms taken to a health facility by place of residence in 72 low- andmiddle-incomecountries:latestsituation(DHSandMICS2005–2013)
STATE OF INEQUALITY: REPRODUCTIVE, MATERNAL, NEWBORN AND CHILD HEALTH
30

Comparing the pace of change in care-seeking for children with pneumonia symptoms in rural and urban areas, two thirds of study countries indicated a pro-rural situation (that is, a faster increase or slower decrease in rural areas compared with urban areas) (Figure 4.7: countries above the horizontal grey zero line). Burkina Faso and Malawi, for example, reported considerable national-level gains, driven by faster progress in rural than in urban areas. The optimal situation – an increasing national average coupled with a pro-rural change – was achieved by about half of study countries (Figure 4.7: countries in the top right quadrant – above and to the right of the grey zero lines).
Cambodia reported an increase in national average with an equal pace of improvement in rural and urban areas.
A minority of study countries reported changes that were pro-urban (Figure 4.7: countries below the horizontal grey zero line). In Rwanda, a considerable increase in the national prevalence of care-seeking was reported; however, this was achieved through faster gains in urban areas than in rural areas by a margin of 20.6 percentage points over 10 years. Namibia and Nepal also reported large improvements in national averages driven by pro-urban changes of around 5 percentage points over the 10-year period.
-3 -2 -1 0 1 2 3 4 5Annual absolute change in national average (percentage points)
-3
-2
-1
0
1
2
3
Ann
ual a
bsol
ute
chan
ge in
rura
l com
pare
d w
ith u
rban
are
as (p
erce
ntag
e po
ints
) Decrease in national averagePro-rural change
Increase in national averagePro-urban change
Increase in national averagePro-rural change
Decrease in national averagePro-urban change
Rwanda
Cambodia
NamibiaNepal
MalawiBurkina Faso
Coloured shapes indicate countries – each study country is represented on the graph by one coloured shape. Each type of shape represents one WHO region. Dashed orange lines indicate the median values (middle points).
FIGURE 4.7 Children aged less than five years with pneumonia symptoms taken to a health facility: change over time in national average (absolute change) and in rural compared with urban areas (absolute excess change) in 33 low- and middle-income countries (DHSandMICS1995–2004and2005–2013)
AfricanRegion; RegionoftheAmericas; South-EastAsiaRegion; European Region; Eastern Mediterranean Region; Western Pacific Region
4.3. CARE-SEEKING FOR SICK CHILDREN
31

OTHER KEY FINDINGS: INEQUALITY IN CARE-SEEKING FOR SICK CHILDREN
• Inhalfofstudycountries,therewasatleasta20percentagepointgapincare-seekingforchildrenwithpneumonia symptoms between the poorest and richest subgroups.
• Inoveronethirdofstudycountries,thedifferencebetweenruralandurbanareasintheprevalenceoftreating diarrhoea with oral rehydration therapy and continued feeding was low, at less than 5 percentage points; the maximum place-of-residence difference, however, approached 40 percentage points.
• Overa10-yearperiod,theuseoforalrehydrationsaltstotreatdiarrhoeainchildrenundertheageoffive years increased in two thirds of study countries; in the majority of these countries with increasing national figures, this change was pro-rural (that is, the proportion of children with diarrhoea who were treated increased more rapidly in rural than in urban areas).
http://www.who.int/gho/health_equity/report_2015/
INTERACTIVE VISUAL 3. CARE-SEEKING FOR SICK CHILDREN
Electronic visualization components accompany this report to enable independent data exploration and benchmarking.
This story-point interactive visual guides you through the state of inequality in this feature story and other care-seeking for sick children indicators.
AVAILABLE ON CD/USB SCAN HERE
I n t e r a c t I v e v I s u a l I z at I o n o f H e a lt H D at a
ISBN 978 92 4 156491 5
© copyright world health organization, 2015. for free distribution.
World HealtH organization20, avenue appia
CH-1211 geneva 27SWitzerland
state of InequalItyreproductive, maternal,
newborn and child health
http://www.who.int/gho/health_equity/report_2015/
STATE OF INEQUALITY: REPRODUCTIVE, MATERNAL, NEWBORN AND CHILD HEALTH
32

4.4 Childhood immunization The coverage of childhood immunization has risen substantially over the past decades, which has contributed significantly to falling child mortality rates. However, diseases that are preventable by vaccines currently recommended by WHO still claim the lives of 1.5 million children every year. Approximately 17% of deaths in children under five years (0–59 months) and 29% of deaths in children aged 1–59 months are vaccine preventable (42).
In 2013, 84% of infants worldwide received DTP3 immunization, an increase from 76% of infants in 1990. Similar gains have been seen in polio and measles immunization, which now reach at least 80% of infants in the majority of countries worldwide. Despite the recent progress in immunization coverage, in 2013, 21.8 million children under the age of one year did not receive the DTP3 vaccine; most of these unprotected children (70%) live in just 10 underserved countries (42).
Improving immunization coverage is widely recognized as a successful and cost-effective intervention to improve child health and reduce child mortality.
FEATURE STORY
ECONOMIC-RELATED INEQUALITY IN DTP3 IMMUNIZATION COVERAGE
DTP3 IMMUNIZATION COVERAGE AMONG ONE-YEAR-OLDS81low-andmiddle-incomestudycountries,DHSandMICS2005–2013 Overall, half of low- and middle-income study countries reported DTP3 immunization coverage of about 80% or higher among one-year-olds. DTP3 immunization coverage was above 90% in more than one quarter of study countries.
LATEST SITUATION: BY ECONOMIC STATUS 78low-andmiddle-incomestudycountries,DHSandMICS2005–2013 Overall, DTP3 immunization coverage was lower in children from poorer households. Across study countries, DTP3 immunization coverage tended to increase with rising economic status. Half of study countries achieved coverage of at least 73% in the poorest quintile, whereas for the richest quintile, half of study countries reported coverage of over 86% (Figure 4.8).
Study countries were more likely to report DTP3 immunization coverage of over 80% in richer than in poorer quintiles: 73% of countries achieved this level of coverage among the richest quintile, while only 38% of countries achieved this level of coverage among the poorest quintile.
The degree of within-country economic-related inequality varied from country to country. In more than one quarter of study countries, there was no – or very little – difference in DTP3 immunization coverage between the richest and poorest quintiles (less than 5 percentage points). On the other hand, pronounced levels of inequality (absolute differences of at least 25 percentage points between the richest and poorest quintiles) were apparent in one quarter of study countries.
4.4. CHILDHOOD IMMUNIZATION
33
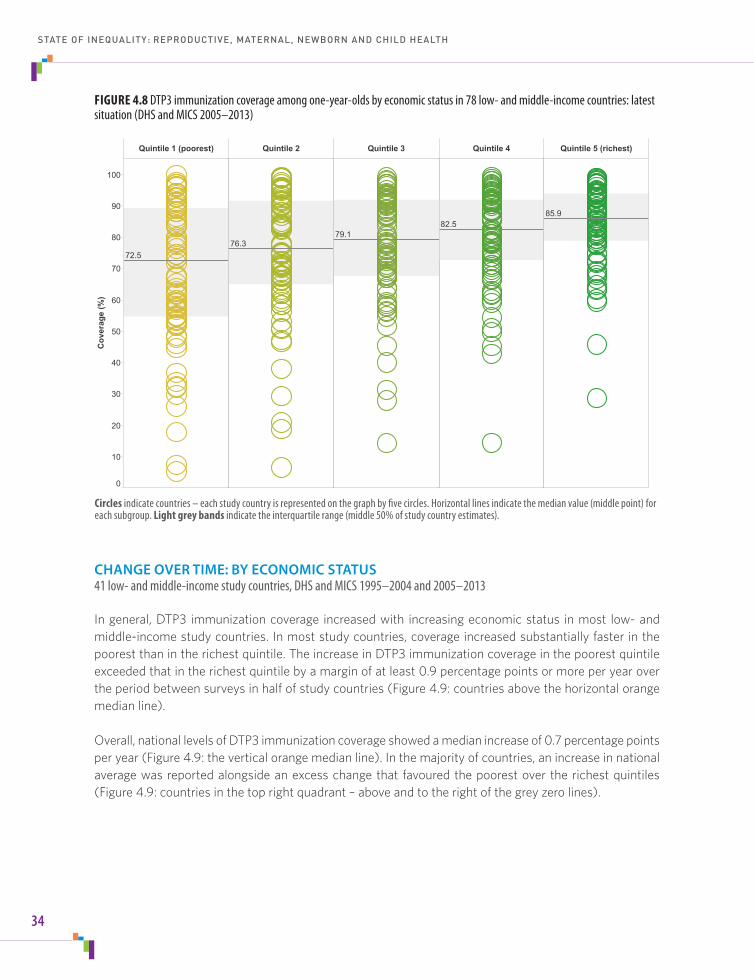
CHANGE OVER TIME: BY ECONOMIC STATUS 41low-andmiddle-incomestudycountries,DHSandMICS1995–2004and2005–2013 In general, DTP3 immunization coverage increased with increasing economic status in most low- and middle-income study countries. In most study countries, coverage increased substantially faster in the poorest than in the richest quintile. The increase in DTP3 immunization coverage in the poorest quintile exceeded that in the richest quintile by a margin of at least 0.9 percentage points or more per year over the period between surveys in half of study countries (Figure 4.9: countries above the horizontal orange median line).
Overall, national levels of DTP3 immunization coverage showed a median increase of 0.7 percentage points per year (Figure 4.9: the vertical orange median line). In the majority of countries, an increase in national average was reported alongside an excess change that favoured the poorest over the richest quintiles (Figure 4.9: countries in the top right quadrant – above and to the right of the grey zero lines).
Quintile 1 (poorest) Quintile 2 Quintile 3 Quintile 4 Quintile 5 (richest)
0
10
20
30
40
50
60
70
80
90
100
Cov
erag
e (%
)
72.576.3
79.182.5
85.9
Circles indicate countries – each study country is represented on the graph by five circles. Horizontal lines indicate the median value (middle point) for each subgroup. Light grey bandsindicatetheinterquartilerange(middle50%ofstudycountryestimates).
FIGURE 4.8 DTP3 immunization coverage among one-year-olds by economic status in 78 low- and middle-income countries: latest situation(DHSandMICS2005–2013)
STATE OF INEQUALITY: REPRODUCTIVE, MATERNAL, NEWBORN AND CHILD HEALTH
34
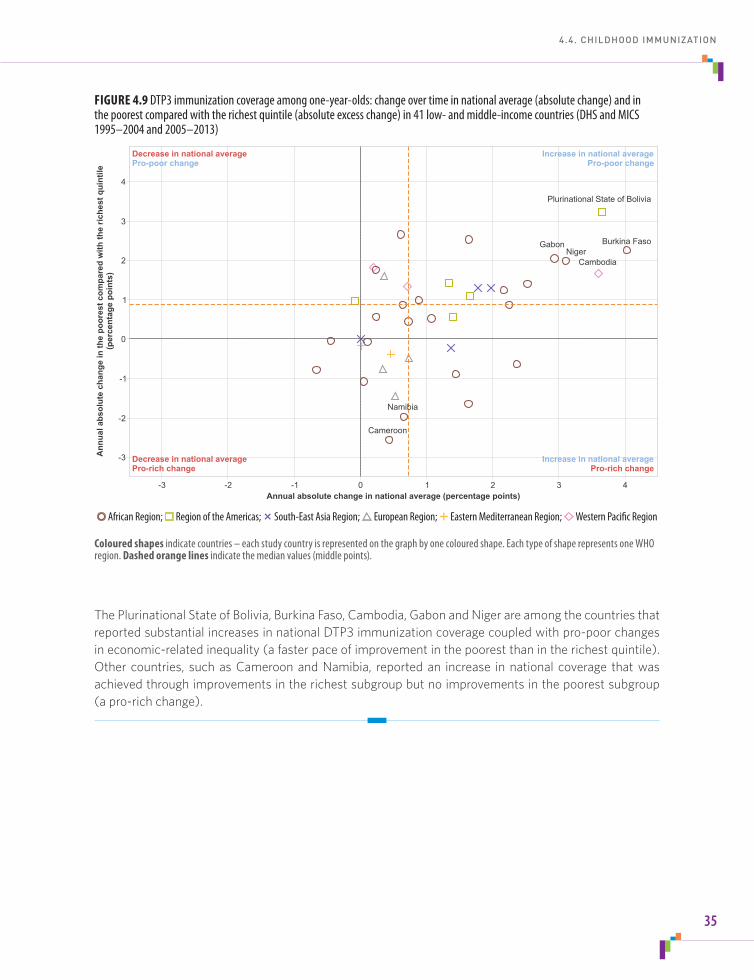
The Plurinational State of Bolivia, Burkina Faso, Cambodia, Gabon and Niger are among the countries that reported substantial increases in national DTP3 immunization coverage coupled with pro-poor changes in economic-related inequality (a faster pace of improvement in the poorest than in the richest quintile). Other countries, such as Cameroon and Namibia, reported an increase in national coverage that was achieved through improvements in the richest subgroup but no improvements in the poorest subgroup (a pro-rich change).
-3 -2 -1 0 1 2 3 4Annual absolute change in national average (percentage points)
-3
-2
-1
0
1
2
3
4
Ann
ual a
bsol
ute
chan
ge in
the
poor
est c
ompa
red
with
the
riche
st q
uint
ile(p
erce
ntag
e po
ints
)
Decrease in national averagePro-poor change
Increase in national averagePro-poor change
Decrease in national averagePro-rich change
Increase in national averagePro-rich change
Burkina Faso
Plurinational State of Bolivia
Cambodia
GabonNiger
Cameroon
Namibia
Coloured shapes indicate countries – each study country is represented on the graph by one coloured shape. Each type of shape represents one WHO region. Dashed orange lines indicate the median values (middle points).
FIGURE 4.9 DTP3 immunization coverage among one-year-olds: change over time in national average (absolute change) and in thepoorestcomparedwiththerichestquintile(absoluteexcesschange)in41low-andmiddle-incomecountries(DHSandMICS1995–2004and2005–2013)
AfricanRegion; RegionoftheAmericas; South-EastAsiaRegion; European Region; Eastern Mediterranean Region; Western Pacific Region
4.4. CHILDHOOD IMMUNIZATION
35

OTHER KEY FINDINGS: INEQUALITY IN CHILDHOOD IMMUNIZATION
• Inmoststudycountries,therewasno–orverylittle–differenceinimmunizationcoveragebetweenboys and girls.
• Economic-relatedabsolute inequalitiesweremorepronounced inDTP3andmeasles immunizationcoverage than in Bacille Calmette-Guérin (BCG) and polio immunization coverage.
• Aconsiderableproportionofstudycountries(about40%)reportedlargeeconomic-relatedinequalitiesin full immunization coverage, with coverage at least 20 percentage points higher in the richest than in the poorest quintiles.
• Overa10-yearperiod,over85%ofstudycountriesreportedincreasesinmeaslesimmunizationcoverage.In all but a few countries, rural areas showed similar or faster improvements than urban areas.
• Overa10-yearperiod,over80%ofstudycountriesachievednational-levelincreasesinfullimmunizationcoverage; in the majority of these countries with national improvements, coverage increased faster in the poorest than in the richest quintile.
http://www.who.int/gho/health_equity/report_2015/
INTERACTIVE VISUAL 4. CHILDHOOD IMMUNIZATION
Electronic visualization components accompany this report to enable independent data exploration and benchmarking.
This story-point interactive visual guides you through the state of inequality in this feature story and other childhood immunization indicators.
AVAILABLE ON CD/USB SCAN HERE
I n t e r a c t I v e v I s u a l I z at I o n o f H e a lt H D at a
ISBN 978 92 4 156491 5
© copyright world health organization, 2015. for free distribution.
World HealtH organization20, avenue appia
CH-1211 geneva 27SWitzerland
state of InequalItyreproductive, maternal,
newborn and child health
http://www.who.int/gho/health_equity/report_2015/
STATE OF INEQUALITY: REPRODUCTIVE, MATERNAL, NEWBORN AND CHILD HEALTH
36

4.5 Child malnutritionChildren who are undernourished at a young age may experience poor cognitive development, and miss out on a critical window for optimizing adult height, lean body mass, intelligence and educational achievement, economic productivity, and reproductive performance (20). Stunting refers to inadequate length or height for age, and affects about 161 million young children globally (43). It is commonly the outcome of insufficient or low-quality diets, poor childcare and frequent infections. Child stunting is the most sensitive indicator of a child’s quality of life (20), and is widely employed as a marker for malnutrition among children.
Effective action to reduce and eliminate child malnutrition – and thereby alleviate short- and long-term adverse health consequences – must be comprehensive and multifaceted, building upon efforts to address immediate concerns about hunger and food availability. This means taking action to improve both the root causes of malnutrition (such as household and family factors, inadequate complementary feeding, early cessation of breastfeeding and frequent infections) and its broader underlying social, economic and environmental determinants (44).
FEATURE STORY
EDUCATION-RELATED INEQUALITY IN STUNTING PREVALENCE IN CHILDREN
STUNTING PREVALENCE IN CHILDREN AGED LESS THAN FIVE YEARS 78low-andmiddle-incomestudycountries,DHSandMICS2005–2013 In half of study countries, nearly one in every three children under the age of five years was classified as stunted. Over one quarter of countries had a national stunting prevalence of under 20% but another quarter had a prevalence of 40% or higher. Overall, stunting in children under five years of age was more prevalent in low-income study countries than in middle-income study countries.
LATEST SITUATION: BY EDUCATION LEVEL 66low-andmiddle-incomestudycountries,DHSandMICS2005–2013 In most countries, stunting prevalence in children was lower among the subgroup with the highest level of maternal education. That is, the no education subgroup tended to have the highest prevalence of stunting, the primary school subgroup had the second highest prevalence, and the secondary school or higher subgroup had the lowest prevalence. In both low-income and middle-income study countries, the median prevalence of stunting decreased most sharply between mothers who received primary-level schooling and those who attended secondary school or higher (relative to the decrease between no education and primary school subgroups) (Figure 4.10)
In half of study countries, the absolute difference in stunting prevalence between the secondary school or higher subgroup and the no education subgroup was 15 percentage points or higher; this education-related difference in stunting prevalence reached a maximum of 38.6 percentage points in Honduras, and the minimum inequality was 0.9 percentage points in Gabon.
4.5. CHILD MALNUTRITION
37

Interesting patterns emerge if the degree of education-related inequality in stunting prevalence is viewed alongside national levels of stunting. A low national prevalence of stunting did not necessarily indicate a favourable situation in terms of inequality. Study countries from the WHO Region of the Americas, for example, demonstrated relatively low stunting prevalence (compared with the median of study countries from all WHO regions), but a wide range of levels of inequality. Belize, Guyana, Haiti, Honduras and Peru all reported a national stunting prevalence of around 20%, but absolute inequality (the difference between the most and least educated) ranged from 8.1 percentage points in Guyana to 38.6 percentage points in Honduras.
CHANGE OVER TIME: BY EDUCATION LEVEL 29low-andmiddle-incomestudycountries,DHSandMICS1995–2004and2005–2013 Overall, the prevalence of stunting tended to decrease over time in all education subgroups. However, annual absolute excess change values revealed considerable variation across countries in terms of the pace of change in stunting prevalence in education subgroups. The Dominican Republic, Malawi, Mali, Mozambique, Zambia and Zimbabwe, for instance, all reported improvements in the least-educated subgroup but no improvement or worsening in the most-educated subgroup; for these countries, excess change indicated a situation that was more favourable among the least educated (that is, pro less-
No education Primary school Secondary school +
0
10
20
30
40
50
60
70
Prev
alen
ce (%
)
Low-income study countries
No education Primary school Secondary school +
0
10
20
30
40
50
60
70
Prev
alen
ce (%
)
Middle-income study countries
Within each subgroup, the top and bottom lines indicate maximum and minimum values, the centre line indicates the median value (middle point) and the light grey boxindicatestheinterquartilerange(middle50%ofstudycountryestimates).
FIGURE 4.10Stuntingprevalenceinchildrenagedlessthanfiveyearsbymother’seducationin30low-incomeand36middle-incomecountries:latestsituation(DHSandMICS2005–2013)
STATE OF INEQUALITY: REPRODUCTIVE, MATERNAL, NEWBORN AND CHILD HEALTH
38

educated). Jordan realized improvements in all subgroups, with substantially faster reductions in stunting prevalence in the no education subgroup relative to the secondary school or higher subgroup; improvements among the least educated outpaced those in the most educated by 11 percentage points over 10 years. Cambodia had similar rates of improvement in all education subgroups, and thus education-related inequality remained unchanged.
All but a few study countries reported an improvement (or no change) in national stunting prevalence over time (Figure 4.11: countries to the left of the vertical grey line). In half of study countries, the national prevalence of stunting decreased by at least 6 percentage points over 10 years (Figure 4.11: countries to the left of the vertical orange median line). More than half of study countries fell into the most desirable quadrant, having achieved a decrease in national stunting prevalence and a faster pace of improvement in the least-educated subgroup (Figure 4.11: countries in the bottom left quadrant – below and to the left of the grey zero lines).
-2 -1 0 1 2Annual absolute change in national average (percentage points)
-2
-1
0
1
2
Ann
ual a
bsol
ute
chan
ge in
the
no e
duca
tion
com
pare
d w
ith th
ese
cond
ary
scho
ol +
sub
grou
p (p
erce
ntag
e po
ints
)
-0.6
-0.3
Decrease in national averagePro less-educated change
Increase in national averagePro less-educated change
Decrease in national averagePro more-educated change
Increase in national averagePro more-educated change
Coloured shapes indicate countries – each study country is represented on the graph by one coloured shape. Each type of shape represents one WHO region. Dashed orange lines indicate the median values (middle points).
FIGURE 4.11 Stunting prevalence in children aged less than five years: change over time in national average (absolute change) and in the least-educated compared with the most-educated subgroup (absolute excess change) in 29 low- and middle-income countries(DHSandMICS1995–2004and2005–2013)
AfricanRegion; RegionoftheAmericas; South-EastAsiaRegion; European Region; Eastern Mediterranean Region; Western Pacific Region
4.5. CHILD MALNUTRITION
39

OTHER KEY FINDINGS: INEQUALITY IN CHILD MALNUTRITION
• Inmoststudycountries,theprevalenceofunderweightinchildrenundertheageoffiveyearswashighestin disadvantaged populations (the poorest, the least educated and those residing in rural areas).
• Inovertwothirdsofstudycountries,underweightprevalenceinchildrenunderfiveyearsofagewasatleast twice as high in the poorest relative to the richest quintiles.
• Inthemajorityofstudycountries,stuntingprevalenceamongallchildrenunderfiveyearsdecreasedover time; the pace of change in the poorest and richest subgroups tended to reveal divergent patterns across study countries, thus there was no global indication of a decrease in economic-related inequality in stunting prevalence.
http://www.who.int/gho/health_equity/report_2015/
INTERACTIVE VISUAL 5. CHILD MALNUTRITION
Electronic visualization components accompany this report to enable independent data exploration and benchmarking.
This story-point interactive visual guides you through the state of inequality in this feature story and other indicators of child malnutrition.
AVAILABLE ON CD/USB SCAN HERE
I n t e r a c t I v e v I s u a l I z at I o n o f H e a lt H D at a
ISBN 978 92 4 156491 5
© copyright world health organization, 2015. for free distribution.
World HealtH organization20, avenue appia
CH-1211 geneva 27SWitzerland
state of InequalItyreproductive, maternal,
newborn and child health
http://www.who.int/gho/health_equity/report_2015/
STATE OF INEQUALITY: REPRODUCTIVE, MATERNAL, NEWBORN AND CHILD HEALTH
40
4.6 Child mortalityIn 2013, child mortality accounted for 6.3 million deaths globally, translating into 17 000 deaths of children aged five years or younger each day (45, 46). The leading causes of deaths in the post-neonatal and early childhood period include preterm birth complications, pneumonia, and intrapartum-related complications such as birth asphyxia (40, 47). Malnutrition contributes to a sizable proportion of deaths, especially in low-income countries (15). Approximately four out of five deaths in children under the age of five years occurred in sub-Saharan African or Southern Asia (15). It is estimated that more than half of all child deaths are due to preventable or treatable conditions that could be averted with access to simple, affordable interventions (48).
Since 1990, the global rate of child mortality has fallen by nearly 50%, with accelerated reductions in recent years. These reductions in child mortality are largely attributable to declines in infectious diseases such as pneumonia, diarrhoea and measles (40). Despite these recent gains, there is still significant progress to be made and the continued reduction of child mortality remains a global priority (46).
FEATURE STORY
PLACE-OF-RESIDENCE INEQUALITY IN UNDER-FIVE MORTALITY RATE
UNDER-FIVE MORTALITY RATE 54low-andmiddle-incomestudycountries,DHS2005–2013
In over half of low- and middle-income study countries, at least 75 children out of every 1000 live births died before reaching their fifth birthday. The countries reporting the highest under-five mortality rates were in the WHO African Region.
Under-five mortality rates varied greatly by country income group: whereas half of the middle-income study countries reported child mortality rates in excess of 50 deaths per 1000 live births, half of the low-income study countries had rates of over 100 deaths per 1000 live births.
LATEST SITUATION: BY PLACE OF RESIDENCE 54low-andmiddle-incomestudycountries,DHS2005–2013
The under-five mortality rate was higher in rural areas than in urban areas in most of the low- and middle-income study countries. In half of countries, the under-five mortality rate in rural areas was 84 deaths per 1000 live births or higher. In urban areas, the under-five mortality rate was about 61 deaths per 1000 live births or higher in half of study countries.
The magnitude of the difference in under-five mortality rates between rural and urban areas varied by country. Half of study countries reported a difference of about 16 deaths per 1000 live births or less (Figure 4.12). In Burkina Faso, Burundi, Cameroon, Guinea, Niger and Nigeria, however, the difference in under-five mortality rates between rural and urban areas was at least 50 deaths per 1000 live births (Figure 4.12: countries highlighted in red).
4.6. CHILD MORTALITY
41

STATE OF INEQUALITY: REPRODUCTIVE, MATERNAL, NEWBORN AND CHILD HEALTH
42
FIGURE 4.12Under-fivemortalityratesbyplaceofresidencein54low-andmiddle-incomecountries:latestsituation (DHS2005–2013)
Circles indicate countries – each study country is represented by two circles in the left graph and one circle in the right graph. In the graph on the left, the light blue bands indicate the absolute difference in mortality rate between rural and urban areas for each country. In the graph on the right, the horizontal line indicates the median value (middle point), and the light grey bandindicatestheinterquartilerange(middle50%ofstudycountryestimates).
Study countries with no (or very low) place-of-residence inequality Study countries with high place-of-residence inequality
0 50 100 150 200Mortality rate (deaths per 1000 live births)
NigerNigeria
CameroonGuinea
Burkina FasoBurundi
MaliCambodia
Bolivia (Plurinational State of)Uganda
IndiaPakistanEthiopiaSenegal
ComorosTimor-Leste
Côte d'IvoireSierra Leone
RwandaLesotho
Democratic Republic of the CongoBenin
MadagascarNepal
IndonesiaMalawiGabon
AlbaniaNamibia
LiberiaPhilippines
PeruAzerbaijan
MozambiqueCongoKenya
BangladeshRepublic of Moldova
TajikistanEgypt
ArmeniaZambia
MaldivesColombia
UkraineZimbabwe
Dominican RepublicHonduras
KyrgyzstanJordan
United Republic of TanzaniaSao Tome and Principe
GuyanaHaiti
-10
0
10
20
30
40
50
60
70
80
Diff
eren
ce b
etw
een
rura
l and
urb
an a
reas
(dea
ths
per 1
000
live
birt
hs)
NigerNigeria
CameroonGuinea
Burkina FasoBurundi
MaliCambodia
Bolivia (Plurinational State of)Uganda
IndiaPakistanEthiopiaSenegal
ComorosTimor-Leste
Côte d’IvoireSierra Leone
RwandaLesotho
Democratic Republic of the CongoBenin
MadagascarNepal
IndonesiaMalawiGabon
AlbaniaNamibia
LiberiaPhilippines
PeruAzerbaijan
MozambiqueCongoKenya
BangladeshRepublic of Moldova
TajikistanEgypt
ArmeniaZambia
MaldivesColombia
UkraineZimbabwe
Dominican RepublicHonduras
KyrgyzstanJordan
United Republic of TanzaniaSao Tome and Principe
GuyanaHaiti
Certain study countries reported no – or very low – place-of-residence inequality in child mortality rates. For example, the Dominican Republic, Honduras, Jordan, Kyrgyzstan, Ukraine, the United Republic of Tanzania and Zimbabwe reported an under-five mortality rate difference of less than 3 deaths per 1000 live births between rural and urban areas (Figure 4.12: countries highlighted in blue). In some cases, such as Jordan and Ukraine, low inequality was achieved alongside low national under-five mortality rates (around 20 deaths per 1000 live births). The United Republic of Tanzania and Zimbabwe, however, had moderately high national rates of under-five mortality (around 80–90 deaths per 1000 live births) and low inequality, indicating that the situation was equally unfavourable in both rural and urban areas.
CHANGE OVER TIME: BY PLACE OF RESIDENCE 37low-andmiddle-incomestudycountries,DHS1995–2004and2005–2013
Change-over-time analyses revealed improvements in national average child mortality rates in nearly all study countries (Figure 4.13: countries to the left of the vertical grey zero line). Notably, Mail, Niger and Rwanda reported an average reduction in under-five mortality of more than 10 deaths per 1000 live births per year.
Reductions in under-five mortality rates across both rural and urban areas were seen in most study countries. Faster decreases tended to be reported for rural areas. For instance, the pace of improvement in rural areas outpaced that in urban areas by more than 45 deaths per 1000 live births over 10 years in Burkina Faso, Malawi, Mozambique, Niger and Rwanda. In contrast, Cambodia and Cameroon reported faster improvements in urban areas, but the pro-urban advantage did not exceed 15 deaths per 1000 live births over 10 years in any of these countries (Figure 4.13).
A clear majority of study countries reported decreasing national under-five mortality rates alongside pro-rural changes in the degree of inequality over time (Figure 4.13: countries in the bottom left quadrant). Furthermore, in nearly one quarter of study countries, the decrease in national under-five mortality rates was particularly fast (at least 60 deaths per 1000 live births over 10 years) and achieved through pro-rural reductions.
OTHER KEY FINDINGS: INEQUALITY IN CHILD MORTALITY
• Inhalfofstudycountries,theinfantmortalityratewasatleast8deathsper1000livebirthshigherinrural than in urban areas.
• Inaboutonequarterofstudycountries,thegap inneonatalmortalityratesbetweenthemost-andleast-educated subgroups was at least 15 deaths per 1000 live births.
• Inhalfofstudycountries,theunder-fivemortalityratedecreasedmorerapidlyinthepoorestthanintherichest subgroup, by a margin of at least 26 deaths per 1000 live births over a 10-year period.
4.6. CHILD MORTALITY
43

http://www.who.int/gho/health_equity/report_2015/
INTERACTIVE VISUAL 6. CHILD MORTALITY
Electronic visualization components accompany this report to enable independent data exploration and benchmarking.
This story-point interactive visual guides you through the state of inequality in this feature story and other child mortality indicators.
AVAILABLE ON CD/USB SCAN HERE
I n t e r a c t I v e v I s u a l I z at I o n o f H e a lt H D at a
ISBN 978 92 4 156491 5
© copyright world health organization, 2015. for free distribution.
World HealtH organization20, avenue appia
CH-1211 geneva 27SWitzerland
state of InequalItyreproductive, maternal,
newborn and child health
http://www.who.int/gho/health_equity/report_2015/
-12 -10 -8 -6 -4 -2 0 2 4 6 8Annual absolute change in national average (deaths per 1000 live births)
-6
-4
-2
0
2
4
6
Ann
ual a
bsol
ute
chan
ge in
rura
l com
pare
d w
ith u
rban
are
as(d
eath
s pe
r 100
0 liv
e bi
rths
)
Decrease in national averagePro-rural change
Increase in national averagePro-rural change
Decrease in national averagePro-urban change
Increase in national averagePro-urban change
Rwanda
Niger Mozambique
Malawi
Burkina Faso
CameroonCambodia
Mali
Coloured shapes indicate countries – each study country is represented on the graph by one coloured shape. Each type of shape represents one WHO region. Dashed orange lines indicate the median values (middle points).
FIGURE 4.13Under-fivemortalityrates:changeovertimeinnationalaverage(absolutechange)andinruralcomparedwithurbanareas(absoluteexcesschange)in37low-andmiddle-incomecountries(DHS1995–2004and2005–2013)
AfricanRegion; RegionoftheAmericas; South-EastAsiaRegion; European Region; Eastern Mediterranean Region; Western Pacific Region
STATE OF INEQUALITY: REPRODUCTIVE, MATERNAL, NEWBORN AND CHILD HEALTH
44
4.7 RMNCH interventions, combinedThe composite coverage index is a weighted score that incorporates the following eight RMNCH intervention indicators:
• demandforfamilyplanningsatisfied
• antenatalcarecoverage(atleastonevisit)
• birthsattendedbyskilledhealthpersonnel
• BCGimmunizationcoverageamongone-year-olds
• measlesimmunizationcoverageamongone-year-olds
• DTP3immunizationcoverageamongone-year-olds
• childrenagedlessthanfiveyearswithdiarrhoeareceivingoralrehydrationtherapyandcontinuedfeeding
• childrenagedlessthanfiveyearswithpneumoniasymptomstakentoahealthfacility.
The composite coverage index captures both the provision and use of key RMNCH interventions, expressing the number of people receiving a specified intervention as a percentage of those who require that intervention. The composite coverage index can be used to indicate a country’s overall progress towards achieving universal coverage for RMNCH. A composite index tends to be more stable and representative of the overall situation than any one of the component RMNCH intervention indicators, which are more sensitive to factors such as small sample sizes.
The Countdown to 2015 initiative has applied the composite coverage index as a summary measure to track key interventions in RMNCH, noting a tendency towards lower child mortality in countries with higher values of the composite coverage index and, conversely, higher child mortality in countries with lower values (20). The expansion and improvement of RMNCH interventions is embedded in all major global initiatives to promote RMNCH.
FEATURE STORY
INEQUALITY IN RMNCH COMPOSITE COVERAGE INDEX
RMNCH COMPOSITE COVERAGE INDEX70low-andmiddle-incomestudycountries,DHSandMICS2005–2013
Overall, almost one quarter of study countries reported composite coverage index values of 80% or more; however, coverage index values varied substantially across countries, ranging from 37.4% in Ethiopia to 89.7% in Costa Rica.
4.7. RMNCH INTERVENTIONS, COMBINED
45

LATEST SITUATION: BY MULTIPLE DIMENSIONS OF INEQUALITY 48 low- and middle-income study countries (by economic status)45low-andmiddle-incomestudycountries(byeducationlevel)62 low- and middle-income study countries (by place of residence)DHSandMICS2005–2013
Disaggregation of the composite coverage index score across three dimensions of inequality revealed a common pattern of higher coverage among advantaged subgroups. The coverage of RMNCH interventions tended to be greatest in the economically advantaged subgroups, the secondary school or higher subgroup and in urban areas. Figure 4.14 illustrates the scale of within-country inequalities and the cross-country variation within subgroups.
Quintile 1(poorest) Quintile 2 Quintile 3 Quintile 4 Quintile 5
(richest)
0
10
20
30
40
50
60
70
80
90
100
Cov
erag
e (%
)
56.7
61.464.9
71.8
79.1
Economic status
No education Primary school Secondaryschool +
56.4
65.9
76.3
Education*
Rural Urban
65.1
76.3
Place of residence
*Educationreferstothehighestlevelofschoolingattainedbythewomanor,inthecaseofnewbornandchildhealthinterventions,thechild’smother.Circles indicate countries – each study country is represented on each graph by one circle per subgroup. Horizontal lines indicate the median value (middle point) for each subgroup. Light grey bandsindicatetheinterquartilerange(middle50%ofstudycountryestimates).
FIGURE 4.14 RMNCH composite coverage index by multiple dimensions of inequality in low- and middle-income countries: latest situation(DHSandMICS2005–2013)
STATE OF INEQUALITY: REPRODUCTIVE, MATERNAL, NEWBORN AND CHILD HEALTH
46

Economic-related inequalityMedian values of the composite coverage index increased in a linear fashion across economic status subgroups, moving from poorest to richest. Economic-related inequality (expressed in absolute terms as a difference between the richest and the poorest quintiles) varied among study countries, ranging from 3.1 percentage points in Jordan to 60.9 percentage points in Nigeria.
In nearly one quarter of study countries, the difference between the richest and poorest quintiles was particularly large – 30 percentage points or higher. Cameroon, the Central African Republic, Ethiopia, Guinea and Nigeria reported the highest levels of within-country economic-related relative inequality, with a level of coverage in the richest subgroup at least two times that of the poorest subgroup.
Low levels of economic-related inequality were reported by Burundi, Colombia, the Dominican Republic, Honduras, Jordan, Kyrgyzstan, Sierra Leone and Swaziland, where the difference in the value of the composite coverage index between the richest and poorest quintiles was 10 percentage points or less.
Education-related inequalityAll low- and middle-income study countries reported composite coverage index values that were greater in the secondary school or higher subgroup than in the no education subgroup. Over one third of study countries reported a difference of more than 20 percentage points between the most- and least-educated subgroups. In Egypt and Swaziland, this difference was less than 8 percentage points. In contrast, the difference was 40 percentage points or more in Cameroon and Nigeria.
Place-of-residence inequalityComposite coverage index values tended to be higher in urban than in rural areas. In nearly half of study countries, however, the difference between urban and rural areas was less than 10 percentage points. One fifth of study countries showed minimal place-of-residence inequality with differences of less than 5 percentage points. In Bosnia and Herzegovina, the Dominican Republic, Jordan, Republic of Moldova and Uzbekistan, this difference was less than 2 percentage points. Ethiopia and Nigeria had the largest level of within-country relative inequality, with coverage in urban areas exceeding that of rural areas by a factor of two.
CHANGE OVER TIME: BY MULTIPLE DIMENSIONS OF INEQUALITY 28 low- and middle-income study countries (by economic status)25low-andmiddle-incomestudycountries(byeducationlevel)34 low- and middle-income study countries (by place of residence)DHSandMICS1995–2004and2005–2013
Overall, countries tended to demonstrate improvements in composite coverage index over time, with gains nationally and within subgroups of the population. The pace of these improvements (or changes) tended to favour the disadvantaged subgroups; that is, the changes were for the most part pro-poor, pro less-educated and pro-rural. The highest rates of increase in coverage (at the national level) were reported by Cambodia (30.9 percentage points over 10 years) and Rwanda (23.9 percentage points over 10 years).
4.7. RMNCH INTERVENTIONS, COMBINED
47
Economic-related inequalityComposite coverage index scores increased faster in the poorest population subgroup compared with the richest subgroup in three quarters of study countries. The Plurinational State of Bolivia and Cambodia reported the fastest pro-poor increases (narrowing of inequality), with the change over time in the poorest subgroup outpacing change in the richest subgroup by at least 20 percentage points over 10 years.
While Ethiopia and Uganda reported a substantial increase in national RMNCH composite coverage index (by more than 10 percentage points over 10 years), improvements in the poorest quintile were outpaced by those in the richest (a pro-rich change).
Education-related inequalityIn the majority of cases, RMNCH composite coverage index increased over time in all three education subgroups. Most countries reported faster improvements in the no education subgroup than in the secondary school or higher subgroup. The Plurinational State of Bolivia, Cambodia and Rwanda reported substantial increases in RMNCH composite coverage index of at least 24 percentage points over 10 years in the no education subgroup.
In many study countries, national-level increases in RMNCH composite coverage index were accomplished through rapid and sizeable gains in the no education subgroup. However, this was not true for all countries. Namibia, for example, achieved a substantial overall increase in RMNCH composite coverage index (by 12.3 percentage points over 10 years), but this was driven largely by improvements in the primary school and secondary school or higher subgroups.
Place-of-residence inequalityMost low- and middle-income study countries reported an increase in the value of the composite coverage index over time in both rural and urban areas. In the majority of cases, the changes were pro-rural; that is, changes in RMNCH composite coverage index occurred faster in, or otherwise favoured, rural areas. Notably, the Plurinational State of Bolivia, Malawi, Mali and Niger reported a pro-rural change by a margin of at least 10 percentage points over 10 years. One in every six countries reported the pace of change to be the same in rural and urban areas (excess change was negligible).
OTHER KEY FINDINGS: INEQUALITY IN RMNCH COMPOSITE COVERAGE INDEX
• Whilehalfofcountrieshadcompositecoverageindexvaluesofover80%fortherichestquintile,onlyone country achieved this level of coverage in the poorest quintile.
• Aconsiderableproportionofcountries–aboutonequarter– reportedbotha lownationalaveragecomposite coverage index value (under 60%) and a high level of education-related inequality (a difference between the most- and least-educated of at least 20 percentage points).
• Overa10-yearperiod,thechangesincompositecoverageindextendedtofavourthemost-disadvantagedsubgroups to a greater extent than the most advantaged for all dimensions of inequality (economic status, education and place of residence); that is, coverage increased more rapidly (or decreased more slowly) in the most-disadvantaged subgroups.
STATE OF INEQUALITY: REPRODUCTIVE, MATERNAL, NEWBORN AND CHILD HEALTH
48
http://www.who.int/gho/health_equity/report_2015/
INTERACTIVE VISUAL 7. RMNCH COMPOSITE COVERAGE INDEX
Electronic visualization components accompany this report to enable independent data exploration and benchmarking.
This story-point interactive visual guides you through the state of inequality in the RMNCH composite coverage index.
AVAILABLE ON CD/USB SCAN HERE
I n t e r a c t I v e v I s u a l I z at I o n o f H e a lt H D at a
ISBN 978 92 4 156491 5
© copyright world health organization, 2015. for free distribution.
World HealtH organization20, avenue appia
CH-1211 geneva 27SWitzerland
state of InequalItyreproductive, maternal,
newborn and child health
http://www.who.int/gho/health_equity/report_2015/
4.7. RMNCH INTERVENTIONS, COMBINED
49
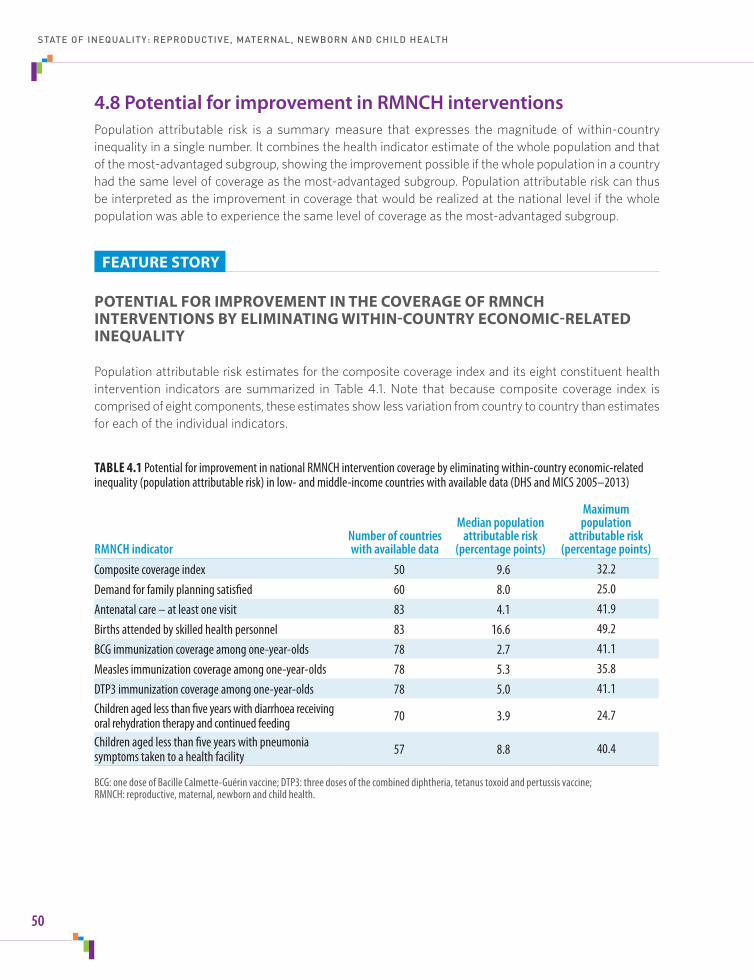
4.8 Potential for improvement in RMNCH interventions Population attributable risk is a summary measure that expresses the magnitude of within-country inequality in a single number. It combines the health indicator estimate of the whole population and that of the most-advantaged subgroup, showing the improvement possible if the whole population in a country had the same level of coverage as the most-advantaged subgroup. Population attributable risk can thus be interpreted as the improvement in coverage that would be realized at the national level if the whole population was able to experience the same level of coverage as the most-advantaged subgroup.
FEATURE STORY
POTENTIAL FOR IMPROVEMENT IN THE COVERAGE OF RMNCH INTERVENTIONS BY ELIMINATING WITHIN-COUNTRY ECONOMIC-RELATED INEQUALITY
Population attributable risk estimates for the composite coverage index and its eight constituent health intervention indicators are summarized in Table 4.1. Note that because composite coverage index is comprised of eight components, these estimates show less variation from country to country than estimates for each of the individual indicators.
TABLE 4.1 Potential for improvement in national RMNCH intervention coverage by eliminating within-country economic-related inequality(populationattributablerisk)inlow-andmiddle-incomecountrieswithavailabledata(DHSandMICS2005–2013)
RMNCH indicator Number of countries with available data
Median population attributable risk
(percentage points)
Maximum population
attributable risk (percentage points)
Composite coverage index 50 9.6 32.2Demand for family planning satisfied 60 8.0 25.0Antenatalcare–atleastonevisit 83 4.1 41.9Births attended by skilled health personnel 83 16.6 49.2BCG immunization coverage among one-year-olds 78 2.7 41.1Measles immunization coverage among one-year-olds 78 5.3 35.8DTP3 immunization coverage among one-year-olds 78 5.0 41.1Children aged less than five years with diarrhoea receiving oral rehydration therapy and continued feeding 70 3.9 24.7
Children aged less than five years with pneumonia symptoms taken to a health facility 57 8.8 40.4
BCG: one dose of Bacille Calmette-Guérin vaccine; DTP3: three doses of the combined diphtheria, tetanus toxoid and pertussis vaccine; RMNCH: reproductive, maternal, newborn and child health.
STATE OF INEQUALITY: REPRODUCTIVE, MATERNAL, NEWBORN AND CHILD HEALTH
50

POTENTIAL FOR IMPROVEMENT IN SELECTED RMNCH INTERVENTION INDICATORSCompositecoverageindexandbirthsattendedbyskilledhealthpersonnel,DHSandMICS2005–2013
By eliminating economic-related inequality in eight RMNCH interventions and increasing coverage to the level of the richest quintile, around half of study countries could potentially achieve an increase in their composite coverage index of about 10 percentage points from current levels (median population attributable risk, 9.6 percentage points). Given that Jordan reported a population attributable risk of 1.5 percentage points, it has the least room for improvement (and the lowest level of within-country economic-related inequality), whereas Nigeria has the most potential for improvement with a population attributable risk of 32.2 percentage points (indicating the highest level of within-country economic-related inequality).
According to this analysis, if economic-related inequalities were eliminated, almost half of study countries would have a national composite coverage index value of about 80% or higher. Currently, only one in every seven study countries reported national index values of over 80%.
Of the indicators that comprise the composite coverage index, the births attended by skilled health personnel indicator demonstrated the most room for improvement according to population attributable risk analyses. Overall, the difference between coverage at the national level and that in the richest quintile was more than 16 percentage points in half of low- and middle-income study countries. This median value, however, masks cross-country variations in population attributable risk. Several countries had a population attributable risk of less than 1 percentage point, while others reported values in excess of 40 percentage points. The maximum population attributable risk for births attended by skilled health personnel was reported in the Lao People’s Democratic Republic (49.2 percentage points).
If economic-related inequalities were eliminated (by increasing the proportion of attended births in the whole population to that in the richest quintile), more than half of study countries would achieve levels of skilled birth attendance of over 95%. Only about one quarter of study countries reported current coverage of 95% or higher.
POTENTIAL FOR IMPROVEMENT IN SELECTED COUNTRY EXAMPLES EgyptandNiger,DHS2008and2012
Within countries, population attributable risk varied according to the health indicator. Egypt, for example, reported little economic-related inequality in the child immunization indicators. Maternal health intervention indicators, on the other hand, each indicated a population attributable risk value of over 16 percentage points. Reproductive health interventions indicators in Egypt had intermediate levels of population attributable risk, of around 5 percentage points (Figure 4.15).
Niger demonstrated different levels of population attributable risk in two maternal health interventions with similar levels of current coverage. Both antenatal care coverage (at least four visits) and births attended by skilled health personnel had national coverage of just over 30%. The potential for improvement by eliminating economic-related inequality, however, was much higher for births attended by skilled health personnel (41.0 percentage points) than antenatal care coverage (at least four visits) (13.5 percentage points) (Figure 4.15).
4.8. POTENTIAL FOR IMPROVEMENT IN RMNCH INTERVENTIONS
51

Egypt Niger
0 20 40 60 80 100National average (%)
0 20 40 60 80 100National average (%)
Reproductivehealthinterventions
Contraceptive prevalence – modern andtraditional methods
Contraceptive prevalence – modern methods
Demand for family planning satisfied
Maternalhealthinterventions
Antenatal care coverage – at least one visit
Antenatal care coverage – at least four visits
Births attended by skilled health personnel
Newborn andchild healthinterventions
Early initiation of breastfeeding
Children aged 6–59 months who receivedvitamin A supplementation
BCG immunization coverage amongone-year-olds
Measles immunization coverage amongone-year-olds
Polio immunization coverage amongone-year-olds
DTP3 immunization coverage amongone-year-olds
Full immunization coverage amongone-year-olds
Children aged < 5 years with diarrhoeareceiving oral rehydration salts
Children aged < 5 years with diarrhoeareceiving oral rehydration therapy andcontinued feeding
Children aged < 5 years with pneumoniasymptoms taken to a health facility
RMNCHinterventions,combined
Composite coverage index
The potential for improvement (pale blue shaded area) represents the improvement possible if the whole population had the same level of coverage as the richest subgroup.
FIGURE 4.15 Potential for improvement in RMNCH intervention coverage by eliminating within-country economic-related inequalityinEgypt(DHS2008)andNiger(DHS2012)
Current situation Potential for improvement
STATE OF INEQUALITY: REPRODUCTIVE, MATERNAL, NEWBORN AND CHILD HEALTH
52

http://www.who.int/gho/health_equity/report_2015/
INTERACTIVE VISUAL 8. POTENTIAL FOR IMPROVEMENT IN RMNCH INTERVENTIONS
Electronic visualization components accompany this report to enable independent data exploration and benchmarking.
These interactive dashboards guide you through the potential for improvement in RMNCH intervention indicators, by multiple dimensions of inequality.
AVAILABLE ON CD/USB SCAN HERE
I n t e r a c t I v e v I s u a l I z at I o n o f H e a lt H D at a
ISBN 978 92 4 156491 5
© copyright world health organization, 2015. for free distribution.
World HealtH organization20, avenue appia
CH-1211 geneva 27SWitzerland
state of InequalItyreproductive, maternal,
newborn and child health
http://www.who.int/gho/health_equity/report_2015/
4.8. POTENTIAL FOR IMPROVEMENT IN RMNCH INTERVENTIONS
53

E V E R Y O N E E V E R Y W H E R E A L W A Y S

Reporting the state of inequality: taking stockOverall, health inequalities were identified across low- and middle-income countries in RMNCH. While national averages demonstrated improvements over the past decade – often as a result of rapid gains in disadvantaged subgroups – this progress was not sufficiently equity oriented to close the gap. Inequalities were still pervasive between those of different economic status subgroups, education levels, places of residence and, in a few cases, sex, though there were variations based on the country and the indicator.
Supplementary tables S3, S4 and S5 (appended to this report) present a summary of state-of-inequality data for the 23 RMNCH indicators.
5E V E R Y O N E E V E R Y W H E R E A L W A Y S
55

5.1 The importance of data disaggregationDisaggregated data are at the heart of monitoring inequalities. The practice of disaggregating data reveals where inequalities exist; appreciating how health levels vary across subgroups can help to identify the best approach to address inequalities in health.
In addition to the four dimensions of inequality discussed in this report, health data may be disaggregated by other relevant dimensions of inequality such as age, race/ethnicity, subnational region and religion, as appropriate and per data availability. For example, age may be considered an important stratifier for reproductive health indicators that are subject to age discrimination (this may occur if adolescent and adult-aged women experience different access to reproductive health interventions, for instance).
In this report, inequalities were analysed by a single dimension of inequality at a time. In some cases, however, it is more instructive to doubly disaggregate, that is, to apply two dimensions of inequality simultaneously. For example, socioeconomic inequalities in health may exist within urban and rural settings. In Benin, the under-five mortality rate was higher in rural areas than in urban areas. However, a closer inspection reveals that, when disaggregated again by economic status, the rate of under-five mortality among the urban poor was even higher than the rate in rural areas (Figure 5.1).
http://www.who.int/gho/health_equity/report_2015/
INTERACTIVE VISUAL 9. DETERMINANTS OF RMNCH
Electronic visualization components accompany this report to enable independent data exploration and benchmarking.
These interactive dashboards guide you through data about the associations between selected country-level determinants and health indicators.
AVAILABLE ON CD/USB SCAN HERE
I n t e r a c t I v e v I s u a l I z at I o n o f H e a lt H D at a
ISBN 978 92 4 156491 5
© copyright world health organization, 2015. for free distribution.
World HealtH organization20, avenue appia
CH-1211 geneva 27SWitzerland
state of InequalItyreproductive, maternal,
newborn and child health
http://www.who.int/gho/health_equity/report_2015/
A studyof thedriversof inequality attempts toexplain the root causesof inequality, lookingat abroad scopeofdeterminants of health (demographic, environmental and socioeconomic factors) within and outside of the health sector. Comprehensive investigations of the causes of inequality draw on many types of research and diverse perspectives to provide context and frame the issue. There are many possible causes of inequality, which may manifest in different ways depending on the setting and health topic (and indicator) of interest, as well as the timing of the study.
This report examines both cross-country inequalities, comparing national averages across low- and middle-income countries,aswellaswithin-country inequalitybyeconomicstatus,education level,placeofresidenceandsex.Asanextension of these findings, the associations between selected determinants of health and RMNCH indicators may be explored to gain preliminary insights into possible country-level factors that may be driving cross-country inequalities in RMNCH.(SeeAppendix1formoredetailsaboutthepossibledeterminantsofhealthfeaturedintheinteractivevisual.)
UNDERSTANDING WHY INEQUALITIES PERSIST
STATE OF INEQUALITY: REPRODUCTIVE, MATERNAL, NEWBORN AND CHILD HEALTH
56

Such a situation may have important implications for policies, programmes and practices. If double-disaggregation analyses were not conducted for Benin, for example, policy-makers might concentrate efforts in rural areas and neglect the disadvantaged urban poor. Thus, when monitoring health inequalities, it may be appropriate to divide the population by multiple dimensions of inequality at the same time. One limitation of double disaggregation using household health survey data, however, is that the sample size in each subgroup diminishes when data are disaggregated. Smaller sample sizes mean that the estimates become more uncertain and the ability to make valid comparisons between subgroups may be hindered.
5.2 Equity orientation of policies, programmes and practicesMonitoring the state of inequality, both across and within countries, serves as a warning system; it draws attention to the presence of inequality in different areas of health and identifies priority areas for further investigation. Policies, programmes and practices should be equity oriented to promote improvements among the most-disadvantaged subgroup(s) that are at least as fast as the most advantaged. Without a dedicated focus on equity, such actions may achieve increases in national coverage but risk intensifying within-country inequality.
Many study countries achieved improved health intervention coverage and outcomes at the national level; however, in some cases this was fuelled by more rapid gains in the advantaged subgroups than in the disadvantaged subgroups. In these cases, health policies, programmes and practices should be re-oriented to uphold the principle of equity and promote faster improvements among the disadvantaged. For instance, in Ethiopia, the national prevalence of modern contraceptive use increased but disproportionately more so among the richer and better-educated subgroups. Similarly, while the percentage of births attended by skilled health personnel in Bangladesh, Ethiopia, Nepal and Uganda increased overall, the pace of the increase favoured the rich over the poor.
5. REPORTING THE STATE OF INEQUALITY: TAKING STOCK
57
Mor
talit
yrate(
deaths
per1
000l
ivebi
rths)
180
120
150
90
FIGURE 5.1Under-fivemortalityratedoublydisaggregatedbyplaceofresidenceandeconomicstatusinBenin(DHS2006)
Source: adapted from Country profiles on urban health: Benin. Kobe: World Health Organization Centre for Health Development (http://www.who.int/kobe_centre/measuring/urbanheart/benin.pdf?ua=1,accessed11March2015).
60
30
153
Urbanpoorestquintile
73
Urbanrichestquintile
134
Rural
106
Urban(overall)0

In other cases, improvements at the national level were accompanied by pro-disadvantaged changes at the population subgroup level, suggesting that interventions may already be equity oriented. In Bangladesh, for example, the increase in measles immunization coverage in rural areas outpaced that in urban areas; there were also faster coverage gains in the poorest (relative to the richest) and among children born to mothers with no education (relative to children whose mothers had received secondary schooling or higher). Likewise, in Malawi, Mozambique, Niger and Rwanda, national infant mortality rates declined, with faster decreases in the least-educated subgroups than in the most-educated subgroups.
Characteristic patterns of inequality across multiple, ordered subgroups – and suggestions for corresponding policy, programme or practice responses – are described further in Appendix 7.
5.3 Equity-oriented health information systemsThe purpose of health information systems is to collect, analyse and report data. When health information systems are equity oriented they have the necessary tools to conduct health inequality monitoring and to generate useful inputs to inform equity-oriented policies, programmes and practices. Developing and expanding equity-oriented health information systems at a national level requires capacity-building to support the improved collection, analysis and reporting of health data by population subgroups. For some countries, significant investment may be required to build and strengthen capacity for health inequality monitoring. Countries that already have strong, equity-oriented health information systems should regularly review and update their standardized data collection, analysis and reporting practices.
One central consideration for the expansion of health inequality monitoring is data availability. The data used for health inequality monitoring should be of high quality and comparable across settings and over time. The two types of data required for health inequality monitoring – data about health and data about the dimensions of inequality – can either be collected from a single source or linked together from different sources. Currently, national assessments of health inequality in low- and middle-income countries – such as the current report – usually draw from household health survey data. Household health surveys such as DHS and MICS are repeated at regular intervals, and have high-quality, comparable data on a specific health topic, as well as on living standards. Health facility data are increasingly recognized as a valuable source of readily available data to assess geographical inequality at the subnational level, especially when data collection practices are harmonized across subnational regions (49).
Dedicated resources are also required to develop and support the technical expertise and skills required to perform health inequality analyses. Inequality is a complex concept that can be conveyed using a variety of analysis techniques. Proficiency in analysing health inequality data demands not only technical knowledge of summary measures, but also an awareness of best practices in data analysis and interpretation.
Effective reporting and dissemination practices take into account the unique needs and abilities of the target audiences. Clear and salient reporting about the state of inequality should aim to achieve a balance between presenting comprehensible messages, while maintaining sufficient technical accuracy and rigour. Sometimes, the clear and effective communication of multiple dimensions of inequality may necessitate a reduction in the amount of data that are presented (49). The use of data visuals – both in the conventional static and novel interactive forms – can greatly enhance the presentation and interpretation of large and complex inequality datasets.
STATE OF INEQUALITY: REPRODUCTIVE, MATERNAL, NEWBORN AND CHILD HEALTH
58

Promotingequitywithinthehealthsectorbeginswithmonitoringhealthinequalities.Actionstoaddressinequitiesinclude:recognizing that health services often contribute to increasing inequities; prioritizing diseases of the poor; deploying and improving health interventions where the poor live; employing appropriate health service delivery channels; removing or reducing financial barriers to health care; and setting goals and monitoring progress through an equity lens (49).
AchievingimprovementsinRMNCH,however,requiresintersectoralactionthataddressesthebroaderdeterminantsofhealth.
Outside of the health sector, actions to promote RMNCH encompass factors such as education, population dynamics, environmentalmanagement,povertyreductionandincomeinequality,women’spoliticalandsocioeconomicparticipation,good governance, and economic growth. The use of reliable, timely evidence for decision-making and accountability is a key strategy to improve health outcomes (50, 51).
ArenewedGlobalStrategyforWomen’s,Children’sandAdolescent’sHealthwillhaveastrongerfocusonequityandrights,and call attention to the integration of environmental, political and socioeconomic determinants in garnering intersectoral action for improved RMNCH (52).TherenewedGlobalStrategy,tobelaunchedinSeptember2015,willbearoadmapforending all preventable deaths of women, children and adolescents by 2030, and will align with the targets and indicators developed for the Sustainable Development Goal Framework. Partners in this process have made a commitment to focus on criticalandunderservedpopulationgroupssuchasnewborns,adolescentsandthoselivinginfragileandconflictsettings.
PROMOTING EQUITY IN RMNCH
Relative to other health topics, inequality monitoring in RMNCH has been accelerated by the availability of relevant household health survey data. Other areas stand to benefit by learning from the data collection, analysis and reporting practices that have been established by initiatives to monitor inequalities in RMNCH. Better cooperation between governments, academia and community stakeholders can help to expand and enhance the quality of health information systems for inequality monitoring, not only in RMNCH, but also in all areas of health. Moving forward, the strengthening of equity-oriented health information systems is a necessary and lasting investment that will enable improved health inequality monitoring across all settings.
5.4 Reducing inequality across health topics and the post-2015 sustainable development agenda Inequalities are not exclusive to RMNCH. There are countless stories about the state of inequality in other areas of health. These stories also need to be explored and shared, drawing upon reliable data, sound analyses and good reporting practices. Monitoring inequalities across the spectrum of health and by multiple dimensions of inequality represents a necessary step in helping all populations achieve their potential for good health. The practice of data disaggregation is acknowledged as a key principle for sustainable development (53). Building capacity for inequality monitoring across a diversity of health topics is necessary, relevant and important, especially as global movements call attention to promoting equity through initiatives such as universal health coverage (10).
5. REPORTING THE STATE OF INEQUALITY: TAKING STOCK
59

In this spirit, the renewed sustainable development goals and targets specifically call for reductions in health inequalities. Indeed, there is a heightened requirement for equity orientation across health-related components of the post-2015 sustainable development agenda, which – in addition to the inclusion of universal health coverage – seek improvements in areas such as environmental health and noncommunicable diseases (54). The overarching goal of the health-related post-2015 sustainable development agenda, to “ensure healthy lives and promote well-being for all at all ages”, represents a commitment to promoting equity in health, and necessitates a focus on monitoring and reporting inequalities (55).
The post-2015 sustainable development agenda focuses on “leaving no one behind”, calling for efforts that prioritize marginalized groups. The reduction of inequality within and between countries is included on the list of proposed sustainable development goals to be attained by 2030. Other proposed goals call for gender equality, poverty elimination and education for all, addressing social factors that contribute to inequalities in health (55).
Monitoring the state of inequality in health is a key step towards identifying where action is needed, and determining how health-related policies, programmes and practices can best be implemented to benefit the people who need them the most. Only by comparisons of data disaggregated by population subgroups is it possible to delve deeper into how various facets of health are experienced throughout the entire population. When health inequalities are taken into consideration, decisions about policies, programmes and practices can align with broader efforts to reduce social inequalities and discrimination, promote gender equality, and realize the right to health for all.
STATE OF INEQUALITY: REPRODUCTIVE, MATERNAL, NEWBORN AND CHILD HEALTH
60
1. Global Health Observatory (GHO) data: Health Equity Monitor [online database]. Geneva: World Health Organization; 2013 (www.who.int/gho/health_equity/en/, accessed 11 March 2015).
2. Global Thematic Consultation on the Post-2015 Development Agenda. Addressing inequalities: synthesis report of Global Public Consultation. New York, NY: United Nations Children’s Fund and UN Women; 2013.
3. The core international human rights instruments and their monitoring bodies [website]. New York, NY: Office of the United Nations High Commissioner for Human Rights; 2015 (www.ohchr.org/EN/ProfessionalInterest/Pages/CoreInstruments.aspx, accessed 11 March 2015).
4. Declaration of Alma-Ata. Alma-Ata, USSR, 6–12 September 1978 (http://www.who.int/publications/almaata_declaration_en.pdf, accessed 11 March 2015).
5. Global Strategy for Health for All by the Year 2000. Geneva: World Health Organization; 1981 (http://whqlibdoc.who.int/publications/9241800038.pdf, accessed 11 March 2015).
6. Office of the United Nations High Commissioner for Human Rights. Human rights indicators: a guide to measurement and implementation. New York, NY: United Nations; 2012 (http://www.ohchr.org/Documents/Publications/Human_rights_indicators_en.pdf, accessed 11 March 2015).
7. Commission on Social Determinants of Health. Closing the gap in a generation: health equity through action on the social determinants of health: final report of the Commission on Social Determinants of Health. Geneva: World Health Organization; 2008 (http://www.who.int/social_determinants/thecommission/finalreport/en/, accessed 11 March 2015).
8. Rio Political Declaration on Social Determinants of Health. Rio de Janeiro, Brazil, 21 October 2011 (http://www.who.int/sdhconference/declaration/Rio_political_declaration.pdf, accessed 11 March 2015).
9. Boerma T, Eozenou P, Evans D, Evans T, Kieny MP, Wagstaff A. Monitoring progress towards universal health coverage at country and global levels. PLoS Med. 2014;11(9):e1001731.
10. Hosseinpoor AR, Bergen N, Koller T, Prasad A, Schlotheuber A, Valentine N et al. Equity-oriented monitoring in the context of universal health coverage. PLoS Med. 2014;11(9):e1001727.
11. Saksena P, Hsu J, Evans DB. Financial risk protection and universal health coverage: evidence and measurement challenges. PLoS Med. 2014;11(9):e1001701.
12. Hill K, Upchurch D. Gender differences in child health: evidence from the Demographic and Health Surveys. Population and Development Review 1995;21(1):127–51.
13. Reports. In: United Nations Millennium Development Goals and beyond 2015 [website]. New York, NY: United Nations; 2014 (http://www.un.org/millenniumgoals/reports.shtml, accessed 11 March 2015).
14. Statistics Division of the Department of Economic and Social Affairs. Millennium Development Goals indicators. The official United Nations site for the MGD indicators [website]. New York, NY: United Nations; 2013 (http://mdgs.un.org/unsd/mdg/Host.aspx?Content=indicators/officiallist.htm, accessed 11 March 2015).
15. The Millennium Development Goals report 2014. New York, NY: United Nations; 2014 (http://www.un.org/millenniumgoals/2014%20MDG%20report/MDG%202014%20English%20web.pdf, accessed 11 March 2015).
References
61

16. The Partnership for Maternal, Newborn & Child Health. The PMNCH 2011 report: analysing commitments to advance the Global Strategy for Women’s and Children’s Health. Geneva: World Health Organization; 2011 (http://www.who.int/pmnch/media/press/2011/2011_pmnch_report/en/, accessed 11 March 2015).
17. The Partnership for Maternal, Newborn & Child Health. The PMNCH 2012 report: analysing progress on commitments to the Global Strategy for Women’s and Children’s Health. Geneva: World Health Organization; 2012 (http://www.who.int/pmnch/media/press/2012/2012_pmnch_report/en/, accessed 11 March 2015).
18. The Partnership for Maternal, Newborn & Child Health. The PMNCH 2013 report: analysing progress on commitments to the Global Strategy for Women’s and Children’s Health; Geneva: World Health Organization; 2013 (http://www.who.int/pmnch/knowledge/publications/2013_pmnch_report/en/, accessed 11 March 2015).
19. The Partnership for Maternal, Newborn & Child Health. The PMNCH 2014 accountability report: tracking financial commitments to the Global Strategy for Women’s and Children’s Health. Geneva: World Health Organization; 2014 (http://www.who.int/pmnch/knowledge/publications/2014_pmnch_report/en/, accessed 11 March 2015).
20. Countdown to 2015. Fulfilling the health agenda for women and children: the 2014 report. Geneva: World Health Organization; 2014 (http://www.countdown2015mnch.org/reports-and-articles/2014-report, accessed 11 March 2015).
21. Countdown to 2015. Tracking progress in child survival: the 2005 report. New York, NY: United Nations Children’s Fund; 2005 (http://www.countdown2015mnch.org/reports-and-articles/previous-reports/2005, accessed 11 March 2015).
22. Countdown to 2015. Tracking progress in maternal, newborn and child survival: the 2008 report. New York, NY: United Nations Children’s Fund; 2008 (http://www.countdown2015mnch.org/reports-and-articles/previous-reports/2008, accessed 11 March 2015).
23. Countdown to 2015. Countdown to 2015 decade report (2000–2010). Geneva: World Health Organization; 2010 (http://www.countdown2015mnch.org/reports-and-articles/previous-reports/2010-decade-report, accessed 11 March 2015).
24. Countdown to 2015. Building a future for women and children: the 2012 report. Geneva: World Health Organization; 2012 (http://www.countdown2015mnch.org/reports-and-articles/previous-reports/2012-report, accessed 11 March 2015).
25. World Health Organization, United Nations Children’s Fund. Every newborn: an action plan to end preventable deaths. Geneva: World Health Organization; 2014 (http://www.everynewborn.org/Documents/Full-action-plan-EN.pdf, accessed 11 March 2015).
26. Commission on Information and Accountability for Women’s and Children’s Health. Keeping promises, measuring results. Geneva: World Health Organization; 2011 (http://www.who.int/topics/millennium_development_goals/accountability_commission/Commission_Report_advance_copy.pdf, accessed 11 March 2015).
27. Independent Expert Review Group. Every woman, every child: a post-2015 vision. The third report of the independent Expert Review Group on Information and Accountability for Women’s and Children’s Health. Geneva: World Health Organization; 2014 (http://apps.who.int/iris/bitstream/10665/132673/1/9789241507523_eng.pdf, accessed 11 March 2015).
28. UN Commission on Life-Saving Commodities for Women and Children. Commissioners’ Report: September 2012, New York, NY: United Nations; 2012 (http://www.everywomaneverychild.org/images/UN_Commission_Report_September_2012_Final.pdf, accessed 11 March 2015).
29. Committing to child survival: a promise renewed – Progress report 2012. New York, NY: United Nations Children’s Fund; 2012 (http://www.unicef.org/publications/index_65820.html, accessed 11 March 2015).
STATE OF INEQUALITY: REPRODUCTIVE, MATERNAL, NEWBORN AND CHILD HEALTH
62
30. Committing to child survival: a promise renewed – Progress report 2013. New York, NY: United Nations Children’s Fund; 2013 (http://www.unicef.org/publications/index_70354.html, accessed 11 March 2015).
31. Committing to child survival: a promise renewed – Progress report 2014. New York, NY: United Nations Children’s Fund; 2014 (http://www.unicef.org/publications/index_75736.html, accessed 11 March 2015).
32. The DHS Program: wealth index [website]. Rockville, MD: United States Agency for International Development; 2014 (http://dhsprogram.com/topics/wealth-index/Index.cfm, accessed 11 March 2015).
33. Reproductive health strategy to accelerate progress towards the attainment of international development goals and targets. Global strategy adopted at the 57th World Health Assembly. Geneva: World Health Organization; 2004 WHO/RHR/04.8 (http://www.who.int/reproductivehealth/publications/general/RHR_04_8/en/, accessed 11 March 2015).
34. Singh S, Darroch JE. Adding it up: costs and benefits of contraceptive services – estimates for 2012. New York, NY: Guttmacher Institute and New York, NY: United Nations Population Fund; 2012.
35. Ensuring human rights in the provision of contraceptive information and services: guidance and recommendations. Geneva: World Health Organization; 2014 (http://www.who.int/reproductivehealth/publications/family_planning/human-rights-contraception/en/, accessed 11 March 2015).
36. World Health Organization, United Nations Children’s Fund, United Nations Population Fund, World Bank, United Nations Population Division. Trends in maternal mortality: 1990 to 2013. Geneva: World Health Organization; 2014 (http://www.who.int/reproductivehealth/publications/monitoring/maternal-mortality-2013/en/, accessed 11 March 2015).
37. Task Force on Child Health and Maternal Health. Who’s got the power? Transforming health systems for women and children. London: Earthscan; 2005.
38. Progress report – reproductive health strategy. To accelerate progress towards the attainment of international development goals and targets. Geneva: World Health Organization; 2010 (http://www.who.int/reproductivehealth/publications/general/rhr_10_14/en/, accessed 11 March 2015).
39. Gwatkin D, Rutstein S, Johnson K, Suliman E, Wagstaff A, Amouzou A. Socio-economic differences in health, nutrition, and population within developing countries. Washington (DC): World Bank; 2007.
40. Liu L, Oza S, Hogan D, Perin J, Rudan I, Lawn JE et al. Global, regional, and national causes of child mortality in 2000–13, with projections to inform post-2015 priorities: an updated systematic analysis. Lancet. 2014;385(9966):430–40.
41. Pneumonia. Fact sheet 331. Geneva: World Health Organization; 2014 (http://www.who.int/mediacentre/factsheets/fs331/en/, accessed 11 March 2015).
42. World Health Organization, United Nations Children’s Fund. Global immunization data. July 2014. Geneva: World Health Organization; 2014 (http://www.who.int/immunization/monitoring_surveillance/global_immunization_data.pdf, accessed 11 March 2015).
43. Levels & trends in child malnutrition. Joint child malnutrition estimates. New York, NY: United Nations Children’s Fund, Geneva: World Health Organization and Washington (DC): World Bank; 2013 (http://www.who.int/nutgrowthdb/summary_jme_2013.pdf, accessed 11 March 2015).
44. Stewart CP, Iannotti L, Dewey KG, Michaelsen KF, Onyango AW. Contextualising complementary feeding in a broader framework for stunting prevention. Matern Child Nutr. 2013;9 (Suppl. 2):27–45.
45. Global Health Observatory (GHO) data: Under-five mortality [online database]. Geneva: World Health Organization; 2014 (http://www.who.int/gho/child_health/mortality/mortality_under_five/en/, accessed 11 March 2015).
46. United Nations Inter-agency Group for Child Mortality Estimation. Levels & trends in child mortality: Report 2014. New York, NY: United Nations Children’s Fund; 2014 (http://www.data.unicef.org/fckimages/uploads/1410869227_Child_Mortality_Report_2014.pdf, accessed 11 March 2015).
REFERENCES
63
47. Global Health Observatory (GHO) data: Causes of child mortality [online database]. Geneva: World Health Organization; 2014 (http://www.who.int/gho/child_health/mortality/causes/en/, accessed 11 March 2015).
48. Children: reducing mortality. Fact sheet 178. Geneva: World Health Organization; 2014 (http://www.who.int/mediacentre/factsheets/fs178/en/, accessed 11 March 2015).
49. Handbook on health inequality monitoring with a special focus on low- and middle-income countries. Geneva: World Health Organization; 2013 (http://apps.who.int/iris/bitstream/10665/85345/1/9789241548632_eng.pdf?ua=1, accessed 11 March 2015).
50. Kuruvilla S, Schweitzer J, Bishai D, Chowdhury S, Caramani D, Frost L et al. Success factors for reducing maternal and child mortality. Bull World Health Organ. 2014;92(7):533–44B.
51. Success factors for women’s and children’s health: how some countries are accelerating progress towards MDGs 4 and 5. Geneva: World Health Organization; 2014 (http://www.who.int/pmnch/knowledge/publications/success_factors_overview.pdf, accessed 11 March 2015).
52. Shaping the future for health women, children & adolescents: learn more about the process to update the Global Strategy [website]. Every Woman Every Child; 2014 (http://www.everywomaneverychild.org/global-strategy-2, accessed 11 March 2015).
53. A world that counts: mobilizing the data revolution for sustainable development [edocument]. Independent Expert Advisory Group on a Data Revolution for Sustainable Development (http://www.undatarevolution.org/wp-content/uploads/2014/12/A-World-That-Counts2.pdf, accessed 11 March 2015).
54. Monitoring framework for the post-2015 health goals of the SDGs: targets and indicators [draft]. Geneva: World Health Organization; 2014 (http://unstats.un.org/unsd/post-2015/activities/egm-on-indicator-framework/docs/Background%20note%20by%20WHO-%20Health%20SDG%20Targets%20and%20Indicators_EGM-Feb2015.pdf, accessed 30 March 2015).
55. Open Working Group of the General Assembly on Sustainable Development Goals. Open Working Group proposal for Sustainable Development Goals; 2014 (https://sustainabledevelopment.un.org/content/documents/1579SDGs%20Proposal.pdf, accessed 30 March 2015).
STATE OF INEQUALITY: REPRODUCTIVE, MATERNAL, NEWBORN AND CHILD HEALTH
64

Appendix 1. Data and analysis methodsData Data sourcesHealth indicator and dimension of inequality data were sourced from publicly available Demographic and Health Surveys (DHS) – rounds three, four, five and six – and Multiple Indicator Cluster Surveys (MICS) – rounds three and four. DHS and MICS are large-scale, nationally representative household health surveys that collect data through standardized, face-to-face interviews with women aged 15–49 years in low- and middle-income countries (1, 2). Country income group was determined using the World Bank classification as of July 2014 (3).
The disaggregated data used in this report are the product of a reanalysis of DHS and MICS micro-data by the International Center for Equity in Health based in the Federal University of Pelotas, Brazil, and can be freely accessed from the World Health Organization (WHO) Health Equity Monitor database (4).
The survey tools used by DHS and MICS permit direct comparisons between surveys, and the analyses in this report assume that the survey design and implementation quality are sufficiently similar between DHS and MICS, across countries and over time (5, 6). The data were taken from rounds of DHS and MICS that were not conducted in the same year in all countries. In a few cases, there may be minor differences between the data reported here and in previous DHS or MICS country reports due to small discrepancies in the time span, definition and/or calculation of some indicators.
Health indicator dataReproductive, maternal, newborn and child health (RMNCH) indicators were selected for inclusion in this report based on the global importance of the indicators and data availability. The RMNCH intervention indicators included in this report are similar to those used by the Countdown to 2015 initiative and the Commission on Information and Accountability for Women’s and Children’s Health, and overlap with the indicators for the Millennium Development Goals (MDGs) targets. The selected intervention indicators represent the continuum of care from reproductive to maternal health, and from newborn to child health; the child malnutrition and mortality indicators also have direct relevancy to the topic.
A description of each of the health indicators used in the report is provided in Supplementary table S1. Detailed information about the criteria used to calculate the numerator and denominator values for each indicator is available in the WHO Indicator and Measurement Registry, under the topic “Health Equity Monitor” (7). Note that the definitions for two of the maternal health intervention indicators used in this
Appendices
65

report (births attended by skilled health personnel and antenatal care coverage (at least one visit)) differ from the official WHO definitions, which employ a uniform definition of skilled health personnel across all countries (only doctors, nurses and midwives). In this report, the definition of skilled health personnel is country specific, and relevant health professionals were determined for each country by reviewing all DHS and MICS country reports. For child immunization indicators, the reference age group used in the denominator (12–23 months) was adjusted to align with alternative immunization schedules adopted in certain countries (18–29 months or 15–26 months).
The year associated with the survey reflects the year of data collection, but is not necessarily the status of the indicator during that year (Supplementary table S1). Mortality indicators, for example, refer to the 10-year period prior to the survey. We also note that there are minor discrepancies for indicators related to maternal health interventions and early initiation of breastfeeding, as DHS data for these indicators are based on live births in the three years prior to the survey and MICS data are based on live births in the two years prior to the survey (6).
Dimensions of inequality dataHealth data were disaggregated by four dimensions of inequality: economic status, education level, place of residence and sex. Economic status was determined at the household level, using a wealth index. Country-specific indices were based on owning selected assets and having access to certain services, and constructed using principal component analysis. Within each country the index was used to create quintiles, thereby identifying five equal subgroups that each account for 20% of the population (8, 9). Note that certain indicators have denominator criteria that do not include all households and/or are more likely to include households from a specific quintile; thus the share of the population for a given indicator may not equal 20%. For example, the birth rate in the poorest quintile is often higher than in the richest quintile, resulting in the poorest quintile representing a larger share of the affected population (number of live births) for indicators such as births attended by skilled health personnel.
Education level refers to the highest level of schooling attained by the woman or, in the case of newborn and child indicators, the mother. Three subgroups were defined: no education, primary school and secondary school or higher.
For place of residence classifications (that is, urban or rural), country specific criteria were applied.
Country selection Countries were selected for inclusion in our analyses based on data availability and survey year. When a survey was conducted over more than one calendar year, the year of survey was assigned based on the initial year of data collection. Low- and middle-income countries with surveys from the past 10 years were chosen to illustrate the “latest situation” of inequality. This included 86 countries (30 low-income countries and 56 middle-income countries) with the year of their most recent survey falling between 2005 and 2013 (54 DHS and 32 MICS). Countries encompassed all WHO regions: 36 countries from the African Region, 12 countries from the Region of the Americas, 8 countries from the South-East Asia Region, 15 countries from the European Region, 9 countries from the Eastern Mediterranean Region and 6 countries from the Western Pacific Region (Supplementary table S2).
STATE OF INEQUALITY: REPRODUCTIVE, MATERNAL, NEWBORN AND CHILD HEALTH
66

For the sake of consistency, the most recent DHS or MICS conducted during the period 2005–2013 was selected for each country, and then that survey was evaluated for health indicator data availability. If indicator data were not available from the most recent survey, the country was not included in analyses for that indicator, regardless of whether that country had relevant data from an older survey conducted during the period 2005–2013. Thus, the number of study countries included in analyses for each indicator was variable. For example, data for the indicators antenatal care coverage (at least four visits) and demand for family planning satisfied were only available from DHS and round four of MICS. Mortality indicator data were taken from DHS but not MICS, excluding from mortality-related analyses in two countries that had a post-2005 DHS but a more recent MICS: Ghana (DHS 2008) and Swaziland (DHS 2006).
“Change over time” was analysed for each study country that had surveys from two time points (a recent survey falling between 2005 and 2013 and an older survey falling between 1995 and 2004), and reflects the change in national averages and inequalities within countries over a period of about 10 years. Change-over-time analyses were possible for 42 countries (19 low-income countries and 23 middle-income countries) from all WHO regions (24 countries from the African Region, 5 countries from the Region of the Americas, 4 countries from the South-East Asia Region, 4 countries from the European Region, 2 countries from the Eastern Mediterranean Region and 3 countries from the Western Pacific Region). The number of years between surveys within countries ranged from 5 to 15 years, as per data availability, though for the majority of countries this gap was 10 or 11 years. When more than one older survey was available, the survey closest to 10 years prior to the most recent survey was selected.
With the exception of reference tables and maps, study countries were excluded on a case-by-case basis if data about the relevant health indicator and/or dimension of inequality were not available, or if the sample size was too low to report a valid estimate for one or more of the relevant subgroups (that is, less than 25 cases, or in the case of mortality indicators, less than 250 unweighted person-years of exposure to the risk of death). For example, there were 54 countries included in the latest-situation analysis of demand for family planning satisfied by education level: from the pool of 86 countries, 23 countries were excluded because the country’s most recent survey did not have data about the indicator, 5 countries were excluded because the survey did not have data about women’s education levels according to the classification used in this report, and 4 countries were excluded because the sample size was less than 25 cases in any one education subgroup.
In all visuals, situations of low sample size were noted. This included estimates based on 25–49 cases, or in the case of mortality indicators, 250–499 unweighted person-years of exposure to the risk of death. In reference tables and maps, all countries were included (even if data from one or more subgroups were not listed); missing data were flagged as not available, not reported or not calculated.
In 13 MICS, education was classified according to different criteria than those applied in other surveys, and subgroup data could not be reasonably compared with those from other study countries. Data from these 13 surveys were thus excluded from subsequent disaggregation and analyses by education. These surveys were conducted in Albania (MICS 2005), Belize MICS (2006), Cuba (MICS 2006 and MICS 2010), Georgia (MICS 2005), Guyana (MICS 2006), Kazakhstan (MICS 2006 and MICS 2010), Kyrgyzstan (MICS 2005), Montenegro (MICS 2005), Serbia (MICS 2005), Ukraine (MICS 2005) and Uzbekistan (MICS 2006). In five DHS, mortality data could not be calculated for all education subgroups; these data were also excluded from further disaggregation and analyses by education. This applied to surveys conducted in Kazakhstan (DHS 1999), Kyrgyzstan (DHS 1997), Republic of Moldova (DHS 2005), Ukraine (DHS 2007) and Uzbekistan (DHS 1996).
APPENDICES
67

The composite coverage index for a given subgroup was not calculated when any of the eight component indicators had a sample size of less than 25 cases.
Determinants of healthTwo databases were searched for potentially relevant determinants of health: the World Bank DataBank (10) and the WHO Global Health Observatory (11). Following consultation with WHO experts, 23 relevant factors were selected to showcase the associations between health indicators and their determinants (Table A1.1). Correlation analyses were also done to show the relationship between health outcomes and selected RMNCH interventions: contraceptive prevalence (modern methods); demand for family planning satisfied; antenatal care coverage (at least one visit); births attended by skilled health personnel; DTP3 immunization coverage among one-year-olds; full immunization coverage among one-year-olds; and composite coverage index.
TABLE A1.1 Health determinants included in correlation analyses with RMNCH indicators, grouped according to the EQuity-oriented AnalysisofLinkagesbetweenhealthandothersectors(EQuAL)Framework*
Health determinant Source
Environmental quality• Accesstoelectricity(%ofpopulation)
World Bank DataBank
• Populationusingimproveddrinking-watersources(%)**• Populationusingimprovedsanitationfacilities(%)**• Roaddensity(kilometreofroadper100squarekilometresoflandarea)
WHO Global Health Observatory
Accountability and inclusion • Labourforceparticipationrateforages15–24years,female(%)• Literacyrateforages15–24years,female(%)• Primaryschoolcompletionrate,female(%ofrelevantagegroup)• Ratiooffemaletomalelabourforceparticipationrate
World Bank DataBank
Livelihoods and skills• GDPpercapita,PPP(currentinternationaldollars)• GNIpercapita,PPP(currentinternationaldollars)• Giniindex• Labourforceparticipationrateforages15–24years,total(%)• Literacyrateforages15–24years,total(%)• Mobilecellularsubscriptions(per100people)• Povertyheadcountratioatnationalpovertyline(%ofpopulation)
World Bank DataBank
Demography• Agedependencyratio(%ofworking-agepopulation)• Population(total)• Populationaged0–14years(%oftotal)• Populationgrowth(%peryear)• Urbanpopulation(%oftotal)
World Bank DataBank
Health system inputs• Percapitagovernmentexpenditureonhealth,PPP(internationaldollars)• Percapitatotalexpenditureonhealth,PPP(internationaldollars)• Physiciansdensity(per1000population)
WHO Global Health Observatory
GDP: gross domestic product; GNI: gross national income; PPP: purchasing power parity.*MoreinformationabouttheEQuALFrameworkwillbeavailableinaforthcomingWHOreportMonitoring health determinants for equity (in preparation).** Determinant was only analysed for health outcomes (and not health interventions).
STATE OF INEQUALITY: REPRODUCTIVE, MATERNAL, NEWBORN AND CHILD HEALTH
68
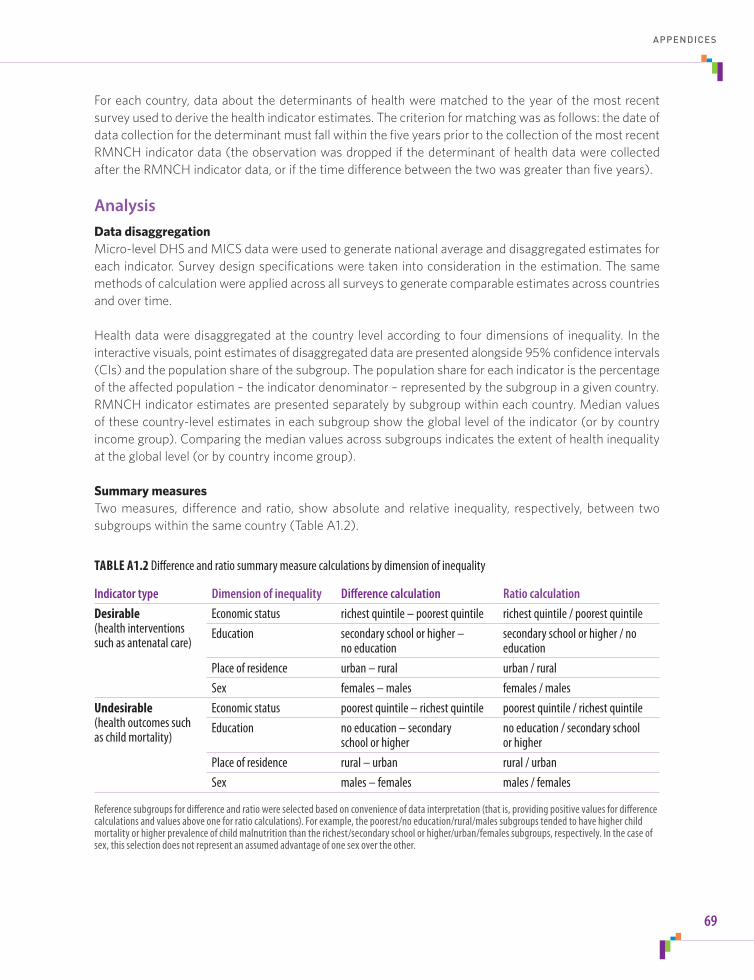
For each country, data about the determinants of health were matched to the year of the most recent survey used to derive the health indicator estimates. The criterion for matching was as follows: the date of data collection for the determinant must fall within the five years prior to the collection of the most recent RMNCH indicator data (the observation was dropped if the determinant of health data were collected after the RMNCH indicator data, or if the time difference between the two was greater than five years).
AnalysisData disaggregationMicro-level DHS and MICS data were used to generate national average and disaggregated estimates for each indicator. Survey design specifications were taken into consideration in the estimation. The same methods of calculation were applied across all surveys to generate comparable estimates across countries and over time.
Health data were disaggregated at the country level according to four dimensions of inequality. In the interactive visuals, point estimates of disaggregated data are presented alongside 95% confidence intervals (CIs) and the population share of the subgroup. The population share for each indicator is the percentage of the affected population – the indicator denominator – represented by the subgroup in a given country. RMNCH indicator estimates are presented separately by subgroup within each country. Median values of these country-level estimates in each subgroup show the global level of the indicator (or by country income group). Comparing the median values across subgroups indicates the extent of health inequality at the global level (or by country income group).
Summary measuresTwo measures, difference and ratio, show absolute and relative inequality, respectively, between two subgroups within the same country (Table A1.2).
TABLE A1.2 Difference and ratio summary measure calculations by dimension of inequality
Indicator type Dimension of inequality Difference calculation Ratio calculation
Desirable (health interventions such as antenatal care)
Economic status richest quintile – poorest quintile richest quintile / poorest quintileEducation secondary school or higher –
no educationsecondary school or higher / no education
Place of residence urban – rural urban / ruralSex females – males females / males
Undesirable (health outcomes such as child mortality)
Economic status poorest quintile – richest quintile poorest quintile / richest quintileEducation no education – secondary
school or higherno education / secondary school or higher
Place of residence rural – urban rural / urbanSex males – females males / females
Reference subgroups for difference and ratio were selected based on convenience of data interpretation (that is, providing positive values for difference calculations and values above one for ratio calculations). For example, the poorest/no education/rural/males subgroups tended to have higher child mortality or higher prevalence of child malnutrition than the richest/secondary school or higher/urban/females subgroups, respectively. In the case of sex, this selection does not represent an assumed advantage of one sex over the other.
APPENDICES
69

Population attributable risk was calculated as the difference between the level of RMNCH intervention coverage in the most-advantaged subgroup (richest quintile, secondary school or higher, or urban) and the national average. Generally, the subtraction yielded a positive value; however, in exceptional cases the result was a negative value (indicating that coverage in the most-advantaged subgroup was lower than the national average). For the purposes of this report, negative population attributable risk values were reassigned to zero to convey that there would be no improvement in the national average if coverage in the total population reached the level of the most advantaged.
For change over time in a given health indicator, the annual change calculation indicates the average change per year within a subgroup of a given country. Annual change was calculated using the number of years between survey one (falling between 1995 and 2004) and survey two (falling between 2005 and 2013), a value that ranged from 5 to 15 years. Annual absolute change was calculated as the difference in health indicator level at the two survey points (most recent survey data minus older survey data), divided by the gap between survey years. A positive value indicates increasing level of the health indicator; that is, an increase in health intervention coverage (a favourable event) or an increase in child mortality or malnutrition prevalence (a non-favourable event). A negative value indicates decreasing level of the health indicator; that is, a decrease in health intervention coverage or a decrease in child mortality or malnutrition prevalence.
Annual absolute excess change compares the pace of change in the most-disadvantaged subgroup (poorest quintile, no education or rural) with that in the most-advantaged subgroup (richest quintile, secondary school or higher, or urban). It is calculated as the annual absolute change in the disadvantaged subgroup minus the annual absolute change in the advantaged subgroup. In the case of sex, excess change compares the pace of change in males with that in females, and is calculated as the annual absolute change in males minus the annual absolute change in females. This selection does not represent an assumed advantage of one sex over the other. More information about the interpretation of annual absolute excess change is available in Appendix 2.
For all summary measures, values between -0.1 and +0.1 (percentage points or deaths per 1000 live births) were interpreted as no inequality (in case of latest status analyses) or no change over time. The same logic was applied to evaluate change in national average over time.
References1. The DHS Program [website]. Rockville, MD: United States Agency for International Development; 2015 (http://
dhsprogram.com, accessed 11 March 2015).
2. Statistics and monitoring: Multiple Indicator Cluster Survey (MICS) [website]. New York, NY: United Nations Children’s Fund; 2015 (http://www.unicef.org/statistics/index_24302.html, accessed 11 March 2015).
3. Data: Country and lending groups [website]. Washington (DC): World Bank; 2014 (http://data.worldbank.org/about/country-and-lending-groups#OECD_members, accessed 11 March 2015).
4. Global Health Observatory (GHO) data: Health Equity Monitor [online database]. Geneva: World Health Organization; 2013 (http://www.who.int/gho/health_equity/en/, accessed 11 March 2015).
5. Requejo J, Victora C, Bryce J. Data resource profile: countdown to 2015: maternal, newborn and child survival. Int J Epidemiol. 2014;43(2):586–96.
6. Hancioglu A, Arnold F. Measuring coverage in MNCH: tracking progress in health for women and children using DHS and MICS household surveys. PLoS Med. 2013;10(5):e1001391.
STATE OF INEQUALITY: REPRODUCTIVE, MATERNAL, NEWBORN AND CHILD HEALTH
70

7. Global Health Observatory (GHO) data: WHO indicator registry [online database]. Geneva: World Health Organization; 2015 (http://www.who.int/gho/indicator_registry/en/, accessed 11 March 2015).
8. Rutstein S, Johnson K. DHS comparative reports no. 6: the DHS wealth index. Calverton, MD: ORC Macro; 2004.
9. The DHS Program: wealth index [website]. Rockville, MD: United States Agency for International Development; 2014 (http://dhsprogram.com/topics/wealth-index/Index.cfm, accessed 11 March 2015)
10. Data: World Bank open data [website]. Washington (DC): World Bank; 2015 (http://data.worldbank.org/, accessed 11 March 2015).
11. Global Health Observatory (GHO) data: Data repository [online database]. Geneva: World Health Organization; 2015 (http://www.who.int/gho/database/en/, accessed 11 March 2015).
APPENDICES
71

Appendix 2. Assessing health inequality: methodological considerationsGeneral guidelines for assessing and reporting the state of inequality include (1):
• Disaggregateddataandsummarymeasuresshouldbereportedtogether.Disaggregateddatagiveasense of the underlying level of health, and summary measures enhance interpretation and reporting by expressing inequality in a single number.
• Bothrelativeandabsolutesummarymeasuresshouldbeconsideredand/orreportedtogiveasenseof the magnitude of the difference between two subgroups and also to provide a relative comparison between two subgroups.
• National average should beprovided alongside inequality estimates to provide amore completeassessment of the situation.
• Accountingforpopulationsharewhenreportinginequalityprovidesamorenuancedindicationofhowinequalities exist within populations.
• Whenassessingchangeovertime,itisimportanttoconsiderthebaselinelevelofhealth,asthereisgreater room for improvement in situations of poor performance at baseline. This is often the case when comparing the progress in disadvantaged and advantaged subgroups, as the disadvantaged often have lower levels of health at baseline and therefore a larger margin of improvement is possible.
• Wheninterpretingestimatesthatapproachlowerandupperlimitsitisimportanttoconsider:- as the overall coverage of a health intervention approaches 100%, the difference and ratio values
typically decrease; - if the coverage in the disadvantaged group is very low, the resulting ratio (between disadvantaged and
advantaged subgroups) may be very high.
Confidence intervals An important feature of these analyses is the inclusion of 95% confidence intervals (CIs) for point estimates of disaggregated data. CIs can be accessed in the interactive visualization components that accompany this report.
Reporting CIs can help users of the data to judge whether there are statistical differences between subgroups. Some caution is required, however, when using confidence measurements to draw conclusions about health inequality data. Estimates that are derived from large samples may prove to be statistically different mathematically, but in the realm of public health this difference may not be meaningful. For example, there was a statistical difference in the prevalence of demand for family planning satisfied in Peru between rural areas (88.8%) and urban areas (90.9%). However, in terms of public health policies, programmes and practices, this 2.1% difference bears little importance.
Nevertheless, this does not mean that CIs should be ignored when reporting data. Rather, there is a need to ensure that point estimates do not lead to false conclusions and misinformed policy. This includes considering whether the CIs of the point estimates are narrow enough to allow valid conclusions about inequality to be drawn. For example, CIs for estimates of the treatment of sick children are important to help indicate the underlying precision of the data. The sample size of the affected population for these indicators is typically much larger among poorer households than richer households. The CI for the richest quintile may be wider, and therefore estimates for the richest quintile may be less precise.
STATE OF INEQUALITY: REPRODUCTIVE, MATERNAL, NEWBORN AND CHILD HEALTH
72

Population shareWhen reporting disaggregated data, providing information about the population share in each subgroup allows for a more thorough interpretation of whether inequalities and changes in inequality over time are meaningful.
An example from Indonesia demonstrates the importance of accounting for population share. Looking at the disaggregated data presented in Figure A2.1, the education-related inequality in antenatal care coverage (at least four visits) appears to have increased between 2002 and 2012 due to hastened increases in the primary school and secondary school or higher subgroups, and decreasing coverage in the no education subgroup. Based on this information, a logical conclusion would be that education-related inequality has increased over time.
Considering the population share, however, brings another layer of meaning to the data. The data presented in Figure A2.2 show the proportion of women with a live birth within three years preceding the survey in Indonesia, by education level, in DHS 2002 and 2012. Information about population share reveal that there was a substantial increase in the proportion of women belonging to the secondary school or higher subgroup, and a decrease in the proportion of women in the no education subgroup. Evidently, there was a population shift between education subgroups over the 10-year period in Indonesia.
Inequality monitoring should draw upon summary measures that take into account disaggregated data and population share across subgroups. For example, summary measures such as the slope index of inequality and the concentration index provide a more sophisticated estimation of inequality than simple measures of inequality (1). By taking into account population shift in the above example, these measures may indicate a decrease in inequality over time, and thus are appropriate measures to capture the impact of upstream policies, such as those promoting education among women. However, such measures require more effort to understand and were not used in this report.
APPENDICES
73
FIGURE A2.1Antenatalcarecoverage(atleastfourvisits)bywoman’seducationinIndonesia(DHS2002and2012)
n No education n Primary school n Secondary school +
Cove
rage
(%)
2002 2012
90
60
40
30
20
10
70
50
0
80
100

Interpreting absolute excess changeExcess change calculations compare the pace of change in two population subgroups over a number of years. In this report, the annual absolute excess change value is interpreted differently for health interventions (where increased intervention coverage is desired) than for health outcomes (where decreased malnutrition and mortality are desired). Several possible scenarios are possible, as detailed in Table A2.1.
Maldivesreportedastuntingprevalenceof15.4%inchildrenlessthanfiveyearsofagewhowereborntomotherswithasecondaryschoolorhigherlevelofeducation,witha95%CIrangingfrom13.1to18.0%.Theshareofthepopulationinthissubgroup(mother’seducation:secondaryschoolorhigher)was49.7%,meaningthatabouthalfofthechildrenunderfiveyears of age in Maldives represented by the DHS 2009 had a mother with a secondary school or higher level of education.
INTERPRETING 95% CONFIDENCE INTERVALS AND POPULATION SHARE: AN EXAMPLE
Maldives, DHS 2009Stunting prevalence in children aged < 5 years (%)By mother’s education: Secondary school + (49.7% of affected population)Estimate: 15.4%; 95%CI: 13.1–18.0
National average: 18.0%; 95%CI: 16.0–20.1
STATE OF INEQUALITY: REPRODUCTIVE, MATERNAL, NEWBORN AND CHILD HEALTH
74
Popu
lation
shar
e (%
)
90
60
40
30
20
10
70
50
80
100
02002
48.546.94.6
2012
67.230.91.9
n Secondary school +n Primary schooln No education
FIGURE A2.2Proportionofwomenaged15–49yearswithalivebirthwithinthreeyearsprecedingthesurveybyeducationinIndonesia(DHS2002and2012)

TABLE A2.1 Guide to interpreting annual absolute excess change estimates
Indicator type
Sign of annual absolute excess change (nature of change)
Direction of annual absolute change in advantaged and disadvantaged subgroups Pace of annual absolute change in subgroups
Desirable (health interventions such as antenatal care)
Positive value (pro-disadvantaged change)
Increasing in both* Increase occurred faster in the disadvantaged subgroup than in the advantaged subgroup
Decreasing in both Decrease occurred slower in the disadvantaged subgroup than in the advantaged subgroup
Mixed directions Increase (or no change) occurred in the disadvantaged subgroup and decrease (or no change) occurred in the advantaged subgroup
Negative value (pro-advantaged change)
Increasing in both Increase occurred slower in the disadvantaged subgroup than in the advantaged subgroup
Decreasing in both** Decrease occurred faster in the disadvantaged subgroup than in the advantaged subgroup
Mixed directions Decrease (or no change) occurred in the disadvantaged subgroup and increase (or no change) occurred in the advantaged subgroup
Zerovalue*** No change in eitherSame direction of change Subgroups reported the same pace of change
Undesirable (health outcomes such as child mortality)
Negative value(pro-disadvantaged change)
Decreasing in both* Decrease occurred faster in the disadvantaged subgroup than in the advantaged subgroup
Increasing in both Increase occurred slower in the disadvantaged subgroup than in the advantaged subgroup
Mixed directions Decrease (or no change) occurred in the disadvantaged subgroup and increase (or no change) occurred in the advantaged subgroup
Positive value(pro-advantaged change)
Decreasing in both Decrease occurred slower in the disadvantaged subgroup than in the advantaged subgroup
Increasing in both** Increase occurred faster in the disadvantaged subgroup than in the advantaged subgroup
Mixed directions Increase (or no change) occurred in the disadvantaged subgroup and decrease (or no change) occurred in the advantaged subgroup
Zerovalue*** No change in eitherSame direction of change Subgroups reported the same pace of change
* Indicates the best-case scenario of improved national average and narrowing inequality.** Indicates the worst-case scenario of worsening national average and widening inequality.***Absoluteexcesschangevaluesintherangeof-0.1to+0.1percentagepointsordeathsper1000livebirthswereinterpretedasnochange.
Reference1. Handbook on health inequality monitoring with a special focus on low- and middle-income countries. Geneva:
World Health Organization; 2013 (http://apps.who.int/iris/bitstream/10665/85345/1/9789241548632_eng.pdf?ua=1, accessed 11 March 2015).
APPENDICES
75
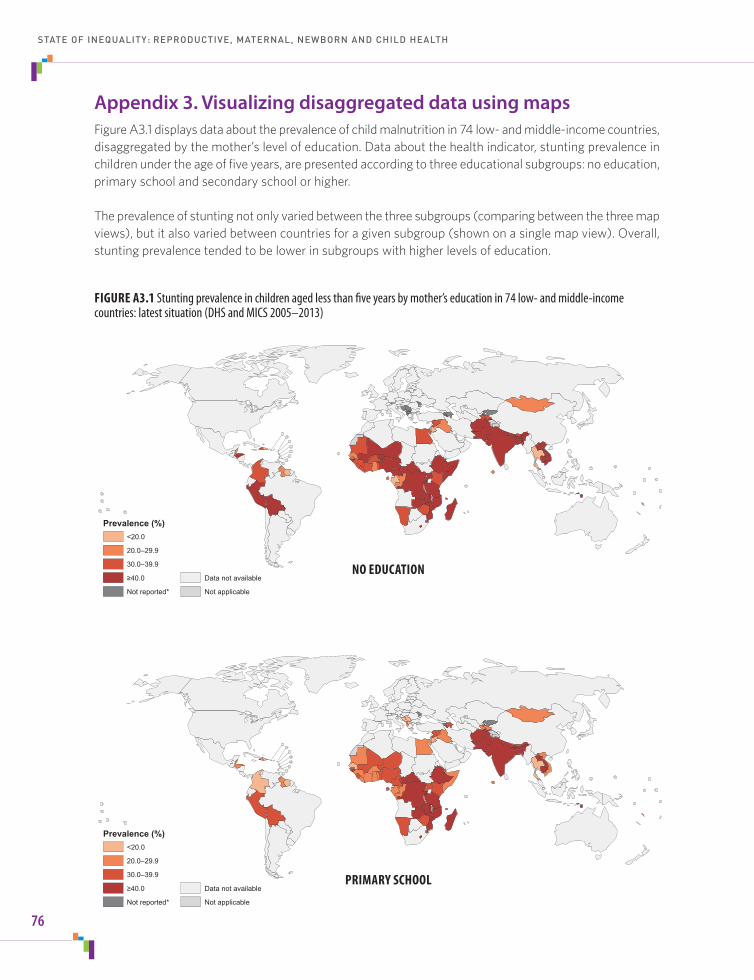
Appendix 3. Visualizing disaggregated data using mapsFigure A3.1 displays data about the prevalence of child malnutrition in 74 low- and middle-income countries, disaggregated by the mother’s level of education. Data about the health indicator, stunting prevalence in children under the age of five years, are presented according to three educational subgroups: no education, primary school and secondary school or higher.
The prevalence of stunting not only varied between the three subgroups (comparing between the three map views), but it also varied between countries for a given subgroup (shown on a single map view). Overall, stunting prevalence tended to be lower in subgroups with higher levels of education.
0 1,700 3,400850 Kilometers
Prevalence (%)<20.0
20.0–29.9
30.0–39.9
≥40.0
Not reported*
Data not available
Not applicable
0 1,700 3,400850 Kilometers
Prevalence (%)<20.0
20.0–29.9
30.0–39.9
≥40.0
Not reported*
Data not available
Not applicable
STATE OF INEQUALITY: REPRODUCTIVE, MATERNAL, NEWBORN AND CHILD HEALTH
76
FIGURE A3.1Stuntingprevalenceinchildrenagedlessthanfiveyearsbymother’seducationin74low-andmiddle-incomecountries:latestsituation(DHSandMICS2005–2013)
NO EDUCATION
PRIMARY SCHOOL

0 1,700 3,400850 Kilometers
Prevalence (%)<20.0
20.0–29.9
30.0–39.9
≥40.0
Data not available
Not applicable
*Estimatewasbasedonfewerthan25cases.
VIDEO CLIP 3. HEALTH INEQUALITIES ARE WIDESPREAD
Watch this short video clip to explore the question: how much does child malnutrition vary across education subgroups within countries?
AVAILABLE ON CD/USB SCAN HERE
I n t e r a c t I v e v I s u a l I z at I o n o f H e a lt H D at a
ISBN 978 92 4 156491 5
© copyright world health organization, 2015. for free distribution.
World HealtH organization20, avenue appia
CH-1211 geneva 27SWitzerland
state of InequalItyreproductive, maternal,
newborn and child health
http://www.who.int/gho/health_equity/report_2015/
www.who.int/gho/health_equity/videos/en/
APPENDICES
77
SECONDARY SCHOOL +
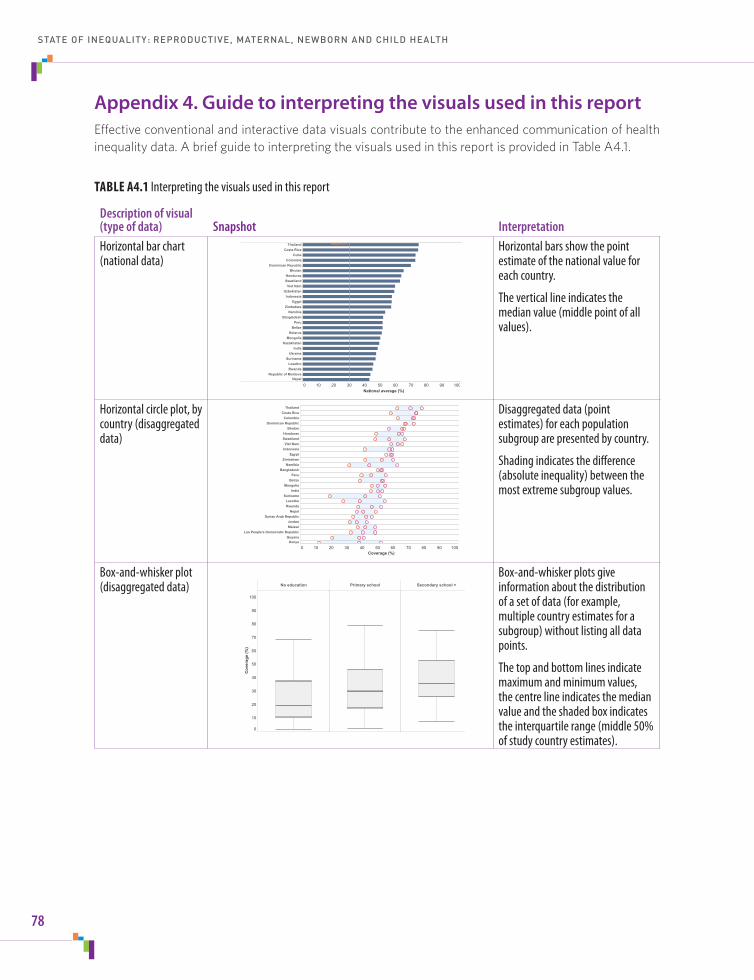
Appendix 4. Guide to interpreting the visuals used in this reportEffective conventional and interactive data visuals contribute to the enhanced communication of health inequality data. A brief guide to interpreting the visuals used in this report is provided in Table A4.1.
TABLE A4.1 Interpreting the visuals used in this report
Description of visual (type of data) Snapshot InterpretationHorizontal bar chart (national data)
0 10 20 30 40 50 60 70 80 90 100National average (%)
ThailandCosta Rica
CubaColombia
Dominican RepublicBhutan
HondurasSwaziland
Viet NamUzbekistan
IndonesiaEgypt
ZimbabweNamibia
BangladeshPeru
BelizeBelarus
MongoliaKazakhstan
IndiaUkraine
SurinameLesothoRwanda
Republic of MoldovaNepal
Median=30.2 Horizontal bars show the point estimate of the national value for each country.
The vertical line indicates the median value (middle point of all values).
Horizontal circle plot, by country (disaggregated data)
0 10 20 30 40 50 60 70 80 90 100Coverage (%)
ThailandCosta Rica
ColombiaDominican Republic
BhutanHondurasSwaziland
Viet NamIndonesia
EgyptZimbabwe
NamibiaBangladesh
PeruBelize
MongoliaIndia
SurinameLesothoRwanda
NepalSyrian Arab Republic
JordanMalawi
Lao People's Democratic RepublicGuyana
Kenya
Disaggregated data (point estimates) for each population subgroup are presented by country.
Shading indicates the difference (absolute inequality) between the most extreme subgroup values.
Box-and-whisker plot (disaggregated data) No education Primary school Secondary school +
0
10
20
30
40
50
60
70
80
90
100
Cov
erag
e (%
)
Box-and-whisker plots give information about the distribution of a set of data (for example, multiple country estimates for a subgroup) without listing all data points.
The top and bottom lines indicate maximum and minimum values, the centre line indicates the median value and the shaded box indicates theinterquartilerange(middle50%of study country estimates).
STATE OF INEQUALITY: REPRODUCTIVE, MATERNAL, NEWBORN AND CHILD HEALTH
78

Description of visual (type of data) Snapshot InterpretationVertical circle graph (disaggregated data)
No education Primary school Secondary school +
0
10
20
30
40
50
60
70
80
90
100
Cov
erag
e (%
)
Circles represent the point estimate for each country within each subgroup: each country is represented by one circle per subgroup.
Horizontal grey lines indicate the median values and the grey band indicates the interquartile range.
Vertical circle graph, by country (summary measures)
-20
-10
0
10
20
30
40
50
60
Circles represent the value of the specified summary measure for each country.
Summary measures include: difference or ratio value (calculated using the most-advantaged and most-disadvantaged subgroups); change over time (annual absolute change in the most-advantaged or most-disadvantaged subgroup); and annual absolute excess change value (comparing pace of change in the most-advantaged and most-disadvantaged subgroup).
The horizontal grey line indicates the median value and the grey band indicates the interquartile range.
Scatterplot – four quadrant view (national data and summary measures)
0 10 20 30 40 50 60 70 80 90 100
-20
-10
0
10
20
30
40
50
60
Each country is represented by one shape.
For latest situation, the national average (x-axis) is plotted against the difference (absolute inequality) between the most extreme subgroups (y-axis) for each country.
For change over time, the annual change in the national average (x-axis) is plotted against the annual absolute excess change (y-axis) for each country.
The horizontal and vertical orange lines indicate the median values.
APPENDICES
79

Description of visual (type of data) Snapshot InterpretationChange-over-time line plot (disaggregated data)
No education Primary school Secondary school +
Survey 1 Survey 2 Survey 1 Survey 2 Survey 1 Survey 20
10
20
30
40
50
60
70
80
90
100
Cov
erag
e (%
)
Each country is represented by one line per subgroup.
Lines indicate the change over time for each country within each subgroup.
Map with vertical bar charts (disaggregated data)
Maps show data for a selected subgroup across countries.
The bar chart at the bottom left displays data for a selected subgroup across countries.
The bar chart at the bottom right displays disaggregated data for a selected dimension of inequality across all subgroups of a selected country.
STATE OF INEQUALITY: REPRODUCTIVE, MATERNAL, NEWBORN AND CHILD HEALTH
80

Appendix 5. Interactive visualization of health dataInteractive data visualization technology can help to enhance the accessibility of health inequality data. This report links to several types of interactive components: map-based dashboards, story-points (consisting of a variety of interactive graphs), reference data tables and country profiles. These components reinforce the content of conventional forms of data presentation employed in this report (text and static tables, graphs and maps). Interactive components also provide users with tools to explore a large database of health data for other stories about health inequalities.
Like the more conventional forms of data presentation used in this report, the accompanying interactive visuals aim to motivate users to engage with the key messages that emerge from data and ultimately take appropriate steps to monitor and address health inequalities. The effective use of interactive visualization technology confers certain benefits over conventional forms of data presentation by:
• presentinglargeamountsofdatainanapproachableandmodifiableformat;
• allowinguserstoselectandcustomizedataviews,suchaschoosingahealthindicatorofinterest;
• makingitpossibletodrilldownthroughlevelsofdataviews,fromtheglobalperspectivetoaselectedlocal level;
• enablinguserstoselectivelybenchmarkinordertoassesshowcountriesareperforminginrelationtoone another; and
• providinganovelandefficientwaytoexplorepatternsinhealthdata.
For interactive visuals to be effective, users need to know how to use their features and how to interpret the underlying messages. Optimally, little effort should be spent on decoding the surface of what one is looking at – if a visual is well designed with the target audience in mind, this should be almost intuitive. Instead, the focus should remain on exploring the substantive content of the visual and the health stories within.Many of the considerations that surround creating effective data visuals depend on the purpose of the communication product, the needs and abilities of the target audience, and the characteristics of the data that are being communicated. The possibilities may be limited by the methods and tools that are available to generate the visual. However, in a general sense, there are certain best practices that have wide applicability to visualizing health data and are exemplified in the interactive visuals that accompany this report (Table A5.1).
APPENDICES
81

TABLE A5.1 Best practices in interactive visualization of data
Best practice Application
Make the visualization(s) cohesive. Ensure that all parts of the dashboard are relevant to the central theme and messages that are being communicated. ➜
Story-points feature comprehensive information about the state of inequality in a selected category of RMNCH.
Interactive maps are built around each dimension of inequality.
Make navigation straightforward. Provide concise directions to support new users. When guiding readers through multiple dashboards, maintain a consistent design and placement of navigation tools. ➜
Dashboards are designed with common visual cues to signal navigation, such as arrows, tabs and buttons.
Yellow stickers on the first few story-point views introduce users to dashboard features, and a help button is available for more detailed navigation assistance.
The selection menu is placed on the left throughout all visuals.
Introduce data in a logical manner. Avoidoverwhelminguserswithtoomuchinformationatonce.Agoodapproachistoprogressfromsimpletomorecomplexconcepts. ➜
Inequalities in health are explained through the use of story-points. Stories feature data and information, building from national average to within-country inequality and from the latest situation to change over time. Complex views, such as scatterplots, are introduced first as separate components, and then combined into one view.
Use interactive features in a meaningful way. Be cognizant of the types of customization that are relevant to the user. ➜
Selection, filtering and highlighting options were chosen based on their logical application to aid interpretation. For example, users can click on legend entries to highlight data.
Use non-interactive (static) aspects of visualization software effectively. When developing interactive dashboards consider how to best apply formatting, settings and design options.
➜The use of the same background colours, title font/size/placement and layout of dashboards creates a unified look.
Emphasize graphics over text. In most cases, the graphics of a dashboard should be the prominent feature; text should be used sparingly in dashboards, only when necessary to augment the information in the graphic.
➜
Buttons and tooltips (pop-ups) provide access to additional text without cluttering the main view of the dashboard.
Use colours purposefully. Colours can be a valuable feature for conveying meaning and patternsindata.Allcolourassignmentsshouldbedeliberate.Note that green–red colour combinations may be difficult for those who are colour blind.
➜
Data points and labels are colour-coded when appropriate. For example, red is used to denote unfavourable situations and blue is used to denote favourable situations.
Make additional information available. Usersshouldbeabletoaccesssufficientinformationabouttheunderlying data to assess its strengths and limitations. Details about the data sources, data selection criteria and method of analysis should be available.
➜
Buttons and tooltips contain information about the content of the visual, and technical notes are available on the dashboards.
Usersarepromptedtorefertothetextofthereportformore detailed information.
RMNCH: Reproductive, maternal, newborn and child health.
STATE OF INEQUALITY: REPRODUCTIVE, MATERNAL, NEWBORN AND CHILD HEALTH
82

Appendix 6. Additional interactive visuals: references for further data explorationAudiences have diverse data needs, and may benefit from additional and alternative approaches to data presentation and reporting. The following interactive visuals present the state of inequality in reproductive, maternal, newborn and child health (RMNCH) through country profiles, maps, reference tables and a comprehensive interactive visual of all RMNCH interventions.
http://www.who.int/gho/health_equity/report_2015/
INTERACTIVE VISUAL A1. EQUITY COUNTRY PROFILES
Electronic visualization components accompany this report to enable independent data exploration and benchmarking.
Country profiles contain all available disaggregated data related to RMNCH interventions and outcomes indicators for a selected country.
AVAILABLE ON CD/USB SCAN HERE
I n t e r a c t I v e v I s u a l I z at I o n o f H e a lt H D at a
ISBN 978 92 4 156491 5
© copyright world health organization, 2015. for free distribution.
World HealtH organization20, avenue appia
CH-1211 geneva 27SWitzerland
state of InequalItyreproductive, maternal,
newborn and child health
http://www.who.int/gho/health_equity/report_2015/
http://www.who.int/gho/health_equity/report_2015/
INTERACTIVE VISUAL A2. MAPS
Electronic visualization components accompany this report to enable independent data exploration and benchmarking.
Interactive maps display disaggregated data for RMNCH indicators by different dimensions of inequality: economic status, education, place of residence and sex.
AVAILABLE ON CD/USB SCAN HERE
I n t e r a c t I v e v I s u a l I z at I o n o f H e a lt H D at a
ISBN 978 92 4 156491 5
© copyright world health organization, 2015. for free distribution.
World HealtH organization20, avenue appia
CH-1211 geneva 27SWitzerland
state of InequalItyreproductive, maternal,
newborn and child health
http://www.who.int/gho/health_equity/report_2015/
http://www.who.int/gho/health_equity/report_2015/
INTERACTIVE VISUAL A3. REFERENCE TABLES
Electronic visualization components accompany this report to enable independent data exploration and benchmarking.
Interactive reference tables contain complete data from all available surveys from 86 low- and middle-income countries.
AVAILABLE ON CD/USB SCAN HERE
I n t e r a c t I v e v I s u a l I z at I o n o f H e a lt H D at a
ISBN 978 92 4 156491 5
© copyright world health organization, 2015. for free distribution.
World HealtH organization20, avenue appia
CH-1211 geneva 27SWitzerland
state of InequalItyreproductive, maternal,
newborn and child health
http://www.who.int/gho/health_equity/report_2015/
APPENDICES
83

http://www.who.int/gho/health_equity/report_2015/
INTERACTIVE VISUAL A4. RMNCH INTERVENTIONS
Electronic visualization components accompany this report to enable independent data exploration and benchmarking.
This story-point interactive visual guides you through the state of inequality in a selected RMNCH intervention indicator and dimension of inequality.
AVAILABLE ON CD/USB SCAN HERE
I n t e r a c t I v e v I s u a l I z at I o n o f H e a lt H D at a
ISBN 978 92 4 156491 5
© copyright world health organization, 2015. for free distribution.
World HealtH organization20, avenue appia
CH-1211 geneva 27SWitzerland
state of InequalItyreproductive, maternal,
newborn and child health
http://www.who.int/gho/health_equity/report_2015/
STATE OF INEQUALITY: REPRODUCTIVE, MATERNAL, NEWBORN AND CHILD HEALTH
84

Appendix 7. Patterns of inequalityFor indicators that have more than two ordered subgroups (that is, multiple subgroups that can be ranked based on logical criteria, such as wealth quintiles or multiple levels of education), characteristic patterns of inequality across disaggregated data may be identified. To illustrate, Figure A7.1 displays four patterns in health intervention coverage data, disaggregated by economic status.
Each of the four distinct patterns of inequality prompts a different general policy response (1, 2).
• Acomplete coverage pattern is shown by the green line. All quintiles report nearly 100% coverage, and thus universal coverage has been achieved. Ongoing monitoring may be warranted to ensure that the situation remains favourable for all.
• Amarginal exclusion pattern – also called top inequality – is represented by the blue line. The indicator demonstrated much lower coverage in the poorest quintile relative to the other four quintiles. This scenario calls for a targeted approach, whereby resources are directed at the most disadvantaged.
• Anincremental linear (or queuing) pattern is apparent in the orange line. A linear gradient indicates equal increases across quintiles, moving from the poorest to the richest. This pattern requires an approach that combines population-wide and targeted interventions.
• Amass deprivation pattern – also called bottom inequality – is indicated by the purple line. Health service coverage is low or very low in all but the richest quintile. Interventions to address mass deprivation should target the whole population, investing resources in all (or most) subgroups.
APPENDICES
85
FIGURE A7.1 Patterns of inequality in health intervention coverage by economic status
n Complete coverage shows a need for continued monitoringn Marginal exclusion requires action targeted to the underserved n Anincrementallinearpatternrequiresacombineduniversalandtargetedapproachn Mass deprivation requires universal action oriented to the whole population
Cove
rage
(%)
Quintile1(poorest)
Quintile 2 Quintile 3 Quintile 4 Quintile5(richest)
100
80
60
40
20
0
The patterns of inequality and their corresponding policy responses are intended to be a general guide for consideration in policy-making. In isolation, this interpretation of data does not constitute evidence for a definitive course of action. Other considerations, such as context-specific factors and national priorities, help to inform decisions about where resources in a country should be focused.
References1. Handbook on health inequality monitoring with a special focus on low- and middle-income countries. Geneva:
World Health Organization; 2013 (http://apps.who.int/iris/bitstream/10665/85345/1/9789241548632_eng.pdf?ua=1, accessed 11 March 2015).
2. Victora CG, Fenn B, Bryce J, Kirkwood BR. Co-coverage of preventive interventions and implications for child-survival strategies: evidence from national surveys. Lancet. 2005;366(9495):1460–6.
VIDEO CLIP 4. HEALTH INEQUALITIES INFORM POLICIES, PROGRAMMES AND PRACTICES
Watch this short video clip to explore the question: which countries demonstrate characteristic patterns of inequality in births attended by skilled health personnel, disaggregated by economic status?
AVAILABLE ON CD/USB SCAN HERE
I n t e r a c t I v e v I s u a l I z at I o n o f H e a lt H D at a
ISBN 978 92 4 156491 5
© copyright world health organization, 2015. for free distribution.
World HealtH organization20, avenue appia
CH-1211 geneva 27SWitzerland
state of InequalItyreproductive, maternal,
newborn and child health
http://www.who.int/gho/health_equity/report_2015/
www.who.int/gho/health_equity/videos/en/
STATE OF INEQUALITY: REPRODUCTIVE, MATERNAL, NEWBORN AND CHILD HEALTH
86

Supplementary tables
Indicator Definition*Affected population (denominator)
Time period reflected in indicator data
Reproductive health interventionsContraceptive prevalence – modern and traditional methods
Percentageofwomenaged15–49years,marriedor in union, who are currently using (or whose sexual partner is using) at least one method of contraception, regardless of the method used.
Womenaged15–49years who are married or in union
Current use at time of survey
Contraceptive prevalence – modern methods
Percentageofwomenaged15–49years,marriedor in union, who are currently using (or whose sexual partner is using) at least one modern method of contraception. Modern methods of contraception include female and male sterilization, oral hormonal pills, intrauterine device(IUD),malecondom,injectables,implant(including Norplant), vaginal barrier methods, the female condom and emergency contraception.
Womenaged15–49years who are married or in union
Current use at time of survey
Demand for family planning satisfied
Percentageofwomenaged15–49years,marriedor in union, who are currently using any method of contraception, among those in need of contraception. Women in need of contraception include those who are fecund but report wanting to space their next birth or stop child-bearing altogether.
Womenaged15–49years who are in need of contraception, are fecund and are married or in union
Current use at time of survey
Maternal health interventionsAntenatalcarecoverage– at least one visit
Percentageofwomenaged15–49yearswithalive birth within the period preceding the survey, attended at least once during pregnancy by skilled health personnel for reasons related to the pregnancy. Skilled health personnel include doctors, nurses, midwives and other medically-trained personnel, as defined according to each country.
Womenaged15–49years with a live birth within the period preceding the survey (only the last live birth was considered)
Three years preceding the survey for DHS, and two years preceding the survey for MICS
Antenatalcarecoverage– at least four visits
Percentageofwomenaged15–49yearswithalive birth within the period preceding the survey, attended at least four times during pregnancy by any provider (skilled or unskilled) for reasons related to the pregnancy.
Womenaged15–49years with a live birth within the period preceding the survey (only the last live birth was considered)
Three years preceding the survey for DHS, and two years preceding the survey for MICS
87
TABLE S1 Descriptions of reproductive, maternal, newborn and child health indicators

Indicator Definition*Affected population (denominator)
Time period reflected in indicator data
Births attended by skilled health personnel
Percentage of live births attended during delivery by skilled health personnel, within the period preceding the survey. Skilled health personnel include doctors, nurses, midwives and other medically-trained personnel, as defined according to each country.
Live births within the period preceding the survey
Three years preceding the survey for DHS, and two years preceding the survey for MICS
Newborn and child health interventionsEarly initiation of breastfeeding
Percentage of children who were put to the breast within one hour of birth.
Live births within the period preceding the survey
Three years preceding the survey for DHS, and two years preceding the survey for MICS
Children aged 6–59monthswhoreceivedvitaminAsupplementation
Percentageofchildrenaged6–59monthswhoreceivedahighdosevitaminAsupplementwithinthesixmonthspriortothesurvey.Ahigh-doseofvitaminAsupplement,accordingtotheInternationalVitaminAConsultativeGroupdefinition, refers to doses equal to or greater than 25 000IU.
Childrenaged6–59months
Six months preceding the survey
BCG immunization coverage among one-year-olds
Percentage of one-year-olds who have received one dose of BCG vaccine.
Childrenaged12–23months Note: some countries use a different reference age group of 15–26 or 18–29 months
Two years preceding the survey
Measles immunization coverage among one-year-olds
Percentage of one-year-olds who have received at least one dose of measles-containing vaccine.
Childrenaged12–23months Note: some countries use a different reference age group of 15–26 or 18–29 months
Two years preceding the survey
Polio immunization coverage among one-year-olds
Percentage of one-year-olds who have received three doses of polio vaccine.
Childrenaged12–23months Note: some countries use a different reference age group of 15–26 or 18–29 months
Two years preceding the survey
DTP3 immunization coverage among one-year-olds
Percentage of one-year-olds who have received three doses of DTP3 vaccine.
Childrenaged12–23months Note: some countries use a different reference age group of 15–26 or 18–29 months
Two years preceding the survey
Full immunization coverage among one-year-olds
Percentage of one-year-olds who have received one dose of BCG vaccine, three doses of polio vaccine, three doses of DTP3 vaccine, and one dose of measles vaccine.
Childrenaged12–23months Note: some countries use a different reference age group of 15–26 or 18–29 months
Two years preceding the survey
STATE OF INEQUALITY: REPRODUCTIVE, MATERNAL, NEWBORN AND CHILD HEALTH
88

Indicator Definition*Affected population (denominator)
Time period reflected in indicator data
Children aged less than five years with diarrhoea receiving oral rehydration salts
Percentageofchildrenaged0–59monthswhohad diarrhoea in the two weeks prior to the survey and received oral rehydration salts.
Childrenaged0–59months who had diarrhoea in the two weeks prior to the survey
Two weeks preceding the survey
Children aged less than five years with diarrhoea receiving oral rehydration therapy and continued feeding
Percentageofchildrenaged0–59monthswhohad diarrhoea in the two weeks prior to the survey and were treated with oral rehydration therapy – oral rehydration salts or an appropriate household solution – and continued feeding.
Childrenaged0–59months who had diarrhoea in the two weeks prior to the survey
Two weeks preceding the survey
Children aged less than five years with pneumonia symptoms taken to a health facility
Percentageofchildrenaged0–59monthswithpneumonia symptoms in the two weeks prior to the survey who were taken to an appropriate health provider.
Children aged 0–59monthswithpneumonia symptoms in the two weeks prior to the survey
Two weeks preceding the survey
RMNCH interventions, combinedComposite coverage index
The composite coverage index is a weighted score reflectingcoverageofeightRMNCHinterventionsalong the continuum of care: demand for family planning satisfied; antenatal care coverage (at least one visit); births attended by skilled health personnel; BCG immunization coverage among one-year-olds; measles immunization coverage among one-year-olds; DTP3 immunization coverage among one-year-olds; children aged less than five years with diarrhoea receiving oral rehydration therapy and continued feeding; and children aged less than five years with pneumonia symptoms taken to a health facility.
This indicator is based on aggregate estimates
Not applicable
Child malnutritionStunting prevalence in children aged less than five years
Percentageofchildrenaged0–59monthswhoare stunted (defined as more than two standard deviations below the median height-for-age of the WHO Child Growth Standards).
Childrenaged0–59months
Current status at time of survey
Underweightprevalence in children aged less than five years
Percentageofchildrenaged0–59monthswhoare underweight (defined as more than two standard deviations below the median weight-for-age of the WHO Child Growth Standards).
Childrenaged0–59months
Current status at time of survey
Wasting prevalence in children aged less than five years
Percentageofchildren0–59monthswhoarewasted (defined as more than two standard deviations below the median weight-for-height of the WHO Child Growth Standards).
Childrenaged0–59months
Current status at time of survey
SUPPLEMENTARY TABLES
89

Indicator Definition*Affected population (denominator)
Time period reflected in indicator data
Child mortalityNeonatal mortality rate Probability(expressedasarateper1000live
births) of a child born in a specific year or period dying in the first 30 days of life,** if subject to age-specific mortality rates of that period.
Number of surviving children at beginning of specified age range during the specified time period
10yearsprecedingthesurvey
Infant mortality rate Probability(expressedasarateper1000livebirths) of a child born in a specific year or period dying before reaching the age of one year, if subject to age-specific mortality rates of that period.
Number of surviving children at beginning of specified age range during the specified time period
10yearsprecedingthesurvey
Under-fivemortalityrate
Probability(expressedasarateper1000livebirths) of a child born in a specific year or period dying before reaching the age of five years, if subject to age-specific mortality rates of that period.
Number of surviving children at beginning of specified age range during the specified time period
10yearsprecedingthesurvey
BCG: one dose of Bacille Calmette-Guérin vaccine; DHS: Demographic and Health Survey; DTP3: three doses of the combined diphtheria, tetanus toxoid andpertussisvaccine;IU:internationalunit;MICS:MultipleIndicatorClusterSurvey;RMNCH:reproductive,maternal,newbornandchildhealth.* Detailed information about the criteria used to calculate the numerator and denominator values for each indicator is available from the WHO Indicator andMeasurementRegistry,underthetopic“HealthEquityMonitor”(www.who.int/gho/indicator_registry/en/,accessed11March2015).** Standard DHS calculations (as applied in this report) specify the first 30 days of life; however, other accepted definitions may specify the first 28 days.
STATE OF INEQUALITY: REPRODUCTIVE, MATERNAL, NEWBORN AND CHILD HEALTH
90

Country Survey source(s) and year(s) WHO RegionCountry income group*
Afghanistan MICS2010–2011 Eastern Mediterranean Low-incomeAlbania DHS 2008–2009 European Middle-incomeArmenia** DHS2010,DHS2000 European Middle-incomeAzerbaijan DHS 2006 European Middle-incomeBangladesh** DHS2011,DHS1999–2000 South-EastAsia Low-incomeBelarus MICS2012 European Middle-incomeBelize MICS2011 Americas Middle-incomeBenin** DHS2011–2012,DHS2001 African Low-incomeBhutan MICS2010 South-EastAsia Middle-incomeBolivia (Plurinational State of)** DHS2008,DHS1998 Americas Middle-incomeBosnia and Herzegovina MICS2011–2012 European Middle-incomeBurkina Faso** DHS2010,DHS1998–1999 African Low-incomeBurundi DHS2010 African Low-incomeCambodia** DHS2010,DHS2000 Western Pacific Low-incomeCameroon** DHS2011,DHS2004 African Middle-incomeCentralAfricanRepublic MICS2010 African Low-incomeColombia** DHS2010,DHS2000 Americas Middle-incomeComoros DHS2012 African Low-incomeCongo DHS2011–2012 African Middle-incomeCosta Rica MICS2011 Americas Middle-incomeCôte d'Ivoire** DHS2011–2012,DHS1998–1999 African Middle-incomeCuba MICS2010–2011 Americas Middle-incomeDemocratic Republic of the Congo DHS2013–2014 African Low-incomeDjibouti MICS 2006 Eastern Mediterranean Middle-incomeDominican Republic** DHS2007,DHS1996 Americas Middle-incomeEgypt** DHS 2008, DHS 2000 Eastern Mediterranean Middle-incomeEthiopia** DHS2011,DHS2000 African Low-incomeGabon** DHS2012,DHS2000 African Middle-incomeGambia MICS2005–2006 African Low-incomeGeorgia MICS2005 European Middle-incomeGhana** MICS2011,DHS2003 African Middle-incomeGuinea** DHS2012,DHS1999 African Low-incomeGuinea-Bissau MICS 2006 African Low-incomeGuyana DHS 2009 Americas Middle-incomeHaiti** DHS2012,DHS2000 Americas Low-incomeHonduras DHS2011–2012 Americas Middle-incomeIndia** DHS2005–2006,DHS1998–1999 South-EastAsia Middle-income
TABLE S2 Study countries: survey source(s) and year(s), WHO region and country income group
SUPPLEMENTARY TABLES
91

Country Survey source(s) and year(s) WHO RegionCountry income group*
Indonesia** DHS2012,DHS2002–2003 South-EastAsia Middle-incomeIraq MICS2011 Eastern Mediterranean Middle-incomeJamaica MICS2005 Americas Middle-incomeJordan** DHS2012,DHS2002 Eastern Mediterranean Middle-incomeKazakhstan** MICS2010–2011,DHS1999 European Middle-incomeKenya** DHS2008–2009,DHS1998 African Low-incomeKyrgyzstan** DHS2012,DHS1997 European Middle-incomeLao People's Democratic Republic MICS2011–2012 Western Pacific Middle-incomeLesotho** DHS 2009, DHS 2004 African Middle-incomeLiberia DHS2013 African Low-incomeMadagascar** DHS2008–2009,DHS1997 African Low-incomeMalawi** DHS2010,DHS2000 African Low-incomeMaldives DHS 2009 South-EastAsia Middle-incomeMali** DHS2012–2013,DHS2001 African Low-incomeMauritania MICS 2007 African Middle-incomeMongolia MICS2010 Western Pacific Middle-incomeMontenegro MICS2005–2006 European Middle-incomeMozambique** DHS2011,DHS2003 African Low-incomeNamibia** DHS 2006–2007, DHS 2000 African Middle-incomeNepal** DHS2011,DHS2001 South-EastAsia Low-incomeNiger** DHS2012,DHS1998 African Low-incomeNigeria** DHS2013,DHS2003 African Middle-incomePakistan DHS2012–2013 Eastern Mediterranean Middle-incomePeru** DHS2012,DHS2000 Americas Middle-incomePhilippines** DHS2013,DHS2003 Western Pacific Middle-incomeRepublic of Moldova DHS2005 European Middle-incomeRwanda** DHS2010,DHS2000 African Low-incomeSao Tome and Principe DHS 2008–2009 African Middle-incomeSenegal** DHS2012–2013,DHS1997 African Middle-incomeSerbia MICS2010 European Middle-incomeSierra Leone DHS2013 African Low-incomeSomalia MICS 2006 Eastern Mediterranean Low-incomeSuriname MICS2010 Americas Middle-incomeSwaziland MICS2010 African Middle-incomeSyrianArabRepublic MICS 2006 Eastern Mediterranean Middle-incomeTajikistan DHS2012 European Low-incomeThailand MICS2005–2006 South-EastAsia Middle-incomeThe former Yugoslav Republic of Macedonia MICS2011 European Middle-income
STATE OF INEQUALITY: REPRODUCTIVE, MATERNAL, NEWBORN AND CHILD HEALTH
92

Country Survey source(s) and year(s) WHO RegionCountry income group*
Timor-Leste DHS2009–2010 South-EastAsia Middle-incomeTogo** MICS2010,DHS1998 African Low-incomeUganda** DHS2011,DHS2000 African Low-incomeUkraine DHS 2007 European Middle-incomeUnitedRepublicofTanzania** DHS2010,DHS1999 African Low-incomeUzbekistan** MICS2006,DHS1996 European Middle-incomeVanuatu MICS 2007 Western Pacific Middle-incomeViet Nam** MICS2010–2011,DHS2002 Western Pacific Middle-incomeYemen MICS 2006 Eastern Mediterranean Middle-incomeZambia** DHS2007,DHS1996 African Middle-incomeZimbabwe** DHS2010–2011,DHS1999 African Low-income
DHS: Demographic and Health Survey; MICS: Multiple Indicator Cluster Survey.*CountryincomegroupwasdeterminedusingtheWorldBankclassificationasofJuly2014(availablefrom:http://data.worldbank.org/about/country-and-lending-groups#OECD_members,accessed11March2015).**Atleastonesurveywasalsoconductedduringtheperiod1995–2004andthecountrywasconsideredforinclusioninchange-over-timeanalyses.
SUPPLEMENTARY TABLES
93

TABLE S3 Summary estimates* for reproductive, maternal, newborn and child health indicators: national average and absolute inequalitybyfourdimensionsofinequality(DHSandMICS2005–2013)
National average Economic status (difference)
richest quintile – poorest quintile
(or vice versa for child malnutrition and child mortality indicators)
Education** (difference)
secondary school or higher – no education(or vice versa for child malnutrition and child mortality indicators)
Place of residence (difference)urban – rural
(or vice versa for child malnutrition and child mortality indicators)
Sex (difference)
females – males(or vice versa for child malnutrition and child mortality indicators)
IndicatorCategory Indicator Med
ian
Mini
mum
Max
imum
Num
ber o
f cou
ntrie
s
Med
ian
Mini
mum
Max
imum
Num
ber o
f cou
ntrie
s
Med
ian
Mini
mum
Max
imum
Num
ber o
f cou
ntrie
s
Med
ian
Mini
mum
Max
imum
Num
ber o
f cou
ntrie
s
Med
ian
Mini
mum
Max
imum
Num
ber o
f cou
ntrie
s
Reproductive health interventions
Contraceptive prevalence – modern and traditional methods 43.6 5.6 79.0 84 13.2 -11.9 39.2 82 16.6 -15.7 45.7 71 6.2 -10.9 29.1 84 Contraceptive prevalence – modern and traditional methods
Contraceptive prevalence – modern methods 30.2 1.2 75.1 84 13.0 -12.6 38.8 82 14.4 -16.4 40.1 71 6.7 -12.0 27.0 84 Contraceptive prevalence – modern methods
Demand for family planning satisfied 60.6 19.7 92.2 61 15.9 -11.1 63.8 60 16.6 -16.4 51.1 54 8.9 -13.4 32.4 61 Demand for family planning satisfied
Maternal health interventions
Antenatalcarecoverage–atleastonevisit 93.2 26.1 99.6 85 10.5 -4.2 68.9 83 16.1 -0.9 63.1 69 4.6 -3.0 48.9 85 Antenatalcarecoverage–atleastonevisit
Antenatalcarecoverage–atleastfourvisits 63.6 14.7 99.7 72 25.1 -6.4 73.5 72 26.8 -1.2 59.9 60 12.8 -6.5 43.4 72 Antenatalcarecoverage–atleastfourvisits
Births attended by skilled health personnel 77.1 11.8 100.0 85 36.6 0.0 80.2 83 36.0 1.5 69.1 69 20.4 -0.4 61.2 85 Births attended by skilled health personnel
Newborn and child health interventions
Early initiation of breastfeeding 52.6 7.6 96.0 86 -0.4 -33.9 22.9 83 0.2 -27.6 21.0 69 -0.4 -18.0 20.5 86 0.9 -6.4 5.3 54 Early initiation of breastfeeding
Childrenaged6–59monthswhoreceivedvitaminAsupplementation 59.6 2.9 92.9 65 6.8 -30.6 46.3 64 9.2 -17.8 37.0 63 2.5 -29.3 18.6 65 -0.1 -3.5 5.7 65 Childrenaged6–59monthswhoreceivedvitaminAsupplementation
BCG immunization coverage among one-year-olds 94.1 29.7 100.0 81 7.8 -12.8 78.3 78 9.7 -0.5 66.2 62 2.8 -9.2 39.2 81 -0.2 -12.8 6.5 81 BCG immunization coverage among one-year-olds
Measles immunization coverage among one-year-olds 81.1 28.8 98.3 81 12.7 -11.7 64.7 78 17.7 -3.2 54.4 62 4.2 -7.0 30.8 81 0.0 -9.8 6.5 81 Measles immunization coverage among one-year-olds
Polio immunization coverage among one-year-olds 77.4 35.9 98.5 80 8.8 -19.8 37.3 77 10.2 -7.1 53.5 62 2.2 -15.6 25.6 80 -0.3 -11.6 10.3 80 Polio immunization coverage among one-year-olds
DTP3 immunization coverage among one-year-olds 78.5 14.1 98.4 81 13.1 -19.3 72.3 78 14.6 -10.4 61.7 62 3.4 -12.9 37.3 81 -0.7 -10.7 8.3 81 DTP3 immunization coverage among one-year-olds
Full immunization coverage among one-year-olds 65.9 11.6 95.1 79 11.4 -21.9 54.1 76 15.1 -9.2 49.1 61 3.3 -17.1 27.6 79 0.2 -11.4 10.3 79 Full immunization coverage among one-year-olds
Children aged less than five years with diarrhoea receiving oral rehydration salts 39.8 11.3 85.1 83 8.9 -17.3 34.3 66 4.5 -25.1 41.7 58 5.4 -43.6 28.3 81 -0.6 -24.1 15.1 83 Children aged less than five years with diarrhoea receiving oral rehydration
salts
Children aged less than five years with diarrhoea receiving oral rehydration therapy and continued feeding 47.6 6.8 77.1 83 8.4 -9.7 30.8 66 6.3 -9.8 31.6 58 4.2 -24.8 39.4 81 -1.0 -22.6 25.7 83 Children aged less than five years with diarrhoea receiving oral rehydration
therapy and continued feeding
Children aged less than five years with pneumonia symptoms taken to a health facility 63.8 13.0 96.5 80 18.2 -21.8 63.2 53 14.0 1.9 37.3 46 9.8 -14.3 40.1 72 0.2 -14.9 17.0 80 Children aged less than five years with pneumonia symptoms taken to a
health facility
RMNCH interventions, combined Composite coverage index 68.8 37.4 89.7 62 20.0 3.1 60.9 48 17.6 7.3 46.1 45 10.8 -4.8 31.1 62 Composite coverage index
Child malnutrition Stunting prevalence in children aged less than five years 29.6 4.9 57.9 78 17.7 -0.8 40.9 77 14.8 -3.7 38.6 66 8.2 -2.8 22.1 78 3.1 -3.5 10.7 78 Stunting prevalence in children aged less than five years
Underweightprevalenceinchildrenagedlessthanfiveyears 13.2 1.3 44.2 77 10.1 -3.1 37.0 76 9.0 -0.8 26.4 65 4.9 -1.2 17.7 77 1.5 -4.1 5.9 77 Underweightprevalenceinchildrenagedlessthanfiveyears
Wasting prevalence in children aged less than five years 6.0 0.7 25.4 77 2.2 -5.5 12.4 76 2.2 -2.6 12.3 65 0.7 -3.7 16.8 77 0.9 -1.5 4.0 77 Wasting prevalence in children aged less than five years
Child mortality Neonatal mortality rate 29.0 9.4 57.6 54 6.1 -17.9 33.1 54 9.3 -10.2 45.2 43 2.9 -11.9 23.6 54 6.7 -0.7 23.4 54 Neonatal mortality rate
Infant mortality rate 53.9 16.4 109.8 54 17.7 -19.1 62.4 54 20.7 -7.4 70.9 43 7.9 -15.5 41.7 54 8.5 -3.3 33.0 54 Infant mortality rate
Under-fivemortalityrate 76.6 18.7 174.7 54 36.5 -11.7 115.2 54 40.3 -3.1 98.6 43 15.5 -11.7 79.4 54 10.5 -6.3 35.7 54 Under-fivemortalityrate
BCG: one dose of Bacille Calmette-Guérin vaccine; DHS: Demographic and Health Survey; DTP3: three doses of the combined diphtheria, tetanus toxoid and pertussis vaccine; MICS: Multiple Indicator Cluster Survey; RMNCH: reproductive, maternal, newborn and child health.*Nationalaverageestimatesareexpressedaspercentagesor,inthecaseofthechildmortalityindicators,asdeathsper1000livebirths.Differenceestimatesareexpressedaspercentagepointsor,inthecaseofthechildmortalityindicators,asdeathsper1000livebirths.**Forreproductiveandmaternalhealthinterventions,educationreferstothewoman’seducation.Fornewbornandchildhealthindicators,educationreferstothemother’seducation.
STATE OF INEQUALITY: REPRODUCTIVE, MATERNAL, NEWBORN AND CHILD HEALTH
94

National average Economic status (difference)
richest quintile – poorest quintile
(or vice versa for child malnutrition and child mortality indicators)
Education** (difference)
secondary school or higher – no education(or vice versa for child malnutrition and child mortality indicators)
Place of residence (difference)urban – rural
(or vice versa for child malnutrition and child mortality indicators)
Sex (difference)
females – males(or vice versa for child malnutrition and child mortality indicators)
IndicatorCategory Indicator Med
ian
Mini
mum
Max
imum
Num
ber o
f cou
ntrie
s
Med
ian
Mini
mum
Max
imum
Num
ber o
f cou
ntrie
s
Med
ian
Mini
mum
Max
imum
Num
ber o
f cou
ntrie
s
Med
ian
Mini
mum
Max
imum
Num
ber o
f cou
ntrie
s
Med
ian
Mini
mum
Max
imum
Num
ber o
f cou
ntrie
s
Reproductive health interventions
Contraceptive prevalence – modern and traditional methods 43.6 5.6 79.0 84 13.2 -11.9 39.2 82 16.6 -15.7 45.7 71 6.2 -10.9 29.1 84 Contraceptive prevalence – modern and traditional methods
Contraceptive prevalence – modern methods 30.2 1.2 75.1 84 13.0 -12.6 38.8 82 14.4 -16.4 40.1 71 6.7 -12.0 27.0 84 Contraceptive prevalence – modern methods
Demand for family planning satisfied 60.6 19.7 92.2 61 15.9 -11.1 63.8 60 16.6 -16.4 51.1 54 8.9 -13.4 32.4 61 Demand for family planning satisfied
Maternal health interventions
Antenatalcarecoverage–atleastonevisit 93.2 26.1 99.6 85 10.5 -4.2 68.9 83 16.1 -0.9 63.1 69 4.6 -3.0 48.9 85 Antenatalcarecoverage–atleastonevisit
Antenatalcarecoverage–atleastfourvisits 63.6 14.7 99.7 72 25.1 -6.4 73.5 72 26.8 -1.2 59.9 60 12.8 -6.5 43.4 72 Antenatalcarecoverage–atleastfourvisits
Births attended by skilled health personnel 77.1 11.8 100.0 85 36.6 0.0 80.2 83 36.0 1.5 69.1 69 20.4 -0.4 61.2 85 Births attended by skilled health personnel
Newborn and child health interventions
Early initiation of breastfeeding 52.6 7.6 96.0 86 -0.4 -33.9 22.9 83 0.2 -27.6 21.0 69 -0.4 -18.0 20.5 86 0.9 -6.4 5.3 54 Early initiation of breastfeeding
Childrenaged6–59monthswhoreceivedvitaminAsupplementation 59.6 2.9 92.9 65 6.8 -30.6 46.3 64 9.2 -17.8 37.0 63 2.5 -29.3 18.6 65 -0.1 -3.5 5.7 65 Childrenaged6–59monthswhoreceivedvitaminAsupplementation
BCG immunization coverage among one-year-olds 94.1 29.7 100.0 81 7.8 -12.8 78.3 78 9.7 -0.5 66.2 62 2.8 -9.2 39.2 81 -0.2 -12.8 6.5 81 BCG immunization coverage among one-year-olds
Measles immunization coverage among one-year-olds 81.1 28.8 98.3 81 12.7 -11.7 64.7 78 17.7 -3.2 54.4 62 4.2 -7.0 30.8 81 0.0 -9.8 6.5 81 Measles immunization coverage among one-year-olds
Polio immunization coverage among one-year-olds 77.4 35.9 98.5 80 8.8 -19.8 37.3 77 10.2 -7.1 53.5 62 2.2 -15.6 25.6 80 -0.3 -11.6 10.3 80 Polio immunization coverage among one-year-olds
DTP3 immunization coverage among one-year-olds 78.5 14.1 98.4 81 13.1 -19.3 72.3 78 14.6 -10.4 61.7 62 3.4 -12.9 37.3 81 -0.7 -10.7 8.3 81 DTP3 immunization coverage among one-year-olds
Full immunization coverage among one-year-olds 65.9 11.6 95.1 79 11.4 -21.9 54.1 76 15.1 -9.2 49.1 61 3.3 -17.1 27.6 79 0.2 -11.4 10.3 79 Full immunization coverage among one-year-olds
Children aged less than five years with diarrhoea receiving oral rehydration salts 39.8 11.3 85.1 83 8.9 -17.3 34.3 66 4.5 -25.1 41.7 58 5.4 -43.6 28.3 81 -0.6 -24.1 15.1 83 Children aged less than five years with diarrhoea receiving oral rehydration
salts
Children aged less than five years with diarrhoea receiving oral rehydration therapy and continued feeding 47.6 6.8 77.1 83 8.4 -9.7 30.8 66 6.3 -9.8 31.6 58 4.2 -24.8 39.4 81 -1.0 -22.6 25.7 83 Children aged less than five years with diarrhoea receiving oral rehydration
therapy and continued feeding
Children aged less than five years with pneumonia symptoms taken to a health facility 63.8 13.0 96.5 80 18.2 -21.8 63.2 53 14.0 1.9 37.3 46 9.8 -14.3 40.1 72 0.2 -14.9 17.0 80 Children aged less than five years with pneumonia symptoms taken to a
health facility
RMNCH interventions, combined Composite coverage index 68.8 37.4 89.7 62 20.0 3.1 60.9 48 17.6 7.3 46.1 45 10.8 -4.8 31.1 62 Composite coverage index
Child malnutrition Stunting prevalence in children aged less than five years 29.6 4.9 57.9 78 17.7 -0.8 40.9 77 14.8 -3.7 38.6 66 8.2 -2.8 22.1 78 3.1 -3.5 10.7 78 Stunting prevalence in children aged less than five years
Underweightprevalenceinchildrenagedlessthanfiveyears 13.2 1.3 44.2 77 10.1 -3.1 37.0 76 9.0 -0.8 26.4 65 4.9 -1.2 17.7 77 1.5 -4.1 5.9 77 Underweightprevalenceinchildrenagedlessthanfiveyears
Wasting prevalence in children aged less than five years 6.0 0.7 25.4 77 2.2 -5.5 12.4 76 2.2 -2.6 12.3 65 0.7 -3.7 16.8 77 0.9 -1.5 4.0 77 Wasting prevalence in children aged less than five years
Child mortality Neonatal mortality rate 29.0 9.4 57.6 54 6.1 -17.9 33.1 54 9.3 -10.2 45.2 43 2.9 -11.9 23.6 54 6.7 -0.7 23.4 54 Neonatal mortality rate
Infant mortality rate 53.9 16.4 109.8 54 17.7 -19.1 62.4 54 20.7 -7.4 70.9 43 7.9 -15.5 41.7 54 8.5 -3.3 33.0 54 Infant mortality rate
Under-fivemortalityrate 76.6 18.7 174.7 54 36.5 -11.7 115.2 54 40.3 -3.1 98.6 43 15.5 -11.7 79.4 54 10.5 -6.3 35.7 54 Under-fivemortalityrate
SUPPLEMENTARY TABLES
95

TABLE S4 Summary estimates for reproductive, maternal, newborn and child health indicators: relative inequality by four dimensions ofinequality(DHSandMICS2005–2013)
BCG: one dose of Bacille Calmette-Guérin vaccine; DHS: Demographic and Health Survey; DTP3: three doses of the combined diphtheria, tetanus toxoid and pertussis vaccine; MICS: Multiple Indicator Cluster Survey; RMNCH: reproductive, maternal, newborn and child health.*Forreproductiveandmaternalhealthinterventions,educationreferstothewoman’seducation.Fornewbornandchildhealthindicators,educationreferstothemother’seducation.
Economic status (ratio)
richest quintile / poorest quintile
(or vice versa for child malnutrition and child mortality indicators)
Education* (ratio)
secondary school or higher / no education(or vice versa for child malnutrition and child mortality indicators)
Place of residence (ratio)
urban / rural (or vice versa for child malnutrition and child mortality indicators)
Sex (ratio)
females / males(or vice versa for child malnutrition and child mortality indicators)
IndicatorCategory Indicator Med
ian
Mini
mum
Max
imum
Num
ber o
f cou
ntrie
s
Med
ian
Mini
mum
Max
imum
Num
ber o
f cou
ntrie
s
Med
ian
Mini
mum
Max
imum
Num
ber o
f cou
ntrie
s
Med
ian
Mini
mum
Max
imum
Num
ber o
f cou
ntrie
s
Reproductive health interventions
Contraceptive prevalence – modern and traditional methods 1.5 0.8 22.1 82 1.7 0.6 11.6 71 1.2 0.8 3.9 84 Contraceptive prevalence – modern and traditional methods
Contraceptive prevalence – modern methods 1.7 0.8 31.8 82 1.9 0.5 12.6 71 1.3 0.7 17.3 84 Contraceptive prevalence – modern methods
Demand for family planning satisfied 1.4 0.8 6.6 60 1.4 0.7 4.4 54 1.2 0.8 2.8 61 Demand for family planning satisfied
Maternal health interventions
Antenatalcarecoverage–atleastonevisit 1.1 1.0 6.1 83 1.2 1.0 3.6 69 1.1 1.0 3.0 85 Antenatalcarecoverage–atleastonevisit
Antenatalcarecoverage–atleastfourvisits 1.5 0.9 9.1 72 1.6 1.0 11.6 60 1.2 0.9 3.3 72 Antenatalcarecoverage–atleastfourvisits
Births attended by skilled health personnel 1.6 1.0 17.7 83 1.8 1.0 13.4 69 1.3 1.0 10.9 85 Births attended by skilled health personnel
Newborn and child health interventions
Early initiation of breastfeeding 1.0 0.2 1.9 83 1.0 0.6 2.0 69 1.0 0.5 1.6 86 1.0 0.9 1.1 54 Early initiation of breastfeeding
Childrenaged6–59monthswhoreceivedvitaminAsupplementation 1.2 0.1 4.7 64 1.2 0.4 3.3 63 1.1 0.3 3.2 65 1.0 0.8 1.2 65 Childrenaged6–59monthswhoreceivedvitaminAsupplementation
BCG immunization coverage among one-year-olds 1.1 0.8 6.6 78 1.1 1.0 4.2 62 1.0 0.9 2.4 81 1.0 0.9 1.1 81 BCG immunization coverage among one-year-olds
Measles immunization coverage among one-year-olds 1.2 0.8 5.9 78 1.3 1.0 4.0 62 1.1 0.9 2.0 81 1.0 0.9 1.1 81 Measles immunization coverage among one-year-olds
Polio immunization coverage among one-year-olds 1.1 0.6 2.3 77 1.1 0.8 2.6 62 1.0 0.7 2.0 80 1.0 0.9 1.2 80 Polio immunization coverage among one-year-olds
DTP3 immunization coverage among one-year-olds 1.2 0.7 10.8 78 1.3 0.8 6.1 62 1.0 0.8 3.9 81 1.0 0.8 1.1 81 DTP3 immunization coverage among one-year-olds
Full immunization coverage among one-year-olds 1.2 0.4 15.4 76 1.3 0.7 7.1 61 1.1 0.6 3.8 79 1.0 0.7 1.2 79 Full immunization coverage among one-year-olds
Children aged less than five years with diarrhoea receiving oral rehydration salts 1.2 0.6 4.8 66 1.1 0.6 3.8 58 1.1 0.2 2.9 81 1.0 0.5 1.5 83 Children aged less than five years with diarrhoea receiving oral rehydration
salts
Children aged less than five years with diarrhoea receiving oral rehydration therapy and continued feeding 1.2 0.7 2.9 66 1.1 0.8 2.5 58 1.1 0.5 1.9 81 1.0 0.7 1.5 83 Children aged less than five years with diarrhoea receiving oral rehydration
therapy and continued feeding
Children aged less than five years with pneumonia symptoms taken to a health facility 1.4 0.7 6.0 53 1.3 1.0 2.4 46 1.2 0.7 3.1 72 1.0 0.7 1.6 80 Children aged less than five years with pneumonia symptoms taken to a
health facility
RMNCH interventions, combined Composite coverage index 1.3 1.0 5.2 48 1.3 1.1 3.2 45 1.2 0.9 2.0 62 Composite coverage index
Child malnutrition Stunting prevalence in children aged less than five years 2.2 1.0 11.1 77 1.6 0.9 4.9 66 1.4 0.7 3.1 78 1.1 0.8 1.5 78 Stunting prevalence in children aged less than five years
Underweightprevalenceinchildrenagedlessthanfiveyears 2.4 0.2 13.1 76 1.8 0.9 6.3 65 1.5 0.6 3.1 77 1.1 0.8 1.8 77 Underweightprevalenceinchildrenagedlessthanfiveyears
Wasting prevalence in children aged less than five years 1.5 0.4 6.7 76 1.4 0.3 4.0 65 1.1 0.5 2.9 77 1.2 0.5 2.6 77 Wasting prevalence in children aged less than five years
Child mortality Neonatal mortality rate 1.3 0.5 3.3 54 1.4 0.6 4.8 43 1.1 0.5 3.1 54 1.3 1.0 2.6 54 Neonatal mortality rate
Infant mortality rate 1.6 0.6 3.4 54 1.6 0.6 3.5 43 1.2 0.7 2.9 54 1.2 0.8 1.7 54 Infant mortality rate
Under-fivemortalityrate 1.8 0.7 3.7 54 1.7 0.8 3.9 43 1.3 0.8 2.6 54 1.1 0.9 1.7 54 Under-fivemortalityrate
STATE OF INEQUALITY: REPRODUCTIVE, MATERNAL, NEWBORN AND CHILD HEALTH
96

Economic status (ratio)
richest quintile / poorest quintile
(or vice versa for child malnutrition and child mortality indicators)
Education* (ratio)
secondary school or higher / no education(or vice versa for child malnutrition and child mortality indicators)
Place of residence (ratio)
urban / rural (or vice versa for child malnutrition and child mortality indicators)
Sex (ratio)
females / males(or vice versa for child malnutrition and child mortality indicators)
IndicatorCategory Indicator Med
ian
Mini
mum
Max
imum
Num
ber o
f cou
ntrie
s
Med
ian
Mini
mum
Max
imum
Num
ber o
f cou
ntrie
s
Med
ian
Mini
mum
Max
imum
Num
ber o
f cou
ntrie
s
Med
ian
Mini
mum
Max
imum
Num
ber o
f cou
ntrie
s
Reproductive health interventions
Contraceptive prevalence – modern and traditional methods 1.5 0.8 22.1 82 1.7 0.6 11.6 71 1.2 0.8 3.9 84 Contraceptive prevalence – modern and traditional methods
Contraceptive prevalence – modern methods 1.7 0.8 31.8 82 1.9 0.5 12.6 71 1.3 0.7 17.3 84 Contraceptive prevalence – modern methods
Demand for family planning satisfied 1.4 0.8 6.6 60 1.4 0.7 4.4 54 1.2 0.8 2.8 61 Demand for family planning satisfied
Maternal health interventions
Antenatalcarecoverage–atleastonevisit 1.1 1.0 6.1 83 1.2 1.0 3.6 69 1.1 1.0 3.0 85 Antenatalcarecoverage–atleastonevisit
Antenatalcarecoverage–atleastfourvisits 1.5 0.9 9.1 72 1.6 1.0 11.6 60 1.2 0.9 3.3 72 Antenatalcarecoverage–atleastfourvisits
Births attended by skilled health personnel 1.6 1.0 17.7 83 1.8 1.0 13.4 69 1.3 1.0 10.9 85 Births attended by skilled health personnel
Newborn and child health interventions
Early initiation of breastfeeding 1.0 0.2 1.9 83 1.0 0.6 2.0 69 1.0 0.5 1.6 86 1.0 0.9 1.1 54 Early initiation of breastfeeding
Childrenaged6–59monthswhoreceivedvitaminAsupplementation 1.2 0.1 4.7 64 1.2 0.4 3.3 63 1.1 0.3 3.2 65 1.0 0.8 1.2 65 Childrenaged6–59monthswhoreceivedvitaminAsupplementation
BCG immunization coverage among one-year-olds 1.1 0.8 6.6 78 1.1 1.0 4.2 62 1.0 0.9 2.4 81 1.0 0.9 1.1 81 BCG immunization coverage among one-year-olds
Measles immunization coverage among one-year-olds 1.2 0.8 5.9 78 1.3 1.0 4.0 62 1.1 0.9 2.0 81 1.0 0.9 1.1 81 Measles immunization coverage among one-year-olds
Polio immunization coverage among one-year-olds 1.1 0.6 2.3 77 1.1 0.8 2.6 62 1.0 0.7 2.0 80 1.0 0.9 1.2 80 Polio immunization coverage among one-year-olds
DTP3 immunization coverage among one-year-olds 1.2 0.7 10.8 78 1.3 0.8 6.1 62 1.0 0.8 3.9 81 1.0 0.8 1.1 81 DTP3 immunization coverage among one-year-olds
Full immunization coverage among one-year-olds 1.2 0.4 15.4 76 1.3 0.7 7.1 61 1.1 0.6 3.8 79 1.0 0.7 1.2 79 Full immunization coverage among one-year-olds
Children aged less than five years with diarrhoea receiving oral rehydration salts 1.2 0.6 4.8 66 1.1 0.6 3.8 58 1.1 0.2 2.9 81 1.0 0.5 1.5 83 Children aged less than five years with diarrhoea receiving oral rehydration
salts
Children aged less than five years with diarrhoea receiving oral rehydration therapy and continued feeding 1.2 0.7 2.9 66 1.1 0.8 2.5 58 1.1 0.5 1.9 81 1.0 0.7 1.5 83 Children aged less than five years with diarrhoea receiving oral rehydration
therapy and continued feeding
Children aged less than five years with pneumonia symptoms taken to a health facility 1.4 0.7 6.0 53 1.3 1.0 2.4 46 1.2 0.7 3.1 72 1.0 0.7 1.6 80 Children aged less than five years with pneumonia symptoms taken to a
health facility
RMNCH interventions, combined Composite coverage index 1.3 1.0 5.2 48 1.3 1.1 3.2 45 1.2 0.9 2.0 62 Composite coverage index
Child malnutrition Stunting prevalence in children aged less than five years 2.2 1.0 11.1 77 1.6 0.9 4.9 66 1.4 0.7 3.1 78 1.1 0.8 1.5 78 Stunting prevalence in children aged less than five years
Underweightprevalenceinchildrenagedlessthanfiveyears 2.4 0.2 13.1 76 1.8 0.9 6.3 65 1.5 0.6 3.1 77 1.1 0.8 1.8 77 Underweightprevalenceinchildrenagedlessthanfiveyears
Wasting prevalence in children aged less than five years 1.5 0.4 6.7 76 1.4 0.3 4.0 65 1.1 0.5 2.9 77 1.2 0.5 2.6 77 Wasting prevalence in children aged less than five years
Child mortality Neonatal mortality rate 1.3 0.5 3.3 54 1.4 0.6 4.8 43 1.1 0.5 3.1 54 1.3 1.0 2.6 54 Neonatal mortality rate
Infant mortality rate 1.6 0.6 3.4 54 1.6 0.6 3.5 43 1.2 0.7 2.9 54 1.2 0.8 1.7 54 Infant mortality rate
Under-fivemortalityrate 1.8 0.7 3.7 54 1.7 0.8 3.9 43 1.3 0.8 2.6 54 1.1 0.9 1.7 54 Under-fivemortalityrate
SUPPLEMENTARY TABLES
97

TABLE S5 Summary estimates* for reproductive, maternal, newborn and child health indicators: annual absolute change in national averageandannualabsoluteexcesschangeovertimebyfourdimensionsofinequality(DHSandMICS1995–2004and2005–2013)
BCG: one dose of Bacille Calmette-Guérin vaccine; DHS: Demographic and Health Survey; DTP3: three doses of the combined diphtheria, tetanus toxoid and pertussis vaccine; MICS: Multiple Indicator Cluster Survey; RMNCH: reproductive, maternal, newborn and child health.* Estimates of annual change in the national average and annual absolute excess change are expressed as percentage points per year, or in the case of the child mortalityinterventions,asdeathsper1000livebirthsperyear.**Forreproductiveandmaternalhealthinterventions,educationreferstothewoman’seducation.Fornewbornandchildhealthindicators,educationreferstothemother’seducation.
National average(annual absolute
change)
Economic status (annual absolute
excess change)annual change in the
poorest quintile – annual change in the richest
quintile
Education** (annual absolute
excess change)annual change in no education – annual change in secondary
school or higher
Place of residence (annual absolute
excess change)annual change in rural
areas – annual change in urban areas
Sex (annual absolute
excess change)annual change in males – annual change in females
IndicatorCategory Indicator Med
ian
Mini
mum
Max
imum
Num
ber o
f cou
ntrie
s
Med
ian
Mini
mum
Max
imum
Num
ber o
f cou
ntrie
s
Med
ian
Mini
mum
Max
imum
Num
ber o
f cou
ntrie
s
Med
ian
Mini
mum
Max
imum
Num
ber o
f cou
ntrie
s
Med
ian
Mini
mum
Max
imum
Num
ber o
f cou
ntrie
s
Reproductive health interventions
Contraceptive prevalence – modern and traditional methods 0.5 -1.7 3.8 42 0.5 -2.6 2.0 42 0.7 -1.2 3.1 38 0.3 -1.1 1.4 42 Contraceptive prevalence – modern and traditional methods
Contraceptive prevalence – modern methods 0.6 -1.2 4.1 42 0.3 -2.1 1.8 42 0.6 -1.0 2.6 38 0.2 -0.8 1.5 42 Contraceptive prevalence – modern methods
Demand for family planning satisfied 0.5 -2.9 4.7 38 0.5 -3.4 2.5 38 0.9 -1.4 6.7 35 0.3 -1.7 1.9 38 Demand for family planning satisfied
Maternal health interventions
Antenatalcarecoverage–atleastonevisit 0.6 -0.9 5.2 42 0.6 -1.6 4.0 42 0.7 -1.7 3.2 38 0.5 -1.6 3.2 42 Antenatalcarecoverage–atleastonevisit
Antenatalcarecoverage–atleastfourvisits 0.7 -2.6 5.3 41 0.2 -2.2 4.1 41 0.4 -3.4 3.0 38 0.4 -1.0 3.3 41 Antenatalcarecoverage–atleastfourvisits
Births attended by skilled health personnel 1.0 -0.7 4.7 42 0.3 -3.5 3.3 42 0.5 -2.2 4.5 38 0.4 -1.6 3.4 42 Births attended by skilled health personnel
Newborn and child health interventions
Early initiation of breastfeeding 0.9 -2.8 5.5 41 0.1 -2.1 3.9 41 0.2 -2.6 3.8 37 0.1 -1.2 2.1 41 0.0 -0.4 1.2 36 Early initiation of breastfeeding
Childrenaged6–59monthswhoreceivedvitaminAsupplementation 1.2 -4.7 4.0 18 0.3 -1.8 4.1 18 0.7 -1.3 3.7 18 0.4 -1.8 1.9 18 -0.1 -1.2 0.4 18 Childrenaged6–59monthswhoreceivedvitaminAsupplementation
BCG immunization coverage among one-year-olds 0.5 -0.5 6.9 41 0.7 -1.8 3.0 41 0.9 -0.5 2.2 35 0.4 -0.7 2.8 41 0.0 -0.9 0.9 41 BCG immunization coverage among one-year-olds
Measles immunization coverage among one-year-olds 0.9 -0.9 3.5 41 0.5 -4.2 4.1 41 0.5 -3.3 2.1 35 0.5 -1.0 2.4 41 -0.1 -1.2 0.6 41 Measles immunization coverage among one-year-olds
Polio immunization coverage among one-year-olds 0.6 -1.3 4.6 41 0.9 -2.0 3.2 41 0.5 -1.8 4.2 35 0.7 -0.5 3.2 41 0.1 -0.7 0.7 41 Polio immunization coverage among one-year-olds
DTP3 immunization coverage among one-year-olds 0.7 -0.7 4.0 41 0.9 -2.5 3.2 41 0.5 -2.0 3.5 35 0.4 -1.2 2.8 41 0.0 -0.9 0.7 41 DTP3 immunization coverage among one-year-olds
Full immunization coverage among one-year-olds 1.0 -1.1 6.5 41 0.6 -3.4 3.4 41 0.2 -2.3 4.2 35 0.5 -2.3 2.7 41 0.0 -1.1 0.9 41 Full immunization coverage among one-year-olds
Children aged less than five years with diarrhoea receiving oral rehydration salts 0.7 -1.0 3.8 41 0.1 -2.2 5.3 36 0.5 -2.8 2.1 34 0.1 -1.6 1.8 40 0.0 -2.8 3.0 41 Children aged less than five years with diarrhoea receiving oral rehydration
salts
Children aged less than five years with diarrhoea receiving oral rehydration therapy and continued feeding 0.6 -3.1 4.3 40 0.3 -1.7 4.3 35 0.4 -3.1 1.7 32 0.2 -2.0 1.7 39 0.2 -3.3 3.8 40 Children aged less than five years with diarrhoea receiving oral rehydration
therapy and continued feeding
Children aged less than five years with pneumonia symptoms taken to a health facility 0.9 -1.6 4.4 35 0.7 -2.6 2.3 26 0.5 -2.1 2.4 21 0.5 -2.1 2.7 33 0.0 -3.0 2.0 35 Children aged less than five years with pneumonia symptoms taken to a
health facility
RMNCH interventions, combined Composite coverage index 0.7 -0.7 3.1 34 0.6 -1.3 2.2 28 0.7 -0.8 1.8 25 0.4 -1.0 1.4 34 Composite coverage index
Child malnutrition Stunting prevalence in children aged less than five years -0.5 -1.7 0.9 31 -0.2 -1.7 1.0 31 -0.3 -1.7 1.0 29 -0.1 -1.0 1.8 31 0.0 -0.4 0.5 31 Stunting prevalence in children aged less than five years
Underweightprevalenceinchildrenagedlessthanfiveyears -0.2 -1.4 0.4 31 -0.2 -1.0 0.9 31 -0.3 -2.7 0.8 29 -0.2 -0.9 0.6 31 0.0 -0.3 0.6 31 Underweightprevalenceinchildrenagedlessthanfiveyears
Wasting prevalence in children aged less than five years 0.0 -0.5 0.7 31 0.1 -0.7 0.6 31 -0.1 -0.4 0.5 29 -0.1 -0.3 0.3 31 0.0 -0.5 0.3 31 Wasting prevalence in children aged less than five years
Child mortality Neonatal mortality rate -0.8 -2.9 0.6 37 -0.6 -3.7 1.5 37 -0.9 -2.6 0.8 31 -0.6 -3.4 1.0 37 -0.1 -1.4 2.9 37 Neonatal mortality rate
Infant mortality rate -2.4 -6.6 1.5 37 -1.5 -6.6 3.0 37 -2.2 -7.8 0.5 31 -1.4 -4.6 1.9 37 0.0 -1.7 4.6 37 Infant mortality rate
Under-fivemortalityrate -4.4 -12.2 1.4 37 -2.6 -8.3 5.1 37 -3.6 -10.7 1.6 31 -1.9 -5.3 1.4 37 0.3 -1.8 4.3 37 Under-fivemortalityrate
STATE OF INEQUALITY: REPRODUCTIVE, MATERNAL, NEWBORN AND CHILD HEALTH
98
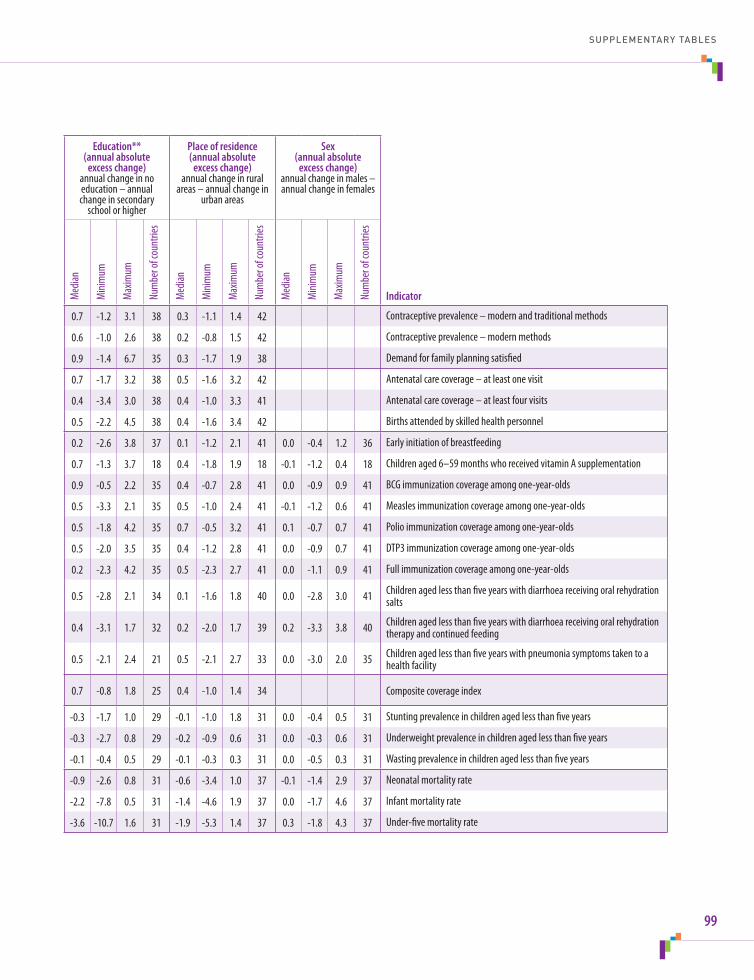
National average(annual absolute
change)
Economic status (annual absolute
excess change)annual change in the
poorest quintile – annual change in the richest
quintile
Education** (annual absolute
excess change)annual change in no education – annual change in secondary
school or higher
Place of residence (annual absolute
excess change)annual change in rural
areas – annual change in urban areas
Sex (annual absolute
excess change)annual change in males – annual change in females
IndicatorCategory Indicator Med
ian
Mini
mum
Max
imum
Num
ber o
f cou
ntrie
s
Med
ian
Mini
mum
Max
imum
Num
ber o
f cou
ntrie
s
Med
ian
Mini
mum
Max
imum
Num
ber o
f cou
ntrie
s
Med
ian
Mini
mum
Max
imum
Num
ber o
f cou
ntrie
s
Med
ian
Mini
mum
Max
imum
Num
ber o
f cou
ntrie
s
Reproductive health interventions
Contraceptive prevalence – modern and traditional methods 0.5 -1.7 3.8 42 0.5 -2.6 2.0 42 0.7 -1.2 3.1 38 0.3 -1.1 1.4 42 Contraceptive prevalence – modern and traditional methods
Contraceptive prevalence – modern methods 0.6 -1.2 4.1 42 0.3 -2.1 1.8 42 0.6 -1.0 2.6 38 0.2 -0.8 1.5 42 Contraceptive prevalence – modern methods
Demand for family planning satisfied 0.5 -2.9 4.7 38 0.5 -3.4 2.5 38 0.9 -1.4 6.7 35 0.3 -1.7 1.9 38 Demand for family planning satisfied
Maternal health interventions
Antenatalcarecoverage–atleastonevisit 0.6 -0.9 5.2 42 0.6 -1.6 4.0 42 0.7 -1.7 3.2 38 0.5 -1.6 3.2 42 Antenatalcarecoverage–atleastonevisit
Antenatalcarecoverage–atleastfourvisits 0.7 -2.6 5.3 41 0.2 -2.2 4.1 41 0.4 -3.4 3.0 38 0.4 -1.0 3.3 41 Antenatalcarecoverage–atleastfourvisits
Births attended by skilled health personnel 1.0 -0.7 4.7 42 0.3 -3.5 3.3 42 0.5 -2.2 4.5 38 0.4 -1.6 3.4 42 Births attended by skilled health personnel
Newborn and child health interventions
Early initiation of breastfeeding 0.9 -2.8 5.5 41 0.1 -2.1 3.9 41 0.2 -2.6 3.8 37 0.1 -1.2 2.1 41 0.0 -0.4 1.2 36 Early initiation of breastfeeding
Childrenaged6–59monthswhoreceivedvitaminAsupplementation 1.2 -4.7 4.0 18 0.3 -1.8 4.1 18 0.7 -1.3 3.7 18 0.4 -1.8 1.9 18 -0.1 -1.2 0.4 18 Childrenaged6–59monthswhoreceivedvitaminAsupplementation
BCG immunization coverage among one-year-olds 0.5 -0.5 6.9 41 0.7 -1.8 3.0 41 0.9 -0.5 2.2 35 0.4 -0.7 2.8 41 0.0 -0.9 0.9 41 BCG immunization coverage among one-year-olds
Measles immunization coverage among one-year-olds 0.9 -0.9 3.5 41 0.5 -4.2 4.1 41 0.5 -3.3 2.1 35 0.5 -1.0 2.4 41 -0.1 -1.2 0.6 41 Measles immunization coverage among one-year-olds
Polio immunization coverage among one-year-olds 0.6 -1.3 4.6 41 0.9 -2.0 3.2 41 0.5 -1.8 4.2 35 0.7 -0.5 3.2 41 0.1 -0.7 0.7 41 Polio immunization coverage among one-year-olds
DTP3 immunization coverage among one-year-olds 0.7 -0.7 4.0 41 0.9 -2.5 3.2 41 0.5 -2.0 3.5 35 0.4 -1.2 2.8 41 0.0 -0.9 0.7 41 DTP3 immunization coverage among one-year-olds
Full immunization coverage among one-year-olds 1.0 -1.1 6.5 41 0.6 -3.4 3.4 41 0.2 -2.3 4.2 35 0.5 -2.3 2.7 41 0.0 -1.1 0.9 41 Full immunization coverage among one-year-olds
Children aged less than five years with diarrhoea receiving oral rehydration salts 0.7 -1.0 3.8 41 0.1 -2.2 5.3 36 0.5 -2.8 2.1 34 0.1 -1.6 1.8 40 0.0 -2.8 3.0 41 Children aged less than five years with diarrhoea receiving oral rehydration
salts
Children aged less than five years with diarrhoea receiving oral rehydration therapy and continued feeding 0.6 -3.1 4.3 40 0.3 -1.7 4.3 35 0.4 -3.1 1.7 32 0.2 -2.0 1.7 39 0.2 -3.3 3.8 40 Children aged less than five years with diarrhoea receiving oral rehydration
therapy and continued feeding
Children aged less than five years with pneumonia symptoms taken to a health facility 0.9 -1.6 4.4 35 0.7 -2.6 2.3 26 0.5 -2.1 2.4 21 0.5 -2.1 2.7 33 0.0 -3.0 2.0 35 Children aged less than five years with pneumonia symptoms taken to a
health facility
RMNCH interventions, combined Composite coverage index 0.7 -0.7 3.1 34 0.6 -1.3 2.2 28 0.7 -0.8 1.8 25 0.4 -1.0 1.4 34 Composite coverage index
Child malnutrition Stunting prevalence in children aged less than five years -0.5 -1.7 0.9 31 -0.2 -1.7 1.0 31 -0.3 -1.7 1.0 29 -0.1 -1.0 1.8 31 0.0 -0.4 0.5 31 Stunting prevalence in children aged less than five years
Underweightprevalenceinchildrenagedlessthanfiveyears -0.2 -1.4 0.4 31 -0.2 -1.0 0.9 31 -0.3 -2.7 0.8 29 -0.2 -0.9 0.6 31 0.0 -0.3 0.6 31 Underweightprevalenceinchildrenagedlessthanfiveyears
Wasting prevalence in children aged less than five years 0.0 -0.5 0.7 31 0.1 -0.7 0.6 31 -0.1 -0.4 0.5 29 -0.1 -0.3 0.3 31 0.0 -0.5 0.3 31 Wasting prevalence in children aged less than five years
Child mortality Neonatal mortality rate -0.8 -2.9 0.6 37 -0.6 -3.7 1.5 37 -0.9 -2.6 0.8 31 -0.6 -3.4 1.0 37 -0.1 -1.4 2.9 37 Neonatal mortality rate
Infant mortality rate -2.4 -6.6 1.5 37 -1.5 -6.6 3.0 37 -2.2 -7.8 0.5 31 -1.4 -4.6 1.9 37 0.0 -1.7 4.6 37 Infant mortality rate
Under-fivemortalityrate -4.4 -12.2 1.4 37 -2.6 -8.3 5.1 37 -3.6 -10.7 1.6 31 -1.9 -5.3 1.4 37 0.3 -1.8 4.3 37 Under-fivemortalityrate
SUPPLEMENTARY TABLES
99

AAbsoluteexcesschange14,15,70 interpreting74–75 summary estimates 98–99Agediscrimination56Alma-AtaDeclaration4Analysis,data13–15,58,69–70Antenatalcare education-related inequality 27, 73 indicators11,87 inequalities 27 potentialforimprovement50,51,52 summary estimates 94–99
BBacille Calmette–Guérin (BCG) immunization 36, 88 potentialforimprovement50 summary estimates 94–99Bar charts horizontal 78 vertical, maps with 80Benchmarking17Birth attendance, skilled 24–28, 88 change over time 26, 27 economic-related inequality 24–26 potentialforimprovement50,51,52 summary estimates 94–99Bottominequality85Box-and-whisker plots 78Breastfeeding, early initiation 88, 94–99
CCare-seeking for sick children 29 feature story 29–32 indicators11,89 potentialforimprovement50,52 summary estimates 94–99Changeininequalityovertime9,19 analysismethods13,15,70 countriesincluded12 data availability 67 summary estimates 98–99
IndexChange-over-time line plot 80Child health interventions, see Newborn and child health interventionsChild malnutrition, see Malnutrition, childChildmortality41 featurestory41–44 indicatorsused11,90 pneumonia 29 summary estimates 94–99 vaccine-preventable diseases 33Circle graphs, vertical 79Circle plots, horizontal 78CommissiononInformationandAccountabilityforWomen’sandChildren’sHealth6Commission on the Social Determinants of Health 4CommittingtoChildSurvival:APromiseRenewed7Completecoveragepattern85Compositecoverageindex45,89 change over time 47–48 featurestory45–49 indicatorsincluded11,45 potentialforimprovement50,51,52 summary estimates 94–99Concentration index 73Confidence intervals (CIs) 72Contraceptive use 20–23 change over time 22, 23 economic-related inequality 23 education-related inequality 20–23 indicators11,87 potentialforimprovement52 summary estimates 94–99Countdownto2015initiative6,45Countries,study12,66–68,91–93
DDashboard16Data10–12,65–69 analysis13–15,58,69–70 availability58 dimensionofinequality10,11,66 disaggregation13,56–57,69
100

healthindicator10,11,65–66 sources10,65 visualization16,76–77DemographicandHealthSurveys(DHS)10,58,65,66–67Diarrhoea, care-seeking for 29 indicatorsused11,89 place-of-residence inequality 32 potentialforimprovement50,52 summary estimates 94–99Difference13,14,69Dimensionsofinequality10,11,56,66Diphtheria, tetanus and pertussis (DTP3) immunization 33, 88 changeovertime34–35 economic-related inequality 33–36 potentialforimprovement50 sex-related inequality 36 summary estimates 94–99Disadvantaged subgroups 3–4 categoriesassessed10,11 change-over-timeanalyses19 health-promotinginitiatives4–5Disaggregation,data13,56–57,69DTP3, see Diphtheria, tetanus and pertussis
EEconomic-related inequality care-seeking for sick children 32 child malnutrition 40 composite coverage index 46, 47, 48 contraceptive use 23 doublydisaggregateddata56–57 immunization coverage 33–36 patterns85 potentialforimprovement50–53 skilled birth attendance 24–26, 27 summary estimates 94–99 under-five mortality rate 43Economicstatus10,11,66Education10,11,66Education-related inequality antenatal care 27, 73 composite coverage index 46, 47, 48 contraceptive use 20–23 maternal health interventions 27 neonatal mortality rate 43 stunting prevalence 37–39, 74, 76–77 summary estimates 94–99Equity globalinitiatives3,4–5 health5 orientation57–59,60 promoting,inRMNCH59Every Woman, Every Child movement 6Excess change, absolute, seeAbsoluteexcesschange
FFamily planning, demand satisfied 23, 87 potentialforimprovement50,52 summary estimates 94–99Featurestories17,19–53Four quadrant view 79
GGender, see SexGlobal Health Observatory, WHO 68GlobalStrategyforHealthforAll4GlobalStrategyforWomen’sandChildren’s(andAdolescent’s)Health6,59Graphs16
HHealth determinants 68–69Healthindicators10,11,65–66 descriptions 87–90 summary estimates 94–99Healthinequality4–5(see also Inequality) methodologyforassessing72–75 multidimensionalnature12 versushealthinequity5Healthinequity5Healthinformationsystems58–59Householdhealthsurveys10,58,65Householdwealthindex10Human rights approach 4
IImmunization, childhood 33 changesovertime34–35,36 feature story 33–36 indicatorsused11,88 potentialforimprovement50,52 summary estimates 94–99Incrementallinearpattern85Independent Expert Review Group 7Inequality 3–4 (see also Health inequality) absolutemeasures13,14,69 acrosshealthtopics,reducing59–60 dimensionsof10,11,56,66 patternsof85–86 reasonsforpersistence56 relativemeasures13,14,69Inequity,health5Infant mortality rate 43, 90, 94–99Interactivedatavisuals16,17,78–84 best practices 82 further exploration of data 83–84 guide to interpreting 78–80InternationalCenterforEquityinHealth,Brazil65
INDEX
101

MMalnutrition, child 37 change over time 38–39 deathsdueto41 feature story 37–40 indicatorsused11,89 summary estimates 94–99Maps16,76–77 with vertical bar charts 80Marginalexclusionpattern85Massdeprivationpattern85Maternal health interventions 24 feature story 24–28 indicatorsused11,65–66,87–88 potentialforimprovement50,51,52 summary estimates 94–99Measles immunization 33, 36, 88 potentialforimprovement50 summary estimates 94–99Medianvalues15,69Millennium Development Goals (MDGs) 3, 6Monitoring9–17 analysismethods13–15,69–70 capacitybuilding58–59 data10–12,65–69Multidimensionalnature,healthinequality12MultipleIndicatorClusterSurveys(MICS)10,58,65,66–67
NNeonatal mortality rate 43, 90, 94–99Newborn and child health interventions indicatorsused11,88–89 potentialforimprovement50,51,52 summary estimates 94–99
OOralrehydrationtherapy32,50,89
PPartnership for Maternal, Newborn and Child Health 6Patternsofinequality85–86Placeofresidence10,11,66Place-of-residence inequalities childmortality41–44 composite coverage index 46, 47, 48 diarrhoea care-seeking 32 doublydisaggregateddata56–57 maternal health interventions 27 measles immunization 36 pneumoniacare-seeking29–31 summary estimates 94–99
Pneumonia, care-seeking for 29–32, 89 economic-related inequality 32 place-of-residenceinequality29–31 potentialforimprovement50,52 summary estimates 94–99Polio immunization 33, 36, 88 summary estimates 94–99Populationattributablerisk14,15,50,70 featurestory50–53Population share 73–74Post-2015sustainabledevelopmentagenda3,5,7,59–60
QQueuingpattern85
RRatio13,14,69Reporting9,16–17,55–60Reproductive, maternal, newborn and child health (RMNCH) 5–7 healthindicators10,11,65–66 interventions combined see Composite coverage index monitoringinequality9–17 potentialforimprovement50–53 promotingequityin59Reproductive health interventions 20 feature story 20–23 indicatorsused11,87 potentialforimprovement50,51,52 summary estimates 94–99Rio Political Declaration on Social Determinants of Health 4RMNCH, see Reproductive, maternal, newborn and child healthRural–urban differences, see Place-of-residence inequalities
SSex(child)10,11Sex-related inequality immunization coverage 36 summary estimates 94–99Slope index of inequality 73Story-points16Stunting prevalence 89 change over time 38–39, 40 economic-related inequality 40 education-related inequality 37–39, 74, 76–77 summary estimates 94–99Summarymeasures13–15,69–70,73
TTables16Topinequality85
STATE OF INEQUALITY: REPRODUCTIVE, MATERNAL, NEWBORN AND CHILD HEALTH
102
UUNCommissiononLife-SavingCommoditiesforWomen’sandChildren’sHealth7Under-fivemortalityrate90 change over time 43, 44 doublydisaggregateddata56–57 place-of-residenceinequality41–44 summary estimates 94–99Underweightprevalence,child40,89,94–99Universalhealthcoverage5Urban–ruraldifferences,see Place-of-residence inequalities
VVisualization,data16,17,76–77(see also Interactive data visuals)VitaminAsupplementation88,94–99
WWasting prevalence, child 89, 94–99Within-country inequality 3–4World Bank DataBank 68
INDEX
103


h t t p : / / w w w . w h o . i n t / g h o / h e a l t h _ e q u i t y / r e p o r t _ 2 0 1 5 /

STATE OF IN
EQU
ALITY R
eproductive, maternal, new
born and child health
ISBN 978 92 4 156490 8
STATE OF INEQUALITYReproductive, maternal,
newborn and child health
I N T E R A C T I V E V I S U A L I Z AT I O N O F H E A LT H D ATA
DEPARTMENT OF HEALTH STATISTICS AND INFORMATION SYSTEMS
WORLD HEALTH ORGANIZATION20, AVENUE APPIA
CH-1211 GENEVA 27SWITZERLAND
GENDER, EQUITY AND HUMAN RIGHTS TEAM
Everyone Everywhere Always
h t t p : / / w w w . w h o . i n t / g h o / h e a l t h _ e q u i t y / r e p o r t _ 2 0 1 5 / WHO


