Embed Size (px)
Citation preview
STATE OF ILLINOIS CHICAGO STATE UNIVERSITY
FINANCIAL AUDIT
FOR THE YEAR ENDED JUNE 30, 2016
Performed as Special Assistant Auditors for
the Auditor General, State of Illinois

State of Illinois Chicago State University Financial Audit For the Year Ended June 30, 2016 Table of Contents
Page
University Officials 1 Financial Statement Report Summary 2 Independent Auditor’s Report 3 Management’s Discussion and Analysis (Unaudited) 7 Basic Financial Statements Statement of Net Position 15 Statement of Revenues, Expenses and Changes in Net Position 16 Statement of Cash Flows 17 Notes to the Basic Financial Statements 18 Required Supplementary Information (Unaudited) Schedule of the Employer’s Proportionate Share of the Net Pension Liability (Unaudited) 43 Schedule of Contributions (Unaudited) 43 Notes to Required Supplementary Information (Unaudited) 44 Supplementary Information University Auxiliary Facilities System Revenue Bond Fund, Series 1998
- Statement of Net Position 45 - Statement of Revenues, Expenses and Changes in Net Position 46 - Statement of Cash Flows 47
Other Information (Unaudited) - Student Enrollment by Term (Unaudited) 48 - University Center Fee (Unaudited) 48 - Rental Disclosures (Unaudited) 48 - Schedule of Insurance in Force (Unaudited) 48
Independent Auditor’s Report on Internal Control Over Financial Reporting and on Compliance and Other Matters Based on an Audit of Financial Statements Performed in Accordance with Government Auditing Standards 49 Schedule of Findings 51 Other Report Issued Under Separate Cover Chicago State University
Compliance Examination (in Accordance with the Uniform Guidance) for the Year Ended June 30, 2016
State of Illinois Chicago State University Financial Audit For the Year Ended June 30, 2016 University Officials Interim President Mr. Cecil B. Lucy, JD, MBA, CPA
(09/16/16 to Present) President Dr. Thomas J. Calhoun, Jr.
(01/01/16 to 09/15/16) President Emeritus Dr. Wayne Watson
(12/31/15 to 06/30/16) President Dr. Wayne Watson
(10/01/09 to 12/30/15) Provost and Senior V.P. for Academic Affairs Dr. Angela M. Henderson Vice President and General Counsel Mr. Patrick B. Cage, Esq.
Acting V.P. of Administration and Finance Mr. Larry D. Owens, CPA (11/01/16 to Present)
Interim V.P. of Administration and Finance Mr. Cecil B. Lucy, JD, MBA, CPA
(10/01/15 to 10/31/16) V.P. of Administration and Finance Mr. Lawrence A. Pinkleton
(04/01/15 to 09/30/15) Associate V.P. of Administration and Finance Ms. Maricela Aranda Interim Executive Director/Controller Mr. Larry D. Owens, CPA
(06/13/16 to Present) Executive Director/Controller Mr. Raul Garcia, CPA, MBA
(08/16/13 to 06/15/16) Director of Accounting/Assistant Controller Ms. Louise Williams, CPA
(12/16/14 to 04/30/16) Chief Internal Auditor Mr. Michael N. Mayo, CPA University offices are located at: 9501 South Martin Luther King Drive Chicago, Illinois 60628
1

State of Illinois Chicago State University Financial Audit For the Year Ended June 30, 2016 Financial Statement Report Summary The audit of the accompanying basic financial statements of Chicago State University (University) was performed by E. C. Ortiz and Co., LLP. Based on their audit, the auditors expressed an unmodified opinion on the University’s basic financial statements. Summary of Findings The auditors identified matters involving the University’s internal control over financial reporting that they considered to be significant deficiencies. The significant deficiencies are described in the accompanying Schedule of Findings on pages 51 through 54 of this report as items 2016-001, Inaccurate Accounting of Accrued Compensated Absences and 2016-002, Improper Accounting of Unearned Revenue and Grant Receivables. Exit Conference The University waived having an exit conference in a letter dated December 21, 2016 from Mr. Cecil Lucy, Interim President. Responses to the recommendations were provided by Ms. Deidre Cato-Baker, Director of Judicial Affairs/Compliance, in a letter dated January 12, 2017.
2

E.C. O RTI Z & CO., LLP C ERTIF I ED PUB L I C ACCOUN TANTS
Independent Auditor's Report
Honorable Frank J. Mautino Auditor General State of Illinois
and
The Board of Trustees Chicago State University
Report on the Financial Statements
As Special Assistant Auditors for the Auditor General, we have audited the accompanying financial statements of the business-type activities and the discretely presented component units of Chicago State University (University), a component unit of the State of Illinois, as of and for the year ended June 30, 2016, and the related notes to the financial statements, which collectively comprise the University's basic financial statements as listed in the table of contents.
Management's Responsibility for the Financial Statements
Management is responsible for the preparation and fair presentation of these financial statements in accordance with accounting principles generally accepted in the United States of America; this includes the design, implementation, and maintenance of internal control relevant to the preparation and fair presentation of financial statements that are free from material misstatement, whether due to fraud or error.
Auditor's Responsibility
Our responsibility is to express opinions on these financial statements based on our audit. We did not audit the financial statements of the discretely presented component units. Those statements were audited by other auditors whose report has been furnished to us, and our opinion, insofar as it relates to the amounts included for the discretely presented component units, are based solely on the reports of the other auditors. We conducted our audit in accordance with auditing standards generally accepted in the United States of America and the standards applicable to financial audits contained in Government Auditing Standards, issued by the Comptroller General of the United States. Those standards require that we plan and perform the audit to obtain reasonable assurance about whether the financial statements are free from material misstatement. The financial statements of the University' s discretely presented component units were not audited in accordance with Government Auditing Standards.
333 SOUT H DES PL AI NES STREET, SU ITE 2-N CHICAGO, I L 6066 1 r c I: 3 I 2. 8 7 6. I 9 0 0 fax : 3 I 2. 8 7 6. I 9 I I
3

An audit involves performing procedures to obtain audit evidence about the amounts and disclosures in the financial statements. The procedures selected depend on the auditor’s judgment, including the assessment of the risks of material misstatement of the financial statements, whether due to fraud or error. In making those risk assessments, the auditor considers internal control relevant to the entity’s preparation and fair presentation of the financial statements in order to design audit procedures that are appropriate in the circumstances, but not for the purpose of expressing an opinion on the effectiveness of the entity’s internal control. Accordingly, we express no such opinion. An audit also includes evaluating the appropriateness of accounting policies used and the reasonableness of significant accounting estimates made by management, as well as evaluating the overall presentation of the financial statements. We believe that the audit evidence we have obtained is sufficient and appropriate to provide a basis for our audit opinions. Opinions In our opinion, based on our audit and the report of other auditors, the financial statements referred to above present fairly, in all material respects, the respective financial position of the business-type activities of the University and its discretely presented component units, as of June 30, 2016, and the respective changes in financial position and, where applicable, cash flows thereof for the year then ended in accordance with accounting principles generally accepted in the United States of America. Emphasis of Matters As discussed in Note 18 to the financial statements, Public Act 099-0524 granted the University Fiscal Year 2017 appropriations, totaling $14,343,500, which the University has used to pay Fiscal Year 2016 costs as allowed for by Public Act 099-0524. Even though this law was enacted on June 30, 2016, the University did not recognize this nonoperating appropriations revenue from the State of Illinois at June 30, 2016 in accordance with generally accepted accounting principles. In addition, the State of Illinois has not enacted an appropriations bill to fund the University’s Fiscal Year 2017 operations. Our opinions are not modified with respect to these matters. Report on Summarized Comparative Information The financial statements of the University, as of and for the year ended June 30, 2015, were audited by the predecessor auditor whose report dated December 4, 2015, expressed an unmodified opinion on those statements. In our opinion, the summarized comparative information presented herein as of and for the year ended June 30, 2015, is consistent, in all material respects, with the audited financial statements from which it has been derived.
4
Other Matters Required Supplementary Information Accounting principles generally accepted in the United States of America require that the Management’s Discussion and Analysis, Schedule of Employer’s Proportionate Share of the Net Pension, Schedule of Contributions, and Notes to Required Supplementary Information on pages 7 through 14 and 43 through 44 be presented to supplement the basic financial statements. Such information, although not a part of the basic financial statements, is required by the Governmental Accounting Standards Board who considers it to be an essential part of financial reporting for placing the basic financial statements in an appropriate operational, economic, or historical context. We have applied certain limited procedures to the required supplementary information in accordance with auditing standards generally accepted in the United States of America, which consisted of inquiries of management about the methods of preparing the information and comparing the information for consistency with management’s responses to our inquiries, the basic financial statements, and other knowledge we obtained during our audit of the basic financial statements. We do not express an opinion or provide any assurance on the information because the limited procedures do not provide us with sufficient evidence to express an opinion or provide any assurance. Other Information Our audit was conducted for the purpose of forming opinions on the financial statements that collectively comprise the University’s basic financial statements. The University Auxiliary Facilities System Revenue Bond Fund, Series 1998 financial statements on pages 45 through 47 and the other information on page 48 are presented for purposes of additional analysis and are not a required part of the basic financial statements. The University Auxiliary Facilities System Revenue Bond Fund, Series 1998 financial statements on pages 45 through 47 is the responsibility of management and was derived from and relates directly to the underlying accounting and other records used to prepare the basic financial statements. Such information has been subjected to the auditing procedures applied in the audit of the basic financial statements and certain additional procedures, including comparing and reconciling such information directly to the underlying accounting and other records used to prepare the basic financial statements or to the basic financial statements themselves, and other additional procedures in accordance with auditing standards generally accepted in the United States of America by us and other auditors. In our opinion, the University Auxiliary Facilities System Revenue Bond Fund, Series 1998 financial statements on pages 45 through 47 are fairly stated, in all material respects, in relation to the basic financial statements as a whole. The “Unaudited” other information on page 48 has not been subjected to the auditing procedures applied in the audit of the basic financial statements, and accordingly, we do not express an opinion or provide any assurance on it.
5
Other Reporting Required by Government Auditing Standards In accordance with Government Auditing Standards, we have also issued our report dated March 17, 2017 on our consideration of the University’s internal control over financial reporting and on our tests of its compliance with certain provisions of laws, regulations, contracts, and grant agreements and other matters. The purpose of that report is to describe the scope of our testing of internal control over financial reporting and compliance and the results of that testing, and not to provide an opinion on internal control over financial reporting or on compliance. That report is an integral part of an audit performed in accordance with Government Auditing Standards in considering the University’s internal control over financial reporting and compliance.
Chicago Illinois March 17, 2017
6

State of Illinois Chicago State University Management’s Discussion and Analysis (Unaudited) For the Year Ended June 30, 2016 Background Chicago State University (CSU or University) was founded as a teacher-training school over 140 years ago. It is located in a residential community on the south side of Chicago, approximately 12 miles south of downtown Chicago. Today the University is composed of five colleges - the College of Arts & Sciences, the College of Business, the College of Education, the College of Health Sciences, and the College of Pharmacy. CSU offers thirty-six undergraduate degrees, twenty-two graduate degrees, and two doctoral degrees (the Doctorate of Education in Educational Leadership and the Doctor of Pharmacy). It also offers an interdisciplinary Honors College for highly motivated students in all areas of study and has a Division of Continuing Education. While CSU has been accredited through the 2022 – 2023 academic year by the Higher Learning Commission, it was notified in mid-2016 that due to the precarious financial state caused by the budget impasse in Springfield, its accreditation was in jeopardy. The Commission gave the University until June 2017 to prove financial stability. Operational and Financial Highlights The Fiscal Year 2016 operating loss ($83.3 million) decreased by $14.6 million compared to the previous fiscal year’s operating loss ($97.9 million). This decrease is attributed to continued pressures to reduce operating costs relative to the reduction in the State financial support and declining student enrollment. The net decrease in nonoperating revenues ($25 million) is attributed to a decrease in State appropriation funding ($16.3 million), a decrease in State fringe benefits ($2.9 million), a decrease in State nonoperating grants ($3 million), a decrease in federal nonoperating grants ($1.4 million) and an increase in other nonoperating expenses ($1.5 million). The decrease in other operating revenues ($12.8 million) is mainly attributed to the drastically reduced State support for capital projects. The following is a financial comparison for the twelve months ending June 30, 2016 and 2015.
2016 2015 Increase (in thousands) (in thousands) (Decrease)
Operating loss $ (83,308) $ (97,863) $ 14,555 Nonoperating revenues 73,063 98,097 (25,034) Other operating revenues 2,030 14,877 (12,847)
Increase (decrease) in net position $ (8,215) $ 15,111 $ (23,326) Management’s Discussion and Analysis The management’s discussion and analysis (MD&A) section of this report presents the University’s financial information in a condensed financial presentation format for fiscal
7
State of Illinois Chicago State University Management’s Discussion and Analysis (Unaudited) For the Year Ended June 30, 2016
years ended June 30, 2016 and 2015. This section of the report is designed to provide an overview of the changes in financial activities from one year to the next, and should be read in conjunction with the University’s basic financial statements. The University’s management is responsible for the completeness and fairness of this information. The MD&A focuses on the University and excludes the discretely presented component units (Chicago State University Foundation and The University Foundation at Chicago State). MD&A for the component units are included in their separately issued financial statements. Refer to the Notes to the Basic Financial Statements (Note 1 on page 19) for information on how to obtain the financial statements of the component units. Using the Financial Statements The Statement of Net Position, the Statement of Revenues, Expenses and Changes in Net Position, and the Statement of Cash Flows emulate the corporate presentation models whereby all of the University’s activities are consolidated into one total. These financial statements are prepared in accordance with Governmental Accounting Standards Board (GASB) Statement No. 35. The financial statements encompass the University and its discretely presented component units. Statement of Net Position The Statement of Net Position presents the assets, deferred outflows of resources and liabilities of the University using the accrual basis of accounting and reflects the financial position of the University at the end of the fiscal year. The statement reflects the University’s financial position at a certain date. Net position, consisting of the net amount of the assets, deferred outflows of resources, liabilities, and deferred inflows of resources, is one indicator of the current financial condition of the University, while the change in net position that occurs over time is an indicator of whether the overall financial condition has improved or worsened during the year. Assets and liabilities are generally measured using current values. One notable exception is capital assets, which are stated at historical cost less an allowance for depreciation. Net position has been further categorized as (i) Net investment in capital assets, (ii) Restricted nonexpendable – net position that are permanently restricted by externally imposed stipulations, (iii) Restricted expendable – net position subject to externally imposed restrictions that can be fulfilled by actions of the University pursuant to those stipulations or that expire by the passage of time and (iv) Unrestricted – net position that are not subject to externally imposed stipulations and may be used at the discretion of the governing board to meet current expenses for any purpose. A summary of the University’s assets, liabilities and net position for the year ended June 30, 2016 in comparison with June 30, 2015 are as follows:
8

State of Illinois Chicago State University Management’s Discussion and Analysis (Unaudited) For the Year Ended June 30, 2016
2016 2015 Change (in millions) (in millions) (in millions)
Assets Current assets $ 26.2 $ 31.4 $ (5.2) Noncurrent assets: Capital assets, net 154.7 158.9 (4.2) Other 2.8 6.1 (3.3)Total Assets 183.7 196.4 (12.7) Deferred outflows for pension expense 0.3 0.3 Liabilities Current liabilities 16.6 18.1 (1.5) Noncurrent liabilities 14.1 17.1 (3.0)Total Liabilities 30.7 35.2 (4.5) Net Position Net investment in capital assets 142.1 144.6 (2.5) Restricted, expendable 1.2 0.8 0.4 Unrestricted 10.0 16.1 (6.1)Total Net Position $ 153.3 $ 161.5 $ (8.2) Current Assets Current assets decreased by $5.2 million from the balance one year ago ($31.4 million) to the current balance ($26.2 million). The decrease is attributable to cash outlays for operating activities. Noncurrent Assets (Capital) Noncurrent assets (Capital) decreased by $4.2 million from the balance one year ago ($158.9 million) to the current balance ($154.7 million). The decrease consists of annual depreciation charges ($6.1 million), slightly offset by net capital additions ($1.9 million). Current Liabilities Current liabilities decreased by $1.5 million from the balance one year ago ($18.1 million) to the current balance ($16.6 million) mainly due to the increase in operating vendor and supplier commitments at year-end, offset by the accrual of the University’s share in the awarded judgement in favor of the plaintiff in an ongoing lawsuit.
9

State of Illinois Chicago State University Management’s Discussion and Analysis (Unaudited) For the Year Ended June 30, 2016
Noncurrent Liabilities Noncurrent liabilities decreased by $3.0 million from the balance one year ago ($17.1 million) to the current balance ($14.1 million) and is attributed to the annual debt service payment and a decrease in employee compensated absences driven by workforce reductions. Net Position (Net investment in capital assets) Capital net position ($142.1 million) decreased by $2.5 million from the balance one year ago ($144.6 million). Capital assets decreased by $4.2 million and related debt decreased by $1.7 million. Net Position (Unrestricted) Unrestricted net position ($10.0 million) decreased by $6.1 million from the balance one year ago ($16.1 million). This is predominantly attributed to the decreased operating results from lower enrollment and reduced appropriations. Statement of Revenues, Expenses and Changes in Net Position The Statement of Revenues, Expenses and Changes in Net Position focuses on the gross costs and the net costs of the University’s activities that are supported substantially by student tuition and fees, state and federal grants and contracts, auxiliary enterprise revenues, and state appropriations. The purpose of the statement is to present the revenues earned and expenses incurred by the University, both operating and nonoperating. Operating revenues primarily result from exchange transactions where each of the parties to the transaction either gives up or receives something of equal or similar value. The major sources of the University’s operating revenues are student tuition and fees, certain grants, and auxiliary revenues. Nonoperating revenues primarily result from non-exchange transactions and are revenues received for which goods and services are not provided in return. The most significant sources of nonoperating revenues that the University relies on to provide funding for operations are State appropriations and on-behalf payments for fringe benefits. Revenues A summary of the University’s revenues for the year ended June 30, 2016 in comparison with June 30, 2015 is as follows:
10
State of Illinois Chicago State University Management’s Discussion and Analysis (Unaudited) For the Year Ended June 30, 2016
2016 2015 Change (in millions) (in millions) (in millions)
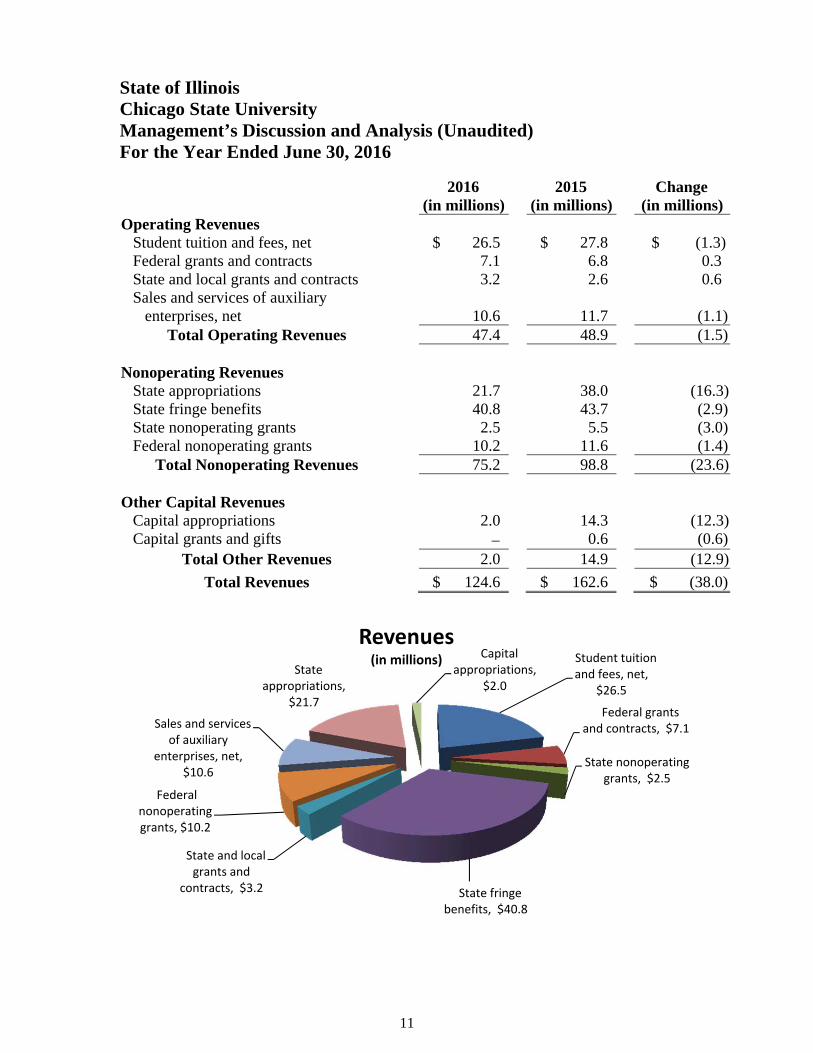
Operating Revenues Student tuition and fees, net $ 26.5 $ 27.8 $ (1.3) Federal grants and contracts 7.1 6.8 0.3 State and local grants and contracts 3.2 2.6 0.6 Sales and services of auxiliary enterprises, net 10.6 11.7 (1.1)
Total Operating Revenues 47.4 48.9 (1.5) Nonoperating Revenues State appropriations 21.7 38.0 (16.3) State fringe benefits 40.8 43.7 (2.9) State nonoperating grants 2.5 5.5 (3.0) Federal nonoperating grants 10.2 11.6 (1.4)
Total Nonoperating Revenues 75.2 98.8 (23.6) Other Capital Revenues Capital appropriations 2.0 14.3 (12.3) Capital grants and gifts 0.6 (0.6)
Total Other Revenues 2.0 14.9 (12.9)
Total Revenues $ 124.6 $ 162.6 $ (38.0)
Student tuition and fees, net,
$26.5
Federal grants and contracts, $7.1
State nonoperating grants, $2.5
State fringe benefits, $40.8
State and local grants and
contracts, $3.2
Federal nonoperating grants, $10.2
Sales and services of auxiliary
enterprises, net, $10.6
State appropriations,
$21.7
Capital appropriations,
$2.0
Revenues(in millions)
11
State of Illinois Chicago State University Management’s Discussion and Analysis (Unaudited) For the Year Ended June 30, 2016
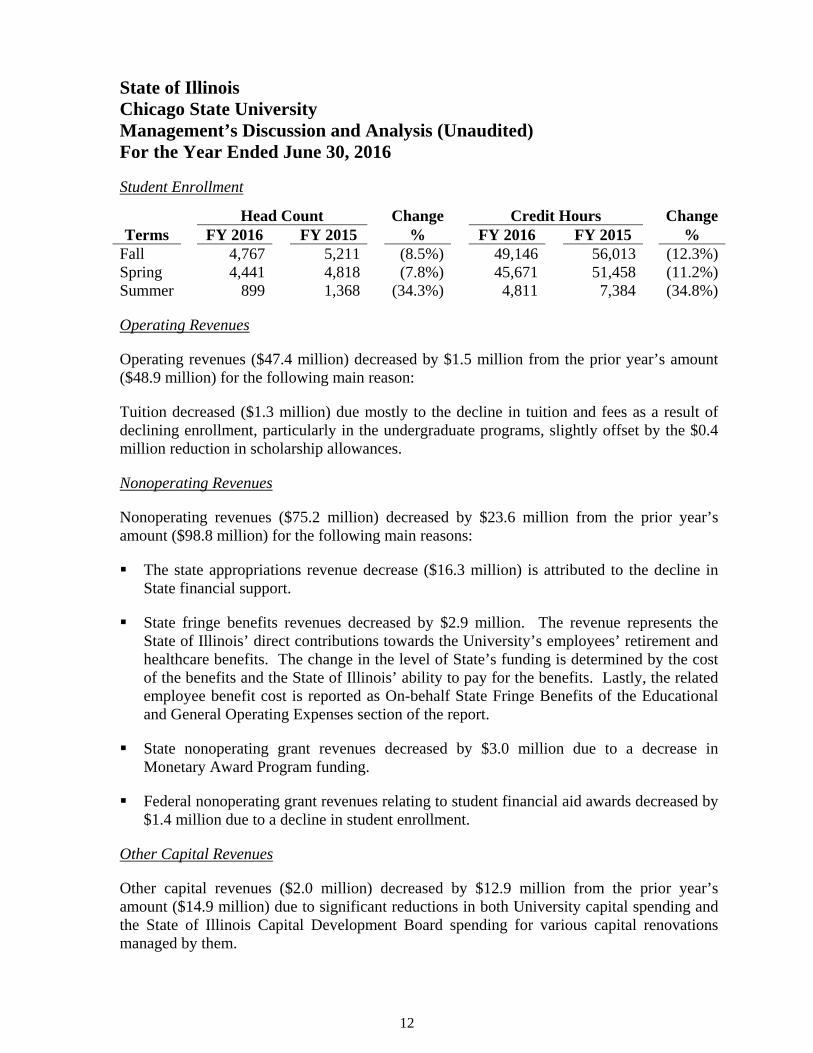
Student Enrollment
Head Count Change Credit Hours ChangeTerms FY 2016 FY 2015 % FY 2016 FY 2015 %
Fall 4,767 5,211 (8.5%) 49,146 56,013 (12.3%)Spring 4,441 4,818 (7.8%) 45,671 51,458 (11.2%)Summer 899 1,368 (34.3%) 4,811 7,384 (34.8%) Operating Revenues Operating revenues ($47.4 million) decreased by $1.5 million from the prior year’s amount ($48.9 million) for the following main reason: Tuition decreased ($1.3 million) due mostly to the decline in tuition and fees as a result of declining enrollment, particularly in the undergraduate programs, slightly offset by the $0.4 million reduction in scholarship allowances. Nonoperating Revenues Nonoperating revenues ($75.2 million) decreased by $23.6 million from the prior year’s amount ($98.8 million) for the following main reasons: The state appropriations revenue decrease ($16.3 million) is attributed to the decline in
State financial support. State fringe benefits revenues decreased by $2.9 million. The revenue represents the
State of Illinois’ direct contributions towards the University’s employees’ retirement and healthcare benefits. The change in the level of State’s funding is determined by the cost of the benefits and the State of Illinois’ ability to pay for the benefits. Lastly, the related employee benefit cost is reported as On-behalf State Fringe Benefits of the Educational and General Operating Expenses section of the report.
State nonoperating grant revenues decreased by $3.0 million due to a decrease in
Monetary Award Program funding. Federal nonoperating grant revenues relating to student financial aid awards decreased by
$1.4 million due to a decline in student enrollment. Other Capital Revenues Other capital revenues ($2.0 million) decreased by $12.9 million from the prior year’s amount ($14.9 million) due to significant reductions in both University capital spending and the State of Illinois Capital Development Board spending for various capital renovations managed by them.
12
State of Illinois Chicago State University Management’s Discussion and Analysis (Unaudited) For the Year Ended June 30, 2016
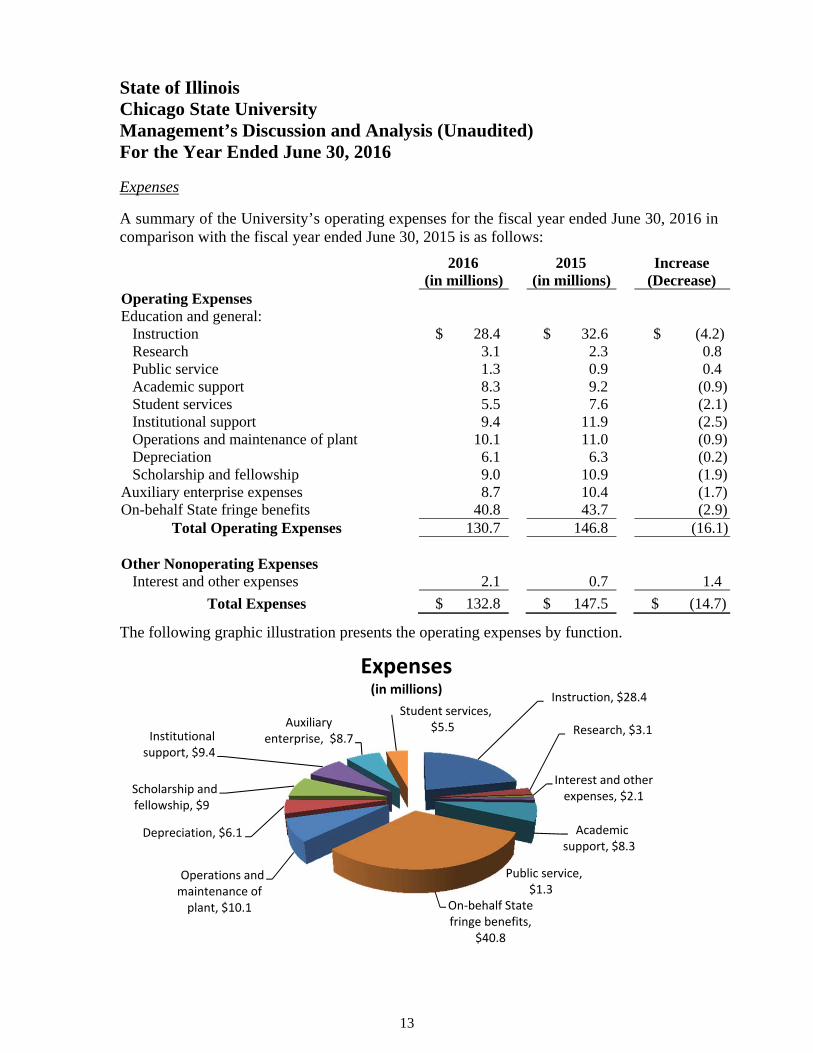
Expenses A summary of the University’s operating expenses for the fiscal year ended June 30, 2016 in comparison with the fiscal year ended June 30, 2015 is as follows:
2016 2015 Increase (in millions) (in millions) (Decrease)
Operating Expenses Education and general: Instruction $ 28.4 $ 32.6 $ (4.2) Research 3.1 2.3 0.8 Public service 1.3 0.9 0.4 Academic support 8.3 9.2 (0.9) Student services 5.5 7.6 (2.1) Institutional support 9.4 11.9 (2.5) Operations and maintenance of plant 10.1 11.0 (0.9) Depreciation 6.1 6.3 (0.2) Scholarship and fellowship 9.0 10.9 (1.9)Auxiliary enterprise expenses 8.7 10.4 (1.7)On-behalf State fringe benefits 40.8 43.7 (2.9)
Total Operating Expenses 130.7 146.8 (16.1) Other Nonoperating Expenses Interest and other expenses 2.1 0.7 1.4
Total Expenses $ 132.8 $ 147.5 $ (14.7) The following graphic illustration presents the operating expenses by function.
Instruction, $28.4
Research, $3.1
Interest and other expenses, $2.1
Public service, $1.3
Academic support, $8.3
On‐behalf State fringe benefits,
$40.8
Operations and maintenance of plant, $10.1
Depreciation, $6.1
Scholarship and fellowship, $9
Institutional support, $9.4
Auxiliary enterprise, $8.7
Student services, $5.5
Expenses(in millions)
13
State of Illinois Chicago State University Management’s Discussion and Analysis (Unaudited) For the Year Ended June 30, 2016 Operating Expenses Operating expenses decreased by $16.1 million from the balance one year ago ($146.8 million) to the current balance ($130.7 million) for the following main reasons: Vendor and employee costs continued to be strategically curtailed ($11.2 million) in
response to declines in State funding and tuition and fee revenues.
Scholarship and fellowship decreased ($1.9 million) due to continuing decline in student enrollment.
On-behalf State fringe benefits decreased ($2.9 million) due to reduction in staffing
levels. Since this benefit is managed and funded by the State of Illinois, under generally accepted accounting principles, the expense relating to University employees is reflected in the financial statements with an offset to revenue on the State fringe benefits line item reported in the nonoperating revenue (expenses) section of the financial statements.
Economic Factors That Will Affect the Future The State of Illinois continues to rally around taking steps to creating a pathway for sound fiscal management but there currently does not exist an agreement on what is the appropriate pathway. The State financial challenges include escalating employee benefit costs and a back log of obligations. The State of Illinois continues to lag in the unemployment economic indicator relative to its neighboring states. For the month ended August 2016, the Illinois unemployment rate was 5.5% while its neighboring unemployment rate ranged from 4.2% to 4.5%. Despite the financial affairs of the State, higher education will continue to play a vital role in developing a well-educated workforce to compete in a modern economy in various industries including healthcare, information technology, distribution and logistics, and manufacturing. Accordingly, the University in coordination with other sister higher education institutions continue to advocate for continued State financial support.
14

University CSUF TUFCS University CSUF
ASSETSCurrent Assets Cash equity with State Treasurer 1,608,491$ -$ -$ 524,043$ -$
Cash and cash equivalents (Note 2) 16,967,411 - 53,693 18,348,687 127,321 Cash and cash equivalents - restricted (Note 2) - - 789,897 - 1,763,092 Certificate of deposits - restricted (Note 2) - - - 250,000 - Securities lending collateral equity of State Treasurer (Note 2) 425,860 - - 300,848 - Balance in State Appropriation 24,879 - - 5,541,430 - Accounts receivable, net (Note 3) 6,891,623 - 28,951 5,817,866 - Inventories 23,706 - - 29,411 - Loans and notes receivable, net (Note 3) 22,522 - - 21,052 - Prepaid expenses and other assets 267,953 - 6,551 564,964 16
Total current assets 26,232,445 - 879,092 31,398,301 1,890,429
Noncurrent AssetsCash and cash equivalents - restricted (Note 2) 2,154,181 - - 5,138,062 - Certificate of deposits - restricted (Note 2) - - - - 2,000 Endowment investments (Note 2) - 5,036,281 - - 5,157,070 Loans and notes receivable, net (Note 3) 627,144 - - 713,496 - Other noncurrent assets - - - 269,813 - Capital assets, net (Note 4) 154,682,708 - - 158,917,345 -
Total noncurrent assets 157,464,033 5,036,281 - 165,038,716 5,159,070
Total Assets 183,696,478 5,036,281 879,092 196,437,017 7,049,499
DEFERRED OUTFLOWS FOR PENSION EXPENSE 287,671 - - 318,777 -
LIABILITIESCurrent Liabilities Accounts payable and accrued liabilities 8,818,493 272,023 20,506 9,210,015 1,271,842
Obligations under securities lending collateral equity of State Treasurer 425,860 - - 300,848 - Accrued wages (Note 5) 2,143,411 - - 2,382,606 - Unearned revenue (Note 6) 2,605,908 - - 3,873,633 - Long-term liabilities - current portion (Note 7) 2,587,263 - - 2,360,140 -
Total current liabilities 16,580,935 272,023 20,506 18,127,242 1,271,842
Noncurrent LiabilitiesAccrued compensated absences (Note 7) 2,962,118 - - 4,539,108 - Bonds payable (Note 7) 10,760,000 - - 12,000,000 - Premium on bonds (Note 7) 145,967 - - 168,423 - Intangible asset payable (Note 7) 199,587 - - 299,381 - Capital leases payable (Note 7) 2,956 - - 74,349 -
Total noncurrent liabilities 14,070,628 - - 17,081,261 -
Total Liabilities 30,651,563 272,023 20,506 35,208,503 1,271,842
NET POSITIONNet investment in capital assets 142,098,962 - - 144,599,567 - Restricted for:
NonexpendableEndowments - 2,840,820 - - 2,961,624
ExpendableDirect programs and scholarships 109,435 2,186,381 789,897 4,734 2,681,975 Loans 666,668 - - 743,844 - Capital projects 437,237 - - 127,209 -
Unrestricted 10,020,284 (262,943) 68,689 16,071,937 134,058 Total Net Position 153,332,586$ 4,764,258$ 858,586$ 161,547,291$ 5,777,657$
2016 2015
STATE OF ILLINOISCHICAGO STATE UNIVERSITYSTATEMENT OF NET POSITION
JUNE 30, 2016(With Comparative Totals as of June 30, 2015)
The accompanying Notes are an integral part of these financial statements.
15

University CSUF TUFCS University CSUF
OPERATING REVENUESStudent tuition and fees (net of scholarship allowances 26,497,026$ -$ -$ 27,832,036$ -$
of $12,501,405 for 2016 and $12,874,813 for 2015)Federal grants and contracts 7,101,139 - - 6,807,501 - State and local grants and contracts 3,198,762 - - 2,506,513 - Nongovernmental grants and contracts 23,948 - - 85,590 - Sales and services of auxiliary enterprises (net of scholarship 10,603,548 - - 11,677,750 -
allowances of $59,266 for 2016 and $107,096 for 2015)Other operating revenues 10,124 20,548 327,615 3,986 429,917
Total operating revenues 47,434,547 20,548 327,615 48,913,376 429,917
OPERATING EXPENSESEducational and general
Instruction 28,427,680 - - 32,560,710 - Research 3,083,243 - - 2,325,552 - Public service 1,328,302 - - 936,499 - Academic support 8,336,336 - - 9,255,643 - Student services 5,539,644 - - 7,594,711 - Institutional support 9,390,878 - - 11,925,039 3,222,934 Operations and maintenance of plant 10,125,690 - - 10,962,559 - Depreciation 6,115,677 - - 6,263,385 - Scholarship and fellowship 8,949,904 39,261 64,322 10,875,344 160,265
Auxiliary enterprise expenses 8,684,394 - - 10,375,155 - On-behalf State fringe benefits (See Note 9) 40,760,468 - - 43,701,632 -
Total operating expenses 130,742,216 39,261 64,322 146,776,229 3,383,199
OPERATING INCOME (LOSS) (83,307,669) (18,713) 263,293 (97,862,853) (2,953,282)
NONOPERATING REVENUES (EXPENSES)State appropriations 21,707,300 - - 38,008,893 - State fringe benefits 40,760,468 - - 43,701,632 - State nonoperating grants 2,505,197 - - 5,515,213 - Federal nonoperating grants 10,186,943 - - 11,546,163 - Gifts and contributions - 7,335 44,800 - 435,878 Investment income (loss) 48,359 (79,322) 12,310 28,680 188,127 Interest on capital asset - related debt (644,972) - - (703,549) - Other nonoperating revenues (expenses) (1,500,000) (159,330) (225,186) - 2,336,590
Net nonoperating revenues (expenses) 73,063,295 (231,317) (168,076) 98,097,032 2,960,595
INCOME (LOSS) BEFORE OTHER REVENUES, EXPENSES, GAINS OR LOSSES (10,244,374) (250,030) 95,217 234,179 7,313
Capital appropriations 2,032,760 - - 14,322,576 - Capital grants and gifts - - - 568,561 - Endowment contributions - - - - 5,035 Loss on disposal of capital assets (3,091) - - (14,018) - Equity transfer - (763,369) 763,369 - -
INCREASE (DECREASE) IN NET POSITION (8,214,705) (1,013,399) 858,586 15,111,298 12,348
NET POSITION, BEGINNING OF YEAR, AS PREVIOUSLY REPORTED 161,547,291 5,777,657 - 146,063,867 5,765,309
PRIOR PERIOD ADJUSTMENTS - - - 372,126 -
NET POSITION, BEGINNING OF YEAR, AS RESTATED 161,547,291 5,777,657 - 146,435,993 5,765,309
NET POSITION, END OF YEAR 153,332,586$ 4,764,258$ 858,586$ 161,547,291$ 5,777,657$
2016 2015
STATE OF ILLINOISCHICAGO STATE UNIVERSITY
STATEMENT OF REVENUES, EXPENSES AND CHANGES IN NET POSITIONFOR THE YEAR ENDED JUNE 30, 2016
(With Comparative Totals for the Year Ended June 30, 2015)
The accompanying Notes are an integral part of these financial statements.
16

2016 2015University University
CASH FLOWS FROM OPERATING ACTIVITIESStudent tuition and fees 26,612,905$ 27,807,039$ Grants and contracts 9,668,714 11,237,044 Payment to suppliers for goods and services (16,091,426) (15,679,609) Payments to employees for services (61,796,684) (67,378,680) Payments for scholarship and fellowship (8,933,884) (10,875,344) Loans issued to students and employees (139,408) (148,859) Loans collected from students 126,380 139,497 Sales and services of auxiliary enterprises 10,674,108 11,509,162 Other receipts (disbursements) (375,166) 231,286
Net cash used in operating activities (40,254,461) (43,158,464)
CASH FLOWS FROM NONCAPITAL FINANCING ACTIVITIESState appropriations 27,223,086 39,723,155 State nonoperating grants 2,511,182 5,509,228 Federal nonoperating grants 10,164,784 11,566,018
Net cash provided by noncapital financing activities 39,899,052 56,798,401
CASH FLOWS FROM CAPITAL FINANCING ACTIVITIESPurchases of capital assets (1,549,756) (6,521,591) Capital grants 325,738 4,251,113 Principal paid on capital debt and leases (1,327,297) (1,312,433) Interest paid on capital debt and leases (672,344) (730,673)
Net cash used in capital financing activities (3,223,659) (4,313,584)
CASH FLOWS FROM INVESTING ACTIVITIESInterest and/or dividends on investments 48,359 28,680 Proceeds from sales and maturities of investments 250,000 - Purchase of certificate of deposits - (250,000)
Net cash provided by (used in) investing activities 298,359 (221,320)
NET INCREASE (DECREASE) IN CASH AND CASH EQUIVALENTS (3,280,709) 9,105,033
CASH AND CASH EQUIVALENTS, BEGINNING OF YEAR 24,010,792 14,905,759
CASH AND CASH EQUIVALENTS, END OF YEAR 20,730,083$ 24,010,792$
RECONCILIATION OF OPERATING LOSS TONET CASH USED IN OPERATING ACTIVITIES:Operating loss (83,307,669)$ (97,862,853)$ Adjustments to reconcile operating loss to net cash used in operating activities:
Depreciation 6,115,677 6,263,385 Noncash for donated equipment (not capitalized) - 24,971 State fringe benefits 40,760,468 43,701,632
Changes in assets, deferred outflows of resources, and liabilities:Accounts receivables, net (421,920) 1,826,789 Inventories 5,705 14,842 Prepaid expenses and other assets 566,824 53,390 Deferred outflows for pension expense 31,106 53,349 Loans and notes receivable 84,882 18,055 Accounts payable and accrued liabilities (1,886,606) 3,173,699 Accrued wages (239,195) 176,908 Unearned revenue (529,976) 20,949 Accrued compensated absences (1,433,757) (623,580)
Net cash used in operating activities (40,254,461)$ (43,158,464)$
NONCASH INVESTING AND NONCAPITAL FINANCING ACTIVITIESCapital appropriations 334,375$ 8,701,904$ Capital grants and gifts - 543,590 State fringe benefits 40,760,468 43,701,632 Intangible capital asset - 495,055 Trade value received for capital assets - 9,500
STATE OF ILLINOISCHICAGO STATE UNIVERSITYSTATEMENT OF CASH FLOWS
FOR THE YEAR ENDED JUNE 30, 2016(With Comparative Totals for the Year Ended 2015)
The accompanying Notes are an integral part of these financial statements.
17
State of Illinois Chicago State University Notes to the Basic Financial Statements June 30, 2016 NOTE 1 - SUMMARY OF SIGNIFICANT ACCOUNTING POLICIES Nature of Operations - Chicago State University (the “University”) is a public, comprehensive, urban institution of higher learning located on the south side of Chicago. The University serves the State, national and international communities by providing its students with academic instruction, by conducting research and other activities that advance fundamental knowledge, and by disseminating knowledge to residents of the region, the State of Illinois and beyond.
The University was established in 1867 as an experimental teacher-training school. The Chicago State University Board of Trustees, established in January 1996 by an act of the Illinois General Assembly, governs the University. The Board consists of seven members appointed by the Governor and one student member elected by the student population.
Reporting Entity - The financial reporting entity, as defined by the Governmental Accounting Standards Board (GASB), consists of the primary government entity, organizations for which the primary government is financially accountable and other organizations for which the nature and significance of their relationship with the primary government are such that exclusion could cause the financial statements to be misleading or incomplete. Accordingly, the financial statements include the accounts of all agencies of Chicago State University, as the primary government, the accounts of the Chicago State University Foundation, the accounts of The University Foundation at Chicago State, (collectively the “Foundation”), and the accounts of the University Auxiliary Facilities System Revenue Bond Fund, Series 1998.
The Chicago State University Foundation (CSUF) was incorporated in December 1968, as an independent, charitable, educational, and non-profit 501(c)(3) corporation with the sole purpose of raising funds for the University to support programs and initiatives for which State general operating funds are not available. In addition, University employees and facilities are used for virtually all activities of the Foundation. CSUF was voluntarily dissolved on April 27, 2016. The University elected to terminate its contractual agreement with the CSUF effective June 30, 2015. The University Foundation at Chicago State (TUFCS), a new foundation, was established on March 24, 2015 for the purpose of providing the University’s students, faculty, and staff financial support through fund raising activities. TUFCS is a non-profit tax-exempt 501(c)(3) organization. The dissolution of CSUF and the transfer of its assets and related obligations to TUFCS has not yet been finalized as of fiscal year-end. Accordingly, CSUF and TUFCS are reported as discretely presented component units in the University’s financial statements.
18

State of Illinois Chicago State University Notes to the Basic Financial Statements June 30, 2016
Separate financial statements for the Foundations may be obtained at the Foundations’ administrative office: Executive Director, Chicago State University Foundation/The University Foundation at Chicago State, Cook Administration Building, 9501 South Martin Luther King Drive, Chicago, Illinois, 60628. The University (including the Foundations) is a component unit of the State of Illinois for financial reporting purposes. The financial balances and activities included in these financial statements are, therefore, also included in the State’s comprehensive annual financial report (CAFR). Financial Statement Presentation - The University follows the financial statement presentation requirements prescribed by GASB Statement No. 35, Basic Financial Statements – and Management’s Discussion and Analysis – for Public Colleges and Universities and subsequent amendments. This statement requires the University’s resources be classified into net position categories and reported in the Statement of Net Position. These categories are defined as (a) Net investment in capital assets (b) Restricted nonexpendable - net position restricted by externally imposed stipulations (c) Restricted expendable - net position subject to externally imposed restrictions that can be fulfilled by actions of the University pursuant to those stipulations or that expire by the passage of time and (d) Unrestricted - net position not subject to externally imposed stipulations but may be designated for specific purposes by action of the Board of Trustees. The University first applies restricted resources when an expense or outlay is incurred for purposes for which both restricted and unrestricted net position are available. The financial statements include certain prior period comparative information, which has been derived from the University’s 2015 financial statements. Such information does not include all of the information required to constitute a complete presentation in conformity with U.S. generally accepted accounting principles. Accordingly, such information should be read in conjunction with the University’s financial statements for the year ended June 30, 2015. Basis of Accounting - For financial reporting purposes, the University is considered a special-purpose government engaged only in business-type activities. Accordingly, the University’s financial statements have been presented using the economic resources measurement focus and the accrual basis of accounting. Under the accrual basis, revenues are recognized when earned and expenses are recorded when an obligation has been incurred. All significant intra-agency transactions have been eliminated. Use of Estimates - The preparation of financial statements in conformity with accounting principles generally accepted in the United States of America requires management to make estimates and assumptions that affect the reported amounts of assets and liabilities and disclosure of contingent assets and liabilities at the date of the financial statements and the
19

State of Illinois Chicago State University Notes to the Basic Financial Statements June 30, 2016
reported amounts of revenues and expenses during the reporting period. Actual results could differ from those estimates. Cash and Cash Equivalents - Cash equivalents are defined as short-term, highly liquid investments that are both readily convertible to known amounts of cash and so near to maturity that they present insignificant risk of changes in value because of changes in interest rates. The University considers all highly liquid investments with an original maturity of three months or less to be cash equivalents. Funds invested through the Illinois Funds are considered cash equivalents. Investments - The University accounts for its investments at fair value in accordance with GASB Statement No. 72, Fair Value Measurement and Application. Accordingly, the changes in fair value of investments are reported as an increase or decrease to investment assets and a component of investment income in the Statement of Revenues, Expenses and Changes in Net Position. Accounts Receivable - Accounts receivable consists of tuition and fee charges to students and auxiliary enterprise services provided to students, faculty, and staff, the majority of which reside in the State of Illinois. Accounts receivable also includes amounts due from federal, state and local governments, or private sources, in connection with the reimbursement of allowable expenditures made pursuant to the University’s grants and contracts. Accounts receivable is presented net of estimated uncollectible accounts. Allowances for doubtful accounts are charged against revenues when estimated or determined to be uncollectible. Inventories - Inventories are determined on the first in, first out (FIFO) method and stated at the lower of cost or market. The cost is recorded as an expense as the inventory is consumed. Prepaid Expenses and Other Assets - Prepaid expenses include amounts paid in advance for services benefitting future periods. Other assets consist of a meal plan deposit with the University’s food service provider. Capital Assets - Capital assets are recorded at cost at the date of acquisition, or fair market value at the date of donation in the case of gifts. For equipment, the University’s capitalization policy includes all items with a unit cost of $5,000 or more and an estimated useful life greater than one year. Intangible assets greater than $100,000 are capitalized. Renovations to buildings, infrastructure, and land improvements that significantly increase the value or extend the useful life of the structure are capitalized. Routine repairs and maintenance are charged to operating expenses in the year in which the expense is incurred. Depreciation is computed using the straight-line method over the estimated useful lives of the assets, generally 10 to 60 years for buildings, 5 to 50 years for infrastructure and site
20
State of Illinois Chicago State University Notes to the Basic Financial Statements June 30, 2016
improvements, 5 to 7 years for library books, and 3 to 15 years for equipment and intangible assets. Unearned Revenue - Unearned revenue includes amounts received for tuition and fees and certain auxiliary activities prior to the end of the fiscal year that are related to the subsequent accounting period. Unearned revenue also includes amounts received from grant and contract sponsors that have not yet been recognized because eligibility requirements have not been met. Accrued Compensated Absences - Employee sick and vacation pay is accrued at year-end for financial statement purposes. The liability and expense incurred are recorded at year-end as accrued compensated absences. Net accrued compensated absences charges are as follows:
2016 2015 Net Change Vacation leave $ 3,171,557 $ 4,340,883 $ (1,169,326) Sick leave 902,588 1,167,019 (264,431)
Total $ 4,074,145 $ 5,507,902 $ (1,433,757) Noncurrent Liabilities - Noncurrent liabilities include (1) principal amounts of revenue bonds payable, capital leases with contractual maturities greater than one year, and the implicit liability related to an intangible asset license in accordance with GASB Statement No. 51; (2) estimated amounts for accrued compensated absences and other liabilities that will not be paid within the next fiscal year; and (3) the premium on the revenue bonds payable (which are being amortized over the term of the bonds using the straight line method). Pensions - For purposes of measuring the net pension liability, deferred outflows of resources and deferred inflows of resources related to pensions, and pension expense, information about the plan net position of the State Universities Retirement System (SURS) and additions to/deductions from SURS’ plan net position has been determined on the same basis as they are reported by SURS. For this purpose, benefit payments (including refunds of employee contributions) are recognized when due and payable in accordance with the benefit terms. Investments are reported at fair value. For the purposes of financial reporting, the State of Illinois and participating employers are considered to be under a special funding situation. A special funding situation is defined as a circumstance in which a non-employer entity is legally responsible for making contributions directly to a pension plan that is used to provide pensions to the employees of another entity or entities and either (1) the amount of the contributions for which the non-employer entity is
21
State of Illinois Chicago State University Notes to the Basic Financial Statements June 30, 2016
legally responsible is not dependent upon one or more events unrelated to pensions or (2) the non-employer is the only entity with a legal obligation to make contributions directly to a pension plan. The State of Illinois is considered a non-employer contributing entity. Participating employers are considered employer contributing entities. Scholarship Allowances and Student Aid - Financial aid to students is reported in the financial statements and is calculated by the alternative method as prescribed by the National Association of College and University Business Officers (NACUBO). Certain aid, such as loans and funds provided to students as awarded by third parties and Federal Direct Lending, are accounted for as a third party payment (credited to the student’s account as if the student made the payment). All other aid is reflected in the financial statements as operating expenses or scholarship allowances, which reduce revenues. The amount reported as an operating expense represents the portion of the aid provided to the student in the form of cash. Scholarship allowances represent the portion of aid provided to the student in the form of reduced tuition. Under the alternative method, these amounts are computed on a university basis by allocating the cash payments to students, excluding payments for the services, calculated by a ratio of total aid to the aid not considered to be third party aid.
Net Position - GASB Statement No. 63 reports equity as “Net Position.” The University’s net position is classified as follows:
Net investment in capital assets - This represents the University’s total investment in capital assets, net of accumulated depreciation and outstanding debt obligations related to those capital assets. To the extent debt has been incurred, but not yet expended for capital assets, such amounts are not included as a component of “net investment in capital assets.”
Restricted net position - nonexpendable - Nonexpendable restricted net position consists of endowment and similar type funds in which donors or other outside sources have stipulated, as a condition of the gift instrument, that the principal is to be maintained inviolate and in perpetuity, and invested for the purpose of producing present and future income, which may either be expended or added to the principal. Restricted net position - expendable - Restricted expendable net position include resources in which the University is legally or contractually obligated to spend in accordance with restrictions imposed by external third parties.
Unrestricted net position - Unrestricted net position represents resources derived from student tuition and fees, sales and service of educational departments and auxiliary enterprises, and unrestricted gifts from donors. These resources are used for transactions relating to the educational and general operations of the University and Foundations and may be used at the discretion of the governing board to meet current expenses for any
22
State of Illinois Chicago State University Notes to the Basic Financial Statements June 30, 2016
purpose. These resources also include auxiliary enterprises, which are substantially self-supporting activities that provide services for students, faculty and staff.
Income Taxes - The University, as a political subdivision of the State of Illinois, is excluded from Federal income taxes under Section 115(1) of the Internal Revenue code, as amended. The Foundations are exempt from income taxes under Section 501(c)(3) of the Internal Revenue code.
Classification of Revenues - The University has classified its revenues as either operating or nonoperating revenues according to the following criteria:
Operating revenues - Operating revenues include activities that have the characteristics of exchange transactions, such as (1) student tuition and fees, net of scholarship discounts and allowances, (2) sales and services of auxiliary enterprises, net of scholarship discounts and allowances, (3) certain federal, state and local grants and contracts, and (4) interest on institutional student loans. Nonoperating revenues - Nonoperating revenues include activities that have the characteristics of nonexchange transactions, such as gifts and contributions, and other revenue sources that are defined as nonoperating revenues by GASB Statement Nos. 9, 24 and 35, such as State appropriations, pass-through grants, and investment income.
New Accounting Pronouncements - The University adopted the provisions of GASB Statements No. 72, Fair Value Measurement and Application and No. 76, The Hierarchy of Generally Accepted Accounting Principles for State and Local Governments during the fiscal year ended June 30, 2016. GASB Statement No. 72 requires the University to use valuation techniques that are appropriate under the circumstances and for which sufficient data are available to measure fair value. GASB Statement No. 76 requires the University to identify the hierarchy of generally accepted accounting principles (GAAP). The Statement reduces the GAAP hierarchy to two categories of authoritative GAAP. The impact of adoption of these statements has been deemed to be minimal to the reporting of the University. In addition, the University will be required to implement GASB Statements No. 73, Accounting and Financial Reporting for Pensions and Related Assets That Are Not Within the Scope of GASB Statement 68, and Amendments to Certain Provisions of GASB Statements 67 and 68, No. 74, Financial Reporting for Postemployment Benefit Plans Other Than Pension Plans, and No. 77, Tax Abatement Disclosures, in Fiscal Year 2017, and Statements No. 75, Accounting and Financial Reporting for Postemployment Benefits Other Than Pensions, No. 81, Irrevocable Split-Interest Agreements, No. 82, Pension Issuesan amendment of GASB Statements No. 67, No. 68, and No. 73, and No. 83, Certain Asset Retirement Obligations in Fiscal Year 2018. The University has not yet evaluated the impact of adopting future pronouncements on its financial statements.
23
State of Illinois Chicago State University Notes to the Basic Financial Statements June 30, 2016
NOTE 2 - DEPOSITS AND INVESTMENTS GASB Statement No. 40, Deposit and Investment Risk Disclosures requires general disclosures by investment type with disclosures of the specific risk exposures of those investments. Investments exposed to credit risk, custodial credit risk, concentration of credit risk, interest rate risk, and foreign currency risk must be disclosed, and the deposit and investment policies (or the lack of a policy) that relate to these risks must be described if the reporting entity is exposed to them. The Public Funds Investment Act (30 ILCS 235) authorized the University and its Board of Trustees to invest in bonds, notes, certificates of indebtedness, treasury bills, or other securities guaranteed by the United States; interest-bearing savings accounts, certificates of deposit, interest-bearing deposits, or any other investment that constitutes direct obligations of any bank; short-term discount obligations of the Federal National Mortgage Association; shares or other securities legally issued by certain state or federal savings and loan associations; insured dividend-bearing share accounts and certain other accounts of chartered credit unions; certain money market mutual funds; the Illinois Funds Money Market Funds; and repurchase agreements that meet certain instrument and transaction requirements. The Foundation is not subject to such restrictions. Cash Equity with State Treasurer - The State Treasurer is the custodian of the State’s cash and cash equivalents for funds maintained in the State Treasury. Deposits in custody of the State Treasurer are pooled and invested with other State funds in accordance with the Deposit of State Moneys Act (15 ILCS 520/11). Funds held by the State Treasurer have not been categorized as to credit risk because the University does not own individual securities. Details on the nature of these deposits and investments are available within the State of Illinois’ Comprehensive Annual Financial Report. Deposits - At June 30, 2016, the carrying amount of the University and the TUFCS deposits with private financial institutions were $19,121,592 and $843,590, respectively. This amount consisted of cash and certificates of deposit deposited with the financial institutions. For financial reporting purposes, these deposits have been classified as cash and cash equivalents or investments, depending upon the original maturity of the financial instrument. Carrying amounts at year-end of the above deposits, pooled investments and cash on hand consisted of:
24

State of Illinois Chicago State University Notes to the Basic Financial Statements June 30, 2016
University TUFCS Carrying Bank Carrying Bank Amount Balance Amount Balance
Deposit Type Cash in bank $ 4,614,252 $6,433,239 $ 843,590 $ 843,590Add: Investments classified as cash equivalents (maturity < 90 90 days) - Illinois Funds - Standard & Poors AAAm 14,476,552 Add: Cash on hand 30,788 Less: Certificates of deposit classified as investments (maturity > 90 days)
Total cash and cash equivalents $19,121,592 $ 843,590 Carrying Amount University TUFCS
Cash and cash equivalents $16,967,411 $ 53,693Cash and cash equivalents - restricted 2,154,181 789,897
Total $19,121,592 $ 843,590 Custodial Credit Risk - Custodial credit risk is the risk that in the event of a bank failure, deposits may not be returned. The University requires that balances on deposit with financial institutions be either insured by the Federal Deposit Insurance Corporation (FDIC), collateralized by securities held by the Federal Reserve Bank, or invested in U.S. Government obligations, in the University’s name. The University maintains cash deposits at certain Chicago-area financial institutions. The FDIC insured bank balances totaled $1,250,000 for the University and TUFCS at June 30, 2016. Another $6,026,829 in bank balances were covered by pledged collateral in the University’s and TUFCS’ name. Interest Rate Risk - Interest rate risk exists when there is a possibility that changes in interest rates could adversely affect an investment’s value. The Illinois Funds has a weighted average maturity of less than one year. Investments The carrying value (and market value) of the investment portfolio of the CSUF and University at June 30, 2016 consisted of the following:
25

State of Illinois Chicago State University Notes to the Basic Financial Statements June 30, 2016
University CSUF Fair Value Fair Value
Equity securities $ $ 5,036,281Illinois Funds (Standard & Poors AAAm) 14,476,552 Total 14,476,552 5,036,281Less: Investments classified as cash equivalents (maturity < 90 days) (14,476,552) Total investments $ $ 5,036,281 In accordance with GASB Statement No. 72, the fair value of investments is further categorized by levels depending on the type of inputs used for their valuation. Level 1: Unadjusted quoted prices for identical assets in active markets that are
accessible at the date of measurement.
Level 2: Quoted prices for similar assets in active markets, quoted prices for identical or similar assets in markets that are not active, or inputs that are observable, either directly or indirectly, for substantially the full term of the assets.
Level 3: Prices or valuation techniques that require inputs that are both significant to the fair value measurement and unobservable (that is, the inputs are supported by little or no market activity).
The fair value of CSUF’s shares of security funds is based on an observable unadjusted quoted market price in an active market therefore this investment has been categorized as Level 1 in the fair value hierarchy. Concentration of Credit Risk - Concentration of credit risk is the risk of loss attributed to the magnitude of an agency’s investment in a single user. All investments are insured or registered and held by CSUF or its agent in CSUF’s name. CSUF does not have a policy limiting its exposure to concentration of credit risk. Credit Risk - Credit risk is the risk that an issuer or other counterparty to a debt investment will not fulfill its obligation. CSUF’s statement of investment objectives and guidelines states that investments in non-convertible fixed income securities other than short-term securities will be restricted to issues within a maximum fixed or expected average maturity of ten years and will be made primarily in (1) securities issued or guaranteed by the U.S. government or its agencies, (2) marketable issues of non-nuclear utility companies rated at the time of purchase within the three highest grades assigned by Moody’s Investor Services, Inc. (Aaa, Aa, or A) or by Standard & Poors (AAA, AA or A), and (3) bond mutual funds which invest primarily in bonds with rating of A and higher. The University’s Funds
26
State of Illinois Chicago State University Notes to the Basic Financial Statements June 30, 2016
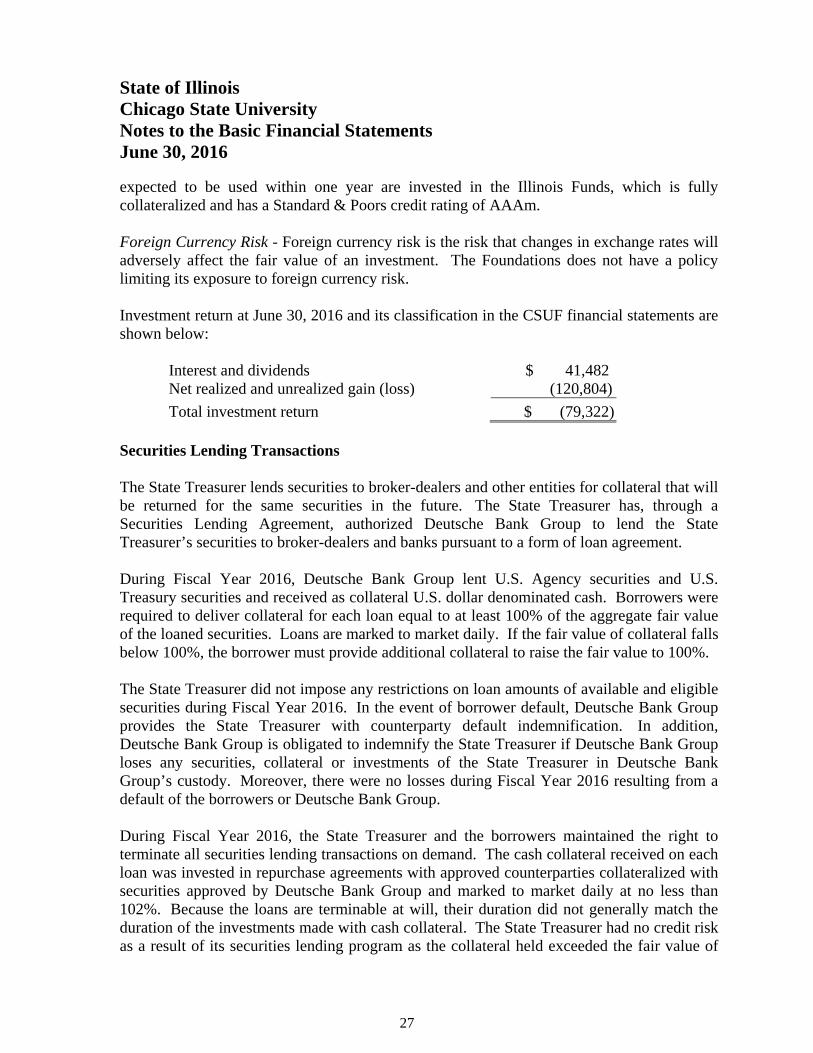
expected to be used within one year are invested in the Illinois Funds, which is fully collateralized and has a Standard & Poors credit rating of AAAm. Foreign Currency Risk - Foreign currency risk is the risk that changes in exchange rates will adversely affect the fair value of an investment. The Foundations does not have a policy limiting its exposure to foreign currency risk. Investment return at June 30, 2016 and its classification in the CSUF financial statements are shown below:
Interest and dividends $ 41,482 Net realized and unrealized gain (loss) (120,804)
Total investment return $ (79,322) Securities Lending Transactions The State Treasurer lends securities to broker-dealers and other entities for collateral that will be returned for the same securities in the future. The State Treasurer has, through a Securities Lending Agreement, authorized Deutsche Bank Group to lend the State Treasurer’s securities to broker-dealers and banks pursuant to a form of loan agreement. During Fiscal Year 2016, Deutsche Bank Group lent U.S. Agency securities and U.S. Treasury securities and received as collateral U.S. dollar denominated cash. Borrowers were required to deliver collateral for each loan equal to at least 100% of the aggregate fair value of the loaned securities. Loans are marked to market daily. If the fair value of collateral falls below 100%, the borrower must provide additional collateral to raise the fair value to 100%. The State Treasurer did not impose any restrictions on loan amounts of available and eligible securities during Fiscal Year 2016. In the event of borrower default, Deutsche Bank Group provides the State Treasurer with counterparty default indemnification. In addition, Deutsche Bank Group is obligated to indemnify the State Treasurer if Deutsche Bank Group loses any securities, collateral or investments of the State Treasurer in Deutsche Bank Group’s custody. Moreover, there were no losses during Fiscal Year 2016 resulting from a default of the borrowers or Deutsche Bank Group. During Fiscal Year 2016, the State Treasurer and the borrowers maintained the right to terminate all securities lending transactions on demand. The cash collateral received on each loan was invested in repurchase agreements with approved counterparties collateralized with securities approved by Deutsche Bank Group and marked to market daily at no less than 102%. Because the loans are terminable at will, their duration did not generally match the duration of the investments made with cash collateral. The State Treasurer had no credit risk as a result of its securities lending program as the collateral held exceeded the fair value of
27
State of Illinois Chicago State University Notes to the Basic Financial Statements June 30, 2016
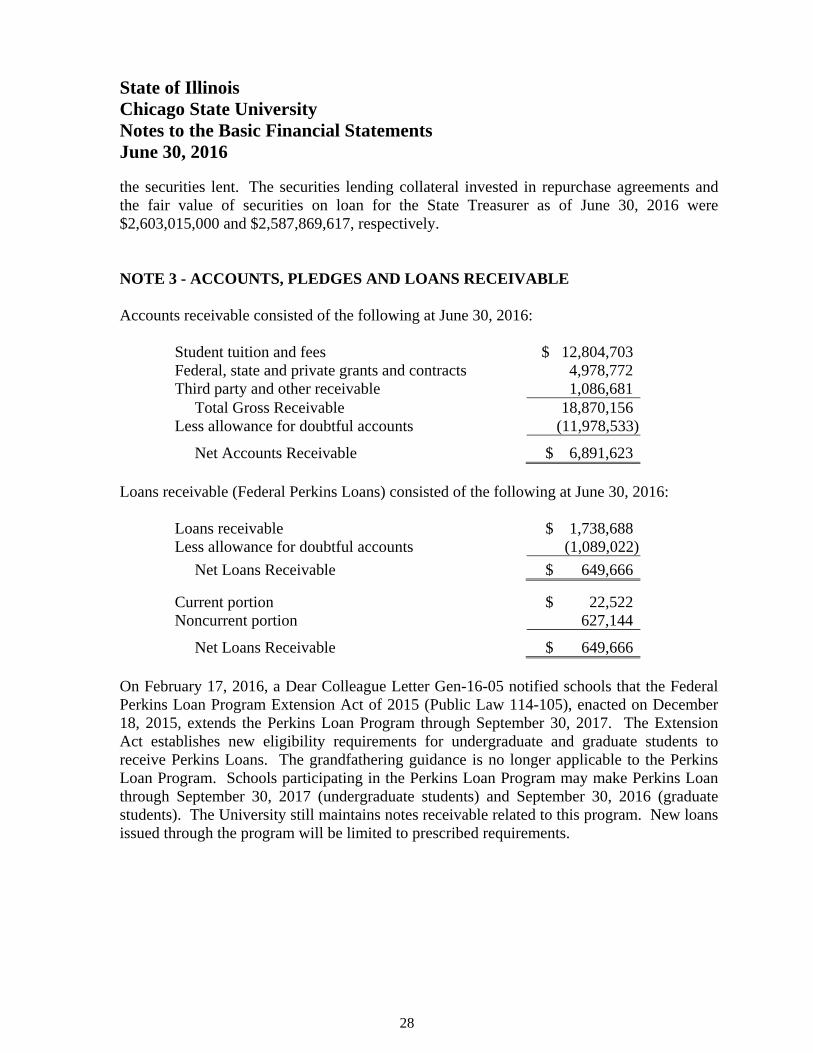
the securities lent. The securities lending collateral invested in repurchase agreements and the fair value of securities on loan for the State Treasurer as of June 30, 2016 were $2,603,015,000 and $2,587,869,617, respectively. NOTE 3 - ACCOUNTS, PLEDGES AND LOANS RECEIVABLE Accounts receivable consisted of the following at June 30, 2016:
Student tuition and fees $ 12,804,703 Federal, state and private grants and contracts 4,978,772 Third party and other receivable 1,086,681 Total Gross Receivable 18,870,156 Less allowance for doubtful accounts (11,978,533)
Net Accounts Receivable $ 6,891,623 Loans receivable (Federal Perkins Loans) consisted of the following at June 30, 2016:
Loans receivable $ 1,738,688 Less allowance for doubtful accounts (1,089,022)
Net Loans Receivable $ 649,666
Current portion $ 22,522 Noncurrent portion 627,144
Net Loans Receivable $ 649,666 On February 17, 2016, a Dear Colleague Letter Gen-16-05 notified schools that the Federal Perkins Loan Program Extension Act of 2015 (Public Law 114-105), enacted on December 18, 2015, extends the Perkins Loan Program through September 30, 2017. The Extension Act establishes new eligibility requirements for undergraduate and graduate students to receive Perkins Loans. The grandfathering guidance is no longer applicable to the Perkins Loan Program. Schools participating in the Perkins Loan Program may make Perkins Loan through September 30, 2017 (undergraduate students) and September 30, 2016 (graduate students). The University still maintains notes receivable related to this program. New loans issued through the program will be limited to prescribed requirements.
28

State of Illinois Chicago State University Notes to the Basic Financial Statements June 30, 2016 NOTE 4 - CAPITAL ASSETS Following are the changes in capital assets for the year ended June 30, 2016:
Amount in thousands
Balance
June 30, 2015 Additions Retirements Net
Transfers Balance
June 30, 2016Capital assets not being depreciated:
Land $ 9,611 $ $ $ $ 9,611 Work of art 41 41 Construction in progress 21,003 988 (8,341) 13,650
Total capital assets not being depreciated 30,655 988 (8,341) 23,302 Other capital assets: Site improvements 15,005 15,005 Buildings and building improvements 179,509 50 8,306 187,865 Equipment 19,350 339 (538) 35 19,186 Intangible assets 1,176 314 1,490 Library books 13,111 149 13,260 Capital leases - equipment 296 44 340
Total other capital assets 228,447 896 (538) 8,341 237,146 Less accumulated depreciation (100,185) (6,115) 535 (105,765)Total other capital assets, net 128,262 (5,219) (3) 131,381
Capital assets, net $ 158,917 $ (4,231) $ (3) $ $ 154,683
NOTE 5 - ACCRUED WAGES Accrued wages includes employee contracts for certain academic personnel that provide for twelve monthly salary payments, although the contracted services are rendered during a nine-month period, and services provided by hourly employees that were paid after June 30. The liability for those employees who are on a deferred pay schedule and those that have completed their contracted services, but have not yet received final payment totaled $2,143,411 at June 30, 2016. Accrued wages also includes unpaid insurance benefits as of June 30, 2016 totaling $403,907. NOTE 6 - UNEARNED REVENUE Unearned revenue consists of the following at June 30, 2016:
Tuition and fees $ 588,104 Grants and contracts 2,017,804
Total Unearned Revenue $ 2,605,908
29
State of Illinois Chicago State University Notes to the Basic Financial Statements June 30, 2016
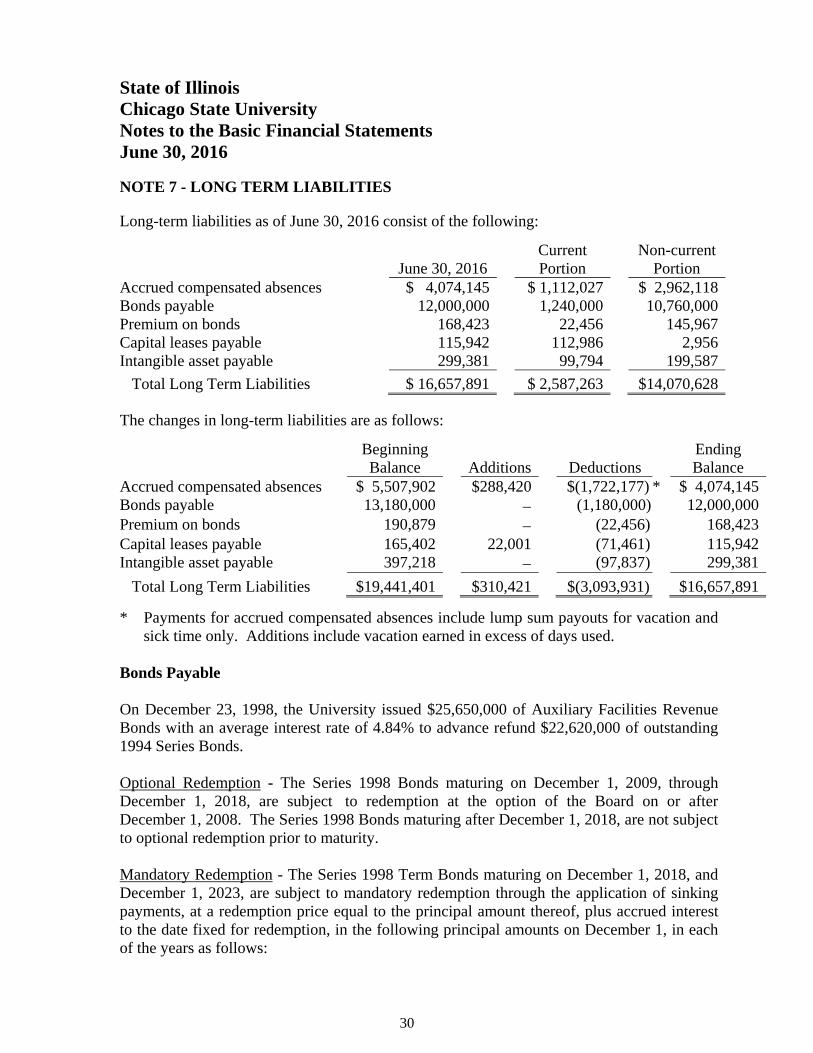
NOTE 7 - LONG TERM LIABILITIES Long-term liabilities as of June 30, 2016 consist of the following:
Current Non-current June 30, 2016 Portion Portion
Accrued compensated absences $ 4,074,145 $ 1,112,027 $ 2,962,118Bonds payable 12,000,000 1,240,000 10,760,000Premium on bonds 168,423 22,456 145,967Capital leases payable 115,942 112,986 2,956Intangible asset payable 299,381 99,794 199,587
Total Long Term Liabilities $ 16,657,891 $ 2,587,263 $14,070,628 The changes in long-term liabilities are as follows:
Beginning Ending Balance Additions Deductions Balance
Accrued compensated absences $ 5,507,902 $288,420 $(1,722,177) * $ 4,074,145Bonds payable 13,180,000 (1,180,000) 12,000,000Premium on bonds 190,879 (22,456) 168,423Capital leases payable 165,402 22,001 (71,461) 115,942Intangible asset payable 397,218 (97,837) 299,381
Total Long Term Liabilities $19,441,401 $310,421 $(3,093,931) $16,657,891 * Payments for accrued compensated absences include lump sum payouts for vacation and
sick time only. Additions include vacation earned in excess of days used. Bonds Payable On December 23, 1998, the University issued $25,650,000 of Auxiliary Facilities Revenue Bonds with an average interest rate of 4.84% to advance refund $22,620,000 of outstanding 1994 Series Bonds. Optional Redemption - The Series 1998 Bonds maturing on December 1, 2009, through December 1, 2018, are subject to redemption at the option of the Board on or after December 1, 2008. The Series 1998 Bonds maturing after December 1, 2018, are not subject to optional redemption prior to maturity. Mandatory Redemption - The Series 1998 Term Bonds maturing on December 1, 2018, and December 1, 2023, are subject to mandatory redemption through the application of sinking payments, at a redemption price equal to the principal amount thereof, plus accrued interest to the date fixed for redemption, in the following principal amounts on December 1, in each of the years as follows:
30
State of Illinois Chicago State University Notes to the Basic Financial Statements June 30, 2016
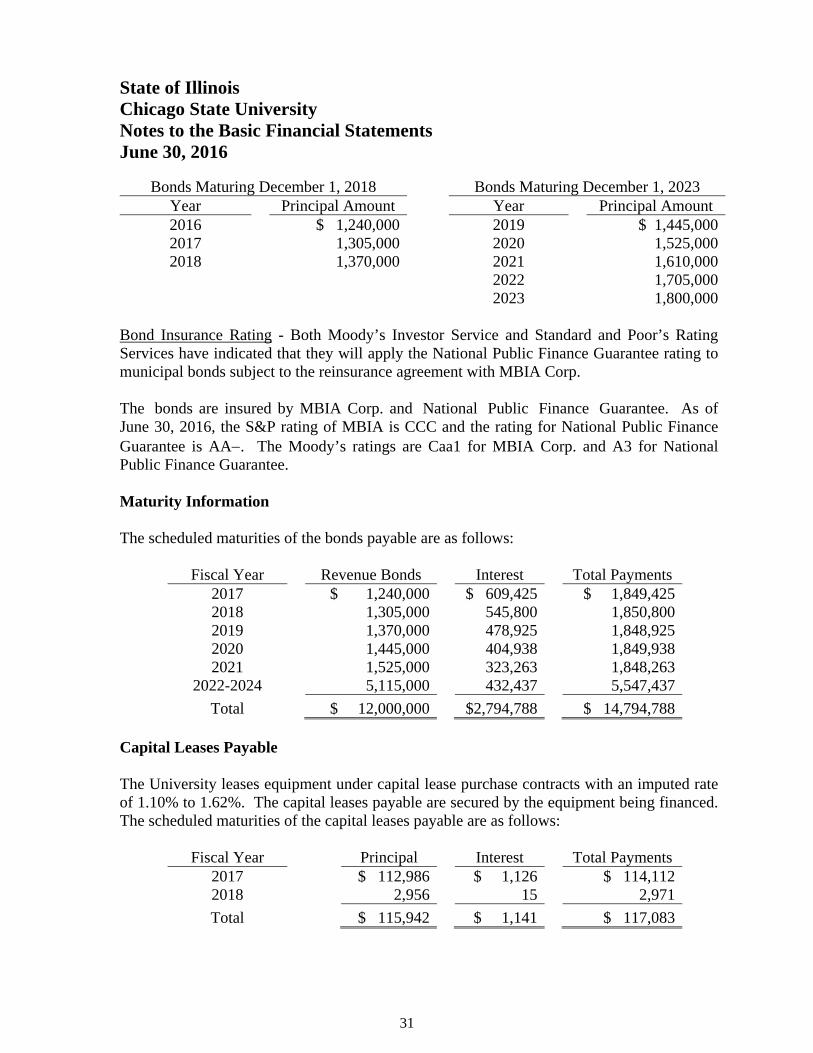
Bonds Maturing December 1, 2018 Bonds Maturing December 1, 2023 Year Principal Amount Year Principal Amount 2016 $ 1,240,000 2019 $ 1,445,0002017 1,305,000 2020 1,525,0002018 1,370,000 2021 1,610,000
2022 1,705,000 2023 1,800,000
Bond Insurance Rating - Both Moody’s Investor Service and Standard and Poor’s Rating Services have indicated that they will apply the National Public Finance Guarantee rating to municipal bonds subject to the reinsurance agreement with MBIA Corp. The bonds are insured by MBIA Corp. and National Public Finance Guarantee. As of June 30, 2016, the S&P rating of MBIA is CCC and the rating for National Public Finance Guarantee is AA. The Moody’s ratings are Caa1 for MBIA Corp. and A3 for National Public Finance Guarantee. Maturity Information The scheduled maturities of the bonds payable are as follows:
Fiscal Year Revenue Bonds Interest Total Payments 2017 $ 1,240,000 $ 609,425 $ 1,849,4252018 1,305,000 545,800 1,850,8002019 1,370,000 478,925 1,848,9252020 1,445,000 404,938 1,849,9382021 1,525,000 323,263 1,848,263
2022-2024 5,115,000 432,437 5,547,437
Total $ 12,000,000 $2,794,788 $ 14,794,788 Capital Leases Payable The University leases equipment under capital lease purchase contracts with an imputed rate of 1.10% to 1.62%. The capital leases payable are secured by the equipment being financed. The scheduled maturities of the capital leases payable are as follows:
Fiscal Year Principal Interest Total Payments 2017 $ 112,986 $ 1,126 $ 114,1122018 2,956 15 2,971
Total $ 115,942 $ 1,141 $ 117,083
31

State of Illinois Chicago State University Notes to the Basic Financial Statements June 30, 2016
Intangible Asset Payable In accordance with GASB Statement No. 51, the University has recorded a liability for future payments under a license agreement with a software vendor dated December 22, 2014. The license agreement is for 60 months and requires various payments over the term of the agreement and at certain milestones. Implicit interest is considered immaterial. The scheduled maturities of the intangible asset payable are as follows :
Fiscal Year Principal Interest Total Payments 2017 $ 99,794 $ $ 99, 7942018 99,794 99,7942019 99,793 99,793
Total $ 299,381 $ $ 299,381 NOTE 8 - NATURAL CLASSIFICATIONS The University’s operating expenses by natural classification were as follows:
Compensation and benefits $ 100,915,306Contractual services 12,081,833Commodities 1,080,344Awards and grants 8,949,904Telecommunication 615,933Other operating expenses 983,219Depreciation 6,115,677
Total Operating Expenses $ 130,742,216 NOTE 9 - STATE FRINGE BENEFITS GASB Statement No. 24, Accounting and Financial Reporting for Certain Grants and Other Financial Assistance requires the University to report “on-behalf payments” for fringe benefits and salaries by legally separate entities as revenue and expenditures of the University. The University reported group insurance on-behalf payments of $11,647,516 for the year ended June 30, 2016. The University also reported on-behalf payments of $29,112,952 for its proportionate share of the State’s collective pension expense as described in Note 10. The on-behalf payments amount that relates to State group health insurance is an allocation of estimated costs incurred by the Department of Central Management Services on-behalf of the University. On-behalf payments for fringe benefits are reflected as nonoperating revenues and corresponding on-behalf expense is reflected as an operating expense.
32
State of Illinois Chicago State University Notes to the Basic Financial Statements June 30, 2016 NOTE 10 - DEFINED BENEFIT PENSION PLAN General Information about the Pension Plan Plan Description - The University contributes to the State Universities Retirement System of Illinois (SURS), a cost-sharing multiple-employer defined benefit plan with a special funding situation whereby the State of Illinois (State) makes substantially all actuarially determined required contributions on behalf of the participating employers. SURS was established July 21, 1941 to provide retirement annuities and other benefits for staff members and employees of State universities, certain affiliated organizations, and certain other State educational and scientific agencies and for survivors, dependents, and other beneficiaries of such employees. SURS is considered a component unit of the State’s financial reporting entity and is included in the State’s financial reports as a pension trust fund. SURS is governed by Chapter 40, Act 5, Article 15 of the Illinois Compiled Statutes. SURS issues a publicly available financial report that includes financial statements and required supplementary information. That report may be obtained by accessing the website at www.SURS.org. Benefits Provided - A traditional benefit plan was established in 1941. Public Act 90-0448 enacted effective January 1, 1998, established an alternative defined benefit program known as the portable benefit package. The traditional and portable plan Tier 1 refers to members that began participation prior to January 1, 2011. Public Act 96-0889 revised the traditional and portable benefit plans for members who begin participation on or after January 1, 2011, and who do not have other eligible Illinois reciprocal system services. The revised plan is referred to as Tier 2. New employees are allowed 6 months after their date of hire to make an irrevocable election. A summary of the benefit provisions as of June 30, 2015 can be found in the System’s comprehensive annual financial report (CAFR) Notes to the Financial Statements. Contributions - The State of Illinois is primarily responsible for funding the System on behalf of the individual employers at an actuarially determined amount. Public Act 88-0593 provides a Statutory Funding Plan consisting of two parts: (i) a ramp-up period from 1996 to 2010 and (ii) a period of contributions equal to a level percentage of the payroll of active members of the System to reach 90% of the total Actuarial Accrued Liability by the end of Fiscal Year 2045. Employer contributions from “trust, federal, and other funds” are provided under Section 15-155(b) of the Illinois Pension Code and require employers to pay contributions which are sufficient to cover the accruing normal costs on behalf of applicable employees. The employer normal cost for Fiscal Year 2015 and 2016 respectively, was 11.71% and 12.69% of employee payroll. The normal cost is equal to the value of current year’s pension benefit and does not include any allocation for the past unfunded liability or interest on the unfunded liability. Plan members are required to contribute 8.0% of their
33

State of Illinois Chicago State University Notes to the Basic Financial Statements June 30, 2016
annual covered salary. The contribution requirements of plan members and employers are established and may be amended by the Illinois General Assembly. Participating employers make contributions toward separately financed specific liabilities under Section 15.139.5(e) of the Illinois Pension Code (relating to contributions payable due to the employment of “affected annuitants” or specific return to work annuitants) and Section 15.155(g) (relating to contributions payable due to earning increases exceeding 6% during the final rate of earnings period). Pension Liabilities, Expense, and Deferred Outflows of Resources and Deferred Inflows of Resources Related to Pensions Net Pension Liability At June 30, 2015, SURS reported a net pension liability (NPL) of $23,756,361,087. The net pension liability was measured as of June 30, 2014. Employer Proportionate Share of Net Pension Liability The amount of the proportionate share of the net pension liability to be recognized for the University is $0. The proportionate share of the State’s net pension liability associated with the University is $346,747,343 or 1.4596%. This amount is not recognized in the University’s financial statement. The net pension liability and total pension liability as of June 30, 2015, was determined based on the June 30, 2014 actuarial valuation rolled forward. The basis of allocation used in the proportionate share of net pension liability is the actual reported pensionable contributions made to SURS during Fiscal Year 2015. Pension Expense At June 30, 2015 SURS reported a collective net pension expense of $1,994,587,170. Employer Proportionate Share of Pension Expense The University’s proportionate share of collective pension expense is recognized similarly to on-behalf payments as both revenue and matching expenditure in the financial statements. The basis of allocation used for the proportionate share of collective pension expense is the actual reported pensionable contributions made to SURS during Fiscal Year 2015. As a result, the University recognized on-behalf revenue and pension expense of $29,112,952 for the fiscal year ended June 30, 2016. Deferred Outflows of Resources and Deferred Inflows of Resources Related to Pensions Deferred outflows of resources are the consumption of net position by the System that is applicable to future reporting periods.
34

State of Illinois Chicago State University Notes to the Basic Financial Statements June 30, 2016 SURS Collective Deferred Outflows and Deferred Inflows of Resources by Sources:
Deferred Outflows Deferred Inflows of Resources of Resources
Difference between expected and actual experience $ 27,312,043 $ Changes in assumption 609,393,909 Net difference between projected and actual earnings on pension plan investments 593,840,642 953,329,464
Total $ 1,230,546,594 $ 953,329,464 SURS Collective Deferred Outflows and Deferred Inflows of Resources by Year to be Recognized in Future Pension Expenses:
Year Ending June 30
Net Deferred Outflows of Resources
2016 $ 154,951,3262017 118,957,7202018 (145,152,075)2019 148,460,1592020
Thereafter
Total $ 277,217,130 Employer Deferral of Fiscal Year 2016 Pension Expenses The University paid $287,671 in federal, trust or grant contributions for the fiscal year ended June 30, 2016. These contributions were made subsequent to the pension liability measurement date of June 30, 2015 and are recognized as deferred outflows of resources as of June 30, 2016. Assumptions and Other Inputs Actuarial assumptions - The actuarial assumptions used in the June 30, 2015 valuation were based on the results of an actuarial experience study for the period June 30, 2010 - 2014. The total pension liability in the June 30, 2015 actuarial valuation was determined using the following actuarial assumptions, applied to all periods included in the measurement: Inflation 2.75 percent Salary increases 3.75 to 12.00 percent, including inflation Investment rate of return 7.25 percent beginning with the actuarial valuation as of June 30, 2014
35
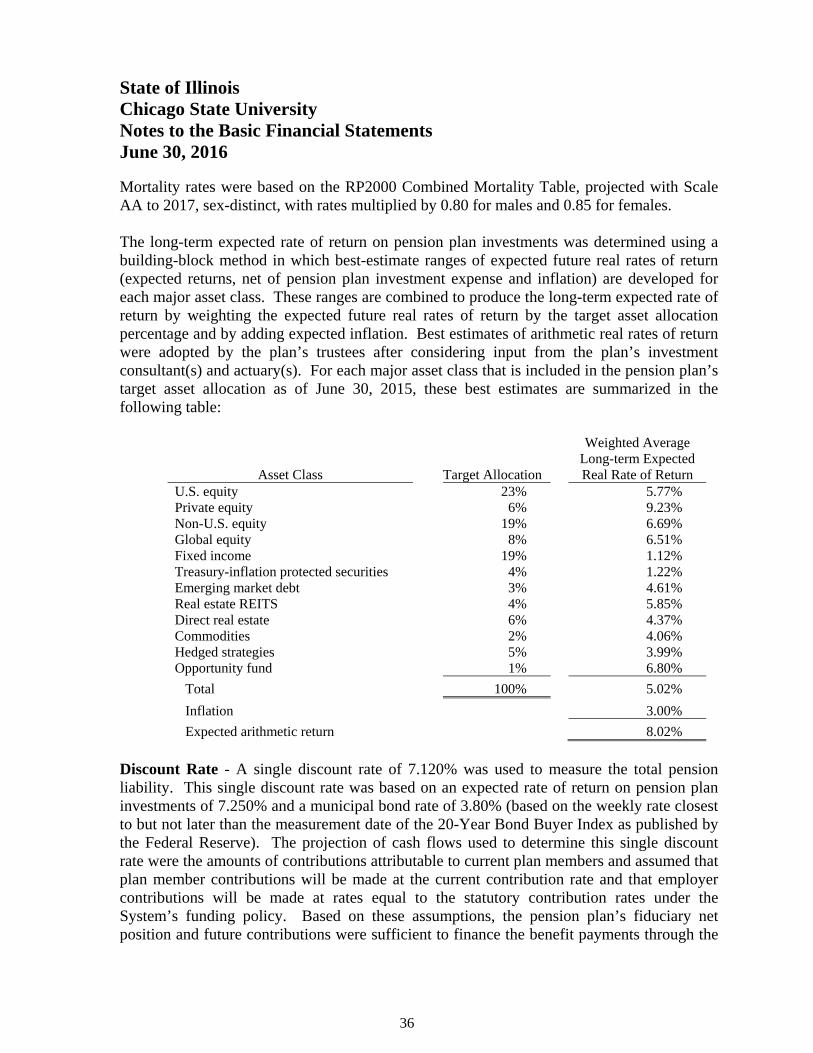
State of Illinois Chicago State University Notes to the Basic Financial Statements June 30, 2016
Mortality rates were based on the RP2000 Combined Mortality Table, projected with Scale AA to 2017, sex-distinct, with rates multiplied by 0.80 for males and 0.85 for females. The long-term expected rate of return on pension plan investments was determined using a building-block method in which best-estimate ranges of expected future real rates of return (expected returns, net of pension plan investment expense and inflation) are developed for each major asset class. These ranges are combined to produce the long-term expected rate of return by weighting the expected future real rates of return by the target asset allocation percentage and by adding expected inflation. Best estimates of arithmetic real rates of return were adopted by the plan’s trustees after considering input from the plan’s investment consultant(s) and actuary(s). For each major asset class that is included in the pension plan’s target asset allocation as of June 30, 2015, these best estimates are summarized in the following table:
Weighted Average Long-term Expected
Asset Class Target Allocation Real Rate of Return U.S. equity 23% 5.77% Private equity 6% 9.23% Non-U.S. equity 19% 6.69% Global equity 8% 6.51% Fixed income 19% 1.12% Treasury-inflation protected securities 4% 1.22% Emerging market debt 3% 4.61% Real estate REITS 4% 5.85% Direct real estate 6% 4.37% Commodities 2% 4.06% Hedged strategies 5% 3.99% Opportunity fund 1% 6.80%
Total 100% 5.02%
Inflation 3.00%
Expected arithmetic return 8.02%
Discount Rate - A single discount rate of 7.120% was used to measure the total pension liability. This single discount rate was based on an expected rate of return on pension plan investments of 7.250% and a municipal bond rate of 3.80% (based on the weekly rate closest to but not later than the measurement date of the 20-Year Bond Buyer Index as published by the Federal Reserve). The projection of cash flows used to determine this single discount rate were the amounts of contributions attributable to current plan members and assumed that plan member contributions will be made at the current contribution rate and that employer contributions will be made at rates equal to the statutory contribution rates under the System’s funding policy. Based on these assumptions, the pension plan’s fiduciary net position and future contributions were sufficient to finance the benefit payments through the
36

State of Illinois Chicago State University Notes to the Basic Financial Statements June 30, 2016
year 2072. As a result, the long-term expected rate of return on pension plan investments was applied to projected benefit payments through the year 2072, and the municipal bond rate was applied to all benefit payments after that date. Sensitivity of the System’s Net Pension Liability to Changes in the Discount Rate - Regarding the sensitivity of the net pension liability to changes in the single discount rate, the following presents the plan’s net pension liability, calculated using a single discount rate of 7.12%, as well as what the plan’s net pension liability would be if it were calculated using a single discount rate that is 1-percentage-point lower or 1-percentage-point higher:
Current Single Discount 1% Decrease Rate Assumption 1% Increase
6.12% 7.12% 8.12%
$ 28,929,333,917 $ 23,756,361,087 $ 19,470,982,362 Additional information regarding the SURS basic financial statements including the Plan Net Position can be found in the SURS comprehensive annual financial report by accessing the website at www.SURS.org. NOTE 11 - POSTEMPLOYMENT BENEFITS The State provides health, dental, vision, and life insurance benefits for retirees and their dependents in a program administered by the Department of Central Management Services. Substantially all State employees become eligible for post-employment benefits if they eventually become annuitants of one of the State sponsored pension plans. Health, dental, and vision benefits include basic benefits for annuitants and dependents under the State’s self-insurance plan and insurance contracts currently in force. Effective July 1, 2013, annuitants were required to contribute towards health, dental, and vision benefits with the amount based on factors such as years of credited service, additional dependent coverage, annuitant’s Medicare participation, and the type of health plan elected. Annuitants also receive life insurance coverage equal to the annual salary of the last day of employment until age 60, at which time the benefit reduces to $5,000. The State pays the University’s portion of employer costs for the benefits provided. The total cost of the State’s portion of health, dental, vision, and life insurance benefits of all members, including post-employment health, dental, vision, and life insurance benefits, is recognized as an expenditure by the State in the State’s Comprehensive Annual Financial Report. The State finances the costs on a pay-as-you-go basis. The total costs incurred for health, dental, vision, and life insurance benefits are not separated by department or component unit for annuitants and their dependents nor active employees and their dependents.
37
State of Illinois Chicago State University Notes to the Basic Financial Statements June 30, 2016
A summary of post-employment benefit provisions, changes in benefit provisions, employee eligibility requirements including eligibility for vesting, and the authority under which benefit provisions are established are included as an integral part of the financial statements of the Department of Central Management Services. A copy of the financial statements of the Department of Central Management Services may be obtained by writing to the Department of Central Management Services, 715 Stratton Building, 401 South Spring Street, Springfield, Illinois, 62706. NOTE 12 - LIABILITY INSURANCE The University participates in a statutory cooperative known as the Illinois Public Higher Education Cooperative (IPHEC). Through IPHEC, the University has contracted with commercial insurance carriers to provide liability insurance coverages, including educators’ legal and other general liability insurance. The University purchases commercial excess general liability coverage of $10.65 million. The University’s liability coverages have a general $350,000 deductible per occurrence which is administered through the State University Risk Management Association (SURMA), a cooperative pool of certain State universities in which the University participates. In most cases, participant contributions to SURMA are based upon actuarial valuations. SURMA was dissolved on January 29, 2016, and the University received $319,068 of its remaining funds. The University also has commercial general property insurance coverage for the replacement value of the University’s property. NOTE 13 - RELATED PARTY TRANSACTIONS A summary of related party transactions during the year ended June 30, 2016, is as follows: The University and CSUF agreed to a master contract, effective June 30, 1983, and revised February 1, 1989, which specified the relationship between the two organizations, as required by the University Guidelines adopted on November 30, 1982, and revised September 10, 1997, by the Legislative Audit Commission. Under the terms of the contract, the CSUF is provided administrative support services by the University, such as maintenance, telephone, personnel, and property control. The CSUF does not directly pay the University for these services, which were valued at $210,097 for the current fiscal year. The CSUF reciprocates by providing fundraising and other services to the University. The University support to the CSUF has been discontinued as a result of the termination of the master contact by the University. The CSUF has since transferred all assets to the TUFCS as of August 2016 and ceased all operations.
38
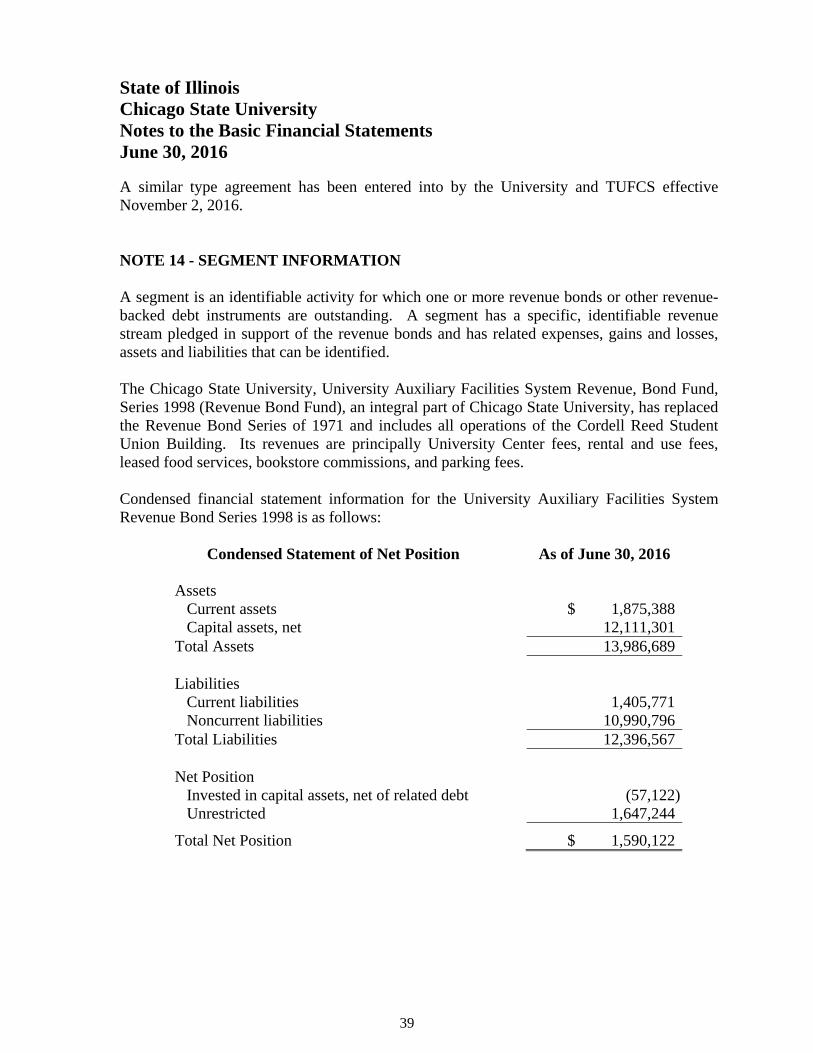
State of Illinois Chicago State University Notes to the Basic Financial Statements June 30, 2016
A similar type agreement has been entered into by the University and TUFCS effective November 2, 2016. NOTE 14 - SEGMENT INFORMATION A segment is an identifiable activity for which one or more revenue bonds or other revenue-backed debt instruments are outstanding. A segment has a specific, identifiable revenue stream pledged in support of the revenue bonds and has related expenses, gains and losses, assets and liabilities that can be identified. The Chicago State University, University Auxiliary Facilities System Revenue, Bond Fund, Series 1998 (Revenue Bond Fund), an integral part of Chicago State University, has replaced the Revenue Bond Series of 1971 and includes all operations of the Cordell Reed Student Union Building. Its revenues are principally University Center fees, rental and use fees, leased food services, bookstore commissions, and parking fees. Condensed financial statement information for the University Auxiliary Facilities System Revenue Bond Series 1998 is as follows:
Condensed Statement of Net Position As of June 30, 2016 Assets Current assets $ 1,875,388 Capital assets, net 12,111,301Total Assets 13,986,689 Liabilities Current liabilities 1,405,771 Noncurrent liabilities 10,990,796Total Liabilities 12,396,567 Net Position Invested in capital assets, net of related debt (57,122) Unrestricted 1,647,244
Total Net Position $ 1,590,122
39

State of Illinois Chicago State University Notes to the Basic Financial Statements June 30, 2016
Condensed Statement of Revenues, Expenses, Year Ended and Changes in Net Position June 30, 2016
Operating revenues $ 4,868,714Operating expenses 3,083,951 Operating income 1,784,763 Nonoperating revenues and expenses, net (642,503) Increase in net position 1,142,260 Net position, beginning of the year 447,862
Net position, end of the year $ 1,590,122
Year Ended Condensed Statement of Cash Flows June 30, 2016
Cash provided by (used in): Operating activities $ 2,413,824 Capital financing activities (1,849,926) Investing activities 49 Net increase in cash 563,947 Cash, beginning of the year 1,128,743 Cash, end of the year $ 1,692,690
NOTE 15 - COMMITMENTS AND CONTINGENCIES The University is named as a defendant in several pending lawsuits. The University believes that these matters will generally be settled in favor of the University and will not result in any significant liabilities to the University. An ongoing lawsuit that was initially ruled in favor of the plaintiff and appealed by the University has been upheld on appeal. In early 2017 the University abandoned any plans for further litigation and agreed to pay the awarded judgement. The University is responsible for $1.5 million of the judgement, with the remainder being covered by the insurance carrier. The University’s share has been accrued in the accompanying financial statements.
40
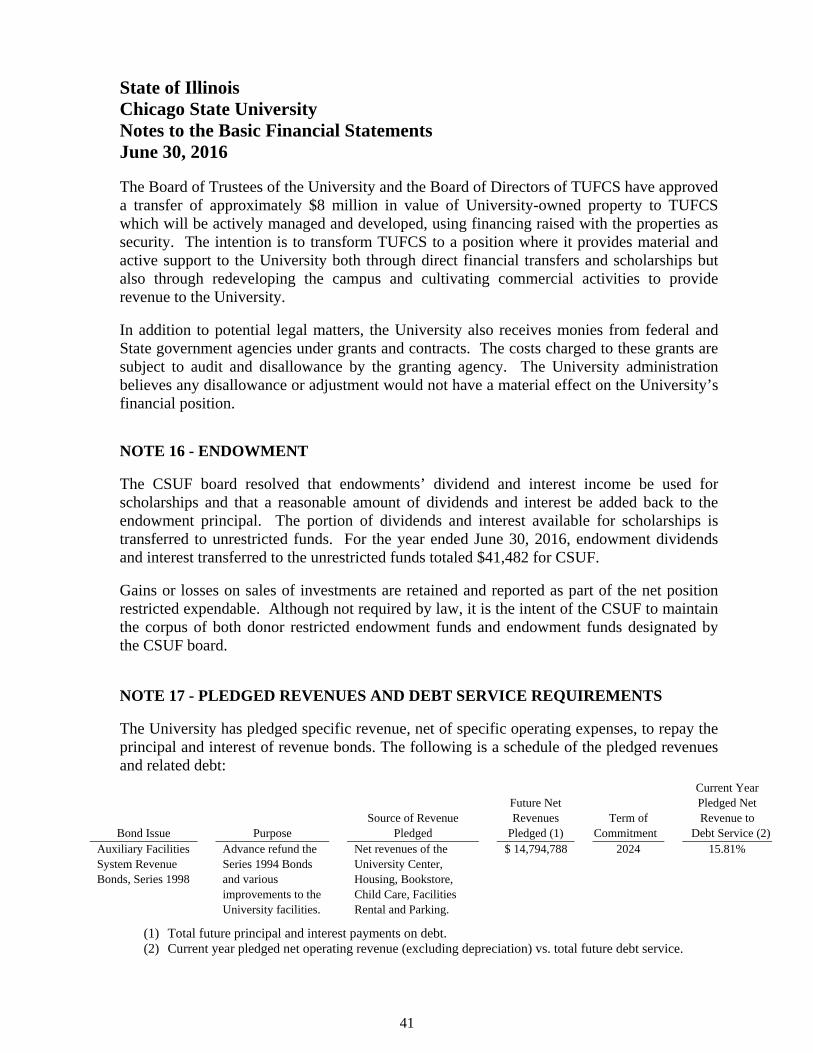
State of Illinois Chicago State University Notes to the Basic Financial Statements June 30, 2016
The Board of Trustees of the University and the Board of Directors of TUFCS have approved a transfer of approximately $8 million in value of University-owned property to TUFCS which will be actively managed and developed, using financing raised with the properties as security. The intention is to transform TUFCS to a position where it provides material and active support to the University both through direct financial transfers and scholarships but also through redeveloping the campus and cultivating commercial activities to provide revenue to the University. In addition to potential legal matters, the University also receives monies from federal and State government agencies under grants and contracts. The costs charged to these grants are subject to audit and disallowance by the granting agency. The University administration believes any disallowance or adjustment would not have a material effect on the University’s financial position. NOTE 16 - ENDOWMENT The CSUF board resolved that endowments’ dividend and interest income be used for scholarships and that a reasonable amount of dividends and interest be added back to the endowment principal. The portion of dividends and interest available for scholarships is transferred to unrestricted funds. For the year ended June 30, 2016, endowment dividends and interest transferred to the unrestricted funds totaled $41,482 for CSUF. Gains or losses on sales of investments are retained and reported as part of the net position restricted expendable. Although not required by law, it is the intent of the CSUF to maintain the corpus of both donor restricted endowment funds and endowment funds designated by the CSUF board. NOTE 17 - PLEDGED REVENUES AND DEBT SERVICE REQUIREMENTS The University has pledged specific revenue, net of specific operating expenses, to repay the principal and interest of revenue bonds. The following is a schedule of the pledged revenues and related debt:
Current Year Future Net Pledged Net Source of Revenue Revenues Term of Revenue to
Bond Issue Purpose Pledged Pledged (1) Commitment Debt Service (2)Auxiliary Facilities Advance refund the Net revenues of the $ 14,794,788 2024 15.81% System Revenue Series 1994 Bonds University Center, Bonds, Series 1998 and various Housing, Bookstore, improvements to the Child Care, Facilities University facilities. Rental and Parking.
(1) Total future principal and interest payments on debt. (2) Current year pledged net operating revenue (excluding depreciation) vs. total future debt service.
41

State of Illinois Chicago State University Notes to the Basic Financial Statements June 30, 2016 NOTE 18 - STATE OF ILLINOIS APPROPRIATIONS On June 30, 2016, the General Assembly passed SB 2047, Public Act 099-0524 that included a 6-month stop-gap budget for universities. The University received Fiscal Year 2017 appropriations as follows: $1,600,000 appropriation from the Education Improvement Fund, $153,500 from the General Professions Dedicated Fund and $12,590,000 from the Education Assistance Fund. Article 74 of the Public Act states that except for those appropriations for Personal Services, State Contributions to State Employees’ Retirement System and State Contributions to Social Security, Fiscal Year 2017 appropriations may be used to pay prior year costs. The University fully spent the Fiscal Year 2017 appropriation from the Education Assistance Fund for FY 2016 costs. In addition, the awards made for Fiscal Year 2016 scholarships totaling $2,089,634 from the Monetary Assistance Program to the University were also paid from the Fiscal Year 2017 appropriation, from the Fund for the Advancement of Education. In accordance with GASB Statement No. 33, the revenues paid from Fiscal Year 2017 appropriations totaling $14,679,634 were not recognized as revenues and receivables at June 30, 2016 even though they were used to pay for Fiscal Year 2016 costs.
As of the date of these financial statements, the State of Illinois has not adopted any new appropriations to the University to provide additional funding for Fiscal Year 2017. An extended delay in State appropriations may cause a financial burden on the University.
42
REQUIRED SUPPLEMENTARY INFORMATION

State of Illinois Chicago State University Required Supplementary Information (Unaudited) For the Year Ended June 30, 2016 Schedule of the Employer’s Proportionate Share of the Net Pension Liability (Unadited) FY 2015 FY 2014 Schedule of Pension Allocations
(a) Proportional percentage of the collective net pension liability 0% 0%(b) Proportional amount of the collective net pension liability $ $ (c) Portion of nonemployer contributing entities’ total proportion
of collective net pension liability associated with employer 346,747,343 342,183,267 Total (b) + (c) $346,747,343 $342,183,267 Employer covered-employee payroll $ 53,800,046 $ 62,948,685Proportion of collective net pension liability associated with employer as percentage of covered-employee payroll 15.52% 18.40%
SURS plan net position as a percentage of total pension liability 42.37% 44.39%
Schedule of Contributions (Unaudited) FY 2016 FY 2015 FY 2014 Federal, trust, grant and other contribution $ 287,671 $ 318,777 $ 348,064Contribution in relation to required contribution 287,671 318,777 348,064Contribution deficiency (excess) Employer covered-employee payroll $3,538,415 $4,104,465 $4,533,557Contributions as a percentage of covered-employee payroll 8.13% 7.77% 7.68% * Note: The System implemented GASB Statement No. 68 in Fiscal Year 2015. The
information above is presented for as many years as available. The Schedule is intended to show information for 10 years.
43

State of Illinois Chicago State University Required Supplementary Information (Unaudited) For the Year Ended June 30, 2016
Notes to Required Supplementary Information (Unaudited) Changes of Benefit Terms There were no benefit changes recognized in the Total Pension Liability as of June 30, 2015. Changes of Assumptions In accordance with Illinois Compiled Statutes, an actuarial review is to be performed at least once every three years to determine the reasonableness of actuarial assumptions regarding the retirement, disability, mortality, turnover, interest and salary of the members and benefit recipients of SURS. An experience review for the years June 30, 2010 to June 30, 2014 was performed in February 2015, resulting in the adoption of new assumptions as of June 30, 2015. Mortality rates. Change from the RP2000 Mortality table projected to 2017, sex
distinct, to the RP-2014 mortality tables with projected generational mortality improvement. Change to a separate mortality assumption for disabled participants.
Salary increase. Change assumption to service-based rates, ranging from 3.75 percent to 15.00 percent based on years of service, with underlying wage inflation of 3.75 percent.
Normal retirement rates. Change to retirement rates at ages younger than 60, age 66, and ages 70-79 to reflect observed experiences.
Early retirement rates. Change to a slight increase to the rates at ages 55 and 56. Turnover rates. Change to produce lower expected turnover for members with less
than 10 years of service and higher turnover for members with more than 10 years of service than the currently assumed rates.
Disability rates. Decrease rates and have separate rates for males and females to reflect observed experience.
Dependent assumption. Main the current assumption on marital status that varies by age and sex and the assumption that males are three years older than their spouses.
Covered Payroll The definition of covered payroll has been redefined by GASB Statement No. 82, Pension IssuesAn Amendment of GASB Statements No. 68 and 73. Below are the definitions from the glossaries of each statement. GASB Statement No. 67 Covered-Employee Payroll. The payroll of employees that are provided with pensions through the pension plan. GASB Statement No. 82 Covered Payroll. All elements included in compensation paid to active employees on which contributions to a pension plan are based.
44

SUPPLEMENTARY INFORMATION
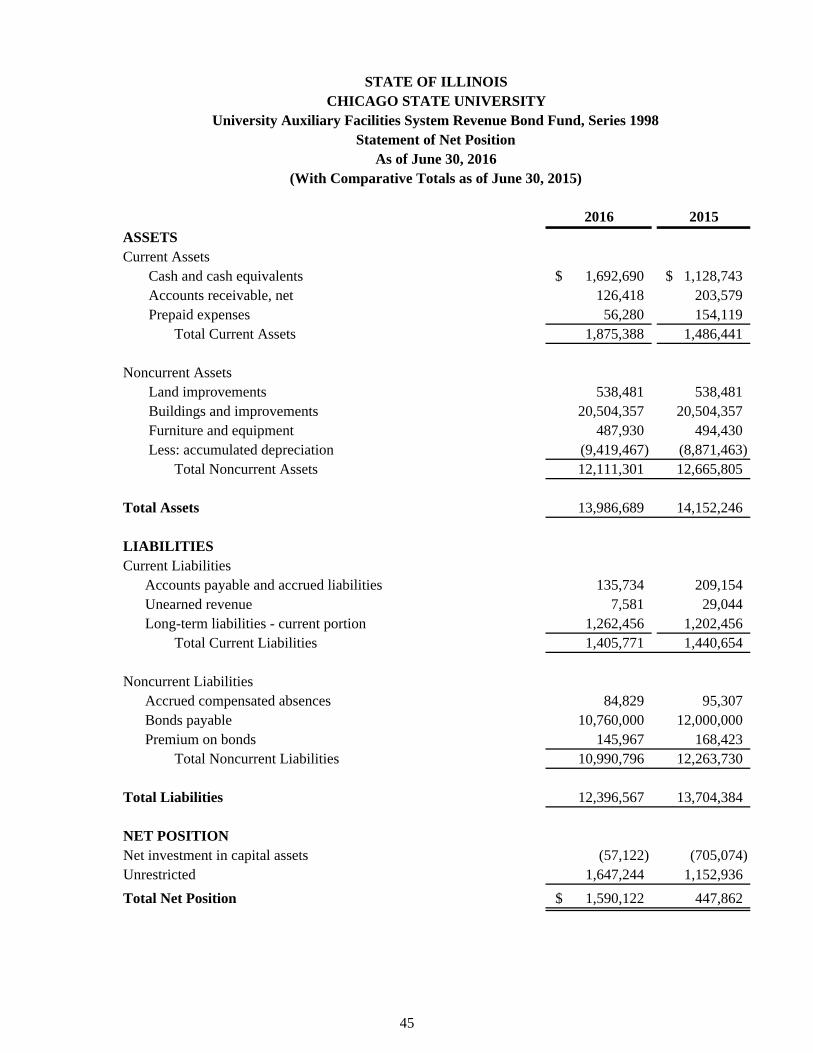
2016 2015
ASSETSCurrent Assets Cash and cash equivalents 1,692,690$ 1,128,743$ Accounts receivable, net 126,418 203,579 Prepaid expenses 56,280 154,119 Total Current Assets 1,875,388 1,486,441
Noncurrent Assets Land improvements 538,481 538,481 Buildings and improvements 20,504,357 20,504,357 Furniture and equipment 487,930 494,430 Less: accumulated depreciation (9,419,467) (8,871,463) Total Noncurrent Assets 12,111,301 12,665,805
Total Assets 13,986,689 14,152,246
LIABILITIESCurrent Liabilities Accounts payable and accrued liabilities 135,734 209,154 Unearned revenue 7,581 29,044 Long-term liabilities - current portion 1,262,456 1,202,456 Total Current Liabilities 1,405,771 1,440,654
Noncurrent Liabilities Accrued compensated absences 84,829 95,307 Bonds payable 10,760,000 12,000,000 Premium on bonds 145,967 168,423 Total Noncurrent Liabilities 10,990,796 12,263,730
Total Liabilities 12,396,567 13,704,384
NET POSITIONNet investment in capital assets (57,122) (705,074) Unrestricted 1,647,244 1,152,936
Total Net Position 1,590,122$ 447,862
(With Comparative Totals as of June 30, 2015)
STATE OF ILLINOISCHICAGO STATE UNIVERSITY
University Auxiliary Facilities System Revenue Bond Fund, Series 1998Statement of Net Position
As of June 30, 2016
45

2016 2015
OPERATING REVENUESRoom and board, (net of scholarship allowances of $59,266) 1,982,144$ 2,176,149$ Bookstore commissions 175,000 175,000 Vending and catering commissions 112,823 178,635 Parking fees 732,589 848,370 University center fees 1,866,158 2,091,990 Total operating revenues 4,868,714 5,470,144
OPERATING EXPENSESPersonal services 1,358,817 1,621,542 Expended for plant 4,798 87,420 Commodities 80,495 135,958 Contractual services 1,021,431 1,911,050 Depreciation 554,504 552,193 Miscellaneous 63,906 208,894 Total operating expenses 3,083,951 4,517,057
OPERATING INCOME 1,784,763 953,087
NONOPERATING REVENUES (EXPENSES)Gain on disposal of capital assets - 2,000 Investment income 49 6 Interest on capital asset - related debt (642,552) (700,302) Net nonoperating expenses (642,503) (698,296)
INCREASE IN NET POSITION 1,142,260 254,791
NET POSITION, BEGINNING OF YEAR 447,862 193,071
NET POSITION, END OF YEAR 1,590,122$ 447,862$
(With Comparative Totals for the Year Ended June 30, 2015)
STATE OF ILLINOISCHICAGO STATE UNIVERSITY
University Auxiliary Facilities System Revenue Bond Fund, Series 1998Statement of Revenues, Expenses and Changes in Net Position
For the Year Ended June 30, 2016
46
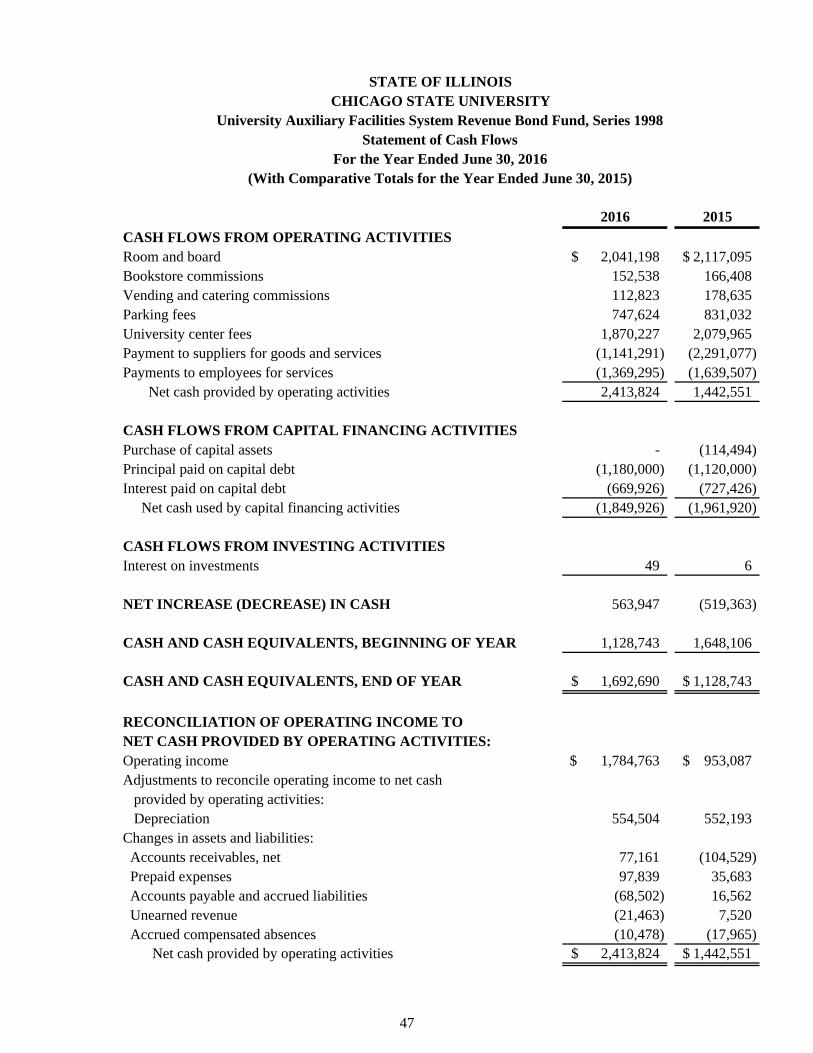
2016 2015
CASH FLOWS FROM OPERATING ACTIVITIESRoom and board 2,041,198$ 2,117,095$ Bookstore commissions 152,538 166,408 Vending and catering commissions 112,823 178,635 Parking fees 747,624 831,032 University center fees 1,870,227 2,079,965 Payment to suppliers for goods and services (1,141,291) (2,291,077) Payments to employees for services (1,369,295) (1,639,507) Net cash provided by operating activities 2,413,824 1,442,551
CASH FLOWS FROM CAPITAL FINANCING ACTIVITIESPurchase of capital assets - (114,494) Principal paid on capital debt (1,180,000) (1,120,000) Interest paid on capital debt (669,926) (727,426) Net cash used by capital financing activities (1,849,926) (1,961,920)
CASH FLOWS FROM INVESTING ACTIVITIESInterest on investments 49 6
NET INCREASE (DECREASE) IN CASH 563,947 (519,363)
CASH AND CASH EQUIVALENTS, BEGINNING OF YEAR 1,128,743 1,648,106
CASH AND CASH EQUIVALENTS, END OF YEAR 1,692,690$ 1,128,743$
RECONCILIATION OF OPERATING INCOME TO NET CASH PROVIDED BY OPERATING ACTIVITIES:Operating income 1,784,763$ 953,087$ Adjustments to reconcile operating income to net cash provided by operating activities: Depreciation 554,504 552,193 Changes in assets and liabilities: Accounts receivables, net 77,161 (104,529) Prepaid expenses 97,839 35,683 Accounts payable and accrued liabilities (68,502) 16,562 Unearned revenue (21,463) 7,520 Accrued compensated absences (10,478) (17,965) Net cash provided by operating activities 2,413,824$ 1,442,551$
(With Comparative Totals for the Year Ended June 30, 2015)
STATE OF ILLINOISCHICAGO STATE UNIVERSITY
University Auxiliary Facilities System Revenue Bond Fund, Series 1998Statement of Cash Flows
For the Year Ended June 30, 2016
47

OTHER INFORMATION

State of Illinois Chicago State University Other Information (Unaudited) For the Year Ended June 30, 2016
Student Enrollment by Term (Unaudited)
Unduplicated Total Full-Time Enrollment Equivalent
Fall session, 2015 4,767 3,423 Spring session, 2016 4,442 3,183 Summer session, 2016 903 325 University Center Fee (Unaudited) For each term, the University Center Fee is assessed based upon enrollment status:
Full-Time Part-Time Student Student
Fall session, 2015 $ 199 $ 128 Spring session, 2016 199 128 Summer session, 2016 159 102 Rental Disclosures (Unaudited) On July 1, 1995, the Revenue Bond Fund renewed an annual rental agreement to provide the University with office space and meeting rooms to conduct certain University activities in the University Center for $272,000. This rental was funded by State appropriations. Schedule of Insurance in Force (Unaudited) The Auxiliary System is insured under a master policy covering universities. The following insurance coverage applicable to the System was effective during the current fiscal year: Fire and extended coverage ($25,000 deductible) of: Building $ 44,831,795 Contents 424,200 Business interruption 13,123,924Boiler and machinery (included in blanket coverage limit) 100,000,000Earthquake 100,000,000Flood 100,000,000Basic general liability (SURMA) 350,000Excess general liability 10,650,000
48
E.C. O RT IZ & CO., LL P CE RTIFIED PUBLIC ACCOUNTANTS
Independent Auditor's Report on Internal Control Over Financial Reporting and on Compliance and Other
Matters Based on an Audit of Financial Statements Performed in Accordance With Government Auditing Standards
Honorable Frank J. Mautino Auditor General State of Illinois
and
The Board of Trustees Chicago State University
As Special Assistant Auditors for the Auditor General, we have audited, in accordance with the auditing standards generally accepted in the United States of America and the standards applicable to financial audits contained in Government Auditing Standards issued by the Comptroller General of the United States, the financial statements of the business-type activities of Chicago State University (University) and its aggregate discretely presented component units, collectively a component unit of the State of Illinois, as of and for the year ended June 30, 2016, and the related notes to the financial statements, which collectively comprise the University's basic fmancial statements, and have issued our report thereon dated March 17, 2017. Our report includes a reference to other auditors who audited the financial statements of the University's discretely presented component units, as described in our report on the University's financial statements. This report does not include the results of the other auditor's testing of internal control over financial reporting or compliance and other matters that are reported on separately by those auditors.
Internal Control Over Financial Reporting
In plarming and performing our audit of the financial statements, we considered the University's internal control over financial reporting (internal control) to determine the audit procedures that are appropriate in the circumstances for the purpose of expressing our opinions on the financial statements, but not for the purpose of expressing an opinion on the effectiveness of the University's internal control. Accordingly, we do not express an opinion on the effectiveness of the University's internal control.
A deficiency in internal control exists when the design or operation of a control does not allow management or employees, in the normal course of performing their assigned functions, to prevent, or detect and correct, misstatements on a timely basis. A material weakness is a deficiency, or a combination of deficiencies, in internal control such that there is a reasonable possibility that a material misstatement of the entity's financial statements will not be prevented, or detected and corrected on a timely basis. A significant deficiency is a deficiency, or a
333 SOUT H D ES PL A I NES ST REET, SU I TE 2- N C HI CAGO, I L 6066 1 t e l: 3 1 2 . 876. 1900 fax: 3 12.876.19 1 1
49
combination of deficiencies, in internal control that is less severe than a material weakness, yet important enough to merit attention by those charged with governance. Our consideration of internal control was for the limited purpose described in the first paragraph of this section and was not designed to identify all deficiencies in internal control that might be material weaknesses or significant deficiencies and therefore, material weaknesses or significant deficiencies may exist that were not identified. Given these limitations, during our audit we did not identify any deficiencies in internal control that we consider to be material weaknesses. We did identify certain deficiencies in internal control, described in the accompanying schedule of findings as items 2016-001 and 2016-002 that we consider to be significant deficiencies. Compliance and Other Matters As part of obtaining reasonable assurance about whether the University’s financial statements are free from material misstatement, we performed tests of its compliance with certain provisions of laws, regulations, contracts, and grant agreements, noncompliance with which could have a direct and material effect on the determination of financial statement amounts. However, providing an opinion on compliance with those provisions was not an objective of our audit, and accordingly, we do not express such an opinion. The results of our tests disclosed no instances of noncompliance or other matters that are required to be reported under Government Auditing Standards.
University’s Responses to the Findings The University’s responses to the findings identified in our audit are described in the accompanying schedule of findings. The University’s responses were not subjected to the auditing procedures applied in the audit of the financial statements and, accordingly, we express no opinion on the responses. Purpose of this Report The purpose of this report is solely to describe the scope of our testing of internal control and compliance and the results of that testing, and not to provide an opinion on the effectiveness of the University’s internal control or on compliance. This report is an integral part of an audit performed in accordance with Government Auditing Standards in considering the University’s internal control and compliance. Accordingly, this communication is not suitable for any other purpose.
Chicago, Illinois March 17, 2017
50

State of Illinois Chicago State University Schedule of Findings June 30, 2016
Current Findings - Government Auditing Standards 2016-001 - Inaccurate Accounting of Accrued Compensated Absences The Chicago State University (University) did not properly account for accrued compensated absences. We obtained the University’s schedule of accrued compensated absences and selected a sample of 40 employees in order to test the accuracy of the accrual. Our testing noted 6 of 40 (15%) employees (1 coach and 5 grant funded employees) were not eligible for vested accrued leave but were included on the accrued leave schedule. Further testing revealed that an additional 5 coaches and 18 grant employees were included in the list. Total accrued compensated absences reported on the University’s financial statements for all of the employees improperly included in the accrued compensated absences schedule totaled $150,759. A proposed adjustment for this amount was not recorded by the University. The University’s Board of Trustees Regulations (BOT Regulations) Section II. B. 6. i. states that the coaches shall be entitled to non-cumulative vacation leave of 2 days per month for each month in the term of appointment. This vacation leave shall be used during the term of appointment, and there shall be no lump sum payment or other benefit provided to such coaches for unused vacation leave at the end of their term of appointment. BOT Regulations II. B. 6. b. (5) (b) also states employees who are hired pursuant to grant funding shall not be entitled to a lump sum payment for accrued vacation leave. The Fiscal Control and Internal Auditing Act (30 ILCS 10/3001) requires the University to maintain a system, or systems, of internal fiscal and administrative controls, that provide assurance that resources and expenditures are properly recorded and accounted for to permit the preparation of reliable financial reports and to maintain accountability over the State’s resources. University management stated, subsequent to being alerted to this situation in the prior audit, a system was implemented in which the Office of Human Resources and Finance/Administration departments would coordinate review of the accrued compensated absences schedule. While that process was indeed followed in Fiscal Year 2016, the final review didn’t include all of the proper personnel. As such, some employees that should not have accrued leave were included on the final schedule. Failure to properly account for accrued leave may cause errors in compensation to employees and may result in inaccurate financial statements. (Finding Code No. 2016-001, 2015-001, 2014-002, 2013-001, 12-2, 11-3)
51
State of Illinois Chicago State University Schedule of Findings June 30, 2016
Current Findings - Government Auditing Standards (Continued)
2016-001 - Inaccurate Accounting of Accrued Compensated Absences (Continued) Recommendation We recommend the University improve its processes to account for accrued leave to ensure records and reporting are accurate. University Response The University agrees with the finding and has taken steps to further improve the process. We identified a single point of accountability in the Finance/Administration area who, with consultation from a Human Resource representative, will be responsible for ensuring that the final compensated absences listing doesn’t include grant dedicated staff, excludable coaches or any other ineligible employees.
52
State of Illinois Chicago State University Schedule of Findings June 30, 2016
Current Findings - Government Auditing Standards (Continued)
2016-002 - Improper Accounting of Unearned Revenue and Grant Receivables The Chicago State University (University) did not properly account for its unearned revenue and grant receivables. During our review of the University’s financial statements as of June 30, 2016, we noted the following: The balance of unearned revenue and grant receivables in relation to the Douglas Hall
renovation project from the Capital Development Board was overstated by $727,134. It was also noted during the audit that other smaller grants had unearned revenue and grant receivable balances that were overstated by $101,279. A proposed adjustment for these errors was not recorded by the University.
Federal, state and private grants and contracts receivable details included credit
balances totaling $196,270 that should have been adjusted or reclassified to other accounts such as unearned revenue for advance payments from both federal and private grants ($154,044); prepaid expenses ($3,955); accounts payable ($8,929); grant revenue or expenses ($29,323); and, allowance for doubtful accounts ($19). A proposed adjustment for these errors was not recorded by the University.
Generally accepted accounting principles (GAAP) requires the recognition of a liability for revenues received in advance and the subsequent reversal of a liability during the period the revenue is earned. The Fiscal Control and Internal Auditing Act (30 ILCS 10/3001) requires all State agencies to establish and maintain a system of internal fiscal control to provide assurance that revenues, expenditures and transfers of assets, resources, or funds applicable to operations are properly recorded and accounted for to permit the preparation of reliable financial reports. University management stated, due to a 40% reduction of staff working in the Grant Accounting area, and the resultant redistribution of job responsibilities, specific year-end close out procedures were not clearly communicated to the remaining staff; therefore, staff was not familiar with treatment of unusual balances needing adjustment prior to the year-end close. Failure to properly record transactions at fiscal year-end may result in inaccurate financial statements. (Finding Code No. 2016-002)
53

State of Illinois Chicago State University Schedule of Findings June 30, 2016
Current Findings - Government Auditing Standards (Continued)
2016-002 - Improper Accounting of Unearned Revenue and Grant Receivables (Continued) Recommendation We recommend the University ensure all transactions are properly accounted for and recorded in the financial statements in accordance with GAAP. University Response The University agrees with the finding and has implemented steps to ensure that future transactions are properly reflected in the financial records in accordance with GAAP. Additionally, year-end close procedures will include a step to validate that any remaining unearned revenue balance has been compared against the applicable accounts receivable balance, and adjustments made if necessary.
54