Embed Size (px)
Citation preview


State of Hawaii Department of Health
Clean Air Branch
Documentation for Natural Events Excluded Data Kona Air Monitoring Station, AQS ID 15-001-1012
2011-2012 PM2.5 Exceedances
Final Report December 2013
Image by crew of Space Shuttle Atlantis, May 13, 2009
Vog
Vog
Ocean entry
N
Kona

This page was intentionally left blank.

i
Introduction During 2011 and 2012, the Kona air monitoring station recorded annual average particulate matter less than or equal to 2.5 micrometers in diameter (PM2.5) concentrations of 12.1 µg/m3 and 16.2 µg/m3, respectively. These values exceed the annual PM2.5 National Ambient Air Quality Standards (NAAQS) of 12 µg/m3. This report is solely to demonstrate that these exceedances at the Kona station, and Kona station alone, were caused by naturally occurring volcanic emissions, were not reasonably controllable or preventable, were associated with measured concentrations in excess of normal historical fluctuations, and would not have occurred
-the U.S. Environmental Protection Ag Table I-1 below is a summary of the flagged PM2.5 data for 2011 and 2012. A table with a complete listing all the dates that were flagged is included in Appendix B.
Kona (AQS ID 150011012): 2011 and 2012 24-hr PM2.5 Flagged Data Year Quarter Date Range Number of Flagged Days 2011 1 February13 March 9 2 2012 1 January 1 to March 31 62 2012 2 April 1 to June 30 87 2012 3 July 1 to September 30 23 2012 4 October 1 to December 28 28
Table I-1. Summary of Flagged Days in 2011 and 2012 There were no exceedances of the 24-hour PM2.5 NAAQS of 35 µg/m3 at the Kona station in 2011 and 2012. Section 1 of this report provides a summary of the exceptional events rules and requirements and details how those rules are met within the report. Section 2 of this report introduces the conceptual model of the volcanic event that occurred during 2011-2012, providing a background narrative of the natural event and an explanation that it affected air quality. Section 2 also provides evidence that the exceedances were due to a natural event. Section 3 of this report establishes a clear causal relationship between the natural events and the exceedances of the annual PM2.5 standard at the monitoring station. This section also discusses how sulfur dioxide (SO2) gas from the volcano turns into sulfate particles as it travels to the Kona coast. Section 4 of this report provides information on existing anthropogenic sources in the Kona area and the emissions control measures required of these sources. It demonstrates that despite the regulation of these man-made sources, the exceedances were not reasonably controllable or preventable.

ii
Section 5 of this report provides information which help illustrate that the exceptional event produced PM2.5 concentrations in excess of normal historical fluctuations. Section 6 of this report summarizes the demonstration, showing a clear causal relationship between the natural event and the exceedances, and concludes that these
- Appendix A of this report includes additional figures and tables with supporting information. Appendix B of this report includes a table with a complete listing all the dates that were flagged. Appendix C of this report will have the affidavits of publication in three local newspapers (when available) notifying the public of the availability for inspection of this document. The three newspapers are the Honolulu Star-Advertiser (State-wide distribution), the Hawaii Tribune-Herald (East Hawaii newspaper distribution) and the West Hawaii Today (West Hawaii newspaper distribution).
iii
Table of Contents
INTRODUCTION .............................................................................................................. i LIST OF FIGURES .......................................................................................................... iv LIST OF TABLES ............................................................................................................ v LIST OF ACRONYMS AND DEFINITIONS ..................................................................... vi Section 1 EXCEPTIONAL EVENTS RULE (EER) REQUIREMENTS ............................................. 1 Section 2 CONCEPTUAL MODEL .................................................................................................. 3 Section 3 CAUSAL RELATIONSHIP ............................................................................................. 15 Section 4 NOT REASONABLY CONTROLLABLE OR PREVENTABLE ...................................... 43 Section 5 HISTORICAL NORM .............................. ........................................................................54 Section 6 BUT-FOR ANALYSIS/CONCLUSIONS .. ........................................................................55 Appendix A: Additional Figures and Charts Appendix B: Kona Station Flagged Data for 2011 and 2012 Appendix C: Public Review Documentation Cover graphic illustrates the volcanic emission plumes (vog) from ocean entry point being blown to the southern end of Hawaii Island then travelling up to the Kona coast during predominant trade wind regime.

iv
List of Figures Figure Title Page 2-1 Kona Air Station Photos ....................................................................................... 3 2-2 Google Earth photo of Kona Air Station ................................................................ 4 2-3 Hawaii Island Wind Patterns ................................................................................. 5 2-4 .............................................. 6 2-5 ............................................... 6 2-6 Hawaii Island Topographical Map ......................................................................... 7 2-7 Hawaiian Islands Topographical Map ................................................................... 8 2-8 Hawaiian Islands Population Map ......................................................................... 9 2-9 Satellite Image of Vog ........................................................................................ 10 2-10 Kilauea Volcano Annual SO2 Emission Rates 1992-2010 .......................................... 11 2-11 Kilauea Volcano Average Daily Output of SO2 for 2011 ..................................... 12 2-12 Kilauea Volcano Average Daily Output of SO2 for 2012 ..................................... 12 3-1 Photo of Honolulu on Hazy Kona Wind Day ....................................................... 16 3-2 2011 Time History of Kona and Ocean View PM2.5 Concentrations ................... 22 3-3 2011 Time History of Kona and Ocean View Normalized PM2.5 Concentrations 23 3-4 2012 Time History of Kona & Ocean View PM2.5 Concentrations ....................... 24 3-5 2012 Time History of Kona & Ocean View Normalized PM2.5 Concentrations .... 25 3-6 2011 Time History of Kona & Ocean View Normalized SO2 Concentrations ...... 26 3-7 2012 Time History of Kona & Ocean View Normalized SO2 Concentrations ...... 27 3-8 Kona Area AN155 Windrose Plots for 2011 and 2012 ........................................ 28 3-9 2012 Kamuela & Keaumo Windrose ................................................................... 31 3-10 2012 Kaunakakai, Molokai Airport & Kaneohe, Marine Corp Air Station Windrose ............................................................................................................ 32 3-11 2012 Waikoloa & Kaupulehu Lava Flow Windrose ............................................. 33 3-12 2012 PTA Range 17 & Hilo International Airport Windrose ................................ 34 3-13 2012 Pahala and Ocean View Windrose ............................................................ 35 3-14 2011 Time History of Kona PM2.5 Concentrations w/Flagged days .................... 37 3-15 Time History of Kona & Ocean View Normalized PM2.5 Concentrations w/Flagged Days ................................................................................................. 38 3-16 2011 Time History of Kona & Ocean View Normalized SO2 Concentrations w/Flagged Days .................................................................................................. 39 3-17 2012 Time History of Kona PM2.5 Concentrations with Flagged Days ................ 40 3-18 2011 Time History of Kona & Ocean View Normalized PM2.5 Concentrations
w/Flagged Days .................................................................................................. 41 3-19 2012 Time History of Kona & Ocean View Normalized SO2 Concentrations
w/Flagged Days .................................................................................................. 42 4-1 Comparison of Emissions for 2011 ..................................................................... 48 4-2 Comparison of Emissions for 2012 ..................................................................... 48 5-1 Annual Average of Measured SO2 at Various Air Stations ................................. 54

v
List of Tables Table Title Page I-1 Summary of Flagged Days in 2011 and 2012 ....................................................... i 3-1 2011-2012 USGS preliminary SO2 emissions data compiled by DOH ............... 18 3-2 2011-2012 AQS Data Mart Hourly PM2.5 Data: Annual Averages ...................... 21 3-3 2011-2012 AQS Data Mart Hourly SO2 Data: Annual Averages ......................... 21 4-1 NAAQS Concentrations ...................................................................................... 43 4-2 Stationary Sources ............................................................................................. 44 4-3 Temporary Sources ............................................................................................ 45 4-4 Kona International Airport ................................................................................... 45 4-5 Kilauea Volcano .................................................................................................. 45 4-6 Stationary Source Emissions .............................................................................. 46 4-7 Temporary Source Emissions............................................................................. 47 4-8 Kona International Airport Emissions .................................................................. 47 4-9 Anthropogenic Emissions ................................................................................... 47 4-10 Kilauea Volcano Emissions ................................................................................ 48 4-11 Regulatory Measures for Anthropogenic Sources .............................................. 50 4-12 Air Pollution Control Measures for Anthropogenic Sources ................................ 52

vi
List of Acronyms and Definitions
QS Air Quality System
ASAS Air Surveillance and Analysis Section (State of Hawaii, Department of Health)
BACT Best Available Control Technology CEMS Continuous Emissions Monitoring System CFR Code of Federal Regulations COMS Continuous Opacity Monitoring System DOH-CAB Department of Health Clean Air Branch (State of Hawaii) EPA United States Environmental Protection Agency HAR Hawaii Administrative Rules HAVO Hawaii Volcano Observatory HAVO OB Hawaii Volcano Observatory Kilauea Observatory HAVO VC Hp Horsepower
Kona winds This refers to periods of light, variable to southerly winds that typically occur when a subtropical ridge rests over the state.
kW Kilowatt MMBtu/hr One million British Thermal Units per hour MW Megawatt NAAQS National Ambient Air Quality Standards NEI National Emissions Inventory NO2 Nitrogen Dioxide NESHAPS National Emissions Standards for Hazardous Air Polllutants NPS National Park Service NSPS New Source Performance Standards
Particulate Matter
A mixture in the air of very small particles and liquid droplets. This
micrometers in diameter. PM2.5 Particulate matter less than or equal to 2.5 micrometers in diameter ppb parts per billion PSD Prevention of Significant Deterioration SCR Selective Catalytic Reduction SO2 Sulfur dioxide gas TPH Tons per hour TPY Tons per year
Trade winds Refers to the predominant winds in the state of Hawaii which is from the east/northeasterly direction.
USGS United States Geological Survey µg/m3 micrograms per cubic meter
Vog or a hazy air pollution condition attributed to the active volcano.
1
Section 1. Exceptional Event Rule (EER) Requirements Technical and procedural requirements are contained within the EER and must be met in order for EPA to concur with the flagged air monitoring data. This section of the report details the Hawaii Department of Health, Clean Air Branch (DOH-CAB) effort to address those requirements as required by 40 CFR 50.14 (Treatment of Air Quality Monitoring Data Influenced by Exceptional Events). 1.1 Procedural Requirements Public notification that event was occurring (40 CFR 50.14 (c)(1(i)) Immediate public notification of NAAQS exceedances is provided on the DOH-CAB website at http://health.hawaii.gov/cab/notification-of-exceedance-of-a-national-ambient-air-quality-standard. Notification of the 2012 exceedances of the annual PM2.5 NAAQS was posted once the data was validated. Place informational flag on data in AQS (40 CFR 50.14 (c)(2(ii)) The Department of Health Laboratory Division, Air Surveillance and Analysis Section (ASAS), submits the repository of ambient air quality data. A preliminary flag is submitted for data collected that may be influenced by exceptional events. Notify EPA of intent to flag through submission of initial event description by July 1 of calendar year following event (40 CFR 50.14 (c)(2(iii)) This report is our initial event description. All data has been flagged in AQS. Document that the public comment process was followed for event documentation (40 CFR 50.14 (c)(3(iv)) Due to time constraints, the public notice for this document will be concurrent with the submittal to EPA. This report will be placed on the DOH-CAB website as well as be available at the DOH-CAB offices in Honolulu, Hilo and Kona for public review for a period of thirty (30) days beginning December 16, 2013 and ending January 14, 2014. Submit demonstration supporting exceptional event flag (40 CFR 50.14 (a)(1-2)) The deadline for the submittal of this demonstration package is December 12, 2013. DOH-CAB will submit this document to EPA Region IX by the deadline. Any significant comments received during the public comment period along with DOH-CABcorresponding responses will be forwarded to EPA. Affidavits of the public notice through the three local newspapers will be submitted to EPA once they are available. 1.2 Documentation Requirements
Pursuant to 40 Code of Federal Regulations (CFR) Part 50.14(c)(3)(iii) of the Exceptional Event Rule (EER), the following six elements must be addressed when requesting the EPA exclude event-related concentrations from regulatory requirements:

2
1) The event affected air quality; 2) The event was not reasonably controllable or preventable; 3) The event was caused by human activity that is unlikely to recur at a particular
location, or was a natural event; 4) There exists a clear causal relationship between the specific event and the
monitored concentration; 5) The event is associated with a measured concentration in excess of normal
historical fluctuations including background; and 6) There would have been no exceedances or violation but for the event.
Section 2 of this report introduces the conceptual model of the volcanic event that occurred during 2011-2012, providing a background narrative of the natural event and
exceedances were due to a natural event. Section 4 of this report provides information on existing anthropogenic sources in the Kona area and the emissions control measures required of these sources. It demonstrates that despite the regulation of these man-made sources, the exceedances
events and the exceedances of the annual PM2.5 standard at the monitoring station. This section also discusses how sulfur dioxide (SO2) gas from the volcano turns into sulfate particles as it travels to the Kona coast. The evidence in this section also confirms that the event in question both affected air quality and were the result of a
Section 5 of this report provides information which help illustrate that the exceptional event produced PM2.5 concentrations in excess of normal historical fluctuations. Section 6 of this report summarizes the demonstration, showing a clear causal relationship between the natural event and the exceedances, and concludes that these
-
3
Section 2. Conceptual Model
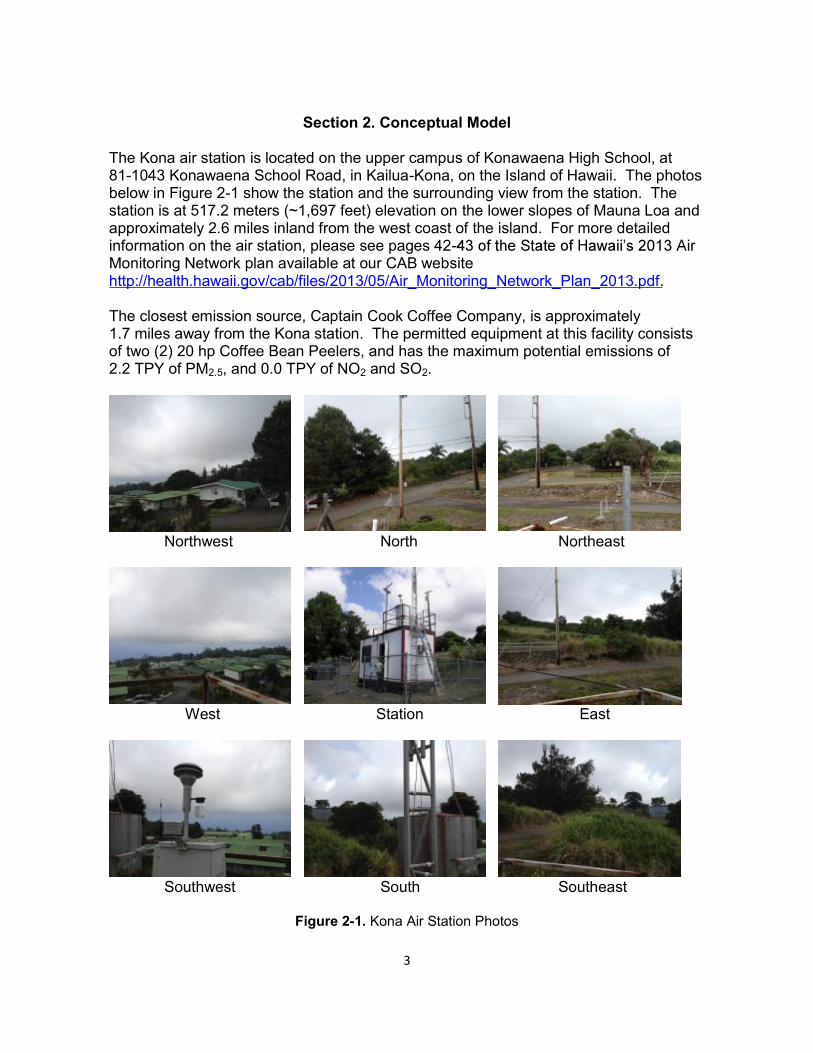
The Kona air station is located on the upper campus of Konawaena High School, at 81-1043 Konawaena School Road, in Kailua-Kona, on the Island of Hawaii. The photos below in Figure 2-1 show the station and the surrounding view from the station. The station is at 517.2 meters (~1,697 feet) elevation on the lower slopes of Mauna Loa and approximately 2.6 miles inland from the west coast of the island. For more detailed information on the air station, please see pages 42-Monitoring Network plan available at our CAB website http://health.hawaii.gov/cab/files/2013/05/Air_Monitoring_Network_Plan_2013.pdf. The closest emission source, Captain Cook Coffee Company, is approximately 1.7 miles away from the Kona station. The permitted equipment at this facility consists of two (2) 20 hp Coffee Bean Peelers, and has the maximum potential emissions of 2.2 TPY of PM2.5, and 0.0 TPY of NO2 and SO2.
Northwest North Northeast
West Station East
Southwest South Southeast
Figure 2-1. Kona Air Station Photos

4
Figure 2-2 below is a satellite image taken from Google Earth of the Kona air station and the surrounding area. The image shows that the surrounding area is a mix of residential lots, agricultural lots, small business, forests, and grasslands.
Figure 2-2. Google Earth Photo of Kona Air Station 2.2 Topography and Climate of Hawaii There are six major populated islands in the state of Hawaii with Kauai being geologically the oldest and Hawaii the youngest. It is the only state that is surrounded by ocean. The islands are actually the summit regions of a long range of undersea volcanic mountains with the largest peaks being Mauna Loa, and Mauna Kea on the island of Hawaii both rising over 13,000 feet above sea level. Situated in the tropics, there extends from May to September and winter from October to April. Hawaii has a temperate climate with a relatively small annual temperature variation with the coldest and warmest months usually occurring in February and August, respectively. Rainfall is influenced by the mountainous nature of the islands with the highest amounts being recorded on the lower flanks of the large peaks of Haleakala, Mauna Loa and Mauna Kea normally during the winter months. There is a large difference in average rainfall

5
amounts between the east side of the island of Hawaii (Hilo) and the west side (Kona). The average rainfall amount from 2000 to 2011 for the Hilo side of the island was 114 inches, while the Kona side averaged 9 inches for the same period (ref. State of Hawaii 2012 Data Book). The northeasterly trade winds are the predominant wind regime for the islands. These winds are produced by an area of high pressure called the Pacific High which is at its northern most position in summer. Therefore, during May to September, the trades predominate about 80 to 95 percent of the time and diminish when they move south with the sun during the winter months. Additionally, subtropical cyclones, often called Kona lows or Kona storms, occur more often in the winter months. The term Kona is used to describe these storms due to the replacement of the normal northeast trade winds with southerly winds. The average wind speeds are highest during the trade wind months of May to September and decrease from October to April. When the trade winds are stronger, they prevail over most of the lowlands. However, in some areas such as the Kona coast and the Kihei area on Maui local sea and land breezes may actually be strengthened by the trade winds. Figure 2-3 below show that the prevailing trade winds from the northeast usually travel over the island of Hawaii and then wraps around the south point of the island up to the Kona coast. A diurnal pattern of land-sea breezes occurs along the Kona coast. During Kona or southerly winds, the wind travels from the south of the island towards the eastern coast of the island.
Figure 2-3. Hawaii Island Wind Patterns (courtesy USGS).
Figures 2-4 and 2-5 show how different weather/wind conditions can affect plume behavior. During typical trade wind days, the plume can be seen blowing in the southwesterly direction. During calm winds or Kona wind days, the vent emissions can be seen fumigating the summit and surrounding area.

6
Figure 2-4. looking southeast from the
Jagger Museum on trade wind day (taken by DOH staff)
Figure 2-5. looking south from the Visitor
Center on Kona wind day (taken by DOH staff) The Kilauea volcano is situated on the southeastern part of the island of Hawaii.
levation of

7
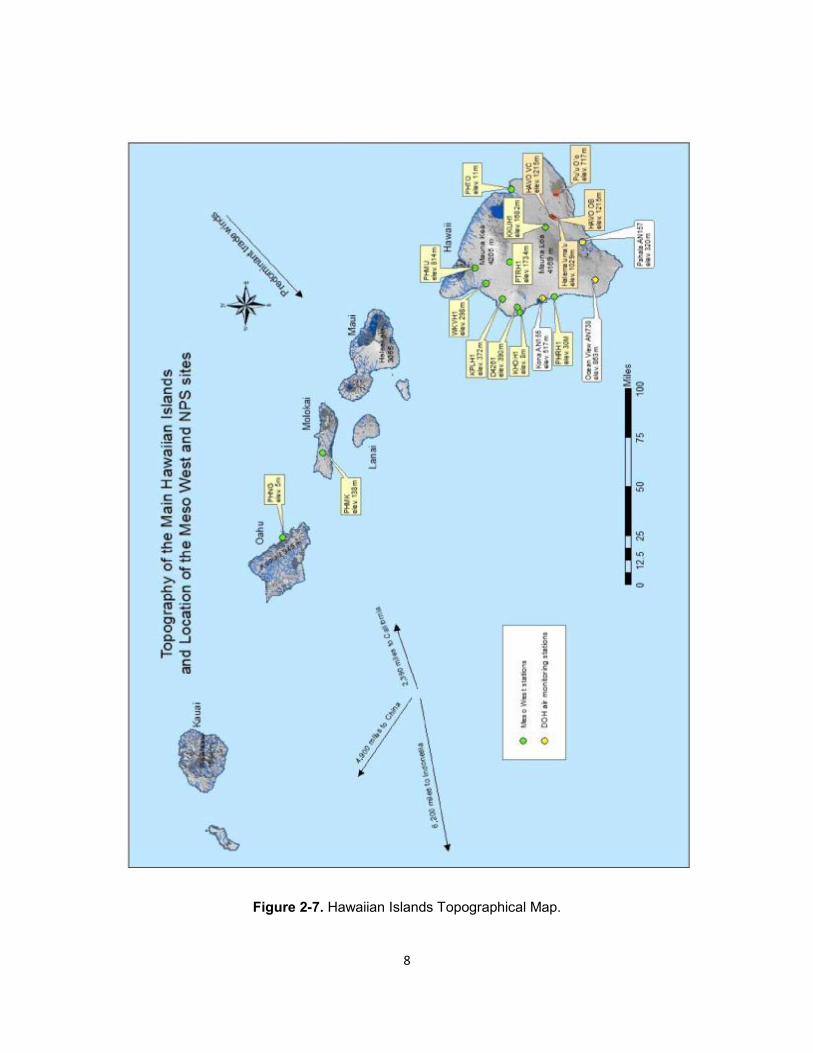
Figure 2-6 is a topographical map of the Big Island showing the locations of the two vents, the ambient air stations operated by DOH, and the location of large emission sources that include five power plants. Figure 2-7 is a topographical map of the main Hawaiian Islands with information on Meso West and NPS locations. Figure 2-8 is a map of the Hawaiian Islands showing the population bases.
Figure 2-6. Hawaii Island Topographical Map.
8
Figure 2-7. Hawaiian Islands Topographical Map.

9
Figure 2-8. Hawaiian Islands Population Map.

10
2.3 Transformation of SO2 to Sulfates (PM2.5) The SO2 released from the Kilauea volcano creates vog when SO2 reacts chemically with sunlight and constituents in the air to form sulfate aerosols. Effects from vog are evident from annual PM2.5 concentration exceedances measured at the Kona air monitoring station as well as the effects on visibility around the Big Island and on other islands hundreds of miles away from the Kilauea volcano. As the SO2 gas travels around the southern end of the island, it interacts with other atmospheric constituents to form particulates that affect communities farther away from the vents, such as Kona. When the winds shift to a southerly direction, the volcanic emissions, mainly as SO2 gas, are carried to towns northeast of the volcano, such as Mountain View and Hilo. Figure 2-9 is a satellite image that depicts this phenomenon.
Figure 2-9. Satellite Image of Vog (courtesy NOAA).
The transformation of SO2 from the Kilauea volcano into aerosol particles, of which PM2.5 is a subset, is discussed in Ref. 7. The reference notes that SO2 is depleted from the air by deposition (dry or wet) in the boundary layer or through chemical reaction to sulphuric acid (H2SO4). It notes that for the time period from 2007-2012, Kilauea SO2 persists in the environment in the range of 16 to 57 hours, and states: "lifetimes are highest in summer when cloud cover is smallest, and shorter for higher cloud fractions in spring and autumn". It further states: "On average, we find a mean SO2 lifetime of 1.56 days, which is consistent with previous studies."

11
2.4 SO2 Emissions The Kilauea volcano on the island of Hawaii has been erupting almost continuously since1983 typically emitting approximately 2,000 tons of SO2 per day. The SO2 is currently beicraters. Prior to December 2007, approximately 200 tons of SO2 came from the
2007, the SO2 emission rate began to increase; and on March 13, 2008, a new gas vent 2 from this location ten-fold, from 200 to
2,000 tons per day. Figure 2-10 below represents the emissions in tons per year from the Kilauea volcano at the HaUnited States Geological Survey (USGS), who provides periodic updates of final emissions estimates; the most recent report (Ref. 4) includes data through 2010.
Figure 2-10. Kilauea Volcano Annual SO2 Emission Rates 1992-2010
Figures 2-11 and 2-12 below show the average daily output of SO2 during 2011 and 2012 as gathered from the Hawaii Volcanoes Observatory Daily Updates. Preliminary emissions estimates are provided in the The daily averages for each month were derived by totaling the daily output from each vent for each month, and dividing the total by the number of days in the month.
0
200,000
400,000
600,000
800,000
1,000,000
1,200,000
1,400,000
1992
1993
1994
1995
1996
1997
1998
1999
2000
2001
2002
2003
2004
2005
2006
2007
2008
2009
2010
SO T
ons p
er y
ear
Year
Kilauea Volcano Annual SO Emission Rate 1992-
Halema'uma'u
Pu'u O'o

12
Figure 2-11. Kilauea Volcano Average Daily Output of Sulfur Dioxide (SO2) for 2011
Figure 2-12. Kilauea Volcano Average Daily Output of Sulfur Dioxide (SO2) for 2012
impact on air
located at a higher elevation and more inland, volcanic emissions would tend to drift more over the island than out to the ocean. Conversely, trade winds would tend to push
331 331
1224
98
608
999 985 925
477 501 424 498
683 524
520
456
686
709 793 654
528 526 518
660
0
500
1000
1500
2000
Jan Feb Mar Apr May Jun Jul Aug Sep Oct Nov Dec
Tons
of S
O
Month
Kilauea Volcano Average Daily Output of Sulfur Dioxide (SO ) for 2011
Halema'uma'u
Pu'u O'o
316
599 565 586 473 445 352 348 266 282 313 262
1092 718 736 742
708 834
732 833 841 869
621 861
0
500
1000
1500
2000
Jan Feb Mar Apr May Jun Jul Aug Sep Oct Nov Dec
Tons
of S
O
Month
Kilauea Volcano Average Daily Output of Sulfur Dioxide (SO ) for 2012
Halema'uma'u
Pu'u O'o

13
ent more over the ocean because this vent is located at a lower elevation and closer to the coast. The higher annual PM2.5 concentration recorded at the Kona air monitoring station in 2012 is likely the result of a much greater release of SO2 2012 than in 2011. In 2012, SO2 tons per year greater than what it released in 2011. The quantity of SO2 released from
ear greater than that This correlates to the premise that the
Emissions from the volcano are considerably higher than those from anthropogenic sources in Kona. The SO2 emissions from the volcano were as high as 447,566 tons per year and 438,958 tons per year for 2011 and 2012, respectively. A comparison of volcano emissions to those from significant anthropogenic sources in Kona found that PM2.5 and PM2.5 precursors of NO2 and SO2 are only 1% of the total emissions (anthropogenic PM2.5, NO2, and SO2 + volcanic SO2). This shows that Kilauea volcano is the primary source contributing to annual PM2.5 concentration exceedances. Concentration versus time plot comparisons of annual PM2.5 and SO2 from Kona and Ocean View air monitoring stations show plots that match well between the two stations over the 2011 to 2012 time frame. It should be noted that these stations are 28 miles apart. Similar plots for the two monitoring stations indicate a large regional source is affecting the air quality at the monitoring sites. The Kilauea volcano is a large regional source that is not reasonably controllable or preventable and is the most likely source of emissions responsible for this correlation. Air pollution control measures provided by regulations that apply to anthropogenic sources in the Kona area, including the HAR, PSD/BACT, NSPS, and NESHAP, are adequate and should be considered reasonable for minimizing PM2.5 and PM2.5 precursors from permitted sources. Please refer to Section 4.12 for the applicable regulations. As stated in Section 4.13, Title V sources, which include all large facilities in the Kona area, are inspected each year to ensure equipment is operated within the terms of the permits. Air monitoring data for 2011 and 2012 shows a decrease in annual SO2 concentration from the Pahala to the Ocean View stations and a further decrease from the Ocean View to Kona stations while there is an increase in annual PM2.5 concentration from Kona to the Ocean View stations and an additional increase from the Ocean View to Pahala stations. This supports the concept that SO2 is converting to sulfates in the wake of th -to-Ocean View-to-Kona. Figure 2.9 shows vog created from gases released by the Kilauea volcano. The presentation by Rudy Husar also illustrates the conversion of SO2 to
http://datafedwiki.wustl.edu/images/6/6d/130919_Hawaii_EE_DSS.ppt. The transport

14
path for SO2 released by the volcano is consistent with what would be expected based on wind patterns for the island. As indicated in Section 2.2, prevailing trade winds from the northeast usually travel over the island, wrap around South Point, and then travel up the Kona coast. In Section 3, additional information is provided on the diurnal wind pattern that traps pollutants in the Kona area. It should be noted that emissions from sources located on the Hilo side of the Big Island would rarely follow the identical transport path as emissions from either the
o craters. At minimum, a northeast trade wind would be required for emissions from sources located in Hilo to follow the same transport path as that o vents. Although the Hawaiian Islands are dominated by northeast trade winds, the winds in the Hilo area are heavily influenced by Mauna Kea and Mauna Loa, producing a dominant southerly wind flow. This phenomenon can be seen by examining wind roses of two (2) sites. Section 3, Figure 3-10 (left) illustrates a dominant northeast trade wind flow from a meteorological site at Molokai Airport. This site is not influenced by high mountain ranges. In contrast, Section 3 Figure 3-12 (left) illustrates the dominant southerly wind flow at the Hilo International Airport due to the diurnal heating and cooling effects of Mauna Kea and Mauna Loa. The Waimea area of the Big Island, approximately 55 miles nort u
u o craters was also examined to address the effects of source emissions from this location. The winds in this area are also heavily influenced by Mauna Kea and most likely prevents emissions from the Waimea area to follow the same transport path as emi o vents. 2.6 Hawaii Island Attainment Status The Big Island of Hawaii attainment/non-attainment status is currently unclassifiable for PM2.5, NO2 and SO2 due to the Kilauea volcano.

15
Section 3. Causal Relationship
The primary purpose of this effort is to analyze PM2.5 monitoring data sets from the Kona monitor on the island of Hawaii with respect to the significant volcanic emissions from the Kilauea volcano. This work is intended to provide supporting documentation for the exclusion of datasets under the Exceptional Events Rule (EER). To accomplish this:
Volcanic SO2 emission information from the United States Geological Survey (USGS) and SO2 and PM2.5 pollutant and wind monitoring data from the United States National Parks Service (NPS) were examined (Ref. 9);
SO2, PM2.5, and wind monitoring data sets from the United States Environmental Protection Agency (EPA; Ref. 10) and University of Utah MesoWest (MesoWest) were analyzed (Ref. 11);
Additional relevant wind monitoring data was examined with respect to potential pollutant transport paths; and
The proposed exceptional event days for Kona were examined relative to relevant monitoring data.
located at a higher elevation and further inland, appears
to have a greater impact on the more vent, which is situated at a lower elevation and closer to the coast. The prevailing
more directly to the town of Pahala and Ocean View, and subsequently up the Kona coast. During days with southerly winds, the Kona area clears up as to Hilo and Mountain View. During Kona or southerly winds, the vog from Kilauea travels up to the other islands in the chain. The DOH-CAB monitors the weather forecasts for these Kona wind days as the vog creates widespread haze (see Figure 3-1) and elevated PM2.5 levels can be seen at the stations on Maui, Oahu, and/or Kauai. To date, the vog has not resulted in PM2.5 exceedances on these islands. However, on such days, the DOH-CAB often declares no-burn for agricultural burning on these islands as well as for the east side of Hawaii Island in order to protect human health and prevent additional particulate pollution. Historically, the majority of no-burn days occur during the winter months, when Kona winds are more likely to occur. The analysis shows that high PM2.5 concentrations measured at the Kona air monitoring station are the result of SO2 vents (Figure 2-7). SO2 transported from north of Kona would have the SO2 decreasing from Kona, through Ocean View, and on to Pahala. PM2.5 would grow from Kona to Pahala; neither of these is the case. A very large PM2.5 north of Kona would not explain the increasing SO2 concentrations monitored as the postulated pollutant is transported from Kona, to Ocean View and to Pahala.
16
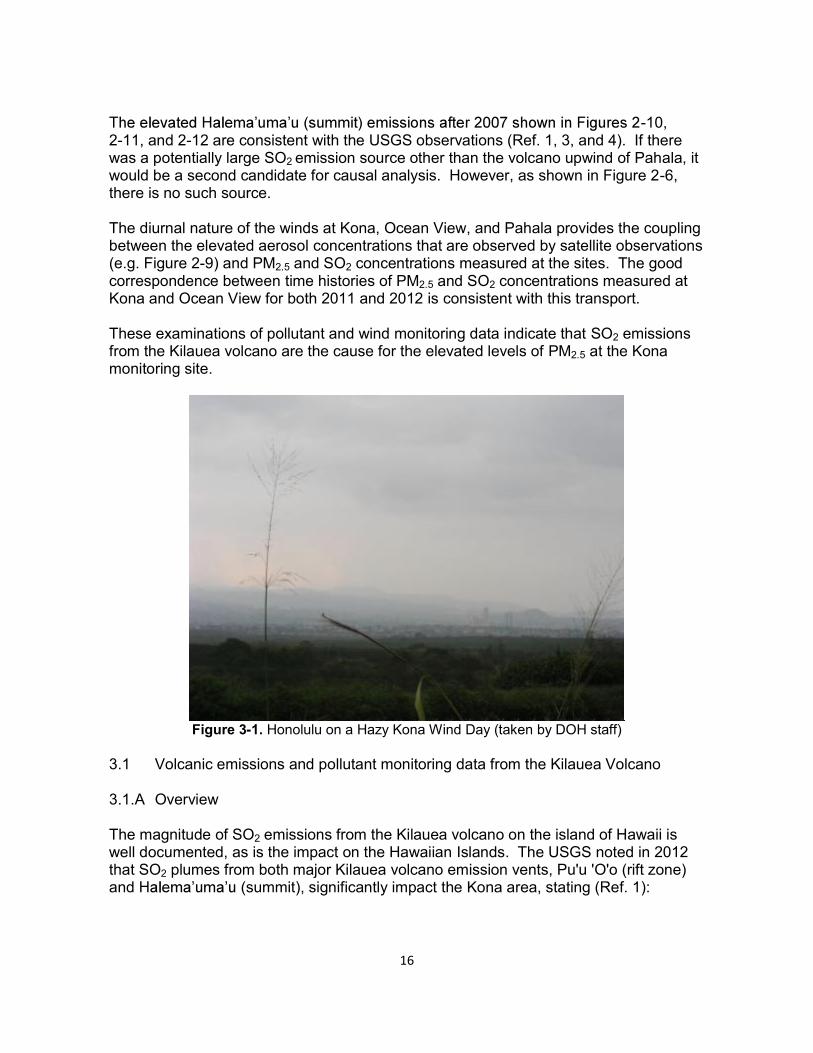
-10, 2-11, and 2-12 are consistent with the USGS observations (Ref. 1, 3, and 4). If there was a potentially large SO2 emission source other than the volcano upwind of Pahala, it would be a second candidate for causal analysis. However, as shown in Figure 2-6, there is no such source. The diurnal nature of the winds at Kona, Ocean View, and Pahala provides the coupling between the elevated aerosol concentrations that are observed by satellite observations (e.g. Figure 2-9) and PM2.5 and SO2 concentrations measured at the sites. The good correspondence between time histories of PM2.5 and SO2 concentrations measured at Kona and Ocean View for both 2011 and 2012 is consistent with this transport. These examinations of pollutant and wind monitoring data indicate that SO2 emissions from the Kilauea volcano are the cause for the elevated levels of PM2.5 at the Kona monitoring site.
Figure 3-1. Honolulu on a Hazy Kona Wind Day (taken by DOH staff)
3.1 Volcanic emissions and pollutant monitoring data from the Kilauea Volcano
3.1.A Overview The magnitude of SO2 emissions from the Kilauea volcano on the island of Hawaii is well documented, as is the impact on the Hawaiian Islands. The USGS noted in 2012 that SO2 plumes from both major Kilauea volcano emission vents, Pu'u 'O'o (rift zone) and summit), significantly impact the Kona area, stating (Ref. 1):

17
"Unfortunately, both plumes eventually reach the west side of Hawai`i Island in a "doublewhammy" of combined effects, resulting in an especially dense and nearly constant haze of vog along the Kona coast."
The use of the term "nearly constant haze of vog" is consistent with the nearly constant elevated level of PM2.5 and SO2 measured at the Kona monitoring station; monitoring site location and general information available at reference 2. The USGS noted the direct relationship between Kilauea SO2 emissions and elevated levels of SO2 and sulfate particles at Kona in their March 7, 1997 "Hawaii Volcano Observatory, Volcano Watch" webpage stating (Ref. 2a):
"This 90% decrease in released SO2 gas from Kilauea is very good news for Kona residents, for it means that there is simply much less gas to be blown by the prevailing trade winds from degassing sources on Kilauea around South Point, and up along the Kona coast, where it is trapped by the onshore-offshore daily wind regime. On this journey, there is also less gas to react chemically with sunlight, oxygen, dust and water to form the sulfuric acid and other sulfate particles that cause the visible pollution that had become so ubiquitous for Kona residents and visitors."
In 2008, the USGS discussed the connection between elevated SO2 emissions from the Halema`uma`u vent and PM2.5 exceedances around Kona and Pahala (Ref. 2b); this would also include the Ocean View area. Key conditions and observations described by USGS in the article were:
"During prevailing trade winds, the east rift gas plume is generally blown out to sea, where it is dispersed and diluted before being carried back onshore to impact downwind communities. The Halema`uma`u plume remains onshore and is generally blown through the Ka`u desert to directly affect downwind communities." "Since the new activity at Halema`uma`u began, the EPA standards for SO2 have been exceeded on numerous occasions in Pahala, and for particulate matter they have been exceeded in both Pahala and Kona. The Pahala air quality monitoring station, which was installed in August 2007, only measured exceedance of SO2 standards after the opening of the Halema`uma`u vent in March 2008." (See Figure 2-10)
To further examine the link between the volcano and Kona PM2.5 measurements, the SO2 emission time history was examined. The USGS monitors SO2 emissions from Kilauea vents at the rift zone and summit and reports preliminary values at their "Recent Kilauea Status Reports, Updates, and Information Releases" webpage (Ref.3). While these values are preliminary, the USGS provides periodic updates of final emissions estimates, the most recent of which includes data from 2007 through 2010. This latest report (Ref. 6) includes one reference that estimates Kilauea's 2007-2010 SO2 average of 751,000 metric tonnes per year (approximately 828,000 tpy), and notes that this is

18
approximately 6% of the global volcanic SO2 emissions. In addition to providing the total emissions, the report also documents the time history of relative emission from the summit and rift zone from 2000 through the end of 2010, showing the shift in emissions from being dominated by the rift zone through 2007, to a more even division in 2009, with somewhat greater emissions from the summit into 2010 (see Figure 31 of Ref. 6). The NPS monitors SO2 and PM2.5 levels, along with weather information within the Kilauea National Park from the Hawaii Volcanoes National Park - Visitor Center and Hawaii Volcanoes National Park - Observatory, located near and to the northeast and northwest of the summit vent (See Figure A-1). 3.1.B USGS SO2 Emissions Estimates & NPS Pollutant and Wind data
Using the preliminary SO2 emissions information posted on the USGS website (Ref. 5), DOH calculations show a slight decrease in the total SO2 emissions from the summit and rift zone vents between calendar years 2011 and 2012 (see Figures A-2, A-3), with summit emissions increasing by approximately 33% and rift zone decreasing by 35%. These DOH calculation result in total annual SO2 emissions for 2011 and 2012 of approximately 448,000 tons per year and 439,000 tons per year, respectively. The increase in SO2 emissions from the summit of Kilauea is noteworthy since, consistent with the USGS 2008 web posting (Ref. 4) discussed previously, it would indicate an expectation for increased SO2 and particulate levels for the Pahala, Ocean View, and Kona areas for 2012 relative to 2011.
Table 3-1. 2011-2012 USGS preliminary SO2 emissions data compiled by DOH
The preliminary USGS SO2 emission estimate was compared to the SO2 and PM2.5 monitoring data from the Kilauea Observatory (HAVO OB), and SO2 monitoring data from the Kilauea Visitor Center (HAVO VC). For the time-wise comparisons of SO2 emissions and pollutant monitoring, daily values were normalized to their respective annual averages to account for magnitude differences. Figures A-4 through A-9 present the preliminary SO2 emission estimates with blue lines and the NPS monitoring data (Ref. 9) with red dots. The normalized emission levels are seen to generally be relatively flat compared to the monitored levels, and there is no significant correlation between any of the paired emission and monitored datasets. While these paired data sets corresponded poorly, this is consistent with the local wind patterns, which tend to transport volcanic emissions away from the two monitoring sites. The pronounced
2011 Daily Average
2012 Daily Average 2011 to 2012
USGS webpage based DOH estimate of Kilauea Volcano
SO2 Emission Rate
SO2 (Tonnes / day)
SO2 (Tonnes / day) % change
Summit 550 726 32%Rift Zone 563 362 -36%
Total 1,112 1,088 -2%

19
difference between the prevailing winds and pollutant approach direction is indicated in Figures A-10 through A-13. For each figure, the windrose and pollution windroses are presented on the left and right, respectively. The windroses graphically present the total hourly occurrences of winds approaching from the indicated 15 degree quadrants during the monitoring year. The pollution windroses graphically present the total hourly pollutant levels associated with winds approaching from the indicated 15 degree quadrants during the monitoring year. Figures A-10 and A-11 show winds approaching HAVO OB for 2011 and 2012 from the northeast, while SO2 approaches from the north and southeast. Figures A-12 and A-13 show winds approaching HAVO VC from the northeast, with SO2 approaching from the southwest. As can be seen with the aid of Figure A-1, the southerly approach directions for indicated by the pollution windroses for HAVO OB and HAVO VC are consistent with approximate line of sight transport from the nearby summit (Halema`uma`u ) vent. The northern approach of SO2 to HAVO OB would be consistent with the partial return of Kilauea summit emissions that are initially transported north of HAVO OB and then return. Recent satellite based Kilauea SO2 emission estimates have indicated that emission levels for March through November 2008 that are about 3 times larger than those previously estimated by the USGS using ground based measurements (Ref. 7). The USGS is reviewing these preliminary Kilauea SO2 emission estimates, as well as values in prior published reports (e.g. Ref. 6), for possible revision. Changes in the USGS ground based measurement methods are also being developed to improve measurement accuracy and address the estimate differences reported in reference 7. The emission levels after revision are currently expected to result in day to day variations that will appear similar to those previously published, but with larger values overall (Ref. 8). 3.1.C Discussion While the USGS SO2 emissions estimates for 2011 and 2012 are preliminary, and may be revised upward by USGS, they provide an indication of the magnitude of the total emissions as well as relative emissions associated with the summit and rift zone. Based on the 2008 USGS assessment (Ref. 4), the growth in Kilauea summit SO2 emissions from 2011 to 2012, from about 221,000 tpy to 293,000 tpy, is consistent with the increase in SO2 and particulate levels at Kona, Ocean View, and Pahala between 2011 and 2012. 3.2 Pollutant monitoring data from Kona, Ocean View, and Pahala
3.2.A Overview The locations of DOH pollutant and weather monitors at Kona, Ocean View, and Pahala are shown in Figure 2-7. PM2.5 and SO2 monitoring data from these monitors were downloaded from the EPA AQS Data Mart (Ref. 10). The AQS designations for the Kona, Ocean View, and Pahala monitors are 150011012, 150012020, and 150012016, respectively. The AQS designation for the PM2.5 and SO2 pollutants are 88101 and

20
42401, respectively; there is an extra "1" at the end of the AQS ID number for datasets downloaded from the AQS Data Mart Data (e.g. the Kona PM2.5 ID number is 150011012881011). For each monitoring site and pollutant, pollutant concentrations are nominally reported hourly. The measurement units for PM2.5 and SO2 presented in
ion (ppb), respectively. Wind direction data associated with these three monitors, as well as for other relevant monitors, was obtained from the University of Utah MesoWest website (Ref. 11). The weather monitors associated with the Kona, Ocean View, and Pahala pollutant monitoring sites are identified by MesoWest as AN155, AN738, and AN157. To confirm apparently erroneous wind direction measurements at the Kona site during the middle of calendar year 2012, data from 3 additional monitoring sites were examined. These sites are identified by MesoWest as D4261, KHOH1, and PHRH1. The locations of these monitoring sites and additional ones discussed in this Section 3.2 are shown in Figure 2-7. It is important to note that the annual average values presented in throughout Section 3.2 were calculated by averaging all daily values based on all hourly data downloaded from the AQS Data Mart for both PM2.5 and SO2. This calculation method was used to produce a value for normalizing individual datasets, and will not produce the exact results reported in the Introduction (e.g 12.1 µg/m3 and 16.2 µg/m3 for 2011 and 2012 Kona PM2.5, respectively). However, for the purpose of normalizing the downloaded AQS dataset, it is an appropriate methodology and result. The calculations were made using heritage subroutines and limited time and the risk of introducing errors made revisions very unwise considering that the calculation results were used only for this section's visualization and trend establishment purposes. 3.2.B Annual Average for Normalization of PM2.5 and SO2 Pollutant Concentrations Annual average PM2.5 and SO2 concentration levels from the Kona, Ocean View, and Pahala monitoring sites were calculated for dataset normalization purposes with data from the EPA AQS Data Mart. For all datasets, the nominal hourly measurement values were averaged for each day, and annual averages were calculated by averaging the daily values for a given calendar year. Negative concentration values were included in the averaging process. The annual average for concentrations for PM2.5 and SO2, as well as the percentage increase between 2011 and 2012 (using 2011 as the baseline) are shown in Tables 3-2 and 3-3, respectively. Two important characteristics appear very clear from these values. First, all monitoring sites show pollutant concentration increases between 2011 and 2012. These results, when coupled with the 2008 USGS web posting (Ref. 4), are consistent with the estimated 32% increase in SO2 emissions from the Kilauea summit; while a range of sources may have had a similar level of change between years, the very large nature of the Kilauea source and it's associated regional impact is unique. Second, the effect of the chemical transformation from SO2 into PM2.5 as the prevailing winds carry the pollutants from Pahala, to Ocean View, and finally up to Kona (as discussed in the 1997 USGS web posting, Ref. 3). For both years, the annual average PM2.5 concentrations increase from the smallest values at Pahala, to Ocean View, and finally at the Kona site (Table 3-2). Likewise, the annual

21
average SO2 concentrations decrease from the largest values at Pahala, to Ocean View, and the Kona site (Table 3-3).
Table 3-2. 2011-2012 AQS Data Mart Hourly PM2.5 Data: Annual Averages
Table 3-3. 2011-2012 AQS Data Mart Hourly SO2 Data: Annual Averages
Thus, annual average concentration levels for normalization are consistent with both the annual average SO2 emissions from the Kilauea summit, the expected pollutant transport path, and the expected chemical transformation process. 3.2.C 2011 PM2.5 and SO2 Pollutant Concentrations at Kona & Ocean View The USGS well outlines the expected transport path for pollutants originating from the Kilauea volcano (Refs. 2, 3, 4), and the annual average pollutant levels are consistent with this description. However, it was recognized that additional confirmation of the linkage between volcanic emissions and monitoring levels could potentially be gleaned from the pollutant time histories measured at the Kona, Ocean View, and Pahala monitoring sites. The linkage between Kona and Ocean View datasets, particularly for the PM2.5 pollutant, are very evident from a casual comparison of the plotted time histories (Figure 3-2). The PM2.5 concentration peaks and valleys are seen to match quite well throughout 2011. Note that the time histories presented in this section plot the average of the three daily average values for normalization, centered on the middle (second) day. This smoothing was performed to represent time lag associated with pollutant transport between Ocean View and Kona, as well as provide some smoothing of the large short scale concentration variations that are characteristic of these datasets. The degree of smoothing, plus and minus one day about the center point, is also consistent with the estimated SO2 average lifetime of 1.56 days discussed in Section 2-3 (Ref. 7).
2011 Annual Ave 2012 Annual Ave 2011 to 2012Monitor % change
Kona 12.23 16.18 32%Ocean View 10.03 12.97 29%
Pahala 6.18 7.59 23%
2011 Annual Ave 2012 Annual Ave 2011 to 2012Monitor SO2 (ppb) SO2 (ppb) % change
Kona 2.88 5.36 86%Ocean View 13.38 23.06 72%
Pahala 33.64 52.16 55%

22
Figure 3-2. 2011 Time History of Kona (red) and Ocean View (blue) PM2.5 Concentrations
For comparison, the plot without smoothing is shown in Figure A-14. In both figures, the Pearson correlation (r2 ; Ref. 12), a quantitative indication of how well the two concentration time histories match, are given below the "AQS Date (Month / Year)" label and are seen to be similar; approximately 0.65 for the smoothed case shown in Figure 3-2 versus approximate 0.56 without smoothing (Fig. A-14); a r2 value of one is the maximum correlation value. The annual average values are calculated using the daily values used for plotting. Because the smoothing weights the concentration values for the first and last data values at half the value as the remaining 363 for calendar year 2011, the annual average values are seen to be very slightly different between the smoothed and unsmoothed pl 3 for 2011 Kona with smoothing
3, the value represented in Table 3-2, without smoothing).
At the bottom of Figure 3-2, the annual average PM2.5 concentrations for Kona and Ocean View are shown. The Kona concentration is seen to be approximately 20% larger than for Ocean View. The time histories for Kona and Ocean View show the Kona PM2.5 concentrations are generally slightly higher than those at Ocean View. This is consistent with the USGS description of the expected transport path of Kilauea volcano SO2 and its chemical conversion into sulfate particulates. In an attempt to better visualize the correspondence between the pollutant concentrations at the monitoring sites, their time histories were normalized with respect to their annual averages.

23
In Figure 3-3, for example, Kona PM2.5 concentrations throughout 2011 were divided by the annual average of the daily PM2.5 concentrations (after smoothing), and likewise for Ocean View PM2.5 concentrations. Through normalization, the relative similarities and differences in the two time histories appear easier to identify. Because the annual averages for the two sites differ by only about 20%, Figure 3-2 and 3-3 appear quite similar.
Figure 3-3. 2011 Time History of Kona (red) and Ocean View (blue) normalized PM2.5
Concentrations However, Figure 3-3 does assist in showing that the PM2.5 concentration time histories at Kona and Ocean View correspond well. It should be noted that correlation values (r2) shown in the two figures are identical. This is a feature of the Pearson correlation algorithm, which remains unchanged if one or both datasets are multiplied by a constant. The good correspondence between the Kona and Ocean View PM2.5 time histories though 2011 is continued in 2012. Figure 3-4 shows the smoothed concentrations for 2012; the unsmoothed plot is shown in Figure A-15, and is seen to be similar. As would be expected from the increased SO2 emissions from the Kilauea summit, the annual average of the PM2.5 concentrations at both sites are greater in 2012 than in 2011. The

24
correlation value (r2) associated with 2012 is only slightly smaller in 2012 than in 2011, approximately 0.57 versus 0.64.
Figure 3-4. 2012 Time History of Kona (red) and Ocean View (blue) PM2.5 Concentrations
While the seasonal PM2.5 concentration highs and lows are noticeably different between 2011 and 2012, this is to be expected considering the coupling of Kilauea SO2 emissions variability winds. The normalized 2012 PM2.5 time histories for Kona and Ocean View are shown in Figure 3-5. Perhaps more than with the 2011 datasets, it appears that the good correspondence between pollutant time histories is more evident when the datasets are normalized.

25
Figure 3-5. 2012 Time History of Kona (red) and Ocean View (blue) Normalized PM2.5
Concentrations The very large SO2 emissions from the Kilauea volcano would be expected to follow a similar path to Kona as particulates. To examine this assertion, the correspondence between the time histories of SO2 concentrations at Kona and Ocean View is presented for 2011 and 2012 in Figures 3-6 and 3-7, respectively. These figures include the same temporal smoothing (3 day center average) and normalization that were used in Figures 3-3 and 3-5.
26
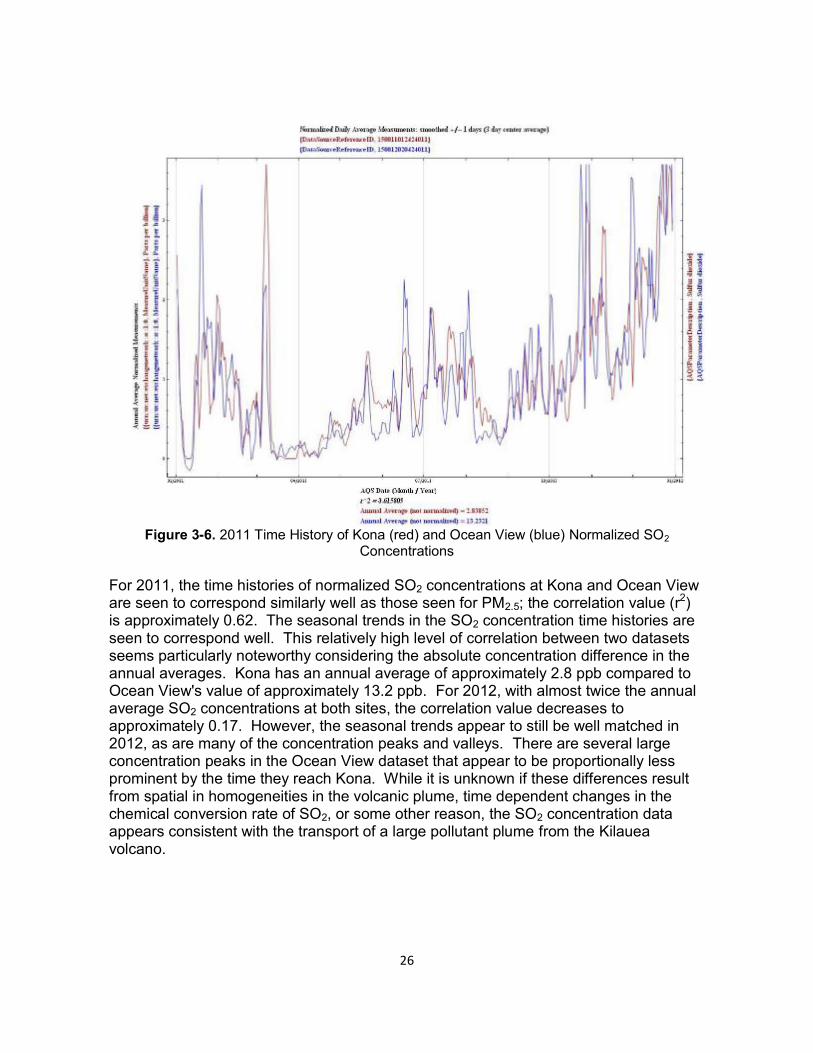
Figure 3-6. 2011 Time History of Kona (red) and Ocean View (blue) Normalized SO2
Concentrations For 2011, the time histories of normalized SO2 concentrations at Kona and Ocean View are seen to correspond similarly well as those seen for PM2.5; the correlation value (r2) is approximately 0.62. The seasonal trends in the SO2 concentration time histories are seen to correspond well. This relatively high level of correlation between two datasets seems particularly noteworthy considering the absolute concentration difference in the annual averages. Kona has an annual average of approximately 2.8 ppb compared to Ocean View's value of approximately 13.2 ppb. For 2012, with almost twice the annual average SO2 concentrations at both sites, the correlation value decreases to approximately 0.17. However, the seasonal trends appear to still be well matched in 2012, as are many of the concentration peaks and valleys. There are several large concentration peaks in the Ocean View dataset that appear to be proportionally less prominent by the time they reach Kona. While it is unknown if these differences result from spatial in homogeneities in the volcanic plume, time dependent changes in the chemical conversion rate of SO2, or some other reason, the SO2 concentration data appears consistent with the transport of a large pollutant plume from the Kilauea volcano.

27
Figure 3-7. 2012 Time History of Kona (red) and Ocean View (blue) Normalized SO2
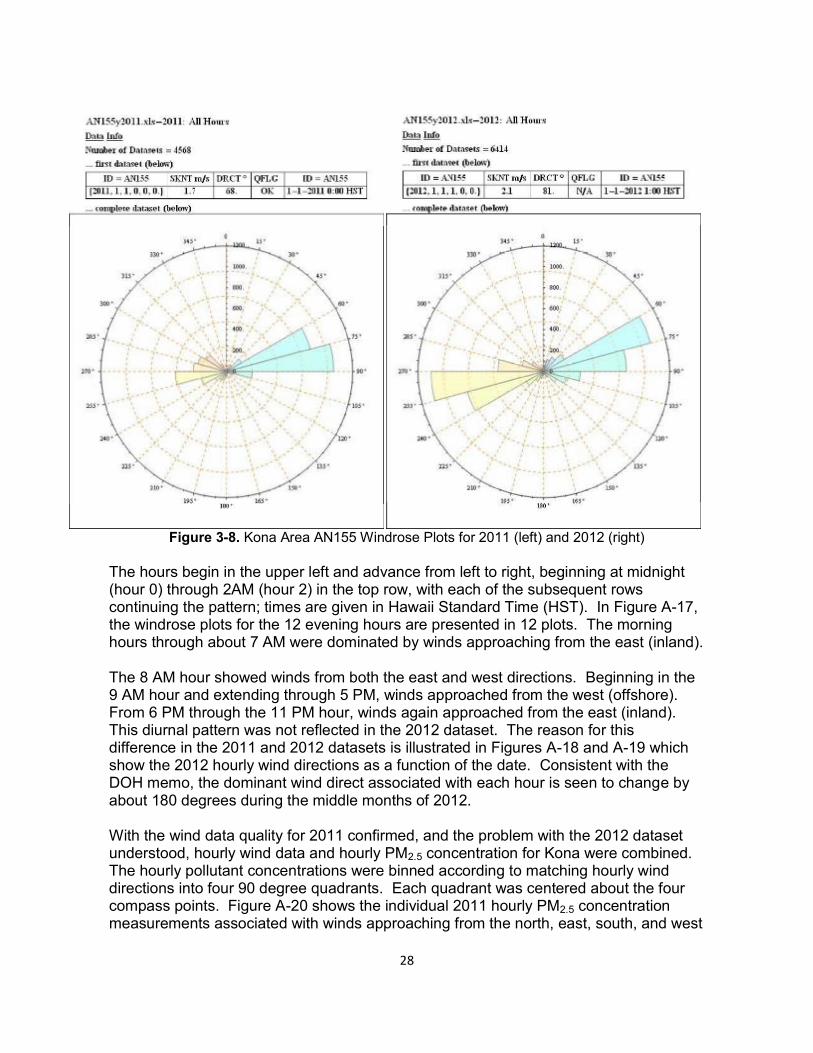
Concentrations The 1997 USGS webpage (Ref. 3) described the Kona pollutants of volcanic origin being "trapped by the onshore-offshore daily wind regime". This description was evaluated. Hourly monitored PM2.5 pollutant concentrations for 2011 and 2012 were combined with hourly wind direction data from the collocated AN155 monitor. Hourly wind direction data was also examined. During the review of hourly wind data from the AN155 monitor, it was noted that the windrose for AN155 had an increased frequency of wind approaching from the west (Figure 3-8). Upon further review, it was found that concern about this issue had previously been noted in an October 2012 memo (Ref. 9) which identified that "Kona - Wind direction sensor, all readings were approximately 180 degrees off". An examination of the 2011 AN155 wind direct data showed the consistent diurnal wind pattern indicated in the USGS document. In Figure A-16, the windrose plots for the 12 morning hours are presented in 12 plots.
28
Figure 3-8. Kona Area AN155 Windrose Plots for 2011 (left) and 2012 (right)
The hours begin in the upper left and advance from left to right, beginning at midnight (hour 0) through 2AM (hour 2) in the top row, with each of the subsequent rows continuing the pattern; times are given in Hawaii Standard Time (HST). In Figure A-17, the windrose plots for the 12 evening hours are presented in 12 plots. The morning hours through about 7 AM were dominated by winds approaching from the east (inland). The 8 AM hour showed winds from both the east and west directions. Beginning in the 9 AM hour and extending through 5 PM, winds approached from the west (offshore). From 6 PM through the 11 PM hour, winds again approached from the east (inland). This diurnal pattern was not reflected in the 2012 dataset. The reason for this difference in the 2011 and 2012 datasets is illustrated in Figures A-18 and A-19 which show the 2012 hourly wind directions as a function of the date. Consistent with the DOH memo, the dominant wind direct associated with each hour is seen to change by about 180 degrees during the middle months of 2012. With the wind data quality for 2011 confirmed, and the problem with the 2012 dataset understood, hourly wind data and hourly PM2.5 concentration for Kona were combined. The hourly pollutant concentrations were binned according to matching hourly wind directions into four 90 degree quadrants. Each quadrant was centered about the four compass points. Figure A-20 shows the individual 2011 hourly PM2.5 concentration measurements associated with winds approaching from the north, east, south, and west

29
(from top to bottom in the figure). The average concentrations associated with the 3 from the west (offshore) and 13.5
3 from the east (onshore); the values associated with the less frequent approaches 3 3, respectively. The relatively
small difference between the average 2011 PM2.5 concentrations approaching from onshore versus offshore is consistent with the USGS description of pollutants trapped by the local wind pattern. The 2012 hourly PM2.5 and wind datasets were plotted without attempting to correct for the know issue with the wind direction. Figure A-21 shows the result of this combining of the two datasets. While an accurate correction of the wind direction could have been made based on the prevailing diurnal wind pattern, it was felt that the significance of this effort would have been negligible for the purposes of this effort. By visual inspection, the east approaching and west approaching data values for the middle of 2012 do not appear to be significantly different. Without correction, the average PM2.5 concentration for winds approac 3 3 from the east (onshore); the values associated with the less frequent approaches from
3 3, respectively. As with 2011, the relatively small difference between the average 2012 PM2.5 concentrations approaching from onshore versus offshore is consistent with the USGS description of Kilauea pollutants trapped by the local wind pattern. 3.2.D Seasonal PM2.5 and SO2 Correlations at Kona, Ocean View and Pahala An examination of the effect of seasonality has on the correlation between PM2.5 and SO2 concentrations at Kona, Ocean View, and Pahala for 2011 and 2012 was made. Each year was divided into four quarters, each three months in length, beginning with January. The results are shown for 2011 and 2012 in figures A-22 and A-23, respectively; note that these correlation calculations were made with the "unsmoothed" AQS datasets. The following observations were noted:
For 2011 and 2012 Kona and Ocean View PM2.5, the first quarter of the year had the best correlation (0.615 and 0.483 for 2011 and 2012, respectively). For 2011, the third quarter correlation value (0.613) was almost as large as the first quarter (0.615). For 2012, the second and third quarters were equal (0.384) and a fair amount less than the first quarter (0.483). For 2011 Ocean View and Pahala PM2.5, the first and fourth quarters had the best correlations (0.239 and 0.178 for the first and fourth quarters, respectively). This was also the case for 2012, with first and fourth quarter values of 0.117 and 0.133, respectively. For both 2011 and 2012, the second and fourth quarters had significantly lower correlation values, never exceeding 0.022. 2011 Kona SO2 correlated best with Kona PM2.5 during the second and third quarter with values of 0.469 and 0.499, respectively. 2011 Kona SO2 correlated best with the second and third quarters of Ocean View PM2.5 with values of 0.357 and 0.351,

30
respectively. 2011 Kona SO2 correlated best with the first and fourth quarters of Pahala SO2 with values of 0.351 and 0.281, respectively. 2012 Kona SO2 correlations had lower values than in 2011. The best correlations were with the second, third, and fourth quarters of Kona PM2.5 with values of 0.242, 0.252, and 0.271, respectively. 2011 Pahala SO2 correlated best with Ocean View SO2 in the first and second quarters, with values of 0.348 and 0.468, respectively. As previously noted, 2011 Pahala SO2 also correlated relatively well with the first and fourth quarters of Kona SO2. For 2012, Pahala SO2 correlated best with the first, third and fourth quarters of Pahala PM2.5, with values of 0.426, 0.219, and 0.207, respectively.
With only two years of data, the observations above seem insufficient to draw conclusions pertaining to seasonal effects. However, evaluation of the data by quarter does help to further illustrate the linkage between the Kona, Ocean View, and Pahala SO2 and PM2.5 datasets. 3.2.E Additional Relevant Wind Data The wind patterns associated with the island of Hawaii were discussed previously in Section 2-2 and illustrated in Figure 2-3. In this section, additional wind direction monitoring data from the Meso West website will be presented and discussed with respect to candidate pollutant transport pathways and source locations. 2012 data is presented, but 2011 data was also examined and is consistent with the 2012 data. The locations and elevations of the monitors are presented in Figure 2-7. While diurnal wind patterns dominate Kona monitoring site, trade winds can be seen to be predominant at higher elevations on the island of Hawaii (Fig. 3-9). In addition to the previously discussed HAVO VC and HAVO OB sites near the Kilauea summit vent, the Kamuela monitor (PHMU) situated in the northern part of Hawaii at an elevation of 814 meters. Winds from the north are also predominant for the Keaumo monitor located on the eastern side of Mauna Loa at an elevation of 1682 meters.

31
Figure 3-9. 2012 Kamuela (PHMU)(left) & Keaumo (KKUH1)(right) Windrose The predominance of trade winds can also be seen at lower elevations when the impact of local mountain are small, such as for the Kaunakakai, Molokai Airport (PHMK, 138 meter elevation) and Kaneohe Marine Corps Air Station (PHNG, 5 meter elevation) data sets shown in Figure 3-10. The PHMK and PHNG monitors are located on the islands Molokai and Oahu, respectively.

32
Figure 3-10. 2012 Kaunakakai, Molokai Airport (PHMK)(left) & Kaneohe, Marine Corps Air Station (PHNG)(right) Windrose
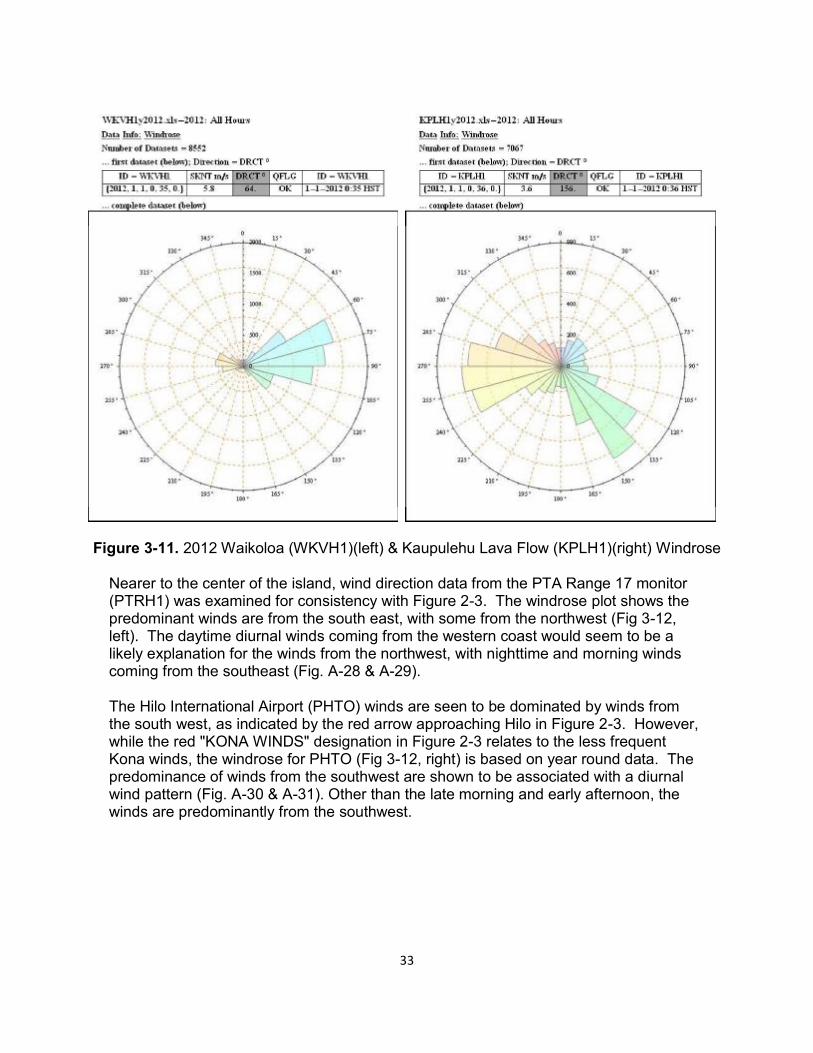
In the region north of Kona shown in Figure 2-3, the winds are seen to travel largely from east to west. That figure is consistent with the wind data from the Waikoloa monitor (WKVH1) (Fig. 3-11, left side). Hourly windrose plots are included in Appendix A (Fig. A-24 & A-25) and show the diurnal pattern of the wind for this monitor, with the dominant flow path being from the east. The Kaupulehu Lava Flow (KPLH1) monitor is also north of the Kona monitor, and like the Waikoloa monitor, is near the western coast. The winds associated with KPLH1 come mostly from the west and also the southeast (Fig. 3-12, right side). The diurnal wind pattern can be seen in the hourly windrose plots (Fig. A-26 & A-27).
33
Figure 3-11. 2012 Waikoloa (WKVH1)(left) & Kaupulehu Lava Flow (KPLH1)(right) Windrose
Nearer to the center of the island, wind direction data from the PTA Range 17 monitor (PTRH1) was examined for consistency with Figure 2-3. The windrose plot shows the predominant winds are from the south east, with some from the northwest (Fig 3-12, left). The daytime diurnal winds coming from the western coast would seem to be a likely explanation for the winds from the northwest, with nighttime and morning winds coming from the southeast (Fig. A-28 & A-29). The Hilo International Airport (PHTO) winds are seen to be dominated by winds from the south west, as indicated by the red arrow approaching Hilo in Figure 2-3. However, while the red "KONA WINDS" designation in Figure 2-3 relates to the less frequent Kona winds, the windrose for PHTO (Fig 3-12, right) is based on year round data. The predominance of winds from the southwest are shown to be associated with a diurnal wind pattern (Fig. A-30 & A-31). Other than the late morning and early afternoon, the winds are predominantly from the southwest.

34
Figure 3-12. 2012 PTA Range 17 (left) & Hilo International Airport (right) Windrose
Annual windroses for Pahala (AN157) and Ocean View (AN738) monitors show relatively even distributions of winds from two directions each. For Pahala (Fig. 3-13, left), winds arrive from the northwest and the east. For Ocean View, winds arrive from the northeast and the southwest. The diurnal nature of the winds can be seen in Fig A-32 and A-33 for Pahala, and Fig A-34 and A-35 for Ocean View. In both cases, morning and evening winds arrive from the direction of the mountain, and daytime winds arrive from the direct of the ocean. In section 3.2.B, the presence of diurnal winds at the Kona (AN155) monitor was discussed. The wind data presented in this section shows that diurnal wind patterns dominate in many areas, including those near the Ocean View (AN738) and Pahala (AN157) monitors. This diurnal pattern will couple with the bulk transport of pollutants from the Kilauea summit, around the bottom of the island, and up the western coast as described by the USGS (Ref. 3, 4).

35
Figure 3-13. 2012 Pahala (AN157)(left) and Ocean View (AN738)(right) Windrose
Considering the wind data discussed in this section the following observations are noted: As indicated in Figure 3-9 and 3-10, the predominance of trade winds is such that it seems unlikely that the occasional Kona winds would impact the analysis of seasonal average concentrations. Based on the SO2 chemical transformation description given in reference 7, it seems much more likely that seasonal weather conditions such as cloud cover, humidity, and precipitation would have a much great influence on SO2 and PM2.5 concentration variability. The predominance of winds from the south west monitored in the Hilo area reduce the likely hood that pollutants originating in Hilo would impact the pollutant levels monitored by the Kona monitor. 3.2.F Discussion The pollutant monitoring data from Kona, Ocean View, and Pahala shows decreasing SO2 concentrations (and increasing PM2.5) as prevailing coastal winds travel clockwise from Pahala, to Ocean View, and up to Kona. The monitoring data are consistent with

36
the Kilauea volcano SO2 transport and chemical conversion process described in references 3, 4, and 7, and discussed in Section 2-3. SO2 transported from north of Kona would have the SO2 decreasing from Kona, through Ocean View, and on to Pahala. PM2.5 would grow from Kona to Pahala. Neither of these is the case. A very large PM2.5 north of Kona would not explain the increasing SO2 concentrations monitored as the postulated pollutant is transported from Kona, to Ocean View and to Pahala. The magnitude of the Kilauea volcano SO2 emissions is well documented. The elevated
Figures 2-10, 2-11, and 2-12 are consistent with the USGS observations (Ref. 1, 3, and 4). If there was a potentially large SO2 emission source other than the volcano upwind of Pahala, it would be a second candidate for causal analysis. However, as shown in Figure 2-6, there is no such source. The diurnal nature of the winds at Kona, Ocean View, and Pahala provides the coupling between the elevated aerosol concentrations that are observed by satellite observations (e.g. Figure 2-9) and PM2.5 and SO2 concentrations measured at the sites. The good correspondence between time histories of PM2.5 and SO2 concentrations measured at Kona and Ocean View for both 2011 and 2012 is consistent with this transport. Note that while a direct comparison of the time histories of volcanic SO2 emissions are monitoring site pollutant measurements was not provided in the document, data sets were compared and the correspondence was not very good. This is not surprising considering the combination of emission characteristics (e.g. buoyancy), weather, wind, and chemistry involved. These examinations of pollutant and wind monitoring data indicate that SO2 emissions from the Kilauea volcano are the cause for the elevated levels of PM2.5 at the Kona monitoring site. 3.3 Examination of Proposed Kona Exceptional Events Days
3.3.A Overview The DOH identified days during 2011 and 2012 that are flagged for exclusion from the Kona dataset (see Appendix B). In 2011, there are two flagged days. In 2012, due to the added impact of the increased Kilauea summit SO2 emissions, there are 200 flagged days. In this section, the flagged days are presented with respect to annual PM2.5 time histories (unsmoothed) at Kona and normalized PM2.5 and SO2 concentrations at Kona and Ocean View. The purpose of these comparisons is to illustrate that the appropriateness of the flagging of these days.

37
3.3.B 2011 Flagged Days The daily average PM2.5 concentrations for 2011 are indicated in red on Figure 3-14.
Figure 3-14. 2011 Time History of Kona (red) PM2.5 Concentrations with Flagged Days (green)
The flagged days and measurement values are indicated by the green vertical lines and green dots. The average PM2.5 concentration used for normalization purposes of the
3 versus the annual average of all days (before flagging) of 3. The linkages discussed in Section 3.2.F between volcanic
emissions, the pollutant transport path / chemical conversion process, and the monitored concentration levels establish the causal link between elevated PM2.5 concentrations and the Kilauea volcano. As indicated in Figure 3-15, the two flagged days occur during peak periods of PM2.5 concentration (smoothed using 3 day center average, then normalized) at the Kona and Ocean View monitors.

38
Figure 3-15. Time History of Kona (red) and Ocean View (blue) Normalized PM2.5
Concentrations with Flagged Days (vertical broken lines) Figure 3-16 presents the normalized SO2 concentration data (smoothed using 3 day center average) for Kona and Ocean View with respect to the two flagged days. While the second flagged day is clearly associated with an SO2 peak at both monitoring sites, the first flagged day occurs during a period of time that indicates a good correspondence between measurements at the two monitoring sites. While SO2 concentration for the second day does not occur at relative peak, that is not surprising considering the range of weather and chemistry effects that can influence SO2 concentrations.

39
Figure 3-16. 2011 Time History of Kona (red) and Ocean View (blue) Normalized SO2
Concentrations with Flagged Days (vertical broken lines) The time history data presented in Figures 3-15 and 3-16 clearly indicates that PM2.5 and SO2 pollutant levels at Kona and Ocean View are strongly linked, and that linkage is due to the large SO2 emissions from the Kilauea volcano. Though only two days are flagged, the data indicates that pollutant levels are elevated throughout most of the year only because of those volcanic emissions. 3.3.C 2012 Flagged Days The daily average PM2.5 concentrations for 2012 are indicated in red on Figure 3-17. The flagged days and measurement values are indicated by the green vertical lines and green dots. The average PM2.5 3 versus the annual average of all days (before flagging, used for normalization purposes) of
3. For 2012, 200 days are flagged. The large number of flagged days is a direct result of the significant and persistent impact that Kilauea SO2 emissions have on the Kona area.

40
Figure 3-17. 2012 Time History of Kona (red) PM2.5 Concentrations with Flagged Days (green)
As indicated in Figure 3-18, the flagged days occur during periods of elevated PM2.5 concentration (smoothed using 3 day center average, then normalized) at the Kona and Ocean View monitors. Figure 3-19 presents the normalized SO2 concentration data (smoothed using 3 day center average) for Kona and Ocean View with respect to the flagged days. While the correlation between the SO2 concentration levels at the two sites is not as strong for SO2 as PM2.5, the seasonal trend is evident. As is the case with 2011, the 2012 data indicates that pollutant levels are elevated throughout most of the year only because of volcanic emissions from Kilauea.

41
Figure 3-18. 2011 Time History of Kona (red) and Ocean View (blue) Normalized PM2.5
Concentrations with Flagged Days (vertical broken lines)

42
Figure 3-19. 2012 Time History of Kona (red) and Ocean View (blue) Normalized SO2
Concentrations with Flagged Days (vertical broken lines) 3.3.D Conclusion The USGS descriptions of the significant impact on the Kona area, as well as the southern region of Hawaii, of the very large SO2 emissions from the Kilauea volcano are consistent with the observed monitoring data for 2011 and 2012. The time histories of PM2.5 concentrations from the Kona and Ocean View monitors indicate a large pollutant plume of common origin impacting both sites. The relative magnitudes of PM2.5 and SO2 measured at the Kona, Ocean View, and Pahala are consistent with the transport path described by the USGS. The hourly PM2.5 concentrations at Kona, when coupled with local wind data, present no indication of any local source significantly impacting the measurements. As such, the Kilauea volcano is the only source that could reasonably be considered responsible for the highly elevated levels of PM2.5 measured by the Kona monitor. The data and associated analysis fully supports the proposed flagged days from the 2011 and 2012 data sets.

43
Section 4. Not Reasonably Controllable or Preventable
The ongoing release of SO2 from Kilauea Volcano is the primary source contributing to annual PM2.5 concentration exceedances measured at the Kona air monitoring station in 2011 and 2012. Anthropogenic emissions in the Kona area are significantly lower in comparison to those from the volcano. Control measures for PM2.5 and PM2.5 precursors of NO2 and SO2 from permitted sources in the Kona area are considered reasonable for minimizing emissions. Emissions were quantified from sources in the Kona area to provide information for this exceptional event demonstration to address the exceedances of the 12 µg/m3 annual NAAQS for PM2.5. Annual PM2.5 concentration exceedances being addressed were recorded at the Kona air quality monitoring station for years 2011 and 2012. Table 4-1 below summarizes the air quality exceedances:
KONA AIR MONITORING STATION, AQS ID 15-001-1012 Year Annual PM2.5 NAAQS (µg/m3) Annual Concentration Measured (µg/m3) 2011 12 12.1 2012 12 16.2
Table 4-1. NAAQS Concentrations 4.1 Pollutant Emissions Emissions were quantified among significant sources in the Kona area for comparison to SO2 emissions from Kilauea Volcano. The ton per year (TPY) maximum potential emissions of PM2.5 and PM2.5 precursors of NO2 and SO2 were quantified from stationary and temporary permitted sources. Actual PM2.5, NO2, and SO2 emissions from Kona International Airport were added to the total anthropogenic emissions. The anthropogenic sources emit PM2.5, NO2, and SO2 from fuel burning equipment. Anthropogenic emissions also include fugitive dust from vehicle travel on unpaved roads and plant processing (crushing and screening of aggregate, grinding of green waste, and asphalt production). 4.2 Stationary Sources There are a number of permitted stationary sources operating in the Kona. Locations of these sources are identified on the map from Figure A-1 in Appendix A. The Keahole Power Plant is the largest stationary source that includes three (3) combustion turbine generators. The remaining facilities are smaller sources of emissions. Stationary sources operating in the Kona area are listed in the table 4-2:

44
STATIONARY SOURCES No. Facility Type Equipment Distance From
Kona Station (miles)
Distance From Ocean View Station (miles)
1 BRE/Waikoloa, LLC Resort Two 5.07 MMBtu/hr Boilers 27.90 55.43
2 Waste Management of Hawaii, Inc.
Aggregate Processing
340 TPH Crushing Plant and 275 TPH Screening Plant
26.11 53.37
3 Captain Cook Coffee Company, Ltd.
Wholesale Coffee
Two 20 hp Coffee Bean Peelers 1.69 30.11
4a Hawaiian Electric Light Company
Electric Generation
Two 20 MW Combustion Turbine generators, Three 2.5 MW Diesel Engine Generators, and One 500 kW Black Start Diesel Engine Generator
17.06 45.32
5a Hawaiian Electric Light company
Electric Generation
One 18 MW Combustion Turbine Generator 17.33 45.66
6 Hawaiian Electric Light Company
Electric Generation
One 1.5 MW Diesel Engine Generator
4.76 32.79
7 Grace Pacific, LLC Asphalt Plant
325 TPH Asphalt Plant 13.82 41.99
8 Jas W. Glover, Ltd. Concrete Batching
150 yd3/hr Concrete Batch Plant
13.55 41.92
9 West Hawaii Concrete
Concrete Batching
150 yd3/hr Concrete Batch Plant 14.80 42.93
10 Cremation Services of West Hawaii
Funeral Service
150 lb/hr Pathological Waste Incinerator 14.65 43.13
11 A Hui Hou Funeral and Tribute Service
Funeral Service
150 lb/hr Human Crematory Unit 38.42 10.22
a: Nos. 4 and 5 designate equipment servicing one facility at the same location. There are two permits for equipment at this one facility. These permits are currently being consolidated into one permit.
Table 4-2. Stationary Sources 4.3 Temporary Sources A majority of temporary permit sources in the Kona area emitting PM2.5 and PM2.5 precursors are crushing and screening plants that move from one site to another. Other temporary sources include portable asphalt plants, water well drilling rig, and green waste processing facility. The temporary sources may operate outside Kona or on other islands. Temporary sources on outer islands may also relocate to Kona. Each temporary source must submit a Change of Location Request that requires the
elocating equipment. Table 4-3 summarizes information for these sources:
45
TEMPORARY SOURCES Facility Type Equipment Various Arrow of Oregon/Hawaiian, LLC (random representative company)
Aggregate Processing
Various Equipment Arrow of Oregon/Hawaiian, LLC has a 300 TPH Impact Plant, 400 TPH Impact Plant, and 500 TPH Screening Plant
Black Maui Rose, LLC Asphalt Plant 300 TPH Portable Asphalt Plant Road and Highway Builders, LLC Asphalt Plant 400 TPH Portable Asphalt Plant Keauhou Kona Construction Cor. Asphalt Plant 120 TP Portable Asphalt Plant Water Resources International, Inc. Water Well Drilling Two 300 hp Diesel Engines, One 400
hp Diesel Engine, and Two 665 hp Diesel Engines
Menehune Green, LLC dba Hawaiian Earth Products
Green Waste Processing
69 TPH Horizontal Grinder with 765 hp Diesel Engine
Table 4-3. Temporary Sources 4.4 Kona International Airport The Kona International Airport is another source of primary and secondary PM2.5 emissions in the Kona area. Currently, there are no permitted sources at the airport. Mobile sources, such as aircraft, and portable ground support equipment for servicing and starting aircraft are exempt from air permit requirements. Table 4-4 below lists information for the airport.
KONA INTERNATIONAL AIRPORT Source Distance From Kona
Station (miles) Distance From Ocean View Station (miles)
Kona International Airport Various 18.2 46.7 Table 4-4. Kona International Airport
4.5 Kilauea Volcano Kilauea Volcano is an extremely large source of SO2 emissions that affect the Kona area. As indicated by U.S. Geological Survey (USGS), the SO2 emitted from the volcano interacts chemically with atmospheric moisture, oxygen, dust, and sunlight to produce vog. Table 4-5 below lists information for Kilauea volcano.
KILAUEA VOLCANO Source
Distance From Kona Station (miles) Distance From Ocean View Station (miles)
42.2 38.0 53.5 47.9
Table 4-5. Kilauea Volcano 4.6 Stationary Source Emissions Maximum potential PM2.5, NO2, and SO2 emissions from permitted stationary sources, assuming controls and permit limits, are shown in Table 4-6.

46
STATIONARY SOURCE EMISSIONS No. Facility Equipment Total Combined Emissions (TPY)
PM2.5 NO2 SO2 1 BRE/Waikoloa, LLC Two 5.07 MMBtu/hr Boilers 0.01 3.2 0.4 2 Waste Management of
Hawaii, Inc. 340 TPH Crushing Plant and 275 TPH Screening Plant 1.2 6.6 1.9
3 Captain Cook Coffee Company, Ltd.
Two 20 hp Coffee Bean Peelers 2.2 0 0
4 Hawaiian Electric Light Company
Two 20 MW Combustion Turbine Generators, Three 2.5 MW Diesel Engine Generatorsb, and One 500 kW Black Start Diesel Engine Generator
221.8a 983.5 1,067.6
5 Hawaiian Electric Light company
One 18 MW Combustion Turbine Generators 87.6a 170.8 481.8
6 Hawaiian Electric Light Company
One 1.5 MW Diesel Engine Generator 1.8 99.1 0.1
7 Grace Pacific, LLC 325 TPH Asphalt Plant 1.4 21.8 4.6 8 Jas W. Glover, Ltd. 150 yd3/hr Concrete Batch Plant 29.4 10.4 3.2 9 West Hawaii Concrete 150 yd3/hr Concrete Batch Plant 13.3 0 0 10 Cremation Services of
West Hawaii Two 150 lb/hr Pathological Waste Incinerators 0.8c 2.8 1.2
11 A Hui Hou Funeral and Tribute Service
One 150 lb/hr Human Crematory Unit 0.1 1.2 0.7
Total 359.6 1,299.4 1,561.5 a: PM2.5 emissions based on data for PM10. b: Two of three 2.5 MW diesel engine generators can operate 8,760 hr/yr. The third 2.5 MW diesel engine
generator is limited to 70,000 gal/yr fuel consumption. c: PM2.5 emissions based on data for PM.
Table 4-6. Stationary Source Emissions 4.7 Temporary Source Emissions Maximum potential PM2.5, NO2, and SO2 emissions, assuming controls and permit limits, are listed in Table 4-7 for temporary permitted sources that would typically operate in the Kona area.

47
TEMPORARY SOURCE EMISSIONS Source Typical
Number of Plants
Equipment Total Emissions (TPY) PM2.5 NO2 SO2
Various 20 Various Equipment Arrow of Oregon/Hawaiian, LLC has a 300 TPH Impact Plant, 400 TPH Impact Plant, and 500 TPH Screening Plant
46.0a 456.0a 82.0a
Asphalt Production Plants 3
300 TPH Portable Asphalt Plant 400 TPH Portable Asphalt Plant 120 TPH Portable Asphalt Plant
27.9 104.0 50.1
Well Drilling Rig with Diesel Engines
1 Two 300 hp Diesel Engines, One 400 hp Diesel Engine, and Two 665 hp Diesel Engines
2.1b 39.2 0.1
Green Waste Grinder and Diesel Engine
1 69 TPH Horizontal Grinder with 765 hp Diesel Engine 1.1 44.7 0.1
Total 77.1 643.9 132.3 a. Based on emissions from Arrow of Oregon/Hawaiian LLC (CSP No. 0738-01-CT) as a random representative
source. Emissions from this facility were multiplied by 20 to approximate total combined emissions from all twenty (20) of the crushing and screening plants.
b. PM2.5 emissions are based on emission estimates for PM10. Table 4-7. Temporary Source Emissions
4.8 Kona International Airport Emissions Table 4-8 shows estimated actual emissions of PM2.5, NO2, and SO2 from the Kona International Airport. Emissions were based on information from the National Emissions Inventory (NEI) for year 2011. The NEI data is not yet available for 2012.
KONA INTERNATIONA AIRPORT EMISSIONS Source Equipment Emissions (TPY)a
PM2.5 NO2 SO2
Kona International Airport Various 11.6 226.7 27.2 a: Based on NEI data for 2011.
Table 4-8. Kona International Airport Emissions 4.9 Anthropogenic Emissions Anthropogenic emissions of PM2.5, NO2, and SO2 from significant sources in the Kona area are shown in Table 4-9.
ANTHROPOGENIC EMISSIONS Source Emissions (TPY)
PM2.5 NO2 SO2
Stationary Permitted Sources 359.6 1,299.4 1,561.5 Temporary Permitted Sources 77.1 643.9 132.3 Kona International Airport 11.6 226.7 27.2 Total 448.3 2,170.0 1,721.0
Table 4-9. Anthropogenic Emissions
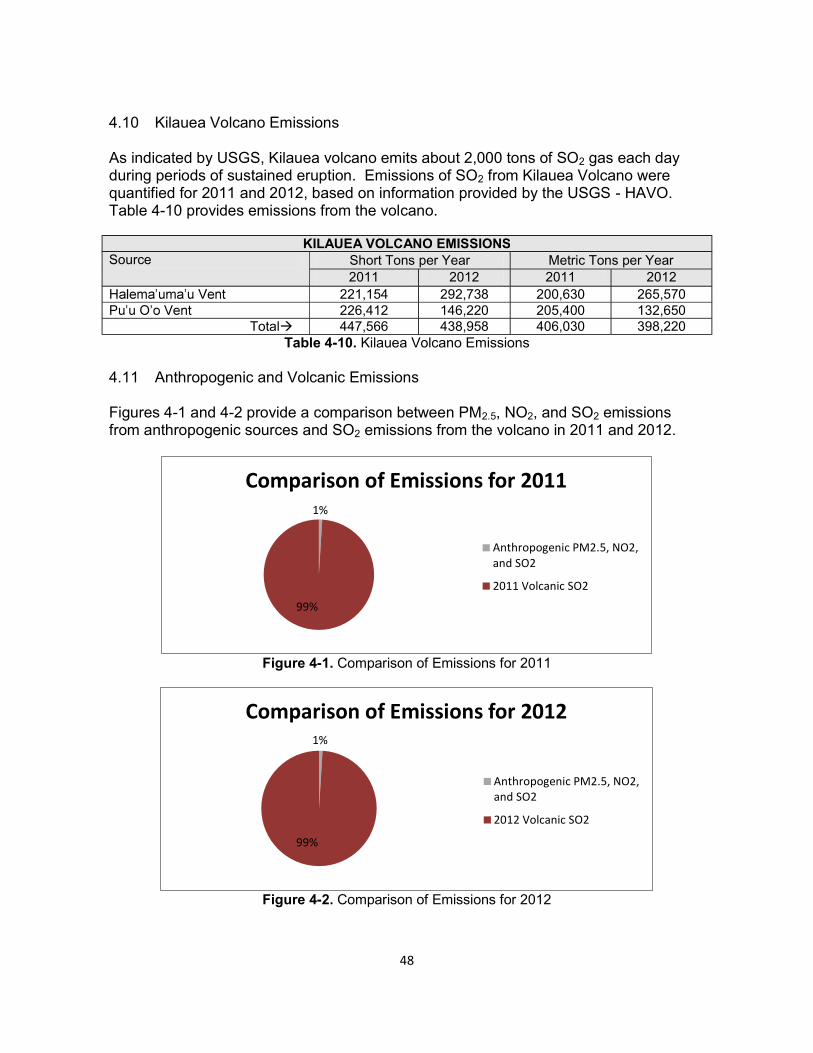
48
4.10 Kilauea Volcano Emissions As indicated by USGS, Kilauea volcano emits about 2,000 tons of SO2 gas each day during periods of sustained eruption. Emissions of SO2 from Kilauea Volcano were quantified for 2011 and 2012, based on information provided by the USGS - HAVO. Table 4-10 provides emissions from the volcano.
KILAUEA VOLCANO EMISSIONS
Source Short Tons per Year Metric Tons per Year 2011 2012 2011 2012
221,154 292,738 200,630 265,570 226,412 146,220 205,400 132,650
Total 447,566 438,958 406,030 398,220 Table 4-10. Kilauea Volcano Emissions
4.11 Anthropogenic and Volcanic Emissions Figures 4-1 and 4-2 provide a comparison between PM2.5, NO2, and SO2 emissions from anthropogenic sources and SO2 emissions from the volcano in 2011 and 2012.
Figure 4-1. Comparison of Emissions for 2011
Figure 4-2. Comparison of Emissions for 2012
1%
99%
Comparison of Emissions for 2011
Anthropogenic PM2.5, NO2,and SO2
2011 Volcanic SO2
1%
99%
Comparison of Emissions for 2012
Anthropogenic PM2.5, NO2,and SO2
2012 Volcanic SO2

49
4.12 Regulatory Measures and Air Pollution Controls The Department of Health is responsible for implementing measures specified in the applicable regulations to control pollutants from stationary and temporary sources. Requirements from the following regulations are incorporated into permits of facilities in the Kona area according to the applicable source category:
1) Hawaii Administrative Rules (HAR); 2) PSD/BACT, §52.21; 3) 40 CFR Part 60, Subpart OOO, NSPS, Standards of Performance for
Nonmetallic Mineral Processing Plants; 4) 40 CFR Part 60, Subpart I, NSPS, Standards of Performance for Hot Mix Asphalt
Facilities; 5) 40 CFR Part 60, Subpart GG, NSPS, Standards of Performance for Stationary
Gas Turbines; and 6) 40 CFR Part 63, Subpart ZZZZ, NESHAP for Stationary Reciprocating Internal
Combustion Engines. Table 4-11summarizes regulations that apply to sources in the Kona area that provide control requirements to minimize PM2.5 and PM2.5 precursors of NO2 and SO2.
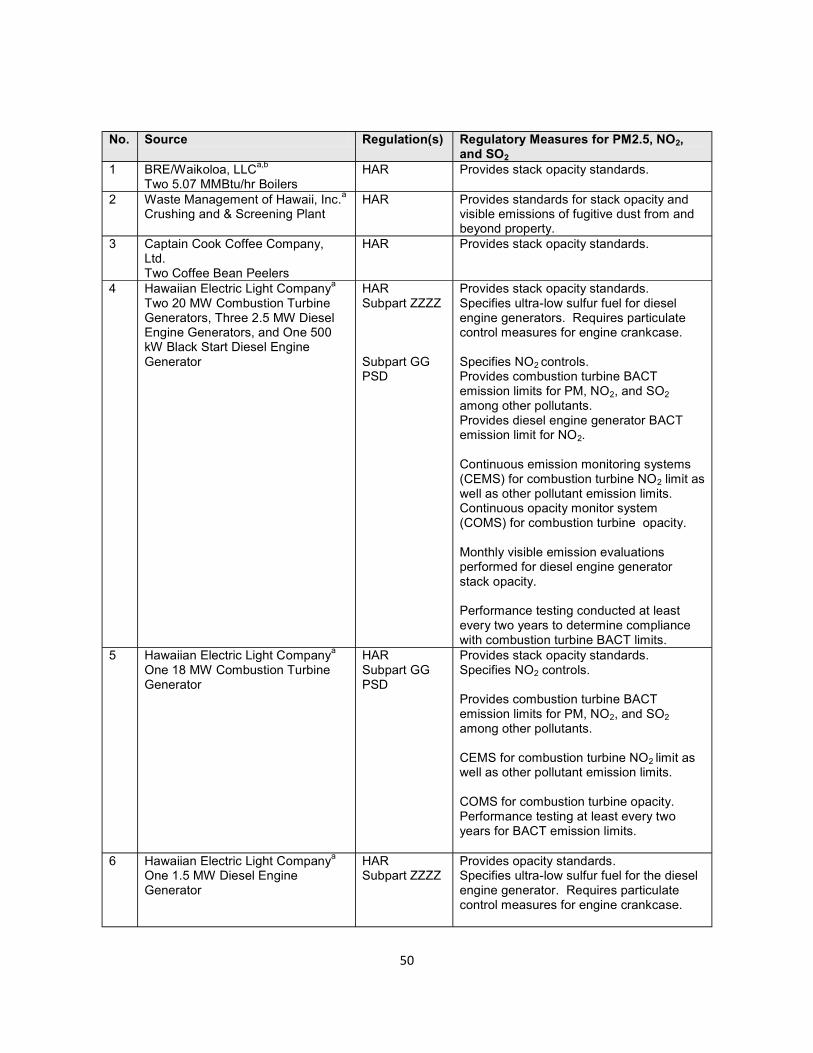
50
No. Source Regulation(s) Regulatory Measures for PM2.5, NO2,
and SO2 1 BRE/Waikoloa, LLCa,b
Two 5.07 MMBtu/hr Boilers HAR Provides stack opacity standards.
2 Waste Management of Hawaii, Inc.a
Crushing and & Screening Plant HAR Provides standards for stack opacity and
visible emissions of fugitive dust from and beyond property.
3 Captain Cook Coffee Company, Ltd. Two Coffee Bean Peelers
HAR Provides stack opacity standards.
4 Hawaiian Electric Light Companya
Two 20 MW Combustion Turbine Generators, Three 2.5 MW Diesel Engine Generators, and One 500 kW Black Start Diesel Engine Generator
HAR Subpart ZZZZ Subpart GG PSD
Provides stack opacity standards. Specifies ultra-low sulfur fuel for diesel engine generators. Requires particulate control measures for engine crankcase. Specifies NO2 controls. Provides combustion turbine BACT emission limits for PM, NO2, and SO2 among other pollutants. Provides diesel engine generator BACT emission limit for NO2. Continuous emission monitoring systems (CEMS) for combustion turbine NO2 limit as well as other pollutant emission limits. Continuous opacity monitor system (COMS) for combustion turbine opacity. Monthly visible emission evaluations performed for diesel engine generator stack opacity. Performance testing conducted at least every two years to determine compliance with combustion turbine BACT limits.
5 Hawaiian Electric Light Companya
One 18 MW Combustion Turbine Generator
HAR Subpart GG PSD
Provides stack opacity standards. Specifies NO2 controls. Provides combustion turbine BACT emission limits for PM, NO2, and SO2 among other pollutants. CEMS for combustion turbine NO2 limit as well as other pollutant emission limits. COMS for combustion turbine opacity. Performance testing at least every two years for BACT emission limits.
6 Hawaiian Electric Light Companya
One 1.5 MW Diesel Engine Generator
HAR Subpart ZZZZ
Provides opacity standards. Specifies ultra-low sulfur fuel for the diesel engine generator. Requires particulate control measures for engine crankcase.

51
No. Source Regulation(s) Regulatory Measures for PM2.5, NO2, and SO2
7 Grace Pacific, LLCa
325 TPH Asphalt Plant HAR Subpart ZZZZ Subpart I
Provides standards for stack opacity and visible emissions of fugitive dust from and beyond the property. Specifies ultra-low sulfur fuel for diesel engine generator. Requires particulate control measures for engine crankcase. Provides opacity and particulate emissions standards for drum mixer dryer. Monthly visible emissions evaluations for stack opacity. Performance testing of drum mixer dryer at least every two years for particulate matter emission limit and opacity.
8 Jas W. Glovera
150 yd3/hr Concrete Batch Plant HAR Provides standard for visible emissions of
fugitive dust from and beyond the property. 9 West Hawaii Concretea
150 yd3/hr Concrete Batch Plant HAR Provides standard for fugitive dust from
and beyond the property. 10 Cremation Services of West
Hawaiia - 150 yd3/hr Pathological Waste Incinerator
HAR Provides stack opacity standards.
11 A Hui Hou Funeral and Tribute Servicea - 150 yd3/hr Crematory
HAR Provides stack opacity standards.
---- Arrow of Oregon/Hawaiian, LLCc,d,e (random representative company) Crushing and Screening Equipment
HAR Subpart OOO
Provides standards for stack opacity and visible emissions of fugitive dust from and beyond property. Provides fugitive dust opacity standards. Monthly visible emissions evaluations for fugitive emissions and stack opacity. Performance testing at least every two years for fugitive dust opacity limits.
----- Black Maui Rose, LLCc
Road and Highway Builders, LLCc
Keauhou Kona Construction Corporationc
Portable Asphalt Plants
HAR Subpart I
Provides standards for stack opacity and visible emissions of fugitive dust from and beyond the property. Provides particulate emission limit and opacity standards for drum mixer dryer. Monthly visible emissions evaluations for stack opacity. Performance testing at least every two years for drum mixer dryers for opacity and particulate matter emission limits.
----- Water Resources International, Inc.c
Temporary Water Well Drilling Rig with Portable Diesel Engine Gen.
HAR Provides stack opacity standards.
----- Menehune Green, LLC dba Hawaiian Earth Productsc Portable Green Waste Grinder
HAR Provides standards for stack opacity and visible emissions of fugitive dust from and beyond the property.
a. Stationary source. b. Subpart JJJJJJ, NESHAP for Area Sources: Industrial Commercial, and Institutional Boilers will apply in 2014
that will require biennial boiler tune ups. c. Temporary source. d. Temporary sources consist of 19 covered sources and 1 noncovered source. e. Covered sources are subject to both HAR and Subpart OOO. Noncovered source is only subject to
requirements from HAR. Table 4-11. Regulatory Measures for Anthropogenic Sources

52
Table 4-12 summarizes control measures utilized by sources in the Kona area to minimize PM2.5 and PM2.5 precursors of NO2 and SO2. No. Source Air Pollution Control Measures 1 BRE/Waikoloa, LLCa
Two 5.07 MMBtu/hr Boilers Proper maintenance and operation for stack opacity.
2 Waste Management of Hawaii, Inc.a
Crushing and & Screening Plant Wet suppression methods for fugitive dust. Proper maintenance and operation for stack opacity.
3 Captain Cook Coffee Company, Ltd.a
Two Coffee Bean Peelers Cyclone dust collector for peelers to control particulate and for opacity. Proper maintenance and operation for stack opacity.
4 Hawaiian Electric Light Companya
Two 20 MW Combustion Turbine Generators, Three 2.5 MW Diesel Engine Generators, and One 500 kW Black Start Diesel Engine Generator
Selective catalytic reduction (SCR) and water injection for combustion turbine to control NO2. Burning ultra-low sulfur fuel to minimize SO2 from diesel engine generators. Crankcase filtration systems for diesel engine generators to control particulate. Proper equipment maintenance and operation for stack opacity.
5 Hawaiian Electric Light Companya
One 18 MW Combustion Turbine Generator Water injection system for combustion turbine to control NO2. Proper maintenance and operation for stack opacity.
6 Hawaiian Electric Light Companya
One 1.5 MW Diesel Engine Generator Ultra-low sulfur fuel fired by unit to minimize SO2. Crankcase filtration system for engine to minimize particulate emissions
7 Grace Pacific, LLCa
325 TPH Asphalt Plant Wet suppression methods for fugitive dust. Baghouse for drum mixer dryers to control particulate for opacity and particulate matter emission limits. Proper maintenance and operation for stack opacity.
8 Jas W. Glovera
150 yd3/hr Concrete Batch Plant Wet suppression measures for fugitive dust. Baghouses for transit mix truck and cement silo loading.
9 West Hawaii Concretea
150 yd3/hr Concrete Batch Plant Wet suppression measures for fugitive dust. Baghouses for transit mix truck and cement silo loading.
10 Cremation Services of West Hawaiia
150 yd3/hr Pathological Waste Incinerator Wet suppression measures for fugitive dust. Baghouses for transit mix truck and cement silo loading.
11 A Hui Hou Funeral and Tribute Servicea
150 yd3/hr Crematory Secondary chamber to reduce particulate. Proper maintenance and secondary chamber for stack opacity. Visual alarm if opacity exceeds 10%.
---- Arrow of Oregon/Hawaiian, LLCb
(random representative company) Crushing and Screening Equipment
Wet suppression measures for fugitive dust. Proper maintenance and operation for stack opacity.
----- Black Maui Rose, LLCb
Road and Highway Builders, LLCb
Keauhou Kona Construction Corporationb
Portable Asphalt Plants
Wet suppression methods for fugitive dust. Baghouses to control particulate from drum mixer dryers for opacity and particulate matter emissions limit. Proper maintenance and operation for stack opacity.
----- Water Resources International, Inc.b
Temporary Water Well Drilling Rig with Portable Diesel Engine Generators
Proper maintenance and operation for stack opacity.
----- Menehune Green, LLC dba Hawaiian Earth Productsb
Portable Green Waste Grinder
Wet suppression methods for fugitive dust. Proper maintenance and operation for stack opacity.
a. Stationary source. b. Temporary source.
Table 4-12. Air Pollution Control Measures for Anthropogenic Sources

53
4.13 Inspections
Title V sources, which include all large facilities in the Kona area, are inspected each year to ensure equipment is operated within the terms of the permits.

54
Section 5. Historical Norm
Prior to the opening as no PM2.5 monitoring being conducted at the Kona station, nor at any of the other air monitoring stations on the Big Island. The earliest PM2.5 monitoring began at the Kona station in March 2008, Pahala in April 2008, and Hilo in May 2008, necessitated by the increase of volcanic emissions and concern for public health and safety. Since no PM2.5 data is available prior to 2008, there is no possible way to s the exceptional event is associated with a measured PM2.5 However, historical SO2 monitoring data is available for the Kona and Hilo stations beginning in 2000. Sampling for SO2 at the Pahala station began on August 10, 2007. Figure 5-1 below shows the annual average of measured SO2 at the three stations. The chart shows an increase in measured SO2 at the three stations beginning 2008, coinciding with the March 18, 2008 event. As explained in previous sections of this report, the increased SO2 emissions correlate with the increase in measured PM2.5 concentrations. Taking into consideration the correlation between SO2 emissions and measured PM2.5 concentrations, th
Figure 5-1. Annual Average of Measured SO2 at Various Air Stations
0
0.01
0.02
0.03
0.04
0.05
0.06
0.07
0.08
2000 2001 2002 2003 2004 2005 2006 2007 2008 2009 2010 2011 2012
SO i
n pp
m
Year
Annual Average of Measured Sulfur Dioxide (SO ) at Various Air Stations
Kona
Hilo
Pahala
Notes: Pahala Station began measuring SO2 on August 10, 2007. New Halema'uma'u vent opened on March 13, 2008.

55
Section 6. - Analysis/Conclusions
In accordance with 40 CFR 50.14(c)(3)(iv)(D), exceptional event packages must
Based on the data evaluated, this exception event package has demonstrated that annual monitored PM2.5 concentrations in 2011 and 2012 were not reasonably controllable or preventable and there is a clear causal relationship between transported SO2 from the Kilauea volcano and measured PM2.5 exceedances from the Kona air monitoring station. Concentrations of SO2 in excess of historical fluctuations were also
Considering the transport path and magnitude of SO2 emissions associated with the volcano plume, there would have been no exceedances of the annual PM2.5 standard but for the naturally occurring and ongoing eruption of Kilauea volcano.
The ongoing release of SO2 from Kilauea Volcano is the primary source affecting air quality and contributing to annual PM2.5 concentration exceedances measured at the Kona air quality monitoring station in 2011 and 2012. According to the USGS, SO2 released from the volcano creates vog when SO2 reacts chemically with sunlight, oxygen, dust particles, and moisture in the air to form sulfate aerosols (fine particles and droplets). As discussed in section 2 of this report, the USGS indicates that trade winds blow the vog from its main source on the volcano to the southwest, where wind patterns send it up the Kona coast. Also, the vog becomes trapped along the Kona coast by daytime (onshore) and nighttime (offshore) breezes. Emissions of PM2.5 and PM2.5 precursors of NO2 and SO2 from anthropogenic sources in the Kona area are only 1% of the total emissions (anthropogenic PM2.5, NO2, and SO2 + volcanic SO2). Please refer to Figures 4-1 and 4-2 of Section 4 for a comparison of the emissions. The air pollution control measures for permitted sources are adequate and should be considered reasonable for minimizing primary and secondary PM2.5. Table 4-1 from Section 4, shows a higher annual PM2.5 concentration measured at the Kona air monitoring station in 2012 than in 2011. The higher 2012 concentration is likely attributed to larger SO2 at were 71,584 tons per year higher in 2012 than in 2011. In 2012, the SO2 emissions
-10 from Section 4 for volcano emissions. As
elevation and further inland, appears to have a greater impact on the more populated
closer to the coast. This would indicate a clear causal connection between the quantity 2.5 exceedances
measured in 2012 from the Kona air monitoring station. Total emissions from permitted soumaximum potential to emit which over estimates the emissions from anthropogenic sources in contributing to annual PM2.5 exceedances.

56
Air monitoring data for 2011 and 2012 in Tables 3-2 and 3-3 of Section 3 show a decrease in annual SO2 concentration from Pahala to Ocean View stations and a further decrease from Ocean View to Kona stations while there is an increase in annual PM2.5 concentration from Kona to Ocean View stations and an additional increase from Ocean View to Pahala stations. This is consistent with what would be expected as SO2 is
-to-Ocean View-to-Kona. This demonstrates a clear causal link between SO2 released by the volcano, the time necessary to form sulfates in the presence of sunlight and atmospheric constituents, the volcanic plume transport path, and monitored concentrations. Figure 2.7 in Section 2 shows vog created from gases released by the Kilauea volcano. Similar concentration versus time plots of air quality data from the Kona and Ocean View air monitoring stations indicate a large regional source is affecting air quality at the monitoring sites. The Kilauea volcano is a large regional source that is not reasonably controllable or preventable and overwhelms the quantity of emissions from anthropogenic sources. The volcano is the likely source responsible for the correlation in the concentration versus time plots. Emissions from permitted facilities and the airport are significantly lower than those from the volcano. These anthropogenic sources are also scattered in location on the island. Therefore, anthropogenic sources cannot be the cause of correlation at the Kona and Ocean View air monitoring sites. The PM2.5 and SO2 plot comparisons for the two monitoring stations are shown in Figures 3-2, 3-3, 3-4, 3-5, 3-6, and 3-7 of Section 3. Air monitoring data in Figure 5-1 of Section 5 shows that increased SO2 concentrations at the Kona, Hilo, vent. This demonstrates an event that is associated with a measured concentration in excess of normal fluctuations.
57
References: 1. United States Geological Survey, Hawaiian Volcano Observatory, "Volcanic Hazards, Frequently Asked Questions about Air Quality in Hawai`i", Updated: 18 December 2012; http://hvo.wr.usgs.gov/hazards/FAQ_SO2-Vog-Ash/P1.html 2. State of Hawaii, Department of Health Environmental Management Division, Clean Air Branch and State Laboratories Division, Air Surveillance and Analysis Section, "State of Hawaii 2013 Air Monitoring Network Plan", Submitted to the U.S. EPA Region 9: July, 1, 2013; http://health.hawaii.gov/cab/files/2013/05/Air_Monitoring_Network_Plan_2013.pdf 3. United States Geological Survey, Hawaiian Volcano Observatory, "Volcano Watch, Kilauea sulfur dioxide emissions down by 90% ", March 7, 1997; http://hvo.wr.usgs.gov/volcanowatch/archive/1997/97_03_07.html 4. United States Geological Survey, Hawaiian Volcano Observatory, "Volcano Watch, In every volcanic paradise, a little vog must fall ", August 14, 2008; http://hvo.wr.usgs.gov/volcanowatch/archive/2008/08_08_14.html 5. United States Geological Survey, Hawaiian Volcano Observatory, "Recent Kilauea Status Reports, Updates, and Information Releases, HAWAIIAN VOLCANO OBSERVATORY DAILY UPDATE"; http://hvo.wr.usgs.gov/hazards/FAQ_SO2-Vog-Ash/P1.html 6. T. Elias and A.J. Sutton, United States Geological Survey, "Sulfur Dioxide Emission Rates from Kilauea 2010." ; http://pubs.usgs.gov/of/2012/1107/ 7. S. Beirle, et. al., "Estimating the volcanic emission rate and atmospheric lifetime of SO2 from space: a case study for Kilauea volcano, Hawai'i", Atmos. Chem. Phys. Discuss., 13, 28695 28727, 2013. 8. A.J. Sutton, United States Geological Survey, personal communications, 9 Dec 2013. 9. United States National Park Service, "NPS Gaseous Pollutant and Met Data"; http://12.45.109.6/ 10. United States Environmental Protection Agency, Technology Transfer Network (TTN), Air Quality System (AQS) Data Mart, Direct Interface; http://www.epa.gov/ttn/airs/aqsdatamart/access/interface.htm 11. University of Utah, MesoWest, Weather Observations; http://mesowest.utah.edu/ 12. Wikipedia, "Pearson product-moment correlation coefficient"; http://en.wikipedia.org/wiki/Pearson_product-moment_correlation_coefficient

58
13. Hawaii, Department of Health, Clean Air Branch, "Clean Air Branch (CAB) 2012 Performance Audit Data - Hilo, Kona, Mountain View, Pahala, Puna E., and Waikoloa Monitoring Stations", October 18, 2012, 12-850M&A CAB.

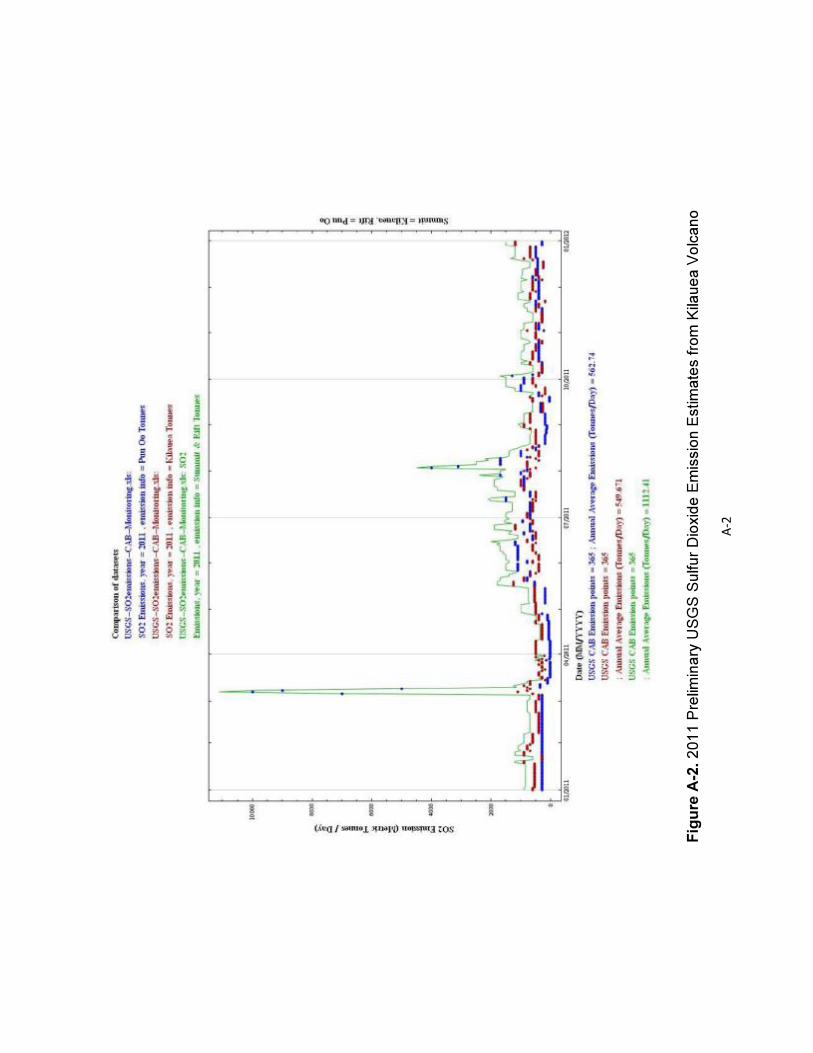

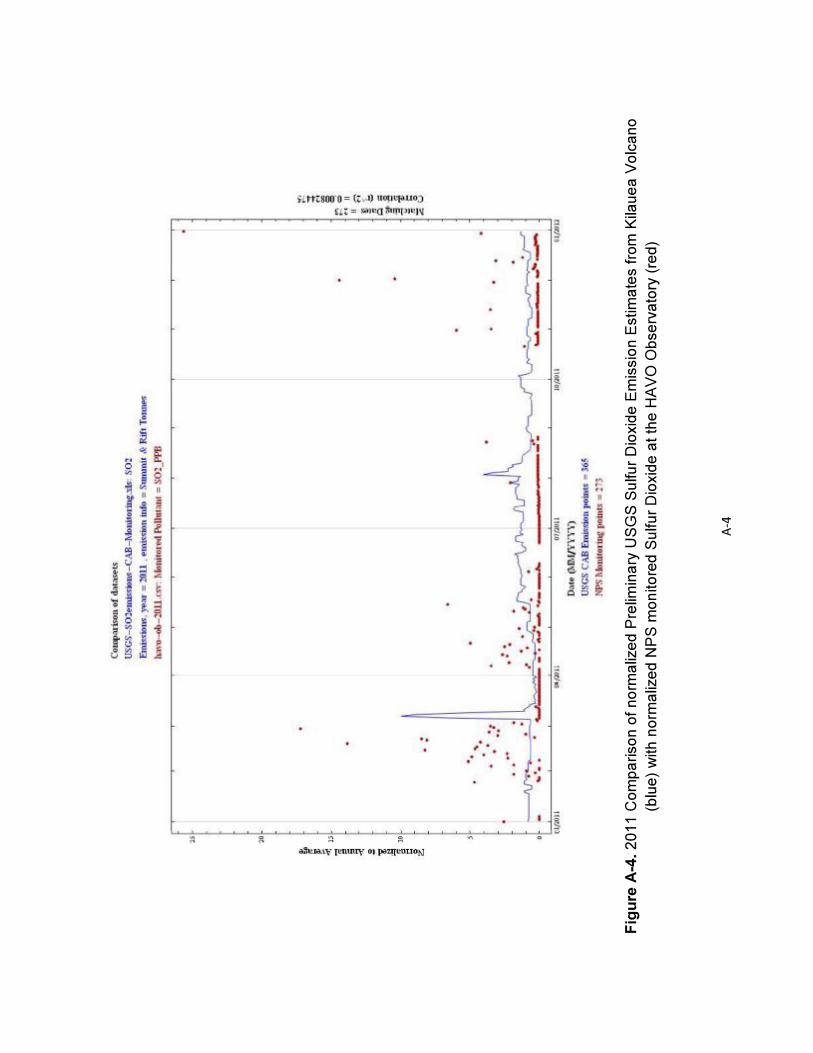


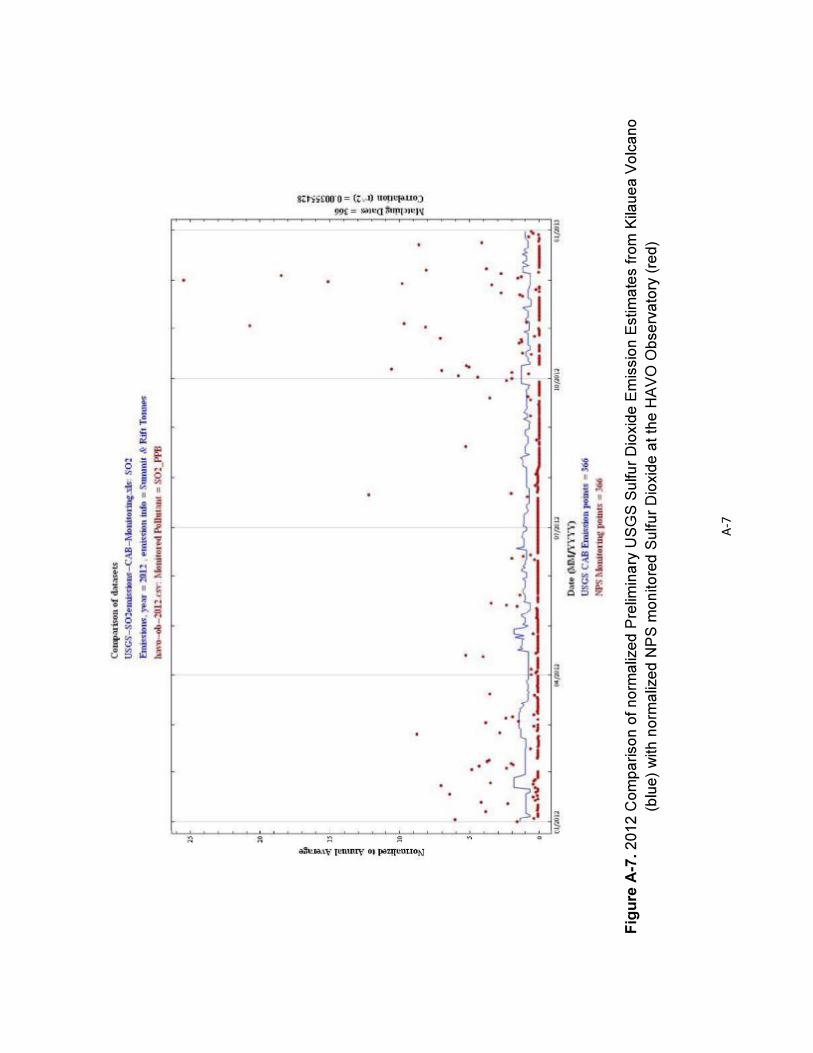


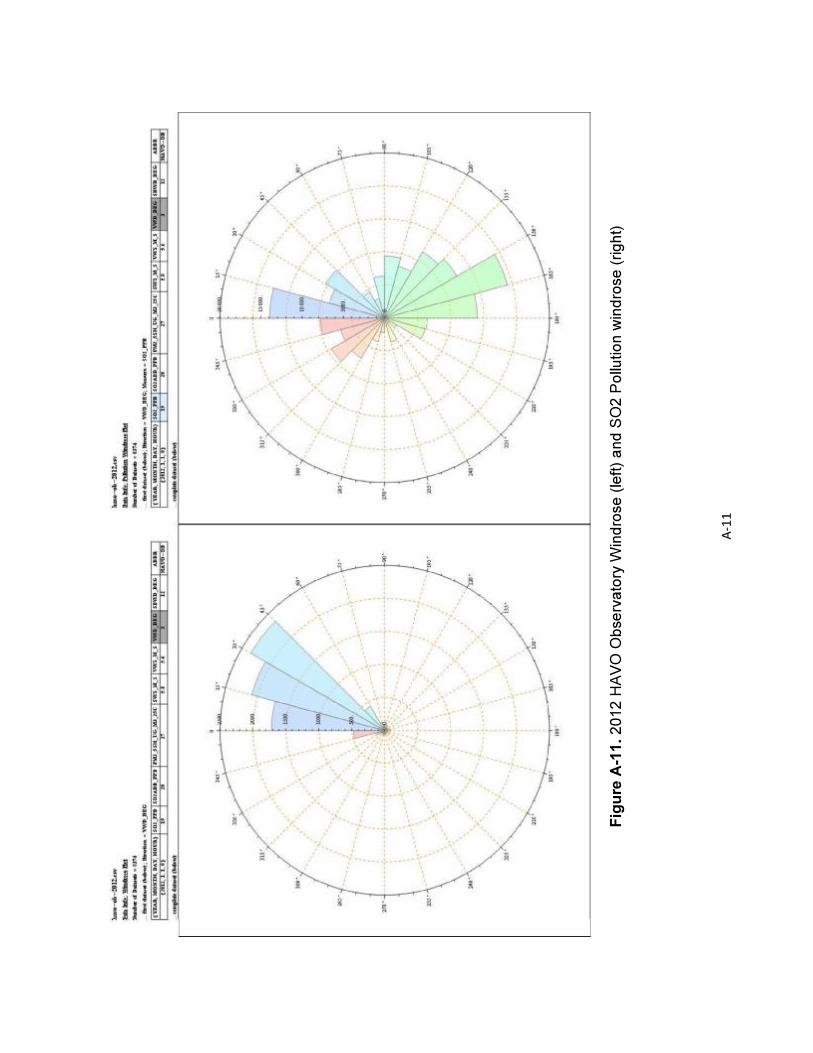


A-16
Figure A-16. 2011 Kona (AN155) Windrose - Morning Hours

A-17
Figure A-17. 2011 Kona (AN155) Windrose - Evening Hours

A-18
Figure A-18. 2012 Kona (AN155) Wind Direction Time History - Morning Hours
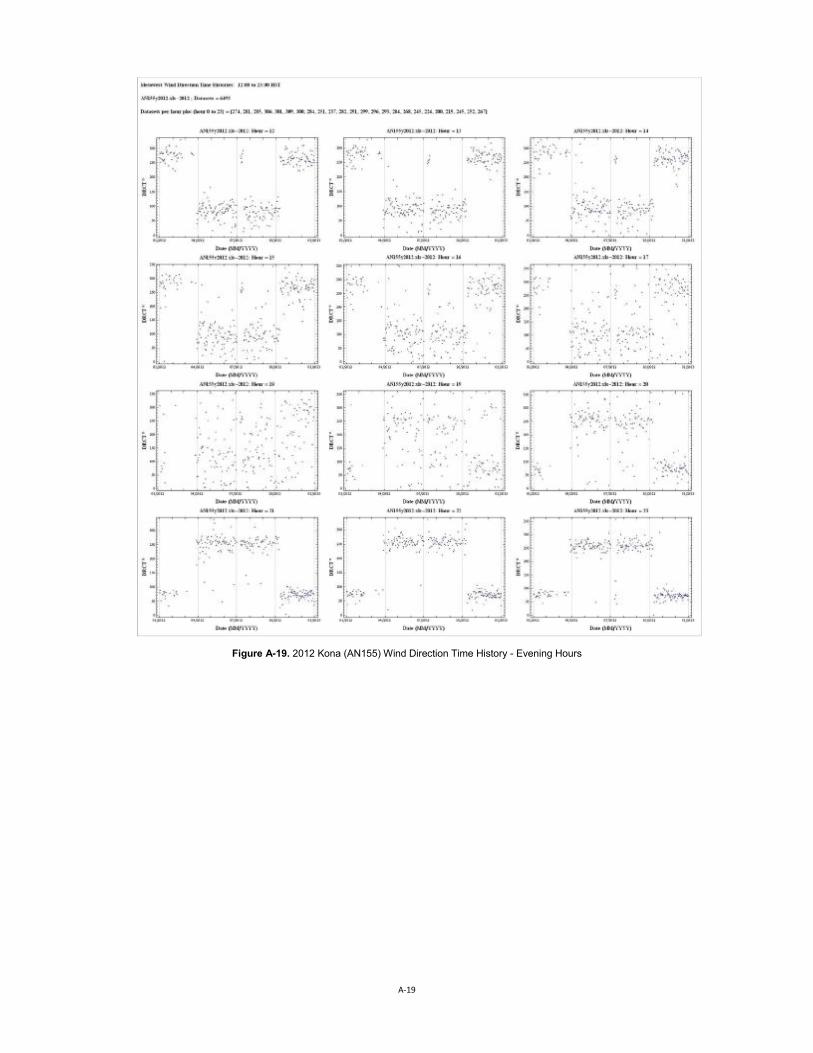
A-19
Figure A-19. 2012 Kona (AN155) Wind Direction Time History - Evening Hours

A-20
Figure A-20. 2011 Kona (AN155) PM2.5 Pollution Time History by Wind Quadrant

A-21
Figure A-21. 2012 Kona (AN155) PM2.5 Pollution Time History by Wind Quadrant

A-22
Figure A-22. 2011 Kona (AN155), Ocean View (AN738), and Pahala (AN157) Annual and Seasonal (Quarterly) Correlations for SO2 and PM2.5

A-23
Figure A-23. 2012 Kona (AN155), Ocean View (AN738), and Pahala (AN157) Annual and Seasonal (Quarterly) Correlations for SO2 and PM2.5
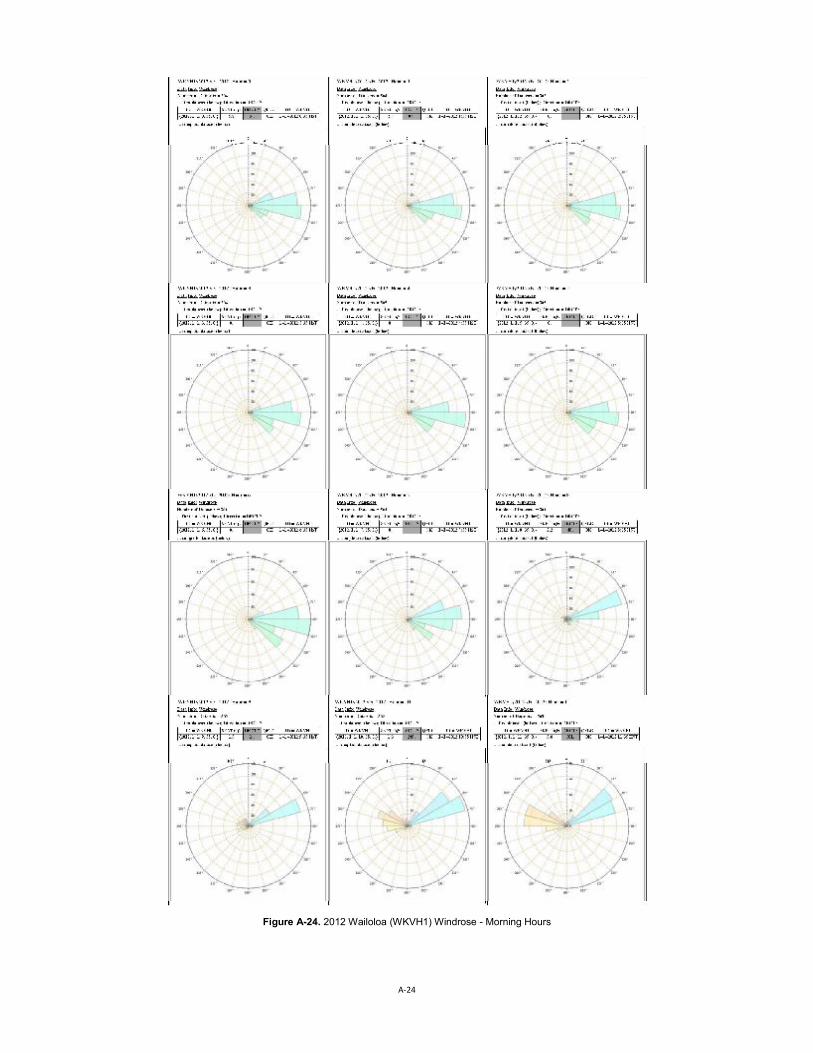
A-24
Figure A-24. 2012 Wailoloa (WKVH1) Windrose - Morning Hours

A-25
Figure A-25. 2012 Wailoloa (WKVH1) Windrose - Evening Hours

A-26
Figure A-26. 2012 Kaupulehu Lava Flow (KPLH1) - Morning Hours

A-27
Figure A-27. 2012 Kaupulehu Lava Flow (KPLH1) - Evening Hours

A-28
Figure A-28. PTA Range 17 (PTRH1) Windrose - Morning Hours

A-29
Figure A-29. PTA Range 17 (PTRH1) Windrose - Evening Hours

A-30
Figure A-30. Hilo International Airport (PHTO) Windrose - Morning Hours

A-31
Figure A-31. Hilo International Airport (PHTO) Windrose - Evening Hours
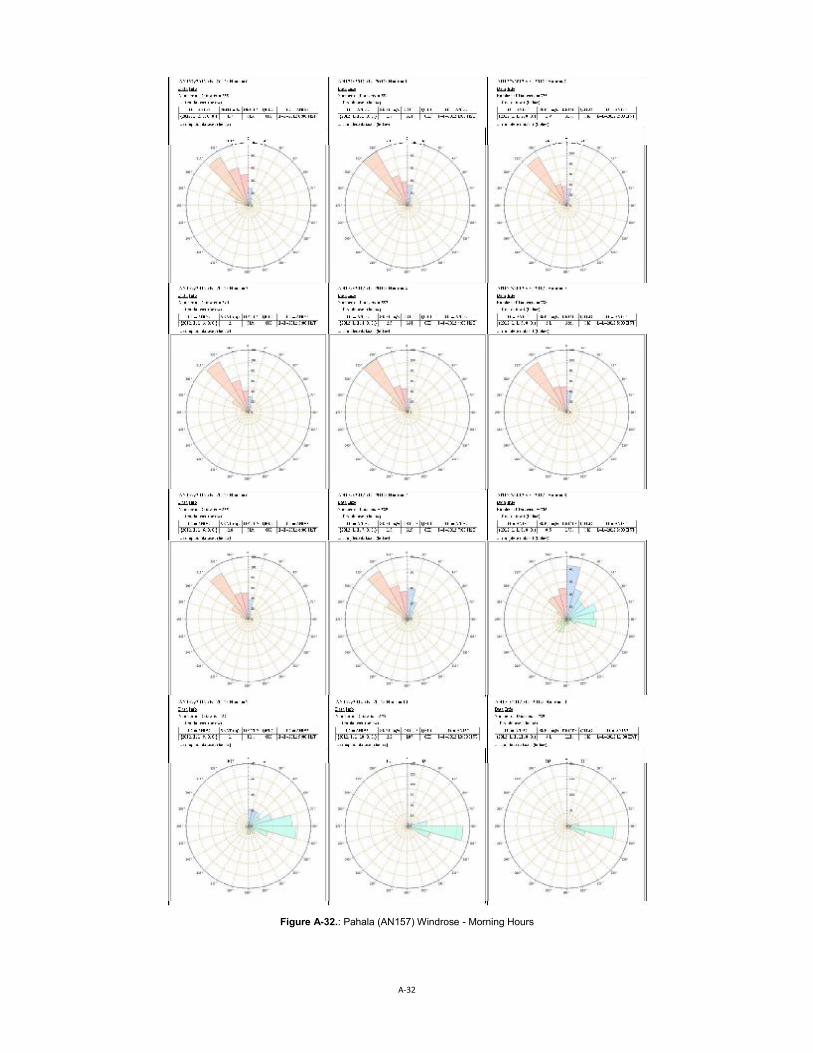
A-32
Figure A-32.: Pahala (AN157) Windrose - Morning Hours

A-33
Figure A-33. Pahala (AN157) Windrose - Evening Hours
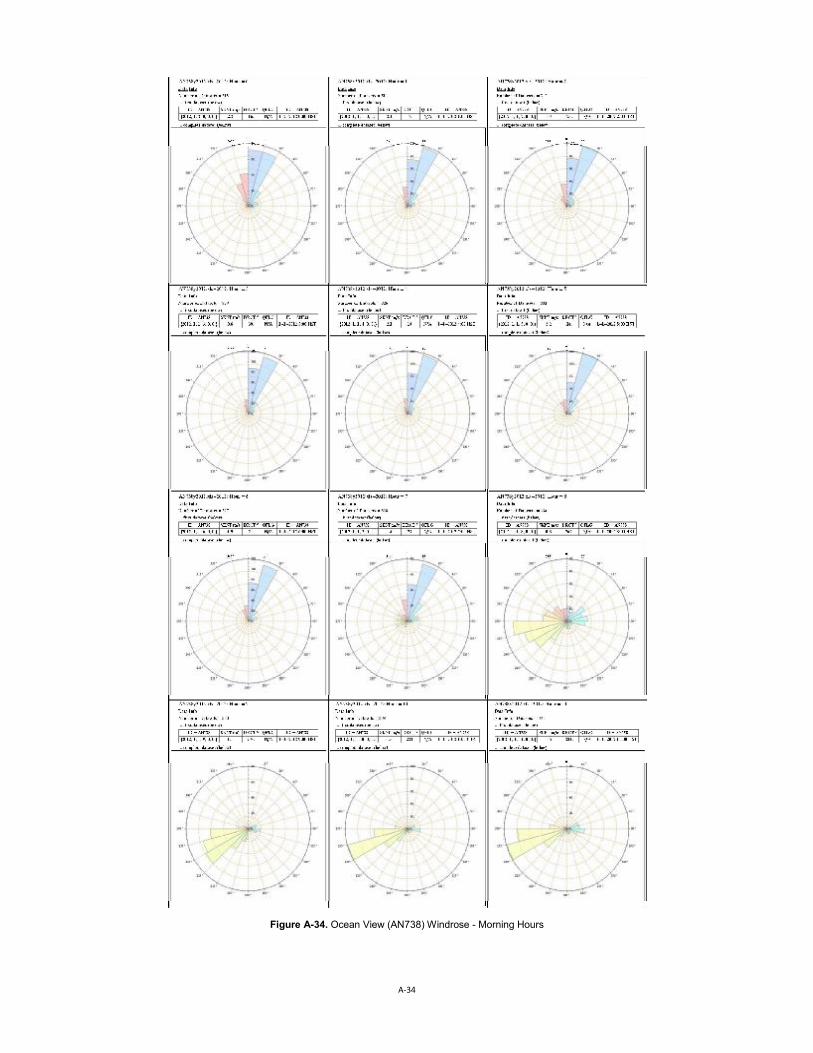
A-34
Figure A-34. Ocean View (AN738) Windrose - Morning Hours
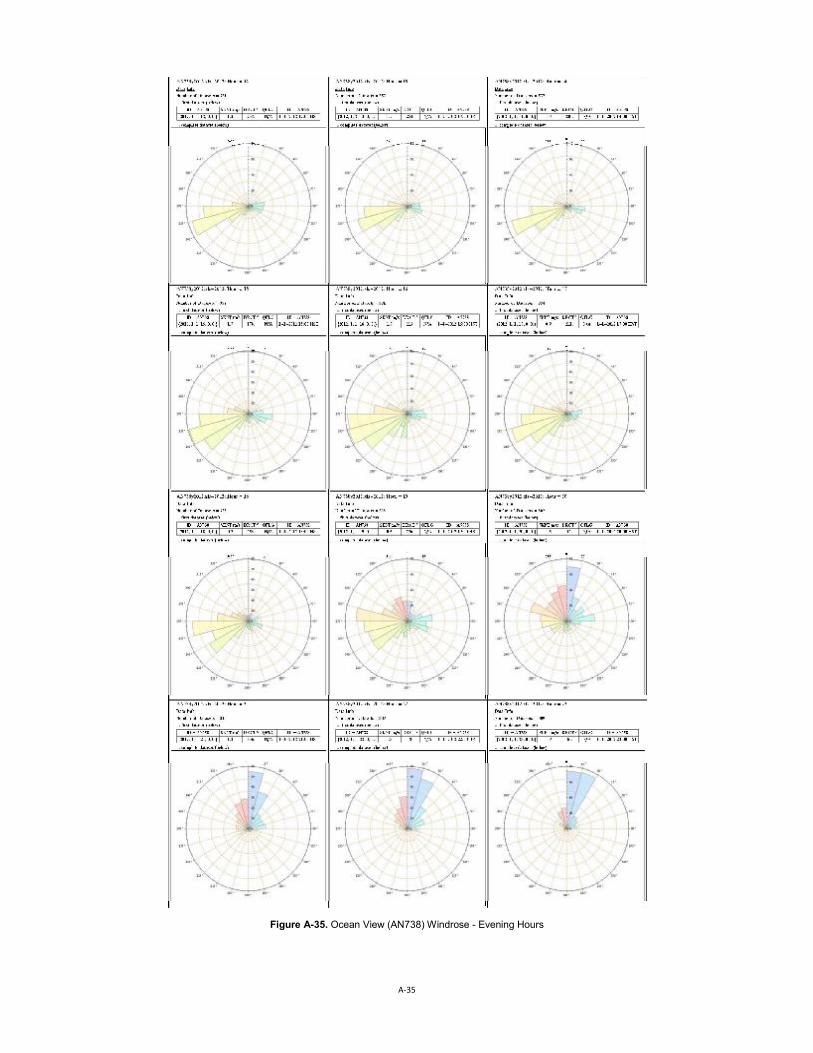
A-35
Figure A-35. Ocean View (AN738) Windrose - Evening Hours
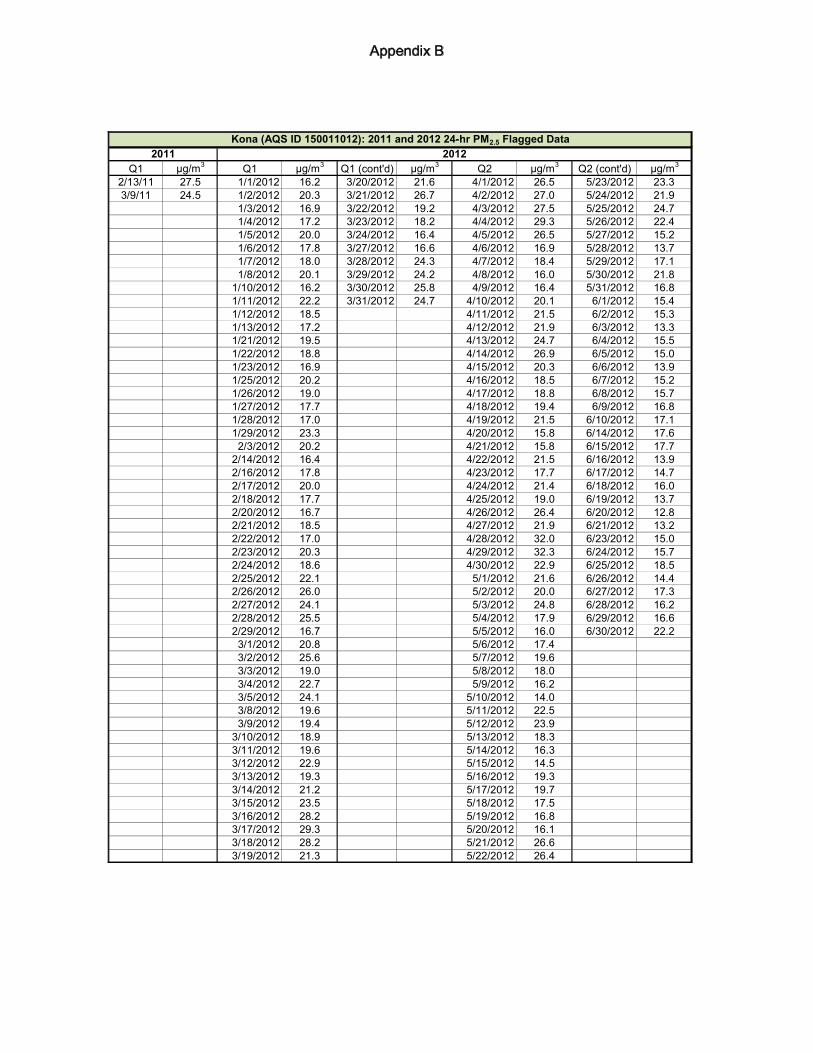
Q1 µg/m3 Q1 µg/m3 Q1 (cont'd) µg/m3 Q2 µg/m3 Q2 (cont'd) µg/m3
2/13/11 27.5 1/1/2012 16.2 3/20/2012 21.6 4/1/2012 26.5 5/23/2012 23.33/9/11 24.5 1/2/2012 20.3 3/21/2012 26.7 4/2/2012 27.0 5/24/2012 21.9
1/3/2012 16.9 3/22/2012 19.2 4/3/2012 27.5 5/25/2012 24.71/4/2012 17.2 3/23/2012 18.2 4/4/2012 29.3 5/26/2012 22.41/5/2012 20.0 3/24/2012 16.4 4/5/2012 26.5 5/27/2012 15.21/6/2012 17.8 3/27/2012 16.6 4/6/2012 16.9 5/28/2012 13.71/7/2012 18.0 3/28/2012 24.3 4/7/2012 18.4 5/29/2012 17.11/8/2012 20.1 3/29/2012 24.2 4/8/2012 16.0 5/30/2012 21.8
1/10/2012 16.2 3/30/2012 25.8 4/9/2012 16.4 5/31/2012 16.81/11/2012 22.2 3/31/2012 24.7 4/10/2012 20.1 6/1/2012 15.41/12/2012 18.5 4/11/2012 21.5 6/2/2012 15.31/13/2012 17.2 4/12/2012 21.9 6/3/2012 13.31/21/2012 19.5 4/13/2012 24.7 6/4/2012 15.51/22/2012 18.8 4/14/2012 26.9 6/5/2012 15.01/23/2012 16.9 4/15/2012 20.3 6/6/2012 13.91/25/2012 20.2 4/16/2012 18.5 6/7/2012 15.21/26/2012 19.0 4/17/2012 18.8 6/8/2012 15.71/27/2012 17.7 4/18/2012 19.4 6/9/2012 16.81/28/2012 17.0 4/19/2012 21.5 6/10/2012 17.11/29/2012 23.3 4/20/2012 15.8 6/14/2012 17.62/3/2012 20.2 4/21/2012 15.8 6/15/2012 17.7
2/14/2012 16.4 4/22/2012 21.5 6/16/2012 13.92/16/2012 17.8 4/23/2012 17.7 6/17/2012 14.72/17/2012 20.0 4/24/2012 21.4 6/18/2012 16.02/18/2012 17.7 4/25/2012 19.0 6/19/2012 13.72/20/2012 16.7 4/26/2012 26.4 6/20/2012 12.82/21/2012 18.5 4/27/2012 21.9 6/21/2012 13.22/22/2012 17.0 4/28/2012 32.0 6/23/2012 15.02/23/2012 20.3 4/29/2012 32.3 6/24/2012 15.72/24/2012 18.6 4/30/2012 22.9 6/25/2012 18.52/25/2012 22.1 5/1/2012 21.6 6/26/2012 14.42/26/2012 26.0 5/2/2012 20.0 6/27/2012 17.32/27/2012 24.1 5/3/2012 24.8 6/28/2012 16.22/28/2012 25.5 5/4/2012 17.9 6/29/2012 16.62/29/2012 16.7 5/5/2012 16.0 6/30/2012 22.23/1/2012 20.8 5/6/2012 17.43/2/2012 25.6 5/7/2012 19.63/3/2012 19.0 5/8/2012 18.03/4/2012 22.7 5/9/2012 16.23/5/2012 24.1 5/10/2012 14.03/8/2012 19.6 5/11/2012 22.53/9/2012 19.4 5/12/2012 23.9
3/10/2012 18.9 5/13/2012 18.33/11/2012 19.6 5/14/2012 16.33/12/2012 22.9 5/15/2012 14.53/13/2012 19.3 5/16/2012 19.33/14/2012 21.2 5/17/2012 19.73/15/2012 23.5 5/18/2012 17.53/16/2012 28.2 5/19/2012 16.83/17/2012 29.3 5/20/2012 16.13/18/2012 28.2 5/21/2012 26.63/19/2012 21.3 5/22/2012 26.4
Kona (AQS ID 150011012): 2011 and 2012 24-hr PM2.5 Flagged Data2011 2012
Appendix B

Q3 µg/m3 Q4 µg/m3
7/1/2012 21.3 10/1/2012 18.27/2/2012 22.2 10/2/2012 17.97/3/2012 17.9 10/3/2012 17.27/5/2012 25.4 10/5/2012 16.27/6/2012 24.3 10/6/2012 16.97/7/2012 18.3 10/8/2012 16.17/8/2012 19.7 10/9/2012 16.97/9/2012 18.1 10/10/2012 19.4
7/10/2012 16.7 10/11/2012 18.17/11/2012 16.7 10/16/2012 16.27/17/2012 19.1 11/3/2012 16.27/18/2012 21.9 11/28/2012 19.07/19/2012 21.0 11/29/2012 16.57/20/2012 16.7 11/30/2012 19.07/21/2012 18.2 12/1/2012 24.07/22/2012 18.0 12/2/2012 16.57/26/2012 16.5 12/5/2012 17.58/4/2012 16.4 12/6/2012 18.5
8/15/2012 21.9 12/7/2012 19.88/16/2012 21.2 12/8/2012 16.69/16/2012 16.1 12/9/2012 16.39/18/2012 16.0 12/12/2012 17.19/30/2012 16.9 12/13/2012 17.4
12/15/2012 16.312/22/2012 16.012/24/2012 17.512/27/2012 16.012/28/2012 17.2
Kona (AQS ID 150011012): 2011 and 2012 24-hr PM2.5 Flagged Data2012 Continued
Appendix B