Embed Size (px)
Citation preview
STATE OF GEORGIA
Program Year 2015 Annual
Report
Workforce Innovation and Opportunity Act
2
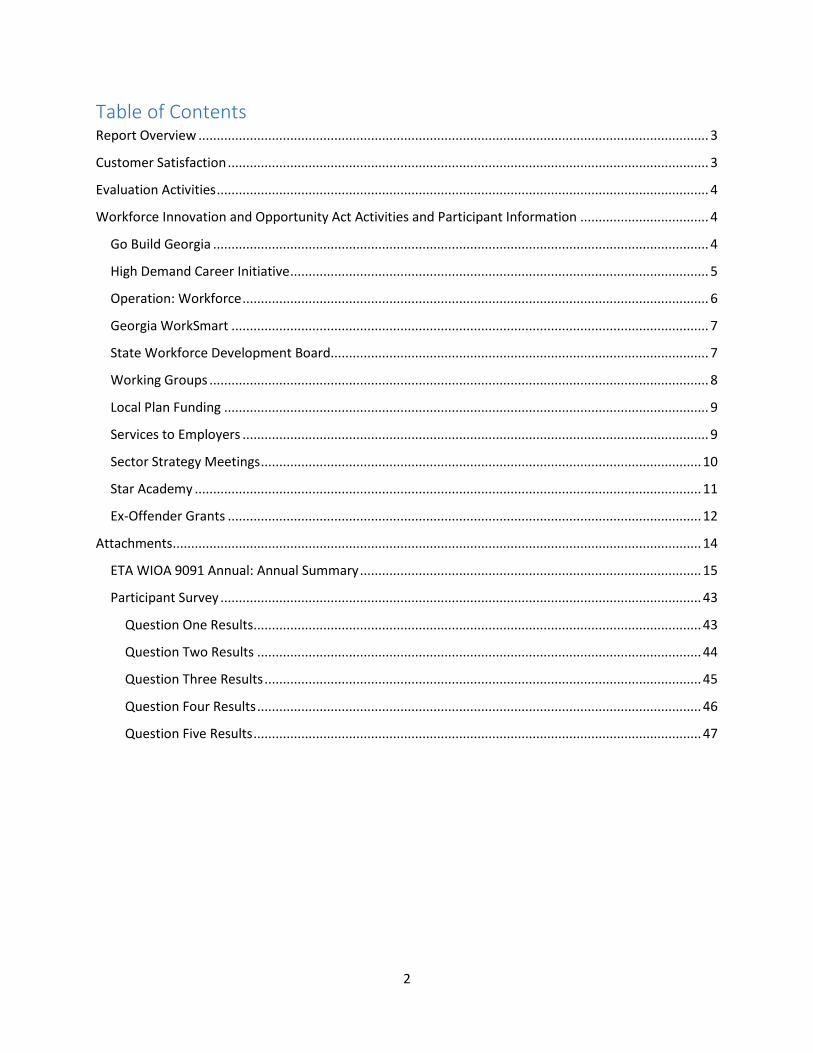
Table of Contents Report Overview ........................................................................................................................................... 3
Customer Satisfaction ................................................................................................................................... 3
Evaluation Activities ...................................................................................................................................... 4
Workforce Innovation and Opportunity Act Activities and Participant Information ................................... 4
Go Build Georgia ....................................................................................................................................... 4
High Demand Career Initiative .................................................................................................................. 5
Operation: Workforce ............................................................................................................................... 6
Georgia WorkSmart .................................................................................................................................. 7
State Workforce Development Board....................................................................................................... 7
Working Groups ........................................................................................................................................ 8
Local Plan Funding .................................................................................................................................... 9
Services to Employers ............................................................................................................................... 9
Sector Strategy Meetings ........................................................................................................................ 10
Star Academy .......................................................................................................................................... 11
Ex-Offender Grants ................................................................................................................................. 12
Attachments ................................................................................................................................................ 14
ETA WIOA 9091 Annual: Annual Summary ............................................................................................. 15
Participant Survey ................................................................................................................................... 43
Question One Results .......................................................................................................................... 43
Question Two Results ......................................................................................................................... 44
Question Three Results ....................................................................................................................... 45
Question Four Results ......................................................................................................................... 46
Question Five Results .......................................................................................................................... 47
3
Report Overview This Annual Report Narrative covers the Workforce Innovation and Opportunity Act (WIOA) Program Year
PY15. This report includes the State’s efforts regarding customer satisfaction measures, evaluation
activities, and WIOA activities and participant information, among other areas. Relatedly, the State
assures that all required elements are reported uniformly, such that relevant state-by-state comparisons
can be made. Within this reporting format, the State highlights some anecdotal success stories as an
illustration of the combined effect of funding allocation and execution of key programs. Lastly, the State
did not seek any waivers during PY15, thus there were no related approvals.
Customer Satisfaction Understanding the importance of customer satisfaction, the State directly engaged every WIOA
participant with a customer satisfaction survey. This survey was emailed directly to each WIOA participant
who were then asked to respond to 5 questions, each containing 5 possible rankings, ranging from
“extremely satisfied” to “not satisfied” or “excellent” to “not good at all,” depending on the question. The
following were the 5 questions:
1) Question 1: Overall how satisfied are you with the services provided to you by your Local
Workforce Development Area’s Career Center?
2) Question 2: Taking into account all of the expectations you held, have the services you received
from your Local Workforce Development Area’s Career Center met your expectations?
3) Question 3: Considering an ideal program for someone in your situation, how well did the services
you received from the Local Workforce Development Area’s Career Center compare with that
ideal?
4) Question 4: Based on the level of service you received from the Local Workforce Development
Area’s Career Center, how likely would you be to recommend others?
5) Question 5: Overall, how would you rate your total experience from your Local Workforce
Development Area’s Career Center?
With an average of approximately 903 participants answering each question, the overwhelming majority
of participants ranked their experience within the highest two most favorable ratings. Specifically, an
average of 72% of participants across all questions ranked their experience with the Local Workforce
Development Area’s Career Center within the highest two most favorable ratings; the highest being
question #4 (75%) in that the participant would likely recommend others to the Local Workforce
Development Area’s Career Center (See attached Participant Survey). Georgia is particularly proud of its
rankings from its WIOA participants, especially given in its high number of Local Workforce Development
Areas. However, the State will continue to strive for a 100% ranking across all areas regarding participant
satisfaction.
It is important to note that the high degree of satisfaction exhibited in the participant survey directly
correlates to the State’s success regarding its performance measures. All 19 Local Workforce

4
Development Areas positively contributed to the State’s high standards, having exceeded in all but two
performance measures during PY15.
Evaluation Activities The State primarily provides a formal evaluation of its workforce system through its annual monitoring
and review of its 19 Local Workforce Development Areas. The monitoring process typically begins during
the month of July and ends in January. The evaluation process includes a desk review of key documents,
on-site interviews of staff and a related inspection of documents over a 6-month time period. In the end,
a report is produced for which each Director is given the opportunity to review, analyze and discuss all
findings, observations and recommendations as a part of the final approval/completion process.
Additionally, unrelated to the monitoring period, key staff regularly visit Local Workforce Development
Areas, in part, to gather further information outside of merely monitoring. The Deputy Commissioner of
Workforce Development has undertaken these visits in the past as well as other key staff. The information
obtained during these site visits, can also be used for the purposes of evaluation.
Workforce Innovation and Opportunity Act Activities and Participant
Information
Go Build Georgia
On January 17, 2012, Governor Deal launched Go Build Georgia. Go Build Georgia is a state initiative
designed to increase awareness of skilled trade careers, focused on manufacturing, telecommunications,
energy, logistics and construction. This public-private partnership is designed to inform youth, educators
and the public at large about the benefits and opportunities within skilled trade industries throughout the
state.
By building a broad coalition of key public and private stakeholders, Go Build Georgia strives to increase
the number of those entering the skilled trade workforce, while increasing the awareness of existing
training programs leading to these in-demand occupations. Through this strategic focus on the skilled
labor supply in our state, Georgia seeks to reduce the skilled labor gap identified through the High Demand
Career Initiative (HDCI) and other labor data sources.
The Go Build Team has been very active over the last year. The monthly average registration rate has
grown from 123.52 to 175 (an increase of 42%). The Go Build High Demand Career Scholarship and Go
Build Grant application process resulted in 24 awards for the first round. Most recently, the Go Build Team
completed its second wave of grant applications with 33 to be vetted by the end of November 2016.
Concurrently, the new Go Build Georgia website is under development. Members of the Go Build Georgia
Team have made an exceptional effort in fostering local school-industry partnerships over the past year.
The Go Build Georgia Team recently received recognition from Warren Tech (DeKalb County) for assisting
the school in the formation of such a partnership.
5
In total, Go Build spending has supported the following:
1) Individual scholarships awarded to graduating seniors to attend a TCSG institution;
2) Grants to middle and high schools to support education about careers in skilled trades; and
3) Promotional materials, including posters for educators across the State.
High Demand Career Initiative
During the first two years of High Demand Career Initiative (HDCI), the primary focus of the initiative was
to engage the private sector by collecting information about their present and future workforce needs.
By hosting 17 public meetings throughout the state, which included more than 120 employers, and by
creating an online assessment, the HDCI team heard a clear and consistent message regarding workforce
needs in Georgia: An effectively trained workforce is essential to the sustainability of Georgia business. A
range of in-demand and difficult-to-fill positions was identified, along with essential workforce skills that
are in short supply. Through those discussions, the data and information collected has equipped the HDCI
team in providing a clear depiction of statewide workforce needs that has helped influence statewide
policy and programming. Although this data is sufficient for describing the workforce needs of Georgia
employers statewide, it lacks the ability to provide adequate details for implementing solutions at the
local and regional levels. Therefore, the HDCI team is prepared to take the next logical step of the
initiative, which includes two tracks.
The first track involves the HDCI team working with regions throughout the state to assist with local and
regional implementation of the HDCI model, through the development of HDCI Sector Partnerships. HDCI
has developed a Sector Partnership Guide to assist the regions in building a framework for ongoing
partnership and communication between public and private sectors. To initiate this process, HDCI is
hosting 12 regional workshops with key regional stakeholders from October to November of 2016. To
assist regions with implementation of the HDCI Sector Partnerships, the Georgia Department of Economic
Development’s Workforce Division (WFD) has released the HDCI Sector Partnership Grants to provide
potential financial support to the regional stakeholders. These grants will give each of the 12 regions the
opportunity to apply for up to $250,000 in funding to support their partnerships. One of the main
purposes of the regional workshops is to discuss the grant application process to ensure every region is
fully equipped to submit a competitive application. The grant is intended to provide sufficient funding to
support a regional convener (either full-time employee(s) or consulting team) to assist with the regional
collaboration.
The second track will be focused on utilizing the information that has been gathered to develop industry-
specific task forces with business representatives and key stakeholders. These task forces will be focused
on discussing the already uncovered acute workforce needs in greater detail and working together to
develop innovative strategies for addressing those needs. Currently, three task forces have been
developed: one to address the critical need for software developers in the Information Technology
industry; one to focus on the “above-the-line” workforce in the Film, Television and Digital Entertainment
6
industry; and one to address the need for truck drivers and warehouse workers in the Logistics &
Transportation industry.
The goal of HDCI, since its launch, has been to develop an infrastructure of communication and
collaboration between the public and private sectors. These regional partnerships and task forces are
additional investments in continuing that work and HDCI funds spent during the last year have supported
these endeavors.
Operation: Workforce
Operation: Workforce is the State of Georgia’s veteran and transitioning service member employment
initiative. This program serves two roles: to connect current and former service members with the
workforce system and to connect Georgia businesses with this highly skilled workforce. This is
accomplished through the Operation: Workforce website which hosts a job portal and provides access to
resources. Additionally, Operation: Workforce expands its reach through partnerships with installations,
LWDAs, chambers of commerce, higher educations, non-profits and veteran centric groups.
Funds directly designated to Operation: Workforce were spent on the upkeep of
operationworkforce.com, which has experienced an increase of 3,315 veteran signups and an increase of
200 Georgia companies registered on the site in the last program year. Funds were also expended to host
a Soldier for Life Employment Summit on Fort Benning in conjunction with the Greater Columbus Chamber
of Commerce and Fort Benning November 4-7, 2015. During this summit, 500 transitioning service
members and 55 companies were in attendance.
In addition to direct funds, indirect funds were used to support Operation: Workforce in PY15. Through
local formula funds, participants were able to attend Georgia Tech’s Veterans Education Training and
Transition (VET²) Program, which takes transitioning service members and gives them a one week course
in transition and then pairs them with a company for a three-week internship. Companies such as
Gulfstream, JCB, The Coca-Cola Company, and many others have participated in this program. In PY15,
the job placement rate was 97% with an average annual salary of $57,000.
To build upon the successful VET² Program, WFD and Operation: Workforce utilized state Rapid Response
funds to address the military cuts affecting Fort Benning and Fort Stewart by forming VET² 101, an online
version of the classroom portion of VET². The program is currently funded to allow 7,000 transitioning
service members to take the course and each participant will be registered on operationworkforce.com
as a part of the course.
As featured in the January issue of Georgia Trend, a service member transitioning out of Fort Stewart
participated in VET² through WorkSource Coastal and obtained a job as an aviation technician at
Gulfstream, seamlessly transferring skills that he learned in the Army into the civilian workforce.
7
Georgia WorkSmart
Launched in October 2015, Georgia WorkSmart is the State’s work-based learning initiative. The program
promotes work-based learning models, such as apprenticeships, internships and on-the-job training, as a
workforce development tool. Georgia WorkSmart assists Georgia companies in developing and
implementing customized training programs to meet their specific hiring and training needs.
This initiative is a collaborative partnership between the Georgia Department of Economic Development’s
Workforce Division, the U.S. Department of Labor’s Office of Apprenticeship, the Technical College System
of Georgia and the Local Workforce Development Areas. Through these partnerships, a key focus of
Georgia WorkSmart is to promote Registered Apprenticeships – an approved, credentialed training
program that combines customized technical instruction with on-the-job learning experiences.
Funds directly designated to Georgia WorkSmart during its first year of operation were primarily expended
on salary, travel, and outreach items. Outreach items were purchased to assist in the official launch event
of the Georgia WorkSmart initiative at the King’s Hawaiian facility in Flowery Branch. King’s Hawaiian is
one of thirty companies to summit letters of commitment to apprenticeships programs. To date, Georgia
WorkSmart has engaged over ninety companies throughout the State to promote the benefits of work-
based learning.
The program manager travelled to Washington D.C. to attend the White House Summit on American
Apprenticeships in September 2015. This summit was held in conjunction with the launch of USDOL’s
American Apprenticeship Initiative grant (AAI). Of the $175 million awarded nationally, Georgia was
granted a $2.99 million award to promote Registered Apprenticeships in advanced manufacturing.
Additional travel costs were expended as Georgia WorkSmart promotes the benefits of Registered
Apprenticeships and assists businesses to create their own customized training programs throughout the
State.
State Workforce Development Board
The active collaboration of the State Workforce Development Board (SWDB), the LWDBs, WFD and the
state’s One-Stop Delivery System is a key component of workforce development in Georgia. This
collaboration begins with the Governor, who is responsible for the establishment of the SWDB. The
SWDB’s membership is comprised of state business and community representatives, members of the
state legislature, adult and youth service providers, chief elected officials, staff of partner state agencies
and representatives of organized labor. In order to prepare for the transition to WIOA, the Governor
examined the current list of members and made additional appointments to the SWDB at the end of PY14.
SWDB members whose board eligibility categories were no longer required by law were re-evaluated and
some were not reappointed to the board. Due to these changes, the SWDB is now fully compliant with
WIOA law.

8
The leadership of the SWDB has developed four committees in order to better assist program and LWDA
development. Those committees are the following: Youth Committee; Re-Employment Services
Committee; Local Workforce Development Area Guidance Committee and Executive Committee. SWDB
members are assigned to those committees based on their areas of experience and interest. WFD’s
programmatic staff serve the SWDB’s various committees by providing detailed research that enables the
committees to make informed policy decisions that are particular to their specific needs. The committees
meet at least four times a year.
One of the SWDB’s most important role is the development of a statewide strategic plan, which
establishes the four-year strategy for the Statewide Workforce Development System. In order to promote
integration, the board worked within the working group structure described in the Working Group
Sections below to develop the plan. Through the board’s vision, the state plan contains the writing, input
and direction of multiple state agencies, local workforce offices and community leaders.
The SWDB meets four times a year. The board has made it a priority to visit the LWDAs for the meetings
of the SWDB. This effort has enabled the members to gain a wider perspective of how services are
delivered across the state, meet local staff, and hear firsthand customer (participant and business) success
stories.
Working Groups
In order to aid the State Workforce Development Board (SWDB) in coordinating services and policy
alignment, WFD created four Working Groups and they were the following: the WIOA Data Integration
Working Group, the WIOA One-Stop Funding and Procurement Working Group, the WIOA One-Stop
Integration Working Group, and the WIOA Administration and Board Structure Working Group. Each
group included members from the Georgia Department of Economic Development Workforce Division
(GDEcD WFD), Georgia Department of Labor (GDOL), Georgia Vocational Rehabilitation Agency (GVRA),
Technical College System of Georgia Office of Adult Education (TCSG OAE), Department of Human Services
(DHS), Local Workforce Development Areas (LWDA), and State Workforce Development Board (SWDB)
members. By gathering such a broad range of members, the Working Groups were able to collaborate to
create a Unified State Plan and make the transition from WIA to WIOA a smoother process. All four groups
have been able to meet consistently and will continue doing so.
The WIOA Data Integration Working Group was created to develop methods to facilitate the exchange of
data between core WIOA partners. The group works with the Georgia Tech Research Institute (GTRI), and
together they are working to find methods for the core partner agencies to share data and streamline the
participant intake process. Thus far, the group has reviewed proposed regulations and data reporting
processes with the WFD staff in preparation for meetings with various core partner agencies. Additionally,
the group has met with GDOL, met with TCSG, met with GVRA, and started documenting core partner
agency profiles.
The primary task of the WIOA One-Stop Funding and Procurement Working Group is to outline the process
for procurement of services with WIOA funding. The working group has developed procurement guidance

9
for LWDAs. Additionally, the group has established guidance outlining the State expectations that each
LWDA needs to fulfill to show progress towards the procurement of their one-stop operator. The WIOA
One-Stop Funding and Procurement Working Group has also met jointly with the WIOA One-Stop
Integrated Working Group to develop customized one-stop operator and location procurement guidance
for each LWDA.
The WIOA One-Stop Integrated Working Group develops ways to integrate workforce programs, then
presents these solutions to SWDB. The group has defined the requirements for co-location, physical
presence, and direct linkage spoke about the vision for comprehensive one-stops and analyzed issues that
might arise when co-location and one-stop location selection. The group also worked on a One-Stop Self-
Assessment to help the joint meeting in drafting guidance for the procurement of the comprehensive one-
stop location within each LWDA.
The WIOA Administration and Board Structure Working Group works to develop cross-agency policies and
guidance dealing with service delivery, administration and local and state board structure. Since the
creation of the working group, five goals have been accomplished. The group has distributed guidance for
the certification of the Local Workforce Development Boards (LWDBs) and completed the certification
process, completed the LWDA and Region designation process, completed and submitted the Georgia
Unified State Plan, and organized a successful Georgia WIOA Convening.
Local Plan Funding
The 19 LWDAs were asked to submit regional and local plans outlining the strategies they would develop
to comply with the Workforce Innovation and Opportunity Act (WIOA). As per WIOA § 108, “each local
board shall develop and submit to the Governor a comprehensive 4-year local plan, in partnership with
the chief elected official. The local plan shall support the strategy described in the State plan in accordance
with WIOA § 102(b)(1)(E) and, otherwise, be consistent with the State plan.”
To assist the LWDAs with the execution of their plans, the Workforce Division (WFD) offered a grant of up
to $25,000 to each region. This funding was to be used to hire a consultant or contractor to assist with the
development and writing of the plan, cover the travel costs of employees and board members to and from
regional planning meetings, and hosting regional planning meetings. If the region planned to use the
funding for costs other than those listed above, they were required to submit a narrative describing how
the funds would be allocated. The LWDAs that requested funding were LWDAs 1, 3, 4, 5, 6, 7, 8, 10, 11 14,
15, 16, 17, and 18. With this funding, local areas were able to utilize neutral conveners, consultants, or
other resources to assist with the drafting and planning process.
Services to Employers
WFD is committed to leveraging resources and efforts in order to meet the needs of the business
customers of the WorkSource Georgia System in an integrated fashion. Furthermore, WFD works with
many state entities to inform Georgia employers of the services that are available to them through their
10
local LWDAs. When new companies relocate or expand in Georgia, WFD and the LWDAs work with the
Georgia Department of Economic Development in order to ensure that those companies are aware of the
services offered.
The WorkSource Georgia system is equipped to support businesses in many different ways. One of those
ways is through applicant screening at WorkSource Georgia Centers. This service reduces the time and
cost that a business would need in order to find qualified applicants. The LWDAs can also provide applicant
referrals and job posting services for businesses that need to hire. This service can increase the qualified
applicant pool for employers. Conducting job fairs and letting companies use WorkSource Georgia center
space for interviews are also services that local areas can provide. Additionally, LWDAs can provide pre-
employment assessments. Local areas use a variety of different assessments in order to screen qualified
applicants for a potential employer. The use of these assessments can give an employer greater insight as
to where an applicant’s competencies and skills gaps lie. LWDAs can also offer employers a variety of
different data including: in-demand occupations, labor market information, and economic trends.
WFD heavily promoted the use of work-based learning services in PY15 including On-the-Job Training
(OJT), Incumbent Worker Training (IWT), Customized Training (CT), and Workforce Experience (WEx). OJT
is perhaps the most popular service that an LWDA can offer an employer. In PY15, WFD contributed
Governor’s Reserve Funding to multiple local OJT projects, an example of which was for Caterpillar in
Athens Georgia.
The Caterpillar Project has served 279 participants in total. Caterpillar received $387,252 in wage
reimbursement at the 50% rate based on the company size. All 270 persons were unemployed at the time
they were hired by Caterpillar and were either hired as an entry level assembler or welder. The projected
annual earnings after hire (averaging the assembler’s and the welder’s entry wage to calculate annual
average earnings) is $31,200. That equates to $8,704,800 in wages earned and spent in the local
community. Since all of the persons served through the OJT activity were unemployed at the time of
Caterpillar hire and enrollment in OJT, this represents a significant increase in post-program economic
earnings for those persons.
Sector Strategy Meetings
In PY15 WFD developed sector strategy academies to assist with the development of industry
partnerships. By using the Aspen Institutes’ Sector Skills Academy methods as the foundation, the
partners were better able to address the workforce issues facing companies like talent preparation,
continued employment, and career advancement. The sessions also aided in the connection of employers,
training providers, and community organizations across the state.
The 19 LWDAs were divided into the WIOA designated 12 state regions. Those regions were then assigned
to specific parts of the state for their sector strategy location. WFD hosted four sector strategy training
sessions. These were located in North Georgia, Metro Atlanta, Middle Georgia, and South and Coastal

11
Georgia. The regions were tasked with bringing representatives from core partners, training/service
providers, non-profit leaders, and industry leaders. Each session was two days. During the sessions, areas
were able to discuss the purpose of the training, view presentations on relevant topics, and break out into
groups for discussions and applicable exercises. Presentations included topics such as “What are Sector
Strategies,” “Labor Market Information,” “Growing the Talent Pipeline,” and “Developing Industry
Networks.” Additionally, the sessions served as the groundwork for the development of the sector
strategies sections of the LWDA regional and local plans.
To follow up on the progress of the regions, LWDAs were asked to give presentations with updates on the
successes and difficulties they were facing with developing sector strategies and the development of their
local plans. These presentations were given at the Georgia WIOA Convening, held in August of 2016, and
allowed each region to see what challenges other areas were facing and how they were working to solve
them. Further development will take place in PY16.
Star Academy
The Pitsco Star Academy program is an effective dropout prevention solution designed to serve at-risk
students. Star Academy ensures that each student has the opportunity to experience academic success
by presenting required high school curricula in an alternative, hands-on approach. Because 66% of over-
age students eventually drop out of school, the Star Academy Program targets the over-age student
demographic. Different learning methods, productive communication techniques, integration of
workplace skills, healthy school environments, and supplemental support services provide a foundation
for student success.
The Star Academy Program addresses national and state standards in four core subjects. Nontraditional
methods of instruction engage all student-learning domains. The implementation and integration of a mix
of strategies, along with a positive school environment, ensures student engagement and support and
provides students the much-needed opportunity to succeed in school. The Star Academy model was
implemented as a school within a school in the Coffee County Career Academy through the support of
WFD and LWDA 18. Though the Career Academy as a whole serves high school students, Star Academy
serves over-age middle school students, with a goal of accelerating them from 8th to 10th grade during
one academic year. The students work individually through hands-on, project-based curricula which
concentrate on the four key areas of math, science, language arts, and social studies.
Students participating in the program were WIA and then WIOA eligible and marked as probable dropouts
by the Coffee County school system. Many came to the program with severe disciplinary issues; all came
with extreme life challenges. The objective of the program was to re-engage the students in learning, to
keep them from dropping out, and ultimately to award them with enough credits to get back on track
towards high school graduation.
12
The state is in the third and final year of the program. In PY15 69 students were enrolled. 37 students
accelerated two grade levels (went from 8th grade to 10th grade). Of the 32 students remaining, one
student dropped out and is currently pursuing a GED. The other students are still attempting to gain
enough credit to be promoted to the 10th grade, but remain in-school.
Ex-Offender Grants
In PY15 WFD offered grants to LWDA to encourage innovative program designs for serving ex-offenders.
The grant was awarded to 6 LWDAs which were the following: WorkSource Georgia Mountains (LWDA 2),
WorkSource Atlanta (LWDA 3), WorkSource DeKalb (LWDA 5), WorkSource West Central Georgia (LWDA
8), WorkSource Southwest Georgia (LWDA 17), and WorkSource Coastal (LWDA 20).
WorkSource Georgia Mountains (LWDA 2) received a grant of $25,000. With that funding, the LWDA
served 11 women in the Lee Arrendale State Prison through the Training2Work (T2W) Offender Job
Training Program. The participants received training through Goodwill Industries of North Georgia and
were taught highway and general construction skills and soft skills through a combination of classroom
training and on-the-job training. All 11 women successfully completed the program.
WorkSource Atlanta (LWDA 3) received a grant of $20,000. The LWDA worked with the Atlanta
Transitional Center. Participants were enrolled in the area’s four-week job readiness class. The class
involved resume preparation, work ethic simulations, time management classes, application process
simulations, and mock interviews. Some participants were directly matched with employers after the class
and others were further enrolled in Adult Work Experience.
WorkSource DeKalb (LWDA 5) received a grant of $12,738 to served ten eligible participants. The LWDA
focused on training opportunities at the local technical college. If a participant was not able to gain entry
into post-secondary education, the LWDA enrolled the participant in GED classes (if necessary) or
completed the necessary remediation with the participant. The LWDA also conducted extensive research
into ex-offender friendly fields. Participants were only offered training opportunities that led to jobs in
the identified fields. Once the training was complete, the participants worked with a dedicated case
manager to find employment.
WorkSource West Central Georgia (LWDA 8) received a grant of $25,000 to serve 15 eligible participants.
The LWDA utilized a workforce fundamentals course which combines classroom training with OJT in the
manufacturing and warehousing fields. Participants were then matched with local employers.
WorkSource Southwest Georgia (LWDA 17) received no state grant funds, but dedicated local funding to
be part of the state pilot. The area implemented a three to five-month training program that included
initial assessment, employability planning, job readiness training, transition support services, job search
and placement assistance, and job retention services based on the needs identified in each participant’s
initial objective assessment. The program was built to accommodate individualized plans which would
address the individual’s identified needs. The area served 13 participants through this program. After
completion, participants were either enrolled in post-secondary education or Work Experience or placed
directly in employment with an employer.

13
WorkSource Coastal (LWDA 20) received a grant of $25,000. Using grants funds, the LWDA created the
Coastal Transitional Initiative which focused on placing ex-offenders in jobs within the construction,
warehousing, and logistics industries. The program served 20 participants with the grant funding through
the 5-phase program. During Phase I, the LWDA staff worked with employers to identify potential
employees from the transitional center who were both eligible for the program as well as had the
potential to serve as quality employees for the employer. The employer interviewed and selected program
participants. During Phase II staff coordinated the delivery of applicable assessments, evaluations, and
pre-employment training to those selected, to include: soft skills training, pre-employment screening, and
Test of Adult Basic Education (TABE). During Phase III participants were placed into subsidized
employment at the employer facility at a rate of $7.25 per hour for up to 40 hours per week. The work
experience lasted for ten weeks. During Phase IV case managers worked with the companies to place the
participants at a pay rate of at least $9.50/ per hour. Finally, during Phase V the LWDA continued to offer
follow-up services to the participant.

14
Attachments
15
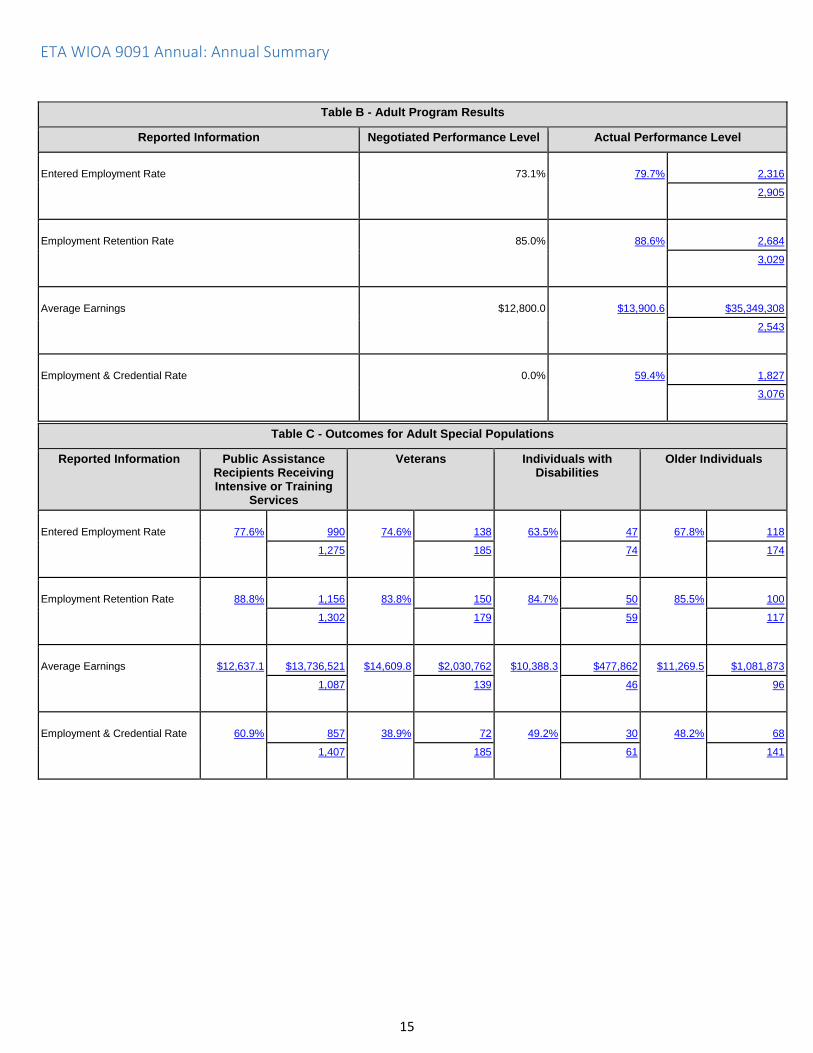
ETA WIOA 9091 Annual: Annual Summary
Table B - Adult Program Results
Reported Information Negotiated Performance Level Actual Performance Level
Entered Employment Rate
73.1%
79.7%
2,316
2,905
Employment Retention Rate
85.0%
88.6%
2,684
3,029
Average Earnings
$12,800.0
$13,900.6
$35,349,308
2,543
Employment & Credential Rate
0.0%
59.4%
1,827
3,076
Table C - Outcomes for Adult Special Populations
Reported Information Public Assistance Recipients Receiving Intensive or Training
Services
Veterans Individuals with Disabilities
Older Individuals
Entered Employment Rate
77.6%
990
74.6%
138
63.5%
47
67.8%
118
1,275
185
74
174
Employment Retention Rate
88.8%
1,156
83.8%
150
84.7%
50
85.5%
100
1,302
179
59
117
Average Earnings
$12,637.1
$13,736,521
$14,609.8
$2,030,762
$10,388.3
$477,862
$11,269.5
$1,081,873
1,087
139
46
96
Employment & Credential Rate
60.9%
857
38.9%
72
49.2%
30
48.2%
68
1,407
185
61
141
16
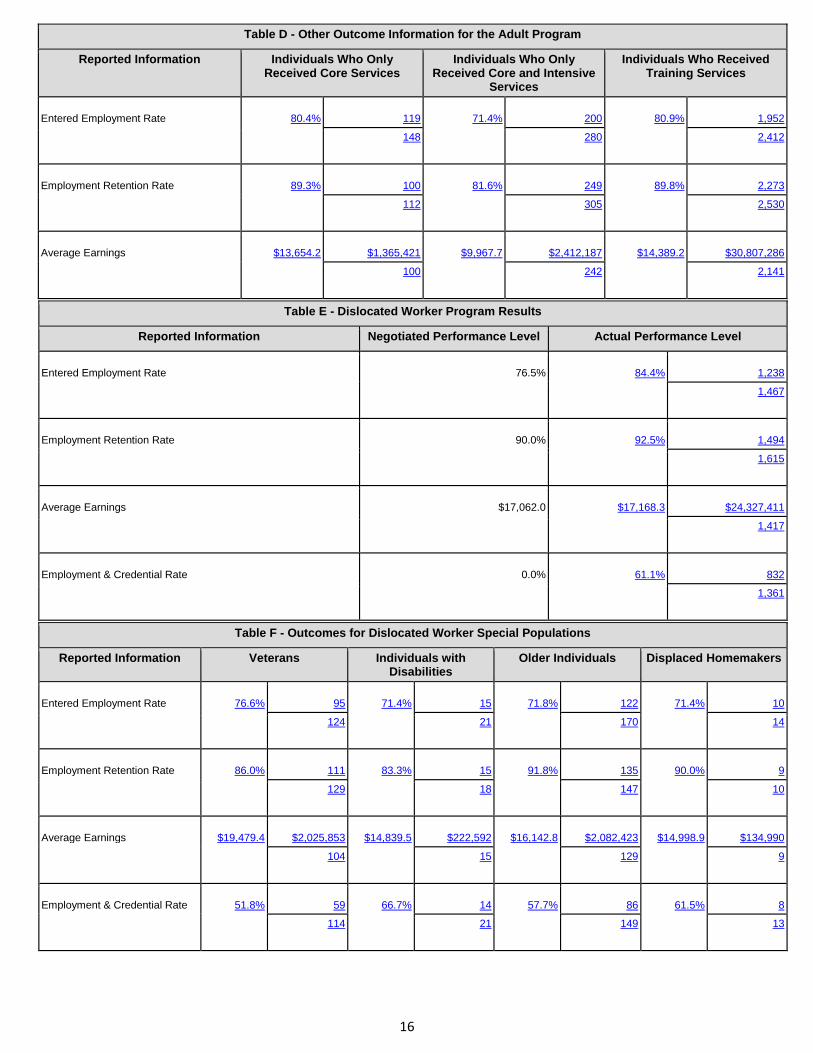
Table D - Other Outcome Information for the Adult Program
Reported Information Individuals Who Only Received Core Services
Individuals Who Only Received Core and Intensive
Services
Individuals Who Received Training Services
Entered Employment Rate
80.4%
119
71.4%
200
80.9%
1,952
148
280
2,412
Employment Retention Rate
89.3%
100
81.6%
249
89.8%
2,273
112
305
2,530
Average Earnings
$13,654.2
$1,365,421
$9,967.7
$2,412,187
$14,389.2
$30,807,286
100
242
2,141
Table E - Dislocated Worker Program Results
Reported Information Negotiated Performance Level Actual Performance Level
Entered Employment Rate
76.5%
84.4%
1,238
1,467
Employment Retention Rate
90.0%
92.5%
1,494
1,615
Average Earnings
$17,062.0
$17,168.3
$24,327,411
1,417
Employment & Credential Rate
0.0%
61.1%
832
1,361
Table F - Outcomes for Dislocated Worker Special Populations
Reported Information Veterans Individuals with Disabilities
Older Individuals Displaced Homemakers
Entered Employment Rate
76.6%
95
71.4%
15
71.8%
122
71.4%
10
124
21
170
14
Employment Retention Rate
86.0%
111
83.3%
15
91.8%
135
90.0%
9
129
18
147
10
Average Earnings
$19,479.4
$2,025,853
$14,839.5
$222,592
$16,142.8
$2,082,423
$14,998.9
$134,990
104
15
129
9
Employment & Credential Rate
51.8%
59
66.7%
14
57.7%
86
61.5%
8
114
21
149
13

17
Table G - Other Outcome Information for the Dislocated Worker Program
Reported Information Individuals Who Only Received Core Services
Individuals Who Only Received Core and Intensive
Services
Individuals Who Received Training Services
Entered Employment Rate
93.3%
14
71.0%
71
85.5%
1,142
15
100
1,335
Employment Retention Rate
100.0%
13
89.1%
114
92.8%
1,306
13
128
1,408
Average Earnings
$11,961.9
$155,505
$14,742.3
$1,621,652
$17,302.0
$21,350,667
13
110
1,234
Table H.1 - Youth (14 - 21) Program Results
Reported Information Negotiated Performance Level Actual Performance Level
Placement in Employment or Education
66.0%
71.0%
2,117
2,983
Attainment of Degree or Certificate
73.0%
68.3%
2,098
3,072
Literacy & Numeracy Gains
51.0%
43.9%
489
1,115
Table H.1.A - Outcomes for Youth Special Populations
Reported Information Public Assistance Recipients
Veterans Individuals with Disabilities
Out-of-School Youth
Placement in Employment or Education
70.4%
1,403
75.0%
3
68.6%
177
70.5%
628
1,992 4 258
891
Attainment of Degree or Certificate
66.2%
1,329
100.0%
2
71.2%
185
53.5%
453
2,009
2
260
847
Literacy & Numeracy Gains
43.0%
289
100.0%
1
37.5%
27
43.9%
489
672
1
72
1,115
Table H.2 - Older Youth (19 - 21) Program Results
Reported Information Negotiated Performance Level Actual Performance Level
Entered Employment Rate
0.0%
70.2% 431
614
Employment Retention Rate
0.0%
87.4%
484
554

18
Average Earnings
$0.0
$5,282.7
$2,762,874
523
Employment & Credential Rate
0.0%
42.3%
320
757
Table I - Outcomes for Older Youth Special Populations
Reported Information Public Assistance Recipients
Veterans Individuals with Disabilities
Out-of-School Youth
Entered Employment Rate
67.7%
256
100.0%
1
58.3%
28
69.3%
323
378
1
48
466
Employment Retention Rate
87.4%
277
0.0%
0
80.0%
28
86.9%
351
317
1
35
404
Average Earnings
$5,070.4
$1,500,831
$0.0
$0
$6,294.9
$201,437
$4,355.0
$1,667,972
296
1
32
383
Employment & Credential Rate
38.3%
169
100.0%
1
38.9%
21
36.8%
207
441
1
54
563
Table J - Younger Youth (14 - 18) Program Results
Reported Information Negotiated Performance Level Actual Performance Level
Skill Attainment Rate
0.0%
66.6%
1,003
1,505
Youth Diploma or Equivalent Rate
0.0%
81.9%
1,495
1,825
Employment Retention Rate
0.0%
71.8%
1,781
2,479
Table K - Outcomes for Younger Youth Special Populations
Reported Information Public Assistance Recipients Individuals with Disabilities Out-of-School Youth
Skill Attainment Rate
64.7%
566
68.9%
131
67.1%
230
875
190
343
Youth Diploma or Equivalent Rate
80.8%
949
82.8%
164
56.7%
204
1,175
198
360
Employment Retention Rate
72.5%
1,182
69.7%
159
62.1%
414
1,630
228
667
19
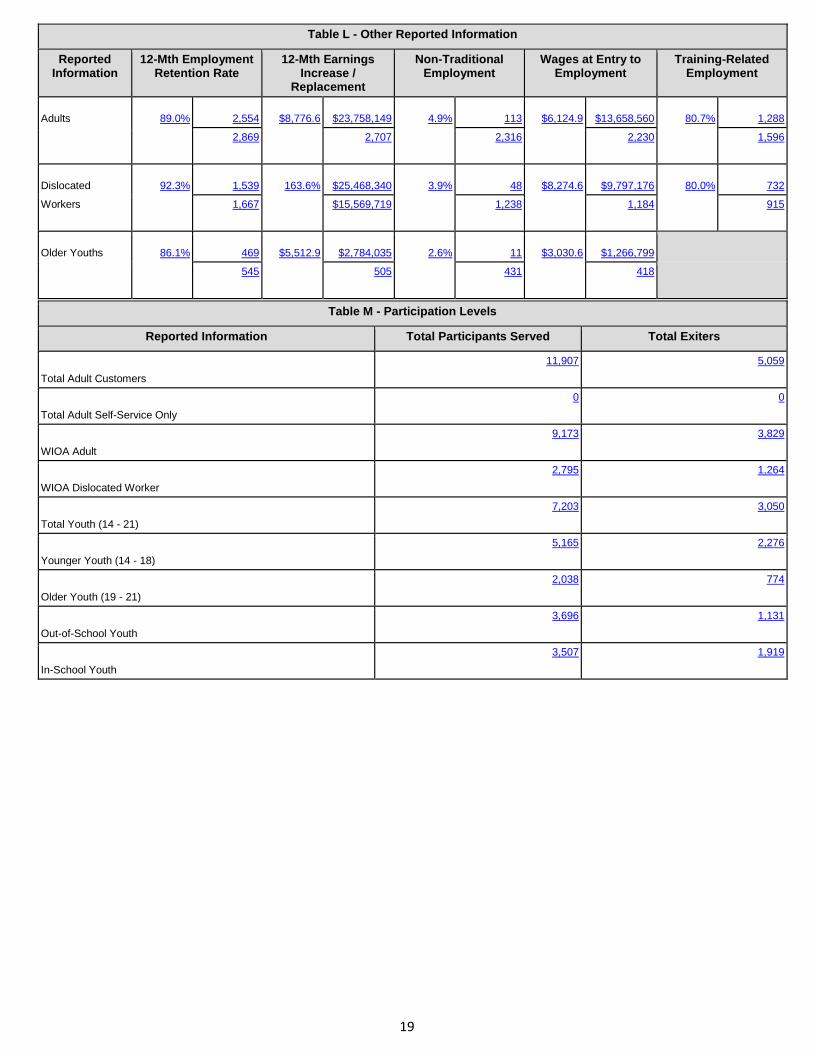
Table L - Other Reported Information
Reported Information
12-Mth Employment Retention Rate
12-Mth Earnings Increase /
Replacement
Non-Traditional Employment
Wages at Entry to Employment
Training-Related Employment
Adults
89.0%
2,554
$8,776.6
$23,758,149
4.9%
113
$6,124.9
$13,658,560
80.7%
1,288
2,869
2,707
2,316
2,230
1,596
Dislocated
92.3%
1,539
163.6%
$25,468,340
3.9%
48
$8,274.6
$9,797,176
80.0%
732
Workers 1,667
$15,569,719
1,238
1,184
915
Older Youths
86.1%
469
$5,512.9
$2,784,035
2.6%
11
$3,030.6
$1,266,799
545
505
431
418
Table M - Participation Levels
Reported Information Total Participants Served Total Exiters
Total Adult Customers 11,907
5,059
Total Adult Self-Service Only 0
0
WIOA Adult 9,173
3,829
WIOA Dislocated Worker 2,795
1,264
Total Youth (14 - 21) 7,203
3,050
Younger Youth (14 - 18) 5,165
2,276
Older Youth (19 - 21) 2,038
774
Out-of-School Youth 3,696
1,131
In-School Youth 3,507
1,919

20
Table N - Cost of Program Activities
Program Activity Total Federal Spending
Local Adults $23,321,157.45
Local Dislocated Workers $16,645,480.67
Local Youth $18,887,295.61
Rapid Response (up to 25%) 134 (a) (2) (A)
$2,328,899.36
Statewide Required Activities (up to 25%) 134 (a) (2) (B)
$3,464,916.99
Statewide Allowable Activities 134 (a) (3)
Pro
gram
Act
ivit
y D
escr
ipti
on
Go Build Georgia $447,806.03
Star Academy $246,650.39
Governor’s High Demand Career Initiative $153,563.40
Operation:Workforce $91,693.99
Georgia WorkSmart $105,217.23
WIOA Transition $131,096.29
Performance Incentive Grants $90,757
LWDA OJT Grants $1,029,459
LWDA Discretionary Funding $268,787
Other $137,072.33
Total of All Federal Spending Listed Above $67,349,852.74

21
Table O - Local Performance
Adults 598
Local Area Name Total Participants Served Dislocated Workers
290
Region 1 Older Youth (19 - 21)
109
Younger Youth (14 - 18) 310
Adults 271
ETA Assigned # Total Exiters Dislocated Workers 202
13210 Older Youth (19 - 21) 75
Younger Youth (14 - 18) 246
Reported Information Negotiated Performance Level
Actual Performance Level
Adults
79.0%
85.3%
Entered Employment Rates Dislocated Workers
86.0%
90.5%
Older Youth (19 - 21)
0.0%
69.8%
Adults
87.0%
92.7%
Retention Rates Dislocated Workers
93.0%
92.7%
Older Youth (19 - 21)
0.0%
85.0%
Younger Youth (14 - 18)
0.0%
75.1%
Adults
$12,500.0
$14,911.1
Average Earnings Dislocated Workers
$14,500.0
$14,853.7
Older Youth (19 - 21)
$0.0
$4,424.0
Adults 0.0% 53.9%
Credential / Diploma Rates Dislocated Workers 0.0% 49.0%
Older Youth (19 - 21) 0.0% 45.3%
Younger Youth (14 - 18)
0.0%
93.3%
Skill Attainment Rate Younger Youth (14 - 18)
0.0%
86.0%
Placement in Employment or Education Youth (14 - 21) 73.0% 76.5%
Attainment of Degree or Certificate Youth (14 - 21) 82.0%
86.9%
Literacy & Numeracy Gains Youth (14 - 21) 87.0% 89.1%

22
Table O - Local Performance
Adults 133
Local Area Name Total Participants Served
Dislocated Workers 41
Region 10 Older Youth (19 - 21) 47
Younger Youth (14 - 18) 79
Adults 31
ETA Assigned # Total Exiters Dislocated Workers 12
13295 Older Youth (19 - 21) 9
Younger Youth (14 - 18) 30
Reported Information Negotiated Performance Level
Actual Performance Level
Adults
87.0%
84.2%
Entered Employment Rates Dislocated Workers
82.0%
92.3%
Older Youth (19 - 21)
0.0%
100.0%
Adults
88.0%
94.3%
Retention Rates Dislocated Workers
90.0%
100.0%
Older Youth (19 - 21)
0.0%
100.0%
Younger Youth (14 - 18)
0.0%
86.5%
Adults
$14,000.0
$16,009.0
Average Earnings Dislocated Workers
$14,000.0
$14,548.3
Older Youth (19 - 21)
$0.0
$6,712.5
Adults
0.0%
88.9%
Credential / Diploma Rates Dislocated Workers
0.0%
76.9%
Older Youth (19 - 21)
0.0%
81.8%
Younger Youth (14 - 18)
0.0%
93.3%
Skill Attainment Rate Younger Youth (14 - 18)
0.0%
58.3%
Placement in Employment or Education Youth (14 - 21)
77.0%
97.5%
Attainment of Degree or Certificate Youth (14 - 21)
85.0%
91.3%
Literacy & Numeracy Gains Youth (14 - 21)
65.0%
66.7%

23
Table O - Local Performance
Adults 255
Local Area Name Total Participants Served
Dislocated Workers 59
Region 11 Older Youth (19 - 21) 20
Younger Youth (14 - 18) 73
Adults 86
ETA Assigned # Total Exiters Dislocated Workers 32
13265 Older Youth (19 - 21) 4
Younger Youth (14 - 18) 69
Reported Information Negotiated Performance Level
Actual Performance Level
Adults
74.0%
80.4%
Entered Employment Rates Dislocated Workers
71.0%
87.5%
Older Youth (19 - 21)
0.0%
100.0%
Adults
88.0%
84.9%
Retention Rates Dislocated Workers
90.0%
95.8%
Older Youth (19 - 21)
0.0%
100.0%
Younger Youth (14 - 18)
0.0%
82.8%
Adults
$14,250.0
$15,103.5
Average Earnings Dislocated Workers
$16,500.0
$15,514.4
Older Youth (19 - 21)
$0.0
$11,119.1
Adults
0.0%
70.8%
Credential / Diploma Rates Dislocated Workers
0.0%
72.0%
Older Youth (19 - 21)
0.0%
0.0%
Younger Youth (14 - 18)
0.0%
83.3%
Skill Attainment Rate Younger Youth (14 - 18)
0.0%
40.0%
Placement in Employment or Education Youth (14 - 21)
60.0%
74.5%
Attainment of Degree or Certificate Youth (14 - 21)
60.0%
66.0%
Literacy & Numeracy Gains Youth (14 - 21)
40.0%
44.4%

24
Table O - Local Performance
Adults 212
Local Area Name Total Participants Served
Dislocated Workers 33
Region 12 Older Youth (19 - 21) 42
Younger Youth (14 - 18) 173
Adults 46
ETA Assigned # Total Exiters Dislocated Workers 10
13195 Older Youth (19 - 21) 7
Younger Youth (14 - 18) 33
Reported Information Negotiated Performance Level
Actual Performance Level
Adults
82.0%
72.4%
Entered Employment Rates Dislocated Workers
85.0%
83.3%
Older Youth (19 - 21)
0.0%
66.7%
Adults
85.0%
81.4%
Retention Rates Dislocated Workers
90.0%
86.7%
Older Youth (19 - 21)
0.0%
90.9%
Younger Youth (14 - 18)
0.0%
76.7%
Adults
$12,500.0
$13,932.3
Average Earnings Dislocated Workers
$14,000.0
$15,305.6
Older Youth (19 - 21)
$0.0
$5,516.2
Adults
0.0%
65.8%
Credential / Diploma Rates Dislocated Workers
0.0%
50.0%
Older Youth (19 - 21)
0.0%
25.0%
Younger Youth (14 - 18)
0.0%
96.0%
Skill Attainment Rate Younger Youth (14 - 18)
0.0%
0.0%
Placement in Employment or Education Youth (14 - 21)
65.0%
48.4%
Attainment of Degree or Certificate Youth (14 - 21)
60.0%
81.3%
Literacy & Numeracy Gains Youth (14 - 21)
65.0%
0.0%
25
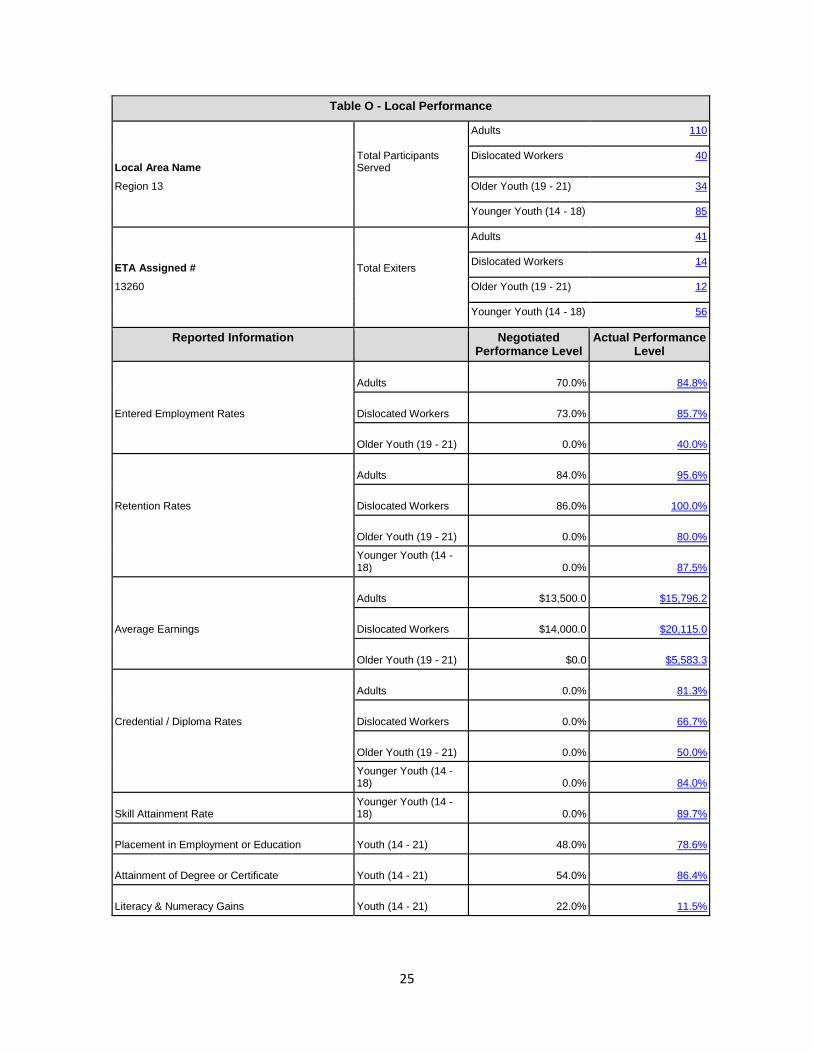
Table O - Local Performance
Adults 110
Local Area Name Total Participants Served
Dislocated Workers 40
Region 13 Older Youth (19 - 21) 34
Younger Youth (14 - 18) 85
Adults 41
ETA Assigned # Total Exiters Dislocated Workers 14
13260 Older Youth (19 - 21) 12
Younger Youth (14 - 18) 56
Reported Information Negotiated Performance Level
Actual Performance Level
Adults
70.0%
84.8%
Entered Employment Rates Dislocated Workers
73.0%
85.7%
Older Youth (19 - 21)
0.0%
40.0%
Adults
84.0%
95.6%
Retention Rates Dislocated Workers
86.0%
100.0%
Older Youth (19 - 21)
0.0%
80.0%
Younger Youth (14 - 18)
0.0%
87.5%
Adults
$13,500.0
$15,796.2
Average Earnings Dislocated Workers
$14,000.0
$20,115.0
Older Youth (19 - 21)
$0.0
$5,583.3
Adults
0.0%
81.3%
Credential / Diploma Rates Dislocated Workers
0.0%
66.7%
Older Youth (19 - 21)
0.0%
50.0%
Younger Youth (14 - 18)
0.0%
84.0%
Skill Attainment Rate Younger Youth (14 - 18)
0.0%
89.7%
Placement in Employment or Education Youth (14 - 21)
48.0%
78.6%
Attainment of Degree or Certificate Youth (14 - 21)
54.0%
86.4%
Literacy & Numeracy Gains Youth (14 - 21)
22.0%
11.5%

26
Table O - Local Performance
Adults 122
Local Area Name Total Participants Served
Dislocated Workers 22
Region 14 Older Youth (19 - 21) 17
Younger Youth (14 - 18) 59
Adults 69
ETA Assigned # Total Exiters Dislocated Workers 8
13110 Older Youth (19 - 21) 7
Younger Youth (14 - 18) 93
Reported Information Negotiated Performance Level
Actual Performance Level
Adults
80.0%
83.3%
Entered Employment Rates Dislocated Workers
85.0%
66.7%
Older Youth (19 - 21)
0.0%
84.6%
Adults
87.5%
85.2%
Retention Rates Dislocated Workers
90.6%
80.0%
Older Youth (19 - 21)
0.0%
100.0%
Younger Youth (14 - 18)
0.0%
57.0%
Adults
$13,000.0
$11,104.6
Average Earnings Dislocated Workers
$14,000.0
$11,629.7
Older Youth (19 - 21)
$0.0
$9,006.1
Adults
0.0%
73.1%
Credential / Diploma Rates Dislocated Workers
0.0%
50.0%
Older Youth (19 - 21)
0.0%
61.5%
Younger Youth (14 - 18)
0.0%
97.7%
Skill Attainment Rate Younger Youth (14 - 18)
0.0%
100.0%
Placement in Employment or Education Youth (14 - 21)
80.0%
60.0%
Attainment of Degree or Certificate Youth (14 - 21)
80.0%
92.3%
Literacy & Numeracy Gains Youth (14 - 21)
40.0%
71.4%

27
Table O - Local Performance
Adults 143
Local Area Name Total Participants Served
Dislocated Workers 9
Region 15 Older Youth (19 - 21) 50
Younger Youth (14 - 18) 37
Adults 111
ETA Assigned # Total Exiters Dislocated Workers 4
13285 Older Youth (19 - 21) 48
Younger Youth (14 - 18) 31
Reported Information Negotiated Performance Level
Actual Performance Level
Adults
80.9%
83.3%
Entered Employment Rates Dislocated Workers
82.4%
75.0%
Older Youth (19 - 21)
0.0%
50.0%
Adults
88.0%
94.2%
Retention Rates Dislocated Workers
92.0%
100.0%
Older Youth (19 - 21)
0.0%
71.4%
Younger Youth (14 - 18)
0.0%
75.0%
Adults
$13,500.0
$12,647.6
Average Earnings Dislocated Workers
$13,500.0
$16,119.9
Older Youth (19 - 21)
$0.0
$4,014.4
Adults
0.0%
56.3%
Credential / Diploma Rates Dislocated Workers
0.0%
33.3%
Older Youth (19 - 21)
0.0%
26.2%
Younger Youth (14 - 18)
0.0%
70.4%
Skill Attainment Rate Younger Youth (14 - 18)
0.0%
0.0%
Placement in Employment or Education Youth (14 - 21)
63.0%
60.6%
Attainment of Degree or Certificate Youth (14 - 21)
75.0%
47.9%
Literacy & Numeracy Gains Youth (14 - 21)
85.0%
97.7%
28
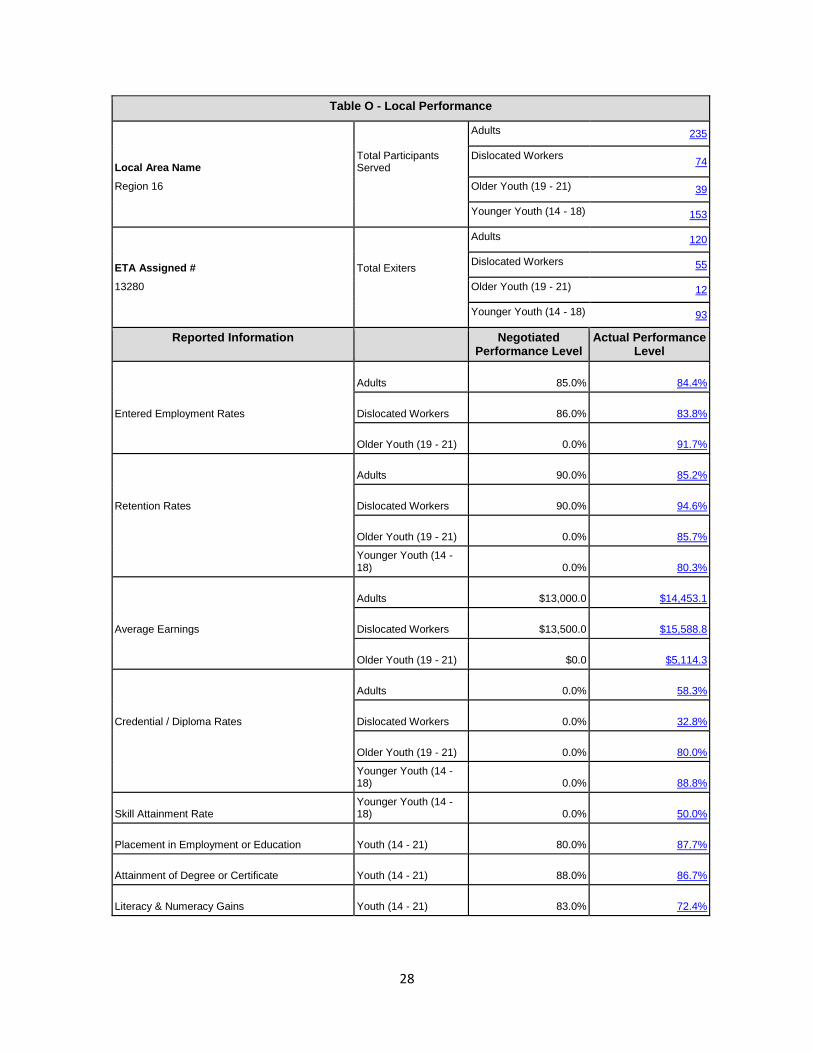
Table O - Local Performance
Adults 235
Local Area Name Total Participants Served
Dislocated Workers 74
Region 16 Older Youth (19 - 21) 39
Younger Youth (14 - 18) 153
Adults 120
ETA Assigned # Total Exiters Dislocated Workers 55
13280 Older Youth (19 - 21) 12
Younger Youth (14 - 18) 93
Reported Information Negotiated Performance Level
Actual Performance Level
Adults
85.0%
84.4%
Entered Employment Rates Dislocated Workers
86.0%
83.8%
Older Youth (19 - 21)
0.0%
91.7%
Adults
90.0%
85.2%
Retention Rates Dislocated Workers
90.0%
94.6%
Older Youth (19 - 21)
0.0%
85.7%
Younger Youth (14 - 18)
0.0%
80.3%
Adults
$13,000.0
$14,453.1
Average Earnings Dislocated Workers
$13,500.0
$15,588.8
Older Youth (19 - 21)
$0.0
$5,114.3
Adults
0.0%
58.3%
Credential / Diploma Rates Dislocated Workers
0.0%
32.8%
Older Youth (19 - 21)
0.0%
80.0%
Younger Youth (14 - 18)
0.0%
88.8%
Skill Attainment Rate Younger Youth (14 - 18)
0.0%
50.0%
Placement in Employment or Education Youth (14 - 21)
80.0%
87.7%
Attainment of Degree or Certificate Youth (14 - 21)
88.0%
86.7%
Literacy & Numeracy Gains Youth (14 - 21)
83.0%
72.4%

29
Table O - Local Performance
Adults 454
Local Area Name Total Participants Served
Dislocated Workers 140
Region 17 Older Youth (19 - 21) 47
Younger Youth (14 - 18) 277
Adults 105
ETA Assigned # Total Exiters Dislocated Workers 46
13075 Older Youth (19 - 21) 22
Younger Youth (14 - 18) 57
Reported Information Negotiated Performance Level
Actual Performance Level
Adults
70.0%
93.2%
Entered Employment Rates Dislocated Workers
76.0%
95.1%
Older Youth (19 - 21)
0.0%
64.7%
Adults
88.0%
95.9%
Retention Rates Dislocated Workers
91.0%
94.4%
Older Youth (19 - 21)
0.0%
94.1%
Younger Youth (14 - 18)
0.0%
61.6%
Adults
$13,500.0
$13,783.4
Average Earnings Dislocated Workers
$15,500.0
$15,036.8
Older Youth (19 - 21)
$0.0
$4,918.8
Adults
0.0%
82.8%
Credential / Diploma Rates Dislocated Workers
0.0%
77.5%
Older Youth (19 - 21)
0.0%
55.6%
Younger Youth (14 - 18)
0.0%
77.8%
Skill Attainment Rate Younger Youth (14 - 18)
0.0%
75.4%
Placement in Employment or Education Youth (14 - 21)
55.0%
72.5%
Attainment of Degree or Certificate Youth (14 - 21)
78.0%
70.4%
Literacy & Numeracy Gains Youth (14 - 21)
65.0%
77.5%

30
Table O - Local Performance
Adults 577
Local Area Name Total Participants Served Dislocated Workers
71
Region 18 Older Youth (19 - 21) 210
Younger Youth (14 - 18) 316
Adults 215
ETA Assigned # Total Exiters Dislocated Workers 31
13300 Older Youth (19 - 21) 68
Younger Youth (14 - 18) 88
Reported Information Negotiated Performance Level
Actual Performance Level
Adults
87.0%
89.5%
Entered Employment Rates Dislocated Workers
90.0%
95.5%
Older Youth (19 - 21)
0.0%
66.1%
Adults
90.0%
94.8%
Retention Rates Dislocated Workers
94.0%
96.4%
Older Youth (19 - 21)
0.0%
94.0%
Younger Youth (14 - 18)
0.0%
65.7%
Adults
$12,500.0
$15,430.2
Average Earnings Dislocated Workers
$14,000.0
$14,087.5
Older Youth (19 - 21)
$0.0
$7,909.2
Adults
0.0%
83.3%
Credential / Diploma Rates Dislocated Workers
0.0%
84.1%
Older Youth (19 - 21)
0.0%
63.5%
Younger Youth (14 - 18)
0.0%
83.1%
Skill Attainment Rate Younger Youth (14 - 18)
0.0%
25.0%
Placement in Employment or Education Youth (14 - 21)
70.0%
70.3%
Attainment of Degree or Certificate Youth (14 - 21)
68.0%
60.2%
Literacy & Numeracy Gains Youth (14 - 21)
35.0%
29.2%
31
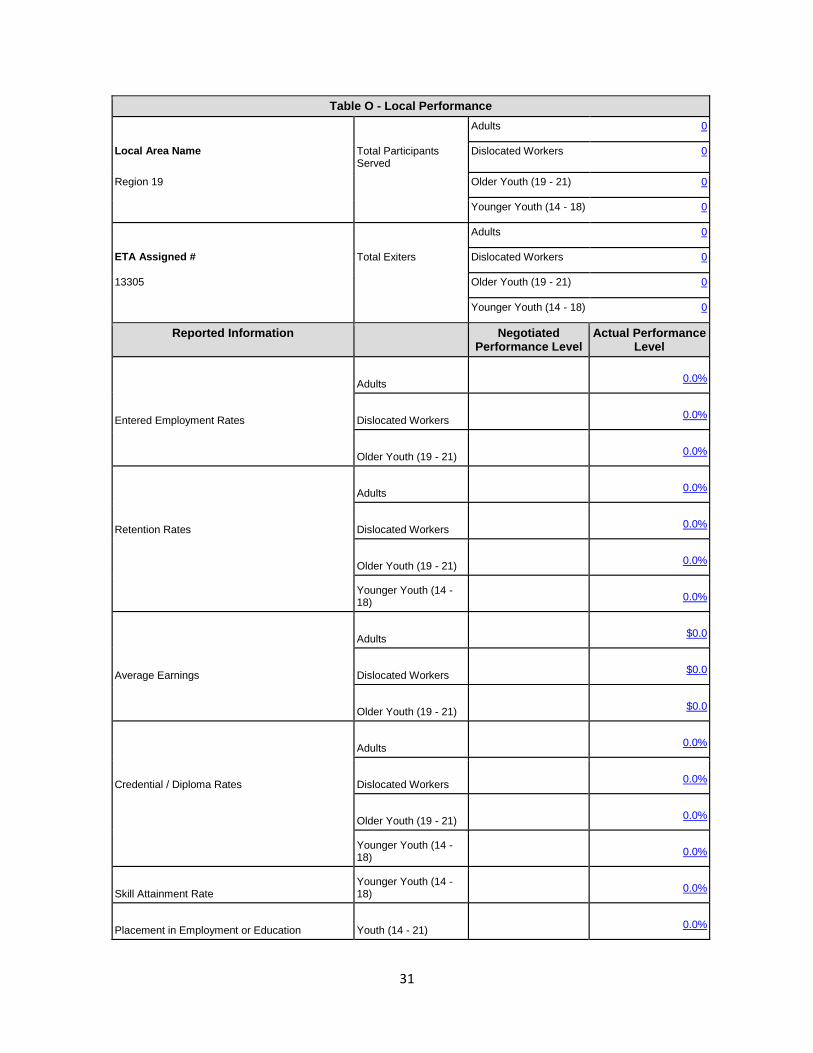
Table O - Local Performance
Adults 0
Local Area Name Total Participants Served
Dislocated Workers 0
Region 19 Older Youth (19 - 21) 0
Younger Youth (14 - 18) 0
Adults 0
ETA Assigned # Total Exiters Dislocated Workers 0
13305 Older Youth (19 - 21) 0
Younger Youth (14 - 18) 0
Reported Information Negotiated Performance Level
Actual Performance Level
Adults
0.0%
Entered Employment Rates Dislocated Workers
0.0%
Older Youth (19 - 21)
0.0%
Adults
0.0%
Retention Rates Dislocated Workers
0.0%
Older Youth (19 - 21)
0.0%
Younger Youth (14 - 18)
0.0%
Adults
$0.0
Average Earnings Dislocated Workers
$0.0
Older Youth (19 - 21)
$0.0
Adults
0.0%
Credential / Diploma Rates Dislocated Workers
0.0%
Older Youth (19 - 21)
0.0%
Younger Youth (14 - 18)
0.0%
Skill Attainment Rate Younger Youth (14 - 18)
0.0%
Placement in Employment or Education Youth (14 - 21)
0.0%

32
Attainment of Degree or Certificate Youth (14 - 21)
0.0%
Literacy & Numeracy Gains Youth (14 - 21)
0.0%

33
Table O - Local Performance
Adults
478
Local Area Name Total Participants Served Dislocated Workers
110
Region 2 Older Youth (19 - 21)
67
Younger Youth (14 - 18)
228
Adults
171
ETA Assigned # Total Exiters Dislocated Workers 59
13050 Older Youth (19 - 21)
23
Younger Youth (14 - 18)
89
Reported Information Negotiated Performance Level
Actual Performance Level
Adults 79.0% 82.6%
Entered Employment Rates Dislocated Workers 88.0% 86.2%
Older Youth (19 - 21) 0.0% 76.0%
Adults 86.0% 90.4%
Retention Rates Dislocated Workers 90.0% 91.3%
Older Youth (19 - 21) 0.0% 100.0%
Younger Youth (14 - 18)
0.0% 88.9%
Adults $13,300.0 $15,610.1
Average Earnings Dislocated Workers $15,800.0 $15,682.4
Older Youth (19 - 21) $0.0 $8,468.0
Adults 0.0% 70.7%
Credential / Diploma Rates Dislocated Workers 0.0% 70.8%
Older Youth (19 - 21) 0.0% 42.9%
Younger Youth (14 - 18)
0.0% 76.4%
Skill Attainment Rate Younger Youth (14 - 18)
0.0%
38.7%
Placement in Employment or Education Youth (14 - 21)
75.0%
72.7%
Attainment of Degree or Certificate Youth (14 - 21)
65.0%
61.8%
Literacy & Numeracy Gains Youth (14 - 21)
40.0%
58.8%

34
Table O - Local Performance
Adults 242
Local Area Name Total Participants Served Dislocated Workers
95
Region 20 Older Youth (19 - 21) 248
Younger Youth (14 - 18) 447
Adults 171
ETA Assigned # Total Exiters Dislocated Workers 27
13270 Older Youth (19 - 21) 71
Younger Youth (14 - 18) 182
Reported Information Negotiated Performance Level
Actual Performance Level
Adults
76.0%
84.2%
Entered Employment Rates Dislocated Workers
78.0%
90.9%
Older Youth (19 - 21)
0.0%
66.0%
Adults
90.0%
94.0%
Retention Rates Dislocated Workers
92.0%
95.3%
Older Youth (19 - 21)
0.0%
74.3%
Younger Youth (14 - 18)
0.0%
74.2%
Adults
$15,500.0
$17,917.9
Average Earnings Dislocated Workers
$15,500.0
$19,676.4
Older Youth (19 - 21)
$0.0
$4,039.2
Adults
0.0%
66.9%
Credential / Diploma Rates Dislocated Workers
0.0%
52.9%
Older Youth (19 - 21)
0.0%
32.0%
Younger Youth (14 - 18)
0.0%
74.4%
Skill Attainment Rate Younger Youth (14 - 18)
0.0%
59.3%
Placement in Employment or Education Youth (14 - 21)
62.0%
63.8%
Attainment of Degree or Certificate Youth (14 - 21)
72.0%
63.1%
Literacy & Numeracy Gains Youth (14 - 21)
39.0%
17.9%

35
Table O - Local Performance
Adults 1,063
Local Area Name Total Participants Served Dislocated Workers
95
Region 3 Older Youth (19 - 21) 169
Younger Youth (14 - 18) 507
Adults 556
ETA Assigned # Total Exiters Dislocated Workers 42
13235 Older Youth (19 - 21) 73
Younger Youth (14 - 18) 352
Reported Information Negotiated Performance Level
Actual Performance Level
Adults
75.0%
70.6%
Entered Employment Rates Dislocated Workers
78.5%
65.7%
Older Youth (19 - 21)
0.0%
62.0%
Adults
86.0%
80.0%
Retention Rates Dislocated Workers
93.0%
90.6%
Older Youth (19 - 21)
0.0%
73.9%
Younger Youth (14 - 18)
0.0%
70.0%
Adults
$12,500.0
$11,427.0
Average Earnings Dislocated Workers
$16,500.0
$16,452.8
Older Youth (19 - 21)
$0.0
$4,208.8
Adults
0.0%
32.6%
Credential / Diploma Rates Dislocated Workers
0.0%
26.9%
Older Youth (19 - 21)
0.0%
10.5%
Younger Youth (14 - 18)
0.0%
64.3%
Skill Attainment Rate Younger Youth (14 - 18)
0.0%
0.0%
Placement in Employment or Education Youth (14 - 21)
72.0%
65.0%
Attainment of Degree or Certificate Youth (14 - 21)
75.0%
49.5%
Literacy & Numeracy Gains Youth (14 - 21)
35.0%
2.8%

36
Table O - Local Performance
Adults 463
Local Area Name Total Participants Served Dislocated Workers
206
Region 4 Older Youth (19 - 21) 184
Younger Youth (14 - 18) 257
Adults 213
ETA Assigned # Total Exiters Dislocated Workers 99
13245 Older Youth (19 - 21) 106
Younger Youth (14 - 18) 154
Reported Information Negotiated Performance Level
Actual Performance Level
Adults
74.5%
74.0%
Entered Employment Rates Dislocated Workers
79.0%
84.8%
Older Youth (19 - 21)
0.0%
70.7%
Adults
85.5%
81.8%
Retention Rates Dislocated Workers
92.0%
93.8%
Older Youth (19 - 21)
0.0%
91.5%
Younger Youth (14 - 18)
0.0%
62.7%
Adults
$13,050.0
$11,326.5
Average Earnings Dislocated Workers
$21,000.0
$26,944.5
Older Youth (19 - 21)
$0.0
$4,291.9
Adults
0.0%
68.9%
Credential / Diploma Rates Dislocated Workers
0.0%
79.5%
Older Youth (19 - 21)
0.0%
29.6%
Younger Youth (14 - 18)
0.0%
78.7%
Skill Attainment Rate Younger Youth (14 - 18)
0.0%
38.1%
Placement in Employment or Education Youth (14 - 21)
66.0%
65.3%
Attainment of Degree or Certificate Youth (14 - 21)
62.0%
70.5%
Literacy & Numeracy Gains Youth (14 - 21)
56.0%
42.6%

37
Table O - Local Performance
Adults 1,067
Local Area Name Total Participants Served Dislocated Workers
246
Region 5 Older Youth (19 - 21) 65
Younger Youth (14 - 18) 337
Adults 451
ETA Assigned # Total Exiters Dislocated Workers 123
13240 Older Youth (19 - 21) 10
Younger Youth (14 - 18) 104
Reported Information Negotiated Performance Level
Actual Performance Level
Adults
83.0%
76.2%
Entered Employment Rates Dislocated Workers
80.0%
71.7%
Older Youth (19 - 21)
0.0%
76.5%
Adults
88.0%
88.9%
Retention Rates Dislocated Workers
91.0%
93.8%
Older Youth (19 - 21)
0.0%
86.7%
Younger Youth (14 - 18)
0.0%
73.8%
Adults
$15,000.0
$14,142.9
Average Earnings Dislocated Workers
$21,000.0
$19,281.9
Older Youth (19 - 21)
$0.0
$6,319.8
Adults
0.0%
42.2%
Credential / Diploma Rates Dislocated Workers
0.0%
57.1%
Older Youth (19 - 21)
0.0%
46.2%
Younger Youth (14 - 18)
0.0%
86.2%
Skill Attainment Rate Younger Youth (14 - 18)
0.0%
66.7%
Placement in Employment or Education Youth (14 - 21)
75.0%
79.5%
Attainment of Degree or Certificate Youth (14 - 21)
59.0%
65.4%
Literacy & Numeracy Gains Youth (14 - 21)
20.0%
38.1%

38
Table O - Local Performance
Adults 266
Local Area Name Total Participants Served Dislocated Workers
196
Region 6 Older Youth (19 - 21) 115
Younger Youth (14 - 18) 253
Adults 66
ETA Assigned # Total Exiters Dislocated Workers 38
13250 Older Youth (19 - 21) 34
Younger Youth (14 - 18) 70
Reported Information Negotiated Performance Level
Actual Performance Level
Adults
71.0%
71.5%
Entered Employment Rates Dislocated Workers
77.0%
79.0%
Older Youth (19 - 21)
0.0%
72.5%
Adults
87.0%
78.0%
Retention Rates Dislocated Workers
92.0%
90.1%
Older Youth (19 - 21)
0.0%
84.4%
Younger Youth (14 - 18)
0.0%
67.9%
Adults
$14,000.0
$12,354.2
Average Earnings Dislocated Workers
$22,000.0
$19,355.1
Older Youth (19 - 21)
$0.0
$4,201.4
Adults
0.0%
46.5%
Credential / Diploma Rates Dislocated Workers
0.0%
55.8%
Older Youth (19 - 21)
0.0%
14.0%
Younger Youth (14 - 18)
0.0%
56.1%
Skill Attainment Rate Younger Youth (14 - 18)
0.0%
4.3%
Placement in Employment or Education Youth (14 - 21)
65.0%
61.9%
Attainment of Degree or Certificate Youth (14 - 21)
58.0%
34.9%
Literacy & Numeracy Gains Youth (14 - 21)
45.0%
55.7%

39
Table O - Local Performance
Adults 1,201
Local Area Name Total Participants Served Dislocated Workers
743
Region 7 Older Youth (19 - 21) 361
Younger Youth (14 - 18) 796
Adults 396
ETA Assigned # Total Exiters Dislocated Workers 297
13255 Older Youth (19 - 21) 128
Younger Youth (14 - 18) 285
Reported Information Negotiated Performance Level
Actual Performance Level
Adults
81.0%
83.3%
Entered Employment Rates Dislocated Workers
86.0%
92.1%
Older Youth (19 - 21)
0.0%
68.3%
Adults
86.0%
91.9%
Retention Rates Dislocated Workers
91.0%
93.7%
Older Youth (19 - 21)
0.0%
85.3%
Younger Youth (14 - 18)
0.0%
68.9%
Adults
$13,200.0
$14,896.7
Average Earnings Dislocated Workers
$20,500.0
$19,333.8
Older Youth (19 - 21)
$0.0
$4,603.8
Adults
0.0%
61.5%
Credential / Diploma Rates Dislocated Workers
0.0%
68.2%
Older Youth (19 - 21)
0.0%
44.8%
Younger Youth (14 - 18)
0.0%
80.9%
Skill Attainment Rate Younger Youth (14 - 18)
0.0%
56.1%
Placement in Employment or Education Youth (14 - 21)
66.0%
70.2%
Attainment of Degree or Certificate Youth (14 - 21)
76.0%
71.2%
Literacy & Numeracy Gains Youth (14 - 21)
42.0%
36.2%
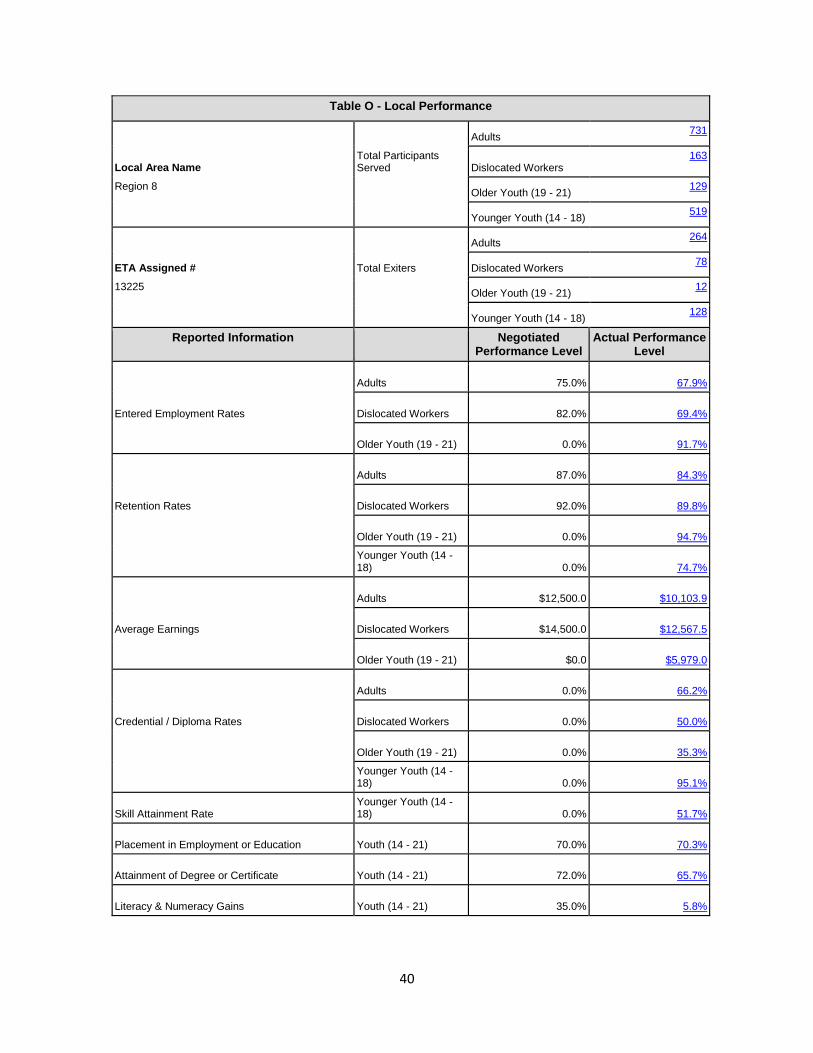
40
Table O - Local Performance
Adults 731
Local Area Name Total Participants Served Dislocated Workers
163
Region 8 Older Youth (19 - 21) 129
Younger Youth (14 - 18) 519
Adults 264
ETA Assigned # Total Exiters Dislocated Workers 78
13225 Older Youth (19 - 21) 12
Younger Youth (14 - 18) 128
Reported Information Negotiated Performance Level
Actual Performance Level
Adults
75.0%
67.9%
Entered Employment Rates Dislocated Workers
82.0%
69.4%
Older Youth (19 - 21)
0.0%
91.7%
Adults
87.0%
84.3%
Retention Rates Dislocated Workers
92.0%
89.8%
Older Youth (19 - 21)
0.0%
94.7%
Younger Youth (14 - 18)
0.0%
74.7%
Adults
$12,500.0
$10,103.9
Average Earnings Dislocated Workers
$14,500.0
$12,567.5
Older Youth (19 - 21)
$0.0
$5,979.0
Adults
0.0%
66.2%
Credential / Diploma Rates Dislocated Workers
0.0%
50.0%
Older Youth (19 - 21)
0.0%
35.3%
Younger Youth (14 - 18)
0.0%
95.1%
Skill Attainment Rate Younger Youth (14 - 18)
0.0%
51.7%
Placement in Employment or Education Youth (14 - 21)
70.0%
70.3%
Attainment of Degree or Certificate Youth (14 - 21)
72.0%
65.7%
Literacy & Numeracy Gains Youth (14 - 21)
35.0%
5.8%

41
Table O - Local Performance
Adults 738
Local Area Name Total Participants Served Dislocated Workers
142
Region 9 Older Youth (19 - 21) 83
Younger Youth (14 - 18) 259
Adults 413
ETA Assigned # Total Exiters Dislocated Workers 85
13275 Older Youth (19 - 21) 52
Younger Youth (14 - 18) 116
Reported Information Negotiated Performance Level
Actual Performance Level
Adults
79.0%
85.8%
Entered Employment Rates Dislocated Workers
82.0%
86.1%
Older Youth (19 - 21)
0.0%
81.3%
Adults
87.0%
89.7%
Retention Rates Dislocated Workers
91.0%
88.2%
Older Youth (19 - 21)
0.0%
96.3%
Younger Youth (14 - 18)
0.0%
84.1%
Adults
$13,200.0
$14,289.7
Average Earnings Dislocated Workers
$13,500.0
$14,688.3
Older Youth (19 - 21)
$0.0
$3,445.6
Adults
0.0%
56.0%
Credential / Diploma Rates Dislocated Workers
0.0%
67.3%
Older Youth (19 - 21)
0.0%
69.4%
Younger Youth (14 - 18)
0.0%
87.3%
Skill Attainment Rate Younger Youth (14 - 18)
0.0%
0.0%
Placement in Employment or Education Youth (14 - 21)
77.0%
85.7%
Attainment of Degree or Certificate Youth (14 - 21)
86.0%
87.1%
Literacy & Numeracy Gains Youth (14 - 21)
72.0%
77.5%

42
Table P - Veteran Priority of Service
Reported Information Total Percent Served
Covered Entrants Who Reached the End of the Entry Period
303
Covered Entrants Who Received a Service During the Entry Period
280
92.4%
Covered Entrants Who Received a Staff-Assisted Service During the Entry Period
280
92.4%
Table Q - Veteran' s Outcomes by Special Populations
Reported Information Post 9/11 Era Veterans Post 9/11 Era Veterans who Received at least
Intensive Services
TAP Workshop Veterans
Entered Employment Rate
86.0%
92
85.1%
86
80.0%
8
107
101
10
Employment Retention Rate
84.3%
91
84.3%
86
80.0%
4
108
102
5
Average Earnings
$15,545.9
$1,305,859
$15,470.3
$1,222,152
$16,736.7
$66,947
84
79
4
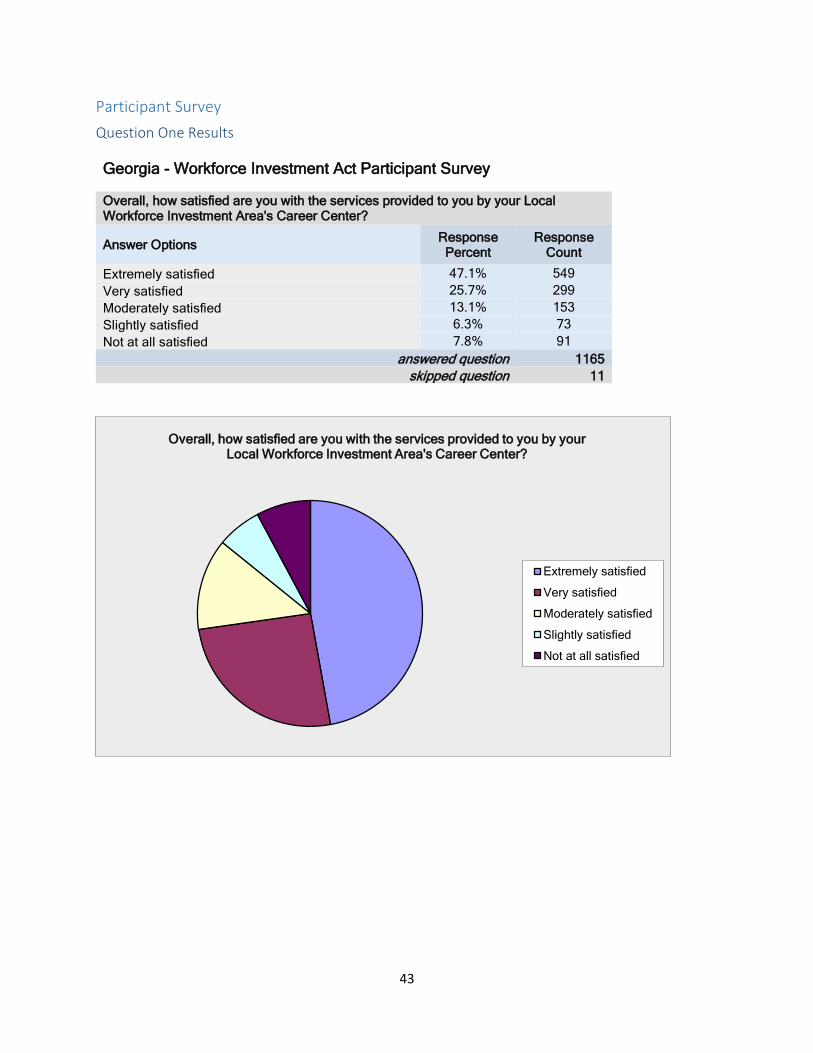
43
Participant Survey
Question One Results
Georgia - Workforce Investment Act Participant Survey
Overall, how satisfied are you with the services provided to you by your Local Workforce Investment Area's Career Center?
Answer Options Response Percent
Response Count
Extremely satisfied 47.1% 549
Very satisfied 25.7% 299
Moderately satisfied 13.1% 153
Slightly satisfied 6.3% 73
Not at all satisfied 7.8% 91
answered question 1165
skipped question 11
Overall, how satisfied are you with the services provided to you by your Local Workforce Investment Area's Career Center?
Extremely satisfied
Very satisfied
Moderately satisfied
Slightly satisfied
Not at all satisfied
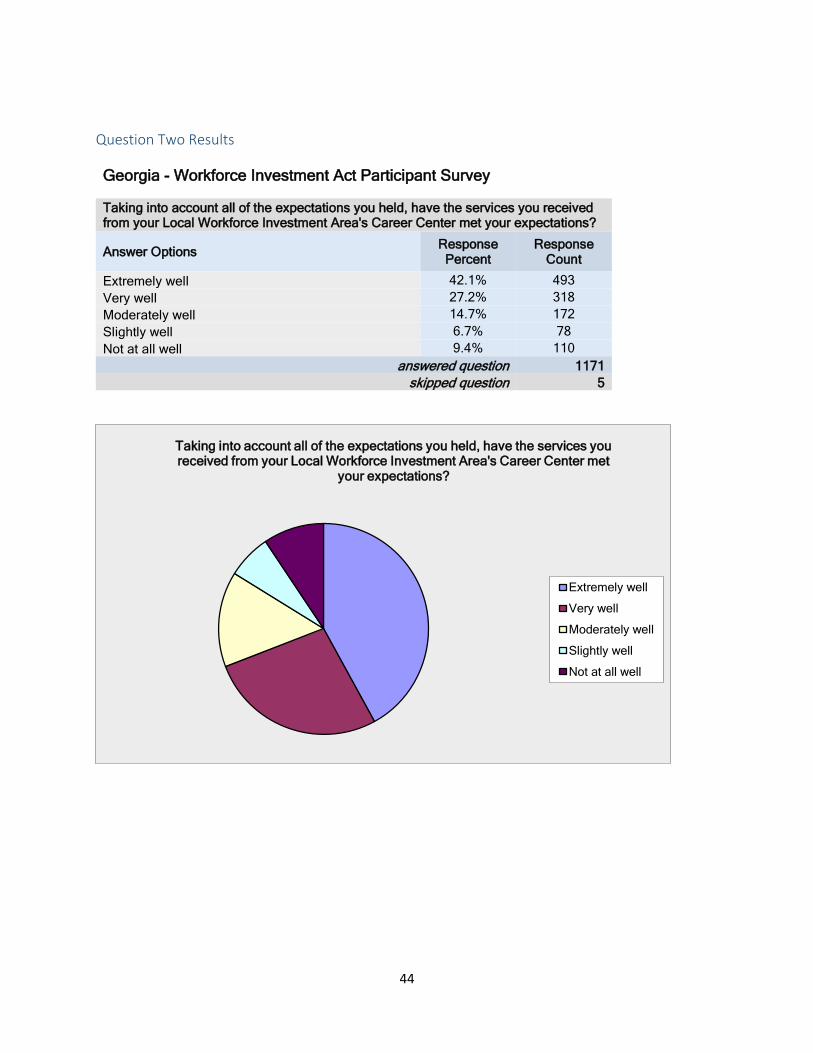
44
Question Two Results
Georgia - Workforce Investment Act Participant Survey
Taking into account all of the expectations you held, have the services you received from your Local Workforce Investment Area's Career Center met your expectations?
Answer Options Response Percent
Response Count
Extremely well 42.1% 493
Very well 27.2% 318
Moderately well 14.7% 172
Slightly well 6.7% 78
Not at all well 9.4% 110
answered question 1171
skipped question 5
Taking into account all of the expectations you held, have the services you received from your Local Workforce Investment Area's Career Center met
your expectations?
Extremely well
Very well
Moderately well
Slightly well
Not at all well
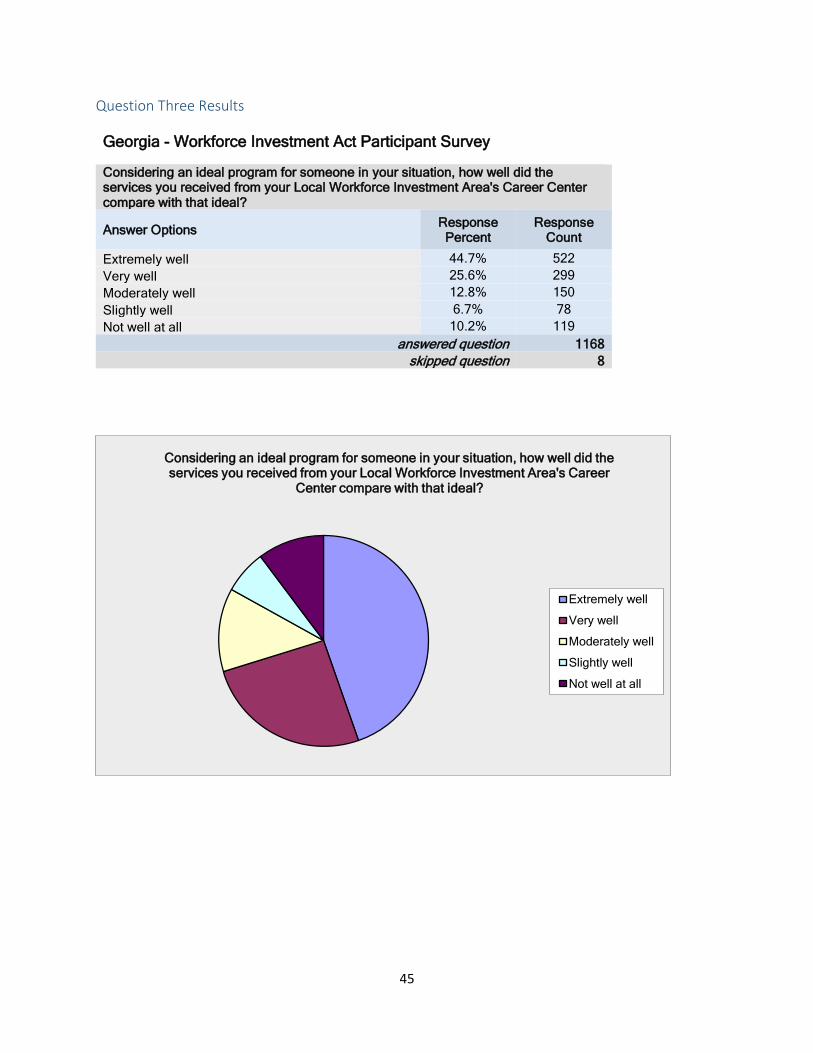
45
Question Three Results
Georgia - Workforce Investment Act Participant Survey
Considering an ideal program for someone in your situation, how well did the services you received from your Local Workforce Investment Area's Career Center compare with that ideal?
Answer Options Response Percent
Response Count
Extremely well 44.7% 522
Very well 25.6% 299
Moderately well 12.8% 150
Slightly well 6.7% 78
Not well at all 10.2% 119
answered question 1168
skipped question 8
Considering an ideal program for someone in your situation, how well did the services you received from your Local Workforce Investment Area's Career
Center compare with that ideal?
Extremely well
Very well
Moderately well
Slightly well
Not well at all
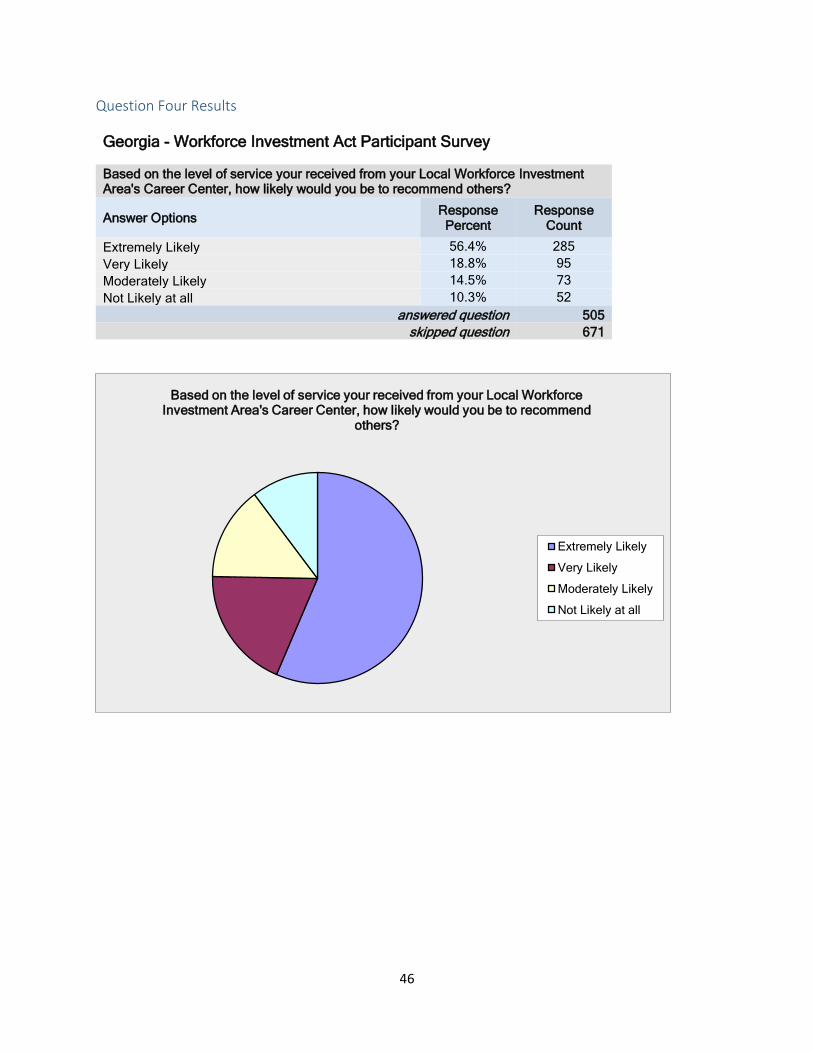
46
Question Four Results
Georgia - Workforce Investment Act Participant Survey
Based on the level of service your received from your Local Workforce Investment Area's Career Center, how likely would you be to recommend others?
Answer Options Response Percent
Response Count
Extremely Likely 56.4% 285
Very Likely 18.8% 95
Moderately Likely 14.5% 73
Not Likely at all 10.3% 52
answered question 505
skipped question 671
Based on the level of service your received from your Local Workforce Investment Area's Career Center, how likely would you be to recommend
others?
Extremely Likely
Very Likely
Moderately Likely
Not Likely at all

47
Question Five Results
Georgia - Workforce Investment Act Participant Survey
Overall, how would you rate your total experience from your Local Workforce Investment Area's Career Center?
Answer Options Response Percent
Response Count
Excellent 50.3% 254
Very good 22.6% 114
Fairly good 11.5% 58
Mildly good 6.3% 32
Not good at all 9.3% 47
answered question 505
skipped question 671
Overall, how would you rate your total experience from your Local Workforce Investment Area's Career Center?
Excellent
Very good
Fairly good
Mildly good
Not good at all