Embed Size (px)
Citation preview

THE STATE OF GEORGETOWN 2016

C2 THE STATE OF GEORGETOWN 2016 REPORT
This report is a product of the staff of the Georgetown
Business Improvement District (BID). The judgments
herein do not necessarily reflect the views of the BID’s
Board of Directors or the members they represent.
Data for the State of Georgetown 2016 cover the
period January 1, 2015 to December 31, 2015, and
Q1 2016 where noted. The BID welcomes comments
and suggestions to improve this report and make
it more useful to readers. Please direct comments
to Jamie Scott, economic development manager,
about this reportcontents
3 Letter from the BID
4 Highlights and Trends
8 Resident Demographics
12 Visitor Profile and Spending
18 Retail and Restaurants
26 Office Market and Employees
34 Hotels
40 Transportation
Copyright © 2016 by the Georgetown Business Improvement District

RO
CK
CR
EE
K P
AR
KW
AY
RO
CK
CR
EE
K P
AR
KW
AY
N ST
N ST
DUMBARTON ST
O ST
O ST
P ST
P ST
VOLTA ST
Q ST
CAMBRIDGE PL
DENT PL
R ST
Q ST
R ST
DENT PL
RESERVOIR RD
PROSPECT ST
M ST
M ST
CADY’S ALLEY
WHITEHURST FWY
FR
AN
CIS
SC
OT
T K
EY
BR
IDG
E
BLUES ALLEY
WIS
CO
NSIN
AV
E
TH
OM
AS
JE
FF
ER
SO
N S
T
34
TH
ST
37
TH
ST
33
RD
ST
PO
TO
MA
C S
T
BA
NK
ST
31S
T S
T
30
TH
ST
29
TH
ST
28
TH
ST
27
TH
ST
32N
D S
T
35
TH
ST
36
TH
ST
WIS
CO
NSIN
AV
E
GEORGETOWN WATERFRONT PARK
C&O CANAL
K ST
POTOMAC RIVER
PO
TO
MA
C S
T
GRACE ST
PENNSYLVANIA AVE
PENNSYLVANIA AVE
WASHINGTON HARBOUR
The Georgetown BID Area
Source: Georgetown BID and data.octo.dc.gov THE STATE OF GEORGETOWN 2016 REPORT 1
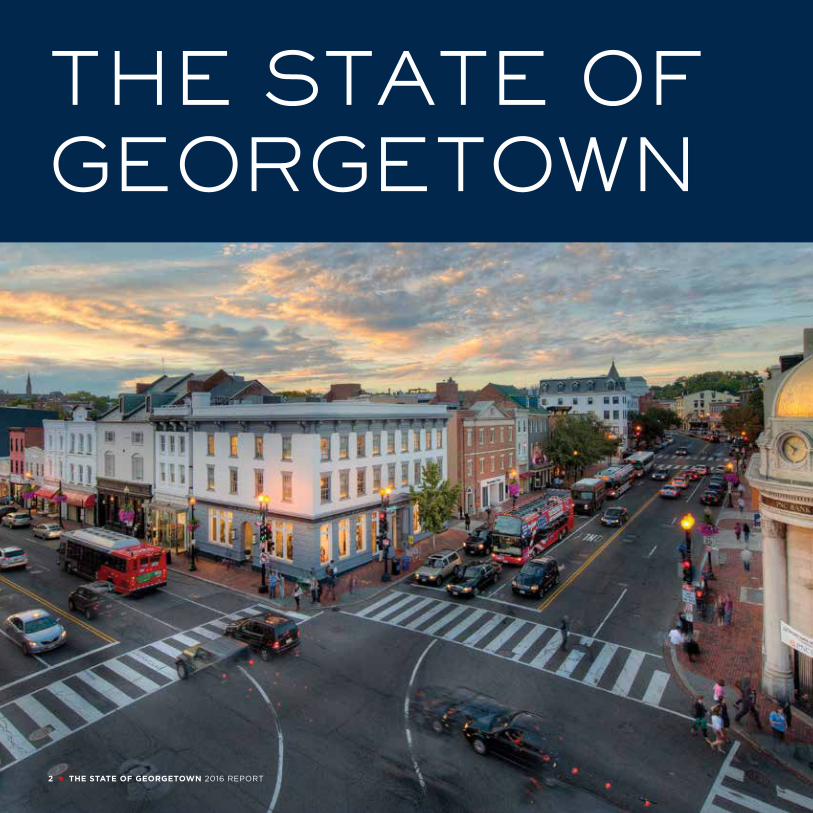
THE STATE OF GEORGETOWN
2 THE STATE OF GEORGETOWN 2016 REPORT

THE STATE OF GEORGETOWN 2016 REPORT 3
LETTER FROM THE GEORGETOWN BID
Each year the Georgetown BID produces this State of Georgetown report to provide data and
analysis on key features of the Georgetown economy. We intend this report to be a resource for
BID members, brokers, community and government partners, and other audiences interested
in doing business in Georgetown. The State of Georgetown is an opportunity to analyze Georgetown’s
past performance and to consider its future in the city and regional economies.
Reflecting on the past year, we have many reasons to be optimistic about Georgetown’s future. After
years of high office vacancy, Georgetown was the strongest performing office submarket in the region
in 2015. The retail economy also showed strength as many new retailers opened in Georgetown or signed
leases to open in 2016. Visitors continued to shop, dine, and stay in Georgetown at strong levels, and the
commercial district remained a significant contributor to the District’s job and tax base.
But Georgetown is not immune to the dynamics of a changing city and economy, and as it has over the
course of its 265-year history, Georgetown must adapt. Georgetown merchants are competing in an
increasingly crowded marketplace, both online and across the region. Georgetown office buildings are
competing for tenants with submarkets that are awash in excess space—primarily in the suburbs. While
every established commercial district in the region has lost retail market share as new neighborhood
commercial districts emerge, population growth and spending patterns trending towards experiential
dining and shopping have kept sales strong. The BID, in collaboration with our members, residents,
and institutional and government partners, is working to ensure that we create and maintain a special
place that attracts both tenants and customers in the face of growing competition.
Earlier this year, we published a two-year update on Georgetown 2028, the 15-year action plan for
Georgetown. That plan continues to drive the BID’s agenda to preserve what’s great, fix what’s broken,
and create what’s missing to support a stronger and more sustainable commercial district. Through
interventions large and small we are working to make it easier to get to Georgetown and to create
a better experience for people once they’re here. This annual economic development report serves
as a complementary tool to understand Georgetown market performance year over year. We invite you
to read this report and additional resources, including the Georgetown 2028 two-year update report,
on our website, georgetowndc.com.
Joe Sternlieb
Georgetown BID CEO
Jamie Scott
Economic Development Manager

HIGHLIGHTS AND TRENDS
4 THE STATE OF GEORGETOWN 2016 REPORT

THE STATE OF GEORGETOWN 2016 REPORT 5
During calendar year 2015, Georgetown thrived as a vibrant
commercial district and continued to be a desirable place to work,
shop, and visit.
• Georgetown was the highest performing office submarket in the region in 2015,
with vacancy rates at 5.9%, due in part to average rental rates 16% lower than the
central business district.
• Retailer interest remained high. Georgetown saw online retailers opening brick-
and-mortar locations, including Birchbox and Warby Parker, and national brands
opening region-exclusive locations, including Sid Mashburn/Ann Mashburn.
• Retail vacancy increased in 2015, but many building owners began renovating
their spaces to bring in new retail tenants in 2016.
• Rising rents on M Street hastened the conversion of restaurants to retail, but new,
local restaurants opened on the side streets south of M Street, where rents are
lower, with more coming in 2016.
• The Georgetown BID, together with Advisory Neighborhood Commission (ANC)
2E and the Citizens Association of Georgetown (CAG), reached consensus on
ending the Georgetown liquor license cap and moratorium. (The ABC announced
the 27-year old moratorium would end on April 9th, 2016, just as this report was
going to press).
• Hotel performance was on par with 2014 performance, which saw rebounds over
the previous year in occupancy, and gains in revenue per available room and
total revenue.
6 THE STATE OF GEORGETOWN 2016 REPORT
ACCESS TO GEORGETOWN
Access is a critical element of the experience of working
in or visiting Georgetown. Improving access has the potential
to further strengthen Georgetown’s office, retail, and hotel
markets. To achieve this, the BID works with local and
regional partners to improve transportation services into and
within Georgetown.
In early 2016, the BID secured the final portion of the funding
for the Georgetown-Rosslyn Gondola feasibility study, to be
released later this year. The BID also installed six bike corrals
in Georgetown, creating capacity for an additional 60 bikes,
and Capital Bikeshare trips to and from Georgetown
increased for the third consecutive year. The H Street Streetcar
opened in February 2016, and the BID continues to advocate
for the extension of that line to Georgetown on dedicated
tracks that ensure a fast, reliable trip. Georgetown remains
an eminently walkable neighborhood, and the BID secured
approval to conduct sidewalk widenings on the 3200 block
of M Street for 30 weekends in 2016, providing more comfort
for pedestrians and shoppers.
The transportation landscape has also vastly changed with
the rise of Uber and other ridesharing services. These services
have, at least anecdotally, provided a seamless transportation
option to many Georgetown visitors, reducing the need
to drive and park. The evolution of ridesharing will continue
to influence the landscape of the Georgetown economy and
the use of public space.
ENHANCING THE GEORGETOWN EXPERIENCE
Consumers, visitors, and businesses continue to seek
authentic places and rich experiences. A healthy mix
of tenants and high quality space remains essential for
a successful commercial district, but experience is
increasingly important.
Employees increasingly want to work in buildings with
unique layouts and in a neighborhood with active outdoor
space, high quality restaurants beyond the typical business
lunch, and nighttime activities after work. For consumers,
particularly millennial consumers, dining is a major form
of entertainment, and they want to eat interesting food in
unique spaces. As more shoppers make internet purchases,
brick-and-mortar retailers can offer personal experiences
that do not exist online. Millennial consumers are also
less brand-loyal, and place value on brand narrative and
authenticity. Visitors staying in Georgetown hotels want
personalized—and local—services and experiences. And as
the District’s population and tourism continue to grow,
residents and visitors alike are seeking outdoor spaces that
provide recreational activities and a respite from the density
of urban life.
The BID continues to work on these items, and to integrate
the employee, consumer, and visitor experience with
Georgetown’s beautiful and historic public spaces.

THE STATE OF GEORGETOWN 2016 REPORT 7
DC RETAIL MARKET TRENDS
The District continued to experience a boom in retail and
restaurants in 2015, evidenced by new openings on 14th
Street, at The Shay and Atlantic Plumbing buildings in Shaw,
and in CityCenter, Union Market, Capitol Riverfront, and
beyond. Georgetown, long the primary neighborhood for
shopping and dining, faces increasing competition from other
neighborhoods. More than 700,000 square feet of retail
delivered across the city in 2015 and another 1.5 million
square feet are under construction for delivery by 2017.1
New neighborhoods have emerged as dining and shopping
destinations, with more to come at the Southwest Waterfront,
Capitol Riverfront, Union Market, Ivy City, and beyond.
Economic shifts are providing new opportunities for local
entrepreneurs offering food, drinks, and products made
in the District. In December 2015 Councilmember Charles
Allen (D-Ward 6) introduced the Made in DC Program
Establishment Act of 2015 to support locally designed and
manufactured products. The success of Union Kitchen, Union
Market, and other local markets, events, and food incubators
demonstrates the potential of this growing sector of the
District’s economy. Georgetown, as a proven commercial
district rich in local history and populated with unique spaces,
is an attractive location for new local businesses looking for
brick-and-mortar locations.
8 THE STATE OF GEORGETOWN 2016 REPORT
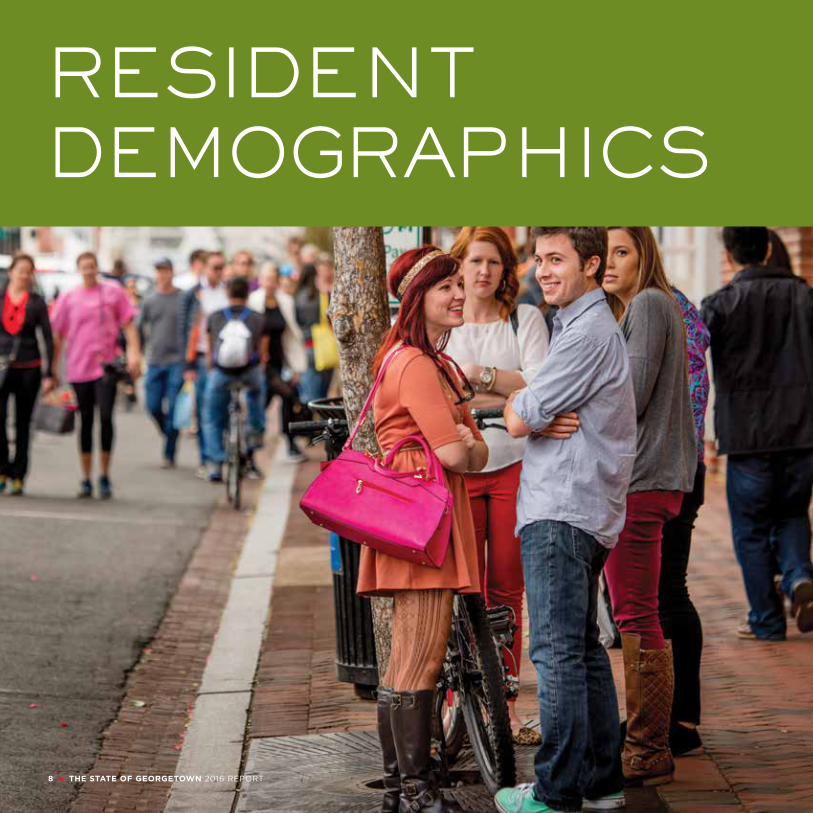
RESIDENTDEMOGRAPHICS
THE STATE OF GEORGETOWN 2016 REPORT 9
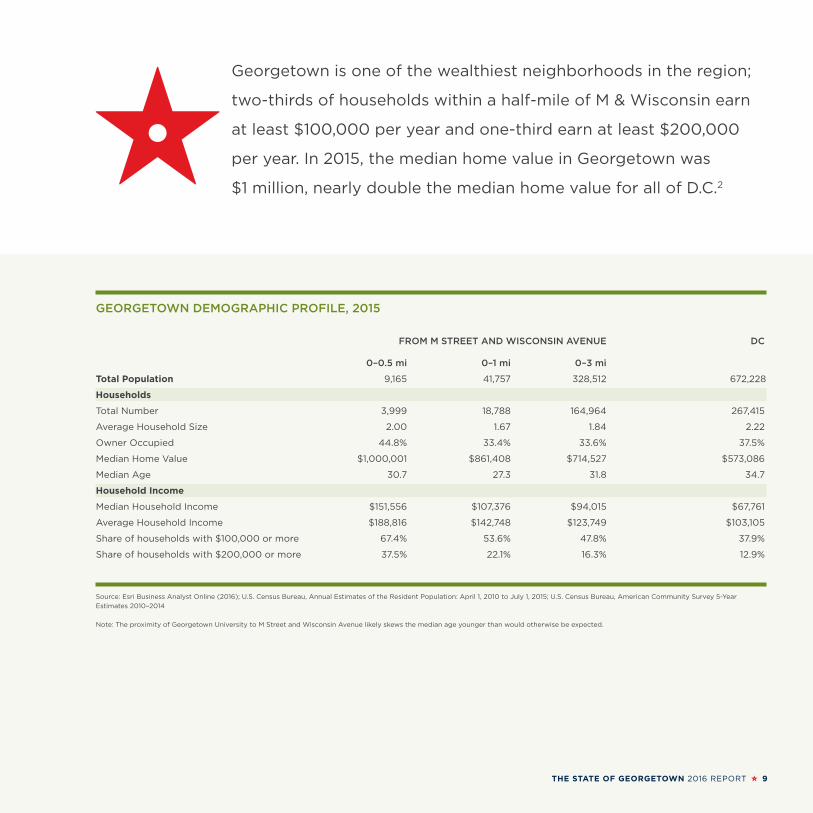
GEORGETOWN DEMOGRAPHIC PROFILE, 2015
FROM M STREET AND WISCONSIN AVENUE DC
0–0.5 mi 0–1 mi 0–3 mi
Total Population 9,165 41,757 328,512 672,228
Households
Total Number 3,999 18,788 164,964 267,415
Average Household Size 2.00 1.67 1.84 2.22
Owner Occupied 44.8% 33.4% 33.6% 37.5%
Median Home Value $1,000,001 $861,408 $714,527 $573,086
Median Age 30.7 27.3 31.8 34.7
Household Income
Median Household Income $151,556 $107,376 $94,015 $67,761
Average Household Income $188,816 $142,748 $123,749 $103,105
Share of households with $100,000 or more 67.4% 53.6% 47.8% 37.9%
Share of households with $200,000 or more 37.5% 22.1% 16.3% 12.9%
Source: Esri Business Analyst Online (2016); U.S. Census Bureau, Annual Estimates of the Resident Population: April 1, 2010 to July 1, 2015; U.S. Census Bureau, American Community Survey 5-Year
Estimates 2010–2014
Note: The proximity of Georgetown University to M Street and Wisconsin Avenue likely skews the median age younger than would otherwise be expected.
Georgetown is one of the wealthiest neighborhoods in the region;
two-thirds of households within a half-mile of M & Wisconsin earn
at least $100,000 per year and one-third earn at least $200,000
per year. In 2015, the median home value in Georgetown was
$1 million, nearly double the median home value for all of D.C.2
10 THE STATE OF GEORGETOWN 2016 REPORT
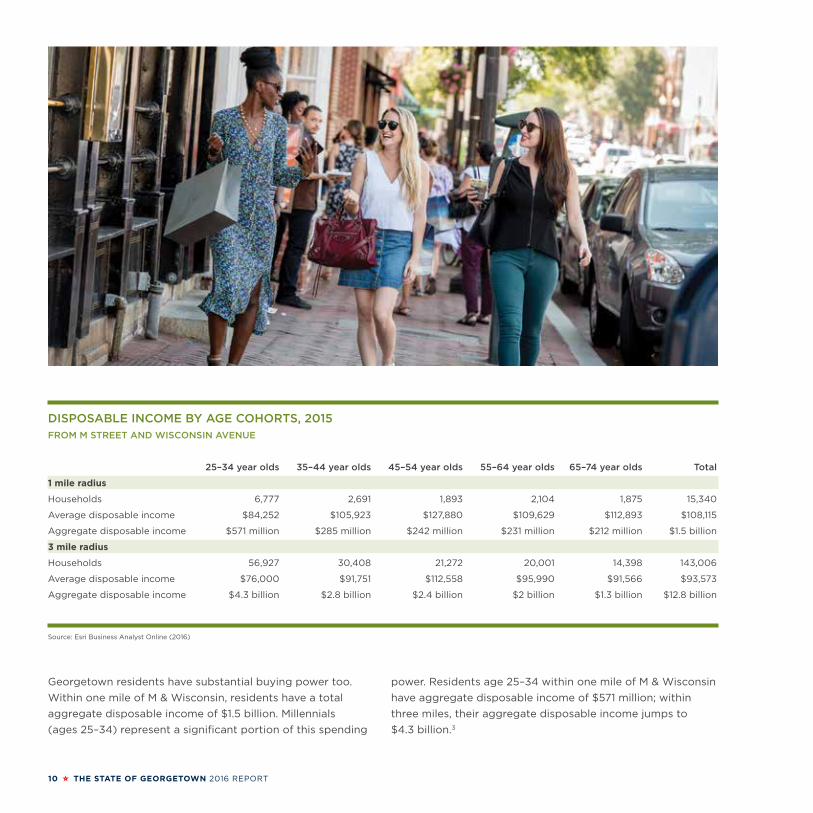
DISPOSABLE INCOME BY AGE COHORTS, 2015 FROM M STREET AND WISCONSIN AVENUE
25–34 year olds 35–44 year olds 45–54 year olds 55–64 year olds 65–74 year olds Total
1 mile radius
Households 6,777 2,691 1,893 2,104 1,875 15,340
Average disposable income $84,252 $105,923 $127,880 $109,629 $112,893 $108,115
Aggregate disposable income $571 million $285 million $242 million $231 million $212 million $1.5 billion
3 mile radius
Households 56,927 30,408 21,272 20,001 14,398 143,006
Average disposable income $76,000 $91,751 $112,558 $95,990 $91,566 $93,573
Aggregate disposable income $4.3 billion $2.8 billion $2.4 billion $2 billion $1.3 billion $12.8 billion
Source: Esri Business Analyst Online (2016)
Georgetown residents have substantial buying power too.
Within one mile of M & Wisconsin, residents have a total
aggregate disposable income of $1.5 billion. Millennials
(ages 25–34) represent a significant portion of this spending
power. Residents age 25–34 within one mile of M & Wisconsin
have aggregate disposable income of $571 million; within
three miles, their aggregate disposable income jumps to
$4.3 billion.3
THE STATE OF GEORGETOWN 2016 REPORT 11
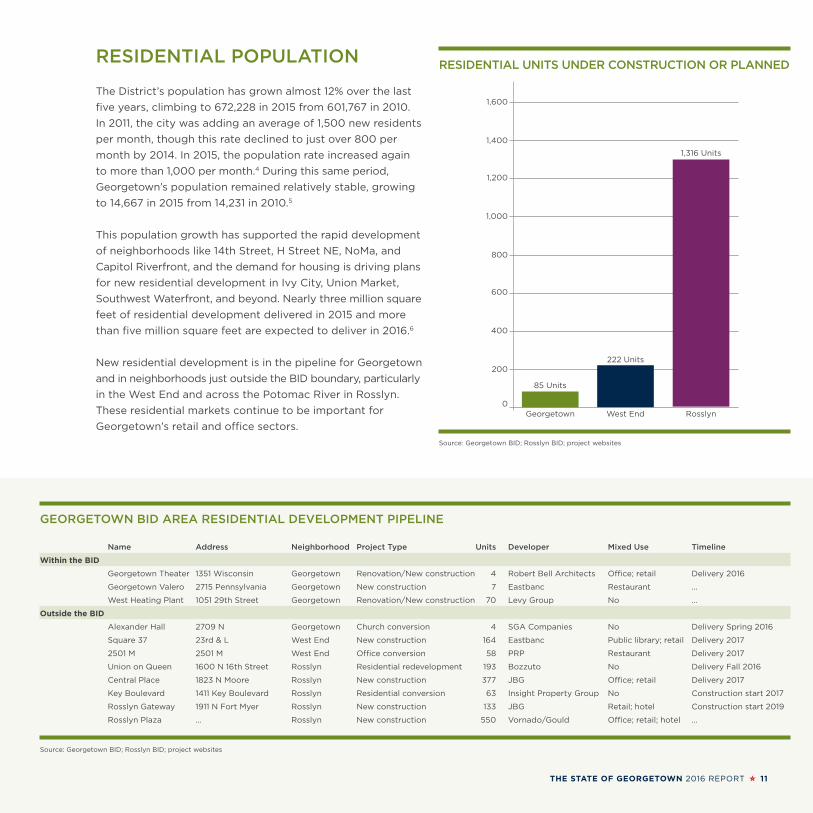
RESIDENTIAL POPULATION
The District’s population has grown almost 12% over the last
five years, climbing to 672,228 in 2015 from 601,767 in 2010.
In 2011, the city was adding an average of 1,500 new residents
per month, though this rate declined to just over 800 per
month by 2014. In 2015, the population rate increased again
to more than 1,000 per month.4 During this same period,
Georgetown’s population remained relatively stable, growing
to 14,667 in 2015 from 14,231 in 2010.5
This population growth has supported the rapid development
of neighborhoods like 14th Street, H Street NE, NoMa, and
Capitol Riverfront, and the demand for housing is driving plans
for new residential development in Ivy City, Union Market,
Southwest Waterfront, and beyond. Nearly three million square
feet of residential development delivered in 2015 and more
than five million square feet are expected to deliver in 2016.6
New residential development is in the pipeline for Georgetown
and in neighborhoods just outside the BID boundary, particularly
in the West End and across the Potomac River in Rosslyn.
These residential markets continue to be important for
Georgetown’s retail and office sectors.
GEORGETOWN BID AREA RESIDENTIAL DEVELOPMENT PIPELINE
Name Address Neighborhood Project Type Units Developer Mixed Use Timeline
Within the BID
Georgetown Theater 1351 Wisconsin Georgetown Renovation/New construction 4 Robert Bell Architects Office; retail Delivery 2016
Georgetown Valero 2715 Pennsylvania Georgetown New construction 7 Eastbanc Restaurant …
West Heating Plant 1051 29th Street Georgetown Renovation/New construction 70 Levy Group No …
Outside the BID
Alexander Hall 2709 N Georgetown Church conversion 4 SGA Companies No Delivery Spring 2016
Square 37 23rd & L West End New construction 164 Eastbanc Public library; retail Delivery 2017
2501 M 2501 M West End Office conversion 58 PRP Restaurant Delivery 2017
Union on Queen 1600 N 16th Street Rosslyn Residential redevelopment 193 Bozzuto No Delivery Fall 2016
Central Place 1823 N Moore Rosslyn New construction 377 JBG Office; retail Delivery 2017
Key Boulevard 1411 Key Boulevard Rosslyn Residential conversion 63 Insight Property Group No Construction start 2017
Rosslyn Gateway 1911 N Fort Myer Rosslyn New construction 133 JBG Retail; hotel Construction start 2019
Rosslyn Plaza … Rosslyn New construction 550 Vornado/Gould Office; retail; hotel …
Source: Georgetown BID; Rosslyn BID; project websites
RESIDENTIAL UNITS UNDER CONSTRUCTION OR PLANNED
Source: Georgetown BID; Rosslyn BID; project websites
1,600
1,400
1,200
1,000
800
600
400
200
0Georgetown West End Rosslyn
85 Units
222 Units
1,316 Units

12 THE STATE OF GEORGETOWN 2016 REPORT
VISITOR PROFILE AND SPENDING
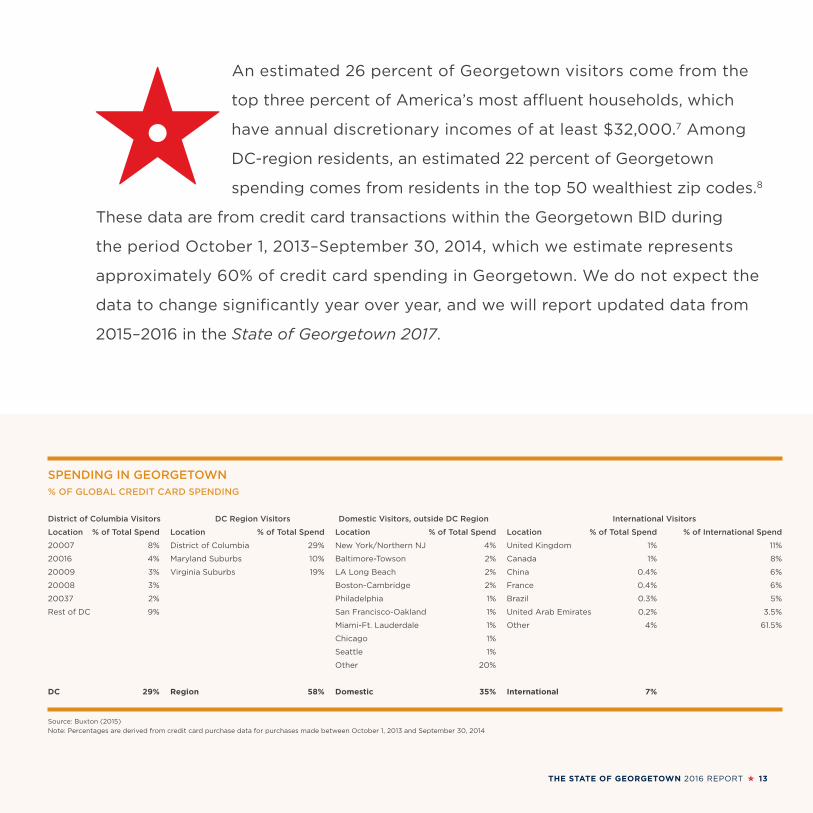
SPENDING IN GEORGETOWN% OF GLOBAL CREDIT CARD SPENDING
District of Columbia Visitors DC Region Visitors Domestic Visitors, outside DC Region International Visitors
Location % of Total Spend Location % of Total Spend Location % of Total Spend Location % of Total Spend % of International Spend
20007 8% District of Columbia 29% New York/Northern NJ 4% United Kingdom 1% 11%
20016 4% Maryland Suburbs 10% Baltimore-Towson 2% Canada 1% 8%
20009 3% Virginia Suburbs 19% LA Long Beach 2% China 0.4% 6%
20008 3% Boston-Cambridge 2% France 0.4% 6%
20037 2% Philadelphia 1% Brazil 0.3% 5%
Rest of DC 9% San Francisco-Oakland 1% United Arab Emirates 0.2% 3.5%
Miami-Ft. Lauderdale 1% Other 4% 61.5%
Chicago 1%
Seattle 1%
Other 20%
DC 29% Region 58% Domestic 35% International 7%
Source: Buxton (2015)
Note: Percentages are derived from credit card purchase data for purchases made between October 1, 2013 and September 30, 2014
THE STATE OF GEORGETOWN 2016 REPORT 13
An estimated 26 percent of Georgetown visitors come from the
top three percent of America’s most affluent households, which
have annual discretionary incomes of at least $32,000.7 Among
DC-region residents, an estimated 22 percent of Georgetown
spending comes from residents in the top 50 wealthiest zip codes.8
These data are from credit card transactions within the Georgetown BID during
the period October 1, 2013–September 30, 2014, which we estimate represents
approximately 60% of credit card spending in Georgetown. We do not expect the
data to change significantly year over year, and we will report updated data from
2015–2016 in the State of Georgetown 2017.
14 THE STATE OF GEORGETOWN 2016 REPORT
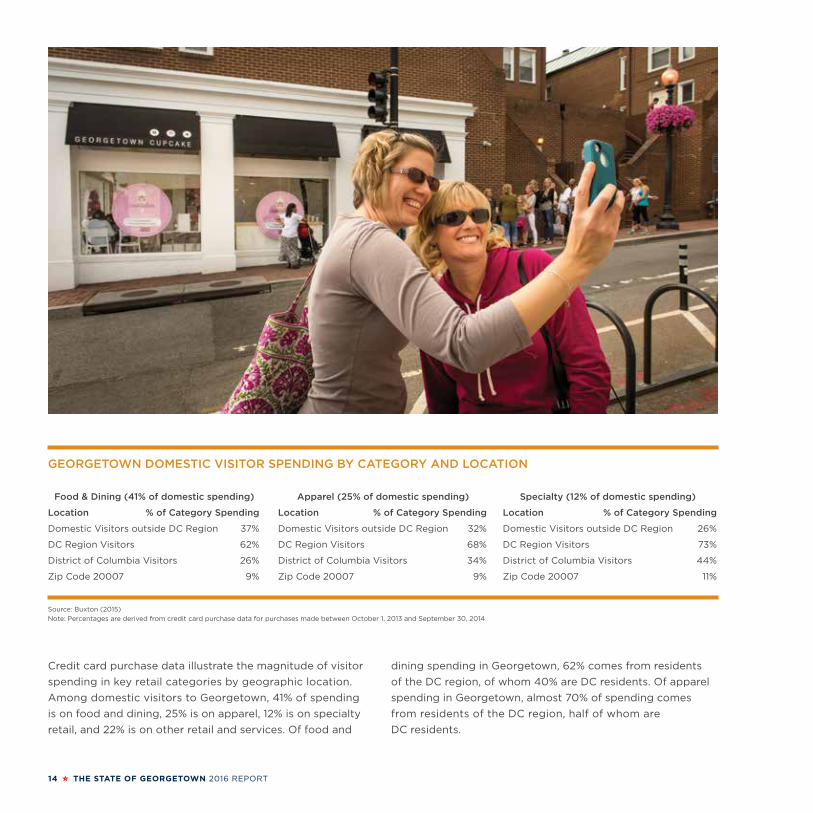
Credit card purchase data illustrate the magnitude of visitor
spending in key retail categories by geographic location.
Among domestic visitors to Georgetown, 41% of spending
is on food and dining, 25% is on apparel, 12% is on specialty
retail, and 22% is on other retail and services. Of food and
GEORGETOWN DOMESTIC VISITOR SPENDING BY CATEGORY AND LOCATION
Food & Dining (41% of domestic spending) Apparel (25% of domestic spending) Specialty (12% of domestic spending)
Location % of Category Spending Location % of Category Spending Location % of Category Spending
Domestic Visitors outside DC Region 37% Domestic Visitors outside DC Region 32% Domestic Visitors outside DC Region 26%
DC Region Visitors 62% DC Region Visitors 68% DC Region Visitors 73%
District of Columbia Visitors 26% District of Columbia Visitors 34% District of Columbia Visitors 44%
Zip Code 20007 9% Zip Code 20007 9% Zip Code 20007 11%
Source: Buxton (2015)
Note: Percentages are derived from credit card purchase data for purchases made between October 1, 2013 and September 30, 2014
dining spending in Georgetown, 62% comes from residents
of the DC region, of whom 40% are DC residents. Of apparel
spending in Georgetown, almost 70% of spending comes
from residents of the DC region, half of whom are
DC residents.
THE STATE OF GEORGETOWN 2016 REPORT 15
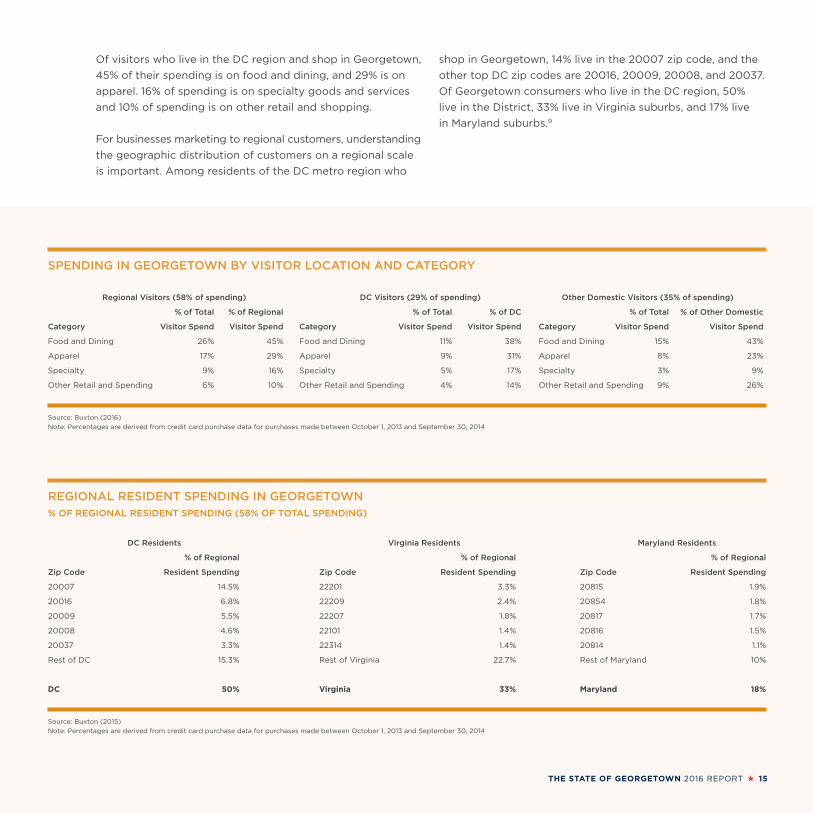
Of visitors who live in the DC region and shop in Georgetown,
45% of their spending is on food and dining, and 29% is on
apparel. 16% of spending is on specialty goods and services
and 10% of spending is on other retail and shopping.
For businesses marketing to regional customers, understanding
the geographic distribution of customers on a regional scale
is important. Among residents of the DC metro region who
SPENDING IN GEORGETOWN BY VISITOR LOCATION AND CATEGORY
Regional Visitors (58% of spending) DC Visitors (29% of spending) Other Domestic Visitors (35% of spending)
% of Total % of Regional % of Total % of DC % of Total % of Other Domestic
Category Visitor Spend Visitor Spend Category Visitor Spend Visitor Spend Category Visitor Spend Visitor Spend
Food and Dining 26% 45% Food and Dining 11% 38% Food and Dining 15% 43%
Apparel 17% 29% Apparel 9% 31% Apparel 8% 23%
Specialty 9% 16% Specialty 5% 17% Specialty 3% 9%
Other Retail and Spending 6% 10% Other Retail and Spending 4% 14% Other Retail and Spending 9% 26%
Source: Buxton (2016)
Note: Percentages are derived from credit card purchase data for purchases made between October 1, 2013 and September 30, 2014
REGIONAL RESIDENT SPENDING IN GEORGETOWN% OF REGIONAL RESIDENT SPENDING (58% OF TOTAL SPENDING)
DC Residents Virginia Residents Maryland Residents
% of Regional % of Regional % of Regional
Zip Code Resident Spending Zip Code Resident Spending Zip Code Resident Spending
20007 14.5% 22201 3.3% 20815 1.9%
20016 6.8% 22209 2.4% 20854 1.8%
20009 5.5% 22207 1.8% 20817 1.7%
20008 4.6% 22101 1.4% 20816 1.5%
20037 3.3% 22314 1.4% 20814 1.1%
Rest of DC 15.3% Rest of Virginia 22.7% Rest of Maryland 10%
DC 50% Virginia 33% Maryland 18%
Source: Buxton (2015)
Note: Percentages are derived from credit card purchase data for purchases made between October 1, 2013 and September 30, 2014
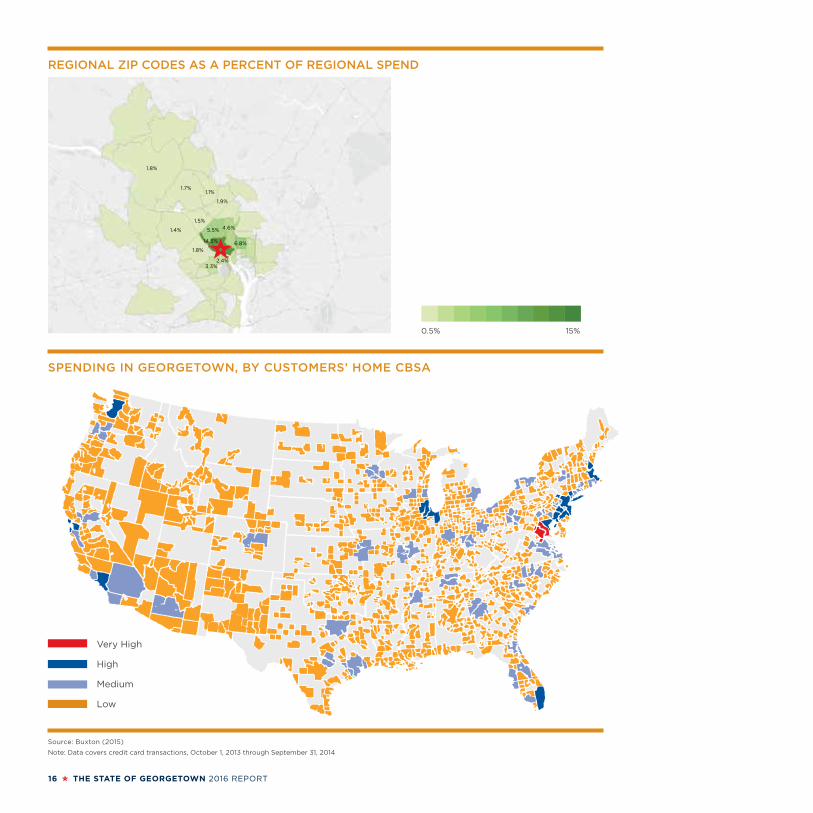
shop in Georgetown, 14% live in the 20007 zip code, and the
other top DC zip codes are 20016, 20009, 20008, and 20037.
Of Georgetown consumers who live in the DC region, 50%
live in the District, 33% live in Virginia suburbs, and 17% live
in Maryland suburbs.9
16 THE STATE OF GEORGETOWN 2016 REPORT
REGIONAL ZIP CODES AS A PERCENT OF REGIONAL SPEND
Very High
High
Medium
Low
SPENDING IN GEORGETOWN, BY CUSTOMERS’ HOME CBSA
Source: Buxton (2015)
Note: Data covers credit card transactions, October 1, 2013 through September 31, 2014
0.5% 15%
1.8%
1.7%1.1%
1.9%
1.5%
1.4%
1.8%
2.4%3.3%
5.5%
14.5% 6.8%
4.6%

THE STATE OF GEORGETOWN 2016 REPORT 17
TOP GEORGETOWN MARKET SEGMENTS SHARE OF DISCRETIONARY NO 3+
MARKET SEGMENT MARKET INCOME AGE CARS CARS PYSCHOGRAPHIC DESCRIPTION
Wealthy, influential, and 13% $32,000+ 51–65 18% 65% Put in long work days, but after hours like to soak
successful couples and up culture and nightlife. Typically the target market
families living in for expensive brands of cars, furnishings, and jewelry;
prestigious suburbs inconspicuous consumption is a foreign concept.
Idea of shopping is having a personal sales clerk at
a boutique or speciality store. Also patronize a wide
range of retailers, including upscale department
stores like Nordstrom and discount chains such as
Marshall’s and T.J. Maxx.
Younger, up-and-coming 14% $16-19,000 31–35 52% 16% Spend free time in local stores, restaurants and
singles living big city cultural venues. More than three times as likely to
lifestyles located within patronize bars and nightclubs. Avoid mainstream
top CBSA markets retailers, preferring local boutiques to any big-box
store. Try to keep within their budget and do not
devote much time to shopping. They take public
transportation and prefer not to travel distances
to shop or spend a long time browsing.
Wealthy and established 8% $32,000+ 66–75 14% 71% Make time for cultured and athletic pursuit. Like to
empty-nesting couples buy popular brands with reputations for being high
residing in suburban and quality and cutting edge. Frequent stores that offer
in-town homes designer apparel and high-end accessories. Lead
busy, time-pressed lives, so also turn to catalogs
and websites. Appreciate the thrill of the bargain
hunt at Marshall’s, T.J. Maxx, Costco, and Best Buy.
Young multi-ethnic singles 7% $6–7,000 25–30 54% 14% Active in the dating scene and often go out at night
living in midwest and to bars, restaurants, cinemas, dance performances
southern city centers and concerts featuring all kinds of music. Limited
budgets, but fond of shopping. Typically use the
Internet to plan a major shopping excursion. Can’t
afford high-end stores, but patronize mall boutiques
like Victoria’s Secret, Abercrombie & Fitch, Ann Taylor
and Banana Republic when they’re running sales.
Mature, upscale couples 7% $32,000+ 66–75 18% 56% With the luxury of both time and money, pursue
and singles in suburban leisure-intensive lifestyles. Like to dine out, go to
homes plays and concerts and shop for decorative antiques.
Don’t mind paying extra for high-quality goods and
brands they’ve known for decades. Fondness for
decorating their homes with purchases from
Williams-Sonoma and Crate and Barrel. Also buy
a wide variety of items through catalogs. Like to
drive hybrid, imported and premium cars.
Source: Buxton (2015) and Experian
18 THE STATE OF GEORGETOWN 2016 REPORT
RETAIL ANDRESTAURANTS
THE STATE OF GEORGETOWN 2016 REPORT 19
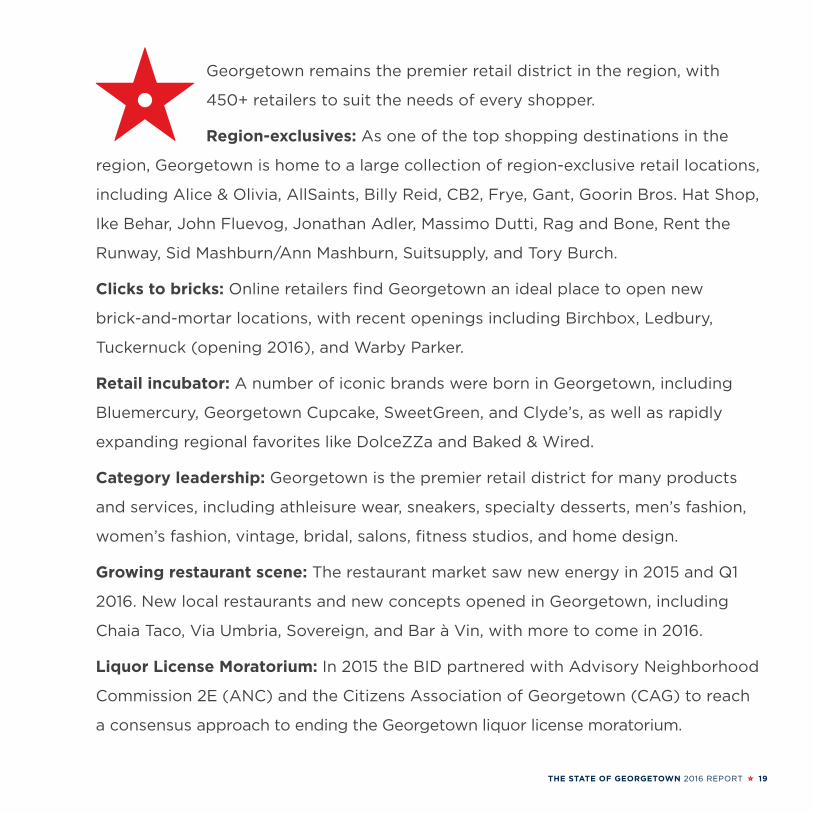
Georgetown remains the premier retail district in the region, with
450+ retailers to suit the needs of every shopper.
Region-exclusives: As one of the top shopping destinations in the
region, Georgetown is home to a large collection of region-exclusive retail locations,
including Alice & Olivia, AllSaints, Billy Reid, CB2, Frye, Gant, Goorin Bros. Hat Shop,
Ike Behar, John Fluevog, Jonathan Adler, Massimo Dutti, Rag and Bone, Rent the
Runway, Sid Mashburn/Ann Mashburn, Suitsupply, and Tory Burch.
Clicks to bricks: Online retailers find Georgetown an ideal place to open new
brick-and-mortar locations, with recent openings including Birchbox, Ledbury,
Tuckernuck (opening 2016), and Warby Parker.
Retail incubator: A number of iconic brands were born in Georgetown, including
Bluemercury, Georgetown Cupcake, SweetGreen, and Clyde’s, as well as rapidly
expanding regional favorites like DolceZZa and Baked & Wired.
Category leadership: Georgetown is the premier retail district for many products
and services, including athleisure wear, sneakers, specialty desserts, men’s fashion,
women’s fashion, vintage, bridal, salons, fitness studios, and home design.
Growing restaurant scene: The restaurant market saw new energy in 2015 and Q1
2016. New local restaurants and new concepts opened in Georgetown, including
Chaia Taco, Via Umbria, Sovereign, and Bar à Vin, with more to come in 2016.
Liquor License Moratorium: In 2015 the BID partnered with Advisory Neighborhood
Commission 2E (ANC) and the Citizens Association of Georgetown (CAG) to reach
a consensus approach to ending the Georgetown liquor license moratorium.
20 THE STATE OF GEORGETOWN 2016 REPORT
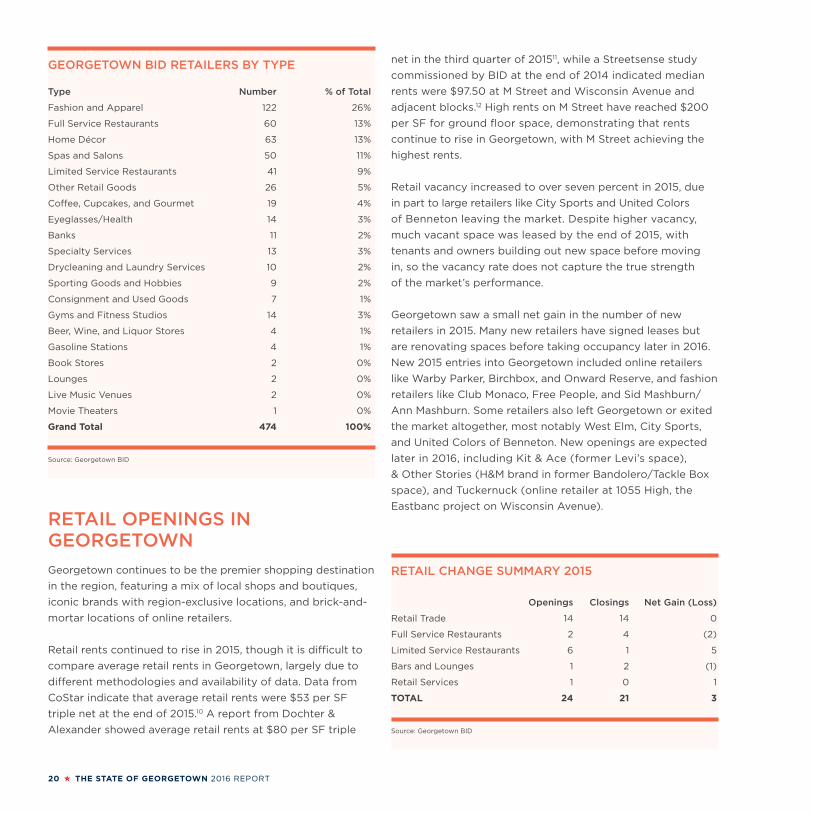
GEORGETOWN BID RETAILERS BY TYPE
Type Number % of Total
Fashion and Apparel 122 26%
Full Service Restaurants 60 13%
Home Décor 63 13%
Spas and Salons 50 11%
Limited Service Restaurants 41 9%
Other Retail Goods 26 5%
Coffee, Cupcakes, and Gourmet 19 4%
Eyeglasses/Health 14 3%
Banks 11 2%
Specialty Services 13 3%
Drycleaning and Laundry Services 10 2%
Sporting Goods and Hobbies 9 2%
Consignment and Used Goods 7 1%
Gyms and Fitness Studios 14 3%
Beer, Wine, and Liquor Stores 4 1%
Gasoline Stations 4 1%
Book Stores 2 0%
Lounges 2 0%
Live Music Venues 2 0%
Movie Theaters 1 0%
Grand Total 474 100%
Source: Georgetown BID
RETAIL CHANGE SUMMARY 2015
Openings Closings Net Gain (Loss)
Retail Trade 14 14 0
Full Service Restaurants 2 4 (2)
Limited Service Restaurants 6 1 5
Bars and Lounges 1 2 (1)
Retail Services 1 0 1
TOTAL 24 21 3
Source: Georgetown BID
RETAIL OPENINGS IN GEORGETOWN
Georgetown continues to be the premier shopping destination
in the region, featuring a mix of local shops and boutiques,
iconic brands with region-exclusive locations, and brick-and-
mortar locations of online retailers.
Retail rents continued to rise in 2015, though it is difficult to
compare average retail rents in Georgetown, largely due to
different methodologies and availability of data. Data from
CoStar indicate that average retail rents were $53 per SF
triple net at the end of 2015.10 A report from Dochter &
Alexander showed average retail rents at $80 per SF triple
net in the third quarter of 201511, while a Streetsense study
commissioned by BID at the end of 2014 indicated median
rents were $97.50 at M Street and Wisconsin Avenue and
adjacent blocks.12 High rents on M Street have reached $200
per SF for ground floor space, demonstrating that rents
continue to rise in Georgetown, with M Street achieving the
highest rents.
Retail vacancy increased to over seven percent in 2015, due
in part to large retailers like City Sports and United Colors
of Benneton leaving the market. Despite higher vacancy,
much vacant space was leased by the end of 2015, with
tenants and owners building out new space before moving
in, so the vacancy rate does not capture the true strength
of the market’s performance.
Georgetown saw a small net gain in the number of new
retailers in 2015. Many new retailers have signed leases but
are renovating spaces before taking occupancy later in 2016.
New 2015 entries into Georgetown included online retailers
like Warby Parker, Birchbox, and Onward Reserve, and fashion
retailers like Club Monaco, Free People, and Sid Mashburn/
Ann Mashburn. Some retailers also left Georgetown or exited
the market altogether, most notably West Elm, City Sports,
and United Colors of Benneton. New openings are expected
later in 2016, including Kit & Ace (former Levi’s space),
& Other Stories (H&M brand in former Bandolero/Tackle Box
space), and Tuckernuck (online retailer at 1055 High, the
Eastbanc project on Wisconsin Avenue).

THE STATE OF GEORGETOWN 2016 REPORT 21
GEORGETOWN BID RETAIL OPENINGS AND CLOSINGS, 2015
2015 OPENINGS 2015 CLOSINGS
RETAIL Calligaris Kate Spade Saturday
Circa Lighting True Religion
Vaporfi Duo
Lynn Louisa Sabun Home
Free People Urban Chic
Sid Mashburn/Ann Mashburn Britt Ryan
Warby Parker Metro Interiors
Francesca’s Jack Wills
Onward Reserve West Elm
Georgetown Olive Oil Company Pedini
Club Monaco All We Art
Birchbox United Colors of Benetton
Thos. Moser (new location) City Sports
Little Birdie’s (new location) Helia’s
FULL SERVICE RESTAURANTS Orange Anchor Tackle Box
Maxime Steak Frites Yummi Crawfish
Mama Rouge
Rialto
LIMITED SERVICE RESTAURANTS Via Umbria (expanded eating space) Little Penguin
Chaia Farm to Taco
Postmodern Foods
Red Toque Café
Curry & Pie
Crumbs & Whiskers
BARS AND LOUNGES The Alex Rhino Bar and Pumphouse
Prince Café
RETAIL SERVICES Soulcycle
POPUPS American Field
Madda Fella
Source: Georgetown BID
22 THE STATE OF GEORGETOWN 2016 REPORT
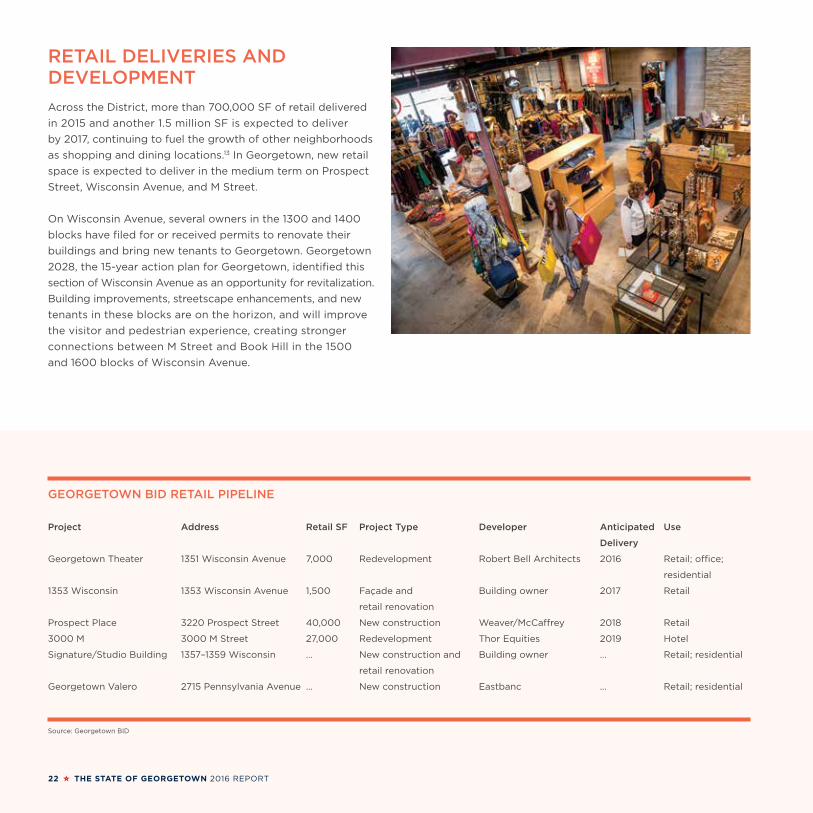
RETAIL DELIVERIES AND DEVELOPMENT
Across the District, more than 700,000 SF of retail delivered
in 2015 and another 1.5 million SF is expected to deliver
by 2017, continuing to fuel the growth of other neighborhoods
as shopping and dining locations.13 In Georgetown, new retail
space is expected to deliver in the medium term on Prospect
Street, Wisconsin Avenue, and M Street.
On Wisconsin Avenue, several owners in the 1300 and 1400
blocks have filed for or received permits to renovate their
buildings and bring new tenants to Georgetown. Georgetown
2028, the 15-year action plan for Georgetown, identified this
section of Wisconsin Avenue as an opportunity for revitalization.
Building improvements, streetscape enhancements, and new
tenants in these blocks are on the horizon, and will improve
the visitor and pedestrian experience, creating stronger
connections between M Street and Book Hill in the 1500
and 1600 blocks of Wisconsin Avenue.
GEORGETOWN BID RETAIL PIPELINE
Project Address Retail SF Project Type Developer Anticipated Use
Delivery
Georgetown Theater 1351 Wisconsin Avenue 7,000 Redevelopment Robert Bell Architects 2016 Retail; office;
residential
1353 Wisconsin 1353 Wisconsin Avenue 1,500 Façade and Building owner 2017 Retail
retail renovation
Prospect Place 3220 Prospect Street 40,000 New construction Weaver/McCaffrey 2018 Retail
3000 M 3000 M Street 27,000 Redevelopment Thor Equities 2019 Hotel
Signature/Studio Building 1357–1359 Wisconsin … New construction and Building owner … Retail; residential
retail renovation
Georgetown Valero 2715 Pennsylvania Avenue … New construction Eastbanc … Retail; residential
Source: Georgetown BID
THE STATE OF GEORGETOWN 2016 REPORT 23
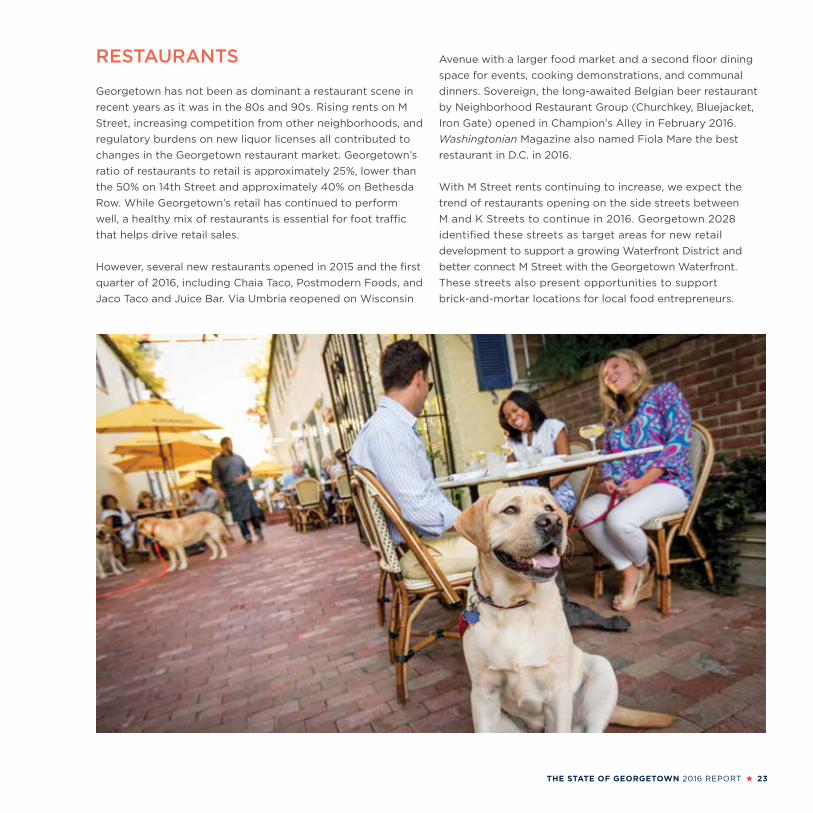
RESTAURANTS
Georgetown has not been as dominant a restaurant scene in
recent years as it was in the 80s and 90s. Rising rents on M
Street, increasing competition from other neighborhoods, and
regulatory burdens on new liquor licenses all contributed to
changes in the Georgetown restaurant market. Georgetown’s
ratio of restaurants to retail is approximately 25%, lower than
the 50% on 14th Street and approximately 40% on Bethesda
Row. While Georgetown’s retail has continued to perform
well, a healthy mix of restaurants is essential for foot traffic
that helps drive retail sales.
However, several new restaurants opened in 2015 and the first
quarter of 2016, including Chaia Taco, Postmodern Foods, and
Jaco Taco and Juice Bar. Via Umbria reopened on Wisconsin
Avenue with a larger food market and a second floor dining
space for events, cooking demonstrations, and communal
dinners. Sovereign, the long-awaited Belgian beer restaurant
by Neighborhood Restaurant Group (Churchkey, Bluejacket,
Iron Gate) opened in Champion’s Alley in February 2016.
Washingtonian Magazine also named Fiola Mare the best
restaurant in D.C. in 2016.
With M Street rents continuing to increase, we expect the
trend of restaurants opening on the side streets between
M and K Streets to continue in 2016. Georgetown 2028
identified these streets as target areas for new retail
development to support a growing Waterfront District and
better connect M Street with the Georgetown Waterfront.
These streets also present opportunities to support
brick-and-mortar locations for local food entrepreneurs.
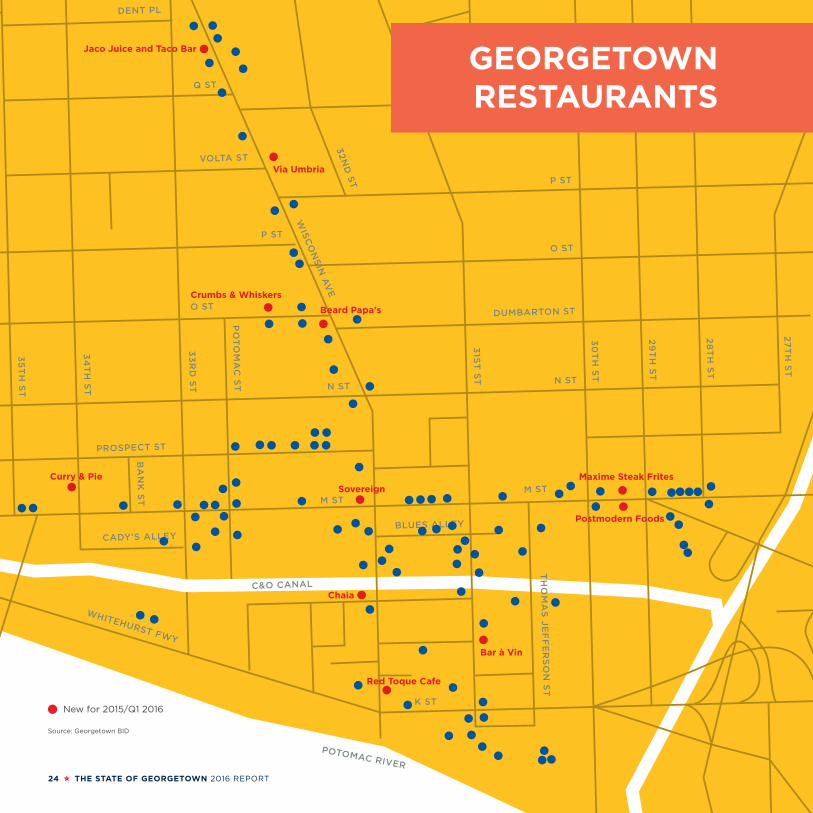
24 THE STATE OF GEORGETOWN 2016 REPORT
N STN ST
DUMBARTON ST
O ST
O ST
P ST
P ST
VOLTA ST
Q ST
CAMBRIDGE PL
DENT PL
R ST
Q ST
DENT PL
RESERVOIR RD
PROSPECT ST
M STM ST
CADY’S ALLEY
WHITEHURST FWY
BLUES ALLEY
TH
OM
AS
JE
FF
ER
SO
N S
T
34
TH
ST
33
RD
ST
PO
TO
MA
C S
T
BA
NK
ST
31S
T S
T
30
TH
ST
29
TH
ST
28
TH
ST
27
TH
ST
32
ND
ST
35
TH
ST
WIS
CO
NS
IN A
VE
C&O CANAL
K ST
POTOMAC RIVER
Via Umbria
Jaco Juice and Taco Bar
Beard Papa’s
Crumbs & Whiskers
Postmodern Foods
Maxime Steak Frites
Bar à Vin
Red Toque Cafe
Chaia
SovereignCurry & Pie
GEORGETOWNRESTAURANTS
New for 2015/Q1 2016
Source: Georgetown BID
THE STATE OF GEORGETOWN 2016 REPORT 25
FOOT TRAFFIC BY MONTH
Source: Georgetown BID, data collected Q1 2015–Q4 2015
N STN ST
DUMBARTON ST
O ST
O ST
P ST
P ST
VOLTA ST
Q ST
CAMBRIDGE PL
DENT PL
R ST
Q ST
DENT PL
RESERVOIR RD
PROSPECT ST
M STM ST
CADY’S ALLEY
WHITEHURST FWY
BLUES ALLEY
TH
OM
AS
JE
FF
ER
SO
N S
T
34
TH
ST
33
RD
ST
PO
TO
MA
C S
T
BA
NK
ST
31S
T S
T
30
TH
ST
29
TH
ST
28
TH
ST
27
TH
ST
32
ND
ST
35
TH
ST
WIS
CO
NS
IN A
VE
C&O CANAL
K ST
POTOMAC RIVER
Via Umbria
Jaco Juice and Taco Bar
Beard Papa’s
Crumbs & Whiskers
Postmodern Foods
Maxime Steak Frites
Bar à Vin
Red Toque Cafe
Chaia
SovereignCurry & Pie
12%
11%
10%
9%
8%
7%
6%
5%
4%
% T
OTA
L A
NN
UA
L F
OO
T T
RA
FF
IC
JANUA
RY
FEBRUARY
MARCH
APRIL
MAY
JUNE
JULY
AUGUST
SEPTEMBER
OCTO
BER
NOVEM
BER
DECEM
BER
M St & Wisconsin
1325 Wisconsin
2929 M St
1629 Wisconsin
1050 Thomas Jefferson
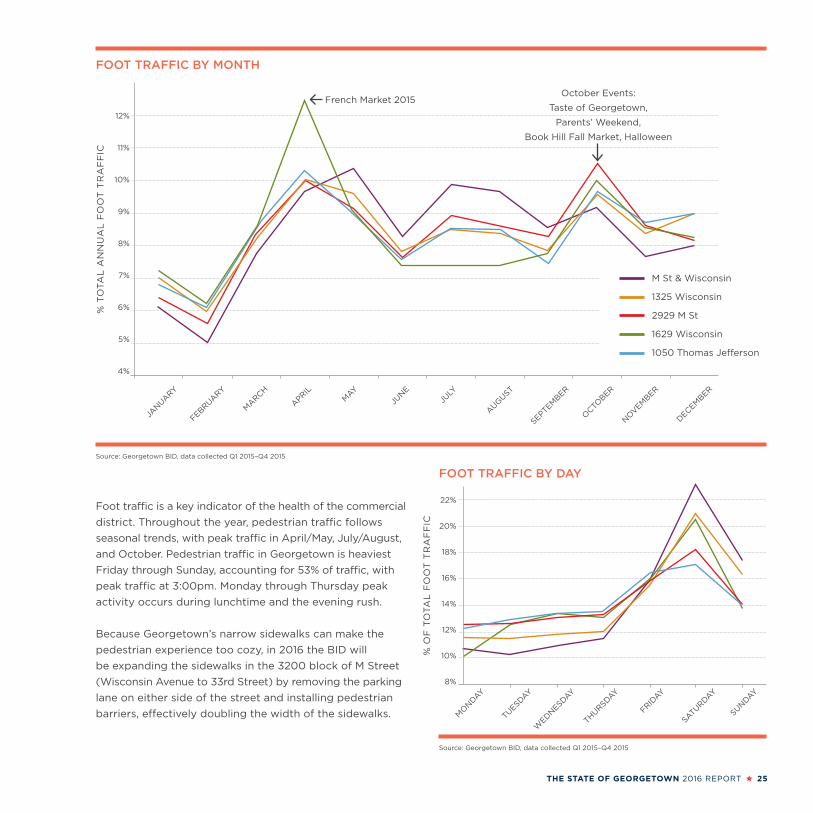
Foot traffic is a key indicator of the health of the commercial
district. Throughout the year, pedestrian traffic follows
seasonal trends, with peak traffic in April/May, July/August,
and October. Pedestrian traffic in Georgetown is heaviest
Friday through Sunday, accounting for 53% of traffic, with
peak traffic at 3:00pm. Monday through Thursday peak
activity occurs during lunchtime and the evening rush.
Because Georgetown’s narrow sidewalks can make the
pedestrian experience too cozy, in 2016 the BID will
be expanding the sidewalks in the 3200 block of M Street
(Wisconsin Avenue to 33rd Street) by removing the parking
lane on either side of the street and installing pedestrian
barriers, effectively doubling the width of the sidewalks.
French Market 2015 October Events:
Taste of Georgetown,
Parents’ Weekend,
Book Hill Fall Market, Halloween
FOOT TRAFFIC BY DAY
Source: Georgetown BID, data collected Q1 2015–Q4 2015
MO
NDAY
TUESDAY
WED
NESDAY
THURSDAY
FRIDAY
SATU
RDAY
SUNDAY
22%
20%
18%
16%
14%
12%
10%
8%
% O
F T
OTA
L F
OO
T T
RA
FF
IC
26 THE STATE OF GEORGETOWN 2016 REPORT
OFFICE MARKET AND EMPLOYEES
THE STATE OF GEORGETOWN 2016 REPORT 27
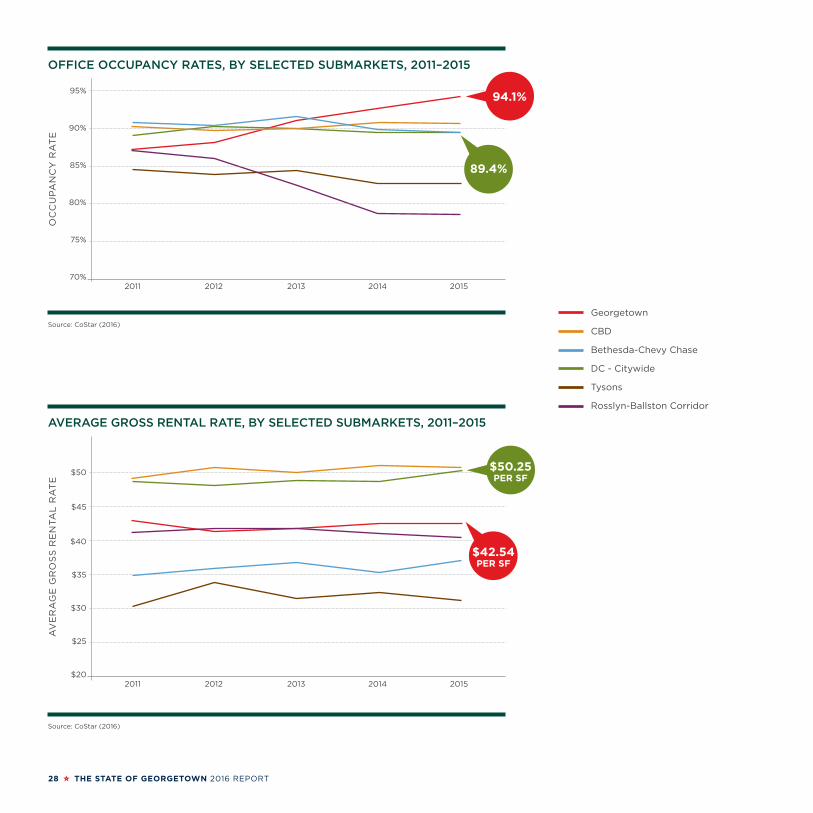
The District’s office market performed well in 2015. Overall office
vacancy held steady at just over 10 percent, lower than the
Suburban Maryland and Northern Virginia submarkets, while
average asking office rents climbed to over $50 per square foot (SF).
Georgetown’s office market improved for the fourth year in a row,
and in 2015 it was the strongest performing office submarket in the region. Office
occupancy climbed to 94.1%, the highest of any submarket and the third straight
year of occupancy above 90%. Rents have remained stable and affordable, closing
2015 at $42.54 per SF for average asking rents.14
Georgetown’s office market features a diversity of tenants, including law firms,
technology companies, nonprofits and associations, professional services firms,
and architecture and design firms. Across the region, office tenants are increasingly
seeking smaller, unique offices in neighborhoods rich in amenities. Georgetown’s
mix of trophy waterfront buildings and small spaces in historic buildings, set against
the backdrop of a vibrant retail district and active public spaces, is well suited to
meet these needs.
28 THE STATE OF GEORGETOWN 2016 REPORT
OFFICE OCCUPANCY RATES, BY SELECTED SUBMARKETS, 2011–2015
Source: CoStar (2016)
95%
90%
85%
80%
75%
70%2011 2012 2013 2014 2015
Georgetown
CBD
Bethesda-Chevy Chase
DC - Citywide
Tysons
Rosslyn-Ballston Corridor
94.1%
89.4%
AVERAGE GROSS RENTAL RATE, BY SELECTED SUBMARKETS, 2011–2015
Source: CoStar (2016)
$50
$45
$40
$35
$30
$25
$202011 2012 2013 2014 2015
$50.25PER SF
$42.54PER SF
AV
ER
AG
E G
RO
SS
RE
NTA
L R
AT
EO
CC
UP
AN
CY
RA
TE
THE STATE OF GEORGETOWN 2016 REPORT 29
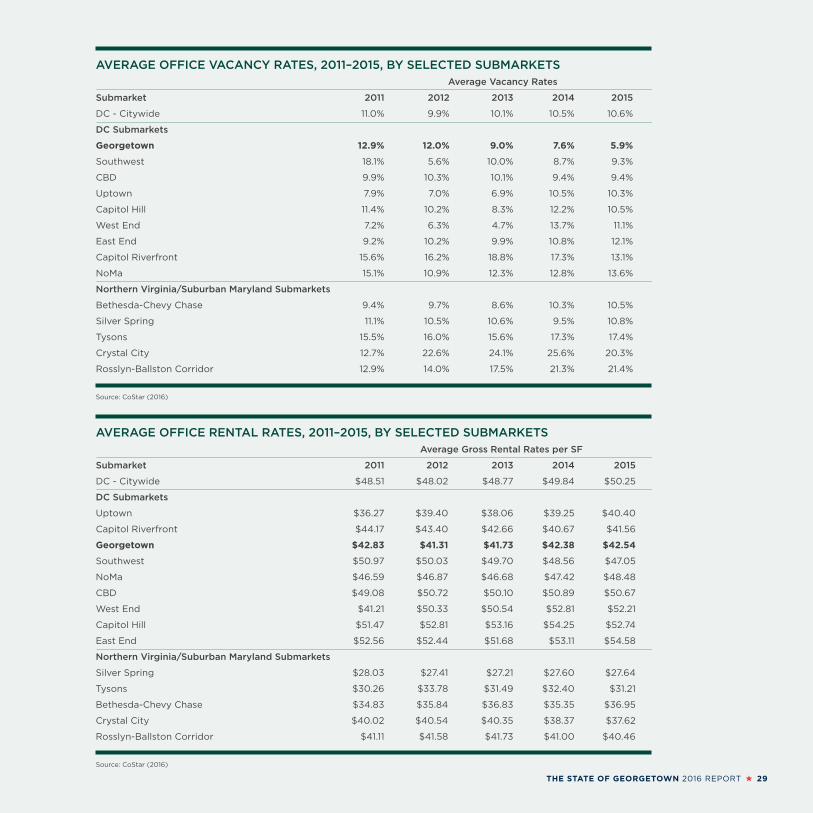
AVERAGE OFFICE VACANCY RATES, 2011–2015, BY SELECTED SUBMARKETS Average Vacancy Rates
Submarket 2011 2012 2013 2014 2015
DC - Citywide 11.0% 9.9% 10.1% 10.5% 10.6%
DC Submarkets
Georgetown 12.9% 12.0% 9.0% 7.6% 5.9%
Southwest 18.1% 5.6% 10.0% 8.7% 9.3%
CBD 9.9% 10.3% 10.1% 9.4% 9.4%
Uptown 7.9% 7.0% 6.9% 10.5% 10.3%
Capitol Hill 11.4% 10.2% 8.3% 12.2% 10.5%
West End 7.2% 6.3% 4.7% 13.7% 11.1%
East End 9.2% 10.2% 9.9% 10.8% 12.1%
Capitol Riverfront 15.6% 16.2% 18.8% 17.3% 13.1%
NoMa 15.1% 10.9% 12.3% 12.8% 13.6%
Northern Virginia/Suburban Maryland Submarkets
Bethesda-Chevy Chase 9.4% 9.7% 8.6% 10.3% 10.5%
Silver Spring 11.1% 10.5% 10.6% 9.5% 10.8%
Tysons 15.5% 16.0% 15.6% 17.3% 17.4%
Crystal City 12.7% 22.6% 24.1% 25.6% 20.3%
Rosslyn-Ballston Corridor 12.9% 14.0% 17.5% 21.3% 21.4%
Source: CoStar (2016)
AVERAGE OFFICE RENTAL RATES, 2011–2015, BY SELECTED SUBMARKETS Average Gross Rental Rates per SF
Submarket 2011 2012 2013 2014 2015
DC - Citywide $48.51 $48.02 $48.77 $49.84 $50.25
DC Submarkets
Uptown $36.27 $39.40 $38.06 $39.25 $40.40
Capitol Riverfront $44.17 $43.40 $42.66 $40.67 $41.56
Georgetown $42.83 $41.31 $41.73 $42.38 $42.54
Southwest $50.97 $50.03 $49.70 $48.56 $47.05
NoMa $46.59 $46.87 $46.68 $47.42 $48.48
CBD $49.08 $50.72 $50.10 $50.89 $50.67
West End $41.21 $50.33 $50.54 $52.81 $52.21
Capitol Hill $51.47 $52.81 $53.16 $54.25 $52.74
East End $52.56 $52.44 $51.68 $53.11 $54.58
Northern Virginia/Suburban Maryland Submarkets
Silver Spring $28.03 $27.41 $27.21 $27.60 $27.64
Tysons $30.26 $33.78 $31.49 $32.40 $31.21
Bethesda-Chevy Chase $34.83 $35.84 $36.83 $35.35 $36.95
Crystal City $40.02 $40.54 $40.35 $38.37 $37.62
Rosslyn-Ballston Corridor $41.11 $41.58 $41.73 $41.00 $40.46
Source: CoStar (2016)
30 THE STATE OF GEORGETOWN 2016 REPORT
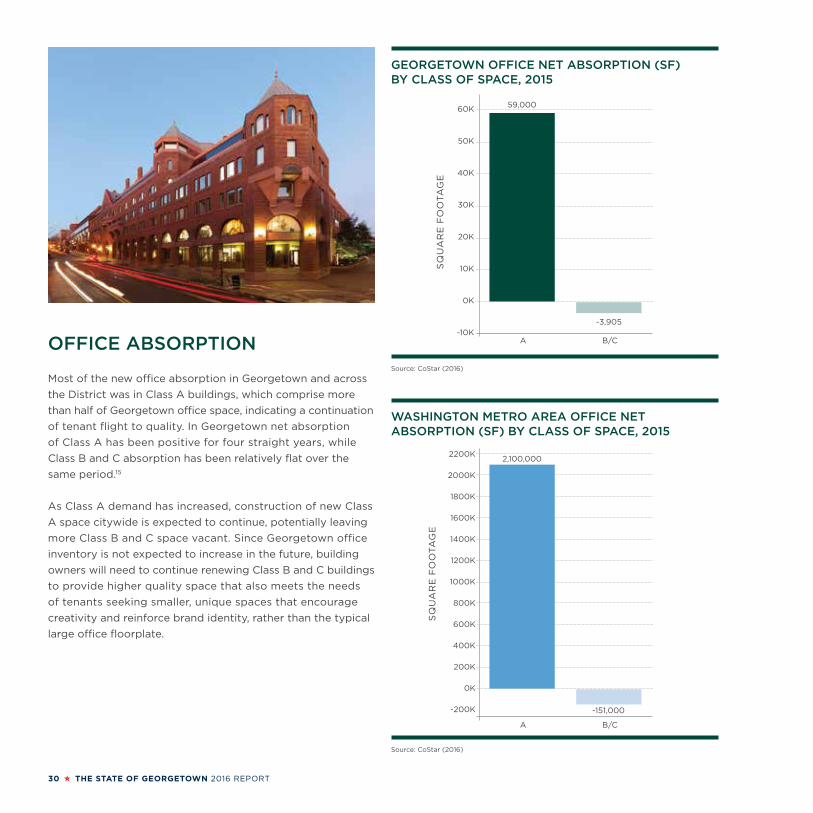
OFFICE ABSORPTION
Most of the new office absorption in Georgetown and across
the District was in Class A buildings, which comprise more
than half of Georgetown office space, indicating a continuation
of tenant flight to quality. In Georgetown net absorption
of Class A has been positive for four straight years, while
Class B and C absorption has been relatively flat over the
same period.15
As Class A demand has increased, construction of new Class
A space citywide is expected to continue, potentially leaving
more Class B and C space vacant. Since Georgetown office
inventory is not expected to increase in the future, building
owners will need to continue renewing Class B and C buildings
to provide higher quality space that also meets the needs
of tenants seeking smaller, unique spaces that encourage
creativity and reinforce brand identity, rather than the typical
large office floorplate.
GEORGETOWN OFFICE NET ABSORPTION (SF) BY CLASS OF SPACE, 2015
Source: CoStar (2016)
60K
50K
40K
30K
20K
10K
0K
-10KA B/C
59,000
-3,905
SQ
UA
RE
FO
OTA
GE
WASHINGTON METRO AREA OFFICE NET ABSORPTION (SF) BY CLASS OF SPACE, 2015
Source: CoStar (2016)
2200K
2000K
1800K
1600K
1400K
1200K
1000K
800K
600K
400K
200K
0K
-200K
A B/C
SQ
UA
RE
FO
OTA
GE
2,100,000
-151,000
THE STATE OF GEORGETOWN 2016 REPORT 31
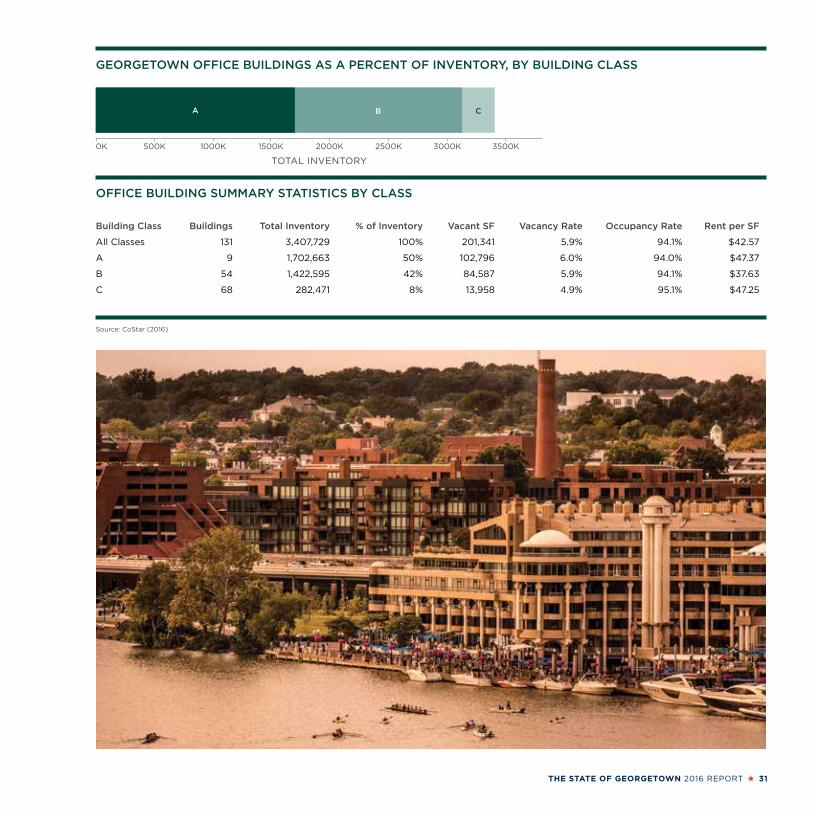
GEORGETOWN OFFICE BUILDINGS AS A PERCENT OF INVENTORY, BY BUILDING CLASS
0K 1000K500K 2000K1500K 3000K2500K 3500K
A B C
OFFICE BUILDING SUMMARY STATISTICS BY CLASS
Building Class Buildings Total Inventory % of Inventory Vacant SF Vacancy Rate Occupancy Rate Rent per SF
All Classes 131 3,407,729 100% 201,341 5.9% 94.1% $42.57
A 9 1,702,663 50% 102,796 6.0% 94.0% $47.37
B 54 1,422,595 42% 84,587 5.9% 94.1% $37.63
C 68 282,471 8% 13,958 4.9% 95.1% $47.25
Source: CoStar (2016)
TOTAL INVENTORY
32 THE STATE OF GEORGETOWN 2016 REPORT
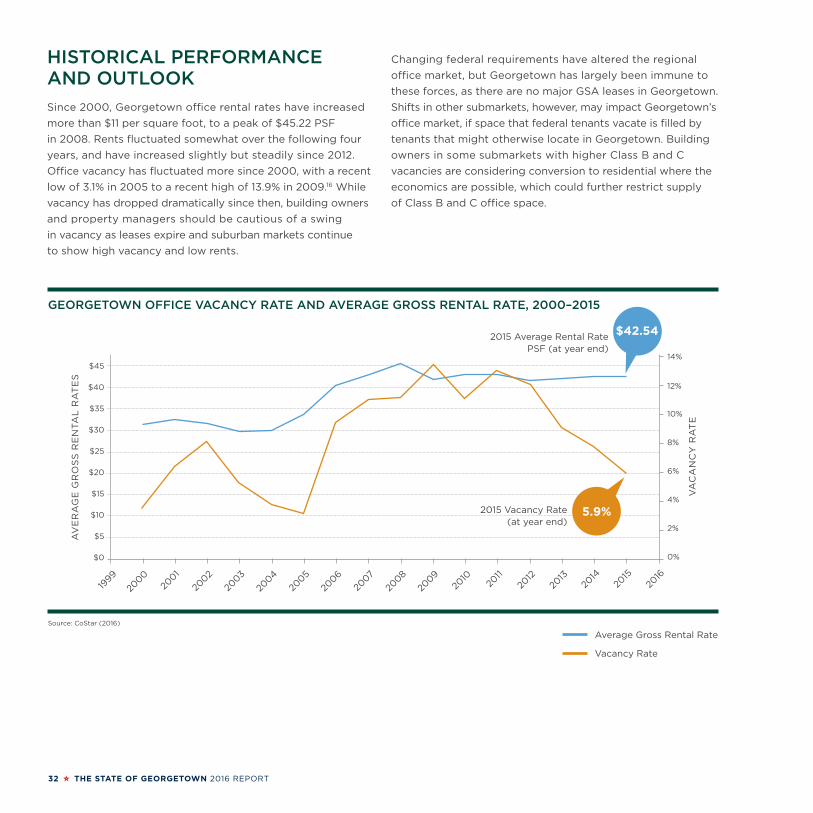
HISTORICAL PERFORMANCE AND OUTLOOK
Since 2000, Georgetown office rental rates have increased
more than $11 per square foot, to a peak of $45.22 PSF
in 2008. Rents fluctuated somewhat over the following four
years, and have increased slightly but steadily since 2012.
Office vacancy has fluctuated more since 2000, with a recent
low of 3.1% in 2005 to a recent high of 13.9% in 2009.16 While
vacancy has dropped dramatically since then, building owners
and property managers should be cautious of a swing
in vacancy as leases expire and suburban markets continue
to show high vacancy and low rents.
Changing federal requirements have altered the regional
office market, but Georgetown has largely been immune to
these forces, as there are no major GSA leases in Georgetown.
Shifts in other submarkets, however, may impact Georgetown’s
office market, if space that federal tenants vacate is filled by
tenants that might otherwise locate in Georgetown. Building
owners in some submarkets with higher Class B and C
vacancies are considering conversion to residential where the
economics are possible, which could further restrict supply
of Class B and C office space.
GEORGETOWN OFFICE VACANCY RATE AND AVERAGE GROSS RENTAL RATE, 2000–2015
Source: CoStar (2016)
Average Gross Rental Rate
Vacancy Rate
$45
$40
$35
$30
$25
$20
$15
$10
$5
$0
AV
ER
AG
E G
RO
SS
RE
NTA
L R
AT
ES
VA
CA
NC
Y R
AT
E
14%
12%
10%
8%
6%
4%
2%
0%
2001
2002
2003
2004
2005
2006
2007
2008
2009
2010
2011
2012
2013
2000
2014
2015
2016
1999
2015 Average Rental Rate PSF (at year end)
2015 Vacancy Rate(at year end)
5.9%
$42.54
THE STATE OF GEORGETOWN 2016 REPORT 33
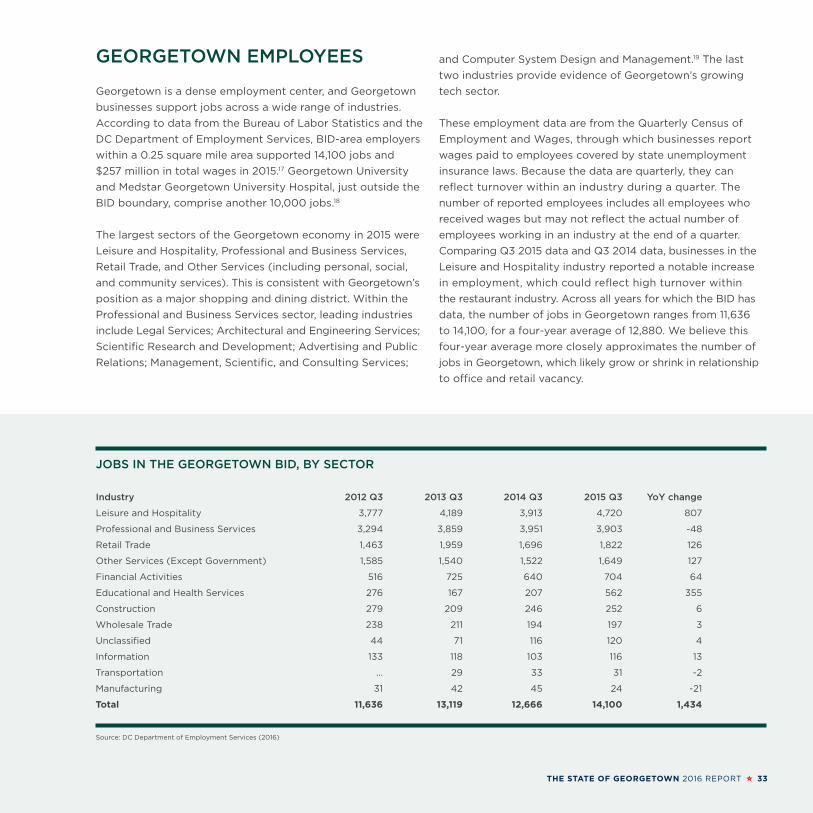
GEORGETOWN EMPLOYEES
Georgetown is a dense employment center, and Georgetown
businesses support jobs across a wide range of industries.
According to data from the Bureau of Labor Statistics and the
DC Department of Employment Services, BID-area employers
within a 0.25 square mile area supported 14,100 jobs and
$257 million in total wages in 2015.17 Georgetown University
and Medstar Georgetown University Hospital, just outside the
BID boundary, comprise another 10,000 jobs.18
The largest sectors of the Georgetown economy in 2015 were
Leisure and Hospitality, Professional and Business Services,
Retail Trade, and Other Services (including personal, social,
and community services). This is consistent with Georgetown’s
position as a major shopping and dining district. Within the
Professional and Business Services sector, leading industries
include Legal Services; Architectural and Engineering Services;
Scientific Research and Development; Advertising and Public
Relations; Management, Scientific, and Consulting Services;
and Computer System Design and Management.19 The last
two industries provide evidence of Georgetown’s growing
tech sector.
These employment data are from the Quarterly Census of
Employment and Wages, through which businesses report
wages paid to employees covered by state unemployment
insurance laws. Because the data are quarterly, they can
reflect turnover within an industry during a quarter. The
number of reported employees includes all employees who
received wages but may not reflect the actual number of
employees working in an industry at the end of a quarter.
Comparing Q3 2015 data and Q3 2014 data, businesses in the
Leisure and Hospitality industry reported a notable increase
in employment, which could reflect high turnover within
the restaurant industry. Across all years for which the BID has
data, the number of jobs in Georgetown ranges from 11,636
to 14,100, for a four-year average of 12,880. We believe this
four-year average more closely approximates the number of
jobs in Georgetown, which likely grow or shrink in relationship
to office and retail vacancy.
JOBS IN THE GEORGETOWN BID, BY SECTOR
Industry 2012 Q3 2013 Q3 2014 Q3 2015 Q3 YoY change
Leisure and Hospitality 3,777 4,189 3,913 4,720 807
Professional and Business Services 3,294 3,859 3,951 3,903 -48
Retail Trade 1,463 1,959 1,696 1,822 126
Other Services (Except Government) 1,585 1,540 1,522 1,649 127
Financial Activities 516 725 640 704 64
Educational and Health Services 276 167 207 562 355
Construction 279 209 246 252 6
Wholesale Trade 238 211 194 197 3
Unclassified 44 71 116 120 4
Information 133 118 103 116 13
Transportation … 29 33 31 -2
Manufacturing 31 42 45 24 -21
Total 11,636 13,119 12,666 14,100 1,434
Source: DC Department of Employment Services (2016)
34 THE STATE OF GEORGETOWN 2016 REPORT
HOTELS
THE STATE OF GEORGETOWN 2016 REPORT 35
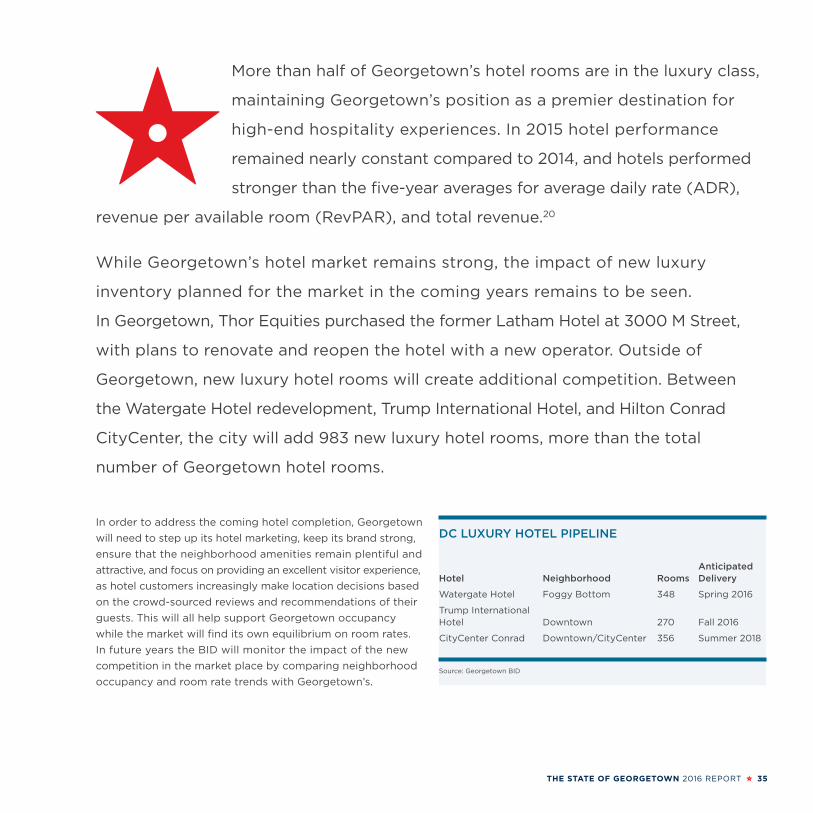
DC LUXURY HOTEL PIPELINE
AnticipatedHotel Neighborhood Rooms Delivery
Watergate Hotel Foggy Bottom 348 Spring 2016
Trump International Hotel Downtown 270 Fall 2016
CityCenter Conrad Downtown/CityCenter 356 Summer 2018
Source: Georgetown BID
More than half of Georgetown’s hotel rooms are in the luxury class,
maintaining Georgetown’s position as a premier destination for
high-end hospitality experiences. In 2015 hotel performance
remained nearly constant compared to 2014, and hotels performed
stronger than the five-year averages for average daily rate (ADR),
revenue per available room (RevPAR), and total revenue.20
While Georgetown’s hotel market remains strong, the impact of new luxury
inventory planned for the market in the coming years remains to be seen.
In Georgetown, Thor Equities purchased the former Latham Hotel at 3000 M Street,
with plans to renovate and reopen the hotel with a new operator. Outside of
Georgetown, new luxury hotel rooms will create additional competition. Between
the Watergate Hotel redevelopment, Trump International Hotel, and Hilton Conrad
CityCenter, the city will add 983 new luxury hotel rooms, more than the total
number of Georgetown hotel rooms.
In order to address the coming hotel completion, Georgetown
will need to step up its hotel marketing, keep its brand strong,
ensure that the neighborhood amenities remain plentiful and
attractive, and focus on providing an excellent visitor experience,
as hotel customers increasingly make location decisions based
on the crowd-sourced reviews and recommendations of their
guests. This will all help support Georgetown occupancy
while the market will find its own equilibrium on room rates.
In future years the BID will monitor the impact of the new
competition in the market place by comparing neighborhood
occupancy and room rate trends with Georgetown’s.
36 THE STATE OF GEORGETOWN 2016 REPORT
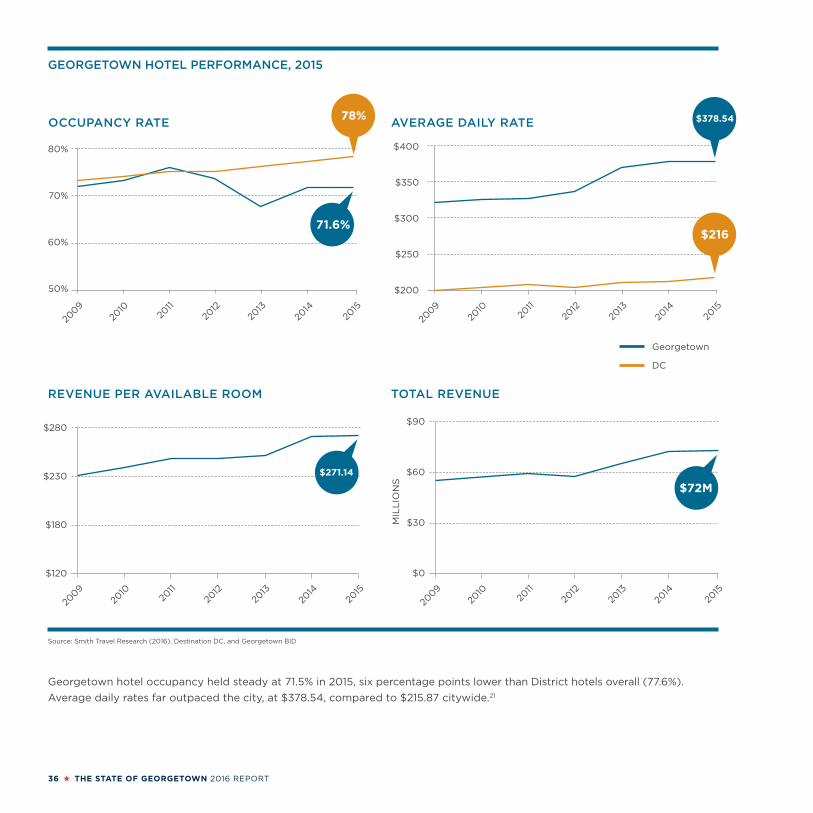
GEORGETOWN HOTEL PERFORMANCE, 2015
Source: Smith Travel Research (2016), Destination DC, and Georgetown BID
Georgetown hotel occupancy held steady at 71.5% in 2015, six percentage points lower than District hotels overall (77.6%).
Average daily rates far outpaced the city, at $378.54, compared to $215.87 citywide.21
N ST
N ST
DUMBARTON ST
O ST
O ST
P ST
P ST
VOLTA ST
Q ST
CAMBRIDGE PL
DENT PL
R ST
Q ST
R ST
DENT PL
RESERVOIR RD
PROSPECT STM ST
M ST
CADY’S ALLEY
WHITEHURST FWY
BLUES ALLEY
TH
OM
AS
JE
FF
ER
SO
N S
T
34
TH
ST
37
TH
ST
33
RD
ST
PO
TO
MA
C S
T
BA
NK
ST
31S
T S
T
30
TH
ST
29
TH
ST
28
TH
ST
27
TH
ST
32N
D S
T
35
TH
ST
36
TH
ST
WIS
CO
NSIN
AV
E
Georgetown Inn (96 rooms)
The Graham Hotel (57 rooms)
Four Seasons Hotel
Washington, DC (222 rooms)
The Capella Georgetown (49 rooms)
[became Rosewood Washington, DC in April 2016]
Ritz-Carlton (86 rooms)
Georgetown Suites (221 rooms)
POTOMAC RIVER
C&O CANAL
RO
CK
CR
EE
K P
AR
KW
AY
GEORGETOWN WATERFRONT PARK
Georgetown Suites Harbour
80%
70%
60%
50%
2009
2010
2011
2012
2013
2014
78%OCCUPANCY RATE
2015
71.6%
$400
$350
$300
$250
$200
$378.54AVERAGE DAILY RATE
$216
2009
2010
2011
2012
2013
2014
2015
$280
$230
$180
$120
REVENUE PER AVAILABLE ROOM
Georgetown
DC
2009
2010
2011
2012
2013
2014
2015
$271.14
$90
$60
$30
$0
MIL
LIO
NS
$72M
TOTAL REVENUE
2009
2010
2011
2012
2013
2014
2015

N ST
N ST
DUMBARTON ST
O ST
O ST
P ST
P ST
VOLTA ST
Q ST
CAMBRIDGE PL
DENT PL
R ST
Q ST
R ST
DENT PL
RESERVOIR RD
PROSPECT STM ST
M ST
CADY’S ALLEY
WHITEHURST FWY
BLUES ALLEY
TH
OM
AS
JE
FF
ER
SO
N S
T
34
TH
ST
37
TH
ST
33
RD
ST
PO
TO
MA
C S
T
BA
NK
ST
31S
T S
T
30
TH
ST
29
TH
ST
28
TH
ST
27
TH
ST
32N
D S
T
35
TH
ST
36
TH
ST
WIS
CO
NSIN
AV
E
Georgetown Inn (96 rooms)
The Graham Hotel (57 rooms)
Four Seasons Hotel
Washington, DC (222 rooms)
The Capella Georgetown (49 rooms)
[became Rosewood Washington, DC in April 2016]
Ritz-Carlton (86 rooms)
Georgetown Suites (221 rooms)
POTOMAC RIVER
C&O CANAL
RO
CK
CR
EE
K P
AR
KW
AY
GEORGETOWN WATERFRONT PARK
Georgetown Suites Harbour
GEORGETOWN HOTELS
Source: Source: Smith Travel Research (2016) and Georgetown BID
THE STATE OF GEORGETOWN 2016 REPORT 37
38 THE STATE OF GEORGETOWN 2016 REPORT
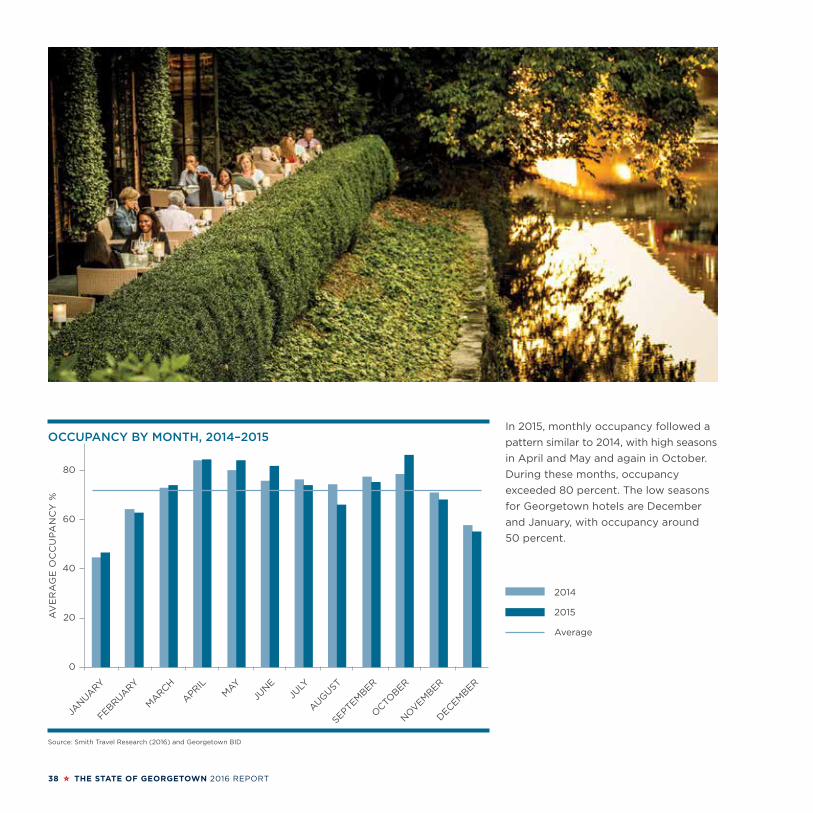
In 2015, monthly occupancy followed a
pattern similar to 2014, with high seasons
in April and May and again in October.
During these months, occupancy
exceeded 80 percent. The low seasons
for Georgetown hotels are December
and January, with occupancy around
50 percent.
OCCUPANCY BY MONTH, 2014–2015
Source: Smith Travel Research (2016) and Georgetown BID
AV
ER
AG
E O
CC
UP
AN
CY
%
JANUA
RY
FEBRUARY
MARCH
APRIL
MAY
JUNE
JULY
AUGUST
SEPTEMBER
OCTO
BER
NOVEM
BER
DECEM
BER
80
60
40
20
0
2014
2015
Average
THE STATE OF GEORGETOWN 2016 REPORT 39
40 THE STATE OF GEORGETOWN 2016 REPORT
TRANSPORTATION
THE STATE OF GEORGETOWN 2016 REPORT 41
Improving access to and within Georgetown is essential to strengthen the
retail and office markets, and enhance the visitor experience. Despite
a lack of direct Metrorail access, Georgetown is accessible by a wide
range of modes, including biking, walking, Metrobus, Circulator, and private automobile.
The BID is also working with partners in DC and Arlington County to study the
feasibility of an aerial gondola connecting the Rosslyn metro station with Georgetown,
and continues to advocate for a streetcar line to Georgetown on dedicated tracks.
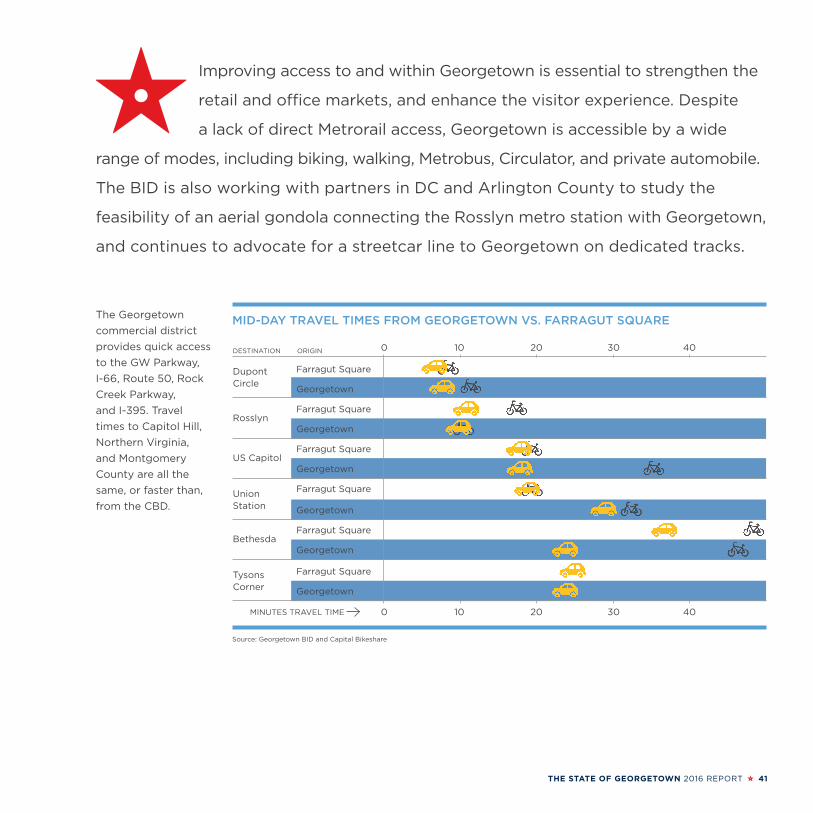
MID-DAY TRAVEL TIMES FROM GEORGETOWN VS. FARRAGUT SQUARE
Source: Georgetown BID and Capital Bikeshare
Dupont Circle
Rosslyn
US Capitol
Union Station
Bethesda
Tysons Corner
Farragut Square
Georgetown
Farragut Square
Georgetown
Farragut Square
Georgetown
Farragut Square
Georgetown
Farragut Square
Georgetown
Farragut Square
Georgetown
DESTINATION ORIGIN 0 10 20 30 40
MINUTES TRAVEL TIME 0 10 20 30 40
The Georgetown
commercial district
provides quick access
to the GW Parkway,
I-66, Route 50, Rock
Creek Parkway,
and I-395. Travel
times to Capitol Hill,
Northern Virginia,
and Montgomery
County are all the
same, or faster than,
from the CBD.
N ST
N ST
DUMBARTON ST
O ST
O ST
P ST
P ST
VOLTA ST
Q ST
CAMBRIDGE PL
DENT PL
R ST
Q ST
R ST
DENT PL
RESERVOIR RD
PROSPECT STM ST
M ST
CADY’S ALLEY
WHITEHURST FWY
BLUES ALLEY
TH
OM
AS
JE
FF
ER
SO
N S
T
34
TH
ST
37
TH
ST
33
RD
ST
PO
TO
MA
C S
T
BA
NK
ST
31S
T S
T
30
TH
ST
29
TH
ST
28
TH
ST
27
TH
ST
32N
D S
T
35
TH
ST
36
TH
ST
POTOMAC RIVER
C&O CANAL
RO
CK
CR
EE
K P
AR
KW
AY
GEORGETOWN WATERFRONT PARK
38B, D5, Rosslyn-Georgetown-Dupont
G2
G2
D1, D2, D6
31, 33, 30N
, 30S, U
nion Station-Georg
etown
WIS
CO
NSIN
AV
E
42 THE STATE OF GEORGETOWN 2016 REPORT
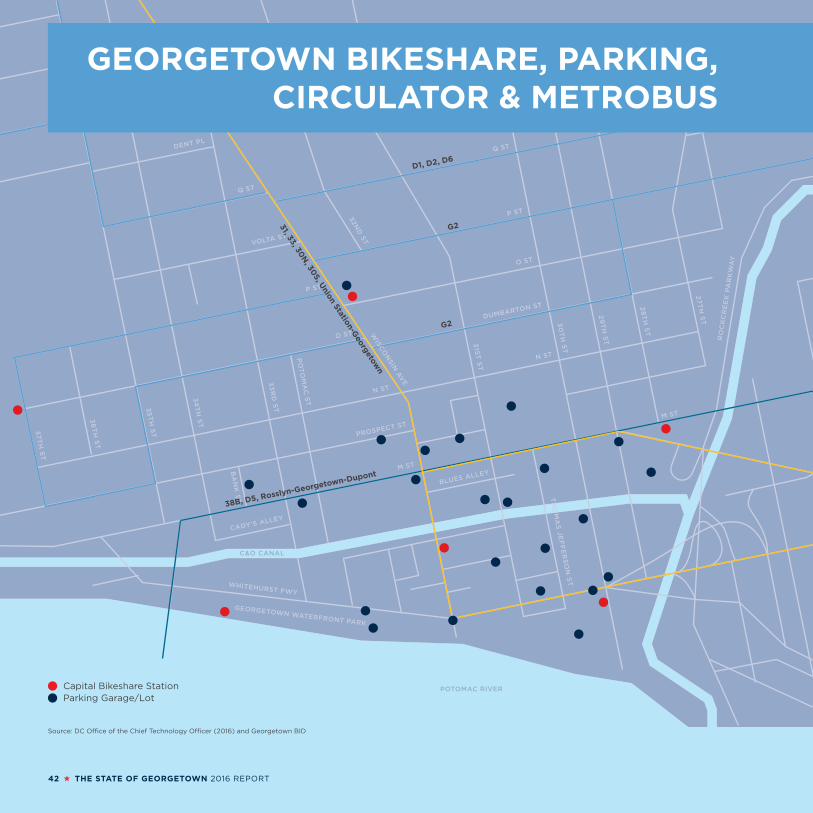
Capital Bikeshare StationParking Garage/Lot
Source: DC Office of the Chief Technology Officer (2016) and Georgetown BID
GEORGETOWN BIKESHARE, PARKING, CIRCULATOR & METROBUS

THE STATE OF GEORGETOWN 2016 REPORT 43
BICYCLING
Bicycling continues to be an important mode for visitors and
employees to travel to Georgetown. Capital Bikeshare ridership
increased for the third straight year in 2015, with 210,965 trips
to and from Georgetown’s six stations.22 In addition to Capital
Bikeshare, three major bike trails—the Capital Crescent Trail,
Rock Creek Trail, and M Street cycletrack—end in or are
immediately adjacent to Georgetown.
Of Capital Bikeshare trips ending in Georgetown, trips by
registered users increased five percent compared to 2014 and
trips by casual users and tourists increased 18%. Compared
to all other BIDs, Georgetown was one of the most popular
commercial district destinations in 2015—Georgetown had
the third highest number of casual user trips ending at
stations within the BID and the highest number of casual
user trips per station.23
BIKESHARE TRIPS TO/FROM GEORGETOWN, BY STATION, 2012–2015
Source: Capital Bikeshare (2016) and Georgetown BID
200K
150K
100K
50K
02012 2013 2014
34th & Water Street NW (Installed July 9, 2014)
37th & O Street NW/Georgetown University
C&O Canal & Wisconsin Avenue NW
Georgetown Harbor/30th Street NW
M Street & Pennsylvania Avenue NW
Wisconsin Avenue & O Street NW (Installed April 25, 2013)
2015
44 THE STATE OF GEORGETOWN 2016 REPORT
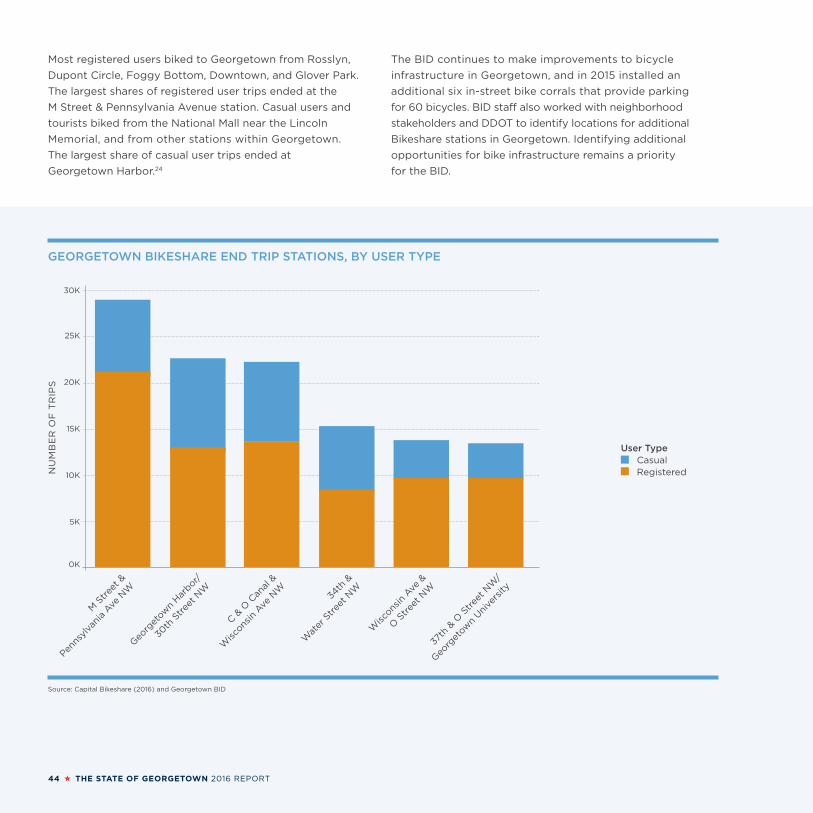
Most registered users biked to Georgetown from Rosslyn,
Dupont Circle, Foggy Bottom, Downtown, and Glover Park.
The largest shares of registered user trips ended at the
M Street & Pennsylvania Avenue station. Casual users and
tourists biked from the National Mall near the Lincoln
Memorial, and from other stations within Georgetown.
The largest share of casual user trips ended at
Georgetown Harbor.24
The BID continues to make improvements to bicycle
infrastructure in Georgetown, and in 2015 installed an
additional six in-street bike corrals that provide parking
for 60 bicycles. BID staff also worked with neighborhood
stakeholders and DDOT to identify locations for additional
Bikeshare stations in Georgetown. Identifying additional
opportunities for bike infrastructure remains a priority
for the BID.
GEORGETOWN BIKESHARE END TRIP STATIONS, BY USER TYPE
Source: Capital Bikeshare (2016) and Georgetown BID
30K
25K
20K
15K
10K
5K
0K
NU
MB
ER
OF
TR
IPS
M S
tree
t &
Penns
ylva
nia
Ave N
W
Geo
rget
own
Har
bor/
30th
Stree
t NW
C & O
Can
al &
Wisco
nsin
Ave
NW
34th
&
Wat
er S
tree
t NW
Wisco
nsin
Ave
&
O S
tree
t NW
37th
& O
Stree
t NW
/
Geo
rget
own
Uni
vers
ity
User Type Casual Registered
THE STATE OF GEORGETOWN 2016 REPORT 45
User Type Casual Registered
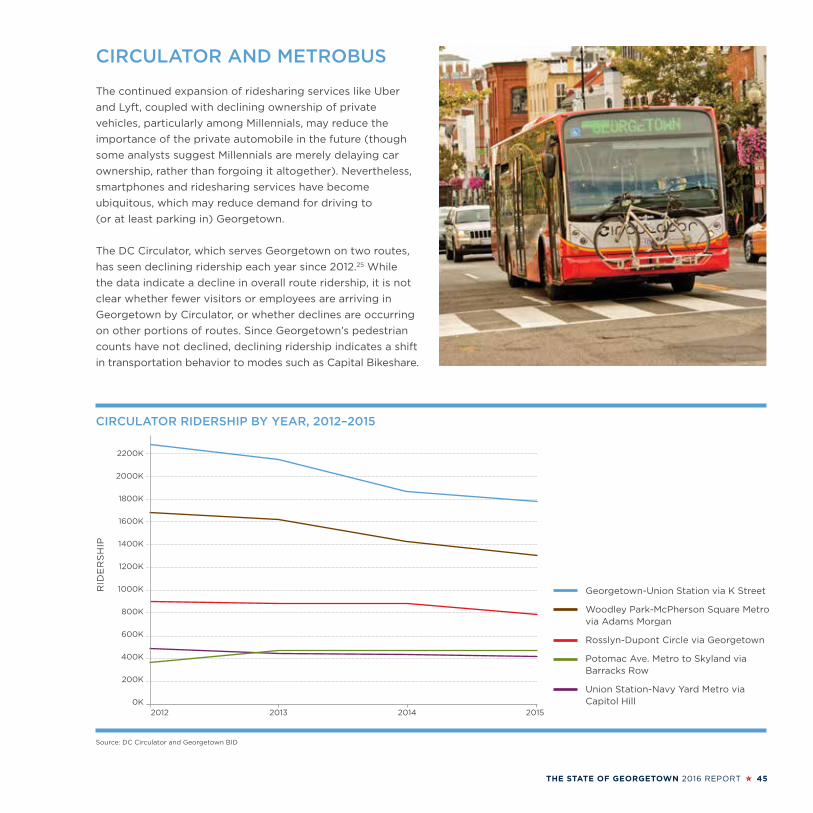
CIRCULATOR AND METROBUS
The continued expansion of ridesharing services like Uber
and Lyft, coupled with declining ownership of private
vehicles, particularly among Millennials, may reduce the
importance of the private automobile in the future (though
some analysts suggest Millennials are merely delaying car
ownership, rather than forgoing it altogether). Nevertheless,
smartphones and ridesharing services have become
ubiquitous, which may reduce demand for driving to
(or at least parking in) Georgetown.
The DC Circulator, which serves Georgetown on two routes,
has seen declining ridership each year since 2012.25 While
the data indicate a decline in overall route ridership, it is not
clear whether fewer visitors or employees are arriving in
Georgetown by Circulator, or whether declines are occurring
on other portions of routes. Since Georgetown’s pedestrian
counts have not declined, declining ridership indicates a shift
in transportation behavior to modes such as Capital Bikeshare.
CIRCULATOR RIDERSHIP BY YEAR, 2012–2015
Source: DC Circulator and Georgetown BID
Georgetown-Union Station via K Street
Woodley Park-McPherson Square Metro via Adams Morgan
Rosslyn-Dupont Circle via Georgetown
Potomac Ave. Metro to Skyland via Barracks Row
Union Station-Navy Yard Metro via Capitol Hill
2200K
2000K
1800K
1600K
1400K
1200K
1000K
800K
600K
400K
200K
0K
RID
ER
SH
IP
2012 2013 2014 2015

46 THE STATE OF GEORGETOWN 2016 REPORT
Metrobus ridership data indicate that approximately 3,000
people board buses in Georgetown on an average weekday
and a similar number disembark. The most popular routes
serving the commercial district are the 38B, 31, and 33.26 Since
Georgetown does not have a metro station, these routes are
critical because they connect Georgetown with the Rosslyn
and Foggy Bottom metro stations and downtown, and serve
significant population centers in Arlington and the Wisconsin
Avenue corridor. Heavy ridership on the 38B provides
further evidence in support of an aerial gondola connecting
Georgetown and Rosslyn.
Metrorail ridership has declined overall from 2011–2015,
likely due in part to continued maintenance and rebuilding,
and ridership at the Foggy Bottom and Rosslyn stations, the
two closest stations to Georgetown, have declined as well.
Along with declining Circulator ridership, these data indicate
a recent shift in transportation patterns among employees
and visitors.
GEORGETOWN METROBUS RIDERSHIP BY MOST HEAVILY-USED ROUTES
BOARDING ALIGHTING
Route Direction Destination Weekday Saturday Sunday Weekday Saturday Sunday
38B East Farragut Square 248 121 93 501 291 222
38B West Ballston 538 352 292 155 87 74
31 North Friendship Heights 423 382 235 138 97 68
31 South Potomac Park 176 129 67 336 299 203
33 North Friendship Heights 418 295 249 175 129 77
33 South Archives 213 161 104 345 295 224
2238 1900 1380 1907 1686 1213
Source: WMATA Ridecheck Plus, 2015 data; note: all data are averages
METRORAIL RIDERSHIP, 2011–2015
Route 2011 2012 2013 2014 2015
System Wide 743,961 744,918 725,770 721,804 712,843
Foggy Bottom 21,318 22,827 22,512 22,053 21,462
Rosslyn 17,158 16,718 15,632 15,460 14,815
METRORAIL AVERAGE DAILY BOARDINGS, 2011–2015
Source: WMATA 2015 Historical Metrorail Ridership
RID
ER
SH
IP
800K
700K
600K
2011 2012 2013 2014 2015
25K
20K
15K
2011 2012 2013 2014 2015
System Wide
Foggy Bottom
Rosslyn

THE STATE OF GEORGETOWN 2016 REPORT 47
WHERE GEORGETOWN BID AREA EMPLOYEES LIVE
Source: US Census Bureau (2016), OnTheMap application, 2014 data
WHERE GEORGETOWN RESIDENTS WORK
Source: US Census Bureau (2016), OnTheMap application, 2014 data
Understanding the travel patterns of residents and employees
is essential for understanding and improving Georgetown’s
transportation needs. 60% of Georgetown residents work in
the District, mostly within Georgetown, West End, Downtown,
and the East End. Employees who work within the BID are
split evenly among the District, Virginia, and Maryland, with
approximately one-third of area employees living in each.
Among District residents, the largest concentrations live in
Georgetown and Glover Park. Other dense pockets include
Dupont Circle, Logan Circle, Mount Pleasant/Columbia
Heights, Shaw, and NoMa.27

48 THE STATE OF GEORGETOWN 2016 REPORT

Endnotes:1 Washington, DC Economic Partnership Development Report
2015–2016
2 Esri Business Analyst Online (2016)
3 Ibid
4 US Census Bureau, Estimates of Population Change and Rankings, 2015 data
5 Esri Business Analyst Online (2016). Note: For the purposes of this estimate, “Georgetown” is defined as DC Census Tracts 1, 2.01, and 2.02 in the 2010 US Census. These tracts cover the area south of Whitehaven Street to the Potomac River. To the west, the area is bounded by 35th Street until Reservoir Road, and then by the western border of Georgetown University, which is included. To the east, the area is bounded by Rock Creek.
6 Washington, DC Economic Partnership Development Report 2015–2016
7 Buxton (2015)
8 Buxton (2015) and Georgetown BID
9 Ibid
10 CoStar (2016)
11 Dochter & Alexander Q3 2015 Retail Market Report
12 Streetsense (2014)
13 Washington, DC Economic Partnership Development Report 2015–2016
14 CoStar (2016)
15 Ibid
16 Ibid
17 DC Department of Employment Services, Q3 2015 data from the Quarterly Census of Employment and Wages
18 Georgetown University in the District of Columbia (2015) and personal correspondence
19 DC Department of Employment Services
20 Smith Travel Research (2016)
21 Destination DC (2016)
22 Capital Bikeshare, 2015 trip history data
23 Ibid
24 Ibid
25 DC Circulator Ridership Data, 2012–2015
26 WMATA Ridecheck Plus, 2015 data
27 US Census Bureau, OnTheMap Application, 2014 data
Notes:Unless otherwise noted, “Georgetown” is defined for statistical purposes as 2010 DC Census Tracts 1, 2.01, and 2.02. These tracts cover the area south of Whitehaven Street to the Potomac River. To the west, the area is bounded by 35th Street until Reservoir Road, and then by the western border of Georgetown University (which is included). To the east, the area is bounded by Rock Creek. For a detailed map, refer to: http://www.census.gov/geo/www/maps/pl10_map_suite/tract.html.
The “Georgetown BID area” is comprised of the commercial corridors along Wisconsin Avenue (between M Street and R Street) and M Street (between 27th Street and 37th Street, and inclusive of the commercial areas of Prospect Street) as well as the commercial areas south of M Street to the Potomac River. For the statistical analysis in this report, BID staff used a contiguous geo-spatial boundary derived from GIS shape files available from the DC Office of the Chief Technology Officer (data.octo.dc.gov). This is the fourth State of Georgetown report undertaken by the Georgetown BID. The BID intends to publish this report annually, using data from each volume as benchmarks and monitors of progress against which the future health of the neighborhood economy will be measured. The staff welcomes comments and suggestions on how to improve and expand this report to be most useful to its readers. Please direct comments to Jamie Scott, economic development manager, at [email protected].
While all data in this publication was produced by the BID or obtained from the sources cited, the BID does not guarantee the accuracy of the data included in this publication; the staff welcomes opportunities and partnerships to refine available data.
BID Staff:
Jamie Scott, lead author
Joe Sternlieb, CEO
Maggie Downing, Sherman Gardner, Will Handsfield, Nancy Miyahira, Terrie Rouse (Georgetown Heritage), Annelies van Vonno, John Wiebenson, Ted Williford, Debbie Young
Design: Fuszion
Photography: Sam Kittner for the Georgetown BID, except page 7 photo by James Jackson, courtesy Chaia; page 34 photo courtesy The Graham Hotel; page 39 photo courtesy The Four Seasons Hotel Washington, DC.
Special thanks to Eric Brown (Buxton), John Kangethe (DOES), Kim Lucas (DDOT), Greg McFarland (WMATA), Chad Shuskey (Washington DC Economic Partnership), Michelle Tierney (Rosslyn BID), Kate Thompson (Destination DC), and Ric Wise (BLS).
GEORGETOWN BUSINESS IMPROVEMENT DISTRICT1000 Potomac St., NW | Suite 122Washington, D.C. 20007T: 202.298.9222 x208 | F: [email protected]