Embed Size (px)
Citation preview

6/26/2012
1
State of Biomedical Innovation Conference
The Brookings InstitutionJune 27, 2012

6/26/2012
2
………………………………………………………….……………………….….……
The Brookings Institution
Mark Deem
June 27, 2012………………………………………………………….……………………..…………
[ c o n f I d e n t I a l ]

6/26/2012
3
Metrics to Gauge Health Care Ecosystem
For health care startups the top issues are:p p
• Financing
• FDA
Patents• Patents
• Burn rate
– Driven by head count
Bi t i bl i l th f li i l t i l
[ c o n f I d e n t I a l ]
– Biggest variable is length of clinical trial

6/26/2012
4
Financing – New Starts and Confidence are Key
New Medical Device Deals *
[ c o n f I d e n t I a l ]* NVCA Money Tree data

6/26/2012
5
Financing – Forward Looking Expectations
[ c o n f I d e n t I a l ]
Source: National VentureCapital Association
6/26/2012
6
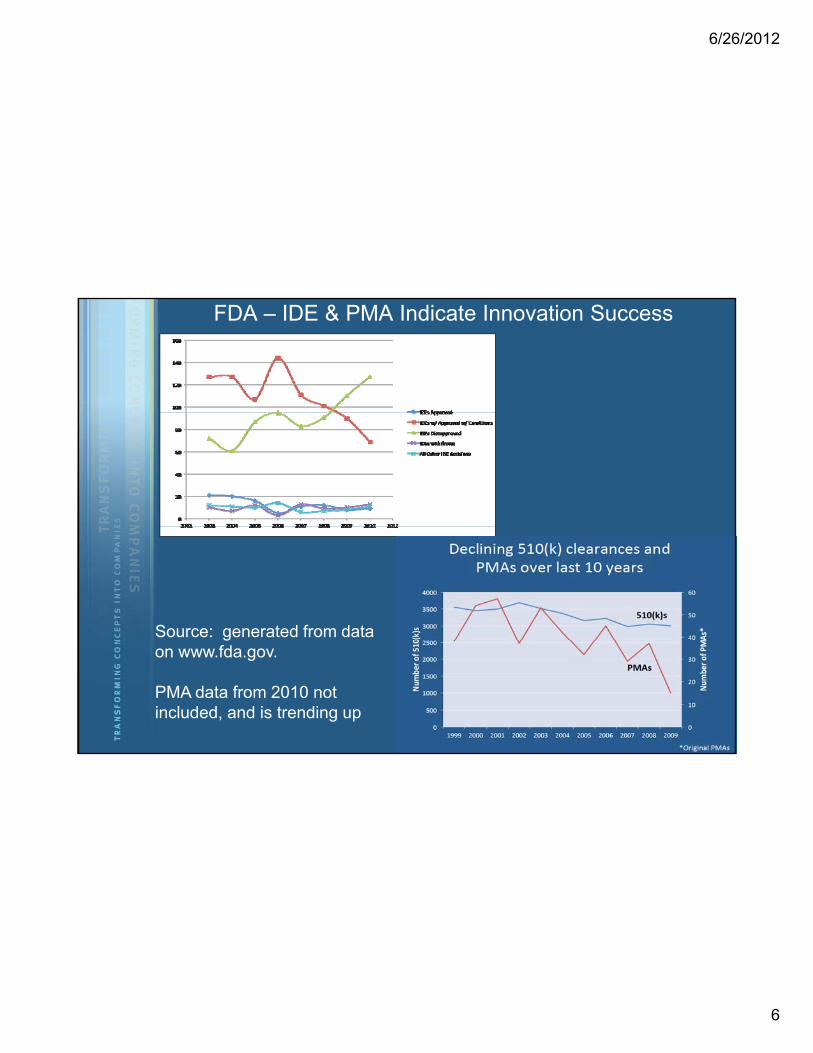
FDA – IDE & PMA Indicate Innovation Success
Source: generated from data
[ c o n f I d e n t I a l ]
gon www.fda.gov.
PMA data from 2010 not included, and is trending up

6/26/2012
7
PTO – Issuance and Pendency
• Pendency decreasing, even as # filings increases
• Quality measures (not shown)Quality measures (not shown) key, and are up
• Inflection point = Kappos appointment
[ c o n f I d e n t I a l ]Source: www.uspto.gov
6/26/2012
8
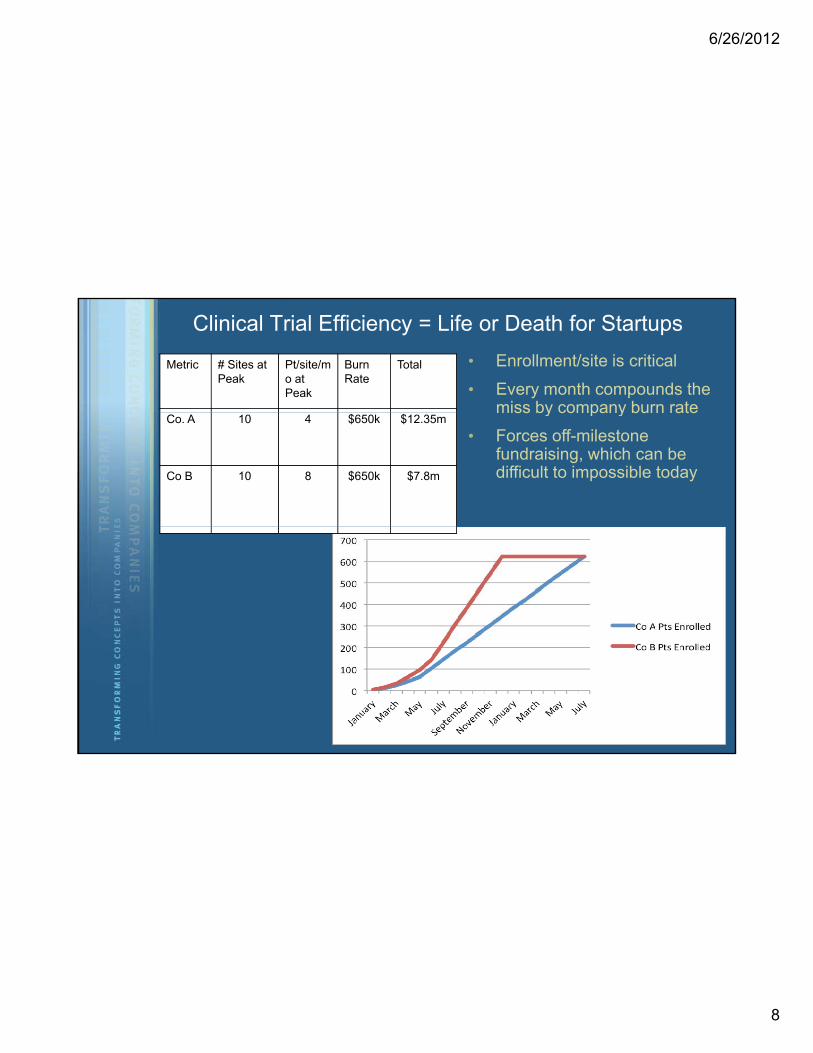
Clinical Trial Efficiency = Life or Death for Startups
• Enrollment/site is critical
• Every month compounds the miss by company burn rate
Metric # Sites at Peak
Pt/site/mo at Peak
Burn Rate
Total
miss by company burn rate
• Forces off-milestone fundraising, which can be difficult to impossible today
Co. A 10 4 $650k $12.35m
Co B 10 8 $650k $7.8m
[ c o n f I d e n t I a l ]

6/26/2012
9
………………………………………………………….……………………….….……
“…the quintessential incubator…“
- David Cassak, Windhover
………………………………………………………….……………………..…………
[ c o n f I d e n t I a l ]

6/26/2012
10
Measuring The Health of the U.S. Bi di l I ti E t iBiomedical Innovation Enterprise
A Venture Investor’s Perspective
Presentation at the Brookings Institution“State of Biomedical Innovation” Conference
June 27, 2012
Jonathan S. Leff
Warburg Pincus LLC

6/26/2012
11
Biopharma Innovation Is In Crisis
Biopharma R&D ProductivityBiopharma R&D Productivity
• “Eroom’s Law”: R&D productivity has roughly halved every 9 years for the last 6 decades!
80 d i d ti it
100
No. of New Drugs Approved per $BN of R&D Spending
– 80x decrease in productivity
• Driven by escalating TIME and COST of drug development
− Probability of success has remained roughly constant
10
1.0
0.11950 1960 1970 1980 1990 2000 2010
Source: Scannell et. al, Nature Reviews Drug Discovery 11, 191‐200 (March 2012).
6/26/2012
12
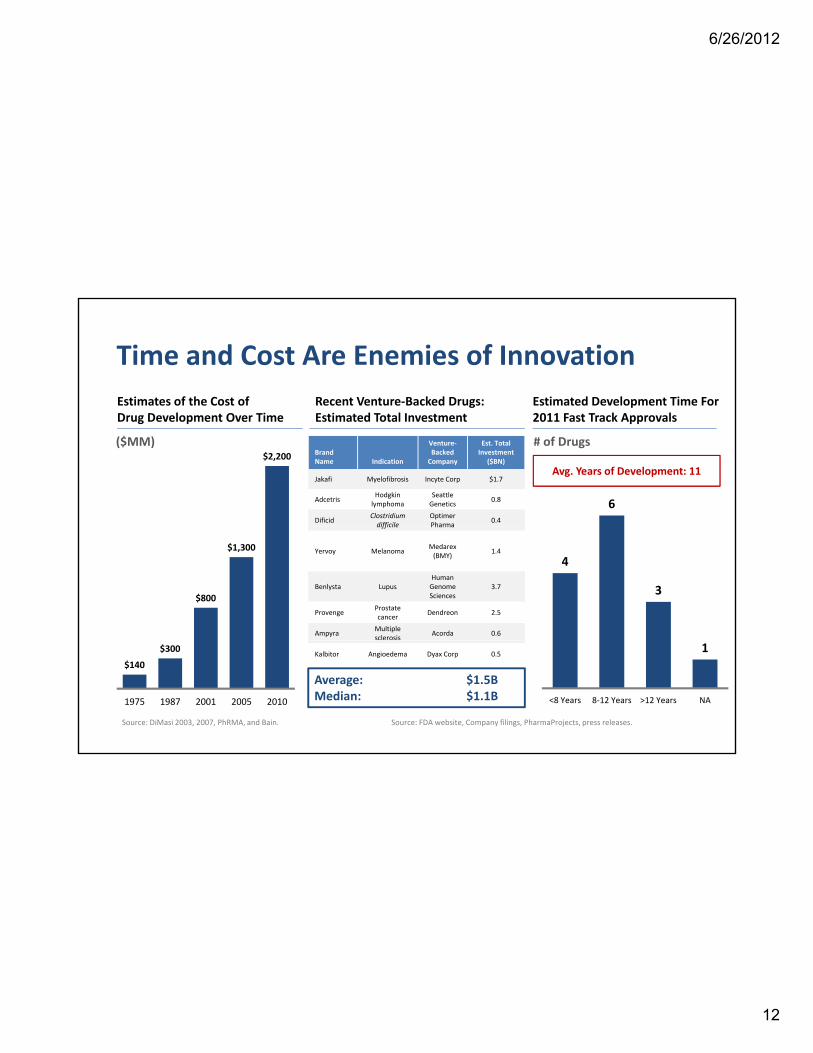
Time and Cost Are Enemies of Innovation
Recent Venture‐Backed Drugs:Estimates of the Cost of Estimated Development Time For Estimated Total Investment
$2,200
Drug Development Over Time
BrandName Indication
Venture‐Backed Company
Est. Total Investment
($BN)
Jakafi Myelofibrosis Incyte Corp $1.7
AdcetrisHodgkin lymphoma
Seattle Genetics
0.8
DificidClostridium difficile
Optimer Pharma
0.4
# of Drugs
6
Avg. Years of Development: 11
2011 Fast Track Approvals
($MM)
$800
$1,300
difficile Pharma
Yervoy MelanomaMedarex(BMY)
1.4
Benlysta LupusHuman Genome Sciences
3.7
ProvengeProstate cancer
Dendreon 2.5
AmpyraMultiple sclerosis
Acorda 0.6
4
3
Source: DiMasi 2003, 2007, PhRMA, and Bain. Source: FDA website, Company filings, PharmaProjects, press releases.
$140
$300
1975 1987 2001 2005 2010
Kalbitor Angioedema Dyax Corp 0.5
Average: $1.5BMedian: $1.1B
1
<8 Years 8‐12 Years >12 Years NA

6/26/2012
13
Return on Investment in Biopharma Innovation Is Declining
”Pharmaceuticals: Exit Research and Create Value”– Morgan Stanley 2010
Return on R&D Investment for
“At some point, your shareholders and stakeholders demand you have a return on investment in research.”
– Ian Reed, CEO of Pfizer, 2011
“[S]ome investors…believe that what we do in R&D is actually value destroying…”
– Chris Viehbacher, CEO of Sanofi, 2011
Morgan Stanley, 2010
14‐15%13‐14%
Top 10 Pharmas
8‐9%
4‐5%
“I’m absolutely convinced this will be the last generation of R&D spending unless a decent return is generated. The
industry will not go forward another ten years spending the money it has been spending unless returns to investors are dramatically greater…or R&D will be cut, and it will be cut
significantly.”– David Redfern, Chief Strategy Officer, GlaxoSmithKline,
2011
1991–1995 1996–2000 2001–2005 2006–2010
Source: McKinsey.
“At a time when the world desperately needs more medicines for everything from influenza to Alzheimer’s
disease, our industry is taking too long, we’re spending too much, and we’re producing far too little.”– John Lechleiter, CEO of Eli Lilly, 2011

6/26/2012
14
Venture Capital Fuels the Development of Most Innovative New Drugs12 of 14 Fast Track Drugs Approved in 2011 Were Venture‐Backed
Name Indication SponsorVenture‐Backed
Innovator
Adcetris (brentuximab vedotin) Hodgkin lymphoma (HL) Seattle Genetics Seattle Genetics
Benlysta (belimumab) Lupus Human Genome Sciences Human Genome Sciences
Dificid (fidaxomicin) Clostridium difficile-associated diarrhea Optimer Pharma Optimer Pharma
Erwinaze (asparaginase erwinia chrysanthemi)
Acute Lymphoblastic Leukemia (ALL) EUSA Pharma EUSA Pharma
Name Indication SponsorVenture‐Backed
Innovator
Adcetris (brentuximab vedotin) Hodgkin lymphoma (HL) Seattle Genetics Seattle Genetics
Benlysta (belimumab) Lupus Human Genome Sciences Human Genome Sciences
Dificid (fidaxomicin) Clostridium difficile-associated diarrhea Optimer Pharma Optimer Pharma
Erwinaze (asparaginase erwinia chrysanthemi)
Acute Lymphoblastic Leukemia (ALL) EUSA Pharma EUSA Pharmachrysanthemi)
Ferriprox (deferiprone) Iron overload due to Thalassemia syndrome ApoPharma BTG plc
Firazyr (icatibant acetate) Hereditary angioedema (HAE) Shire Human Genetic Therapies Jerini
Incivek (telaprevir) Chronic hepatitis C Vertex Pharma Vertex Pharma
Jakafi (ruxolitinib) Myelofibrosis Incyte Corp Incyte Corp
Victrelis (boceprevir) Chronic hepatitis C Schering (Merck) Corvas
Xalkori (crizotinib) Non-small cell lung cancer (NSCLC) Pfizer Sugen
chrysanthemi)
Ferriprox (deferiprone) Iron overload due to Thalassemia syndrome ApoPharma BTG plc
Firazyr (icatibant acetate) Hereditary angioedema (HAE) Shire Human Genetic Therapies Jerini
Incivek (telaprevir) Chronic hepatitis C Vertex Pharma Vertex Pharma
Jakafi (ruxolitinib) Myelofibrosis Incyte Corp Incyte Corp
Victrelis (boceprevir) Chronic hepatitis C Schering (Merck) Corvas
Xalkori (crizotinib) Non-small cell lung cancer (NSCLC) Pfizer Sugen
Yervoy (ipilimumab) Melanoma Bristol Myers Squibb Medarex
Zelboraf (vemurafenib) Melanoma Genentech Plexxikon
Caprelsa (vandetanib) Medullary thyroid cancer AstraZeneca N/A
Nulojix (betacept) Organ rejection prophylaxis Bristol Myers Squibb N/A
Yervoy (ipilimumab) Melanoma Bristol Myers Squibb Medarex
Zelboraf (vemurafenib) Melanoma Genentech Plexxikon
Caprelsa (vandetanib) Medullary thyroid cancer AstraZeneca N/A
Nulojix (betacept) Organ rejection prophylaxis Bristol Myers Squibb N/A
6/26/2012
15
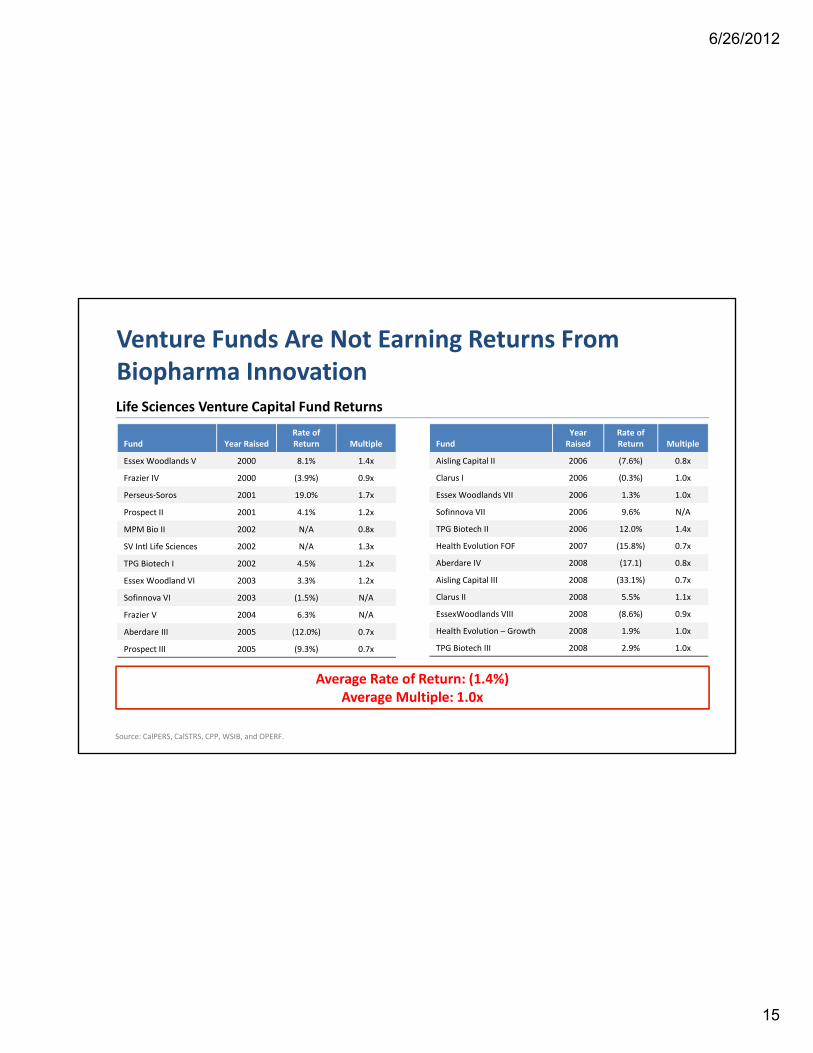
Venture Funds Are Not Earning Returns From Biopharma InnovationLife Sciences Venture Capital Fund Returnsp
Fund Year RaisedRate of Return Multiple
Essex Woodlands V 2000 8.1% 1.4x
Frazier IV 2000 (3.9%) 0.9x
Perseus‐Soros 2001 19.0% 1.7x
Prospect II 2001 4.1% 1.2x
i 2002 / 0 8
FundYear Raised
Rate of Return Multiple
Aisling Capital II 2006 (7.6%) 0.8x
Clarus I 2006 (0.3%) 1.0x
Essex Woodlands VII 2006 1.3% 1.0x
Sofinnova VII 2006 9.6% N/A
TPG Bi h II 2006 12 0% 1 4MPM Bio II 2002 N/A 0.8x
SV Intl Life Sciences 2002 N/A 1.3x
TPG Biotech I 2002 4.5% 1.2x
Essex Woodland VI 2003 3.3% 1.2x
Sofinnova VI 2003 (1.5%) N/A
Frazier V 2004 6.3% N/A
Aberdare III 2005 (12.0%) 0.7x
TPG Biotech II 2006 12.0% 1.4x
Health Evolution FOF 2007 (15.8%) 0.7x
Aberdare IV 2008 (17.1) 0.8x
Aisling Capital III 2008 (33.1%) 0.7x
Clarus II 2008 5.5% 1.1x
EssexWoodlands VIII 2008 (8.6%) 0.9x
Health Evolution – Growth 2008 1.9% 1.0x
Prospect III 2005 (9.3%) 0.7x
Source: CalPERS, CalSTRS, CPP, WSIB, and OPERF.
Average Rate of Return: (1.4%)Average Multiple: 1.0x
TPG Biotech III 2008 2.9% 1.0x
6/26/2012
16
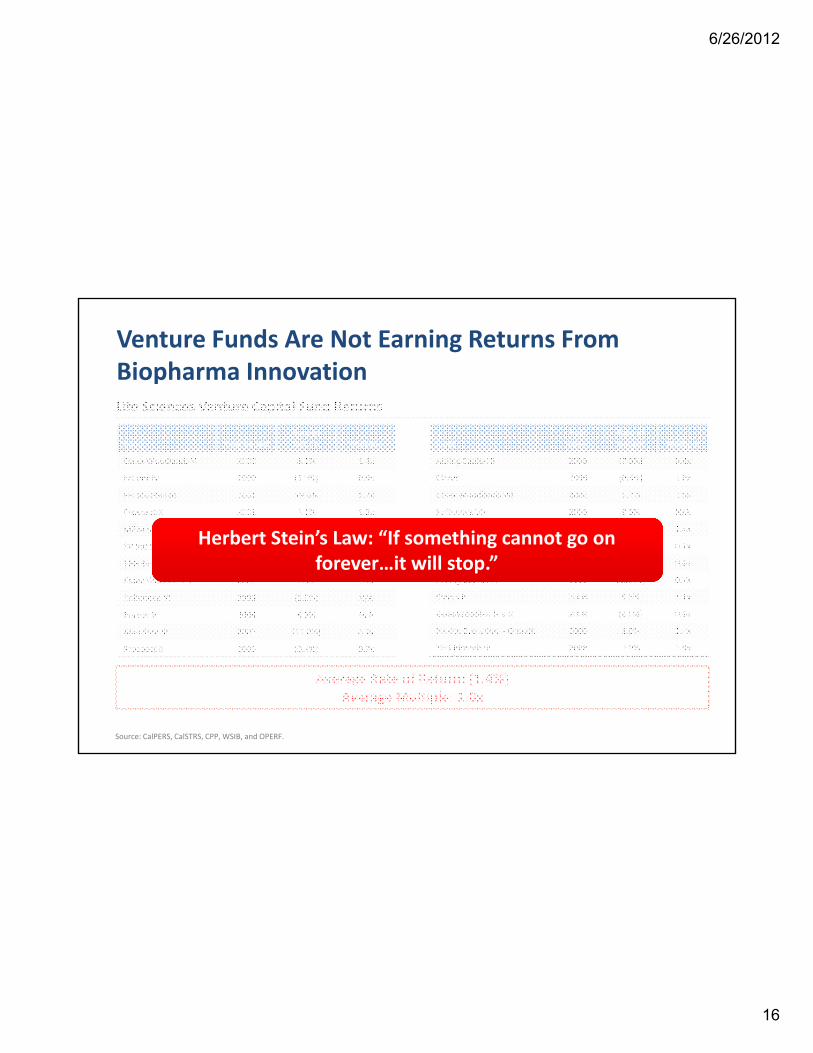
Venture Funds Are Not Earning Returns From Biopharma InnovationLife Sciences Venture Capital Fund Returnsp
Fund Year RaisedRate of Return Multiple
Essex Woodlands V 2000 8.1% 1.4x
Frazier IV 2000 (3.9%) 0.9x
Perseus‐Soros 2001 19.0% 1.7x
Prospect II 2001 4.1% 1.2x
i 2002 / 0 8
FundYear Raised
Rate of Return Multiple
Aisling Capital II 2006 (7.6%) 0.8x
Clarus I 2006 (0.3%) 1.0x
Essex Woodlands VII 2006 1.3% 1.0x
Sofinnova VII 2006 9.6% N/A
TPG Bi h II 2006 12 0% 1 4MPM Bio II 2002 N/A 0.8x
SV Intl Life Sciences 2002 N/A 1.3x
TPG Biotech I 2002 4.5% 1.2x
Essex Woodland VI 2003 3.3% 1.2x
Sofinnova VI 2003 (1.5%) N/A
Frazier V 2004 6.3% N/A
Aberdare III 2005 (12.0%) 0.7x
TPG Biotech II 2006 12.0% 1.4x
Health Evolution FOF 2007 (15.8%) 0.7x
Aberdare IV 2008 (17.1) 0.8x
Aisling Capital III 2008 (33.1%) 0.7x
Clarus II 2008 5.5% 1.1x
EssexWoodlands VIII 2008 (8.6%) 0.9x
Health Evolution – Growth 2008 1.9% 1.0x
Herbert Stein’s Law: “If something cannot go on forever…it will stop.”
Prospect III 2005 (9.3%) 0.7x
Source: CalPERS, CalSTRS, CPP, WSIB, and OPERF.
Average Rate of Return: (1.4%)Average Multiple: 1.0x
TPG Biotech III 2008 2.9% 1.0x

6/26/2012
17
Venture Firms Are Pulling Out of Life Sciences Investing
Prospect Venture Partners Unable To Raise New Fund
“Health‐care specialists … struggle to find viable models for investing in biotechnology …”
– Dow Jones
(January 2012)
“In the last four years our companies have filed 7 NDA’s –
Scale Venture Partners Exits Life Sciences Investing
In the last four years, our companies have filed 7 NDA s something we are proud of. Unfortunately, they took longer and
used more capital than planned from the start.”
– Kate Mitchell, Scale Venture Partners
(Scale Venture Partners Blog, November 2011)
“The more sophisticated LPs are concerned with the regulatoryProviders of Capital
(“Limited Partners” or “LPs”) Questioning The Merits of Life Sciences
Investing
“The more sophisticated LPs are concerned with the regulatory environment and the ever‐increasing cost of clinical trials. The cost
burden has gone no place but up.”
– Michael Powell, Ph.D., Sofinnova Ventures
(BioCentury Interview ‐ October 2011)

6/26/2012
18
Venture Capital Investment In Life Sciences Innovation Is Under Serious Pressure…
Lif S i C i Fi t Ti F diLife Sciences Companies First‐Time Fundings
270 263245
189Lowest Quarterly Level Since 1995
Lowest Annual Level Since 1996
158 157
100
Source: NVCA/PWC MoneyTree report.
2006 2007 2008 2009 2010 2011 Q1 2012 Annualized

6/26/2012
19
…And Venture Capitalists Expect to Continue to Pull Back
NVCA S f Lif S i V t C it l I t (O t b 2011)NVCA Survey of Life Sciences Venture Capital Investors (October 2011)
Past 3 Years Change in BiopharmaInvestment
Next 3 Years Expected Change in Biopharma Investment
14%
% of Respondents
15%
% of Respondents
14%
Increased
15%
Increased
41%Decreased
40%Decreased

6/26/2012
20
Reduced Investment Appears To Be Taking A Toll on New Clinical Trial Starts
I d d T d i N D E t i E h Ph f D l tIndexed Trend in New Drugs Entering Each Phase of Development
PHASE I PHASE II PHASE III
100
54
100
70
100
53
Source: CMR 2012 Pharmaceutical R&D Fact Book, Thomson Reuters.
2007 2008 2009 2010 2011 2007 2008 2009 2010 2011 2007 2008 2009 2010 2011

6/26/2012
21
Annual State of Biomedical Innovation
Henry GrabowskiDuke University
Brookings Institution ConferenceJune 27 2012June 27, 2012

6/26/2012
22
Trends in Fully Allocated Capitalized Cost per Approved Drug
802900
336
466
318
802
400
500
600
700
800
900
ns
of
2000
$
84
214
54104 138
3 8
0
100
200
300
Millio
n
Preclinical Clinical Total
1970s approvals 1980s approvals 1990s approvals
Source: DiMasi et al., J Health Economics 2003;22(2):151-185

6/26/2012
23
Why is R&D Process for New Drugs so Long and Costly?
Scientific, regulatory, and commercial uncertainties
Management of the R&D process is highly variable
Multiple testing phases involving 1000s of subjectsp g p g j
Most new drug candidates fail to reach the market

6/26/2012
24
Number of Drug Candidates Required to Achieve One Approved Compound
3
4
5
1
2
3
0Phase I Phase II Phase III FDA Approval
Source: DiMasi et al., J Health Economics 2003;22(2):151-185

6/26/2012
25
R&D Costs per New Drug Approval Determinant Factors - Clinical Phase
• Probability of success
• Number of subjects
• Clinical trial complexityC ca a co p e y
• Input prices
• Clinical trial length
C t f C it l• Cost of Capital

6/26/2012
26
Quality Output Measures of NMEs
• Priority versus standard FDA approvals• Priority versus standard FDA approvals
• First in class <new mechanism of action>
• Significant advance in existing class
• Consensus or global NMEs
• Weighting FDA approvals by sales
t t it ti−patent citations
−medical articles, citations, etc.

6/26/2012
27
State of Biomedical Innovation Conference
26The Use of Medicines in the United States: Review of 2011Report by the IMS Institute for Healthcare Informatics
Murray Aitken
Executive Director

6/26/2012
28
More new medicines were launched in 2011 than in the past decade
N M l l E titi L h d i th US 2002 2011
TRANSFORMATIONS IN DISEASE TREATMENT
57
6
3 6
8 177
13
New Molecular Entities Launched in the US, 2002-2011
13 15 12 11 106 6 7 8 9
35
5 4 9
5 6 79
126
6 6
2002 2003 2004 2005 2006 2007 2008 2009 2010 2011
New Mechanism Orphan Existing Mechanism
27The Use of Medicines in the United States: Review of 2011Report by the IMS Institute for Healthcare Informatics
New Mechanism Orphan Existing Mechanism
Source: IMS Institute for Healthcare Informatics, 2011

6/26/2012
29
State of Biomedical Innovation Conference
Audience Q&A