Embed Size (px)
Citation preview

G. Comer Foundation
State of Antarctic and Greenland Ice Sheet Mass Balance and Ice-
Sheet ModelingRichard B. Alley, Penn StatePlease note: I work for
Penn State University,And help UN IPCC, NRC, etc.,But I am not representing them,Just me.
****AAAS, Chicago, 2009****
Photo by R.B. Alley, Scoresby Sund

No agreed-upon worst case; maybe 3-4x this rise? Don’t believe this could happen faster than centuries, but we might in decades reach the level that would commit us to this over centuries. Generally NOT in cost/benefit projections.
Why care about ice sheets?

CO2 in atmosphere has followed IPCC-linked projections closely.
Temperature rise has been a bit larger than central projections, but well within error bars.
Sea-level rise has been well above central projections, and barely within error bars.
Rahmstorf et al., Science, 2007

IPCC on Ice Sheets• 2001: Noted large uncertainties, but suggested
central estimate of slight net growth over next century, with snowfall increase in cold parts exceeding melting increase in warmer parts, and with little ice-flow change
• 2007: Ice sheets now shrinking, in part because of ice-flow change in response to warming
• “Models used to date do not include…the full effects of changes in ice sheet flow, because a basis in published literature is lacking…understanding of these effects is too limited to… provide a best estimate or an upper bound for sea level rise.” (IPCC WG1 AR4 SPM 2007)

Model-based projections of global average sea level rise at the end of the 21st century (2090-2099) are shown in Table SPM-3. For each scenario, the midpoint of the range in Table SPM-3 is within 10% of the TAR model average for 2090-2099. The ranges are narrower than in the TAR mainly because of improved information about some uncertainties in the projected contributions15. {10.6}15 TAR projections were made for 2100, whereas projections in this Report are for 2090-2099. The TAR would have had similar ranges to those in Table SPM-2 if it had treated the uncertainties in the same way. [p. 15]

Model-based projections of global average sea level rise at the end of the 21st century (2090-2099) are shown in Table SPM-3. For each scenario, the midpoint of the range in Table SPM-3 is within 10% of the TAR model average for 2090-2099. The ranges are narrower than in the TAR mainly because of improved information about some uncertainties in the projected contributions15. {10.6}15 TAR projections were made for 2100, whereas projections in this Report are for 2090-2099. The TAR would have had similar ranges to those in Table SPM-2 if it had treated the uncertainties in the same way. [p. 15]

Merged S & W Greenland coastal temperatures infilled, Ilulissat, Nuuk and Qaqortoq. Vinther, B.M., K.K. Andersen, P.D. Jones, K.R. Briffa and J. Cappelen, Extending Greenland Temperature Records into the late 18th Century, JGR, 111, D11105. http://www.cru.uea.ac.uk/cru/data/greenland/swgreenlandave.dat) B=Box+ 2006; C=Chen+ 2006; Cz=Cazenave+ 2008; H=Hanna+ 2005; I=IPCC 2007L=Luthcke+ 2006; T=Thomas+ 2006; Z=Zwally+ 2006; R (dashed)=Rignot+Kanagaratnam 2006; R (solid)=Rignot+ 2008 S=Shepherd+ 2007; RL=Ramillien+ 2006; V=Velicogna+Wahr 2005; W=Wouters+ 2008
tan+orange=snowfall-melt-assumed discharge; green+violet primarily altimetry; red=snowfall-melt-discharge; dark blue=GRACE; light blue=assessment; updated from Alley et al., 2007

Greenland ice sheet has**grown with cooling;**shrunk with warming;**disappeared when too warm.
US Govt. CCSP SAP 1.2, ch. 6;Published electronically Jan., 2009.Marine Isotope Stages shown in black, approximate ages in red.
20 ka140 ka?
0 ka5 ka
130 ka
440 ka?

0
+1
-1
Ant
arct
icte
mpe
ratu
re
anom
aly
(o C)
Cz=Cazenave+ 2008; I=IPCC 2007; R=Rignot+ 2008; RL=Ramillien+ 2006; RT=Rignot+Thomas 2002; RT2=update of RT including additional losses from Thomas+ 2004 + Rignot+ 2005; V=Velicogna+Wahr 2006; W=Wingham+ 2006; Z=Zwally+ 2005; Temperature=Steig+ 2009 hand-digitized average of E+W Antarctic.
violet=altimetry; red=snowfall-melt-discharge; dark blue=GRACE; light blue=assessment; updated from Alley et al., 2007
Temperature

All piles tend to spread under own weight:• Strong things resist spreading (a block of wood), but weak
things spread easily (pancake batter); • Lubrication speeds spreading (pancake batter spreads faster
on a greased griddle than on a waffle iron);• Supports oppose spreading (a flying buttress keeps a
cathedral from spreading and falling apart).
ww
w.d
esig
ncom
mun
ity.c
om/s
crap
book
/imag
es/1
032.
gif
ww
w.p
bs.o
rg/w
gbh/
build
ingb
ig/s
kysc
aper
/got
hic.
htm
l

An ice sheet is a two-mile-thick, continent-wide pile
• Spreads under its own weight; • Snowfall on center adds to pile;• Melting at edges, or break-off of
icebergs, subtract from pile;• Increase in snowfall grows pile; faster
melting or faster flow shrink pile;• Water in ice-sheet pile came from
ocean, so sea level falls when ice sheet grows, and sea level rises when ice sheet shrinks.

Meltwater drains through Greenland• Accelerates flow
somewhat by lubricating the bed (averaged over a year, effect of surface meltwater on basal velocity probably order of 10%, so while additional melt in future may speed mass loss, but probably not huge);
• Thermal effects of surface meltwater may be more important…
Zwally et al., 2002, Science

Bigger issue with meltwater:• Central Greenland frozen to bed, with
almost no basal motion;• Thawing a frozen bed speeds motion, a
little to a lot--2x useful first guess?• Time for surface warming to penetrate
to bed through ice is ~10,000 yr;• Time for surface meltwater reaching
bed to have similar effect ~10 minutes or less…

Photo by Ian Joughin, Science, Alley et al., 2008
Lakes on Greenland ice sheet may be kilometers across and many meters deep

Photo from Sarah Das, Science, Das et al., 2008
Air-filled crevasses can penetrate only a small fraction of the ice-sheet thickness, but water-filled crevasses canbreak through to and along the bed.

Meltwater-penetration:• Meltwater is getting through ice near
edges of Greenland (Zwally et al., 2002)• Mass loss will increase (up to 2x?) if
meltwater access to bed migrates inland with warming (Parizek & Alley, 2004)
• Model: Meltwater accesses bed through lake-driven crevasses (Alley et al., 2005)
• Observed: Crevasse lake-drainage exceeding Niagara Falls (Das et al., 2008)
• Future: Work to do, but expect somewhat accelerated mass loss
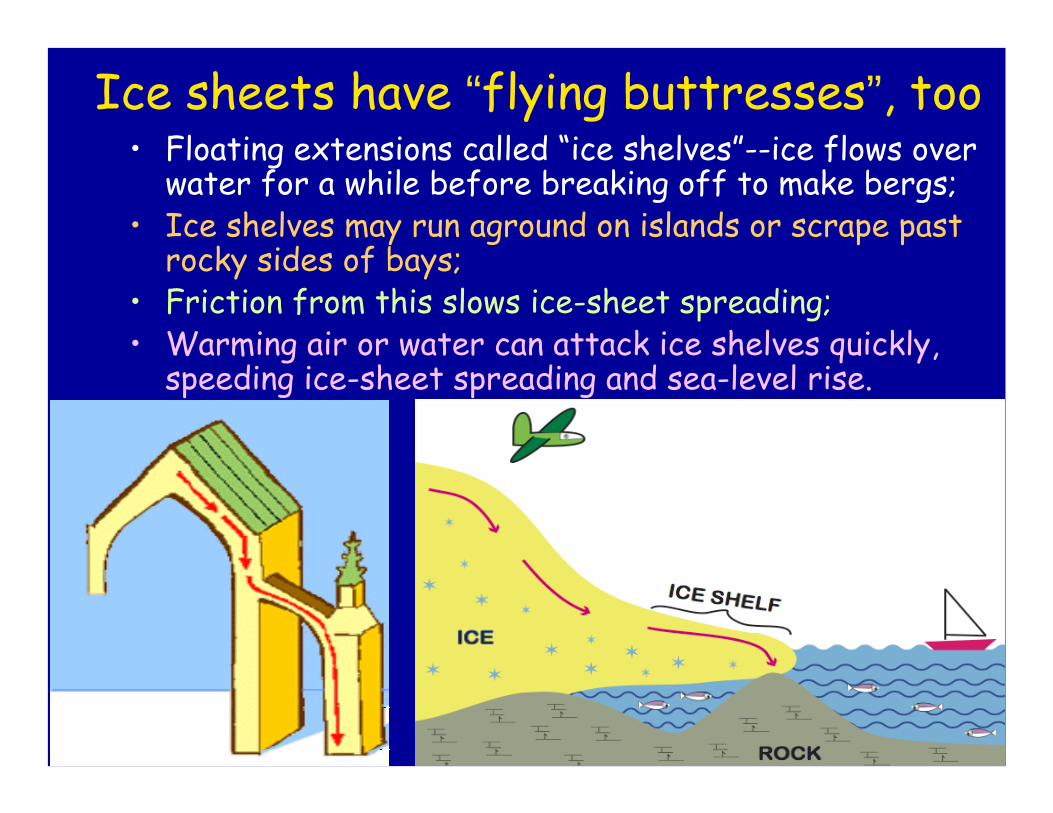
Ice sheets have “flying buttresses”, too• Floating extensions called “ice shelves”--ice flows over
water for a while before breaking off to make bergs; • Ice shelves may run aground on islands or scrape past
rocky sides of bays;• Friction from this slows ice-sheet spreading;• Warming air or water can attack ice shelves quickly,
speeding ice-sheet spreading and sea-level rise.

January 31, 2002
http
://sv
s.gs
fc.n
asa.
gov/
vis/
a000
000/
a002
400/
a002
421/
inde
x.ht
ml
12 mi20 km
OceanAntarctic Peninsula (gothic cathedral)
Icebergs
Larsen B Ice Shelf (flying buttress)
Melt ponds
Island
Island

January 31, 2002
http
://sv
s.gs
fc.n
asa.
gov/
vis/
a000
000/
a002
400/
a002
421/
inde
x.ht
ml
12 mi20 km

March 7, 2002. 8x tributary flow-speed increase followed
http
://sv
s.gs
fc.n
asa.
gov/
vis/
a000
000/
a002
400/
a002
421/
inde
x.ht
ml
12 mi20 km

Jakobshavn Ice Stream in Greenland
Discharge from many major Greenland ice streams has accelerated markedly.
Source: Prof. Konrad Steffen, Univ. of Colorado

Seal, in Jakobshavn Isfjord. The fjord is so clogged with ice calved from the glacier that it is sometimes hard to realize that deep seawater lies beneath. This seal, far up the fjord, is good evidence that indeed an appropriately equipped swimmer can get here. Photo by R.B. Alley

The calving front of Jakobshavn. Ice flows down from the Greenland ice sheet on the left, along the arrow. On the right is the Isfjord, ocean water clogged with loose icebergs that have calved off. “X” marks the couple-hundred-foot-high cliff where icebergs form, falling down into the Isfjord where broken ice covers sea water.
Isfjord
X
Photo by R.B. Alley

Jakobshavn Isbrae, W. Greenland. Retreat with speed doublingduring ice-shelf loss, which likely was caused by warming.Image courtesy Ian Joughin (Alley et al., 2005).
Rock
Rock
Ice Flow
Floatingice mess
Berg
5 km19
92
2000
2002
2003 20
04

Shepherd et al., 2004, GRL
1oC warming gives 10 m/year more melt.
So ice shelves expected to be very sensitive to even small climate changes.


Modeling the real physics• Simplified models exist that capture the key physics• All require tuning of poorly known physical variables• Comprehensive models with key physics being developed• Likely to require data-assimilation for initialization• Efforts underway at some large modeling centers to add
ice sheets (e.g., Los Alamos for NCAR model, GFDL)• I don’t see resource commitment to ice sheets that is
devoted to oceans and atmospheres• I doubt problem soluble without such resources• That’s a personal opinion (but an informed one…)• There will be need for a lot of field, laboratory and
remote-sensing work to support the modeling effort

Synopsis• Warming melts ice and raises sea level• No reliable evidence that snowfall rises enough
with warming to offset increasing melting and spreading, and much evidence that snowfall doesn’t rise enough
• Probably centuries or more to lose an ice sheet• Might commit to dumping one within decades• No reliable projections or worst-case scenarios• Good work ongoing, but commitment of large
modeling centers looks small to me compared to effort on other key parts of climate system

Photo by R.B. Alley