Embed Size (px)
Citation preview

Portland State University Portland State University
PDXScholar PDXScholar
Dissertations and Theses Dissertations and Theses
Summer 8-5-2013
State Need-Based Aid and Four-Year College Student State Need-Based Aid and Four-Year College Student
Retention: A Statewide Study Retention: A Statewide Study
Kara Lynn McFall Portland State University
Follow this and additional works at: https://pdxscholar.library.pdx.edu/open_access_etds
Part of the Educational Leadership Commons, and the Other Education Commons
Let us know how access to this document benefits you.
Recommended Citation Recommended Citation McFall, Kara Lynn, "State Need-Based Aid and Four-Year College Student Retention: A Statewide Study" (2013). Dissertations and Theses. Paper 1003. https://doi.org/10.15760/etd.1003
This Dissertation is brought to you for free and open access. It has been accepted for inclusion in Dissertations and Theses by an authorized administrator of PDXScholar. Please contact us if we can make this document more accessible: [email protected].

State Need-Based Aid and Four-Year College Student Retention:
A Statewide Study
by
Kara Lynn McFall
A dissertation submitted in partial fulfillment of the requirements for the degree of
Doctor of Education in
Educational Leadership: Postsecondary Education
Dissertation Committee: Janine Allen, Chair
Peter Collier Andrew Job
Candyce Reynolds
Portland State University 2013

© 2013 Kara Lynn McFall
i
Abstract
Every college age student should have the opportunity to attend college and earn a
degree, but the fiscal realities for lower income students prevent the majority from
attending and the vast majority from completing college, thus perpetuating an
intergenerational trend of limited postsecondary education and a likelihood of marginal
income and status. Past research studies have shown that, among lower income students,
those who receive higher levels of grant funding to offset college expenses are more
likely to persist toward completing their educations than those who do not receive the
same level of grant funding and thus are forced to rely upon other means, such as student
loans or employment, to pay for college. The majority of this research was conducted
prior to the recession that began in December 2007 (National Bureau of Economic
Research, 2008), which has been more severe and longer lasting than any economic
contraction since the Great Depression (Dwyer & Lothian, 2012); more current research
is needed to determine whether the educational retention behaviors of lower income
students in the current challenging economic climate are positively impacted by grant
funding. In this study I used quantitative methods to analyze a specific state policy
change to determine whether a significant change in the grant funding provided to lower
income students resulted in increased retention rates for these students. This study
examines school years from 2006-2010, thus encompassing the recent financial crisis and
affording an opportunity to explore the persistence behaviors of lower income students
during the greatest financial crisis of modern times. The ultimate purpose of the study is
to provide conclusions from the research to postsecondary policy makers in the hopes of

ii
informing policy and supporting continuing funding of need-based financial aid for lower
income students.

iii
Acknowledgements
This dissertation would not have been possible without the help and
encouragement of many supporters. I would like to start by thanking my faculty advisor
and chair of my dissertation committee, Janine Allen, for her unwavering support,
encouragement, guidance, and patience over the years as I inched my way towards
completion of my degree. Janine has been a rich source of scholarship and a true mentor
in helping me grow academically; I am grateful to her for never giving up on me.
I would like to thank my dissertation committee of Peter Collier, Andrew Job, and
Candyce Reynolds for their generosity in providing advice and guidance and the
encouragement they offered that helped to keep me motivated. In addition, Moti Hara and
Janice Forrester both provided invaluable statistical advice. Pati Sluys was instrumental
in editing (and re-editing) my dissertation through many iterations and was the essence of
patience through my last minute requests for changes.
Finally, heartfelt thanks to my family and friends, who provided me with the help
and support I needed to succeed. I would like to thank Linda Negrin, Elizabeth Whelan,
and Jamie Sprague for the many times they took care of my dogs so that I could attend
class while working fulltime; I could not have completed my degree without their help
and friendship. Thanks to Leslie Hinea and Grace and Dan Muncie-Jarvis for the
emotional support and encouragement they provided over the journey. To my mother;
father; sister Julie; and brothers Mike, Nod, and Matthew, thank you for being my biggest
champions and sources of inspiration.

iv
Table of Contents Page
Abstract ................................................................................................................................ i Acknowledgements ............................................................................................................ iii List of Tables .................................................................................................................... vii List of Figures .................................................................................................................. viii Chapter I: Introduction .........................................................................................................1
Background of the Problem .....................................................................................5
Financial Aid Policies in Oregon ...........................................................................19 Statement of the Research Problem .......................................................................22 Purpose of the Study ..............................................................................................23 Significance of the Research ..................................................................................24 Research Methodology and Research Questions ...................................................26 Summary ................................................................................................................29
Chapter II: Review of the Literature and Conceptual Framework ....................................30
Introduction ............................................................................................................30 Persistence of Freshmen Students ..........................................................................31 Noneconomic Factors in Persistence .....................................................................33 Economic Factors in Persistence ...........................................................................36 Impact of Types and Amount of Financial Aid on Persistence .............................39 Integrative (Economic and Noneconomic) Factors in Persistence ........................47 Influences on Persistence .......................................................................................51
Individual Influences on Persistence Institutional Influences on Persistence

v
Federal Government Influences on Persistence State Government Influences on Persistence
Conceptual Framework ..........................................................................................62 Summary ................................................................................................................64
Chapter III: Methodology ..................................................................................................66
Introduction ............................................................................................................66 Appropriateness of the Research Design ...............................................................67 Research Design.....................................................................................................68 Setting and Participants..........................................................................................69 Instrumentation Used to Collect the Data ..............................................................71 Procedure ...............................................................................................................72 Data Processing and Analysis ................................................................................74 Ethical Considerations ...........................................................................................76 Threats to Internal Validity ....................................................................................77 Limitations of the Study.........................................................................................79 Summary ................................................................................................................80
Chapter IV: Analysis and Findings ....................................................................................82 Introduction ............................................................................................................82 Descriptive Statistics ..............................................................................................82 Student Demographic Characteristics ....................................................................84 Student Financial Aid Characteristics ....................................................................88
Summary of Key Descriptive Findings..................................................................91 Inferential Statistics ...............................................................................................92

vi
Pearson Chi-Square Test Results ...........................................................................94 Binomial Logistic Regression Results ...................................................................95
Chapter V: Discussion and Conclusions ............................................................................99 Introduction ............................................................................................................99 Research Findings ..................................................................................................99 Strengths and Limitations ....................................................................................109 Areas for Future Research ...................................................................................111 Conclusions ..........................................................................................................115
References ........................................................................................................................118 Appendices A SCARF Data Extraction, Transformation, and Load Process Flow Description ....133 B OUS Data Sharing Agreement ................................................................................136 C Exhibit 1 of the OUS Data Sharing Agreement Revised November 9, 2012 .........143 D IRB Review Not Required Form ............................................................................147 E Human Subjects Research Review Committee Waiver of Review of “State Need-Based Aid and Four-Year College Student Persistence: A Statewide Study” (HSRRC #122403 ...................................................................................156

vii
List of Tables
Table Page 1 Independent Control Variables in the Analysis .................................................. 76 2 Threats to Internal Validity of Experimental Research Designs. ....................... 77 3 Summary of the Research Design ...................................................................... 81 4 Number of Students in the Working Data Set Sorted by Academic Year ...........84 5 Student Demographic Characteristics by Academic Year ..................................85 6 Institutional GPA Values by Academic Year ......................................................86 7 Student Mother and Father Educational Level Values by Academic Year .........88 8 Average OOG Awarded and the Average Student Total Other Aid (Excluding the OOG) by Year .........................................................................89 9 Average Annual OOG Award Amount and Percentage Need Met by the OOG, by Year ..................................................................................................90 10 Average Cost of Attendance, Percentage of Increase in Attendance, and Percentage of Need Met by the OOG, by Academic Year ..............................91 11 Crosstabulation of Retention by Academic Year Grouping ................................95 12 Variables of the Binomial Logistic Regression for 8,928 Cases .........................96 13 The Observed and Predicted Frequencies of Retention by Logistic Regression With the Cutoff of 0.5 ...................................................................98

viii
List of Figures Figure Page
1 Unemployment and Weekly Earnings for Degreed vs. Non-Degreed Americans ......................................................................................................... 3

1
CHAPTER I
INTRODUCTION
Every college age student should have the opportunity to attend college and earn a
degree, but the fiscal realities for lower income students prevent the vast majority from
attending or completing college, thus perpetuating an intergenerational trend of limited
postsecondary education and a likelihood of marginal income and status. Students from
low socioeconomic status (SES) families face severe challenges in attending and
graduating from college. In particular, the funding crisis in higher education and the
increasing costs of a college degree have combined to produce a negative impact on the
graduation rates of these students. Mortenson (2007) found that while 40% of students
from families in the lowest quartile of earnings attended college, only 12% of these
students graduate with a bachelor’s degree by the age of 24. By comparison, a staggering
73% of students from families in the highest quartile of earnings achieve a bachelor’s
degree by the age of 24.
Unfortunately, not attending or completing college is a trend that tends to pass
from generation to generation. A 2001 study published by the National Center for
Educational Statistics found that in 1999, 82% of students whose parents held a
bachelor’s degree or higher enrolled in college as soon as they graduated from high
school; the number dropped to 54% for students whose parents held only a high school
diploma and 36% for students whose parents did not graduate from high school (Choy,
2001). The same study found that among students who started college in the 1989-1990

viii
school year, first-generation students were more likely to have dropped out of college
after 5 years than their counterparts whose parents had obtained college degrees (45%
versus 29%). Thus, barriers to obtaining a college degree resonate not just with a student
experiencing the barriers; the issue of access affects the next generation as well.
According to Altbach, Berdahl, and Gumport (2005), “the lack of postsecondary
education creates a likelihood of marginal income and status” (p. 271). A report by the
National Center for Public Policy and Higher Education (2008) stated more bluntly:
“Education and training beyond high school is a prerequisite for employment that
supports a middle-class life. This is a reality for most Americans” (p. 9).
Figure 1 from the U.S. Bureau of Labor Statistics (2013) clearly shows the
discrepancy between unemployment rates and earnings for those Americans 25 and older
who have college degrees and those without. Unemployment rates grow steadily higher
the less education a person has; from 2.1% for adults with professional degrees and 2.5%
for adults with doctoral degrees, to a high of 12.4% for those who have not earned a high
school diploma (U.S. Bureau of Labor Statistics, 2013). Similarly, weekly earnings drop
the less education a person has, from $1,735 for adults with professional degrees and
$1,624 for adults with doctoral degrees, to a low of $471 for those who have not earned a
high school diploma (U.S. Bureau of Labor Statistics, 2013). The evidence is clear: those
without college degrees are more likely to be unemployed and on average will earn a
substantially lower wage than those who attend and complete college.

viii
Figure 1. Unemployment and weekly earnings for degreed vs. non-degreed Americans. Source: U.S. Bureau of Labor Statistics (2013).
Changes in policy at the federal, state and institutional level over the past several
decades have made the attainment of a college degree for lower income students more
challenging. In particular, the shift in need-based financial aid from a grant-based
structure to a loan-based structure over the last few decades has contributed to the gap in
graduation rates between those in the highest socioeconomic quartiles and those in the
lowest quartiles (Hearn & Holdsworth, 2004). This factor, combined with the continuing
and rapid increases in the cost of higher education and the lingering impacts of the
recession that began in December 2007, make the problem of equitable access across
socioeconomic strata more acute.

viii
The research in this study explored the impact of shifts in financial aid policies at
the state level on the retention rates of lower income, first-time freshman students. The
term freshman for the purposes of this study was defined as a student who registered as a
first-time undergraduate student during Fall term and did not transfer credits from another
college or university earned subsequent to high school graduation. While the terms
retention and persistence are both used in the paper, retention is actually a specific case
of persistence using the definitions of the National Student Clearinghouse Research
Center (Shapiro et al., 2013) where retention is “continued enrollment within the same
institution” (p. 1) and persistence is “continued enrollment within any U.S. institution”
(p. 1).
The study includes an analysis of the impact on retention of a state policy change
that provided increased need-based funding for lower income students. The research
draws upon a conceptual framework proposed by Chen and St. John (2011) that
recognizes and examines the influential role that state postsecondary financial aid
policies play in determining whether at risk students will persist. Using data obtained
from the Oregon University System on retention rates of lower income freshman students
who obtained Oregon Opportunity Grants (OOG) for 2 years of low-level individual
grant funding and 2 years of comparatively higher amounts of funding, I analyzed
whether there is a relationship between higher grant funding and higher retention rates for
lower income students. In the study I examined school years from 2006-2010, thus
encompassing the recent financial crisis and affording an opportunity to explore the

viii
retention behaviors of lower income students during the greatest financial crisis of
modern times.
Background of the Problem
Students from low SES backgrounds are at a disadvantage in terms of
postsecondary success. In particular, the funding crisis in higher education and the
increasing costs of a college degree have combined to have a negative impact on the
graduation rates of these students. The higher education policy that has had the most
sweeping impact on access and eventual graduation for lower income students is the
migration in higher education funding away from a grant-based model to a loan-based
model. This shift has occurred at the federal, state and institution level, but the largest
impact has resulted from federal policies that have prevented federally-funded higher
education grants from keeping pace with the increasing cost of attendance.
In 1965 the Higher Education Act was passed as part of President Johnson’s War
on Poverty, implementing a mix of need-based grants for lower socioeconomic students
and portable student loan programs targeted at middle income students and continuing the
College Work Study Program that was created as part of the Educational Opportunity Act
of 1964 (Coomes, 2000). Johnson saw educational improvement as a national priority.
Among other programs, the Higher Education Act created the Educational Opportunity
Grant program and a major new loan program, Guaranteed Student Loans (St. John,
2003). The 1972 reauthorization of Higher Education Act included the introduction of a
major new federal grant program, Basic Education Opportunity Grants, now known as
Pell grants (St. John, 2003). The Basic Education Opportunity Grants program was a
viii
portable grant program; grants were provided to students to enable them to choose the
colleges they wished to attend. In 1978 Jimmy Carter expanded the reach of Pell grants to
middle-income students with the passage of the Middle Income Student Assistance Act
(St. John, 2003). Thus access to a higher education was provided through the mix of work
study, grant and loan-based programs of the HEA.
The decline in access to higher education began in the 1980s and has resulted in a
shift from having taxpayers support the costs of a college education to having students
and their families bear the costs (St. John & Parsons, 2004). Hearn and Holdsworth
(2004) described the shift in federal higher education funding from the grant-based
system in the mid-1970s to a primarily loan-based system today. Mortenson (2011b)
noted “Since 1980 progressive social policy has been steadily replaced with regressive
social policy choices that have crippled and reversed the national commitment to higher
education opportunity” (p. 1). Mortenson cited research that shows that the share of
higher education revenue provided by students and their families has increased from a
low of 30.3% in 1980 to 50.5% in 2009.
A noteworthy shift in policies for funding higher education occurred during Bill
Clinton’s presidency away from the policies started by Johnson to benefit disadvantaged
students; many argue that Clinton’s legacy was to institute policies that mainly benefited
the middle class (Brainard, Burd, & Gose, 2000). Clinton implemented a tuition tax credit
of up to $1,500 per year, which critics argued did not increase access for lower income
students whose families do not earn enough to owe taxes. Similarly, Clinton’s creation of
the AmeriCorp program provided a vehicle for students to earn grants for college with
viii
one or two years of community service; critics stated that the program was mainly a boon
to middle class students and actually shifted money away from the federal need-based aid
programs (Brainard et al., 2000). While Clinton did agree late in his term to raise the
maximum Pell Grant amount, his overall policy approach was to adopt programs and
policies that were not targeted at increasing access for lower income students. Clinton’s
tuition tax credits in particular were seen as “pandering to the middle class” (Brainard et
al., 2000, p. A27).
Taking inflation into account, federal student loans for college students increased
125% during the 1990s, while federal grants for students increased by only 55% (The
College Board, 2000). More recently, 40% of undergraduate students in the 2006-2007
school year received federal student loans. One outcome of the shift from grants to
student loans as funding sources for higher education has been the impact on attendance;
Hearn and Holdsworth (2004) made the case that grants promote attendance much more
powerfully than do student loans.
The federal government has also adopted student loan policies that effectively
“punish” those schools that have higher numbers of students from lower socioeconomic
classes (St. John, Asker, & Hu, 2001, p. 423). Federal student loan policies reduce the
amount of student loan funding for schools that have higher rates of default on student
loans. If default rates are high enough, an institution may lose federal funding entirely by
being declared not administratively capable (Skinner, 2007). Colleges and universities
that have higher rates of high-need students—those students who are most likely to find
that they are unable to repay their loans—tend to have the highest rate of loan defaults

viii
and thus are subject to reductions in federal funding (St. John et al., 2001, p. 423). The
threshold for default rates that determine administrative capability for Perkins loans—
low-interest loans available for very high need students—is set lower when compared to
other types of loans. A college will be determined to be not administrative capable if
Perkins loan default rates are 15% or higher, while default rates for loans under the
Federal Family Education Loan or Federal Direct Loan programs are set to 25% for one
or more of the most recent three fiscal years or 40% for the most recent cohort (Skinner,
2007). Because low-income students are more likely to default on student loans, colleges
with a higher relative number of low-SES students and thus more students receiving
Perkins loans are at a greater risk of loan defaults and a corresponding loss or reduction
in federal funding when declared not administratively capable.
State financial aid policies for higher education have evolved as well as federal
aid funding policies. Ehrenberg (2006) stated that a larger share of state financial aid is
now being provided in the form of merit-based grants—a form of aid that tends to favor
educationally advantaged students instead of those from lower SES strata—rather than
appropriations to public institutions to help fund their operations costs and thus reduce
the need to raise tuitions. In a study of 13 states that introduced broad-based merit-aid
programs, Susan Dynarski (cited in Ehrenberg, 2006) determined that in many of these
states the 30% or more of the students who qualified for the awards were represented in
large numbers by white and middle- or upper-income students. Dynarski concluded
“Hence the growth of these programs can be understood primarily as a response to large

viii
voting blocs concerned about rising tuitions, not as an effort to increase access for
underrepresented groups” (p. 49).
Low-SES students are less likely to do well in high school, and thus are less likely
to earn merit-based grants from state governments, due to a variety of reasons.
McDonough (1997) found that low-SES students are disproportionately represented in
high schools that do not focus on preparing students for college and have fewer
counseling resources. Walpole (2007) reported that low-SES students are more likely to
be steered toward vocational programs and away from college preparatory programs, thus
reducing educational attainment for these students. Walpole further asserted that low-SES
students also have less access to more rigorous courses and are discouraged from taking
honors and advanced placement courses, further lessening their college readiness upon
graduation.
The result of the disparity in high school achievement between low-SES students
and high-SES students is less preparation for college and less ability to compete for
merit-based aid. Kahlenberg (2004) pointed out a 30-year trend in SAT scores, which he
uses as one measure of high school achievement levels: he notes that those students with
family incomes in the lowest 10-15% have combined verbal and math SAT scores that
are approximately 200 points behind the scores of students in the highest 10-15% of
family incomes. Similarly, the high school dropout rates of the highest income groups are
much lower than the dropout rates of the lowest income groups; in 2000 the figure was
21.0% for the lowest family income quartile and 3.9% for the highest quartile.

viii
Reductions in state funding for public universities that result in higher tuitions,
when coupled with the move in federal aid away from need-based grants to loans and tax
credits, poses a double burden for lower socioeconomic students: not only are there fewer
dollars available in the form of grants to fund their educations, but the price tag for a
college degree continues to rise as institutions are pushed to make up for decreased
support from the federal and state governments by raising tuition. The reduction in the
amount of need-based aid that is available for lower income students is exacerbated by a
continuing steep rise in tuition costs. The national average inflation-adjusted tuition and
fee charges for state resident undergraduate students at flagship universities increased by
247% from $2,291 in 1981 to $7,963 in 2010; for comprehensive colleges and
universities the national average inflation-adjusted tuition and fee charges for state
resident undergraduate students increased by 230% from $1,896 in 1981 to $6,257 in
2010 (Mortenson, 2011b).
Another issue faced by low-SES students is the fact that, similar to the trend
mentioned earlier for state grant aid, the grant aid provided by institutions is increasingly
being awarded based on merit to students in middle and upper incomes rather than those
students who are the most economically challenged. As previously mentioned, low-SES
students tend to be at a disadvantage when competing for merit-based grants against their
more prosperous classmates. As a result of these circumstances and the shift to a more
merit-based system for aid disbursement at the institutional level, fewer institutional
grants are being awarded to low-SES students. During the 1990s for example, the
percentage of students in the highest income quartile who received institutional aid

viii
increased from 12 to 18%, while the percentage of students of middle incomes who
received institutional aid increased from 17 to 23% (Task Force on State Budget Issues,
2005).
The shift in policy away from a grant-based model to a loan-based model has had
a profound impact on lower income students, and thus raises concerns for equity in
higher education. Lower-income students who cannot pay for college with need-based
grants or family contributions are forced to make up the gap with loans or by working.
The increasing trend of providing aid for lower-income students in a form that requires
repayment provides a disadvantage for these students compared to students whose
families can afford to use savings or current income to pay for college attendance (St.
John & Parsons, 2004). Students from any SES can obtain student loans, but lower
income students are more likely to emerge from college with a higher level of cumulative
debt (Callan, 2001). On average, lower income students accumulate more debt while in
college, particularly at private institutions (Kahlenberg, 2004).
In addition, the proportion of income needed to repay student loans is much
higher for lower income students than for those of a higher SES. The total undergraduate
student loan amount in 1996 represented 26% of family income for the lowest income
quintile, 6% for the middle quintile, and only 1% for the highest quintile (National Center
for Education Statistics, as cited in Callan, 2001, p. 89). Walpole (2007) reported that
low-SES students who do graduate from college have lower incomes than their higher-
SES peers, even when working full time and after attending graduate school. These lower
incomes represent a double-negative for the low-SES student—the student is forced to
viii
borrow more to attend college, thus emerging with a higher level of debt, but this same
student earns a lower income after graduation, thus negatively impacting the student’s
ability to repay the debt.
Even those low-income students who qualify for Pell Grants find that the amount
of spending power with their grants has decreased dramatically. In the 1986-1987 school
year, the maximum Pell Grant covered 52% of the average published costs of tuition,
fees, room and board at public 4-year institutions and 21% of these average costs at
private institutions; in the 2006-2007 school year this figure had dropped to 32% of these
costs at a public 4-year university and 13% at a private college (The College Board,
2007). In addition, the Pell Grant program is projected to be underfunded by nearly $70
billion from 2013-2022.
Finally, the impacts of the recession that began in December 2007 have been
profound and longer lasting than other historical economic crises in the United States.
According to Dwyer and Lothian (2012), the recession that began in 2007 has had a
slower and less sizable recovery than five of the past six economic crises, with the Great
Depression providing the one exception. The 2007 recession and Great Depression
provide the only two examples in 130 years of U.S. economic crises where the recoveries
did not exceed their previous declines by substantial amounts; close to 6% on average
(Dwyer & Lothian, 2012, p. 6). In other words, the economy is experiencing lower
increases in recovery than it did decreases during the recession.
The slow recovery is reflected in the nation’s unemployment rates. While
unemployment continued a downward trend in November 2012 by dropping to 7.7%,

viii
economists warned that lower unemployment figures are the result of a shrinking labor
force rather than the addition of new jobs (Schwartz, 2012). The labor force dropped by
350,000 in November 2012, due in part to workers who dropped out of the labor force
after unsuccessfully seeking employment, a trend that has been a factor in the continuing
slow recovery. If unemployment numbers are expanded to include those who want work
but have become discouraged and stopped looking or those forced to take part-time work
because full-time work is not available, the unemployment rate is actually 14.4%
(Schwartz, 2012). Younger workers are experiencing the highest rates of unemployment;
figures for November 2012 show workers aged 20 to 24 had an unemployment rate of
12.7%, while the unemployment rate for workers aged 25 to 34 was 7.9% (Schwartz,
2012).
The economic realities for those students seeking a college education since the
start of the 2007 recession are different than the realities of students from earlier periods
when the economy was stronger by comparison. All students considering a postsecondary
degree face uncertain employment upon graduation; Cochran and Lee (2011) noted “In
the United States, the recession that began in 2008 has exacerbated unemployment or
underemployment of recent graduates” (p. 1). More current research is required to
determine the impact of financial aid policies on lower income students in this restricted
economic climate.Past research has shown that lower socioeconomic students are more
likely to graduate when provided with grant rather than loan-based funding (Hearn &
Holdsworth, 2004; Mortenson, 1990; Pascarella & Terenzini, 2005; Singell, 2001), but
policy shifts from the 1960s to today have seen erosion in grant-based aid for low-SES

viii
students and an increased reliance on student loans. In the decade from 1990 to 2000,
need-based aid fell nationally from 80% of all aid to 60% (The College Board, 2000). A
study published in 1994 by St. John concluded that a number of the gains in higher
education for high need students that resulted from the expansion of student aid in the
form of grants through the 1970s were eroded with the shift in funding to student loans.
Hearn and Holdsworth (2004) made the case that the move away from grant-based aid to
loan-based aid has had a negative impact on lower income students’ access to higher
education, choice of which college to attend, and persistence toward degree attainment,
since all three components are shown to increase substantially with aid that does not
require repayment.
The combined financial aid policies at the federal, state, and institution levels
result in a lower amount of grant aid for lower income students who aspire to attend
colleges and universities with the most selective admissions policies than for students in
the highest economic strata who attend the same schools. A study published in 2007 by
The College Board showed that low income students at these selective universities in the
2003-2004 school year received an average of $30,306 in grant aid from federal, state and
institution sources. By comparison, low-middle income students at these same institutions
received an average of $33,340 in grant aid from the same sources, while middle-high
income students received an average of $34,136 and high income students received an
average of $35,499 in grant aid from the same sources. Thus as family income decreases
and, by extension, the need for grant-based aid increases, the amount of funding provided
in the form of grants for students at these elite schools actually shrinks. With the

viii
increasing scarcity of resources that are available for higher education, a larger share of
grant-based aid is provided to the students in the highest income levels who are best able
to afford college without financial assistance.
The financial aid landscape has changed enormously over the last few decades at
the federal, state and institutional level. The resulting question of concern to higher
education institutions and society as a whole is whether a shift in financial aid resources
from the modern loan-based model back to a structure that provides a higher percentage
of grant-based funding can increase persistence and graduation rates for low-SES
students. Are lower income students who receive educational grants rather than student
loans more likely to succeed in and eventually graduate from college?
Mortenson (1990) used economic investment theory and attitudinal survey data to
examine the relationship between a historic decline in participation in higher education
for low-SES students and the corresponding shift in federal funding from grant-based aid
to loan-based aid. Mortenson’s study found that college enrollment rates of students from
low-income families increased with the use of grants to reduce the net cost of college; his
findings also showed that students from low-income families were less willing to incur
debt to pay for their educations. Mortenson concluded that “only grants achieve desired
enrollment gains by low-income students” (p. 1) and further stated “When loans are
substituted for grants for low income aid applicants, the enrollment problems that were
solved by grants are recreated by loans” (p. 5).
In using economic investment theory in interpreting the enrollment declines for
low income students that occurred between 1980 and 1990—a loss of between 40 and

viii
50% participation gains during the time of increased grants from the mid 1960s through
the mid 1970s—Mortenson (1990) argued that loans add risk and financing costs to the
investment in higher education, unlike grants. He concluded that the addition of these
costs reduces the net benefits of college attendance for those who use student loans, and
thus fewer low income students will enroll or persist if loans are the primary financial aid
vehicle provided.
One gap in Mortenson’s (1990) study is the fact that the study was conducted
more than 20 years ago; the 2007 recession has had profound and continuing impacts on
the economy and the financial aid landscape has continued to evolve since Mortenson’s
study, along with sharp increases in the tuition charged at virtually all public higher
education institutions. As the standard for financial aid has switched from a model that
favors grant-based funding to one that heavily favors loan-based funding, adjustments in
expectations and attitudes may also have shifted; more current research is required to
determine if lower SES students remain as sensitive to the source of financial aid. This
research study provided the opportunity to use current data since the 2007 recession to
examine an actual state-level financial aid policy shift that resulted in 2 years of vastly
increased grant funding for low-SES students and the resulting impacts on retention.
Another gap in Mortenson’s (1990) study again deals with the timeliness of the
data surveyed and the resulting analysis. Since the time of Mortenson’s study the number
of jobs requiring a college degree has increased; it can be expected that this change in the
employment climate will have had an impact on lower-income students’ attitudes toward
college. In a later study Mortenson (2011b) pointed out that “The old high wage/low skill

viii
economy has largely disappeared. In its place are service industry jobs that require
substantial amounts of expensive postsecondary education and training” (p. 2). Studies
show that college graduates earn more than those without a college degree; in 2013 the
U.S. Bureau of Labor Statistics estimated that a person with a bachelor’s degree earned
$1,066 per week while a high school graduate earned only $652 per week. Barton (2008)
argued that the “wage premium” that exists between college graduates and those without
a degree is more recently due largely to the sharp reduction in earnings for high school
graduates and dropouts rather than increasing earnings of college graduates.
Barton (2008) also pointed out that the educational requirements for jobs have
grown steadily over the last five or six decades; the ability to maintain a middle class
income with just a high school diploma has become much more challenging. In
discussing why American K-12 schools are increasingly not preparing students for
postsecondary studies, Friedman (2012) stated flatly that “There is no good job today that
does not require more and better education to get it, hold it, or advance in it” (p. A19). As
the fiscal realities of not obtaining a college degree have continued to evolve, it can be
expected that student attitudes toward obtaining a college degree have also evolved; more
current research on retention factors for low-income students is needed.
Using the theory of targeted subsidies, Braxton (2000) posited that the way to
positively impact persistence is “through subsidies targeted at specific groups based on
their ability to pay” (p. 30). Programs that meet the criteria for targeted subsidies are
reduced tuition, direct grants, low-interest loans, and subsidized work-study programs. A
related model is the ability-to-pay model, whereby a student’s perception of his or her

viii
ability to pay is a precondition for academic success and persistence. Cabrera, Stampen,
and Hansen (1990) found that students who are satisfied with their abilities to pay for
college had higher educational aspirations and an increased likelihood of persistence than
those students who were less satisfied with their abilities to pay; providing financial aid
that reduces the burden for students (e.g., lowered tuition and grants) positively impacts a
student’s perception of his or her ability to pay. Both theories point to financial aid as a
positive motivator for student persistence.
Research devoted to determining the effect of grant-based funding versus loan-
based funding on persistence rates indicates that students are more likely to enroll and
persist when provided with grants rather than loans. Leslie and Brinkman (1988)
analyzed three different studies in researching the impact of financial aid on student
enrollment: multivariate analyses of student behavior, calculations of participation
(enrollment) rates, and student opinion surveys. Among their findings, they determined
that grants do promote enrollment for lower income students. St. John (1990a) also found
that the poorest students respond more strongly than students in other income levels to
increases in grant aid and further found that these same students reacted more strongly in
terms of the decision to enroll to grant increases than tuition decreases, possibly because
the students anticipated a corresponding decrease in grant funding when tuition was
lowered. The consensus among these studies is that lower income students are more
sensitive to net increases in the cost of attending college than their higher income
classmates, whether by increased tuition or decreased financial aid. A logical conclusion

viii
therefore is that lower income students are more likely to enroll in college if grant-based
aid is increased.
Hearn and Holdsworth (2004) also made the case that grants promote attendance
much more powerfully than do student loans. They further made the case that the move
away from grant-based aid to loan-based aid has had a negative impact on lower income
students’ access to higher education, choice of which college to attend, and persistence
toward degree attainment, since all three components are shown to increase substantially
with aid that does not require repayment. However, more recent research is needed in the
context of potential changes in student perceptions in light of the challenging economic
climate that has resulted from the continuing effects of the 2007 recession and its impact
on unemployment, higher levels of the chronically unemployed, and reduced numbers of
job openings.
Financial Aid Policies in Oregon
Policymakers in Oregon recognized the increasing challenges for low income
students in paying for a postsecondary education and persisting to graduation and
responded by increasing the amount of aid available through the OOG for the 2008-2009
and 2009-2010 school years. The Oregon legislature originally established the State Need
Grant in 1971 to assist “Oregon’s neediest students” in obtaining college educations; this
grant later became the OOG (Oregon Student Assistance Commission, n.d.a). The grant
is funded both by state funds and by two small federal matching programs.
Oregon more than doubled the amount of aid available under the OOG for the
2008-2009 school year (Oregon Student Assistance Commission, n.d.b). In addition,

viii
maximum income levels to qualify for grants were raised from $33,600 per year for a
family of four to $70,000 for a family of four for the 2008-2009 school year, while the
maximum amount offered per year rose from $1,752 to $3,200 for students attending
public Oregon universities (Pardington, 2008b).
The additional funding was expected to reduce the average debt level of a
graduate of a public Oregon university from $19,000 to $12,000. According to Dave
McDonald, associate provost of Western Oregon University, this reduction was expected
to have a large impact on low and middle income students struggling to pay for a college
education (Pardington, 2008b). The money was meant to “fill the gap that is not covered
by student, parent, and federal contributions” (p. A01).
The increases in need-based aid were also hoped to positively impact the ability
of students from “diverse backgrounds” to attend college (Pardington, 2008a). In addition
to increasing minority student enrollment, officials at Oregon’s seven public universities
hoped to attract more students from rural areas with the increased grant money made
available. Kate Peterson, Oregon State University’s assistant provost for enrollment
management, stated “We really need to remove the barriers” (Pardington, 2008a, p. A01).
The increased availability of grant money was expected to enable more lower-income
students to attend Oregon’s public institutes of higher education and also positively
impact retention rates for these same students.
The number of recipients of an OOG in the Oregon University System for
Oregon’s seven 4-year universities for the 2006-2007 school year (the first year of the
study) was 10,271; this number dropped slightly for the 2007-2008 school year to 9,974,

viii
a modest decrease of 2.9%; the total amount of funding dropped from $14,391,288 to
$14,484,638, a decrease of 0.6%. The number of recipients of an OOG in the Oregon
University System for Oregon’s seven 4-year universities rose to 15,822 in the 2008-
2009 school year, an increase of 58.6% from the year before; the total amount of funding
for the same time period rose to $32,502,442, an increase of 124.4% from the year
before. While relatively modest cuts in the number of recipients and total amount of
funding occurred for the 2009-2010 school year (14,752 total recipients and $28,437,093
total funding), funding amounts and beneficiaries still remained well above the 2006-
2007 and 2007-2008 school years, the baseline years of our study. These increases
reflected the changes in policy that were meant to provide a continuing source of funding
for lower SES students pursuing a college degree in Oregon.
The recent national economic crisis and resulting political pressures had a
negative impact on the funding of the OOG. According to figures provided by the Oregon
Student Assistance Commission (n.d.b), the increases provided in the 2008-2009 and
2009-2010 school years were immediately followed by reductions in funding for the
program in the following years. The number of recipients of an OOG in the Oregon
University System for the 2009-2010 school year fell to 14,752, a relatively moderate
decrease of 7.3%; the total amount of funding for the same time period fell to
$28,437,093, a decrease of 14.3%. This trend accelerated the next year; the number of
recipients of the OOG in the Oregon University System for the 2010-2011 school year
fell to 6,267, a reduction of 57.5%, while the total amount of funding for the same time
period fell to $9,774,401, a reduction of 65.6%.

viii
The rise in the amount of funding provided by the OOG presented an opportunity
to test one of the hypotheses that was the foundation of the policy change that increased
funding for the OOG: lower income students who receive higher levels of grant funding
to offset college expenses will be more likely to persist in their educations than those
lower income students who do not receive the same level of grant funding and thus are
forced to rely upon other means such as student loans or employment to pay for college.
The Oregon legislature approved a dramatic increase in funding for the OOG for two
school years (2008-2009 and 2009-2010); this study provides an opportunity to determine
if the policy change was indeed effective in its primary goal of encouraging the retention
of the target population of low income Oregon students.
Statement of the Research Problem
It is hypothesized that lower income students who receive higher levels of grant
funding to offset college expenses will be more likely to be retained in their educations
than those lower income students who do not receive the same level of grant funding and
thus are forced to rely upon other means such as student loans or employment to pay for
college. While past research has supported this hypothesis (Hearn & Holdsworth, 2004;
Mortenson, 1990; Pascarella & Terenzini, 2005; Singell, 2001), there is a lack of recent
research performed within the context of the worldwide recession that started in
December 2007 and the ensuing economic uncertainties that have resulted. In this study I
examined a recent and specific state policy change to determine whether a significant
change in the grant funding provided to lower income students resulted in increased
retention rates for these students. I performed a quantitative analysis to determine if a

viii
relationship existed between the amount of grant funding provided to lower-SES students
and the retention of those students. The assumption that there is a positive correlation
between grant funding and retention for lower income students supports Mortenson’s
economic investment theory in assuming that the higher amounts of grant funding would
reduce the risk and financing costs of the affected students, thus increasing the net
financial benefit to the students and increasing the likelihood of retention. The
assumption further supports the price response theories of Manski and Wise (1983); St.
John, Kirshstein, and Noell (1991); and Stampen and Cabrera (1986, 1988) that posited
that there is a price point for lower income students where the social and economic value
of college attendance outweigh the costs and benefits of alternative activities such as
working; this price point can be achieved through the use of grants and other funding
vehicles that do not require repayment. Similarly, the research assumes the validity of St.
John’s theory of targeted subsidies by tying the impact of a specific targeted subsidy
(grants) on increased persistence rates. Finally, the assumption supports Cabrera et al.’s
(1990) ability-to-pay model by linking the student’s increased ability to pay for college
through the increased grant funding to increased persistence rates.
Purpose of the Study
The purpose of this study is to contribute to the knowledge base by exploring the
research question of whether grant-based funding is positively correlated to retention for
lower-SES students through the analysis of a specific state policy change for student
financial aid. This study was meant to expand upon the existing literature by using
quantitative methods to analyze the impact of a specific policy change for financial aid on

viii
a target population to determine if the desired outcome (increased retention) was
achieved.
Studies have already been performed to suggest a correlation between grant-based
funding for lower income students and persistence rates. Earlier studies rooted in
economic theory used price response theories to posit that students will only attend and
persist in college when the social and economic value of college attendance is of higher
value to students than the costs and benefits of alternative activities such as working
(Manski & Wise, 1983; St. John, 1990a; St. John et al., 1991; Stampen & Cabrera, 1986,
1988).
At this point no specific study had been performed to determine if the policy
change enacted by the Oregon legislature that dramatically increased the amount of
funding for the OOG in the 2008-2009 and 2009-2010 school years was effective. While
the studies cited above that were performed in the 1980s and 1990s lend support to the
prediction that persistence rates are tied to grant funding and thus would have increased
in response to the increases of 2008-2009 and 2009-2010, the data needed to be analyzed
in order to make a definitive assertion. I performed this analysis to determine whether or
not retention was positively correlated to the increased grant funding; the results of the
analysis are presented in chapters 4 and 5.
Significance of the Research
This study examines the results of a state policy change that was implemented to
address, among other concerns, issues with postsecondary persistence by low-SES
students. The study is timely due to the continuing trend of the cost of a college degree
viii
rising at a faster pace than inflation and the lingering effects of the economic recession
that lasted from December 2007 to 2009. As the costs of college continue to rise, the
ability of lower income students to pay for a college degree continues to degrade. Studies
have shown that low income students are less likely to attend and persist in college when
forced to take out loans (Mortenson, 1990). This study analyzed a specific instance where
a state policy change was implemented that was estimated to reduce the average low
income student’s debt load upon graduation from $19,000 to $12,000 (Pardington,
2008b) to test the research question of whether reducing the required debt load of lower
income students increased their retention rates. By analyzing the data for retention of low
income students who received OOGs before and during the state policy change that
vastly increased the amounts of the grants, this study provides quantitative feedback on
the success of such programs in achieving the goal of increased persistence and eventual
graduation of low income students, a goal that President Obama has set as part of his
2020 goal to lead the world with the highest share of college graduates (White House
Office of the Press Secretary, 2012).
By using a statewide data set, this study provides an analysis of the outcomes of
the policy change that can inform policy for states and the federal government when
addressing the concerns of the increasing costs of a college education and the continuing
low graduation rates of low-SES students. Graduation rates for low-SES students have
continued to stagnate under federal and state policies that have reduced grant funding in
favor of student loans; this study will inform the debate on whether the financial aid

viii
model needs to be changed to once again favor grant aid for lower income students rather
than student loans.
Research Methodology and Research Questions
The research question that I examined is as follows: Are the retention rates of
students at 4-year public institutions in Oregon who received increased funding under the
OOG for the 2008-2009 and 2009-2010 school years significantly higher than the
retention rates of the same demographic of students who received the lower funding
amounts in the 2006-2007 and 2007-2008 school years? Ultimately, is there a
relationship between the retention rates for lower income students and the proportion of
unmet need funded by the OOG?
I restricted my study to 4-year public institutions rather than including community
college students in the analysis because the two student populations have significant
differences. Mullin (2012) pointed out that “Community college students have a greater
proportion of students with various risk factors when compared with all of higher
education” (p. 4). In addition, Mullin noted that community colleges provide access to
almost half of all minority undergraduate students and more than 40% of undergraduate
students who are living in poverty. Prince (2006) also found that community college
students are less likely to apply for financial aid than students attending other types of
institutions. Given the significant differences in the student populations of 4-year public
institutions and community colleges, I elected to restrict the study to 4-year public
institutions. However, there is a continuing trend of students choosing the lower-cost
alternative of a community college rather than starting as a freshman at a 4-year

viii
university; a 2012 survey by Sallie Mae showed that the percentage of students enrolled
in a community college increased from 23% in 2010 to 29% in 2012 (Sallie Mae, 2012).
Given this growing trend, an expansion of the analysis to include community college
students is suggested as a future topic of research. A separate study focusing specifically
on the impact of increased grant funding on retention rates for community college
students is also another topic that is worthy of study.
In order to study the question of whether there is a relationship between the
retention rates for lower income 4-year public university students and the amount of grant
funding they receive, I used quantitative research methods. Through the use of a logistic
regression analysis, I analyzed the impact of the increase in grant funding on the
categorical dependent variable, retention from freshman to sophomore year, using the
independent variable percentage of financial need met by the OOG. In order to calculate
this independent variable I first calculated the financial need before the OOG, which
consists of the amount of aid required by the student to pay for the cost of attendance
after all other aid and family sources were considered. I defined the variable financial
need before the OOG as:
• The cost of attendance for a specific school year
o minus the EFC for that same school year
o minus total of all grants except the OOG
o minus total scholarships
o minus total work study
o minus fee remissions.
The independent variable of study is therefore the percentage of financial need
met by the OOG, calculated by dividing the amount of the OOG for the year by the
viii
financial need before the OOG. I examined data for the following school years: 2006-
2007, 2007-2008, 2008-2009, and 2009-2010. My null hypothesis (H0) was that the
retention rates for freshman students at the seven 4-year universities in Oregon for the
2008-2009 and 2009-2010 school years (when the OOG experienced large increases in
funding and award amounts) were not significantly higher than for the 2006-2007 and
2007-2008 school years when the OOG funding was at sharply reduced rates, thus
indicating that there is no relationship between the amount of grant funding provided by
the OOG and the retention rates of those students who were awarded the OOG.
Based on the literature review I performed, one would expect the retention rates
for freshman students at the seven 4-year universities in Oregon for the 2008-2009 and
2009-2010 school years (when the OOG experienced large increases in funding and
award amounts) would be significantly higher than for the 2006-2007 and 2007-2008
school years when the OOG funding was at sharply reduced rates, thus indicating that
there is a relationship between the amount of grant funding provided by the OOG and the
retention rates of those students who were awarded the OOG.
This study had a specific and narrow research question: Are the retention rates of
students at 4-year public institutions in Oregon who received increased funding under the
OOG for the 2008-2009 and 2009-2010 school years significantly higher than the
retention rates of the same demographic of students who received the lower funding
amounts in the 2006-2007 and 2007-2008 school years?

viii
Summary
This chapter describes the real and significant issues facing lower-income
postsecondary students today in terms of financing college educations. Due to a dramatic
shift in financial aid policies for low-income students at the federal, state and institutional
levels away from grant-based to loan-based models, low-income students continue to
realize much lower levels of success than their higher-income classmates in persisting in
college. While the contributing factors to persistence are varied and complex, one
component that has been identified and requires further research is the use of financial aid
as a means to encourage lower-income postsecondary students to persist. Because the
federal government has shifted more of the responsibility for financing higher education
to individual states, there is a need to examine state financial aid policies to determine
how to best apply the scarce resources available to achieve the goal of higher and more
equitable persistence rates for low-income students. The following chapter provides a
review of the literature to further describe the problem, research that has been performed
to date on the problem, gaps in the knowledge, and the conceptual framework used as a
basis for this study that examined the results of a state policy change targeting the
provision of grant-based aid to low-income students as a means of encouraging
persistence.

viii
CHAPTER II
REVIEW OF THE LITERATURE AND CONCEPTUAL FRAMEWORK
Introduction
This chapter begins with a review of the existing literature regarding one segment
of the target student population of this study: college freshmen. Despite decades of
research and a variety of intervention strategies, high levels of freshman dropouts
continue to be an issue (Astin, 1996; Milem & Berger, 1997; Singell, 2001; Terenzini &
Reason, 2005; Tinto, 1993). I conducted a review of the literature to understand the
models, theories, and factors that influence persistence decisions of college freshmen,
along with areas where persisting problems support continued research.
The other component of the target population of the proposed study is lower-
income students. The chapter contains a review of the non-economic and economic
factors that influence persistence for college students, with special emphasis on low-
income college students. The factors that contribute to persistence for low-income
students are varied and oftentimes interdependent. The chapter reviews the evolution of
various theories of student persistence, including a line of study that attempts to identify
integrative models that account for both economic and non-economic factors and the
interaction among the factors. This chapter also contains a description of the different
influences on and stakeholders for college student persistence and related theories. Key
influences on persistence include individual, institutional, federal government, and state
government influences. The chapter describes each of these influences separately and,

viii
where appropriate, also notes where theory has identified relationships and interactions
between individual persistence factors. Cases where research on persistence is
contradictory or incomplete are noted as areas where further research is warranted.
The chapter closes with a description of the conceptual framework that was used
as a basis for this research study. The framework draws upon work by Chen and St. John
(2011) in recognizing the influential role that state postsecondary financial aid policies
play in determining whether at-risk students will persist. The study focused on the
impacts of a specific state financial aid policy on retention using a conceptual framework
adapted from a similar model proposed by Chen and St. John.
Persistence of Freshmen Students
Ample research has shown that the highest college dropout rates occur for college
freshmen. Four-year colleges and universities lose an average of 29% of their first-year
students before they begin their second years (Terenzini & Reason, 2005). Terenzini and
Reason (2005) estimated that more than 60% of college students in a cohort who
withdraw within 5 years do so before the start of their second year; they further noted that
the highest dropout rates are among historically underrepresented, low-income, and first-
generation students.
The transition to college in the first year has long been recognized as a time of
great change that is critical in determining if a student will persist and eventually
graduate. Feldman and Newcomb (1969) described the experiences of a first year college
student as a process of both desocialization and socialization, with the student required to
unlearn old attitudes and shed former behaviors and values, while at the same time

viii
learning and adopting new ones. Drawing upon Tinto’s (1993) theory of student
departure, which posits that students who do not successfully integrate themselves into
the college environment are more likely to depart, Milem and Berger (1997) found that
students who do not successfully involve and integrate themselves into the college
environment within their first six to seven weeks of college have a tendency to remain
uninvolved. Astin’s (1996) theory of student involvement similarly posits that student
involvement is comprised of three key factors: involvement in academics, with faculty,
and with student peer groups. The result of these theories has been a number of first-year
programs that are designed to teach students how to successfully integrate into college,
with the goal of reducing student departure in the first year; however, dropout rates
remain higher for college freshmen than for any other grade level.
Economics also play a role in the persistence decisions of first-year students. In
examining reasons why lower income freshmen are more likely to drop out than their
higher income peers, Bozick (2007) found that affluent students are more likely than
lower income students to have their college educations financed by their parents and to
have the means to live on campus without having to work to pay for room and board.
Conversely, lower income students are more likely to have to work to pay for college and
to live at home to save money, both factors that detract from the student’s involvement on
campus and that have been shown to contribute to a lower likelihood of persistence
(Astin, 1996). One body of research has found that providing financial aid to lower
income students increases the likelihood of persistence from the freshman to sophomore
year. Singell (2001) found that the increasing the amount of need-based aid for first-year

viii
students increases the likelihood of that student persisting to graduation. Pascarella and
Terenzini (2005) similarly found that providing grant funding for lower income freshman
has a positive influence on retention to the sophomore year. However, providing financial
aid is only one component in encouraging at-risk freshman to persist to the sophomore
year. Choy (2001) found that 34% of all entering freshman students were first-generation,
at-risk students; in addition to financial aid, these students require other resources such as
institutional support services in order to encourage persistence.
I chose to focus my study on freshman students because the risk for departure is
greatest for this demographic. While many studies have been performed and theories
have been developed to try to identify and address factors that contribute to the relatively
low rate of persistence for freshman, the departure rate remains high. Additional analysis
and case studies will contribute to the understanding of what influences freshmen to leave
college and how to intervene to ensure persistence.
The body of literature that explores the larger topic of persistence for college
students as a whole contains a wide range of factors and theories. The following sections
explore the main persistence factors that researchers have identified, along with
corresponding theories, concepts, and frameworks.
Noneconomic Factors in Persistence
Most scholars acknowledge that there are both economic and non-economic
factors that influence persistence. Early studies on the subject of persistence tended to
focus solely on either the economic or noneconomic factors, or in the case of early
economic analyses included noneconomic factors with the sole purpose of controlling for

viii
sources of variance that substantially interact with the economic factors. Among the
approaches considered in the noneconomic analyses was the student-institution fit theory.
The student-institution fit theory posits that a student who attends an institution
that provides the academic and social environment that most closely meets the student’s
needs is more likely to persist (Bean, 1980; Spady, 1970, 1971; Tinto 1987, 1993). Tinto
(1987, 1993) posited that a student develops a commitment to his or her college through
academic and social experiences at the college, which play an important role in the
cognitive and affective development of the student; the stronger these commitments, the
higher the likelihood that the student will persist.
Most of the student-institution fit studies did not consider the role of finances on
persistence (Braxton, Sullivan, & Johnson, 1997). Besides Bean (1982) and, in his later
studies, Tinto (1993), these early researchers exploring the student-institution fit model
did not include finances as an independent variable of study. The assumption the
researchers made was that the financial standing of a student and the student’s family
impacted only the student’s aspirations to attend college and the choice of institutions to
attend; once the student was enrolled in college the need was assumed to be met
(Cabrera, Nora, & Castañeda, 1992; St. John, Cabrera, Nora, & Asker, 2000). This
assumption obviously ignores the fact that for lower income students the financial
decisions that impact whether a student persists or drops out are constant; the struggle to
pay for college is one that is ongoing, not a one-time battle.
Pascarella and Terenzini (1991, 2005) also noted that student-support systems,
interaction with faculty and peers, frequent participation in college-sponsored activities,

viii
and affective outcomes with college play a role in persistence. Pascarella, Pierson,
Wolniak, and Terenzini (2004) noted that interaction with peers had significant positive
impacts on learning outcomes for first-generation students, where first-generation
students were defined as college students whose parents had attained no more than a high
school education. In a study performed to determine the effect of various factors in
influencing first-generation students’ learning and cognitive development during college,
the authors found that “noncourse-related interactions with peers had impacts on science
reasoning, writing skills, and educational degree plans that were significantly more
positive for first-generation than for other students” (Pascarella et al., 2004, p. 273).
Conversely, Pascarella and Terenzini (2005) found that attendance at 2-year institutions,
interruptions in attendance, and delaying entrance into college after high school all have
negative impacts on persistence rates.
The study also showed that for first generation students “extracurricular
involvement had significant positive effects on critical thinking, degree plans, internal
locus of attribution for academic success, and preference for higher-order cognitive
tasks” (Pascarella et al., 2004, p. 273). Astin (1984) reported similar findings in an article
where he presented his theory of student involvement. Astin defined student involvement
as “the amount of physical and psychological energy that the student devotes to the
academic experience” (p. 297). Astin theorized that a student’s learning and personal
development is positively correlated to the quality and quantity of the student’s
involvement. Similar to the study performed by Pascarella et al. (2004), Astin noted that
for all students, regardless of family income level, those who participated in

viii
extracurricular activities “of almost any type” or who joined social fraternities or
sororities as part of their academic experiences were more likely to persist (Pascarella
et al., p. 523). Astin also found that those students who could afford to live on campus
were less likely to drop out, regardless of the institution, sex, race, ability or family
background. Astin postulated that those students who live in residence halls have greater
time and opportunity for involvement in campus life.
While the studies that target the non-economic factors that impact persistence all
attempt to provide insight into the factors that most impact a student’s decision to persist
in college, the reality for low-SES students is that economic factors play a critical role in
determining if students attend, persist in, and eventually graduate from college. Inclusion
of economic factors in studies of persistence is critical to ensure that the factors that most
impact a lower income student’s decision to persist are considered. The next section
describes research that has been performed to identify the various economic factors that
influence a student’s decision to persist, including those factors that have a larger impact
on low-SES students.
Economic Factors in Persistence
Analyses that focus on economic factors that substantially impact persistence
decisions include considerations of financial need, student aid packaging, and adequacy
of aid (Cabrera, Nora et al., 1992; Nora & Horvath, 1989; St. John, Paulsen, & Starkey,
1996). Among the competing economic theories linked to student persistence are price-
response theories, the ability-to-pay model, and the theory of targeted subsidies.

viii
The price-response theories posit that the economic and social benefits a student
attains by attending college are greater than the benefits associated with alternative
activities such as full-time employment (St. John, Cabrera et al., 2000). Early studies
performed by Fuller, Manski, and Wise (1982); Manski and Wise (1983); Leslie and
Brinkman (1987); St. John (1990a); Savoca (1990); and Kane (1995) all concluded that,
as would be expected, college enrollment is negatively impacted by increases in tuition,
while Leslie and Brinkman and St. John specifically noted the impact that financial aid
had in serving to reduce student sensitivity to increases in tuition.
Net-price theory, the precursor to the price-response theory, postulated that
students respond to the net-price of college by considering both the cost of tuition and the
amount offered in student aid (Hearn & Longanecker, 1985); low-income students, who
are most sensitive to the cost of college, would therefore be encouraged to enroll and
persist if the amount of aid offered reduced the net-price to a low enough level. This line
of study was later supplanted by research that suggests that low-income students respond
differently to a rise in tuition and a corresponding rise in aid; in other words, even if the
net-price for the student remains the same, if tuition is raised high enough a student may
choose not to persist even if offered a corresponding increase in aid (McPherson &
Schapiro, 1991; St. John, 1990a, 1990b, 1993).
Some scholars have chosen to focus on persistence as a factor of ability to pay.
Ability to pay is “the label given to a composite variable that usually includes measures
of such factors as students’ SES, their perceptions of their and their family’s ability to
finance college, and satisfaction with the cost” (Pascarella & Terenzini, 2005, p. 413).

viii
Conclusions reached through extensive studies by Cabrera and colleagues are that
students’ perceptions of their abilities to pay appear to be positively related to persistence
and educational aspirations, to a significant degree. However, the relationship appears to
be indirect because it positively affects the academic integration and resulting
institutional commitment of the students (Cabrera, Castañeda, Nora, & Hengstler, 1992;
Cabrera, Nora et al., 1992; Cabrera et al., 1990). Cabrera et al. (1990) further theorized
that a student’s perceived ability to pay was a precondition for the achievement of
cognitive and non-cognitive outcomes in college because ability to pay enables the
student to more fully participate in the academic and social aspects of college rather than
forcing the student to work long hours due to financial worries. After examining a sample
of college students from the National Center for Educational Statistics High School and
Beyond 1980 Senior Cohort, Cabrera et al. (1990) concluded that those students who
were satisfied with their ability to pay for college had both higher aspirations and higher
likelihoods of persisting in college than their peers who had less confidence in their
ability to pay and who had lower aspirations.
The related theory of targeted subsidies posits that the way to encourage
persistence is through subsidies that are targeted at different student populations based
upon the students’ abilities to pay. Programs that have been employed to encourage
persistence based upon the ability-to-pay model include reduced tuition, direct grants,
low-interest loans, and subsidized work-study programs; the point of the programs is to
equalize students on their ability to pay for college and to increase the benefits derived
from attending (Bowen, 1977; Cabrera et al., 1990). One category of study on the role of

viii
financial aid in persistence decisions focuses on the overall effect of financial aid on
student persistence (Astin 1975; Murdock 1987; Stampen & Cabrera 1986, 1988);
another category focuses on the sensitivity of persistence decisions to reductions in
tuition and awards in the form of grants, scholarships, and work-study packages (Astin
1975; Nora 1990; St. John 1990a, 1994; St. John et al., 1991; Voorhees 1985).
The analysis of financial theory when studying persistence is complicated by the
fact that there are multiple types of financial aid and that financial aid is often presented
as a package with multiple different types of aid offered to a student—grants, loans,
scholarships, work study, and tuition and fee reductions, among others. Yet studies have
shown that students respond differently to different types of aid and, as can be expected,
persistence decisions also vary depending upon the amount of aid offered. The following
section examines various types of aid, their impacts on departure decisions, and areas
where further study is warranted.
Impact of Types and Amount of Financial Aid on Persistence
Research on student aid has shown that student aid makes low-income students as
likely to persist as their more affluent peers (Leslie & Brinkman, 1988; Murdock, 1987;
Nora & Horvath, 1989; Porter, 1991; St. John, 1990a; Stampen & Cabrera, 1986, 1988).
However, the research on the impact of grants and scholarships on persistence versus
other types of aid such as loans or work-study programs has not resulted in consistent
conclusions. Some studies that controlled for academic performance and other relevant
variables concluded that grants and scholarships were negatively related to persistence
rates, both within-year and year-to-year (Kaltenbaugh, St. John, & Starkey, 1999; Payne,

viii
Pullen, & Padgett, 1996; Somers, 1993, 1996a, 1996b; St. John, Oescher, & Andrieu,
1992; St. John & Starkey, 1995). DesJardins, Ahlburg, and McCall (2002) found that
need-based grants had no impact on persistence (when other relevant variables were
controlled) over a 7-year period and found that merit-based scholarships of equal value
had the largest impact on persistence in each year of the study.
Most of the research however has shown that grant aid has a positive, significant
impact on persistence rates. A number of studies that were performed with nationally
representative samples that controlled for students’ historical academic ability and other
relevant background traits showed the beneficial effects of grants on persistence (Astin,
1993; Clotfelter, 1991; Cofer & Somers, 1999, DesJardins et al., 1999; Dynarski, 2003;
Heller, 2003; St. John, 1990a, 1991; St. John et al., 1991; Wei & Horn, 2002). Some
studies tied specific outcomes in terms of increased educational attainment in years
(Dynarski, 2003) and increased odds of persisting from the freshman to the sophomore
year (Heller, 2003) to grant-based aid, taking into account demographic, academic,
institutional and cost factors. Those studies performed at individual institutions also
typically support the finding that grants and scholarships are beneficial in terms of
persistence and graduation (Fenske, Porter, & DuBrock, 2000; Lam, 1999; McDaniel &
Graham, 2001; Payne et al., 1996; Schuh, 1999).
For low-income students the impact of grant-based aid on persistence appears to
be especially strong, particularly in the first and second year of college. A 1995 study by
the U. S. General Accounting Office found that an additional $1,000 in grant aid to a
low-income student reduced the likelihood of that student dropping out of college in the
viii
first year by 23%. This same study found that the odds of dropping out were reduced by
only 8% in the second year and that grants did not impact a low-income student’s
persistence rates in the third year. Because most dropouts occur between the first and
second years, Pascarella and Tetrezini (2005, pp. 409-410) surmised that a “floor effect”
may explain the decline in the influence grants have on persistence rates. More research
is required to identify the impact of grant based aid on persistence, particularly for the
most vulnerable student populations such as freshmen students and lower income
students.
Additional research has examined the effectiveness of particular types of aid
packages in encouraging minorities to persist (Astin 1975; Nora 1990; Olivas 1985;
St. John 1990b). Olivas (1985) examined student aid packages for disadvantaged
Hispanic students in an attempt to develop baseline data for this particular student
population. His findings included the fact that the majority of disadvantaged Hispanic
students who received aid had a financial aid package from a single source, typically Pell
grants. This fact was significant because Olivas also concluded from his research that the
lack of comprehensive, multi-source financial aid packages had a negative impact on
persistence for Hispanics. In a study of Hispanics at community colleges, Nora (1990)
found the same result for the students in the study: the vast majority did not take
advantage of Supplemental Educational Opportunity Grants, College Work Study, or
National Direct Student Loans, relying instead on single source funding from Pell grants.
Nora’s study did indicate that the Hispanic students in the study who received high levels
of both campus-based aid (Supplemental Educational Opportunity Grants, College Work

viii
Study, or National Direct Student Loans) and non-campus-based aid were more likely to
persist than those students in the study who received low levels of or no aid.
In reviewing the literature from 1990-2008, Hossler, Ziskin, Kim, Cekic, and
Gross (2008) concluded that the receipt of larger amounts of financial aid had a more
positive impact on persistence than the receipt of smaller amounts of aid. The authors
concluded that this result is most likely attributable to the fact that a larger portion of
unmet need is met with larger financial aid amounts. The authors did note that “in most
instances variations in the amount of financial aid accounted for relatively small
proportions of the overall variance in persistence” (p. 103).
Some studies focus on the effectiveness of grants versus loans on persistence. In
their review of the literature from 1990-2008, Hossler et al. (2008) concluded that the
evidence shows that loans are not as effective as grants in promoting persistence.
Research by Hearn and Holdsworth (2004) also made the case that grants promote
attendance much more powerfully than do student loans. While research has shown that
lower socioeconomic students are more likely to graduate if provided with grant rather
than loan-based funding, policy shifts from the 1960s to today have seen erosion in grant-
based aid for low-SES students and an increased reliance on student loans. In the decade
from 1990 to 2000, need-based aid fell nationally from 80% of all aid to 60% (The
College Board, 2000). A study published in 1994 by St. John concluded that a number of
the gains in higher education for high need students that resulted from the expansion of
student aid in the form of grants through the 1970s were eroded with the shift in funding
to student loans. Hearn and Holdsworth found that the move away from grant-based aid

viii
to loan-based aid that has occurred since the 1980s has had a negative impact on lower
income students’ access, choice, and persistence, since all three components are shown to
increase substantially with aid that does not require repayment.
Many studies have focused on the impact of borrowing via student loans on
persistence. Multiple studies have shown a negative correlation between using student
loans to pay for college and persistence, taking into account other factors that influence
persistence. Paulsen and St. John (2002), Somers (1996a), and St. John et al. (1992)
reported on the negative influence of borrowing on persistence into the next semester,
while Murdock, Nix-Mayer, and Tsui (1995) and Somers (1996b) reported on the
negative influence of borrowing on persistence from freshman to sophomore year. Cofer
and Somers (1999) found that higher levels of borrowing were more likely to have a
negative impact on persistence for students attending private colleges (that have higher
tuitions on average) than public institutions; one possible explanation offered by the
authors is the fact that students at the private universities had higher debt levels on
average. Paulsen and St. John found a negative relationship between borrowing and
persistence, particularly for lower-income students, but concluded that the issue was an
overall inadequacy of financial aid in all forms to enable the students to cover their
college costs.
Other studies however have shown either a positive influence of borrowing on
persistence or no statistically significant impact on persistence (Choy & Premo, 1996;
Clotfelter, 1991; Cofer & Somers, 1999; Cuccaro-Alamin & Choy, 1998; DesJardins
et al., 1997; Horn & Berktold, 1998; King, 2002; St. John, 1990a, 1991; St. John et al.,
viii
1991; Wei & Horn, 2002). Hossler et al. (2008) found in their review of the literature that
“the evidence regarding loans is so mixed that their effect on persistence appears to be
small or perhaps even nonexistent” (p. 102). Studies by DesJardins et al. (1997, 1999)
however found that loans did not have a significant impact on persistence during
students’ early years in college but had a negative impact on persistence in later years.
Two potential factors to account for different outcomes for different studies on the impact
of student loans on persistence are the fact that the 1992 amendments to the Higher
Education Act authorized higher loan limits and the continuing rise in tuition and fees.
Both of these factors promote higher debt levels, which Pascarella and Terenzini (2005)
noted may account for negative impacts on persistence and graduation.
Some studies have attempted to distinguish between the different types of loans
and their differing impacts on persistence; failing to distinguish between for example
subsidized and unsubsidized loans can lead to a misinterpretation of the impact of loans
on persistence (Chen, 2008; Singell, 2002). Need-based loans such as Perkins loans and
subsidized Stafford loans have been found to positively impact student persistence, while
loans such as Stanford Unsubsidized loans that are not based on need and are
unsubsidized are found to have little impact on student persistence (Singell, 2002).
The effects of student loans on persistence and graduation are oftentimes difficult
to accurately assess because the loans are part of an aid package that includes grants,
scholarships, work study programs, or some combination of different aid vehicles (Cofer
& Somers, 1999; King, 2002; St. John, 1991; St. John et al., 1991, Wei & Horn, 2002).

viii
Pascarella and Terenzini (2005) also pointed out that the existence of multiple forms of
aid complicates the analysis of the relative importance of any particular form of aid.
The impact of college work-study on persistence has not been widely studied;
those studies that have been performed have mixed results. A study performed by
DesJardins et al. (2002) found that the effects of work-study on persistence were positive,
but diminished after the student finished the first 2 years of college. Some studies found
neither a positive nor negative impact of work-study programs on college (Braunstein,
McGrath, & Pescatrice, 2000; Dowd & Coury, 2006; Somers, 1995; St. John, Hu, &
Tuttle, 2000). Some of these same studies however did indicate that work-study programs
helped to provide incentives to persist for some students such as Latino and low-income
students who are at high-risk of dropping out (Braunstein et al., 2000; St. John, Hu et al.,
2000). St. John (2004) noted that the topic is complicated by the fact that many on-
campus work-study programs pay less than off-campus jobs, and there are therefore
fewer students who are willing to work on campus.
One line of research has indicated that the effects of on-campus work-study are
positive in terms of persistence because this type of aid helps students to socially
integrate into their college communities (DesJardins et al., 2002; St. John, Hu, & Weber,
2001). These conclusions support the earlier research by Tinto (1987, 1993) and Bean
(1980, 1982, 1990) that stressed the strong role that social integration plays in a student’s
persistence. One weakness in drawing conclusions on the role of work-study in
persistence is the fact that few studies have been performed for on-campus work-study

viii
programs that are not funded by the federal work-study program (Baum, McPherson, &
Steele, 2008).
A related line of study by Astin (1984) looked at the impact of working on
campus versus off campus. Astin found that part-time employment in an on-campus job
promotes persistence; he included work-study as part of the analysis. Astin postulates that
on-campus work offers the same benefits as having residential housing on campus: by
spending more time on campus the student increases the likelihood of contact with other
students, professors, and college staff. Astin also theorized that depending upon a college
for employment serves to result in a greater sense of attachment to the college.
Conversely, Astin found that working off campus in a full-time job had a negative impact
on persistence. He theorized that spending significant amounts of time and energy off
campus in pursuits that were not related to academic and student life resulted in
diminished time and energy that the student had available for academic and other
activities.
Focusing solely on the role of financial influences on persistence provides useful
information, particularly for those stakeholders who provide aid and influence financial
aid policy, but the approach also paints an incomplete picture. St. John, Cabrera et al.
(2000) noted that while early studies by Cabrera et al. (1990), Nora (1990), and Vorhees
(1985) focused on the impact of financial aid on persistence, other factors that were
included in the study such as precollege motivational factors, precollege academic ability
and achievement, demographic factors, students’ SES, and college performance were
approached from the perspective of controlling for sources of variance that substantially

viii
interact with the direct effects of financial variables. The emphasis therefore was on the
impact of financial aid on persistence, not on also considering the effects of nonfinancial
factors. Interaction between financial aid and these other factors was not considered, thus
limiting the studies.
St. John, Cabrera et al. (2000) also noted that approaches that include only
economic considerations underestimate the role of the institution in contributing to
decisions by the student of whether to persist. Pascarella and Terenzini (1991) noted that
student-support systems, interaction with faculty, and affective outcomes associated with
college all play a role in the decision of whether to persist, yet these factors were
typically not considered in the early economic-impact studies. The next section discusses
studies that attempt to take an integrative approach in considering both economic and
noneconomic factors in the departure decisions of students.
Integrative (Economic and Noneconomic) Factors in Persistence
St. John, Cabrera et al. (2000) argued that models that focus solely on the role of
economic factors in determining persistence do not provide a complete or true picture of
the role of financial influences in college persistence. “They focus on the influence of aid,
along with the factors that need to be controlled to assess this effect, rather than
attempting to construct a logical model that assesses interactions among all of the
important factors that influence persistence” (p. 31). St. John, Cabrera et al. argued that
issues in methodology and the conceptualization of persistence have hindered the
efficacy of the analyses and conclude that both financial and non-financial components

viii
need to be examined in order to obtain a full picture of the factors that contribute to
student persistence in college.
Early studies examined the role of finances on persistence in the context of non-
financial aspects such as academic factors, the student’s socialization process, satisfaction
with the institution, institutional fit, perceived utility of the education obtained from the
institution, commitment to the goal of college, and intent to persist (Bean, 1982; Bean &
Metzner, 1985; Cabrera et al., 1990). The findings from these studies indicated that while
finances directly impact persistence decisions, they also indirectly affect the student’s
social and academic integration process, as well as the student’s commitment to the
institution and college completion. Thus the role of finances in persistence is intertwined
with other components such as institutional fit and academic performance.
Cabrera, Nora et al. (1992) also studied the direct and indirect effects of finances
on student persistence in conjunction with noneconomic factors such as the influence of
significant others, intent to persist, grade point average (GPA) in college, precollege
academic achievement, academic and social integration, goal and institutional
commitments, and the intent to persist. The list below illustrates the authors’ findings of
the factors that had the largest total effect on persistence; the list runs from largest to
smallest influence:
• The student’s intent to persist,
• GPA,
• Financial aid,
• Commitment to the institution,
• Social integration,
• Precollege academic performance,

viii
• Commitment to degree completion,
• Support from significant others,
• Academic and intellectual development, and
• Finance attitudes.
The study indicated that receiving some form of financial aid facilitated students’
social interactions with other undergraduate students at their institution and the authors
theorized that the financial aid provided more free time to engage in social activities and
to become more socially integrated into the campus life, as well as providing more time
to study and thus more academic success.
St. John et al. (1996) attempted the development of a “nexus model” that merged
the economic perspective with the student-institution fit perspective. However, the
authors noted a flaw in the approach taken: the lack of consideration of the decision-
making process in selecting a college, which does not accurately depict the continuous
and interconnected student decision process. The next iteration of the nexus model
rectified the earlier model’s deficiency by depicting a nexus between college choice and
persistence while also including the role that financial aid related factors play in college
persistence.
St. John et al. (1996) envisioned persistence as a three-stage process. The first
stage determines a student’s predisposition to attend college and perceptions the student
has of personal financial position; these components are influenced by socioeconomic
factors and academic ability. In the second stage the student estimates the costs and
benefits of a particular college in determining whether or not to enroll; financial aid plays
a role not only in the decision to enroll, but in the selection of a particular college. The

viii
third stage is when the student actually enrolls in a college; a variety of non-economic
factors such as characteristics of the college, academic performance and the experiences
of the student while in college impact the educational aspirations of the student, while
positive social and academic experiences reinforced and in some cases enhanced the
student’s perceptions of both the economic and non-economic benefits associated with
enrollment in and eventual graduation from the institution (St. John, Cabrera et al., 2000).
Financial aid was believed to have a positive influence on persistence by balancing the
costs of attending college with the benefits obtained with a degree. The balance between
the costs and benefits of college could be upset by negative influences such as increases
in tuition, thus having a corresponding negative influence on persistence.
The integrative studies that attempt to include comprehensive analyses of the
totality of factors that influence departure decisions, both economic and noneconomic,
are useful in identifying those factors that have the greatest influence on persistence and
the ability of individual factors to interact with other factors. However, different
stakeholders wield different kinds of influence on the student departure decision process,
and thus will be interested in focusing on different pieces of the persistence model. State
legislatures wield large control over state financial aid and tuition through their higher
education policies and funding decisions, and thus are interested in studies that examine
the role of finances and financial aid in the decision to persist; individual institutions are
more likely to be interested in studies that point to the role and influence of university
environments that foster academic and social integration in encouraging students to
persist, factors that are within the control of individual colleges. The next section

viii
examines key stakeholders who wield influence on persistence and the different roles
these stakeholders play in encouraging students to persist.
Influences on Persistence
Different studies pertaining to persistence and the researchers who have studied
the topic focus on different influences on and stakeholders for persistence. The
implications of the different persistence influences for researchers interested in the
subject of persistence are in narrowing the focus of study; a state legislature for example
may be interested in examining the impact of a state policy change in financial aid on
persistence, while an individual university may be interested in the impact of a change in
student advising policy at the university on persistence. The below section describes key
stakeholders who wield influence on persistence, while recognizing that this list is not
exhaustive; the list of stakeholder groups includes individual, institutional, federal
government, and state government influencers.
Finally, while the below influences on persistence are described individually, it is
important to note that in reality different influences work in combination to impact a
student’s decision to persist. For example, a student who receives enough federal and
state financial aid (federal and state influences) to cover the cost of attendance but does
not attend a college that creates an environment that fosters academic and social
integration (institution influences) may not make the decision to persist; conversely, a
student who attends an institution that creates a positive academic and social environment
but does not receive adequate financial aid may elect not to persist. The approach of
describing the influences on persistence individually is not meant to negate the

viii
interactionalist theories proposed by Tinto (1975, 1987, 1992), Astin (1975, 1984, 1993,
1996) and others that describe the student departure process as a dynamic process
between the individual and the environment; the intent is to clarify the different
components that influence a student’s decision of whether to persist.
Individual Influences on Persistence
Tinto’s (1987, 1993) research into institution-fit theory described various
individual factors that determine whether a student will persist in college. Tinto posited
that a student develops a commitment to his or her college through academic and social
experiences at the college, which play an important role in the cognitive and affective
development of the student; the stronger these commitments, the higher the likelihood
that the student will persist. While the institution controls to a large degree the
encouragement and offering of academic and social environments conducive to
institutional-fit, the student individually also bears responsibility for engaging in the
activities that contribute to the commitment to graduate, as well as bringing to the process
individual attributes, skills, intentions and commitments (Tinto, 1987).
Psychological theories of persistence view a student’s departure decisions as
influenced mainly by attributes that reflect an individual’s psychological characteristics
(Chen, 2008). Psychological theories posit that departure is reflective of the student’s
psychological response to the environment and due mainly to the student’s willingness or
ability to persist in college. Bean and Eaton (2000) described four main psychological
sub-theories for persistence and dropout behavior: attitude-behavior theory, the coping
behavioral approach theory, self-efficacy theory, and the attribution (locus of control)
viii
theory. Bean and Eaton drew upon Fishbein and Ajzen’s (1975) definition of attitude as
whether a person has a favorable or unfavorable opinion of an object in helping to define
the attitude-behavior theory. Bean and Eaton postulated that a student’s attitude toward
college, which has been shaped by previous experiences, individual abilities, and self
assessments, leads to the student’s behaviors, including the decision to persist or drop
out. The coping behavioral approach theory describes a person’s ability to adapt in a new
environment; students who are able to adapt to their new college environments are more
likely to persist than those students who struggle to adapt. Self-efficacy theory is
concerned with a person’s belief in himself or herself as capable of dealing with specific
situations; those students who believe they are able to cope with the changes and
challenges posed by college are more likely to persist. Attribution theory is concerned
with whether the individual has a strong internal locus of control; those students who
believe they are in charge of their own destinies are more likely to believe that they are
responsible for their own college success.
One limitation of viewing persistence decisions as the result of an individual’s
strengths or weaknesses through the lens of various psychological theories is the failure
to account for the influence of external and social factors (Chen, 2008). In addition, the
focus on individual influences fails to take into account the role of financial aid and
tuition price in making the determination of whether to persist (St. John, Cabrera et al.,
2000). An examination of institutional influences on persistence helps to provide a more
complete view of the departure process.

viii
Institutional Influences on Persistence
There are a number of researchers who have focused on the institutional
influences on persistence. Tinto (2002) went so far as to say “it is my view that student
persistence is primarily an institutional event and therefore primarily the responsibility of
the institution” (p. 7). Tinto (1975, 1993) stressed the need for successful academic and
social integration as integral to a student’s decision to persist with his theory of individual
student departure. Tinto also emphasized the importance of interaction with faculty and
student peers as components of the academic and social integration. While the student
individually has a responsibility to pursue the activities that promote institutional fit (see
prior paragraphs on Individual Influences on Persistence), the individual institution also
bears responsibility for creating an environment that promotes academic and social
integration for students and creating an organizational culture that promotes faculty
interaction with students.
Chen (2008) pointed to the following organizational attributes of higher
educational institutions as major influences on a student’s socialization patterns that
influence the student’s departure decisions: structure, size, faculty-student ratios, and
institutional resources (p. 213). Swail (2004) specified course availability, course content,
instruction, and support mechanisms such as tutoring, mentoring, and career counseling
as institutional influences on a student’s ability to persist. Kuh, Schuh, Whitt, and
Associates (1991) made the specific point that institutions themselves impact student
involvement. Kuh et al. noted that “involving colleges” provide the best environment for
student learning and development, echoing earlier research by Tinto (1975, 1993) in

viii
making the point that student involvement promotes greater integration in the social and
academic systems of the institution, thus promoting institutional commitment.
Astin’s (1975, 1984) theory of involvement similarly suggests a powerful link
between student persistence and the student’s involvement in college. Astin (1984)
defined student involvement as “the amount of physical and psychological energy that the
student devotes to the academic experience” (p. 297). Astin (1996) later expanded upon
his earlier student involvement model with a review of 20 years of national data spanning
thousands of students; the results confirmed that student involvement continued to
powerfully promote student outcomes. Astin (1996) specifically identified that
involvement with academics, faculty, and student peers represent the most powerful
forms of positive involvement. One can therefore conclude that institutions who provide
a supportive environment for student learning and who encourage positive faculty and
student relationships can positively influence student outcomes and persistence.
Tinto (1992) stated that one limitation to studies of the role of institutions in
student departure decisions is the fact that these studies do not actually include lower-
level factors such as students’ interactions with peers and faculty, factors that might
mediate the organization effects of student behavior. Berger (2000) also noted the need to
consider individual students rather than drawing conclusions from aggregated student
outcome data at the institutional level.
Much of the research that focuses on the role of the individual institution in
promoting student persistence has a basis in Tinto’s (1975, 1993) theory of individual
student departure and Astin’s (1975, 1984, 1996) theory of student involvement. Both

viii
theories provide a foundation for the premise that individual institutions have the
capabilities to apply resources to develop and promote environments that encourage
student involvement and thus encourage student persistence. However, individual
institutions are only one piece of the persistence equation; the federal and state
governments also play roles in influencing student persistence.
Federal Government Influences on Persistence
According to King (2002) of the American Council on Education’s Center for
Policy Analysis, the federal government has four primary interests in student persistence:
1) Ensuring that federal student aid funds are used productively.
2) Helping low-income students who have gained access to postsecondary succeed once enrolled.
3) Holding colleges and universities accountable by tracking student attainment.
4) Producing information on national trends in education, including persistence.
(p. 2)
The federal government’s role in helping low-income students succeed in their
postsecondary educations is achieved in large part through Title IV student aid and
academic support programs, including eight programs to serve and assist low-income
students, first-generation college students, and disabled individuals in succeeding from
middle school through postsecondary education. Funding for these programs is provided
directly to the institutions, not individual students.
Federal student financial aid programs are designed to minimize the need of lower
income students to work, freeing their time to devote to academic pursuits. Historically,
Pell grants met the requirement for need-based aid through 1978, when the Middle

viii
Income Student Assistance Act was passed, raising the threshold of income requirements
for Pell grants and leaving less money available to lower-income students (St. John,
2003). Mortenson (2011a) reported that the purchasing power of the Pell grant maximum
award at public universities declined from approximately 65% of total institutional
charges in the 1970s to less than 30% by 2007-2009.
Federal grant aid began to decline in the 1980s, while federal student loans for
college began to increase. Taking inflation into account, federal student loans for college
students increased 125% during the 1990s, while federal grants for students increased by
only 55% (The College Board, 2000). More recently, 40% of undergraduate students in
the 2006-2007 school year received federal student loans (The College Board, 2007). One
outcome of the shift from federal grants to student loans as funding sources for higher
education has been the impact on persistence; Hearn and Holdsworth (2004) made the
case that grants promote persistence much more powerfully than do student loans.
Heller (2001) also pointed out that federal student aid policies can have
unintended consequences. Heller noted that federal funding formulas that reward colleges
and universities who achieve broader racial and ethnic diversity among their students will
therefore encourage colleges to find ways to increase access for minority students;
however, he also points out that performance-based funding approaches that reward
institutions for increasing their graduation rates may also work against the goal of access
for minority and lower-income students, two groups that are often at higher risk of
dropping out of college.

viii
A 2010 report to Congress and the Secretary of Education that was issued by the
Advisory Committee on Student Financial Assistance included findings that low- and
moderate-income students have significantly lower graduation rates than higher income
peers. The Advisory Committee on Student Financial Assistance found that available
grant aid from all sources (including the federal government) was not sufficient to ensure
access and persistence of qualified low- and moderate-income students. The study
concluded that “Shielding academically qualified low- and moderate-income students
from rising public college prices is a national imperative” (p. iii).
While the factors that influence persistence of lower income students are varied,
federal financial aid policies such as those governing Pell grants have been shown to have
real impacts. Because the federal government has shifted from financial aid policies that
favor grants to those that favor loans, the role of filling need-based aid has increasingly
shifted to state governments. Given the increasing role that state governments are asked
to play in ensuring access and persistence for low-income students, more research is
needed to analyze the impact of financial aid policy decisions at the state level. The next
section explores the changes in the role that state governments have played in funding
higher education for lower-income students and the implications for persistence.
State Government Influences on Persistence
The role that state governments play in influencing higher education access and
persistence has shifted over time. The federal government began sharing the
responsibility for subsidizing college students with the states in the 1950s; the intent of
the subsidies was to provide equal opportunity to attend college regardless of income
viii
(McPherson & Schapiro, 1998). States have traditionally provided funding for higher
education mainly to public institutions in order to maintain low tuitions and promote
equal access (Chen & St. John, 2011). However, three national reports in the early 1970s
(Carnegie Commission on Higher Education, 1973; Committee for Economic
Development, 1973; Newman, 1971) made recommendations that states shift from a low-
tuition policy to one where college costs are shared between the states and students and
their families (resulting in increased tuitions); low income students would continue to be
provided access through need-based aid to enable them to afford the higher tuitions
(Chen & St. John, 2011). This model was the norm until the 1980s, when most states
began raising tuition without providing corresponding increases in need-based grants.
Weerts and Ronca (2006) reported that state appropriations for higher education
have declined 40% from 1978 to 2006. At the same time, the cost of tuition has risen
sharply (Callan, 2001; Hauptman, 2001; Heller, 2006). Mortenson (2011c) noted that
states have reduced their annual investment in higher education from approximately
$10.55 per $1,000 of state personal income between FY1976 and FY1980 to $6.30 per
$1,000 by FY2011. As a result, public institutes of higher education have been forced to
increase their tuition and fees to make up for the reductions in state financing. The
average cost of tuition and fees at state flagship universities for resident undergraduate
students in the U.S. increased 247% from 1980 to 2009 (using constant 2009 dollars); the
average cost of tuition and fees at state regional universities and colleges for resident
undergraduate students in the U.S. increased 230% for the same time period (Mortenson,
2011c). Ehrenberg (2006) further stated that a larger share of shrinking state higher

viii
education funding is now being provided in the form of merit-based grants—a form of
aid that tends to favor educationally advantaged students instead of those from lower
socioeconomic strata—rather than appropriations to public institutions to help fund their
operations costs and thus reduce the need to raise tuitions.
Recent research into state financing policies for higher education financial aid can
be divided into two categories: the first is focused on state merit-based aid, and the
second is focused on state need-based aid (Chen & St. John, 2011). Research on state
merit-based aid has provided mixed results (Chen & St. John, 2011). Students in New
Mexico who received merit-based aid in the form of New Mexico Success scholarships
had lower retention rates (Binder, Ganderton, & Hutchens, 2002). Other studies that
examined the impacts of Georgia’s Helping Outstanding Pupils Educationally (HOPE)
merit-based scholarships on student persistence noted a higher chance of persistence and
graduation for recipients (Dynarski, 2003; Henry, Rubenstein, & Bugler, 2004).
Some studies on the impact of state-provided need-based aid have focused on
national data samples. Titus (2006) performed a national study on the impact of state
need-based aid and found that, in 48 of the states, the need-based aid was positively
related to graduation at 4-year institutions. Chen and St. John (2011) pointed out that a
limitation of the study was the fact that the researcher did not include state funding on
non-need-based aid in the study. Chen and St. John performed a study that examined the
relationship between state higher education financing policies and student outcomes at 4-
year institutions and how the results vary across various student subgroups; findings
included the fact that SES factored heavily into whether students persisted to graduation,

viii
with high-SES students having 55% higher odds of graduating than low-SES students. In
addition, the results of the study showed that there was a positive relationship between
the ration of state need-based aid and the cost of public tuition (state need-aid/public
tuition) and graduation from students’ first institutions, which the authors argue points to
the need for coordination between state grant programs and tuition policies.
Some scholars approach the analysis of the impact of state-provided need-based
aid by examining outcomes within a single state; results have been inconsistent. One
study performed for the state of Washington found that increases in grants were
associated with increased persistence rates as well as a reduction in the inequalities in
persistence for minority and majority students (St. John, 1999). In a study performed in
the state of Indiana, researchers could not identify a statistically significant relationship
between state grants and student persistence in any of the three cohorts studied (St. John,
Hu et al., 2001). Given the challenges facing most states in allocating their budget dollars
in tight economic times, the inconsistencies in findings for state-funded need-based aid
programs points to the need for further single-state studies. Specific analyses that can
compare the outcomes of specific financial aid policies can help to inform state
legislatures that are considering the role of state policy in providing need-based aid to
lower income students as a means to promote access and persistence.
This study examined the influence of a state legislature financial aid policy
change on persistence rates for lower-income freshman students at public, 4-year
institutions in the state of Oregon. Choosing to focus on financial aid at the state level
influenced the conceptual framework that was used for the study. The intent of this study

viii
was to provide information on the impact of increases in need-based aid provided by the
state as a means of informing and impacting state policies on postsecondary financial aid.
The conceptual framework described below controls for the impact of individual student
background characteristics on persistence while focusing on determining whether
increased state need-based aid impacts persistence rates of lower-income students.
Conceptual Framework
In a national study on the influence of state financial policies on college student
persistence, Chen and St. John (2011) noted that while theories regarding the persistence
of college students have evolved over decades, most have focused on institutional or
individual attributes while ignoring state-level factors. The authors note the early
influences of Tinto (1975, 1987) on theories supporting the role of a student’s academic
and social integration in impacting persistence and the influences of Bean (1980) and
Berger and Milem (2000) on theories supporting the role of institutions in impacting
persistence. Chen and St. John noted the value these two theoretical frameworks have
provided in the study of persistence while also pointing out the need to consider the role
of state financing on the student decision-making process.
Recent research has more fully considered the role of financial factors in student
persistence. St. John (2006) posited that both student characteristics and state financing
policies influence student outcomes and persistence decisions, including a state’s
expenditures on need-based grants, non-need-based grants, and institutional funding that
impacts tuition; he concluded that there is a need to control for financial factors as well as
the influence of the students’ demographic backgrounds and academic preparations.

viii
Other scholars have found a relationship between differences in student backgrounds and
how a student responds to financial aid (Chen, 2008; Chen & DesJardins, 2008, 2010;
Heller, 1997; Leslie & Brinkman, 1987). These scholars therefore promote a framework
that tests the interaction effects between aid and student background characteristics such
as SES and race/ethnicity (Chen & St. John, 2011).
This study is based upon the conceptual framework developed by Chen and St.
John (2011) that integrates components of theories by Tinto (1975, 1987), Bean (1980),
Berger and Milem (2000), St. John (2006) and the heterogeneous approach of Leslie and
Brinkman (1987), Heller (1997), Chen (2008), and Chen and DesJardins (2008, 2010).
Chen and St. John’s model includes independent variables for student attributes
(race/ethnicity, gender, SES, postsecondary plans, high school GPA, unmet need,
academic integration, social integration, and first-year GPA) and institutional attributes
(institutional control or whether the institution is public or private and institutional
selectivity, ranked as low, medium, and high). Chen and St. John’s model controls for
these student and institution level factors; my model controls for student level factors
only, including independent variables for GPA, gender, race and ethnicity.
While the intent of Chen and St. John’s (2011) study was to determine the impact
of state-level financial policies across a national sample on persistence at the students’
first institution as well as to determine differences in the impact of the state-level
financial policies by SES and racial/ethnic background, the intent of my study was to
examine the impact on persistence of a specific state policy change on a single subgroup
(lower income freshman students). I therefore controlled for the student level factors but
viii
did not categorize results by individual factors such as SES or racial/ethnic background.
Chen and St. John’s dependent variable is a dichotomous variable defined as persistence
through graduation (0 if the student did not graduate from the student’s first institution, 1
if the student did graduate from the student’s first institution). Due to the focus of my
study on freshman students, my dependent variable is a dichotomous variable defined as
retention from freshman to sophomore year (0 if the student was not retained from
freshman to sophomore year within the same institution, 1 if the student was retained
from freshman to sophomore year within the same institution).
Summary
Ample literature exists that describes the continuing persistence problem of
freshman students. Given the scope of the problem—one study of 4-year colleges and
universities found that they lose an average of 29% of their first-year students before they
begin their second years (Terenzini & Reason, 2005)—more research is required that
focuses on this critical period in the student persistence model. While recognizing the
criticality of integrating the freshman student quickly into the college environment in
order to avoid early departure, decades of research into the specific persistence issue
posed by the freshman student have failed to provide adequate solutions to stop the high
levels of students who depart before their sophomore year. More research is needed to
identify the efficacy of potential means of addressing freshman departure, including both
economic and noneconomic approaches. This study approaches the question of freshman
retention through the lens of state-provided need-based aid, thus focusing the research
specifically on the at-risk student population of low-income freshman students.

viii
While the literature acknowledges that multiple factors influence a student to
persist, specific stakeholders have different spans of control over their contributions to
student persistence; state legislatures for example can control financial aid and tuition
through policy decisions. Chen and St. John (2011) recognized the influential role that
state postsecondary financial aid policies play in determining whether at-risk students
will persist while acknowledging a dearth of research that focuses upon the impact of
different policies. This study focuses on the impacts of a specific state financial aid
policy on retention using a conceptual framework adapted from a similar model proposed
by Chen and St. John. Chapter 3 describes the methodology that was used for the study,
including the quantitative methods that were used to examine whether the increase of
state-funded need-based aid had a significant impact on retention of lower-income
freshman students at 4-year, public universities in the state of Oregon over a 2-year
period.

viii
CHAPTER III
METHODOLOGY
Introduction
The research question that I examined is as follows: Are the retention rates of
freshman students at 4-year public institutions in Oregon who received increased funding
under the OOG for the 2008-2009 and 2009-2010 school years significantly higher than
the retention rates of the same demographic of students who received the lower funding
amounts in the 2006-2007 and 2007-2008 school years? Ultimately, is there a
relationship between the retention rates for lower income freshman students and the
proportion of unmet need funded by the OOG?
The following sections provide a justification for using quantitative research
methods for the study; a description of the research design, the research hypothesis, and
the dependent and independent variables of study; a description of the study settings and
participants; a description of the Oregon University System Student Centralized
Administrative Reporting File (SCARF) database from which the data for the study was
provided and the methods used to populate the database; the procedures used to collect
the data; the methods I used to analyze the data; a description of ethical considerations
that pertain to the study; and threats to the internal validity of the study. I close with a
description of limitations of the study.

viii
Appropriateness of the Research Design
My research study fits the model for quantitative research methods. Below I
compare my study to Cresswell’s (2005, p. 44) description of the criteria for quantitative
research. According to Cresswell, quantitative research:
• Is used to study research problems requiring a description of trends or an explanation of the relationship among variables. My study examined the relationship between the amount of grant funding provided to lower income students under the OOG and the retention rates of freshman students receiving an OOG.
• Uses literature to play a major role, justify the research problem and create a need for the direction (purpose statement and research questions or hypotheses) of the study. There is ample literature citing the challenges facing lower SES students in terms of persisting in their higher educational studies; specific research points to a correlation between the use of grants (versus loans) for financing college for these students and increased persistence rates.
• Has specific and narrow purpose statements, research questions, or
hypotheses and seeks measurable, observable data on variables. This study has a specific and narrow research question: Are the retention rates of freshman students from freshman to sophomore year at 4-year public institutions in Oregon who received increased funding under the OOG for the 2008-2009 and 2009-2010 school years significantly higher than the retention rates from freshman to sophomore year of the same demographic of students who received the lower funding amounts in the2006-2007 and 2007-2008 school years? The study also sought to use the data collected by the OSAC on retention rates for freshman students receiving OOGs.
• Data collection consists of collecting data using instruments with preset
questions and responses, gathering numeric (numbered) data, and collecting information from a large number of individuals. For this study I analyzed data for all freshman students receiving OOGs in the state of Oregon who were attending 4-year institutions for the 2006-2007, 2007-2008, 2008-2009, and 2009-2010 school years and analyzed specific data such as retention rates from freshman to sophomore year, average cost of attendance, expected family contribution, and amount of funding provided with the OOGs.
viii
• Data analysis consists of statistical analysis and involves describing trends, comparing group differences, or relating variables. Interpretation consists of comparing results with prior predictions and past research. This study employed a logistic regression analysis to determine the relationship between increased grant funding under the OOG and increased retention rates from freshman to sophomore year for students who receive OOGs.
• Research reports use standard, fixed structures and evaluative criteria.
Researchers take an objective and unbiased approach. Conclusions were drawn based upon the results of the statistical analysis to determine if a relationship existed between the two variables of study; I controlled for the impact of other independent variables such as mother and father’s educational attainment and race/ethnicity.
Research Design
I used a quantitative research design that compared fall-to-fall retention rates from
freshman to sophomore year of four different groups of freshman students at 4-year,
public universities in the state of Oregon. The term retention for the purposes of this
study referred to whether a student who registered as a freshman during Fall term
completed at least one credit hour during freshman Fall term and registered for at least
one credit hour the following Fall term at the same institution. The term freshman for the
purposes of this study was defined as a student who registered as a first-time
undergraduate student during Fall term and did not transfer credits from another college
or university earned subsequent to high school graduation.
This is a non-experimental, comparative design that compared the fall-to-fall
retention rates of freshman students in the 2006-2007 and 2007-2008 school years who
received lower amounts of funding under the OOG program against the retention rates of
freshman students in the 2008-2009 and 2009-2010 school years who received the

viii
increased amounts of funding under the OOG program to determine if increases in the
OOG funding resulted in higher retention rates for those students who received an OOG.
The purpose of the design was to test the primary hypothesis that the retention
rates from freshman to sophomore year for students at the seven 4-year universities in
Oregon for the 2008-2009 and 2009-2010 school years (when the OOG experienced large
increases in funding and award amounts) would be significantly higher than for the 2006-
2007 and 2007-2008 school years when the OOG funding was at sharply reduced rates,
thus indicating that there is a relationship between the amount of grant funding provided
by the OOG and the retention rates of those students who are awarded the OOG.
Through the use of a logistic regression analysis, I analyzed the impact of the
increase in grant funding on the categorical dependent variable, retention from freshman
to sophomore year, using the independent variable percentage of financial need met by
the OOG. This variable represents the amount of unmet need satisfied by the awarded
OOG after the cost of attendance and other aid were taken into account.
Setting and Participants
Data collected were for first-time freshmen for all seven of the 4-year public
universities within the Oregon University System in the state of Oregon. These seven
universities, their locations, and descriptions provided by the Oregon University System
(n.d.a) are listed below.
• Eastern Oregon University, La Grande. “Serves students and communities throughout Oregon with a special focus on rural, regional and distance learning. Programs are delivered on campus, online and onsite in La Grande and at 16 regional centers and include liberal arts, business, education and cooperative programs in agriculture, nursing and dental hygiene” (“Campus Websites,” para. 1).
viii
• Oregon Institute of Technology, campuses in Klamath Falls and Portland. “The Northwest’s only polytechnic institution, OIT serves the state with programs in business, engineering and health technologies, and a cooperative programs in dental fields and nursing” (“Campus Websites,” para. 2).
• Oregon State University, campuses in Corvallis and Bend. Corvallis Campus:
“A land, sea, sun, and space grant university with programs in the liberal arts and sciences, and professional programs in agricultural sciences, business, education, engineering, forestry, health and human sciences, oceanography, pharmacy, and veterinary medicine” (“Campus Websites,” para. 3). Bend Campus: “A branch campus on the site of its major partner, Central Oregon Community College (COCC). OSU and its collaborating program providers offer a wide array of student services and a growing number of degree programs in arts and sciences, business, education, natural resources, and recreation” (“Campus Websites,” para. 4).
• Portland State University, Portland. “A large, diverse urban public university
located in the heart of Portland, PSU offers programs in fine and performing arts, liberal arts and sciences, business administration, education, urban and public affairs, social work, engineering and computer science” (“Campus Websites,” para. 5).
• Southern Oregon University, Ashland. “Provides liberal arts and sciences
programs, and professional programs in business, education, and performing arts; and a cooperative program in nursing” (“Campus Websites,” para. 6).
• University of Oregon, Eugene. “A major liberal arts and sciences university
with professional programs in architecture and allied arts, business, education, journalism, law, music and performing arts, and planning and public policy” (“Campus Websites,” para. 7).
• Western Oregon University, Monmouth. “Provides programs in liberal arts
and sciences, professional programs in education, business, and public services, and a cooperative program in nursing” (“Campus Websites,” para. 8).
Participants in the study are freshman students from the seven 4-year universities
in Oregon who received funding under the OOG over the 4 years of study. The threshold
for family income levels that determine eligibility for an OOG was raised from $33,600
in the 2007-2008 school year to $70,000 in the 2008-2009 school year. I restricted the

viii
data for all 4 years of the study to students whose Free Application for Federal Student
Aid (FAFSA) parental adjusted gross income was $33,600 or less for the 4 years of study
in order to ensure that I analyzed students from the same population. I also restricted the
data to students who were:
• undergraduates,
• first-time freshmen,
• residents of the state of Oregon, and
• attending a 4-year public institution.
I restricted my study to 4-year public institutions rather than including community
college students in the analysis because the two student populations have significant
differences. Mullin (2012) pointed out that “Community college students have a greater
proportion of students with various risk factors when compared with all of higher
education” (p. 4). In addition, Mullin noted that community colleges provide access to
almost half of all minority undergraduate students and more than 40% of undergraduate
students who are living in poverty. Prince (2006) also noted that community college
students are less likely to apply for financial aid than students attending other types of
institutions. Given the significant differences in the student populations of 4-year public
institutions and community colleges, I elected to restrict the study to 4-year public
institutions.
Instrumentation Used to Collect the Data
Data for this study is from the SCARF, which is collected and maintained by the
Oregon University System. Data for the study is from the 2006-2007, 2007-2008, 2008-
2009, and 2009-2010 school years.

viii
The purpose of the SCARF is to gather student- and course-related data to support
centralized reporting, analysis, and planning, as well as the development of educational
programs. SCARF is
an Extraction Transformation/Validation and Load (ETL) system comprising student and course information for each institution in the Oregon University System (OUS). SCARF is built and maintained by the Office of Institutional Research (OUS-IR) from records submitted by each OUS institution according to a standard reporting schedule. The records are submitted electronically as a “flat” text file delimited by the “|” (pipe) character. (Oregon University System, n.d.c, “Scarf Data Dictionary Introduction,” para. 1)
Appendix A contains a description and diagram provided by the Oregon University
System of the method used to extract, transform, and load the data in SCARF.
The data for this research study were requested from and approved by the Oregon
University System through a data sharing agreement (Appendix B), pending approval of
the dissertation proposal. Note that a revised version of Exhibit 1 of the data sharing
agreement (Appendix C) was submitted on November 9, 2012, to expand the number of
fields requested and clarify the dependent variable of study. The data were obtained on
February 7, 2013, following the successful defense of the dissertation proposal on
November 28, 2012. The data were provided in Microsoft Excel files that contained no
identifying information for the student records; random identifiers were used for each
student.
Procedure
The data for this research study was provided by the Oregon University System
through a data sharing agreement (Appendix B). I agreed to comply with all applicable
federal and state law regarding the use, maintenance, and re-disclosure of Subject Data

viii
including, but not limited to, the Family Educational Rights and Privacy Act, and the
Oregon Consumer Identity Theft Protection Act (2007).
This study used human subjects and is compliant with the U.S. Department of
Health and Human Services (2009) Code of Federal Regulations, 45 CFR § 46.102. The
research involved secondary data provided by the Oregon University System that did not
contain identifiers; codes were used in place of student identification numbers. This study
met the four criteria identified by the Human Subjects Research Review Committee at
Portland State University for “no review required.” Following the successful defense and
approval of the dissertation proposal I submitted the form requesting a waiver of the
Institutional Review Board review to Human Subjects Research Review Committee and
received approval for this waiver; a copy of the approved request form is included in
Appendix D and a copy of the waiver memo is included in Appendix E. The four criteria
for no Institutional Review Board review required are:
1. All identifying information has been removed and data cannot be linked back to individuals.
2. No contact with subjects is/was involved.
3. Data has been previously collected by another investigator.
4. Data already exists.
In addition, any personally identifiable information obtained from Oregon
University System was kept confidential and such personally identifiable information was
used only to meet the purposes of the research, adhering to the conditions specified by
Oregon University System.

viii
Data Processing and Analysis
For the analysis of the data I used a logistic regression analysis. This analysis is
appropriate based on the following criteria provided by Cresswell (2005):
• Each analysis is meant to predict membership in one of two groups:
o Either the student was retained from freshman to sophomore year or was not retained.
• The independent variable, the percentage of financial need that was met by the amount of funding provided through the OOG, is continuous.
• The dependent variable, whether a student was retained from freshman to sophomore year, is dichotomous.
Through the use of a logistic regression analysis, I analyzed the impact of the
increase in grant funding on the categorical dependent variable, retention from freshman
to sophomore year, using the independent variable percentage of financial need met by
the OOG. In order to calculate this independent variable I first calculated the financial
need before the OOG, which consists of the amount of aid required by the student to pay
for the cost of attendance after all other aid and family sources are considered. I defined
the variable financial need before the OOG as:
• The cost of attendance for a specific school year
o minus the EFC for that same school year
o minus total of all grants except the OOG
o minus total scholarships
o minus total work study
o minus fee remissions.
The independent variable of study is therefore the percentage of financial need
met by the OOG, calculated by dividing the amount of the OOG for the year by the

viii
financial need before the OOG. I examined data for the following school years: 2006-
2007, 2007-2008, 2008-2009, and 2009-2010. My null hypothesis (H0) is that the
retention rates for freshman students at the seven 4-year universities in Oregon for the
2008-2009 and 2009-2010 school years (when the OOG experienced large increases in
funding and award amounts) would not be significantly higher than for the 2006-2007
and 2008-2009 school years when the OOG funding and individual award amounts were
at sharply reduced rates, thus indicating that there is no relationship between the amount
of OOG funding awarded to individual students (and thus the amount of unmet need met
by the OOG) and the retention rates of those students who are awarded an OOG. Based
on the literature review I performed, one would expect the retention rates for freshman
students at the seven 4-year universities in Oregon for the 2008-2009 and 2009-2010
school years (when the OOG experienced large increases in funding and award amounts)
would be significantly higher than for the 2006-2007 and 2007-2008 school years when
the OOG funding and award amounts were at sharply reduced rates, thus indicating that
there is a relationship between the amount of grant funding awarded to individual
students through the OOG (and thus the amount of unmet need met by the OOG) and the
retention rates of those students who were awarded the OOG.
In order to determine the unique association between percentage of financial need
met by the OOG and retention, I controlled for other independent variables that previous
research has shown to influence retention and persistence. These variables are listed in
Table 1.

viii
Table 1 Independent Control Variables in the Analysis
Independent Control Variable Name
Reason for Inclusion in Study
Student Information
Ethnicity Studies have been performed that examine the effectiveness of particular types of student aid on the persistence rates of minority students (Astin 1975; Olivas 1985; Nora 1990; Nora and Horvath 1989; St. John 1990); it was therefore important to include this variable in the study to account for any effects that might have been caused by differences in ethnicity among the students in the data set.
Institutional GPA GPA has been shown to be positively correlated to persistence (e.g., Cabrera, Nora, & Castañeda, 1992).
FAFSA Father’s Educational Level and FAFSA Mother’s Educational Level
Research has shown that children of parents who did not attend or graduate college are significantly less likely to enroll in and graduate from college; in addition, first generation students are more likely to have dropped out of college than their counterparts whose parents had obtained college degrees (Choy, 2001).
Ethical Considerations
The confidentiality of the study data was maintained at all times and identification
of participants was not available during or after the study. I ensured the confidentiality of
the students in the data set provided by Oregon University System by using the following
measures:
1. Students were identified using a personal identifier code generated by the Oregon University System.
2. Data were kept secure via means of locked facilities (my residence) and a password-protected, encrypted laptop computer.
3. I password protected the subject data obtained and changed the password every 3 months.
4. I used encryption when transmitting the subject data electronically.
5. I did not release any unitary data.

viii
Threats to Internal Validity
Because the subjects of my study were not assigned, my study is by definition a
non-experimental design. I chose to analyze the eight factors described by Campbell and
Stanley (1963) as threats to internal validity for my research design. Internal validity is
defined as the “extent to which the results of a study can be attributed to treatments rather
than flaws in the research design” (Vogt, 1993, p. 114). Campbell and Stanley
recommended controlling for eight potential threats to internal validity in order to avoid
confounding the resulting analysis with one or more of these factors. The eight factors are
listed in Table 2, with a description of their applicability to my research study.
Table 2 Threats to Internal Validity of Experimental Research Designs
Internal Validity Threat (Campbell & Stanley, 1963)
Implications for Study
History: “the specific events occurring between the first and second measurements in addition to the experimental variable” (p. 5).
The most obvious potential for historical impact on my study is the recession that began in December 2007. The recession was the most serious economic downturn since the Great Depression (Dwyer & Lothian, 2012); it is possible that student attitudes toward the cost of college may have impacted their decisions of whether to persist.
Maturation: “processes within the respondents operating as a function of the passage of time per se (not specific to the particular events), including growing older, growing hungrier, growing more tired, and the like: (p. 5).
Not controlled in the study and not considered a threat.
Testing: “the effects of taking a test upon the scores of a second testing” (p. 5).
Not applicable to a non-experimental design where no testing was performed.

viii
Table 2 (continued)
Internal Validity Threat (Campbell & Stanley, 1963)
Implications for Study
Instrumentation: “changes in the calibration of a measuring instrument or changes in the observers or scores used may produce changes in the obtained measurements” (p. 5).
I used data obtained by the Oregon University System (OUS) Student Centralized Administrative Reporting File (SCARF) database. During the course of the study the methods used to define the data fields and collect the data did not change; similarly I used consistent data definitions (e.g., the definition of retention) for all years of the study.
Statistical regression: “operating where groups have been selected on the basis of their extreme scores” (p. 5).
The students in the study were selected based upon the following criteria:
• Freshmen
• Attending one of Oregon’s 4-year, public universities
• Oregon residents
• Recipients of the OOG for one or the following school years:
o 2006-2007
o 2007-2008
o 2008-2009
o 2009-2010
Selection: “biases resulting in differential selection of respondents for the comparison groups” (p. 5).
All of the study participants were chosen using the same criteria listed above.
Experimental mortality: “differential loss of respondents from the comparison groups” (p. 5).
For this particular study, dropping out of the study is a valid, measurable result and does not skew or bias the results.
Selection-maturation interaction: “in certain of the multiple-group quasi-experimental designs…selection-maturation interaction is confounded with, i.e., might be mistaken for, the effect of the experimental variable” (p. 5).
All of the study participants were chosen using the same criteria listed above.
Source: Campbell and Stanley (1963).

viii
While Campbell and Stanley (1963) described threats to internal validity as
applied to experimental and quasi-experimental research designs; these internal validity
threats may also apply to non-experimental research designs. Because my research study
is a true non-experimental design, it was not possible to control for all of the sources of
internal validity; it is important however to consider whether any of the factors may have
influenced the results of the study.
Limitations of the Study
One limitation of the available data is that it only provides information for those
students who filled out a FAFSA form; I could not identify students who borrow from
family members, use credit cards to pay for college, or use other sources of aid. While
my study was restricted to those students who filled out a FAFSA and were provided
with grants under the OOG fund, the results of the analysis do provide an indication of
whether retention is correlated to the provision of grant funding for a representative
population of low income, freshman students.
Another limitation with the study is that it did not account for those students who
opt out of college following the freshman year of study, but later return to persist. The
data also did not account for those students who leave their colleges to transfer to another
institution. These two subsets of the study population were expected to be small enough
to not adversely impact the conclusions drawn from the analysis.
A third limitation of the study is that it employs a cross-sectional design rather
than a longitudinal design. I researched retention from freshman to sophomore year,
targeting the behavior of the student group most vulnerable to dropping out of college
viii
(undergraduate freshman students). Ultimately however the real goal is for students to not
only persist beyond their freshman years, but to ultimately graduate with 4-year college
degrees. A longitudinal study would enable the analysis of persistence behavior for
lower-income students who receive the OOG throughout their college tenure, thus
providing more insight into behaviors that lead to (or do not lead to) graduation. Future
research that includes this type of longitudinal design is recommended.
A fourth limitation of the study is that it does not control for the role of student
involvement in impacting student persistence. Both Tinto’s (1993) theory of student
departure and Astin’s (1996) theory of student involvement posit that successful student
integration is key in persistence. Factors such as the ability to live on campus, integration
into campus activities, and the development of healthy relationships with faculty and with
student peer groups are all influential in determining if a student will persist. Inclusion of
these factors is a source for future research.
Summary
The purpose of this chapter was to explain the research methodology of this study,
describe the population of the study, provide an explanation of the data and the
procedures that were used to collect the data, and describe the statistical analysis that was
used to analyze the data. A summary of the research design is provided in Table 3.
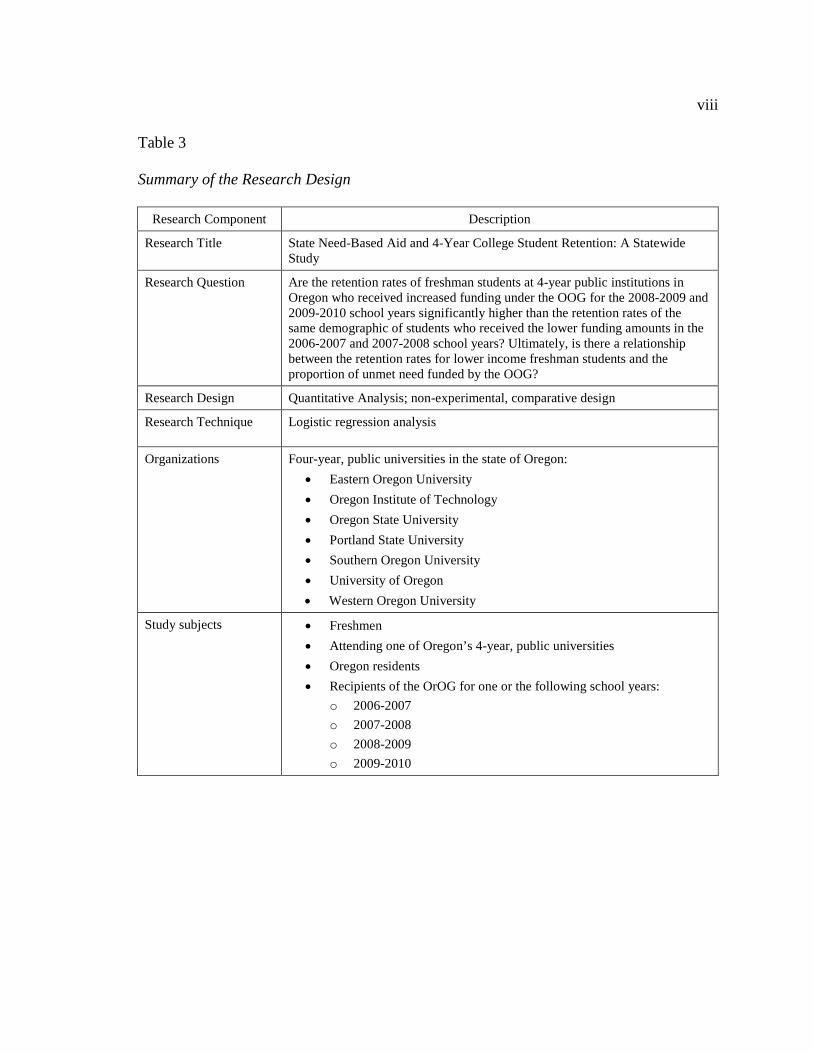
viii
Table 3 Summary of the Research Design
Research Component Description
Research Title State Need-Based Aid and 4-Year College Student Retention: A Statewide Study
Research Question Are the retention rates of freshman students at 4-year public institutions in Oregon who received increased funding under the OOG for the 2008-2009 and 2009-2010 school years significantly higher than the retention rates of the same demographic of students who received the lower funding amounts in the 2006-2007 and 2007-2008 school years? Ultimately, is there a relationship between the retention rates for lower income freshman students and the proportion of unmet need funded by the OOG?
Research Design Quantitative Analysis; non-experimental, comparative design
Research Technique Logistic regression analysis
Organizations Four-year, public universities in the state of Oregon:
• Eastern Oregon University
• Oregon Institute of Technology
• Oregon State University
• Portland State University
• Southern Oregon University
• University of Oregon
• Western Oregon University
Study subjects • Freshmen
• Attending one of Oregon’s 4-year, public universities
• Oregon residents
• Recipients of the OrOG for one or the following school years:
o 2006-2007
o 2007-2008
o 2008-2009
o 2009-2010

viii
CHAPTER IV
ANALYSIS AND FINDINGS
Introduction
The research question that I examined is as follows: Are the retention rates of
freshman students at 4-year public institutions in Oregon who received increased funding
under the OOG for the 2008-2009 and 2009-2010 school years significantly higher than
the retention rates of the same demographic of students who received the lower funding
amounts in the 2006-2007 and 2007-2008 school years? Ultimately, is there a
relationship between the retention rates for lower income freshman students and the
proportion of unmet need funded by the OOG? The purpose of this investigation was to
determine whether the amount of unmet need that is met through grant funding provided
to lower income students has an impact on their retention rates by employing a logistic
regression analysis to a state-wide data set.
This chapter is divided into three sections. The first section provides descriptive
statistics for the study sample, with a description of the variables used in the logistic
regression analysis; the second section evaluates the results of the logistic regression
analysis; and the third section provides a summary of the findings.
Descriptive Statistics
I obtained data from the Oregon University System SCARF database for the
2006-2007, 2007-2008, 2008-2009, 2009-2010, and 2010-2011 school years; the 2010-
2011 data were obtained only for the purposes of determining retention of students who

viii
were freshman in the 2009-2010 school year. The following students were eliminated
from the analysis:
• Students whose freshman year started in 2010 or 2011 (38,541 total eliminated)
• Students who did not start in the Fall term of their freshman year (i.e., started in Spring, Winter, or Summer term (19,612 total eliminated)
• Students who started Fall term of their freshman year, signed up for classes, but completed no hours in their freshman Fall term (693 eliminated)
• Transfer students (43,402 eliminated)
• Students who did not receive an OOG (37,661 total eliminated)
• Students who received an OOG, but whose parental adjusted gross income was greater than $33,660 (1,645 total eliminated)
The final number of students in the working data set is included in Table 4. The
final working data set contained 10,026 students total who were first-time freshmen in
Fall term of their first year of school, started in one of the 4 years of study, received an
OOG during their freshmen year, and had parental adjusted gross income of $33,600 or
less. The sample size per year varied from 1,995 students in the 2007-2008 school year to
3,156 students in the 2009-2010 school year; the increase in the sample size reflects the
increase in funding of the OOG program for the 2008-2009 and 2009-2010 academic
years that enabled the awarding of more grants.

viii
Table 4 Number of Students in the Working Data Set Sorted by Academic Year
Academic Year Number of Students
2006-2007 2,039
2007-2008 1,995
2008-2009 2,836
2009-2010 3,156
TOTAL 10,026
Student Demographic Characteristics
Data on gender and ethnicity were self reported by the students on original
admissions forms, although the students can make changes to their personal demographic
information through their educational institutions. In the case of gender if the student left
the field blank the student’s gender was identified as “Unknown.” As shown in Table 5,
gender was fairly evenly split over the 4 years of the study:
• 2006: 40.5% males, 59.4% females, 0.1% unknown
• 2007: 43.7% males, 56.0% females, 0.3% unknown
• 2008: 42.6% males, 57.1% females, 0.3% unknown
• 2009: 43.2% males, 56.4% females, 0.4% unknown

viii
Table 5
Student Demographic Characteristics by Academic Year
2006-2007 2007-2008 2008-2009 2009-2010
n % n % n % n %
Gender Female 1,212 59.4 1,118 56.0 1,620 57.1 1,779 56.4
Male 825 40.5 871 43.7 1,208 42.6 1,364 43.2
Unknown 2 0.1 6 0.3 8 0.3 13 0.4
Ethnicity White 1,347 66.1 1,311 65.7 1,932 68.1 2,153 68.2
Asian or Pacific Islander 108 5.3 121 6.1 111 3.9 144 4.6
Hispanic or Latino 99 4.9 90 4.5 159 5.6 162 5.1
Hispanic-Mexican 36 1.8 33 1.7 74 2.6 66 2.1
Black or African American 74 3.6 76 3.8 106 3.7 109 3.5
American Indian-Alaskan Natives
42 2.1 18 0.9 35 1.2 64 2.0
Multi-Ethnic 40 2.0 50 2.5 42 1.5 46 1.5
Other 131 6.4 124 6.2 173 6.1 170 5.4
Declined to respond 147 7.2 154 7.7 157 5.5 71 2.3
Unknown/Undefined 15 0.7 18 0.9 47 1.7 171 5.4
Race/ethnicity was reported for each term data were obtained for a student.
Because some students reported different races/ethnicities in different terms, the
race/ethnicity the student reported for the first term of freshman year was used for the
purposes of the analysis. Those race/ethnicity categories that contained less than 150
respondents total over the 4 years of the study were combined into the category “Other;”
this category ranged from a low of 5.4% in 2009 to a high of 6.4% in 2006.
The majority of the students in the sample self-identified as white, ranging from a
low of 65.7% in 2007 to a high of 68.2% in 2009. Of the remaining race/ethnicity
categories, the percentage of Asian or Pacific Islander ranged from 3.9% in 2008 to 6.1%

viii
in 2007. Hispanic or Latino ranged from 4.5% in 2007 to 5.6% in 2008; Hispanic-
Mexican ranged from 1.7% in 2007 to 2.6% in 2008. Black or African American students
ranged from 3.5% in 2009 to 3.8% in 2007. American Indian-Alaskan Native students
ranged from 0.9% in 2007 to 2.1% in 2006. Those students who declined to identify their
races/ethnicities ranged from 2.3% in 2009 to 7.7% in 2007, while those students whose
races/ethnicities were unknown ranged from 0.7% in 2006 to 5.4% in 2009. Those
students who self-identified as multi-ethnic ranged from 1.5% in 2008 and 2009 to 2.5%
in 2007.
Institutional (college) GPA was included as an independent variable in the study.
Table 6 shows the average Institutional GPAs for the 4 years of the study, along with the
number of values reported. For the missing Institutional GPA values, the students
registered for classes but data for GPA was not reported (had null values) for freshman
year (a different case from instances when GPA was 0, meaning the students registered
for classes but did not complete any terms in freshman year). Average institutional GPA
ranged from a low of 2.87 in 2007-2008 to a high of 2.94 in 2008-2009 and 2009-2010.
Table 6 Institutional GPA Values by Academic Year
2006-2007 2007-2008 2008-2009 2009-2010
Average Institutional GPA 2.91 2.87 2.94 2.94
Number Reported 1,813 1,765 2,593 2,852
No GPA Reported 226 230 243 304

viii
The following descriptive results apply to the students’ family educational
attributes. Table 7 shows the breakout of educational levels achieved by the students’
mothers and fathers. For the data provided all 4 years for both mother and father, the
majority of respondents reported a high school education, followed next by college or
beyond. The averages for both high school educations and college or beyond were greater
for mothers than fathers; mother’s educational level reported at the high school level
ranged from a low of 46.2% in 2009-2010 to a high of 47.8% in 2007-2008, while
father’s educational level reported at the high school level ranged from a low of 42.2% in
2006-2007 to a high of 46.0% in 2008-2009. Mother’s educational level reported as
college or beyond ranged from a low of 34.6% in 2008-2009 to a high of 37.1% in 2009-
2010, while father’s educational level reported as college or beyond ranged from a low of
30.8% in 2008-2009 to a high of 33.0% in 2007-2008. The average reported educational
attainment for mothers was higher than the average reported educational attainment for
fathers for all 4 years of the study.
When analyzing the student demographic characteristics, the data is very similar
across all 4 years of the study. Data for the 4 years of study for gender, race/ethnicity,
institutional GPA, and the students’ mother and father educational levels all show
extremely similar reported values across the 4 years of study. In examining the
demographics across the four years of study, it does not appear that there are any
differences in the four data sets for any of the student demographic variables.

viii
Table 7
Student Mother and Father Educational Level Values by Academic Year
2006-2007 2007-2008 2008-2009 2009-2010
n % n % n % n %
Mother’s Educational Level
Middle school/junior high 160 7.9 156 7.8 284 10.0 287 9.1
High school 950 46.6 954 47.8 1,320 46.5 1,459 46.2
College or beyond 741 36.3 711 35.6 982 34.6 1,172 37.1
Other/unknown 168 8.2 155 7.8 238 8.4 222 7.0
Not reported 20 1.0 19 1.0 12 0.4 16 0.5
Father’s Educational Level
Middle school/junior high 202 9.9 199 10.0 299 10.5 299 9.5
High school 861 42.2 847 42.5 1,304 46.0 1,410 44.7
College or beyond 669 32.8 659 33.0 873 30.8 1,027 32.5
Other/unknown 282 13.8 269 13.5 344 12.1 392 12.4
Not reported 25 1.2 21 1.1 16 0.6 28 0.9
Student Financial Aid Characteristics
Descriptive results were also analyzed for student financial aid information. In
addition to the OOG, there were four other potential sources of financial aid that were
included in calculations of financial need before the OOG. Financial need before the
OOG was defined as the amount of aid required by the student to pay for the cost of
attendance after all other aid and family sources were considered. I defined the variable
financial need before the OOG as:

viii
• The cost of attendance for a specific school year
o minus the EFC for that same school year
o minus total of all grants except the OOG
o minus total scholarships
o minus total work study
o minus fee remissions.
Both the average OOG awarded and the average other aid that was considered in
addition to the OOG is represented in Table 8. The “Total Other Aid” consists of the
average annual total of all grants except the OOG, scholarships, work study, and fee
remissions. The average OOG awarded shows the expected increase in 2008-2009 when
the average award amount was increased; the average award amount for our data set
increased by 53.5% from the 2007-2008 to the 2008-2009 academic year. The average
total other aid varied from $5,811 in 2006-2007 to $6,681 in 2009-2010; the largest
average increase in the average total other aid occurred from 2008-2009 to 2009-2010, an
increase of 11.9%.
Table 8
Average OOG Awarded and the Average Student Total Other Aid (Excluding the OOG) by Year
2006-2007 2007-2008 2008-2009 2009-2010
Average OOG Awarded $1,494 $1,572 $2,413 $2,088
Average Total Other Aid $5,811 $6,162 $5,970 $6,681
Total Aid Awarded $7,305 $7,734 $8,383 $8,769
The descriptive statistics provided in Table 9 are for the average annual OOG
award by year and the average percentage of need met by the OOG by year. The average

viii
annual amount of the OOG award and the average percentage need met by the OOG are
higher in the 2008-2009 academic year (when the amount of OOG funding was
increased) than for the 2006-2007 and 2007-2008 academic years; the average annual
amount of the OOG award for the 2009-2010 academic year is higher than for the 2006-
2007 and 2007-2008 academic year, but the average percentage of need met by the OOG
is the same as the 2006-2007 academic year (and higher than the 2007-2008 academic
year). The fact that the average percentage of need met by the OOG for the 2009-2010
academic year is not higher than that of the 2006-2007 academic year, despite an increase
in average award amount, is most likely due in part to the fact that the average amount of
the OOG award for the 2009-2010 academic year fell by $325 (13.5%) from the prior
year, as well as the fact that higher increases in tuition occurred for the 2009-2010
academic year. Table 10 shows the average cost of attendance for our study population
for the 4 years of our study; the average cost of attendance increased 16.7% from the
2006-2007 academic year to the 2009-2010 academic year.
Table 9 Average Annual OOG Award Amount and Percentage of Need Met by the OOG, by Academic Year
Year Average Annual OOG Award Amount
Average % of Unmet Need Met by the OOG
2006-2007 $1,494 18.0%
2007-2008 $1,572 17.0%
2008-2009 $2,413 22.0%
2009-2010 $2,088 18.0%
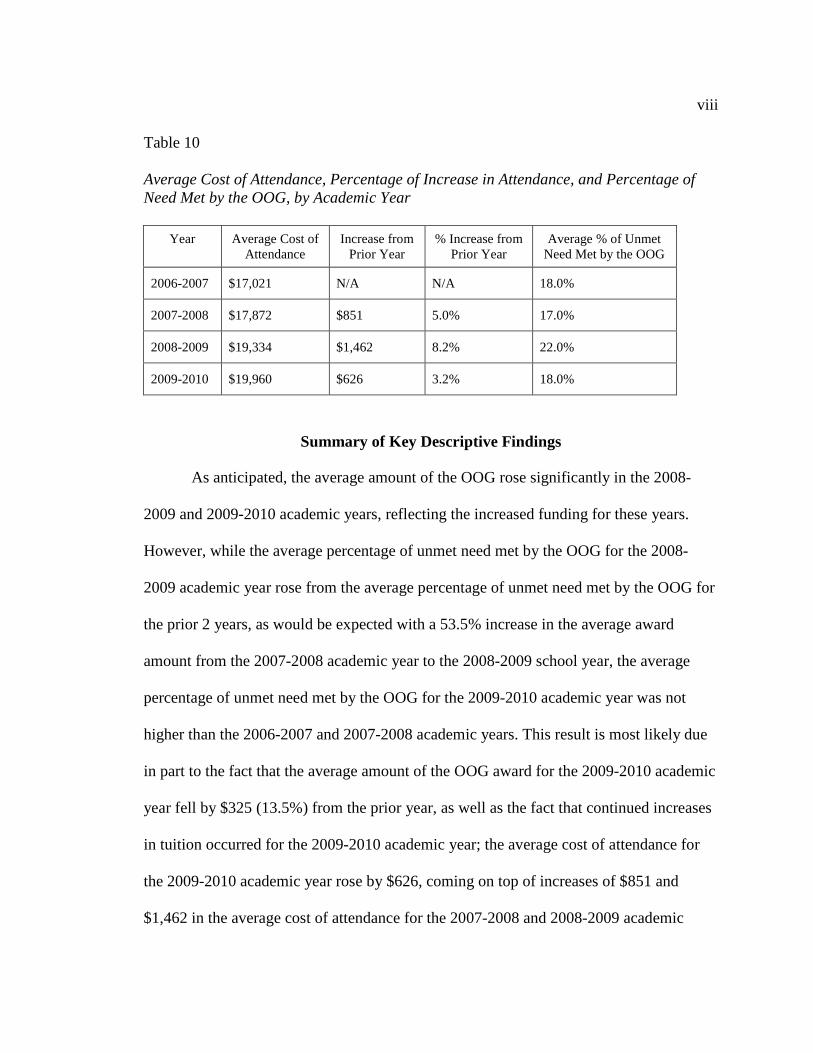
viii
Table 10
Average Cost of Attendance, Percentage of Increase in Attendance, and Percentage of Need Met by the OOG, by Academic Year
Year Average Cost of Attendance
Increase from Prior Year
% Increase from Prior Year
Average % of Unmet Need Met by the OOG
2006-2007 $17,021 N/A N/A 18.0%
2007-2008 $17,872 $851 5.0% 17.0%
2008-2009 $19,334 $1,462 8.2% 22.0%
2009-2010 $19,960 $626 3.2% 18.0%
Summary of Key Descriptive Findings
As anticipated, the average amount of the OOG rose significantly in the 2008-
2009 and 2009-2010 academic years, reflecting the increased funding for these years.
However, while the average percentage of unmet need met by the OOG for the 2008-
2009 academic year rose from the average percentage of unmet need met by the OOG for
the prior 2 years, as would be expected with a 53.5% increase in the average award
amount from the 2007-2008 academic year to the 2008-2009 school year, the average
percentage of unmet need met by the OOG for the 2009-2010 academic year was not
higher than the 2006-2007 and 2007-2008 academic years. This result is most likely due
in part to the fact that the average amount of the OOG award for the 2009-2010 academic
year fell by $325 (13.5%) from the prior year, as well as the fact that continued increases
in tuition occurred for the 2009-2010 academic year; the average cost of attendance for
the 2009-2010 academic year rose by $626, coming on top of increases of $851 and
$1,462 in the average cost of attendance for the 2007-2008 and 2008-2009 academic

viii
years, respectively. The overall average amount of the increases in the OOG were not
enough to reduce the amount of unmet need that was met due to higher increases in the
average cost of attendance.
Inferential Statistics
A binomial logistic regression analysis was conducted using SPSS to address the
question: Are the retention rates of freshman students at 4-year public institutions in
Oregon who received increased funding under the OOG for the 2008-2009 and 2009-
2010 school years significantly higher than the retention rates of the same demographic
of students who received the lower funding amounts in the 2006-2007 and 2007-2008
school years? Ultimately, is there a relationship between the retention rates for lower
income freshman students and the proportion of unmet need funded by the OOG?
The independent variable of study was percentage of financial need met by the
OOG. In order to calculate this independent variable I first calculated the financial need
before the OOG, which consists of the amount of aid required by the student to pay for
the cost of attendance after all other aid and family sources were considered. I defined the
variable financial need before the OOG as:
• The cost of attendance for a specific school year
o minus the EFC for that same school year
o minus total of all grants except the OOG
o minus total scholarships
o minus total work study
o minus fee remissions.
The independent variable of study is therefore the percentage of financial need
met by the OOG, calculated by dividing the amount of the OOG for the year by the

viii
financial need before the OOG. I examined data for the following school years: 2006-
2007, 2007-2008, 2008-2009, and 2009-2010.
The independent control variables were ethnicity, institutional GPA, mother’s
educational level, and father’s educational level. While I originally considered including
high school GPA, total family income, and net worth as independent control variables, I
determined that these variables are highly correlated to other independent variables
already included in the study (high school GPA is highly correlated to institutional GPA,
total family income and family net worth are highly correlated to percentage of financial
need met by the OOG). In addition, there were 3,176 records where the high school GPA
was missing for the 2006-2007, 2007-2008, 2008-2009, and 2009-2010 academic years, a
significant number from the overall sample. Given the close correlation between high
school and institutional GPA and the large number of records that were missing high
school GPA, I did not use high school GPA as an independent control variable in my
study.
The dependent variable was Retention, which had two categories: retained (yes)
and was not retained (no). The treatment was set to 0 for the 2006-2007 and 2007-2008
academic years (years of lower OOG funding) and was set to 1 for the 2008-2009 and
2009-2010 academic years (years of higher OOG funding). The dependent variable of
study is a binary indicator of whether the student was retained from freshman to
sophomore year. The term retention for the purposes of this study refers to a student who
registered as a freshman during Fall term, completed at least one credit hour during

viii
freshman Fall term, and registered for at least one credit hour the following Fall term
within the same institution.
Pearson Chi-Square Test Results
My null hypothesis (H0) was that the retention rates for freshman students at the
seven 4-year universities in Oregon for the 2008-2009 and 2009-2010 school years (when
the OOG experienced large increases in funding and award amounts) were not
significantly higher than for the 2006-2007 and 2007-2008 school years when the OOG
funding was at sharply reduced rates, thus indicating that there is no relationship between
the amount of unmet need met by the grant funding provided by the OOG and the
retention rates of those students who were awarded the OOG.
Table 11 shows the number of students who were retained and were not retained
by academic year groupings (2006-2007 and 2007-2008 for lower OOG funding, and
2008-2009 and 2009-2010 for higher OOG funding). The results of a Pearson Chi-Square
test determined that the null hypothesis could be rejected with a p value less than .01.
Therefore, the retention rates for the 2006-2007 and 2007-2008 academic years (when the
OOG funding was lower) are not equal to the retention rates for the 2008-2009 and 2009-
2010 academic years (when the OOG funding was higher).

viii
Table 11 Crosstabulation of Retention by Academic Year Grouping
Retained from freshman to sophomore year?
Total sample
2006-2007 & 2007-2008
2008-2009 & 2009-2010
Percentage of need met
by the OOG (N) (n1) (n2) M SD
Yes 8,610 2,885 4,455 15.1 21.4 No 3,070 1,149 1,537 20.2 71.8
Summary 10,026 4,034 5,992 18.8 62.5
Binomial Logistic Regression Results
The binomial logistic regression test was conducted in SPSS. Of the 10,026
students included in the original sample, 8,928 were used in the analysis (89.0%); the
1,098 students who were not included in the analysis were excluded because data were
missing for some of the independent variables of study (11.0% of the cases); only
students who provided data points for each of the independent variables of study were
included in the analysis.
The results of the analysis are in Table 12. The results showed that
Predicted logit of (PERSISTENCE) = -1.6697 + (.0494)*PERCENT OF NEED MET BY OOG
+ (-.3119)*WHITE + (.1865)*ASIAN OR PACIFIC ISLANDER + (.0683)*BLACK OR AFRICAN AMERICAN + (.2062)*HISPANIC OR LATINO + (-.1228)*HISPANIC MEXICAN + (-.2057)*AMERICAN INDIAN-ALASKAN NATIVE + (-.2421)*DECLINED TO ANSWER + (-.3362)*UNKNOWN + (.0947)*MULTI-ETHNIC + (-.0139)*MOTHER’S EDUCATION + (-.0324)*FATHER’S EDUCATION + (1.2356)*INSTITUTIONAL GPA

viii
Table 12
Variables of the Binomial Logistic Regression for 8,928 Cases
Predictor
B
SE B
Wald’s X2
df
p
eB
(odds ratio)
Constant -1.6697 .1836 82.6850 1 .0000 .1883
Percentage of need met by the OOG
.0494 .0356 1.9276 1 .1650 1.0506
Ethnicity
Other 34.4170 9 .0001
White -.3119 .1239 6.3376 1 .0118 .7321
Asian or Pacific Island .1865 .1876 .9885 1 .3201 1.2050
Black or African American
.0683 .1894 .1299 1 .7185 1.0707
Hispanic or Latino .2062 .1776 1.3480 1 .2456 1.2290
Hispanic–Mexican -.1228 .2264 .2940 1 .5877 .8845
American Indian–Alaskan Native
-.2057 .2561 .6451 1 .4219 .8141
Declined to answer -.2421 .1756 1.9015 1 .1679 .7850
Unknown -.3362 .2249 2.2340 1 .1350 .7145
Multi-ethnic .0974 .2560 .1446 1 .7037 1.1023
Mother’s education -.0139 .0416 .1115 1 .7384 .9862
Father’s education -.0324 .0371 .7617 1 .3828 .9681
Institutional GPA 1.2356 .0390 1002.6664 1 .0000 3.4404
Test X
2 df p
Overall model evaluation
Wald test 1.9276 1 .0356
Goodness-of-fit test
Hosmer & Lemeshow 128.245 8 .000
In analyzing the significance of the independent variables, the analysis shows that
percentage of need met by the OOG, ethnicity, mother’s education and father’s education
viii
are not significant factors in predicting retention at a .01 or .05 level; the only variable
that is significant in predicting retention at the .01 level is the institutional GPA.
Therefore, according to the model, the log of the odds of a student being retained was
positively related to institutional GPA (p < .01; Table 12). In other words, the higher the
institutional GPA, the more likely it is the student will be retained from freshman to
sophomore year.
I used a Wald test to evaluate the overall model. The p value is significant at the
.05 level (p < .05), indicating that the model provides an improvement over the null
model or intercept-only model.
I used the Hosmer-Lemeshow test for an inferential test of the goodness-of-fit of
the model against the actual outcomes (see Table 12). The Hosmer-Lemeshow goodness-
of-fit test yielded a X2(8) of 128.245 with a significance < .01, indicating that the model
is not a good fit for the data. However, a known disadvantage of the Hosmer-Lemeshow
goodness-of-fit test is that for large sample sizes such as the sample I examined, a very
small difference can lead to significance. I therefore also examined the results for the
Nagelkerke R square goodness-of-fit model; the p value is .208, which indicates a
relatively weak relationship of 20.8% between the predictors and the prediction.
Table 13 is a classification table that documents the validity of the predicted
probabilities; I used the SAS default of 0.5 for the cutoff point. Table 13 shows that the
prediction for students who were retained was more accurate than that for students who
were not retained. This observation was supported by the magnitude of sensitivity of
98.6% , calculated as Sensitivity = 7076/(7076+100) compared to that of specificity of
23.6%, calculated as Specificity = 416/(1345+416). The proportion of correctly classified

viii
students who were retained was therefore 98.6%, while the proportion of incorrectly
classified students who were not retained was 23.6%. The rate of false positives, or the
proportion of events misclassified as students who were retained out of all of the
students, was 16.0%; the rate of false negatives, or the proportion of events misclassified
as students who were not retained out of all of the students, was 19.4%. The overall
correction prediction was 83.8%.
Table 13
The Observed and Predicted Frequencies of Retention by Logistic Regression With the Cutoff of 0.5
Predicted
Observed Yes No % Correct
Yes 7076 100 98.6
No 1345 416 23.6
Overall % correct 83.8
Further discussion of the research findings is included in the next chapter.
Information about hypothesis testing and information from the logistic regression models
is included. Strengths and limitations of the research are discussed, along with areas for
future research. Finally, summary conclusions of the research are presented.

viii
CHAPTER V
DISCUSSION AND CONCLUSIONS
Introduction
The purpose of this study was to examine whether retention rates for lower
income college students are impacted by increasing the amount of grant funding to satisfy
unmet need–in other words, to see if increasing the amount of grant funding for lower
income college students to reduce their levels of unmet need results in higher retention
rates for these students. The sample population included low income students from
Oregon’s seven public, 4-year universities who received an OOG between the academic
calendar years of 2006-2007 and 2009-2010. Data were collected from Oregon
University System through a data sharing agreement and analyzed through quantitative
analysis. This chapter discusses the research findings, strengths and limitations of the
research process, and areas for future research.
Research Findings
The purpose of this study was to examine whether retention rates for lower
income college students are impacted by increasing the amount of grant funding to satisfy
unmet need–in other words, to see if increasing the amount of grant funding for lower
income college students to reduce their levels of unmet need results in higher retention
rates for these students. The sample population included low income students from
Oregon’s seven public, 4-year universities who received an OOG between the academic
calendar years of 2006-2007 and 2009-2010. The null hypothesis (H0) was that the

viii
retention rates for freshman students at the seven 4-year universities in Oregon for the
2008-2009 and 2009-2010 school years (when the OOG experienced large increases in
funding and award amounts) were not significantly higher than for the 2006-2007 and
2007-2008 school years when the OOG funding was at sharply reduced rates, thus
indicating that there is no relationship between the amount of grant funding provided by
the OOG and the retention rates of those students who were awarded the OOG.
The null hypothesis was rejected; the results of the Pearson chi-square test
indicated that the null hypothesis could be rejected with a p value less than .01, indicating
that the retention rates for the 2008-2009 and 2009-2010 academic years were
significantly higher than the retention rates for the 2006-2007 and 2007-2008 academic
years. However, the percentage of need met by the OOG was not found to be a significant
factor in predicting retention, with p > .05 for the independent variable percentage of
need met by the OOG. Yet, when the increases in the OOG are considered with the
corresponding increases in tuition and fees for the same time period, this result is not
surprising.
• In looking at the independent variable of study, the percent of unmet need met by the OOG, this variable increased by only 5% from the 2007-2008 academic year (before the average amount of the OOG was increased) to the 2008-2009 academic year (the first year the average amount of the OOG was increased), and remained at the same level for the 2009-2010 academic year as the 2006-2007 academic year (before the average amount of the OOG was increased). A 5% increase in the percentage of unmet need met by the OOG for the 2008-2009 academic year may have simply been too little to impact persistence.
• While the average OOG award increased by $841 from the 2007-2008
academic year to the 2008-2009 academic year, the corresponding rise in the cost of attendance was $1,462. The increase in the OOG was not sufficient to make up for the increased cost of attendance.

viii
• From the 2006-2007 academic year to the 2009-2010 academic year, the average OOG award increased $594, while the corresponding rise in the cost of attendance was $2,939. Again, the increase in the OOG over the life of the study was not sufficient to make up for the increased cost of attendance over the life of the study.
The intent of the increase in the OOG was to enable more lower-income students
to attend Oregon’s public institutes of higher education and also positively impact
retention rates for these same students (Pardington, 2008a, p. A01). However, despite an
increase of more than 53% in the average award amount in the 2008-2009 academic year
alone, the increase was insufficient to make up for even higher increases in the cost of
tuition and fees charged at Oregon’s public universities.
The study was also conducted at a time when increasing numbers of Americans
are questioning the value of a college education. As cited earlier, a survey performed by
the Pew Research Center in 2011 found that 57% of Americans felt that college does not
provide good value for the money, while 75% felt that college is too expensive for most
Americans to afford. Much of the shift in attitudes toward the value of a college
education can be attributed to the continuing steep increases in the cost. Because
students’ attitudes toward the value of a college degree can be expected to have
significant influence on the students’ retention, the retention rates in the study were likely
impacted by historically negative views toward the value of a college education.
In examining the results of the study in light of the earlier economic theories
linked to persistence (price-response theories, the ability-to-pay model, and the theory of
targeted subsidies), the findings are what one would expect. In the early price-response
studies performed by Fuller et al. (1982); Manski and Wise (1983); Leslie and Brinkman

viii
(1987); St. John (1990a); Savoca (1990); and Kane (1995); the researchers all concluded
that, as would be expected, college enrollment is negatively impacted by increases in
tuition. McPherson and Schapiro (1991) and St. John (1990a, 1990b, 1993) also found
that low-income students respond differently to a rise in tuition and a corresponding rise
in aid; in other words, even if the net-price for the student remains the same, if tuition is
raised high enough a student may choose not to persist even if offered a corresponding
increase in aid. Tuition for Oregon’s public universities rose sharply in the four years of
my study; the increases in the cost of attendance were high enough to more than offset
the increases in the amount of funding provided by the OOG. Even though the percentage
of need met by the OOG rose from 17.0% to 22.0% from the 2007-2008 to the 2008-2009
academic year, the percentage of need met by the OOG was still not found to be a
significant factor in predicting retention. Sensitivity of the lower-income students in the
study to the increases in tuition could be one explanation for this result, thus supporting
the price-response theory.
The ability to pay model refers to “the label given to a composite variable that
usually includes measures of such factors as students’ SES, their perceptions of their and
their family’s ability to finance college, and satisfaction with the cost” (Pascarella &
Terenzini, 2005, p. 413). As reported earlier in chapter 2, conclusions reached through
extensive studies by Cabrera and colleagues are that students’ perceptions of their
abilities to pay appear to be positively related to persistence and educational aspirations,
to a significant degree (Cabrera, Castañeda et al., 1992; Cabrera, Nora et al., 1992;
Cabrera et al., 1990). The sharp increases in the cost of attendance for the students in the

viii
four years of my study may have caused sticker shock for the students; the fact that these
increases were higher than the increases in the OOG award amounts that occurred at the
same time are likely to have negatively impacted the students’ perceptions of their ability
to pay, thus negatively impacting persistence for these students.
The related theory of targeted subsidies posits that the way to encourage
persistence is through subsidies that are targeted at different student populations based
upon the students’ abilities to pay. Programs that have been employed to encourage
persistence based upon the ability-to-pay model include reduced tuition, direct grants,
low-interest loans, and subsidized work-study programs; the point of the programs is to
equalize students on their ability to pay for college and to increase the benefits derived
from attending (Bowen, 1977; Cabrera et al., 1990). In the four years of my study the cost
of attendance at Oregon’s public universities rose by a greater amount than the subsidies
provided through the OOG. The fact that the percentage of need met by the OOG was not
found to be a significant factor in predicting retention may simply have been because the
5% increase in the amount of need met by the OOG that occurred as a result of the
increases in OOG awards during the study (the targeted subsidies) was insufficient to
have an impact on retention for the lower income students in the study in light of the
larger increases in the cost of attendance.
This study also just looked at the influence of a change in a single factor relating
to retention. The research cited in chapter 2 includes multiple factors that influence
retention, including individual, institutional, federal government, and state government
influences. The complexity of the retention equation raises the question of whether

viii
altering one single variable (in this case state government financial aid) is sufficient to
cause a significant change in retention rates for lower income students. The small amount
of the increase in the OOG award compared to the large increase in the cost of attendance
for the years of study may have been insufficient to make a difference in retention when
none of the other factors were changed. For example, the relatively small increase in the
OOG might have been sufficient to have a significant impact on freshman retention into
sophomore year if the students in the study had also been provided with tutoring to
enable them to increase their first-year college GPAs.
The results of the study do have implications for policy. The trend in higher
education has been a steady increase in the cost of tuition and fees since the 1980s.
Mortenson (2011b) found that the national average inflation-adjusted tuition and fee
charges for state resident undergraduate students at flagship universities increased by
247% from $2,291 in 1981 to $7,963 in 2010; for comprehensive colleges and
universities the national average inflation-adjusted tuition and fee charges for state
resident undergraduate students increased by 230% from $1,896 in 1981 to $6,257 in
2010. The impact of these increased costs for higher education has been particularly acute
for lower-income students. The state of Oregon attempted to address the issue of access
for lower-income students by increasing the funding of their OOG program, including the
average amount of individual awards; however, the increased awards were not sufficient
to overcome the increases in tuition and fees that occurred at the same time.
Policymakers who want to address the issue of access for lower income students through
financial means need to enact policies that truly address the cost of attendance for this

viii
student population, either through lowered tuition and fees, increased grant funding that
at a minimum keeps pace with the amount of increases in the cost of attendance, or both
options. Historical studies have shown that grant funding promotes persistence more
powerfully than loans (Dwyer, McCloud, & Hodson, 2012; Hearns & Holdsworth, 2004;
Leslie & Brinkman, 1988; Mortenson, 1990; St. John, 1990a); the continued issue of
college affordability for lower income students will not be resolved by continuing to
promote policies that require large amounts of student loans in order to achieve a college
degree.
Policymakers can also choose to focus future grant funding on those who most
need the assistance: lower-income students. One of the changes implemented by Oregon
in 2008 as part of the increased funding of the OOG was to raise the maximum income
levels to qualify for grants from $33,600 per year for a family of four to $70,000 for a
family of four for the 2008-2009 school year (Pardington, 2008b). As a result of this
change, the OOG funding was no longer targeted just for students in the lowest income
levels; middle class students qualified for the grant as well, using the Pew Research
Center’s 2010 analysis of U.S. Census Bureau data that found that median income for a
four-person household was $68,274. If policymakers had chosen to keep maximum
qualifying family income at the same level, the program dollars could have gone towards
providing larger awards for the lower-income students who qualified for the grant, thus
increasing the percentage of need met by the OOG. This move would have increased the
likelihood of a positive impact on retention, particularly if the amount of grant funding

viii
provided by the program enabled the recipients to absorb the continuing increases in the
cost of attendance.
A related issue of college affordability lies with the above-referenced continuing
increases in the cost of tuition and fees. State governments in particular need to address
the financial policies that result in continuing large increases in the cost of attendance at
public colleges and universities. Mortenson (2011c) noted that states have reduced their
annual investment in higher education from approximately $10.55 per $1,000 of state
personal income between FY1976 and FY1980 to $6.30 per $1,000 by FY2011. As a
result, public institutes of higher education have been forced to increase their tuition and
fees to make up for the reductions in state financing. Just within the 4 years of this study,
the average cost of attendance for the students included in the study increased by almost
$3,000, an increase of over 17%. Until state policymakers begin to reinvest in higher
education and prioritize the postsecondary education of their constituents, lower income
students will continue to be priced out of college degrees.
Another implication for policymakers is the implication of the significance of the
independent variable institutional GPA. This independent variable was the only variable
in the study of significance at the .01 or .05 level (it was significant at the .01 level),
indicating a significant relationship between institutional GPA and retention rates.
Policymakers can therefore assume that policies that increase institutional GPA for
lower-income students will increase retention rates for this student population. One
means of positively impacting GPA is to address the financial needs of lower-income
students by providing grant funding to address their unmet need, thus reducing or

viii
eliminating the need to work to afford college. As noted earlier, Cabrera et al. (1990)
found that students who do not have to work long hours due to financial worries are more
likely to participate in the academic and social aspects of college that lead to college
success and are more likely to persist. Astin (1984) also found that working off-campus
at a full-time job had a negative impact on persistence; he postulated that spending
significant amounts of time and energy off campus in pursuits that were not related to
academic and student life resulted in diminished time and energy that the student had
available for academic and other college-related activities. Thus there is a proven link
between the need to work to afford college and lower levels of institutional GPA; one
means for policymakers to increase institutional GPA for lower-income students and
therefore increase persistence is to remove the need to work long hours by awarding grant
or scholarship funding to this student population, a means of financial support that does
not require repayment.
A final implication for policymakers is in the transition from community college
to 4-year universities. Bailey and Morest (2006) noted that low-income students are
increasingly enrolling in community colleges as less expensive alternatives to achieve
bachelor’s degrees. However, Alfonso (2006) found in a study of the impact of
community college attendance on bachelor degree attainment that community college
students attained bachelor’s degrees at a rate that was 40-50 percentage points below that
of students who chose to attend 4-year colleges; Alfonso found that even those
community college students who enrolled with the expectation of achieving bachelor’s
degrees had significantly lower degree attainment than those students who instead

viii
enrolled in 4-year colleges. One explanation Alfonso provided for the difference in
attainment is the difficulty in transferring from the community college to a 4-year
institution. A study performed by the Advisory Committee on Student Financial
Assistance (2010) listed the need for financial aid as one of the barriers to successful
transfer from the 2- to the 4-year institution, noting that the significant increase in costs
of the 4-year institution can prove a significant barrier. Increased costs that were
identified included tuitions that are an average of 2.5 times higher at public flagship
universities than community colleges and additional costs such as room, board, and
transportation, which may total an average of up to $10,000. The study also noted that
there is often less institutional aid available to transfer students due to policies at 4-year
institutions that target the recruitment of first-time, full-time students. Many transfer
students also are forced to work to afford college, thus increasing time and cost to degree.
Policymakers at the institution, state, and federal level can help in the transfer process
and eventual degree attainment for community college students by offering targeted
financial aid guidance, increasing the amount of scholarships and grants available for
transfer students, and targeting some scholarships and grants specifically for transfer
students. As the number of college students who pursue bachelor’s degrees but choose to
start at community colleges because of financial concerns continues to grow,
policymakers need to provide the financial means to make the transfer to 4-year
institutions affordable.

viii
Strengths and Limitations
One strength of the study is the source and availability of the data to test my
hypothesis. The state of Oregon increased the amount of individual awards in the OOG
program during the 2008-2009 academic year, which is within my range of study data. I
was able to examine retention results for low income students for 2 years of lower OOG
awards (2006-2007 and 2007-2008 academic years) and for 2 years of higher OOG
awards (2008-2009 and 2009-2010 academic years).
Another consideration is the timeliness of the analysis. Much of the research into
the impact of financial aid on persistence and retention has occurred in prior decades
when fiscal realities were different. The cost of a college education has continued to rise
steeply. The national average inflation-adjusted tuition and fee charges for state resident
undergraduate students at flagship universities increased by 247% from $2,291 in 1981 to
$7,963 in 2010; for comprehensive colleges and universities the national average
inflation-adjusted tuition and fee charges for state resident undergraduate students
increased by 230% from $1,896 in 1981 to $6,257 in 2010 (Mortenson, 2011b). The
resulting high cost of a college education has impacted attitudes toward the value of a
college education. A survey performed by the Pew Research Center in 2011 found that
57% of Americans felt that college does not provide good value for the money. Given
these shifting views toward the value of a college education that have been shaped in part
by the continuing increases in the cost, my research provides a more timely analysis of
how college retention for lower income students is impacted by increases in financial aid.

viii
One limitation of the study is the fact that it does not account for students who
transferred from their original institution to another institution of higher education. While
the data may show that a student was not retained from freshman to sophomore year
within the same institution, the student may have continued his or her education by
enrolling at another college or university upon completion of freshman year. A national
study of degree-seeking students performed by the National Student Clearinghouse
Research Center (Shapiro et al., 2013) from the 2006-2007 academic year through the
2011-2012 academic year found that, on average, 12.0% of students at 4-year, public
universities completed their educations at different institutions than their starting
institutions. My study does not differentiate between those students who dropped out of
school during or immediately after their freshman years from those students who started
their freshman year at one institution and enrolled at a different institution either during
or immediately following freshman year; the overall persistence numbers are therefore
lower than the actual numbers that would have resulted if I had the data to track across-
institution persistence. However, this reporting discrepancy should have been
commensurate across the 4 years of the study.
Another potential limitation is the fact that the recession that began in December
2007 and ended in June 2009 occurred not only during my study, but also right before the
amount of funding for the OOG was raised for the 2008-2009 academic year. Given the
severity of the recession, I was concerned that retention might have been negatively
impacted by students who had to drop out of college to pursue employment. However, a
report published by the National Student Clearinghouse Research Center (Dunbar et al.,

viii
2011) that analyzed the impacts of the recession on college enrollment and persistence
found no significant drops in retention or persistence rates during the recession.
Another limitation of the study is the fact that relatively high increases in tuition
and fees occurred at the same time as the OOG award increases. For example, while the
average OOG award rose by $841 in the 2008-2009 academic year, the average cost of
attendance also rose by $1,462; the increased amount of the award in many cases was not
sufficient to make up for the steep hike in tuition and fees. This financial impact therefore
reduced the efficacy of the analysis.
Areas for Future Research
College retention is a complex concept to analyze, complicated by the multitude
of factors that provide influence. Yet the continuing disparity between employment rates
and earnings for those Americans who have a college degree and those without point to
the need for continued research into ways to positively impact retention. The previously
cited 2013 analysis by the U.S. Bureau of Labor Statistics found that unemployment rates
grow steadily higher the less education a person has; from 2.1% for adults over 25 with
professional degrees and 2.5% for adults over 25 with doctoral degrees, to a high of
12.4% for those who have not earned a high school diploma. Similarly, weekly earnings
drop the less education a person has, from $1,735 for adults with professional degrees
and $1,624 for adults with doctoral degrees, to a low of $471 for those who have not
earned a high school diploma (U.S. Bureau of Labor Statistics, 2013). The evidence
pointing to the strong correlation between a college degree and gainful employment and
earnings indicates the need for continued focus on retention research.

viii
One obvious area to explore is the impact of meaningful increases in grant
funding for lower income students on retention. The cost of a college education continues
to rise; in our study alone the average cost of attendance for a 4-year Oregon public
university rose by $2,939 or 17.3% during the 4 years of the study. In order to determine
if increasing the amount of grant funding given to low income students will positively
impact retention, the amount of the increase needs to cover both a significant portion of
the cost of attendance and take into account any continuing increases in this cost while
the student is in college. Providing increases in grant funding that do not even account for
increases in tuition and fees will not enable a realistic determination of whether reducing
the financial burden of lower income college students will increase the likelihood of
retention.
Another area of future study is to examine the impact of increased financial aid
for lower income students not just on within-institution retention, but on persistence to
graduation that includes transfers to other institutions. The ultimate goal of financial aid
policies is to enable students to pursue a college education through to graduation;
restricting analysis to only those students who are retained within the same institution
does not enable a full picture of the persistence model. As noted previously, a national
study of degree-seeking students performed by the National Student Clearinghouse
Research Center (Shapiro et al., 2013) from the 2006-2007 academic year through the
2011-2012 academic year found that, on average, 12.0% of students at 4-year, public
universities completed their educations at different institutions than their starting
institutions; transfer students therefore need to be included in future research to enable a

viii
true analysis of the impact of increased financial aid on the persistence of lower income
students.
It would also be helpful to consider persistence not just of freshman students, but
students at any level of undergraduate degree completion. I focused on the special case of
retention of freshman students due to the body of research that has shown that the highest
college dropout rates occur for college freshmen. As noted earlier, 4-year colleges and
universities lose an average of 29% of their first-year students before they begin their
second years (Terenzini & Reason, 2005). Terenzini and Reason (2005) further estimated
that more than 60% of college students in a cohort who withdraw within 5 years do so
before the start of their second year; they further noted that the highest dropout rates are
among historically underrepresented, low-income, and first-generation students. , Noel,
and Richter (1999) also found that attrition rates are reduced by half for each year a
student is retained past the freshman year; in other words, if an institution’s attrition rate
from first- to second-year is 40%, the second- to third-year attrition rate can be expected
to be 20%, and the third- to fourth-year attrition rate can be expected to be 10%. While
addressing freshman attrition offers the best chance of increasing graduation rates,
persistence is not guaranteed once a student advances to sophomore year; attention needs
to be paid to the remaining 40% of students who withdraw after their freshman year to
determine the factors that can be influenced to increase the likelihood of persistence.
In addition, given the increasing numbers of students pursuing some or all of their
college educations at community colleges, it would be helpful to either extend the study
to include community college students or, given the differences noted between

viii
community college students and those attending 4-year universities, perform separate
studies that determine the impact of financial aid policies on community college student
persistence. As noted previously, Mullin (2012) reported that “Community college
students have a greater proportion of students with various risk factors when compared
with all of higher education” (p. 4). In addition, Mullin noted that community colleges
provide access to almost half of all minority undergraduate students and more than 40%
of undergraduate students who are living in poverty. Given the continuing trend of
students choosing the lower-cost alternative of a community college rather than starting
as a freshman at a 4-year university, an expansion of the analysis to include community
college students is suggested as a future topic of research. A separate study focusing
specifically on the impact of increased grant funding on retention rates for community
college students is also another topic that is worthy of study.
As mentioned in previous chapters, retention is a multi-faceted phenomenon.
Factors that impact retention include individual, institutional, federal government, and
state government influences. In this study I included ethnicity, college GPA, mother’s
educational attainment, and father’s educational attainment as independent variables.
Further research should include more focus on the interaction effects of the various
factors to give a more accurate assessment of the impact of financial aid decisions on
various population groups. For example, Murtaugh et al. (1999) noted that college GPA
is significantly related to retention; further studies to determine if additional grant
funding for lower income students can positively impact college GPA and thus retention

viii
by reducing the need to work may provide further insights into the dependencies between
different variables that influence retention.
I used quantitative methods to analyze four years of data from Oregon’s public
universities to enable the analysis of the impact of the state’s change in funding for the
OOG on retention of freshman students who were grant recipients. Using mixed methods
to survey the recipients on factors relating to the decisions to persist or the decision to
leave college would have provided a more complete picture of the factors that influence
persistence. For example, my quantitative study did not include an analysis of the role
that parents’ decision-making plays in determining whether the student persists in
college; the assumption of the study was that the student is solely responsible for the
decision of whether or not to persist. Using surveys or interviews to explore the potential
influence of parents on the decision of lower-income students to persist or drop out may
have yielded important information on a factor that cannot be included in a strictly
quantitative study. Adding a qualitative analysis component to a similar, future study
would enable the researcher to gather information via surveys or interviews to provide a
context for the results of the quantitative analysis to better understand the factors that
drive a student’s persistence decisions, the relative weight of these factors, and the most
effective means of positively influencing the lower-income student population to persist.
Conclusions
Low postsecondary persistence rates for lower-income students continue to
contribute to lower lifetime earnings and employment opportunities for this segment of
the population. The continuing increases in the cost of a college degree have pushed the
viii
attainment of a college education out of reach for many. Yet the implications of not
attaining a college degree make the pursuit of solutions to the persistence problem of
lower-income students worthwhile. The difference in 2009 median income for college
graduates versus high school graduates was $19,550; college graduate median income
was $46,931, while high school graduate median income was $27,381 (Pew Research
Center, 2011). In 2011 the expected difference in lifetime earnings for a typical graduate
with a bachelor’s degree versus high school graduate was $650,000; the typical
bachelor’s degree holder over a 40-year work life could expect to earn $1,420,000 versus
$770,000 for the high school graduate (Pew Research Center, 2011). Given the
magnitude of the expected payoff of a college degree, more should be done to ensure that
the continuing low graduation rates of lower-income students are addressed.
The factors that influence persistence and retention are complex and varied. State
governments are in a position to positively impact both the cost of a college degree and
the amount of aid provided to lower-income students, two related factors that have been
shown to influence persistence. By increasing the amount of financing provided to public
colleges and universities, state governments can stop or even reverse the trend of
increasing hikes in tuition and fees. By making the cost of a college education more
affordable, state governments can ensure that lower-income students have more
opportunities to attend college and graduate. Increasing graduation rates provides a solid
return on investment through higher earnings of constituents and ensuing higher tax
revenues. In addition, Moretti (2004), an economist Enrico of the University of California
at Berkeley, reported that having a highly educated workforce boosts the wages at all

viii
levels of education. Oliff, Palacios, Johnson, and Leachman (2013) also noted that a
highly educated workforce attracts strong employers who pay competitive wages, which
are then spent in the community on goods and services, thus strengthening the overall
economic robustness of the community. Stopping the trend of reducing the amount of
state investment in higher education makes sound financial sense.
States can also influence the affordability of college for lower-income
postsecondary students by increasing the amount of grant funding provided to them. For
those who do attend college, the rising cost of tuition has caused an increase in the
amount of debt incurred through student loans. The increase in the amount of debt
incurred by the average bachelor’s degree graduate at a public 4-year institution grew by
15% from the 2007-2008 to the 2010-2011 academic year, from $11,800 to $13,600;
measured in 20011 dollars (Oliff et al., 2013). Research has shown that high levels of
student debt are associated with lower rates of home and auto ownership, difficulty in
saving for retirement, and challenges pursuing entrepreneurial ventures (Bidwell, 2013).
In addition, high levels of student debt make the likelihood of graduation lower,
particularly among lower-income students (Dwyer et al., 2012). State governments can
address the issue of large student loan debt levels and the associated negative impact on
graduation rates by providing grants at meaningful levels to enable students to truly
afford college without the burden of working excessive hours or assuming massive levels
of debt.

viii
REFERENCES
Advisory Committee on Student Financial Assistance. (2006). Transition matters: Community college to bachelor’s degree. Washington, DC: U.S. Department of Education.
Advisory Committee on Student Financial Assistance. (2010). The rising price of
inequality: How inadequate grant aid limits college access and persistence. Washington, DC: U.S. Department of Education.
Alfonso, M. (2006). The impact of community college attendance on baccalaureate
attainment. Research in Higher Education, 47(8), 873-903. Allen, D. (1999). Desire to finish college: An empirical link between motivation and
persistence. Research in Higher Education, 40(4), 461-485. Altbach, P. G., Berdahl, R. O., & Gumport, P. J. (2005). American higher education in
the twenty-first century: Social, political, and economic challenges. Baltimore, MD: The Johns Hopkins University Press.
Astin, A. W. (1975). Preventing students from dropping out. San Francisco, CA: Jossey-
Bass. Astin, A. W. (1984). Student involvement: A developmental theory for higher education.
Journal of College Student Personnel, 25, 297-308. Astin, A. W. (1993). What matters in college? Four critical years revisited. San
Francisco, CA: Jossey-Boss. Astin, A. W. (1996). Involvement in learning revisited: Lessons we have learned. Journal
of College Student Development, 37(2), 123-134. Bailey, T., & Morest, V. (2006). Defending the community college equity agenda.
Baltimore, MD: The Johns Hopkins University Press. Barton, P. E. (2008). How many college graduates does the U. S. labor force really need?
Change, 40(1), 16-21. Baum, S., McPherson, M., & Steele, P. (Eds.). (2008). The effectiveness of student aid
policies: What the research tells us. New York, NY: The College Board.

viii
Bean, J. P. (1980). Dropouts and turnover: The synthesis and test of a causal model of student attrition. Research in Higher Education, 12(2), 155-187.
Bean, J. P. (1982). Student attrition, intentions, and confidence: Interaction effects in a
path model. Research in Higher Education, 17(4), 291-320. Bean, J. P. (1990). Why students leave: Insights from research. In D. Hossler (Ed.). The
strategic management of college enrollments (pp. 147-169). San Francisco, CA: Jossey-Bass.
Bean, J. P., & Eaton, S. (2000). A psychological model of college student retention. In J.
M. Braxton (Ed.), Reworking the departure puzzle: New theory and research on college student retention. Nashville, TN: University of Vanderbilt Press.
Bean, J. P., & Metzner, B. S. (1985). A conceptual model of nontraditional student
attrition. Review of Educational Research, 55, 485-540. Berger, J. B. (2000). Organizational behavior at colleges and student outcomes: A new
perspective on college impact. Review of Higher Education, (23)2, 177-198. Berger, J. B., & Milem, J. F. (2000). Organizational behavior in higher education and
student outcomes. In J. C. Smart (Ed.), Higher education: Handbook of theory and research (Vol. 15; pp. 268-338). New York, NY: Agathon.
Bettinger, E. (2004). How financial aid affects persistence. In C. M. Hoxby (Ed.),
College choices: The economics of where to go, when to go, and how to pay for it (pp. 207-237). Chicago, IL: University of Chicago Press.
Bidwell, A. (2013, May 9). Rising student-loan debt hinders spending and hurts the
economy, report says. The Chronicle of Higher Education. Retrieved May 11, 2013 from http://chronicle.com/article/Rising-Student-Loan-Debt-Hurts/139141/
Binder, M., Ganderton, P. T., & Hutchens, K. (2002). Incentive effects of New Mexico’s
merit-based state scholarship program: Who responds and how? In D. E. Heller & P. Marin (Eds.), Who should we help? The negative consequences of merit scholarships (pp. 41-56). Cambridge, MA: The Civil Rights Project at Harvard University.
Bowen, H. R. (1977). Investment in learning: The individual and social value of
American higher education. New Brunswick, NJ: Transaction Publishers. Bozick, R. (2007). Making it through the first year of college: The role of students’
economic resources, employment, and living arrangements. Sociology of Education, 80(3), 261-284.

viii
Brainard, J., Burd, S., & Gose, B. (2000). The Clinton legacy in higher education. The Chronicle of Higher Education, 47(16), A27-32.
Braunstein, A., McGrath, M., & Pescatrice, D. (2000). Measuring the impact of financial
factors on college persistence. Journal of College Student Retention, 2(3), 191-203.
Braxton, J. M. (2000). Reworking the departure puzzle. Nashville, TN: Vanderbilt
University Press. Braxton, J. M., Sullivan, A. V., & Johnson, R. M. (1997). Appraising Tinto’s theory of
college student departure. In J. C. Smart (Ed.), Higher education: Handbook of theory and research (Vol. 12; pp. 107-164). New York, NY: Agathon Press.
Cabrera, A. F., Castañeda, M. B., Nora, A., & Hengstler, D. (1992). The convergence
between two theories of college persistence. Journal of Higher Education, 63(2), 143-164.
Cabrera, A. F., Nora, A., & Castañeda, M. B. (1992). The role of finances in the
persistence process: A structural model. Research in Higher Education, 33(5), 571-593.
Cabrera, A. F., Stampen, J. O., & Hansen, W. L. (1990). Exploring the effects of ability
to pay on persistence in college. Review of Higher Education, 13(3), 303-336. Callan, P. M. (2001). Reframing access and opportunity: Problematic state and federal
higher education policy in the 1990s. In D. E. Heller (Ed.), The states and public higher education policy (pp. 83-99). Baltimore, MD: The Johns Hopkins University Press.
Carnegie Commission on Higher Education. (1973). Priorities for action: Final report of
the Carnegie Commission on Higher Education. New York, NY: McGraw-Hill. Campbell, D. T., & Stanley, J. C. (1963). Experimental and quasi-experimental designs
for research. Belmont, CA: Wadsworth. Chen, R. (2008). Financial aid and student dropout in higher education: A heterogeneous
research approach. In J. C. Smart (Ed.), Higher education: Handbook of theory and research (pp. 209-239). Bronx, NY: Agathon Press.
Chen, R., & DesJardins, S. (2008). Exploring the effects of financial aid on the gap in
student dropout risks by income level. Research in Higher Education, 49(1), 1-18.

viii
Chen, R., & DesJardins, S. (2010). Investigating the impact of financial aid on student dropout risks: Racial and ethnic differences. The Journal of Higher Education, 81, 179-208
Chen, R., & St. John, E. P. (2011). State financial policies and college student
persistence: A national study. The Journal of Higher Education 82(5), 629-660. Choy, S. P. (2001). Students whose parents did not go to college: Postsecondary access,
persistence, and attainment. Washington, DC: U.S. Department of Education. Choy, S. P., & Premo, M. D. (1996). How low income undergraduates financed
postsecondary education: 1992-1993. Washington, DC: National Center for Education Statistics. (ERIC Document Reproduction Service Number ED394473)
Clotfelter, C. T. (1991). Financial aid and public policy. In C. T. Clotfelter, R. G.
Ehrenberg, M. Getz & J. J. Siegfried (Eds.), Economic challenges in higher education (pp. 89-123). Chicago, IL: University of Chicago Press.
Cochran, J. A., & Lee, E. D. (2011). Disillusionment with higher education in the Middle
East and the United States. Forum on Public Policy Online, 2011(3), 1-12. Cofer, J. E., & Somers, P. A. (1999). An analytical approach to understanding student
debt load response. Journal of Student Financial Aid, 29, 25-44. The College Board. (2000). Trends in student aid. New York, NY: Author. The College Board. (2007). Trends in student aid. New York, NY: Author. Committee for Economic Development. (1973). The management and financing of
colleges. New York, NY: Author. Coomes, M. D. (2000). The historical roots of enrollment management. New Directions
for Student Services, 89, 5-18. Cresswell, J. W. (2005). Educational research: Planning, conducting, and evaluating
quantitative and qualitative research (2nd ed.). Upper Saddle River, NJ: Pearson Education, Inc.
Cuccaro-Alamin, S., & Choy, S. P. (1998). Postsecondary financing strategies: How
undergraduates combine work, borrowing, and attendance. Washington, DC: National Center for Education Statistics. (ERIC Document Reproduction Service Number ED412859)
viii
DesJardins, S. L., Ahlburg, D. A., & McCall, B. P. (1997, June 2). Using event history methods to model the different modes of student departure from college. Paper presented at the annual meeting of the Association for Institutional Research, Orlando, FL.
DesJardins, S. L., Ahlburg, D. A., & McCall, B. P. (1999). An event history model of
student departure. Economics of Education Review, 18(3), 375-390. DesJardins, S. L., Ahlburg, D. A., & McCall, B. P. (2002). Simulating the longitudinal
effects of changes in financial aid on student departure from college. Journal of Human Resources, 37, 653-679.
Dowd, A. C., & Coury, D. (2006). The effect of loans on the persistence and attainment
of community college students. Research in Higher Education, 47(1), 33-62. Dunbar, A., Hossler, D., Shapiro, D., Chen, J., Martin, S., Torres, V., Zerquera, D.,
Ziskin, M. (2011). National postsecondary enrollment trends: Before, during and after the Great Recession. Herndon, VA: National Student Clearinghouse Research Center.
Dwyer, G. P., & Lothian, J. R. (2012). International and historical dimensions of the
financial crisis of 2007 and 2008. Journal of International Money and Finance, 31(1), 1-9.
Dwyer, R. E., McCloud, L., & Hodson, R. (2012). Debt and graduation from American
universities. Social Forces, 90(4), 1133-1155 Dynarski, S. M. (2003). Does aid matter? Measuring the effect of student aid on college
attendance and completion. The American Economic Review, 93(1), 279-288. Ehrenberg, R. G. (2006). The perfect storm and the privatization of public higher
education. Change, 38(1), 46-53. Family Educational Rights and Privacy Act of 1974, 20 U.S.C. § 1232g; 34 CFR Part 99
(1974). Feldman, K. A., & Newcomb, T. M. (1969). The impact of college on students. San
Francisco, CA: Jossey-Bass. Fenske, R. H., Porter, J. D., & DuBrock, C. P. (2000). Tracking financial aid and
persistence of women, minority, and needy students in science, engineering, and mathematics. Research in Higher Education, 41, 67-94.
viii
Fishbein, M., & Ajzen, I. (1975). Belief, attitude, intention, and behavior: An introduction to theory and research. Reading, MA: Addison-Wesley.
Friedman, T. L. (2012, August 7). Average is over, part II. The New York Times, p. A19. Fuller, W., Manski, C. F., & Wise, D. A. (1982). New evidence on economic
determinants of postsecondary schooling choices. Journal of Human Resources, 12, 477-495.
Hauptman, A. (2001). Reforming the ways in which states finance higher education. In
D. E. Heller (Ed.), The states and public higher education policy: Affordability, access, and accountability (pp. 11-38). Baltimore, MD: The Johns Hopkins University Press.
Hearn, J. C., & Holdsworth, J. M. (2004). Federal student aid: The shift from grants to
loans. In E. P. St. John & M. D. Parsons (Eds.), Public funding of higher education: Changing contexts and new rationales (pp. 40-59). Baltimore, MD: The Johns Hopkins University Press.
Hearn, J. C., & Longanecker, D. (1985). Enrollment effects of alternative postsecondary
price policies. The Journal of Higher Education, 56, 485-508. Heller, D. E. (1997). Student price response in higher education: An update to Leslie and
Brinkman. The Journal of Higher Education, 68, 624-659. Heller, D. E. (2001). Trends in the affordability of public colleges and universities: The
contradiction of increasing prices and increasing enrollment. In D. E. Heller (Ed.), The states and public higher education policy: Affordability, access, and accountability (pp. 11-38). Baltimore, MD: The Johns Hopkins University Press.
Heller, D. E. (2003). Informing public policy: Financial aid and student persistence.
Boulder, CO: Western Interstate Commission for Higher Education. Heller, D. E. (2006). Merit aid and college access. Madison, WI: University of
Wisconsin, Wisconsin Center for the Advancement of Postsecondary Education. Henry, G. T., Rubenstein, R., & Bugler, D. T. (2004). Is HOPE enough? Impacts of
receiving and losing merit-based financial aid. Educational Policy 18(5), 686-709. Higher Education Act of 1965, Pub. L. No. 89-329 (1965).
viii
Horn, L. J., & Berktold, J. (1998). Profile of undergraduates in U.S. postsecondary education institutions: 1995-96. Washington, DC: Office of Educational Research and Improvement, U.S. Department of Education. (ERIC Document Reproduction Service Number ED419461)
Hossler, D., Ziskin, M. B., Kim, S., Cekic, O., & Gross, J. P. K. (2008). Student aid and
its role in encouraging persistence. Bloomington, IN: Project on Academic Success.
Kahlenberg, R. D. (2004). America’s untapped resource: Low-income students in higher
education. New York, NY: The Century Foundation Press. Kaltenbaugh, L. S., St. John, E. P., & Starkey, J. B. (1999). What difference does tuition
make? An analysis of ethnic differences in persistence. Journal of Student Financial Aid, 29, 21-31.
Kane, T. J. (1995). Rising public college entry and college tuition: How well do public
subsidies promote access to college? (Working Paper Series No. 5164). Cambridge, MA: National Bureau of Economic Research.
King, J. E. (2002). The federal role in promoting student persistence: Current practice,
worrisome possibilities, and opportunities for progress. Optimizing the nation’s investment: Persistence and success in postsecondary education. Madison, WI: University of Wisconsin-Madison, Wisconsin Center for the Advancement of Postsecondary Education.
Kuh, G. D., Schuh, J. H., Whitt, E. J., & Associates (1991). Involving colleges. San
Francisco, CA: Jossey-Bass. Lam, L. P. T. (1999, May). Assessing financial aid impacts on time-to-degree for
nontransfer undergraduate students at a large urban public university. Paper presented to the Forum of the Association for Institutional Research, Seattle, WA.
Leslie, L. L., & Brinkman, P. T. (1987). Student price response in higher education.
Journal of Higher Education, 58, 181-204. Leslie, L. L., & Brinkman, P. T. (1988). The economic value of higher education.
Washington, DC: American Council on Education. Levitz, R. S., Noel, L., & Richter, B. J. (1999). Strategic moves for retention success. In
G. H. Gaither (Ed.), Promising practices in recruitment, remediation, and retention (pp. 31-50). San Francisco, CA: Jossey-Bass.

viii
Manski, C. F., & Wise, D. A. (1983). College choice in America. Cambridge, MA: Harvard University Press.
McDaniel, C., & Graham, S. W. (2001). Student retention in an historically Black
institution. College Student Journal, 35(1), 143-157. McDonough, P. M. (1997). Choosing colleges: How social class and schools structure
opportunity. Albany, NY: State University of New York Press. McPherson, M. S., & Schapiro, M. O. (1991). Keeping college affordable: Government
and equal opportunity. Washington, DC: The Brookings Institute. McPherson, M. S., & Schapiro, M. O. (1998). The student aid game: Meeting needs and
rewarding talent in American higher education. Princeton, NJ: Princeton University Press.
Milem, J. F., & Berger, J. B. (1997). A modified model of college student persistence:
Exploring the relationship between Astin’s theory of involvement and Tinto’s theory of student departure. Journal of College Student Development, 38, 387-400.
Mitchel, D. F., Goldman, B. A., & Smith, M. (1999). Change factors affecting college
matriculation: A re-analysis. Journal of the First-Year Experience and Students in Transition, 11(2), 75-92.
Moretti, E. (2004). Estimating the social return to higher education: Evidence from
longitudinal and repeated cross-sectional data. Journal of Econometrics, 121(1-2), 175-212.
Mortenson, T. G. (1990). The impact of increased loan utilization among low family
income students. Iowa City, IA: American College Testing Program. Mortenson, T. G. (2007). Higher education for students from low income families 1970-
2006. Postsecondary Education OPPORTUNITY, 183, 1-16. Mortenson, T. G. (2011a). Give ‘em Pell! Postsecondary Education OPPORTUNITY,
228, 1-16. Mortenson, T. G. (2011b). How to limit opportunity for higher education 1980 to 2011.
Postsecondary Education OPPORTUNITY, 230, 1-16. Mortenson, T. G. (2011c). State need-based grant aid compared to federal Pell grant aid
by state 1979-2010. Postsecondary Education OPPORTUNITY, 232, 13-20.

viii
Mullin, C. M. (2012). Why access matters: The community college student body (Policy Brief 2012-01PBL). Retrieved from http://www.aacc.nche.edu/Publications/ Briefs/Documents/PB_AccessMatters.pdf
Murdock, T. A. (1987). It isn’t just money: The effects of financial aid on student
persistence. Review of Higher Education, 11(1), 75-101. Murdock, T. A., Nix-Mayer, L., & Tsui, P. (1995, May 28-31). The effect of types of
financial aid on student persistence towards graduation. Paper presented at the 35th Annual Forum of the Association for Institutional Research, Boston, MA.
Murtaugh, P. A., Burns, L. D., Schuster, J. (1999). Predicting the retention of university
students. Research in Higher Education, 40(3), 355-371. National Bureau of Economic Research. (2008). Determination of the December 2007
peak in economic activity. Cambridge, MA: Author. National Center for Public Policy and Higher Education. (2008). Measuring up 2008: The
national report card on higher education. San Jose, CA: Author. Newman, F. (1971). Report on higher education. Washington, DC: U.S. Government
Printing Office. Nora, A. (1990). Campus-based programs as determinants of retention among Hispanic
college students. Journal of Higher Education, 61(3), 312-331. Nora, A., & Horvath, F. (1989). Financial assistance: Minority enrollments and
persistence. Education and Urban Society, 21(3), 299-309. Oliff, P., Palacios, V., Johnson, I., & Leachman, M. (2013). Recent deep state higher
education cuts may harm students and the economy for years to come. Washington, DC: Center on Budget and Policy Priorities. Retrieved May 2, 2013, from http://www.cbpp.org/files/3-19-13sfp.pdf
Olivas, M. A. (1985). Financial aid packaging policies: Access and ideology. The Journal
of Higher Education, 56(4), 462-475. Oregon Consumer Identify Theft Protection Act (2007). ORS 646A.600 to 646A.628.
Retrieved March 16, 2013 from http://www.leg.state.or.us/ors/ Oregon Student Assistance Commission. (n.d.a). History of the Oregon Opportunity
Grant. Retrieved March 14, 2013, from http://www.oregonstudentaid.gov/oog-history.aspx.

viii
Oregon Student Assistance Commission. (n.d.b). Oregon Student Assistance Commission: Opportunity Grant recipients and disbursements–2005-07 through 2009-11. Retrieved November 1, 2012, from http://oregonstudentaid.gov/oo-doc/OOG-summary-0507-to-0911.pdf
Oregon University System. (n.d.a). Campuses and centers. Retrieved March 16, 2013,
from http://www.ous.edu/about/campcent Oregon University System. (n.d.b). Historical budget documents. Retrieved March 16,
2013, from http://www.ous.edu/dept/budget/historical Oregon University System. (n.d.c). SCARF data dictionary. Retrieved March 16, 2013,
from http://www.ous.edu/sites/default/files/dept/ir/scarf/dd2010/scarf_2010.pdf Pardington, S. (2008a, September 25). Demand for financial aid swamps colleges. The
Oregonian, p. A01. Pardington, S. (2008b, January 13). Getting state aid for college gets easier. The
Oregonian, p. A01. Pascarella, E. T., Pierson, C. T., Wolniak, G. C., & Terenzini, P. T. (2004). First-
generation college students: Additional evidence on college experiences and outcomes. The Journal of Higher Education, 75, 249-284.
Pascarella, E. T., & Terenzini, P. T. (1991). How college affects students: Findings and
insights from twenty years of research. San Francisco, CA: Jossey-Bass. Pascarella, E. T., & Terenzini, P. T. (2005). How college affects students: A third decade
of research (Vol. 2). San Francisco, CA: Jossey-Bass. Paulsen, M. B., & St. John, E. P. (2002). Social class and college costs: Examining the
financial nexus between college choice and persistence. The Journal of Higher Education, 73(2), 189-239.
Payne, B. K., Pullen, R. R., & Padgett, J. M. (1996). An examination of student attrition
at a medium-sized southern university. Psychological Reports, 78, 1035-1038. Pew Research Center. (2010). The lost decade of the middle class. Retrieved June 23,
2013, from http://www.pewsocialtrends.org/2012/08/22/the-lost-decade-of-the-middle-class/
Pew Research Center. (2011). Is college worth it? Retrieved April 15, 2013, from
http://www.pewsocialtrends.org/files/2011/05/higher-ed-report.pdf

viii
Porter, O. F. (1991). Where do we go from here: Looking beyond student aid and access to persistence. In J. P. Merisotis (Ed.), The changing dimensions of student aid. New directions for higher education (No. 74; pp. 75-90). San Francisco, CA: Jossey-Bass.
Prince, H. (2006). Money on the table: State initiatives to improve financial aid
participation. Boston, MA: Jobs for the Future. Sallie Mae. (2012). How America pays for college 2012. Newark, DE: Author. Savoca, E. (1990). Another look at the demand for higher education: Measuring the price
sensitivity of the decision to apply to college. Economics of Education Review, 9(2), 123-134.
Schuh, J. H. (1999). Examining the effects of scholarships on retention in a fine arts
college. Journal of College Student Retention, 1, 193-202. Schwartz, N. D. (2012, December 8). Jobless rate edges down to its lowest level in 4
years. The New York Times, p. A1. Shapiro, D., Dundar, A., Chen, J., Ziskin, M., Park, E., Torres, V., & Chiang, Y. (2013).
Completing college: A state-level view of student attainment rates. Herndon, VA: National Student Clearinghouse Research Center.
Singell, L. D., Jr. (2001). Come and stay a while: Does financial aid effect enrollment
and retention at a large public university? Retrieved February 2, 2013, from http://digitalcommons.ilr.cornell.edu/cheri/12
Singell, L. D., Jr. (2002). Merit, need, and student self selection: Is there discretion in the
packaging of aid at a large public university? Economics of Education Review, 21(5), 445-454.
Skinner, R. R. (2007, March). Institutional eligibility for participation in Title IV student
aid programs under the Higher Education Act: Background and reauthorization issues (CRS Report No. RL33909). Washington, DC: Government Printing Office.
Somers, P. A. (1993). Using student financial aid to influence enrollment and persistence
in urban institutions. Journal of Student Financial Aid, 23, 51-59. Somers, P. A. (1995). A comprehensive model for examining the impact of financial aid
on enrollment and persistence. Journal of Student Financial Aid, 25(1), 13-27.

viii
Somers, P. A. (1996a). The freshman year: How financial aid influences enrollment and persistence at a regional comprehensive university. College Student Affairs Journal, 16, 27-38.
Somers, P. A. (1996b). The influence of price on year-to-year persistence of college
students. NASPA Journal, 33, 94-104. Spady, W. G. (1970). Dropouts from higher education: An interdisciplinary review and
synthesis. Interchange, 1(1), 65-85. Spady, W. G. (1971). Dropouts from higher education: Toward an empirical model.
Interchange, 2(3), 38-62. St. John, E. P. (1990a). Price response in enrollment decisions: An analysis of the high
school and beyond sophomore cohort. Research in Higher Education, 31, 161-176.
St. John, E. P. (1990b). Price response in persistence decisions: An analysis of the high
school and beyond senior cohort. Research in Higher Education, 31, 387-403. St. John, E. P. (1991). The impact of student financial aid: A review of recent research.
Journal of Student Financial Aid, 21, 18-32. St. John, E. P. (1993). Untangling the web: Using price-response measures in enrollment
projections. Journal of Higher Education, 64, 676-695. St. John, E. P. (1994). Prices, productivity and investment: Assessing financial strategies
in higher education (ASHE-ERIC Higher Education Report Three). Washington, DC: The George Washington University.
St. John, E. P. (1999). Evaluating state grant programs: A case study. Research in Higher
Education, 40, 149-170. St. John, E. P. (2003). Refinancing the college dream. Baltimore, MD: The Johns
Hopkins University Press. St. John, E. P. (2004). The nexus between finances and student involvement in
persistence. Paper presented at the annual meeting of the American Education Research Association, San Diego, CA.
St. John, E. P. (2006). Education and the public interest: Education reform, public
finance, and access to higher education. Dordrecht, The Netherlands: Springer.

viii
St. John, E. P., Asker, E. H., & Hu, S. (2001). The role of finances in student choice: A review of theory and research. In M. B. Paulsen & J. C. Smart (Eds.), The finance of higher education: Theory, research, policy & practice (pp. 419-438). New York, NY: Agathon Press.
St. John, E. P., Cabrera, A. E., Nora, A., & Asker, E. H. (2000). Economic influences on
persistence reconsidered. How can finance research inform the reconceptualization of persistence models? In J. M. Braxton (Ed.), Reworking the student departing puzzle (pp. 29-47). Nashville, TN: Vanderbilt University Press.
St. John, E. P., Hu, S., & Tuttle, T. (2000). Persistence by undergraduates in an urban
public university: Understanding the effects of financial aid. The Journal of Student Financial Aid, 30(2), 23-37.
St. John, E. P., Hu, S., & Weber, J. (2001). State policy and the affordability of public
higher education: The influence of state grants on persistence in Indiana. Research in Higher Education, 42(4), 401-428.
St. John, E. P., Kirshstein, R. J., & Noell, J. (1991). The effects of student financial aid
on persistence: A sequential analysis. Review of Higher Education, 14(3), 383-406.
St. John, E. P., Oescher, J., & Andrieu, S. C. (1992). The influence of prices on within-
year persistence by traditional college-age students in four-year colleges. Journal of Student Financial Aid, 22, 27-38.
St. John, E. P., & Parsons, M. D. (Eds.). (2004). Public funding of higher education:
Changing contexts and new rationales. Baltimore, MD: The Johns Hopkins University Press.
St. John, E. P., Paulsen, M. B., & Starkey, J. B. (1996). The nexus between college
choice and persistence. Research in Higher Education, 37(2), 175-220. St. John, E. P., & Starkey, J. B. (1995). The influence of prices on the persistence of adult
undergraduates. Journal of Student Financial Aid, 25, 7-17. Stampen, J. O., & Cabrera, A. F. (1986). Exploring the effects of student aid on attrition.
Journal of Student Financial Aid, 16, 28-40. Stampen, J. O., & Cabrera, A. F. (1988). Is the student aid system achieving its
objectives? Evidence on targeting and attrition. Economics of Education Review 7, 29-46.

viii
Swail, W. S. (2004). The art of student retention: A handbook for practitioners and administrators. Stafford, VA: Educational Policy Institute.
Task Force on State Budget Issues. (2005). Ensuring the nation’s future: Preserving the
promise of higher education. Academe 91(1), 62-66. Terenzini, P. T., & Reason, R. D. (2005, November 15). Parsing the first year of college:
Rethinking the effect of college on students. Paper presented at the meeting of the Association for the Study of Higher Education, Philadelphia, PA.
Tinto, V. (1975). Dropout from higher education: A theoretical synthesis of recent
research. Review of Higher Education 45, 89-125. Tinto, V. (1987). Leaving college: Rethinking the causes and cures of student attrition.
Chicago, IL: The University of Chicago Press. Tinto, V. (1992). Student attrition and retention. In B. R. Clark & G. R. Neave (Eds.),
The encyclopedia of higher education (1st ed.; pp. 1697-1709). Tarrytown, NY: Pergamon.
Tinto, V. (1993). Leaving college: Rethinking the causes and cures of student attrition
(2nd ed.). Chicago, IL: University of Chicago Press. Tinto, V. (2002). Enhancing student persistence: Connecting the dots. Optimizing the
nation’s investment: Persistence and success in postsecondary education. Madison, WI: University of Wisconsin-Madison, Wisconsin Center for the Advancement of Postsecondary Education.
Titus, M. A. (2006). No college student left behind: The influence of financial aspects of
a state’s higher education policy on college completion. The Review of Higher Education, 29(3), 293-317.
U.S. Bureau of Labor Statistics. (2013). Education pays. Retrieved March 9, 2013, from
http://www.bls.gov/emp/ep_chart_001.htm U.S. Department of Health and Human Services (2009). Code of federal regulations:
Title 45 public welfare. Retrieved March 16, 2013, from http://www.hhs.gov/ ohrp/policy/ohrpregulations.pdf
U. S. General Accounting Office. (1995). Higher education: Restructuring student aid
could reduce low-income student drop-out rate (Research Report No. 95-48). Washington, DC: U.S. General Accounting Office, Health, Education, and Human Services Division.
viii
Vogt, W. P. (1993). Dictionary of statistics and methodology. Newbury Park, CA: Sage. Voorhees, R. A. (1985). Financial aid and persistence: Do the federal campus-based aid
programs make a difference? Journal of Student Aid, 15, 21-30. Walpole, M. (2003). Social mobility and college: Low SES students’ experiences and
outcomes of college. Review of Higher Education, 27(1), 45-73. Walpole, M. (2007). Economically and educationally challenged students in higher
education: Access to outcomes. Hoboken, NJ: John Wiley & Sons. Weerts, D. J., & Ronca, J. M. (2006). Examining differences in state support for higher
education: A comparative study of state appropriations for research universities. Journal of Higher Education, 77(6), 935-965.
Wei, C. C., & Horn, L. (2002). Persistence and attainment of beginning students with
Pell Grants (Statistical Analysis Report No. NCES 2002-169). Washington, DC: National Center for Education Statistics, U. S. Department of Education.
White House Office of the Press Secretary. (2012). FACT SHEET: President Obama’s
blueprint for keeping college affordable and within reach for all Americans. Retrieved July 15, 2012, from http://www.whitehouse.gov/the-press-office/2012/01/27/fact-sheet-president-obama-s-blueprint-keeping-college-affordable-and-wi

viii
APPENDIX A
SCARF DATA EXTRACTION, TRANSFORMATION, AND LOAD PROCESS FLOW DESCRIPTION

viii
The SCARF Extraction Transformation/Validation and Loading (ETL) process flow is described below, followed by a diagram of the process (Oregon University System SCARF Data Dictionary, n.d.c).
• Institution Prepares File: The institution runs a process that extracts the data, does initial transformation, validation, and formatting of the file as defined by this document. The file is then transferred to OUS-IR via encrypted file transfer.
• OUS-Stage Technical Validation: The file is transferred to a staging location where it is loaded and automatically validated against the definitions and specification in this data dictionary. This technical validation will not catch data that is technically correct but still invalid; for example, the system would not catch the case where the institution reports no first-time freshmen because all records are set to a transfer admission decision.
• OUS-Stage Preliminary Report: A preliminary report is delivered to OUS-IR and the institution for review and approval. This report is not only used to find bad data but also allow the institution to make comparisons with their own reports and expected numbers (the example error above should be found in the report and fixed). Finally this report is the basis for the approval.
• OUS-IR and Institution Approve?: Both the institution and OUS-IR approve or reject the file.
o OUS-IR validates the submission to ensure the data are well formed an do not violate constraints or definitions. OUS-IR also validates that data quality is acceptable.
o The institution certifies that the information is correct, the data are consistent and accurate, and that the values are expected and represent the institution. This certification is by a designee of the provost or president of each institution. A single person will sign off via e-mail or a web based application (TBD).
o If either OUS-IR or the institution rejects the submission, the institution makes corrections and resubmits a complete file.
• OUS-IRIS Load to Warehouse: When validated and approved by both OUS-IR and the institution, the file is loaded to the IR Data Warehouse (IRIS). At this point the data are ready for reporting and analysis.

viii

viii
APPENDIX B
OUS DATA SHARING AGREEMENT

viii

viii

viii

viii
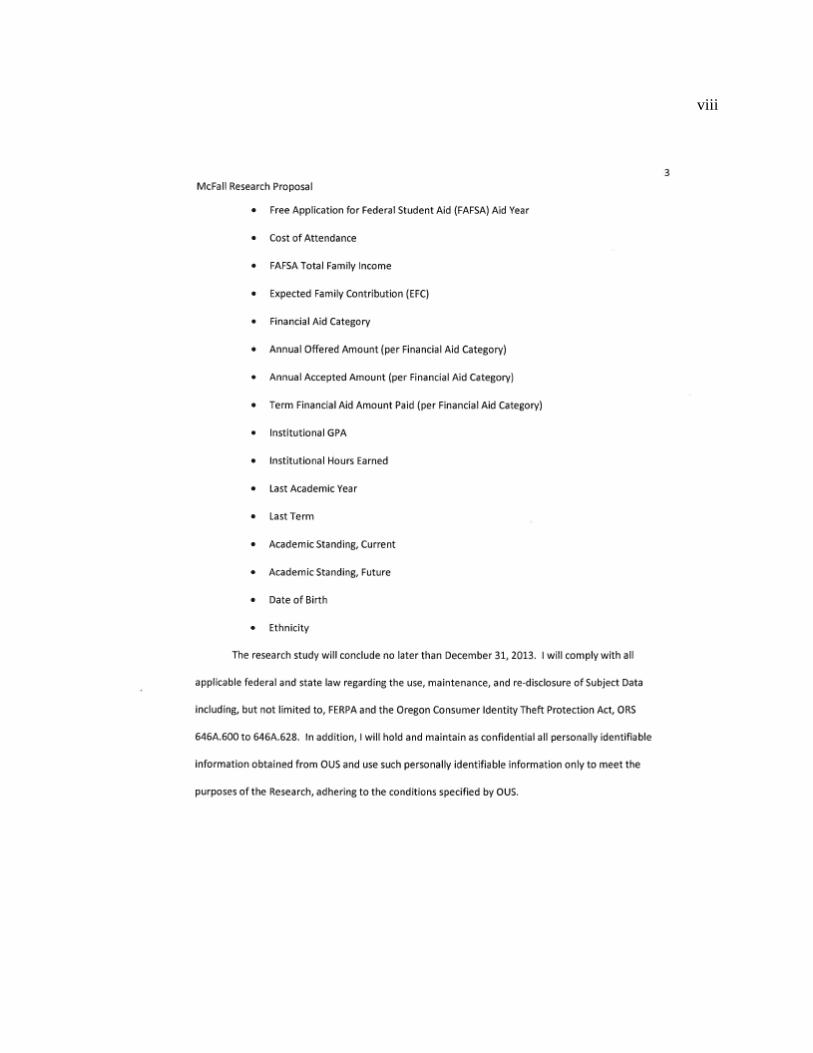
viii

viii

viii
APPENDIX C
EXHIBIT 1 OF THE OUS DATA SHARING AGREEMENT REVISED NOVEMBER 9, 2012

viii
Exhibit 1 – McFall Research Proposal
Every college age student should have the opportunity to attend college and earn a degree, but the fiscal realities for lower income students prevent the majority from attending and the vast majority from completing college, thus perpetuating a generational trend of limited postsecondary education and a likelihood of marginal income and status. Research studies have shown that lower income students who receive higher levels of grant funding to offset college expenses will be more likely to persist in their educations than those lower income students who do not receive the same level of grant funding and thus are forced to rely upon other means such as student loans or employment to pay for college. In this study I will examine a specific state policy change to determine whether a significant change in the grant funding provided to lower income students results in increased persistence rates for these students. The ultimate purpose of the study is to provide conclusions from the research to postsecondary policy makers in the hopes of informing and supporting continuing funding of need-based financial aid for lower income students.
The Oregon legislature more than doubled the funding available under the Oregon Opportunity Grant for the 2008-2009 school year (Oregon Student Assistance Commission, n.d.). The increases in need-based aid were hoped to positively impact the ability of students from “diverse backgrounds” to attend college (Pardington, 2008b). In addition to increasing minority student enrollment, officials at Oregon’s seven public 4-year universities hoped to attract more students from rural areas with the increased grant money made available. Kate Peterson, Oregon State University’s assistant provost for enrollment management, stated “We really need to remove the barriers” (Pardington, 2008b). The increased availability of grant money was expected to enable more lower-income students to attend Oregon’s public institutes of higher education and also positively impact persistence rates for these same students.
The focus of my research study is the impact of the changes in funding for the Oregon Opportunity Grant on persistence rates for lower income students. I plan to perform a quantitative analysis to determine if a relationship exists between the amount of grant funding provided to lower-income students and the persistence rates of those students. The research question that I am examining is as follows: Are the persistence rates of students at 4-year public institutions in Oregon who received increased funding under the Oregon Opportunity Grant for the 2008-2009 and 2009-2010 school years significantly higher than the persistence rates of the same demographic of students who received the lower funding amounts in the 2007-2008 and 2011-2012 school years? Ultimately, are persistence rates for these lower income students correlated with the amount of grant funding they received?
Through the use of a logistic regression analysis, I will analyze the impact of the increase in grant funding on the categorical dependent variable, persistence from freshman to sophomore year, using the independent variable percentage of financial need met by the OOG. In order to calculate this independent variable I will first calculate the financial need before the OOG, which consists of the amount of aid required by the

viii
student to pay for the cost of attendance after all other aid and family sources are considered. I will be defining the variable financial need before the OOG as:
• The cost of attendance for a specific school year o minus the EFC for that same school year o minus total of all grants except the OOG o minus total scholarships o minus total work study o minus fee remissions.
The independent variable of study is therefore the percentage of financial need met by the OOG, calculated by dividing the amount of the OOG for the year by the financial need before the OOG. I will be examining data for the following school years: 2007-2008, 2008-2009, 2009-2010, and 2011-2012. I will request that only data for undergraduate students who are Oregon residents be provided.
Data I will be collecting includes the following, as defined by the 2011 Oregon University System (OUS) Student Centralized Administrative Reporting File (SCARF) data dictionary: Student
• Sex • Date of Birth • Ethnicity • Student Level • Student Type • Major 1 • High School Grade Point Average (GPA) • Admission Year • Admission Term • Institutional Term Hours Attempted • Institutional Term Hours Earned • Institutional Term GPA • Institutional Term GPA Hours • Institutional Hours Earned • Institutional GPA Hours • Institutional GPA • Academic Standing, Current • Academic Standing, Future
Student Supplemental • Attendance Type • Attendance Status • SAT Composite • ACT Composite • GED Score

viii
Financial Aid • Free Application for Federal Student Aid (FAFSA) Aid Year • FAFSA Total Family Income • FAFSA Student + Spouse Adjusted Gross Income • FAFSA Student + Spouse Net Worth • FAFSA Mother’s Educational Level • FAFSA Father’s Educational Level • FAFSA Parents’ Adjusted Gross Income • FAFSA Parents’ Net Worth • Expected Family Contribution (EFC) • Cost of Attendance • Cost of Attendance Basis
Financial Aid Category
• Financial Aid Category • Annual Offered Amount (per Financial Aid Category) • Annual Accepted Amount (per Financial Aid Category) • Term Financial Aid Amount Paid (per Financial Aid Category)
Degree
• Major 1, CIP Code • Major 1, Major Code • Last Academic Year • Last Term
Race/Ethnicity
• Race/Ethnicity
The research study will conclude no later than December 31, 2013. I will comply with all applicable federal and state law regarding the use, maintenance, and re-disclosure of Subject Data including, but not limited to, FERPA and the Oregon Consumer Identity Theft Protection Act, ORS 646A.600 to 646A.628. In addition, I will hold and maintain as confidential all personally identifiable information obtained from OUS and use such personally identifiable information only to meet the purposes of the Research, adhering to the conditions specified by OUS.

viii
APPENDIX D
IRB REVIEW NOT REQUIRED FORM

viii

viii

viii
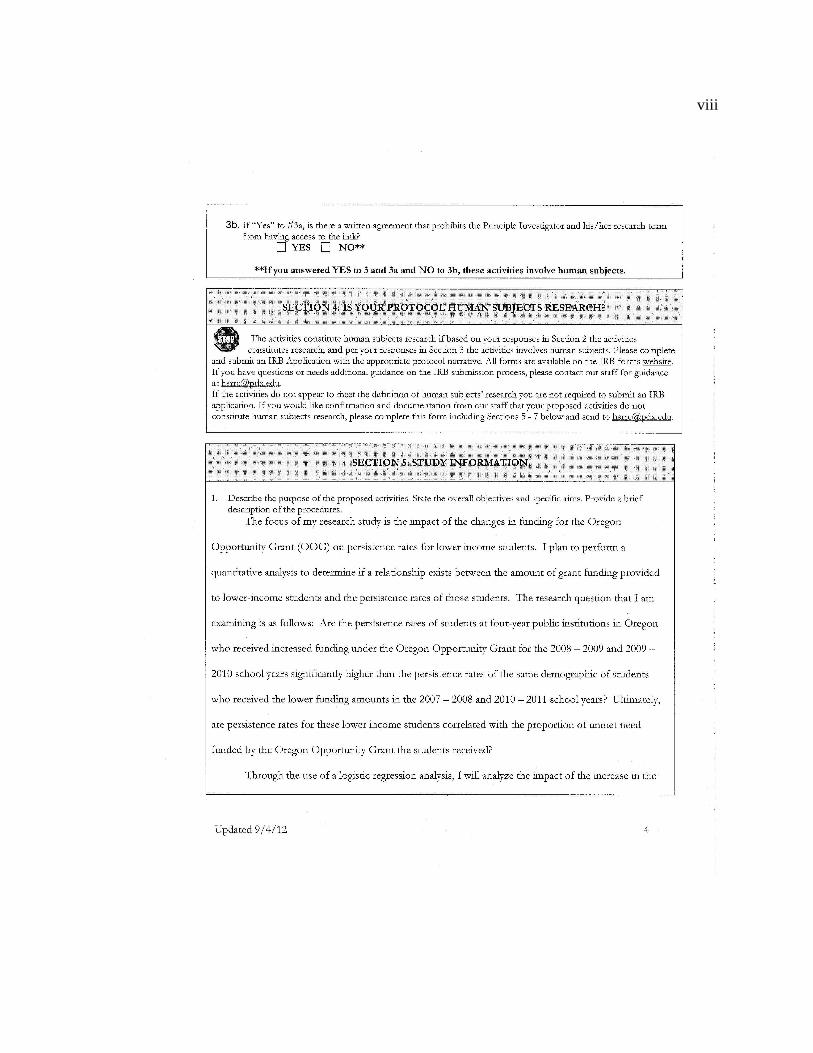
viii

viii

viii

viii

viii

viii
APPENDIX E
HUMAN SUBJECTS RESEARCH REVIEW COMMITTEE WAIVER OF REVIEW OF “STATE NEED-BASED AID AND FOUR-YEAR COLLEGE STUDENT
PERSISTENCE: A STATEWIDE STUDY” (HSRRC #122403)

viii
Post Office Box 751 503-725-4288 tel
Portland, Oregon 97207-0751 503-725-8170 fax
To: Janine Allen and Kara McFall
From: HSSRC
Date: December 11, 2012
Re: HSRRC waived review of your application titled, “State Need-Based Aid and Four-Year College Student Persistence: A Statewide Study” (HSRRC #122403)
________________________________________________________________________
The Human Subjects Research Review Committee has waived further review of your project as we have determined that the project does not fall under the federal regulations pertaining to research with human subjects.
Regardless of this waiver, PSU faculty, staff and students are still responsible for maintaining the highest ethical standards when conducting any projects or studies on behalf of PSU.
Thank you for informing the committee, and we appreciate your timely attention to this matter. If you make changes in the proposed project, the Committee must be notified in writing as further review may be required.
If you have questions or concerns, please contact the HSRRC in the Office of Research and Strategic Partnerships (RSP), (503) 725-2243, Market Center Building, 6th floor.
cc: Roxanne Treece
Waiver memo
Human Subjects Research Review Committee