Embed Size (px)
Citation preview

Volume 60, Number 9 September 14, 2012
This report was updatedJanuary 18, 2013, to correcterrors in Tables A and 2.
U.S. Decennial Life Tables for 1999–2001:State Life Tablesby Rong Wei, Ph.D., Office of Research and Methodology; Robert N. Anderson, Ph.D., Division of Vital Statistics; Lester R. Curtin, Ph.D.,Division of Health and Nutrition Examination Surveys; and Elizabeth Arias, Ph.D., Division of Vital Statistics
AbstractObjective—This report, following publication of the national life
tables (1,2) for 1999–2001, presents state-specific life tables for the50 states and District of Columbia by race (white and black) and sex.These tables are the most recent in a series of decennial life tablesfor the United States.
Methods—Data used to prepare these state-specific life tablesinclude population counts by age on the census date of April 1, 2000;deaths occurring in the 3-year period of 1999–2001; and counts of U.S.resident births during 1997–2001. Methods for calculating the lifetables were modified from the previous decennial life tables to auto-mate the smoothing of age-specific mortality data and to allow for theestimation of life tables for smaller population subgroups, which oftenhad insufficient data available to estimate reliable life tables under theprevious method. The current method allows for the estimation of lifetables for the black population in six states, which were never pre-viously published due to small numbers of deaths. Standard errors forestimating life expectancy and probability of dying are also presentedin this report.
Results—Among the 50 states, Hawaii had the highest life expec-tancy at birth during the 1999–2001 period at 80.23 years, andMississippi had the lowest life expectancy at 73.88 years. Life expec-tancy for the District of Columbia was even lower at 73.09 years.State-specific life expectancy at birth improved from the previousdecennial period (1989–1991) for all states and the District ofColumbia. Life expectancy at age 65 ranged from 20.42 years inHawaii to 16.61 years in Kentucky. Life expectancy at age 65 alsoimproved for all states except Kentucky.
Keywords: life expectancy • survival • death rates • statemortality
IntroductionThis report presents life tables for 1999–2001 for each of the 50
states and District of Columbia and is one of a series of reportspresenting the U.S. decennial life tables for 1999–2001. The series,by the Centers for Disease Control and Prevention’s National Centerfor Health Statistics (NCHS), also includes a report presenting U.S.national life tables (1); a report that describes in detail the methodsused to estimate the national life tables (2); and a report on nationallife tables analyzed by major groups of cause of death (forthcoming).
Unlike U.S. national life tables, which are published both annuallyand decennially, state life tables are published only decennially. Eachset of life tables in the decennial series is based on the decennialcensus of population and deaths in the 3-year period centered on thecensus year, (e.g., during 1979–1981, 1989–1991, and so forth). Thedecennial state life tables for 1999–2001 are the most recent in theseries that began with the 1939–1941 period. For each of the 50 statesand District of Columbia, life tables in this report are presented by race(white and black) and sex where the numbers of deaths were sufficientto produce reliable estimates.
Data and MethodsThe life tables presented in this report are based on age-
specific death rates calculated using data from the 2000 census ofpopulation (as of April 1, 2000) and deaths occurring in the UnitedStates in the 3 years proximate to the 2000 census (i.e.,1999–2001). Information on all resident deaths occurring in the 50states and District of Columbia was collected from death certificatesfiled in state vital statistics offices and reported to NCHS as part ofthe National Vital Statistics System (NVSS). The general method-ology used in preparing state life tables was originally developed byThomas N.E. Greville for the 1939–1941 decennial life tables (3),
National VitalStatistics Reports
U.S. DEPARTMENT OF HEALTH AND HUMAN SERVICESCenters for Disease Control and Prevention
National Center for Health StatisticsNational Vital Statistics System

2 National Vital Statistics Reports, Vol. 60, No. 9, September 14, 2012
with modifications applied by later authors for the preparation of subsequent decennial tables. In preparing the state life tables for 1999–2001, significant changes were made to the previous estimation methodology. These changes resulted in improvements in the technique for smoothing the data and in the estimation of life tables for states with small numbers of deaths (i.e., where the total number of deaths in the data period for a population is less than 700; see ‘‘Technical Notes’’).
The modified methodology for smoothing the data is based on a systematic statistical procedure, which ensures that estimation is efficient and repeatable, and that the resulting mortality estimates are objective and statistically optimized. Using the previous methodology, when the age distribution of observed death rates was not sufficiently smooth, the observed death rates were then manually adjusted by transferring deaths from one age group to another adjacent age group in an iterative manner until smoothness was achieved—a time-consuming process. The current life table methodology utilizes a parametric model (4) representing the typical shape of the age-specific mortality curve. This method results in a curve that is smoothed with minimized estimation errors. Details of this method are presented in the ‘‘Technical Notes.’’
Another significant improvement in the methodology involved estimating life tables for race and sex groups in states with small numbers of deaths. Life table estimation for these populations is complicated by concerns about reliability due to small numbers of observed deaths (5). Life tables for the previous decennial period 1989–1991 were not published for black populations in 18 states because of this concern. The criterion for publication required the total number of deaths for a population group during the 3-year period to be greater than 700. This criterion was derived from the calculation of coefficients of variation for death rates and life expectancies (5). To further reduce the minimum criterion for estimating life tables for small populations, a method of probability modeling with historical data was used (6). NCHS has well-documented mortality data for more than 30 years, and data from the historical record can be used to assist the estimation of current death rates (6,7); see ‘‘Technical Notes’’ for detail on the methodology. By applying this method, the minimum number of deaths criterion was reduced to 300 deaths for the 3-year period. As a result, life tables for the black population (males and females) in six states (Iowa, Minnesota, Nebraska, New Mexico, Oregon, and Rhode Island), unpublished in previous decennial series, are published for 1999–2001. Nevertheless, there are still 11 states (Alaska, Hawaii, Idaho, Maine, Montana, New Hampshire, North Dakota, South Dakota, Utah, Vermont, and Wyoming) in which the total number of deaths is insufficient for reliable estimation (i.e., less than 300 for either black females or black males or both). Life tables for the black population for these 11 states are not published in this series.
Explanation of life table and standard error table columns
Note: Data used for illustration are from Table IA–3 for females in Iowa.
Column 1—Age (x to x + 1) in years: Shows the interval of 1 year between the two exact ages indicated. For instance, ‘‘21–22’’
indicates the interval between the 21st and the 22nd birthdays; in other words, the 22nd year of life before reaching the 22nd birthday.
Column 2—Probability of dying between ages x and x + 1 (qx): Shows the proportion of the members of the life-table cohort alive at the beginning of the indicated year of age who will die before reaching their next birthday on the basis of the mortality rates of 1999–2001. For example, for females (Table IA–3) who reach age 21 in Iowa, the probability of dying before reaching their 22nd birthday is 0.00042—which means that out of every 1,000 females surviving to age 21, 0.42 will die before reaching their 22nd birthday.
Column 3—Number surviving to age x (lx): Shows the number of persons, starting with a cohort of 100,000 live births, who will survive to the birthday marking the beginning of the indicated year of age. Thus, out of 100,000 female babies born alive in the cohort of Table IA–3, 99,640 will complete the first year of life and enter the second, 99,071 will reach age 21, and 74,718 will reach age 75.
Column 4—Number dying between ages x and x + 1 (dx): Shows the number dying in each successive age interval out of 100,000 live births. Thus, out of 100,000 female babies born alive, 360 will die in the first year of life (ages 0–1), 41 in the 22nd year (ages 21–22), and 2,093 in the 76th year (ages 75–76). Each figure in column 4 is the difference between two successive numbers in column 3 (e.g., 41 deaths in the 22nd year are the surviving difference between 99,071 in the 22nd year and 99,030 in the 23rd year).
Columns 5 and 6—Person-years lived from ages x and x + 1 (Lx), and Total number of person-years lived above age x (Tx): Both columns describe the stationary population. Suppose that a group of 100,000 persons such as that assumed in column 3 are born every year, and that the proportion dying in each such group in each age interval throughout the lives of the members is exactly that shown in column 2. If there were no migration and if the births were evenly distributed over the year, the survivorship of these births would constitute what is called a stationary population, because in such a population the number of persons living within a given age interval would never change. When a person leaves an age interval, whether by death or growing older and entering the next higher age interval, his or her place would immediately be taken by someone entering from the next lower age interval. Thus, a census taken at any time in such a stationary community would always show the same total population and the same numerical distribution of that population among the various age intervals. In such a stationary population supported by 100,000 annual births, column 3 shows the number of persons who, each year, would reach the exact age that marks the beginning of the age interval indicated in column 1, and column 4 shows the number of persons who would die each year in that year of age interval. Column 5, Lx
(person-years lived between ages x and x + 1), shows the number of persons in the stationary population in the indicated year of age. For example, the number shown in Table IA–3 for the year of age 21–22 is 99,051. This means that in a stationary population supported by 100,000 annual births, and with proportions dying in each age interval in accordance with column 2, a census taken on any date would show 99,051 persons at age 21 (i.e., between exact ages 21 and 22). Column 6, Tx (total number of person-years lived above age x), shows the total number of persons in the stationary population in the indicated year of age and all subsequent years of age. For example, in the stationary population of persons described above, column 6 shows

3 National Vital Statistics Reports, Vol. 60, No. 9, September 14, 2012
that there would be at any given moment a total of 6,052,029 persons who had reached their 21st birthday. The population at age 0 and above—in other words, the total persons of the stationary community—would be 8,139,133.
Column 7—Expectation of life at age x (ex): The average remaining lifetime (also called expectation of life at age x) at any given age is the average number of years of remaining life to be lived by those surviving to that age, on the basis of a given set of age-specific rates of dying. To relate these figures to the preceding columns of the life table, it is necessary to observe that the figures in column 5 of the life tables can also be interpreted in terms of a single life-table cohort without introducing the concept of the stationary population. From this point of view, each figure in column 5 represents the total time in years lived between two indicated birthdays by all those reaching the younger age among the survivors of a cohort of 100,000 live births. Thus, the figure of 99,071 for females in Iowa in the year of age 21–22 is the total number of years of life between their 21st and 22nd birthdays by the 99,071 (column 3) who reached their 21st birthday out of the original cohort of 100,000 females born alive. The corresponding figure (6,052,029) in column 6 is the total number of years lived after attaining age 21 by the 99,071 reaching that exact age. This number of years divided by the number of persons (6,052,029 divided by 99,071) gives 61.09 years as the average remaining lifetime at age 21 for females in Iowa.
Standard errors (SEs)—The probabilities of dying and the expectation of life presented in this report are ‘‘point estimates.’’ They do not give the reader an indication of how accurate they are. Therefore, SEs for estimates of qx and ex are also presented. SEs of probability of dying and of life expectancy contain six and three decimal places, respectively, and are shown in Tables IA–10 and Table IA–11 for Iowa. Nine life tables for the total population—by race, by sex, and by race and sex—are based on a complete count of resident deaths in Iowa during 1999, 2000, and 2001. As such, they are not subject to sampling error. However, even complete counts may be considered as one of a large series of possible results that could have arisen under the same circumstances. This type of variation is known as random error. The SEs shown in this report reflect random error only, not other errors such as misreporting of age on death certificates or in the census.
SEs can be used to develop confidence intervals (CIs) within which the point estimates are expected to lie with a probability level of 1 – α. Even though 68 percent CIs are rarely used because of their high degree of uncertainty, they are shown here to demonstrate the method of construction of CIs. To obtain a 68 percent CI for the probability of dying at any age, take the point estimate from column 2 of the appropriate life table and add and subtract one SE from the table that gives the SEs of the probability of dying [68 percent CI = point estimate ± 1.00(SE)]. The 95 percent CI is obtained by adding and subtracting two (1.96 for exact value) SEs [95 percent CI = point estimate ± 1.96(SE)]. For example, the probability that a 50-year-old female in Iowa will die before her 51st birthday is 0.00262 (Table IA–3) with an SE of 0.000206 (Table IA–10). Therefore, the 68 percent CI is from 0.002414 to 0.002826, and the 95 percent CI is from 0.002208 to 0.003032. The life expectancy of a 50-year-old female is 33.29 years (Table IA–3) with an SE of 0.055 years (Table IA–11); the 68 percent CI for the life expectancy is, therefore, from 33.135 to 33.345 years, and the 95 percent CI is from 33.080 to 33.400 years.
Results and Discussion
Life tables for the 50 states and District of Columbia
Complete life tables
A set of complete life tables (age interval in 1 year from 0 to 109 years) for each state and the District of Columbia is available online from ‘‘U.S. Decennial Life Tables for 1999–2001: State Life Tables’’ at http://www.cdc.gov/nchs/nvss/mortality/lewk4.htm. All table titles are listed in Table II. These tables are numbered using the FIPS alpha code for the state combined with a table code. The table code is denoted as 1 for the total population, 2 for total males, 3 for total females, 4 for total white persons, 5 for white males, 6 for white females, 7 for total black persons, 8 for black males, 9 for black females, 10 for the standard error of qx, and 11 for the standard error of ex . For example, Table AL–3 included in this report shows the complete life table for total females in Alabama, and Table KY–11 shows S2(ex) for Kentucky.
Summary tables for population surviving and life expectancy at 5-year intervals
Table 1 summarizes survivorship by age (in 5-year age intervals), race (white and black), and sex for the 50 states and District of Columbia. Table 2 summarizes life expectancy by age, race, and sex in the same way. Both tables are constructed by abstracting figures from column 3 (lx) (Table 1) and column 7 (ex) (Table 2) from the complete tables at age 0, 5, 10, ... , 105 years for all nine subpopulations.
Life expectancy at birth (e0) and at age 65 (e65)
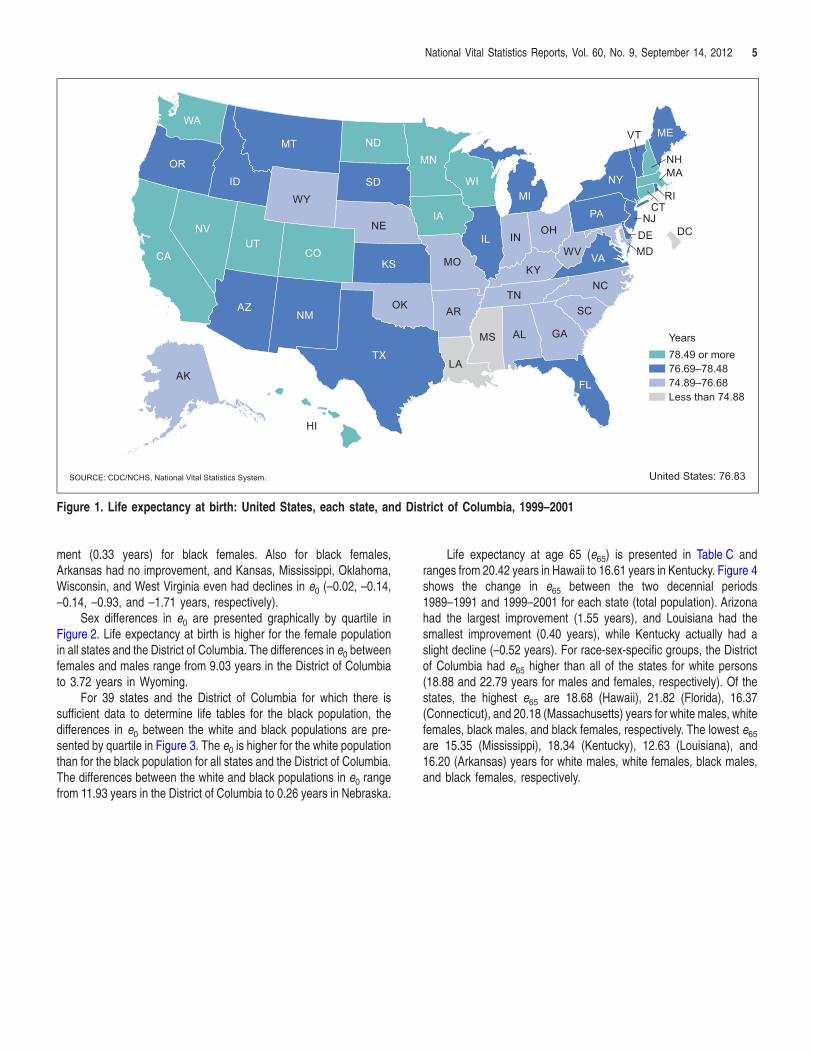
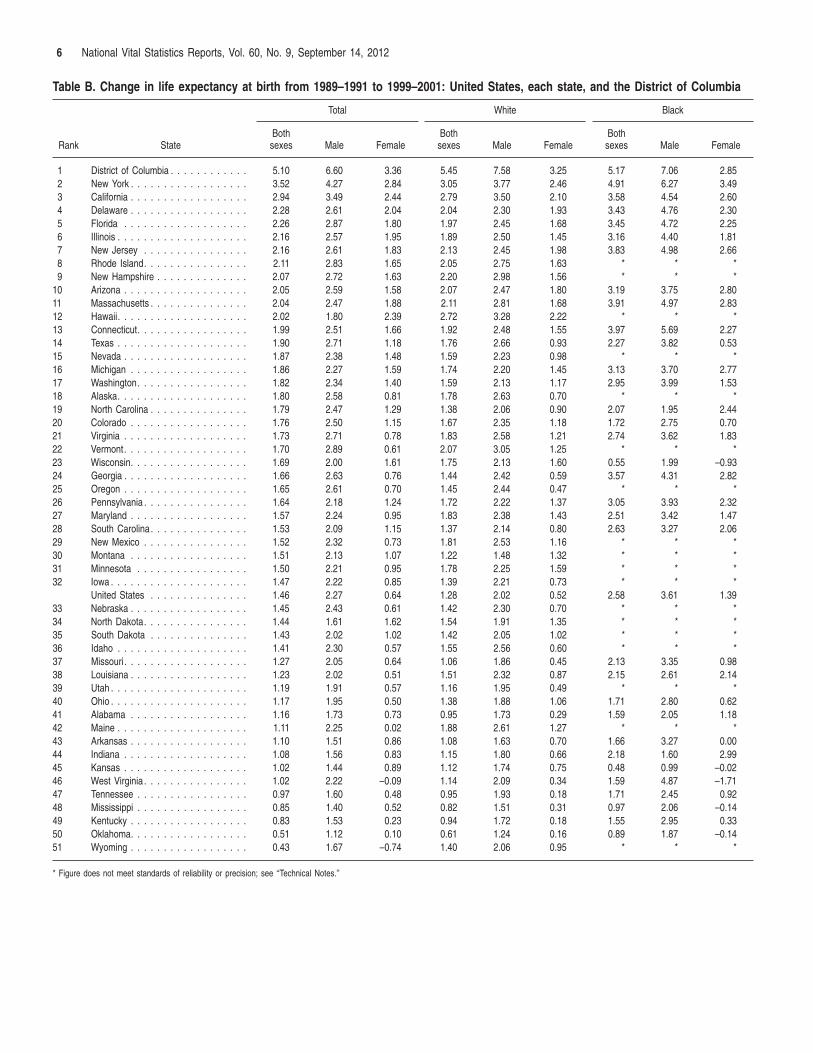
Life expectancy at birth (e0) by race and sex for the United States, each state, and the District of Columbia is presented in rank order in Table A. Figure 1 shows the geographic distribution for the United States. At the state level for the total population, Hawaii had the highest e0 at 80.23 years; Mississippi, at 73.88 years, had the lowest. The e0 in the District of Columbia was 73.09 years. Table B shows the change in e0 in rank order for the 50 states and District of Columbia between the two decennial periods 1989–1991 and 1999–2001. The District of Columbia had a substantial improvement (5.10 years)—higher than all of the states. Among the states, New York had the largest improvement during this period (3.52 years) and Wyoming had the smallest improvement (0.43 years). For race-sex specific groups, the District of Columbia had substantial improvements in all population groups (7.58, 3.25, 7.06, and 2.85 years for white males, white females, black males, and black females, respectively). Among the states, New York had the largest improvements during this period for all race-sex-specific groups (3.77, 2.46, 6.27, and 3.49 years for white males, white females, black males, and black females, respectively). Oklahoma had the smallest improvements for both white males (1.24 years) and white females (0.16 years). Kansas had the smallest improvement of all states for black males (0.99 years), while Kentucky had the smallest improve

Table A. Life expectancy at birth, by race and sex: United States, each state, and the District of Columbia, 1999–2001
Total White Black
Rank Area and stateBothsexes Male Female
Bothsexes Male Female
Bothsexes Male Female
123456789
1011121314151617181920212223242526272829303132
33343536373839404142434445464748495051
Hawaii. . . . . . . . . . . . . . . . . . . .Minnesota . . . . . . . . . . . . . . . . .North Dakota. . . . . . . . . . . . . . . .Connecticut. . . . . . . . . . . . . . . . .Utah . . . . . . . . . . . . . . . . . . . . .California . . . . . . . . . . . . . . . . . .New Hampshire . . . . . . . . . . . . . .Iowa . . . . . . . . . . . . . . . . . . . . .Massachusetts . . . . . . . . . . . . . . .Colorado . . . . . . . . . . . . . . . . . .Rhode Island. . . . . . . . . . . . . . . .Washington. . . . . . . . . . . . . . . . .Wisconsin. . . . . . . . . . . . . . . . . .Nebraska . . . . . . . . . . . . . . . . . .South Dakota . . . . . . . . . . . . . . .Idaho . . . . . . . . . . . . . . . . . . . .Vermont. . . . . . . . . . . . . . . . . . .New York . . . . . . . . . . . . . . . . . .Arizona . . . . . . . . . . . . . . . . . . .Florida . . . . . . . . . . . . . . . . . . .Oregon . . . . . . . . . . . . . . . . . . .Kansas . . . . . . . . . . . . . . . . . . .Montana . . . . . . . . . . . . . . . . . .New Jersey . . . . . . . . . . . . . . . .Maine . . . . . . . . . . . . . . . . . . . .New Mexico . . . . . . . . . . . . . . . .Illinois . . . . . . . . . . . . . . . . . . . .Texas . . . . . . . . . . . . . . . . . . . .Delaware . . . . . . . . . . . . . . . . . .Pennsylvania . . . . . . . . . . . . . . . .Virginia . . . . . . . . . . . . . . . . . . .Michigan . . . . . . . . . . . . . . . . . .United States . . . . . . . . . . . . . . .Wyoming . . . . . . . . . . . . . . . . . .Alaska. . . . . . . . . . . . . . . . . . . .Missouri. . . . . . . . . . . . . . . . . . .Indiana . . . . . . . . . . . . . . . . . . .Ohio . . . . . . . . . . . . . . . . . . . . .Maryland . . . . . . . . . . . . . . . . . .North Carolina . . . . . . . . . . . . . . .Nevada . . . . . . . . . . . . . . . . . . .Oklahoma. . . . . . . . . . . . . . . . . .Arkansas . . . . . . . . . . . . . . . . . .Tennessee . . . . . . . . . . . . . . . . .West Virginia . . . . . . . . . . . . . . . .Georgia . . . . . . . . . . . . . . . . . . .Kentucky . . . . . . . . . . . . . . . . . .South Carolina . . . . . . . . . . . . . . .Alabama . . . . . . . . . . . . . . . . . .Lousiana . . . . . . . . . . . . . . . . . .Mississippi . . . . . . . . . . . . . . . . .District Columbia . . . . . . . . . . . . .
80.2379.2679.0678.9078.8978.8078.7978.7678.7678.7278.6578.6478.5678.3778.3478.2978.2478.2078.1578.1078.0977.7877.7477.5877.4677.2677.0677.0477.0477.0276.9576.9076.8376.6476.6376.5276.4776.4976.3676.2776.0575.6175.4375.2975.2875.2775.2075.0474.8074.2873.8873.09
77.1776.7475.9676.1376.8476.0276.2476.1175.7976.2975.8376.1875.6176.0075.1976.1876.1875.1375.2574.9775.8274.8475.1874.7775.2374.5273.9174.1274.2474.0974.4873.9874.1074.8374.1873.5973.5573.9473.5573.0573.3472.7572.0571.9872.7572.2872.2571.6871.3271.1270.3068.57
83.6581.8082.6181.6380.9581.6381.4081.3981.6881.1681.4281.1481.6480.7881.7980.5080.2981.1681.1681.4080.3780.8880.5680.3279.6380.0680.2680.0579.7879.9079.3479.8379.4578.5579.4179.4679.4578.9579.0879.5679.2478.5978.9978.6677.8478.2278.2078.4978.3477.4477.6277.59
80.6479.7579.5379.3678.9378.7178.8878.7779.0178.7378.8578.5178.9378.6379.3378.4478.5778.6678.4978.7977.9678.1877.9478.5978.2377.8978.0577.5177.8077.8778.1777.9277.4177.7477.6177.0876.9777.3178.1377.2776.0375.8276.2876.2275.5176.6875.5976.7075.9676.3875.6081.54
78.4077.0376.6576.7376.9576.1176.4676.1976.3576.2376.0676.1076.1276.1776.3576.4676.3075.7875.5175.6475.7275.4675.0775.8275.5975.1975.3374.7475.0575.0375.6275.2674.7475.3375.4574.2974.2474.5875.5874.2773.4973.0073.1773.3172.7573.8872.7373.7672.8573.4772.2578.94
83.3182.6182.6781.9280.9381.3681.3081.3581.6381.3181.6080.9881.8781.1482.6180.5380.9081.4981.6482.1480.2081.0081.2481.3280.8880.6980.7880.3580.5580.6580.6980.5979.9780.4180.1079.9379.6980.0180.6680.3478.9778.7579.5979.2878.3679.5378.4279.7779.1479.4179.1384.31
*74.06
*74.81
*73.23
*72.9176.3674.1374.8474.2971.5171.88
***
74.2474.0372.2274.0371.70
*72.30
*72.9770.6272.0672.6971.3272.7971.6271.74
**
70.9471.9871.8672.2071.4572.5771.7470.5970.6871.3472.3671.7171.4570.8270.7770.3869.61
*71.59
*71.73
*69.97
*70.8173.1471.7172.1871.9068.4169.15
***
70.1370.9568.9870.6768.47
*68.85
*71.6366.8169.1870.2767.2669.3767.3868.08
**
67.2267.4768.6068.4166.3370.5668.9767.3066.8669.8768.2969.0167.3466.4266.4566.7264.59
*76.60
*77.71
*76.67
*75.1679.3376.5977.3977.1174.3474.67
***
77.8477.7075.5378.2475.02
*75.54
*74.3774.2074.7675.2175.3476.2075.9575.12
**
74.5076.5574.9175.7876.6874.7574.3473.5874.1672.6576.1674.4675.4174.9475.3073.6874.46
* Figure does not meet standards of reliability or precision; see ‘‘Technical Notes.’’
4 National Vital Statistics Reports, Vol. 60, No. 9, September 14, 2012
5 National Vital Statistics Reports, Vol. 60, No. 9, September 14, 2012
WA
OR
CA
NV
ID
MT
WY
UT CO
AZ NM
AK
TX
OK
KS
NE
SD
ND MN
IA
MO
AR
LA
MS
TN
KY
IN
WI MI
OH
NY
ME
IL
AL GA
FL
SC
NC
VAWV
PA
HI
MD DE NJ
CT RI
MA NH
VT
DC
Years 78.49 or more 76.69–78.48 74.89–76.68 Less than 74.88
SOURCE: CDC/NCHS, National Vital Statistics System. United States: 76.83
Figure 1. Life expectancy at birth: United States, each state, and District of Columbia, 1999–2001
ment (0.33 years) for black females. Also for black females, Arkansas had no improvement, and Kansas, Mississippi, Oklahoma, Wisconsin, and West Virginia even had declines in e0 (–0.02, –0.14, –0.14, –0.93, and –1.71 years, respectively).
Sex differences in e0 are presented graphically by quartile in Figure 2. Life expectancy at birth is higher for the female population in all states and the District of Columbia. The differences in e0 between females and males range from 9.03 years in the District of Columbia to 3.72 years in Wyoming.
For 39 states and the District of Columbia for which there is sufficient data to determine life tables for the black population, the differences in e0 between the white and black populations are presented by quartile in Figure 3. The e0 is higher for the white population than for the black population for all states and the District of Columbia. The differences between the white and black populations in e0 range from 11.93 years in the District of Columbia to 0.26 years in Nebraska.
Life expectancy at age 65 (e65) is presented in Table C and ranges from 20.42 years in Hawaii to 16.61 years in Kentucky. Figure 4 shows the change in e65 between the two decennial periods 1989–1991 and 1999–2001 for each state (total population). Arizona had the largest improvement (1.55 years), and Louisiana had the smallest improvement (0.40 years), while Kentucky actually had a slight decline (–0.52 years). For race-sex-specific groups, the District of Columbia had e65 higher than all of the states for white persons (18.88 and 22.79 years for males and females, respectively). Of the states, the highest e65 are 18.68 (Hawaii), 21.82 (Florida), 16.37 (Connecticut), and 20.18 (Massachusetts) years for white males, white females, black males, and black females, respectively. The lowest e65
are 15.35 (Mississippi), 18.34 (Kentucky), 12.63 (Louisiana), and 16.20 (Arkansas) years for white males, white females, black males, and black females, respectively.
6 National Vital Statistics Reports, Vol. 60, No. 9, September 14, 2012
Table B. Change in life expectancy at birth from 1989–1991 to 1999–2001: United States, each state, and the District of Columbia
Total White Black
Both Both Both Rank State sexes Male Female sexes Male Female sexes Male Female
1 District of Columbia . . . . . . . . . . . . 5.10 6.60 3.36 5.45 7.58 3.25 5.17 7.06 2.85 2 New York . . . . . . . . . . . . . . . . . . 3.52 4.27 2.84 3.05 3.77 2.46 4.91 6.27 3.49 3 California . . . . . . . . . . . . . . . . . . 2.94 3.49 2.44 2.79 3.50 2.10 3.58 4.54 2.60 4 Delaware . . . . . . . . . . . . . . . . . . 2.28 2.61 2.04 2.04 2.30 1.93 3.43 4.76 2.30 5 Florida . . . . . . . . . . . . . . . . . . . 2.26 2.87 1.80 1.97 2.45 1.68 3.45 4.72 2.25 6 Illinois . . . . . . . . . . . . . . . . . . . . 2.16 2.57 1.95 1.89 2.50 1.45 3.16 4.40 1.81 7 New Jersey . . . . . . . . . . . . . . . . 2.16 2.61 1.83 2.13 2.45 1.98 3.83 4.98 2.66 8 Rhode Island. . . . . . . . . . . . . . . . 2.11 2.83 1.65 2.05 2.75 1.63 * * * 9 New Hampshire . . . . . . . . . . . . . . 2.07 2.72 1.63 2.20 2.98 1.56 * * *
10 Arizona . . . . . . . . . . . . . . . . . . . 2.05 2.59 1.58 2.07 2.47 1.80 3.19 3.75 2.80 11 Massachusetts . . . . . . . . . . . . . . . 2.04 2.47 1.88 2.11 2.81 1.68 3.91 4.97 2.83 12 Hawaii. . . . . . . . . . . . . . . . . . . . 2.02 1.80 2.39 2.72 3.28 2.22 * * * 13 Connecticut. . . . . . . . . . . . . . . . . 1.99 2.51 1.66 1.92 2.48 1.55 3.97 5.69 2.27 14 Texas . . . . . . . . . . . . . . . . . . . . 1.90 2.71 1.18 1.76 2.66 0.93 2.27 3.82 0.53 15 Nevada . . . . . . . . . . . . . . . . . . . 1.87 2.38 1.48 1.59 2.23 0.98 * * * 16 Michigan . . . . . . . . . . . . . . . . . . 1.86 2.27 1.59 1.74 2.20 1.45 3.13 3.70 2.77 17 Washington. . . . . . . . . . . . . . . . . 1.82 2.34 1.40 1.59 2.13 1.17 2.95 3.99 1.53 18 Alaska. . . . . . . . . . . . . . . . . . . . 1.80 2.58 0.81 1.78 2.63 0.70 * * * 19 North Carolina . . . . . . . . . . . . . . . 1.79 2.47 1.29 1.38 2.06 0.90 2.07 1.95 2.44 20 Colorado . . . . . . . . . . . . . . . . . . 1.76 2.50 1.15 1.67 2.35 1.18 1.72 2.75 0.70 21 Virginia . . . . . . . . . . . . . . . . . . . 1.73 2.71 0.78 1.83 2.58 1.21 2.74 3.62 1.83 22 Vermont. . . . . . . . . . . . . . . . . . . 1.70 2.89 0.61 2.07 3.05 1.25 * * * 23 Wisconsin. . . . . . . . . . . . . . . . . . 1.69 2.00 1.61 1.75 2.13 1.60 0.55 1.99 –0.93 24 Georgia . . . . . . . . . . . . . . . . . . . 1.66 2.63 0.76 1.44 2.42 0.59 3.57 4.31 2.82 25 Oregon . . . . . . . . . . . . . . . . . . . 1.65 2.61 0.70 1.45 2.44 0.47 * * * 26 Pennsylvania . . . . . . . . . . . . . . . . 1.64 2.18 1.24 1.72 2.22 1.37 3.05 3.93 2.32 27 Maryland . . . . . . . . . . . . . . . . . . 1.57 2.24 0.95 1.83 2.38 1.43 2.51 3.42 1.47 28 South Carolina . . . . . . . . . . . . . . . 1.53 2.09 1.15 1.37 2.14 0.80 2.63 3.27 2.06 29 New Mexico . . . . . . . . . . . . . . . . 1.52 2.32 0.73 1.81 2.53 1.16 * * * 30 Montana . . . . . . . . . . . . . . . . . . 1.51 2.13 1.07 1.22 1.48 1.32 * * * 31 Minnesota . . . . . . . . . . . . . . . . . 1.50 2.21 0.95 1.78 2.25 1.59 * * * 32 Iowa . . . . . . . . . . . . . . . . . . . . . 1.47 2.22 0.85 1.39 2.21 0.73 * * *
United States . . . . . . . . . . . . . . . 1.46 2.27 0.64 1.28 2.02 0.52 2.58 3.61 1.39 33 Nebraska . . . . . . . . . . . . . . . . . . 1.45 2.43 0.61 1.42 2.30 0.70 * * * 34 North Dakota. . . . . . . . . . . . . . . . 1.44 1.61 1.62 1.54 1.91 1.35 * * * 35 South Dakota . . . . . . . . . . . . . . . 1.43 2.02 1.02 1.42 2.05 1.02 * * * 36 Idaho . . . . . . . . . . . . . . . . . . . . 1.41 2.30 0.57 1.55 2.56 0.60 * * * 37 Missouri. . . . . . . . . . . . . . . . . . . 1.27 2.05 0.64 1.06 1.86 0.45 2.13 3.35 0.98 38 Louisiana . . . . . . . . . . . . . . . . . . 1.23 2.02 0.51 1.51 2.32 0.87 2.15 2.61 2.14 39 Utah . . . . . . . . . . . . . . . . . . . . . 1.19 1.91 0.57 1.16 1.95 0.49 * * * 40 Ohio . . . . . . . . . . . . . . . . . . . . . 1.17 1.95 0.50 1.38 1.88 1.06 1.71 2.80 0.62 41 Alabama . . . . . . . . . . . . . . . . . . 1.16 1.73 0.73 0.95 1.73 0.29 1.59 2.05 1.18 42 Maine . . . . . . . . . . . . . . . . . . . . 1.11 2.25 0.02 1.88 2.61 1.27 * * * 43 Arkansas . . . . . . . . . . . . . . . . . . 1.10 1.51 0.86 1.08 1.63 0.70 1.66 3.27 0.00 44 Indiana . . . . . . . . . . . . . . . . . . . 1.08 1.56 0.83 1.15 1.80 0.66 2.18 1.60 2.99 45 Kansas . . . . . . . . . . . . . . . . . . . 1.02 1.44 0.89 1.12 1.74 0.75 0.48 0.99 –0.02 46 West Virginia . . . . . . . . . . . . . . . . 1.02 2.22 –0.09 1.14 2.09 0.34 1.59 4.87 –1.71 47 Tennessee . . . . . . . . . . . . . . . . . 0.97 1.60 0.48 0.95 1.93 0.18 1.71 2.45 0.92 48 Mississippi . . . . . . . . . . . . . . . . . 0.85 1.40 0.52 0.82 1.51 0.31 0.97 2.06 –0.14 49 Kentucky . . . . . . . . . . . . . . . . . . 0.83 1.53 0.23 0.94 1.72 0.18 1.55 2.95 0.33 50 Oklahoma. . . . . . . . . . . . . . . . . . 0.51 1.12 0.10 0.61 1.24 0.16 0.89 1.87 –0.14 51 Wyoming . . . . . . . . . . . . . . . . . . 0.43 1.67 –0.74 1.40 2.06 0.95 * * *
* Figure does not meet standards of reliability or precision; see ‘‘Technical Notes.’’

7 National Vital Statistics Reports, Vol. 60, No. 9, September 14, 2012
WA
OR
CA
NV
ID
MT
WY
UT CO
AZ NM
AK
TX
OK
KS
NE
SD
ND MN
IA
MO
AR
LA
MS
TN
KY
IN
WI MI
OH
NY
ME
IL
AL GA
FL
SC
NC
VAWV
PA
HI
MD DE NJ
RI
MA
DC
Years Q1 3.72–5.04 Q2 5.05–6.38 Q3 6.39–7.70 Q4 7.71–9.03
CT
NH
VT
NOTES: Life expectancies reflect female life expectancy minus male life expectancy. Q1–Q4 represent quartiles of the total data range. SOURCE: CDC/NCHS, National Vital Statistics System. United States: 5.35
Figure 2. Sex differences in life expectancy at birth: United States, each state, and District of Columbia, 1999–2001
WA
OR
CA
NV
ID
MT
WY
UT CO
AZ NM
AK
TX
OK
KS
NE
SD
ND MN
IA
MO
AR
LA
MS
TN
KY
IN
WI MI
OH
NY
ME
IL
AL GA
FL
SC
NC
VAWV
PA
HI
MD DE NJ
RI
MA
DC
Years Q1 0.26–3.17 Q2 3.18–6.09 Q3 6.10–9.01 Q4 9.02–11.93 Insufficient data
NOTES: Life expectancies reflect white persons’ life expectancy minus black persons’ life expectancy. Q1–Q4 represent quartiles of the total data range. SOURCE: CDC/NCHS, National Vital Statistics System.
CT
NH
VT
United States: 5.67
Figure 3. Racial differences in life expectancy at birth: United States, each state, and District of Columbia, 1999–2001

8 National Vital Statistics Reports, Vol. 60, No. 9, September 14, 2012
Table C. Life expectancy at age 65, by race and sex: United States, each state, and the District of Columbia, 1999–2001
All races White Black
Rank State Total Male Female Total Male Female Total Male Female
1 Hawaii. . . . . . . . . . . . . . . . . . . . 20.42 18.17 22.87 20.15 18.68 21.76 * * * 2 Florida . . . . . . . . . . . . . . . . . . . 19.54 17.58 21.52 19.80 17.80 21.82 16.20 13.86 18.52 3 Arizona . . . . . . . . . . . . . . . . . . . 19.48 17.95 20.95 19.53 17.88 21.15 17.56 15.39 19.84 4 South Dakota . . . . . . . . . . . . . . . 19.33 17.34 21.35 19.43 17.42 21.48 * * * 5 North Dakota. . . . . . . . . . . . . . . . 19.24 16.95 21.78 19.42 17.44 21.50 * * * 6 Colorado . . . . . . . . . . . . . . . . . . 19.09 17.59 20.48 19.10 17.58 20.50 16.90 15.63 18.02 7 Connecticut. . . . . . . . . . . . . . . . . 19.08 17.26 20.74 19.30 17.64 20.77 18.10 16.37 19.49 8 California . . . . . . . . . . . . . . . . . . 19.08 17.27 20.80 19.07 17.45 20.57 16.70 14.52 18.88 9 Minnesota . . . . . . . . . . . . . . . . . 19.03 17.49 20.46 19.40 17.49 21.31 16.51 15.34 17.52
10 Utah . . . . . . . . . . . . . . . . . . . . . 19.03 18.01 19.96 18.97 17.99 19.87 * * * 11 Rhode Island. . . . . . . . . . . . . . . . 19.02 17.03 20.84 18.95 17.01 20.70 17.55 15.87 19.01 12 Wisconsin. . . . . . . . . . . . . . . . . . 18.87 16.91 20.80 18.99 17.10 20.82 15.81 14.22 17.15 13 Washington. . . . . . . . . . . . . . . . . 18.80 17.28 20.23 18.66 17.22 19.99 16.60 15.03 18.17 14 Iowa . . . . . . . . . . . . . . . . . . . . . 18.80 17.11 20.34 18.80 17.13 20.33 15.76 14.42 16.97 15 New York . . . . . . . . . . . . . . . . . . 18.74 16.69 20.60 18.98 17.07 20.70 17.24 14.72 19.21 16 Montana . . . . . . . . . . . . . . . . . . 18.65 17.05 20.29 18.22 16.36 20.37 * * * 17 Massachusetts . . . . . . . . . . . . . . . 18.65 16.57 20.59 18.80 16.88 20.52 18.45 16.30 20.18 18 Idaho . . . . . . . . . . . . . . . . . . . . 18.63 17.36 19.82 18.63 17.34 19.86 * * * 19 Nebraska . . . . . . . . . . . . . . . . . . 18.61 17.13 19.96 18.68 17.18 20.05 15.50 13.80 17.06 20 New Mexico . . . . . . . . . . . . . . . . 18.56 17.46 19.60 19.05 17.85 20.18 16.23 15.04 17.50 21 Kansas . . . . . . . . . . . . . . . . . . . 18.46 16.42 20.52 18.78 16.92 20.58 15.98 14.12 17.65 22 New Hampshire . . . . . . . . . . . . . . 18.42 16.77 19.99 18.70 17.25 20.02 * * * 23 Oregon . . . . . . . . . . . . . . . . . . . 18.40 17.16 19.51 18.35 17.14 19.43 16.97 14.79 19.49 24 Delaware . . . . . . . . . . . . . . . . . . 18.27 16.60 19.83 18.41 16.81 19.90 16.19 14.12 18.17 25 Vermont. . . . . . . . . . . . . . . . . . . 18.17 16.96 19.23 18.52 16.95 19.99 * * * 26 New Jersey . . . . . . . . . . . . . . . . 18.10 16.19 19.81 18.66 16.79 20.34 16.38 14.20 18.30 27 Illinois . . . . . . . . . . . . . . . . . . . . 18.05 15.95 20.05 18.40 16.61 20.01 15.70 13.66 17.44 28 Texas . . . . . . . . . . . . . . . . . . . . 18.02 16.17 19.79 18.34 16.65 19.90 15.50 13.88 16.84 29 Michigan . . . . . . . . . . . . . . . . . . 18.01 16.17 19.74 18.34 16.67 19.86 16.94 14.84 18.82 30 Missouri. . . . . . . . . . . . . . . . . . . 17.98 16.17 19.66 18.09 16.30 19.76 15.48 13.51 17.15 31 Alaska. . . . . . . . . . . . . . . . . . . . 17.97 16.62 19.38 18.02 16.76 19.35 * * * 32 North Carolina . . . . . . . . . . . . . . . 17.95 15.82 19.94 18.11 16.23 19.86 16.47 13.60 19.03 33 Pennsylvania . . . . . . . . . . . . . . . . 17.93 16.09 19.56 18.41 16.66 19.93 15.88 13.42 18.12
United States . . . . . . . . . . . . . . . 17.77 16.11 19.12 17.88 16.22 19.23 16.14 14.12 17.65 34 Maryland . . . . . . . . . . . . . . . . . . 17.66 16.13 18.97 18.41 16.86 19.78 16.91 15.36 18.19 35 Indiana . . . . . . . . . . . . . . . . . . . 17.64 15.69 19.48 17.89 16.14 19.47 15.85 13.54 18.08 36 Wyoming . . . . . . . . . . . . . . . . . . 17.62 16.55 18.68 18.54 16.96 20.20 * * * 37 Virginia . . . . . . . . . . . . . . . . . . . 17.53 16.09 18.76 18.30 16.62 19.81 15.95 13.71 18.07 38 Arkansas . . . . . . . . . . . . . . . . . . 17.50 15.41 19.57 17.85 15.91 19.73 14.91 13.24 16.20 39 Nevada . . . . . . . . . . . . . . . . . . . 17.49 15.78 19.45 17.32 15.84 18.94 16.30 15.21 17.35 40 Oklahoma. . . . . . . . . . . . . . . . . . 17.48 15.65 19.25 17.64 15.92 19.29 15.27 13.93 16.37 41 Maine . . . . . . . . . . . . . . . . . . . . 17.41 16.20 18.48 18.39 16.72 19.95 * * * 42 Ohio . . . . . . . . . . . . . . . . . . . . . 17.37 15.90 18.63 17.92 16.18 19.49 15.92 14.43 17.17 43 South Carolina . . . . . . . . . . . . . . . 17.25 15.14 19.23 17.83 16.02 19.51 15.80 13.32 17.97 44 Tennessee . . . . . . . . . . . . . . . . . 17.24 15.14 19.21 17.66 15.67 19.50 15.34 13.27 17.03 45 District of Columbia . . . . . . . . . . . . 17.21 14.52 19.72 20.81 18.88 22.79 15.84 13.58 17.65 46 Alabama . . . . . . . . . . . . . . . . . . 17.20 14.99 19.26 17.64 15.70 19.43 16.29 14.06 18.14 47 Georgia . . . . . . . . . . . . . . . . . . . 16.88 15.06 18.46 17.63 15.79 19.28 16.06 13.42 18.29 48 Mississippi . . . . . . . . . . . . . . . . . 16.86 14.50 19.17 17.48 15.35 19.50 15.63 14.35 16.53 49 West Virginia . . . . . . . . . . . . . . . . 16.80 15.48 17.94 17.04 15.37 18.54 15.84 14.30 17.01 50 Louisiana . . . . . . . . . . . . . . . . . . 16.74 14.96 18.32 17.85 16.03 19.52 15.38 12.63 18.20 51 Kentucky . . . . . . . . . . . . . . . . . . 16.61 14.77 18.29 16.97 15.39 18.34 15.43 13.29 17.40
* Figure does not meet standards of reliability or precision; see ‘‘Technical Notes.’’

9 National Vital Statistics Reports, Vol. 60, No. 9, September 14, 2012
0
16
17
18
19
20
21
1No change in value. SOURCE: CDC/NCHS, National Vital Statistics System.
Life
exp
ecta
ncy
at a
ge 6
5 (y
ears
)
Ken
tuck
yLo
uisi
ana
Wes
t Virg
inia
Mis
siss
ippi
Geo
rgia
Ala
bam
aD
istri
ct o
f Col
umbi
aTe
nnes
see
Sou
th C
arol
ina
Ohi
oM
aine
Okl
ahom
aN
evad
aA
rkan
sas
Virg
inia
Wyo
min
gIn
dian
aM
aryl
and
Uni
ted
Stat
esP
enns
ylva
nia
Nor
th C
arol
ina
Ala
ska
Mis
sour
iM
ichi
gan
Texa
sIll
inoi
sN
ew J
erse
yVe
rmon
tD
elaw
are
Ore
gon
New
Ham
pshi
reK
ansa
sN
ew M
exic
oN
ebra
ska
Idah
oM
assa
chus
etts
Mon
tana
New
Yor
kIo
wa
Was
hing
ton
Wis
cons
inR
hode
Isla
ndU
tah
Min
neso
taC
alifo
rnia
Con
nect
icut
Col
orad
oN
orth
Dak
ota
Sou
th D
akot
aA
rizon
aFl
orid
aH
awai
i
1999–2001
1989–1991
1
Figure 4. Life expectancy at age 65 for total population for two decennials, by state: United States, 1999–2001 and 1989–1991
References
1. Arias E, Curtin LR, Wei R, Anderson RN. U.S. decennial life tables for 1999–2001: United States life tables. National vital statistics reports; vol 57 no 1. Hyattsville, MD: National Center for Health Statistics. 2008. Available from: http://www.cdc.gov/nchs/data/nvsr/nvsr57/nvsr57_01.pdf.
2. Wei R, Curtin LR, Arias E, Anderson RN. U.S. decennial life tables for 1999–2001: Methodology of the United States life tables. National vital statistics reports; vol 57 no 4. Hyattsville, MD: National Center for Health Statistics. 2008. Available from: http://www.cdc.gov/nchs/ data/nvsr/nvsr57/nvsr57_04.pdf.
3. Greville TNE. United States life tables and actuarial tables, 1939–1941. Washington, DC: U.S. Government Printing Office. 1947.
4. Heligman P, Pollard JH. The age pattern of mortality. Inst Actuar 107(1):49–80. 1980.
5. Curtin LR, Gonzalez JF. Smoothing procedures for life tables based on small numbers of deaths. Proceedings of the American Statistical Association, Section on Social Statistics, 415–20. 1986.
6. Voulgaraki A, Wei R, Kedem B. An approach to handle the problem of zero deaths in estimating mortality rates. Proceedings of the American Statistical Association, Section on Statistics in Epidemiology, 1914–21. 2008.
7. Wei R, Voulgaraki A. Statistical methods for estimating mortality rates for ages with zero observed deaths. Proceedings of the American Statistical Association, Section on Statistics in Epidemiology, 1452–9. 2008.
8. Armstrong RH. Methodology of the national and state life tables. U.S. decennial life tables for 1989–91; vol 1 no 2. Hyattsville, MD: National Center for Health Statistics. 1998.
9. Wei R, Curtin LR, Anderson RN. Model U.S. mortality data for building life tables and further studies. Proceedings of the American Statistical Association, Section on Biometrics, 4458–64. 2004.
10. Curtin LR. Reliability considerations for state decennial life tables. Proceedings of the American Statistical Association, Section on Social Statistics, 161–6. 1983.
11. Chiang CL. Introduction to stochastic processes in biostatistics. New York: John Wiley and Sons. 1968.
List of Detailed Tables 1. Survivorship, by age, race, and sex: United States, 50 states,
and District of Columbia, 1999–2001 . . . . . . . . . . . . . . . . . . 10
2. Life expectancy, by age, race, and sex: United States, 50 states, and District of Columbia, 1999–2001 . . . . . . . . . . . . . . . . . . 31

10 National Vital Statistics Reports, Vol. 60, No. 9, September 14, 2012
Table 1. Survivorship, by age, race, and sex: United States, 50 states, and District of Columbia, 1999–2001
All races White Black
State and age (years) Total Males Females Total Males Females Total Males Females
United States
0. . . . . . . . . . . . . . . . . . . 5. . . . . . . . . . . . . . . . . . . 10 . . . . . . . . . . . . . . . . . . 15 . . . . . . . . . . . . . . . . . . 20 . . . . . . . . . . . . . . . . . . 25 . . . . . . . . . . . . . . . . . . 30 . . . . . . . . . . . . . . . . . . 35 . . . . . . . . . . . . . . . . . . 40 . . . . . . . . . . . . . . . . . . 45 . . . . . . . . . . . . . . . . . . 50 . . . . . . . . . . . . . . . . . . 55 . . . . . . . . . . . . . . . . . . 60 . . . . . . . . . . . . . . . . . . 65 . . . . . . . . . . . . . . . . . . 70 . . . . . . . . . . . . . . . . . . 75 . . . . . . . . . . . . . . . . . . 80 . . . . . . . . . . . . . . . . . . 85 . . . . . . . . . . . . . . . . . . 90 . . . . . . . . . . . . . . . . . . 95 . . . . . . . . . . . . . . . . . . 100 . . . . . . . . . . . . . . . . . 105 . . . . . . . . . . . . . . . . .
Alabama
0. . . . . . . . . . . . . . . . . . . 5. . . . . . . . . . . . . . . . . . . 10 . . . . . . . . . . . . . . . . . . 15 . . . . . . . . . . . . . . . . . . 20 . . . . . . . . . . . . . . . . . . 25 . . . . . . . . . . . . . . . . . . 30 . . . . . . . . . . . . . . . . . . 35 . . . . . . . . . . . . . . . . . . 40 . . . . . . . . . . . . . . . . . . 45 . . . . . . . . . . . . . . . . . . 50 . . . . . . . . . . . . . . . . . . 55 . . . . . . . . . . . . . . . . . . 60 . . . . . . . . . . . . . . . . . . 65 . . . . . . . . . . . . . . . . . . 70 . . . . . . . . . . . . . . . . . . 75 . . . . . . . . . . . . . . . . . . 80 . . . . . . . . . . . . . . . . . . 85 . . . . . . . . . . . . . . . . . . 90 . . . . . . . . . . . . . . . . . . 95 . . . . . . . . . . . . . . . . . . 100 . . . . . . . . . . . . . . . . . 105 . . . . . . . . . . . . . . . . .
Alaska
0. . . . . . . . . . . . . . . . . . . 5. . . . . . . . . . . . . . . . . . . 10 . . . . . . . . . . . . . . . . . . 15 . . . . . . . . . . . . . . . . . . 20 . . . . . . . . . . . . . . . . . . 25 . . . . . . . . . . . . . . . . . . 30 . . . . . . . . . . . . . . . . . . 35 . . . . . . . . . . . . . . . . . . 40 . . . . . . . . . . . . . . . . . . 45 . . . . . . . . . . . . . . . . . . 50 . . . . . . . . . . . . . . . . . . 55 . . . . . . . . . . . . . . . . . .
See footnotes at end of table.
100,000 99,176 99,097 98,998 98,664 98,202 97,750 97,199 96,419 95,268 93,591 91,211 87,595 82,224 74,794 64,561 50,819 34,471 18,472
6,871 1,477
144
100,000 98,909 98,800 98,659 98,187 97,529 96,880 96,143 95,154 93,732 91,656 88,616 84,229 78,013 69,486 58,426 45,126 30,531 16,963
7,067 1,950
303
100,000 99,058 98,974 98,833 98,324 97,591 96,858 96,170 95,421 94,428 92,955 90,692
100,000 99,095 99,008 98,890 98,426 97,746 97,112 96,382 95,384 93,931 91,800 88,862 84,478 78,083 69,350 57,572 42,683 26,473 12,447
3,847 643
46
100,000 98,704 98,584 98,415 97,751 96,786 95,904 95,006 93,810 92,057 89,463 85,660 80,194 72,563 62,368 49,624 35,187 21,042
9,815 3,208
638 65
100,000 98,950 98,842 98,643 97,936 96,945 95,923 94,982 94,008 92,787 91,042 88,422
100,000 99,261 99,190 99,111 98,915 98,682 98,418 98,052 97,492 96,645 95,420 93,597 90,739 86,367 80,158 71,257 58,411 41,798 23,918
9,553 2,181
217
100,000 99,054 98,957 98,846 98,571 98,218 97,801 97,225 96,440 95,344 93,778 91,505 88,188 83,369 76,492 67,009 54,664 39,984 24,789 12,003
4,046 814
100,000 99,153 99,094 99,016 98,727 98,292 97,872 97,464 96,957 96,210 95,049 93,229
100,000 99,312 99,239 99,146 98,826 98,405 98,000 97,504 96,796 95,755 94,233 92,032 88,614 83,423 76,132 65,946 52,100 35,421 18,943
6,963 1,453
134
100,000 99,205 99,114 98,972 98,475 97,922 97,404 96,787 95,942 94,673 92,773 89,949 85,823 79,920 71,776 61,007 47,762 32,864 18,632
7,938 2,239
354
100,000 99,407 99,343 99,232 98,846 98,349 97,860 97,295 96,613 95,682 94,287 92,132
100,000 99,243 99,163 99,052 98,615 98,002 97,434 96,772 95,855 94,522 92,573 89,854 85,710 79,515 70,912 59,139 44,043 27,376 12,817
3,892 624
41
100,000 99,044 98,938 98,762 98,089 97,299 96,607 95,822 94,762 93,183 90,827 87,350 82,308 75,191 65,540 53,225 38,873 24,251 12,005
4,258 945 111
100,000 99,338 99,257 99,113 98,587 97,896 97,185 96,386 95,501 94,376 92,750 90,285
100,000 99,385 99,319 99,245 99,049 98,835 98,601 98,282 97,789 97,047 95,958 94,284 91,591 87,391 81,346 72,546 59,681 42,820 24,475
9,673 2,145
201
100,000 99,324 99,248 99,143 98,833 98,526 98,190 97,749 97,127 96,179 94,746 92,592 89,388 84,700 78,068 68,739 56,341 41,336 25,599 12,277
4,037 772
100,000 99,465 99,418 99,342 99,116 98,845 98,602 98,299 97,841 97,123 95,998 94,245
100,000 98,382 98,271 98,139 97,701 96,944 96,140 95,160 93,801 91,754 88,726 84,588 78,869 71,448 62,126 50,804 37,828 24,589 13,157
5,349 1,485
246
100,000 98,285 98,141 98,000 97,559 96,661 95,734 94,546 92,814 90,285 86,824 82,268 76,362 68,876 59,654 48,780 36,693 24,355 13,461
5,707 1,661
288
* * * * * * * * * * * *
100,000 98,219 98,093 97,930 97,274 96,099 94,934 93,631 91,930 89,411 85,596 80,417 73,369 64,588 53,926 41,441 28,326 16,433
7,579 2,549
560 70
100,000 97,955 97,804 97,645 96,967 95,570 94,218 92,547 90,126 86,709 82,230 76,499 69,338 60,619 50,345 38,796 26,737 15,557
6,992 2,124
360 27
* * * * * * * * * * * *
100,000 98,550 98,455 98,354 98,141 97,784 97,313 96,630 95,585 93,970 91,661 88,478 83,963 77,781 69,634 59,239 46,358 31,987 18,309
7,972 2,346
400
100,000 98,488 98,351 98,230 98,020 97,565 97,008 96,232 95,090 93,346 90,832 87,429 82,742 76,422 68,157 57,812 45,649 32,558 20,118 10,175
3,905 1,032
* * * * * * * * * * * *

National Vital Statistics Reports, Vol. 60, No. 9, September 14, 2012 11
Table 1. Survivorship, by age, race, and sex: United States, 50 states, and District of Columbia, 1999–2001—Con.
All races White Black
State and age (years) Total Males Females Total Males Females Total Males Females
Alaska—Con.
60 . . . . . . . . . . . . . . . . . . 87,236 84,464 90,398 88,827 86,516 91,537 * * * 65 . . . . . . . . . . . . . . . . . . 82,041 78,582 86,056 83,826 80,834 87,414 * * * 70 . . . . . . . . . . . . . . . . . . 74,551 70,126 79,648 76,638 72,568 81,512 * * * 75 . . . . . . . . . . . . . . . . . . 64,102 58,621 70,370 66,334 61,055 72,608 * * * 80 . . . . . . . . . . . . . . . . . . 50,675 44,259 57,709 52,655 46,330 59,777 * * * 85 . . . . . . . . . . . . . . . . . . 34,989 28,553 42,063 36,137 29,892 43,131 * * * 90 . . . . . . . . . . . . . . . . . . 19,610 14,499 25,493 19,654 15,003 25,031 * * * 95 . . . . . . . . . . . . . . . . . . 8,014 5,152 11,632 7,426 5,148 10,222 * * * 100 . . . . . . . . . . . . . . . . . 2,055 1,090 3,465 1,614 1,011 2,412 * * * 105 . . . . . . . . . . . . . . . . . 271 112 556 157 90 251 * * *
Arizona
0. . . . . . . . . . . . . . . . . . . 100,000 100,000 100,000 100,000 100,000 100,000 100,000 100,000 100,000 5. . . . . . . . . . . . . . . . . . . 99,232 99,068 99,357 99,247 99,159 99,319 98,043 98,170 97,958 10 . . . . . . . . . . . . . . . . . . 99,143 98,962 99,286 99,162 99,063 99,246 97,940 98,052 97,871 15 . . . . . . . . . . . . . . . . . . 99,025 98,821 99,193 99,059 98,934 99,171 97,845 97,924 97,812 20 . . . . . . . . . . . . . . . . . . 98,626 98,250 98,980 98,696 98,425 98,967 97,387 97,268 97,574 25 . . . . . . . . . . . . . . . . . . 98,092 97,456 98,740 98,213 97,696 98,760 96,720 96,375 97,177 30 . . . . . . . . . . . . . . . . . . 97,560 96,681 98,477 97,722 96,995 98,503 96,074 95,457 96,859 35 . . . . . . . . . . . . . . . . . . 96,961 95,881 98,102 97,145 96,226 98,140 95,256 94,378 96,357 40 . . . . . . . . . . . . . . . . . . 96,155 94,845 97,540 96,379 95,234 97,613 94,131 92,997 95,546 45 . . . . . . . . . . . . . . . . . . 94,991 93,371 96,697 95,279 93,808 96,855 92,551 91,102 94,341 50 . . . . . . . . . . . . . . . . . . 93,292 91,238 95,436 93,676 91,725 95,735 90,267 88,363 92,590 55 . . . . . . . . . . . . . . . . . . 90,822 88,171 93,561 91,327 88,707 94,055 86,970 84,439 90,063 60 . . . . . . . . . . . . . . . . . . 87,279 83,819 90,797 87,919 84,396 91,522 82,394 78,922 86,452 65 . . . . . . . . . . . . . . . . . . 82,247 77,772 86,775 83,001 78,368 87,715 76,040 71,382 81,376 70 . . . . . . . . . . . . . . . . . . 75,211 69,627 80,904 76,057 70,195 82,081 67,555 61,502 74,415 75 . . . . . . . . . . . . . . . . . . 65,775 59,145 72,567 66,675 59,615 73,980 56,926 49,331 65,211 80 . . . . . . . . . . . . . . . . . . 53,871 46,522 61,341 54,732 46,813 62,878 44,385 35,633 53,680 85 . . . . . . . . . . . . . . . . . . 39,927 32,721 47,352 40,597 32,780 48,780 30,813 22,104 40,330 90 . . . . . . . . . . . . . . . . . . 25,519 19,585 31,845 25,872 19,440 32,875 18,093 11,019 26,539 95 . . . . . . . . . . . . . . . . . . 13,129 9,315 17,412 13,172 9,088 17,883 8,375 4,033 14,437 100 . . . . . . . . . . . . . . . . . 4,940 3,209 7,014 4,838 3,039 7,061 2,782 962 5,998 105 . . . . . . . . . . . . . . . . . 1,196 710 1,819 1,117 641 1,748 588 129 1,713
Arkansas
0. . . . . . . . . . . . . . . . . . . 100,000 100,000 100,000 100,000 100,000 100,000 100,000 100,000 100,000 5. . . . . . . . . . . . . . . . . . . 99,025 98,760 99,220 99,237 99,205 99,274 98,379 98,238 98,466 10 . . . . . . . . . . . . . . . . . . 98,920 98,636 99,136 99,138 99,091 99,193 98,250 98,078 98,369 15 . . . . . . . . . . . . . . . . . . 98,771 98,462 99,015 98,991 98,915 99,076 98,089 97,889 98,238 20 . . . . . . . . . . . . . . . . . . 98,323 97,841 98,751 98,536 98,281 98,812 97,656 97,304 97,958 25 . . . . . . . . . . . . . . . . . . 97,706 96,966 98,400 97,981 97,514 98,480 96,806 96,001 97,524 30 . . . . . . . . . . . . . . . . . . 97,064 96,072 98,019 97,463 96,813 98,158 95,725 94,463 96,851 35 . . . . . . . . . . . . . . . . . . 96,369 95,157 97,551 96,793 95,925 97,717 94,625 93,035 96,035 40 . . . . . . . . . . . . . . . . . . 95,461 94,005 96,890 95,944 94,844 97,108 93,188 91,216 94,933 45 . . . . . . . . . . . . . . . . . . 94,145 92,363 95,905 94,706 93,270 96,218 91,211 88,746 93,393 50 . . . . . . . . . . . . . . . . . . 92,193 89,941 94,423 92,872 90,934 94,893 88,366 85,214 91,197 55 . . . . . . . . . . . . . . . . . . 89,293 86,377 92,201 90,148 87,496 92,897 84,276 80,221 88,010 60 . . . . . . . . . . . . . . . . . . 85,065 81,218 88,903 86,160 82,522 89,894 78,557 73,333 83,384 65 . . . . . . . . . . . . . . . . . . 79,015 73,950 84,089 80,406 75,512 85,428 70,747 64,182 76,777 70 . . . . . . . . . . . . . . . . . . 70,693 64,131 77,279 72,376 66,012 78,899 60,520 52,680 67,656 75 . . . . . . . . . . . . . . . . . . 59,794 51,675 67,912 61,709 53,874 69,703 48,074 39,352 55,745 80 . . . . . . . . . . . . . . . . . . 46,560 37,295 55,739 48,566 39,674 57,492 34,060 25,627 41,475 85 . . . . . . . . . . . . . . . . . . 31,914 22,853 41,257 33,744 25,088 42,668 20,376 13,693 26,465 90 . . . . . . . . . . . . . . . . . . 18,109 11,016 26,153 19,463 12,690 26,962 9,521 5,524 13,443 95 . . . . . . . . . . . . . . . . . . 7,803 3,760 13,179 8,537 4,654 13,380 3,124 1,506 4,896 100 . . . . . . . . . . . . . . . . . 2,271 790 4,757 2,524 1,086 4,652 625 241 1,111 105 . . . . . . . . . . . . . . . . . 383 86 1,070 430 137 971 64 19 131
See footnotes at end of table.

12 National Vital Statistics Reports, Vol. 60, No. 9, September 14, 2012
Table 1. Survivorship, by age, race, and sex: United States, 50 states, and District of Columbia, 1999–2001—Con.
All races White Black
State and age (years) Total Males Females Total Males Females Total Males Females
California
0. . . . . . . . . . . . . . . . . . . 100,000 100,000 100,000 100,000 100,000 100,000 100,000 100,000 100,000 5. . . . . . . . . . . . . . . . . . . 99,437 99,296 99,536 99,398 99,338 99,447 98,539 98,460 98,600 10 . . . . . . . . . . . . . . . . . . 99,374 99,224 99,480 99,332 99,268 99,385 98,439 98,353 98,507 15 . . . . . . . . . . . . . . . . . . 99,287 99,123 99,410 99,247 99,167 99,317 98,318 98,209 98,410 20 . . . . . . . . . . . . . . . . . . 99,011 98,732 99,259 98,973 98,778 99,167 97,873 97,527 98,218 25 . . . . . . . . . . . . . . . . . . 98,624 98,160 99,077 98,587 98,218 98,978 97,144 96,366 97,937 30 . . . . . . . . . . . . . . . . . . 98,250 97,632 98,869 98,228 97,711 98,783 96,398 95,293 97,516 35 . . . . . . . . . . . . . . . . . . 97,816 97,072 98,569 97,787 97,125 98,501 95,596 94,240 96,970 40 . . . . . . . . . . . . . . . . . . 97,192 96,294 98,107 97,144 96,306 98,048 94,454 92,877 96,050 45 . . . . . . . . . . . . . . . . . . 96,242 95,120 97,388 96,168 95,079 97,337 92,751 90,882 94,642 50 . . . . . . . . . . . . . . . . . . 94,789 93,331 96,273 94,682 93,225 96,228 90,258 87,969 92,559 55 . . . . . . . . . . . . . . . . . . 92,575 90,623 94,551 92,429 90,449 94,510 86,668 83,770 89,539 60 . . . . . . . . . . . . . . . . . . 89,242 86,582 91,916 89,058 86,347 91,869 81,594 77,846 85,254 65 . . . . . . . . . . . . . . . . . . 84,314 80,677 87,938 84,098 80,417 87,867 74,595 69,747 79,339 70 . . . . . . . . . . . . . . . . . . 77,224 72,331 82,042 76,987 72,116 81,912 65,388 59,181 71,447 75 . . . . . . . . . . . . . . . . . . 67,474 61,115 73,594 67,240 61,055 73,337 54,033 46,324 61,386 80 . . . . . . . . . . . . . . . . . . 54,846 47,164 62,106 54,652 47,375 61,637 40,986 32,196 49,328 85 . . . . . . . . . . . . . . . . . . 39,850 31,723 47,688 39,718 32,244 46,950 27,432 18,812 36,059 90 . . . . . . . . . . . . . . . . . . 24,425 17,363 31,680 24,362 18,059 30,728 15,366 8,561 23,078 95 . . . . . . . . . . . . . . . . . . 11,614 7,014 16,899 11,600 7,603 15,966 6,711 2,736 12,277 100 . . . . . . . . . . . . . . . . . 3,810 1,830 6,506 3,812 2,126 5,878 2,086 537 5,066 105 . . . . . . . . . . . . . . . . . 737 259 1,561 739 337 1,312 412 55 1,483
Colorado
0. . . . . . . . . . . . . . . . . . . 100,000 100,000 100,000 100,000 100,000 100,000 100,000 100,000 100,000 5. . . . . . . . . . . . . . . . . . . 99,354 99,189 99,465 99,312 99,232 99,372 98,481 98,107 98,709 10 . . . . . . . . . . . . . . . . . . 99,287 99,119 99,402 99,240 99,159 99,302 98,392 98,039 98,599 15 . . . . . . . . . . . . . . . . . . 99,174 98,996 99,300 99,137 99,044 99,212 98,191 97,794 98,444 20 . . . . . . . . . . . . . . . . . . 98,841 98,557 99,082 98,800 98,612 98,978 97,718 97,134 98,175 25 . . . . . . . . . . . . . . . . . . 98,411 97,960 98,844 98,390 98,031 98,765 97,084 96,292 97,788 30 . . . . . . . . . . . . . . . . . . 97,982 97,368 98,601 97,973 97,468 98,512 96,415 95,430 97,350 35 . . . . . . . . . . . . . . . . . . 97,513 96,764 98,281 97,488 96,846 98,178 95,687 94,536 96,837 40 . . . . . . . . . . . . . . . . . . 96,882 95,984 97,805 96,839 96,023 97,709 94,692 93,342 96,084 45 . . . . . . . . . . . . . . . . . . 95,944 94,846 97,074 95,908 94,841 97,040 93,264 91,673 94,954 50 . . . . . . . . . . . . . . . . . . 94,523 93,136 95,951 94,513 93,069 96,033 91,163 89,238 93,250 55 . . . . . . . . . . . . . . . . . . 92,371 90,569 94,235 92,402 90,428 94,482 88,071 85,687 90,691 60 . . . . . . . . . . . . . . . . . . 89,157 86,758 91,633 89,239 86,536 92,071 83,603 80,585 86,890 65 . . . . . . . . . . . . . . . . . . 84,430 81,212 87,740 84,545 80,916 88,336 77,268 73,444 81,356 70 . . . . . . . . . . . . . . . . . . 77,689 73,432 82,021 77,831 73,183 82,641 68,527 63,843 73,537 75 . . . . . . . . . . . . . . . . . . 68,186 62,692 73,625 68,345 62,510 74,230 57,273 51,699 62,987 80 . . . . . . . . . . . . . . . . . . 55,564 48,901 61,909 55,713 48,764 62,454 43,781 37,668 49,713 85 . . . . . . . . . . . . . . . . . . 40,204 33,163 46,918 40,303 33,044 47,342 29,198 23,479 34,680 90 . . . . . . . . . . . . . . . . . . 24,190 18,158 30,187 24,210 18,043 30,437 15,918 11,654 20,119 95 . . . . . . . . . . . . . . . . . . 10,982 7,209 15,066 10,944 7,119 15,148 6,473 4,173 8,898 100 . . . . . . . . . . . . . . . . . 3,277 1,788 5,116 3,236 1,744 5,109 1,735 945 2,662 105 . . . . . . . . . . . . . . . . . 534 228 987 518 218 972 261 115 460
Connecticut
0. . . . . . . . . . . . . . . . . . . 100,000 100,000 100,000 100,000 100,000 100,000 100,000 100,000 100,000 5. . . . . . . . . . . . . . . . . . . 99,305 99,232 99,358 99,402 99,335 99,451 98,789 99,196 98,561 10 . . . . . . . . . . . . . . . . . . 99,245 99,180 99,289 99,344 99,288 99,382 98,717 99,112 98,502 15 . . . . . . . . . . . . . . . . . . 99,174 99,091 99,236 99,277 99,204 99,331 98,604 98,967 98,421 20 . . . . . . . . . . . . . . . . . . 98,929 98,718 99,128 99,045 98,857 99,222 98,248 98,383 98,305 25 . . . . . . . . . . . . . . . . . . 98,533 98,122 98,939 98,671 98,308 99,031 97,667 97,434 98,084 30 . . . . . . . . . . . . . . . . . . 98,115 97,501 98,723 98,313 97,777 98,848 96,889 96,242 97,680 35 . . . . . . . . . . . . . . . . . . 97,659 96,890 98,419 97,892 97,212 98,568 95,949 94,947 97,054 40 . . . . . . . . . . . . . . . . . . 97,061 96,138 97,971 97,307 96,463 98,145 94,511 93,099 95,966 45 . . . . . . . . . . . . . . . . . . 96,180 95,048 97,296 96,458 95,393 97,516 92,566 90,634 94,495 50 . . . . . . . . . . . . . . . . . . 94,834 93,386 96,262 95,157 93,756 96,550 90,049 87,468 92,556 55 . . . . . . . . . . . . . . . . . . 92,772 90,842 94,666 93,162 91,258 95,048 86,759 83,341 89,970
See footnotes at end of table.

National Vital Statistics Reports, Vol. 60, No. 9, September 14, 2012 13
Table 1. Survivorship, by age, race, and sex: United States, 50 states, and District of Columbia, 1999–2001—Con.
All races White Black
State and age (years) Total Males Females Total Males Females Total Males Females
Connecticut—Con.
60 . . . . . . . . . . . . . . . . . . 89,617 86,989 92,200 90,107 87,490 92,705 82,350 77,928 86,421 65 . . . . . . . . . . . . . . . . . . 84,887 81,274 88,417 85,515 81,918 89,070 76,436 70,865 81,464 70 . . . . . . . . . . . . . . . . . . 77,975 73,067 82,715 78,783 73,933 83,516 68,579 61,843 74,586 75 . . . . . . . . . . . . . . . . . . 68,301 61,870 74,385 69,303 63,033 75,285 58,491 50,785 65,313 80 . . . . . . . . . . . . . . . . . . 55,612 47,747 62,826 56,755 49,224 63,699 46,324 38,136 53,471 85 . . . . . . . . . . . . . . . . . . 40,304 31,958 48,058 41,446 33,611 48,701 32,795 25,129 39,579 90 . . . . . . . . . . . . . . . . . . 24,414 17,236 31,485 25,343 18,735 31,714 19,695 13,705 25,227 95 . . . . . . . . . . . . . . . . . . 11,271 6,740 16,243 11,819 7,724 16,078 9,319 5,706 12,915 100 . . . . . . . . . . . . . . . . . 3,480 1,653 5,841 3,680 2,055 5,564 3,142 1,627 4,822 105 . . . . . . . . . . . . . . . . . 603 211 1,237 639 296 1,095 661 277 1,154
Delaware
0. . . . . . . . . . . . . . . . . . . 100,000 100,000 100,000 100,000 100,000 100,000 100,000 100,000 100,000 5. . . . . . . . . . . . . . . . . . . 99,093 98,806 99,289 99,334 99,137 99,474 98,639 99,115 98,349 10 . . . . . . . . . . . . . . . . . . 99,012 98,711 99,224 99,282 99,077 99,430 98,497 98,946 98,235 15 . . . . . . . . . . . . . . . . . . 98,889 98,584 99,105 99,194 99,003 99,327 98,352 98,849 98,040 20 . . . . . . . . . . . . . . . . . . 98,596 98,180 98,925 98,921 98,631 99,156 98,020 98,450 97,775 25 . . . . . . . . . . . . . . . . . . 98,169 97,546 98,704 98,514 98,008 98,966 97,450 97,674 97,391 30 . . . . . . . . . . . . . . . . . . 97,696 96,884 98,421 98,093 97,399 98,739 96,725 96,759 96,838 35 . . . . . . . . . . . . . . . . . . 97,134 96,161 98,019 97,602 96,750 98,411 95,769 95,613 96,045 40 . . . . . . . . . . . . . . . . . . 96,357 95,204 97,420 96,919 95,866 97,930 94,480 94,142 94,912 45 . . . . . . . . . . . . . . . . . . 95,206 93,806 96,514 95,883 94,549 97,182 92,637 92,024 93,303 50 . . . . . . . . . . . . . . . . . . 93,481 91,718 95,141 94,307 92,566 96,016 90,000 88,934 91,034 55 . . . . . . . . . . . . . . . . . . 90,900 88,614 93,072 91,919 89,601 94,203 86,232 84,485 87,866 60 . . . . . . . . . . . . . . . . . . 87,094 84,068 89,982 88,345 85,231 91,411 80,970 78,221 83,504 65 . . . . . . . . . . . . . . . . . . 81,583 77,565 85,439 83,093 78,937 87,174 73,786 69,688 77,613 70 . . . . . . . . . . . . . . . . . . 73,888 68,697 78,929 75,669 70,357 80,942 64,243 58,625 69,426 75 . . . . . . . . . . . . . . . . . . 63,550 57,108 69,800 65,465 58,924 71,949 52,485 45,295 58,974 80 . . . . . . . . . . . . . . . . . . 50,612 43,121 57,693 52,385 44,808 59,674 39,130 30,871 46,593 85 . . . . . . . . . . . . . . . . . . 35,746 28,190 42,990 37,016 29,420 44,391 25,521 17,522 33,189 90 . . . . . . . . . . . . . . . . . . 21,084 14,887 27,365 21,626 15,492 27,883 13,749 7,643 20,410 95 . . . . . . . . . . . . . . . . . . 9,529 5,761 13,754 9,492 5,890 13,517 5,666 2,299 10,211 100 . . . . . . . . . . . . . . . . . 2,930 1,433 4,884 2,737 1,402 4,446 1,616 415 3,839 105 . . . . . . . . . . . . . . . . . 524 194 1,054 434 174 832 282 38 979
District of Columbia
0. . . . . . . . . . . . . . . . . . . 100,000 100,000 100,000 100,000 100,000 100,000 100,000 100,000 100,000 5. . . . . . . . . . . . . . . . . . . 98,830 98,368 99,084 99,486 99,410 99,517 98,657 98,838 98,562 10 . . . . . . . . . . . . . . . . . . 98,707 98,193 99,015 99,339 99,254 99,379 98,546 98,710 98,468 15 . . . . . . . . . . . . . . . . . . 98,569 97,982 98,961 99,182 99,038 99,286 98,443 98,574 98,398 20 . . . . . . . . . . . . . . . . . . 98,009 96,961 98,825 99,046 98,844 99,200 97,566 96,969 98,200 25 . . . . . . . . . . . . . . . . . . 97,263 95,670 98,544 98,879 98,602 99,099 96,135 94,364 97,738 30 . . . . . . . . . . . . . . . . . . 96,508 94,623 98,067 98,647 98,282 98,959 94,735 91,968 97,187 35 . . . . . . . . . . . . . . . . . . 95,503 93,370 97,326 98,311 97,842 98,749 93,007 89,402 96,235 40 . . . . . . . . . . . . . . . . . . 94,061 91,612 96,234 97,811 97,213 98,422 90,850 86,352 94,956 45 . . . . . . . . . . . . . . . . . . 92,025 89,126 94,668 97,074 96,296 97,908 88,211 82,814 93,205 50 . . . . . . . . . . . . . . . . . . 89,187 85,643 92,462 95,975 94,944 97,095 84,861 78,560 90,718 55 . . . . . . . . . . . . . . . . . . 85,282 80,839 89,403 94,338 92,937 95,814 80,445 73,187 87,227 60 . . . . . . . . . . . . . . . . . . 79,987 74,363 85,225 91,851 89,966 93,808 74,624 66,313 82,399 65 . . . . . . . . . . . . . . . . . . 72,955 65,909 79,631 88,087 85,612 90,705 67,035 57,670 75,872 70 . . . . . . . . . . . . . . . . . . 63,979 55,378 72,217 82,291 78,871 85,984 57,563 47,267 67,325 75 . . . . . . . . . . . . . . . . . . 53,224 43,103 62,776 73,987 69,116 78,996 46,453 35,596 56,644 80 . . . . . . . . . . . . . . . . . . 41,062 30,088 51,398 62,650 55,987 69,079 34,284 23,781 44,153 85 . . . . . . . . . . . . . . . . . . 28,392 18,009 38,664 48,128 40,013 55,903 22,241 13,433 30,864 90 . . . . . . . . . . . . . . . . . . 16,833 8,694 25,816 31,748 23,483 40,097 12,039 6,015 18,492 95 . . . . . . . . . . . . . . . . . . 8,070 3,122 14,596 16,566 10,164 23,879 5,074 1,962 8,929 100 . . . . . . . . . . . . . . . . . 2,897 751 6,560 6,074 2,781 10,729 1,522 419 3,200 105 . . . . . . . . . . . . . . . . . 707 106 2,158 1,331 391 3,176 290 51 766
See footnotes at end of table.

14 National Vital Statistics Reports, Vol. 60, No. 9, September 14, 2012
Table 1. Survivorship, by age, race, and sex: United States, 50 states, and District of Columbia, 1999–2001—Con.
All races White Black
State and age (years) Total Males Females Total Males Females Total Males Females
Florida
0. . . . . . . . . . . . . . . . . . . 100,000 100,000 100,000 100,000 100,000 100,000 100,000 100,000 100,000 5. . . . . . . . . . . . . . . . . . . 99,128 99,040 99,203 99,315 99,240 99,382 98,465 98,325 98,563 10 . . . . . . . . . . . . . . . . . . 99,050 98,948 99,140 99,248 99,161 99,327 98,346 98,183 98,467 15 . . . . . . . . . . . . . . . . . . 98,946 98,821 99,059 99,150 99,045 99,249 98,212 98,013 98,371 20 . . . . . . . . . . . . . . . . . . 98,598 98,339 98,855 98,810 98,579 99,045 97,815 97,444 98,149 25 . . . . . . . . . . . . . . . . . . 98,066 97,567 98,576 98,314 97,854 98,797 97,103 96,414 97,739 30 . . . . . . . . . . . . . . . . . . 97,510 96,802 98,238 97,831 97,181 98,516 96,288 95,362 97,144 35 . . . . . . . . . . . . . . . . . . 96,900 96,012 97,814 97,280 96,451 98,156 95,210 94,052 96,283 40 . . . . . . . . . . . . . . . . . . 96,087 94,983 97,221 96,519 95,471 97,623 93,793 92,482 95,010 45 . . . . . . . . . . . . . . . . . . 94,914 93,508 96,352 95,417 94,071 96,828 91,836 90,330 93,233 50 . . . . . . . . . . . . . . . . . . 93,199 91,360 95,065 93,793 92,016 95,635 89,084 87,231 90,802 55 . . . . . . . . . . . . . . . . . . 90,703 88,251 93,165 91,413 89,025 93,856 85,252 82,776 87,544 60 . . . . . . . . . . . . . . . . . . 87,117 83,815 90,384 87,971 84,733 91,224 80,006 76,497 83,239 65 . . . . . . . . . . . . . . . . . . 82,036 77,624 86,365 83,058 78,703 87,379 72,934 67,939 77,582 70 . . . . . . . . . . . . . . . . . . 74,948 69,256 80,556 76,188 70,492 81,857 63,502 56,856 69,695 75 . . . . . . . . . . . . . . . . . . 65,512 58,473 72,469 66,945 59,822 74,063 51,884 43,553 59,563 80 . . . . . . . . . . . . . . . . . . 53,679 45,519 61,757 55,206 46,877 63,540 38,717 29,277 47,473 85 . . . . . . . . . . . . . . . . . . 39,911 31,469 48,525 41,345 32,675 50,282 25,270 16,259 34,244 90 . . . . . . . . . . . . . . . . . . 25,727 18,318 33,785 26,846 19,209 35,225 13,620 6,857 21,440 95 . . . . . . . . . . . . . . . . . . 13,482 8,337 19,681 14,148 8,842 20,572 5,613 1,961 11,001 100 . . . . . . . . . . . . . . . . . 5,257 2,686 8,846 5,521 2,882 9,193 1,602 329 4,284 105 . . . . . . . . . . . . . . . . . 1,356 538 2,746 1,410 584 2,793 280 27 1,145
Georgia
0. . . . . . . . . . . . . . . . . . . 100,000 100,000 100,000 100,000 100,000 100,000 100,000 100,000 100,000 5. . . . . . . . . . . . . . . . . . . 99,025 98,863 99,138 99,290 99,178 99,377 98,506 98,209 98,674 10 . . . . . . . . . . . . . . . . . . 98,935 98,765 99,055 99,211 99,091 99,305 98,396 98,093 98,570 15 . . . . . . . . . . . . . . . . . . 98,814 98,618 98,962 99,101 98,962 99,215 98,252 97,908 98,469 20 . . . . . . . . . . . . . . . . . . 98,426 98,091 98,725 98,708 98,447 98,960 97,855 97,337 98,249 25 . . . . . . . . . . . . . . . . . . 97,912 97,349 98,460 98,239 97,774 98,729 97,231 96,403 97,916 30 . . . . . . . . . . . . . . . . . . 97,399 96,663 98,128 97,807 97,191 98,464 96,538 95,462 97,449 35 . . . . . . . . . . . . . . . . . . 96,800 95,915 97,681 97,307 96,555 98,113 95,631 94,289 96,783 40 . . . . . . . . . . . . . . . . . . 95,941 94,870 97,011 96,590 95,672 97,576 94,352 92,657 95,818 45 . . . . . . . . . . . . . . . . . . 94,674 93,298 96,048 95,494 94,324 96,742 92,500 90,308 94,411 50 . . . . . . . . . . . . . . . . . . 92,788 90,924 94,638 93,815 92,260 95,454 89,813 86,902 92,364 55 . . . . . . . . . . . . . . . . . . 89,961 87,375 92,528 91,254 89,130 93,475 85,953 82,045 89,409 60 . . . . . . . . . . . . . . . . . . 85,758 82,166 89,345 87,399 84,462 90,464 80,527 75,285 85,200 65 . . . . . . . . . . . . . . . . . . 79,652 74,737 84,558 81,742 77,674 85,955 73,138 66,217 79,323 70 . . . . . . . . . . . . . . . . . . 71,074 64,595 77,486 73,732 68,187 79,393 63,533 54,693 71,356 75 . . . . . . . . . . . . . . . . . . 59,658 51,639 67,423 62,870 55,716 69,966 51,787 41,174 61,019 80 . . . . . . . . . . . . . . . . . . 45,634 36,676 54,009 49,230 40,783 57,216 38,506 27,059 48,441 85 . . . . . . . . . . . . . . . . . . 30,086 21,810 37,948 33,622 25,260 41,596 24,943 14,604 34,502 90 . . . . . . . . . . . . . . . . . . 15,809 9,972 21,717 18,635 12,182 25,183 13,249 5,949 21,004 95 . . . . . . . . . . . . . . . . . . 5,913 3,115 9,066 7,551 4,070 11,522 5,320 1,635 10,216 100 . . . . . . . . . . . . . . . . . 1,347 569 2,361 1,935 805 3,469 1,452 262 3,622 105 . . . . . . . . . . . . . . . . . 153 50 312 259 77 570 235 21 831
Hawaii
0. . . . . . . . . . . . . . . . . . . 100,000 100,000 100,000 100,000 100,000 100,000 * * * 5. . . . . . . . . . . . . . . . . . . 99,208 99,111 99,291 99,649 99,634 99,669 * * * 10 . . . . . . . . . . . . . . . . . . 99,164 99,069 99,243 99,618 99,601 99,642 * * * 15 . . . . . . . . . . . . . . . . . . 99,094 98,976 99,197 99,577 99,569 99,590 * * * 20 . . . . . . . . . . . . . . . . . . 98,870 98,672 99,061 99,447 99,444 99,455 * * * 25 . . . . . . . . . . . . . . . . . . 98,537 98,213 98,882 99,198 99,138 99,293 * * * 30 . . . . . . . . . . . . . . . . . . 98,166 97,713 98,655 98,912 98,761 99,127 * * * 35 . . . . . . . . . . . . . . . . . . 97,719 97,157 98,324 98,542 98,273 98,901 * * * 40 . . . . . . . . . . . . . . . . . . 97,109 96,423 97,843 97,982 97,543 98,551 * * * 45 . . . . . . . . . . . . . . . . . . 96,221 95,351 97,143 97,145 96,456 97,996 * * * 50 . . . . . . . . . . . . . . . . . . 94,898 93,732 96,120 95,864 94,814 97,114 * * * 55 . . . . . . . . . . . . . . . . . . 92,912 91,284 94,618 93,891 92,352 95,720 * * *
See footnotes at end of table.

National Vital Statistics Reports, Vol. 60, No. 9, September 14, 2012 15
Table 1. Survivorship, by age, race, and sex: United States, 50 states, and District of Columbia, 1999–2001—Con.
All races White Black
State and age (years) Total Males Females Total Males Females Total Males Females
Hawaii—Con.
60 . . . . . . . . . . . . . . . . . . 89,967 87,620 92,402 90,915 88,705 93,532 * * * 65 . . . . . . . . . . . . . . . . . . 85,653 82,239 89,131 86,482 83,398 90,136 * * * 70 . . . . . . . . . . . . . . . . . . 79,489 74,566 84,336 80,035 75,893 84,965 * * * 75 . . . . . . . . . . . . . . . . . . 70,870 64,111 77,422 71,078 65,720 77,323 * * * 80 . . . . . . . . . . . . . . . . . . 59,314 50,818 67,775 59,233 52,789 66,551 * * * 85 . . . . . . . . . . . . . . . . . . 45,089 35,602 55,063 44,683 37,867 52,452 * * * 90 . . . . . . . . . . . . . . . . . . 29,582 20,718 39,809 28,953 22,948 36,022 * * * 95 . . . . . . . . . . . . . . . . . . 15,544 9,160 24,023 14,920 10,852 19,996 * * * 100 . . . . . . . . . . . . . . . . . 5,879 2,720 11,002 5,480 3,589 8,039 * * * 105 . . . . . . . . . . . . . . . . . 1,382 461 3,339 1,235 718 2,007 * * *
Idaho
0. . . . . . . . . . . . . . . . . . . 100,000 100,000 100,000 100,000 100,000 100,000 * * * 5. . . . . . . . . . . . . . . . . . . 99,277 99,348 99,235 99,337 99,498 99,230 * * * 10 . . . . . . . . . . . . . . . . . . 99,184 99,263 99,134 99,239 99,407 99,124 * * * 15 . . . . . . . . . . . . . . . . . . 99,046 99,100 99,021 99,101 99,245 99,010 * * * 20 . . . . . . . . . . . . . . . . . . 98,680 98,596 98,798 98,743 98,740 98,803 * * * 25 . . . . . . . . . . . . . . . . . . 98,225 97,941 98,561 98,346 98,191 98,571 * * * 30 . . . . . . . . . . . . . . . . . . 97,814 97,380 98,312 97,926 97,614 98,320 * * * 35 . . . . . . . . . . . . . . . . . . 97,359 96,820 97,968 97,442 96,992 97,981 * * * 40 . . . . . . . . . . . . . . . . . . 96,737 96,078 97,469 96,813 96,217 97,502 * * * 45 . . . . . . . . . . . . . . . . . . 95,829 94,973 96,763 95,938 95,155 96,818 * * * 50 . . . . . . . . . . . . . . . . . . 94,467 93,289 95,732 94,632 93,581 95,788 * * * 55 . . . . . . . . . . . . . . . . . . 92,396 90,734 94,173 92,630 91,182 94,203 * * * 60 . . . . . . . . . . . . . . . . . . 89,264 86,904 91,765 89,562 87,524 91,748 * * * 65 . . . . . . . . . . . . . . . . . . 84,545 81,280 88,017 84,898 82,028 87,966 * * * 70 . . . . . . . . . . . . . . . . . . 77,624 73,257 82,227 78,001 74,017 82,201 * * * 75 . . . . . . . . . . . . . . . . . . 67,761 62,226 73,520 68,124 62,911 73,531 * * * 80 . . . . . . . . . . . . . . . . . . 54,622 48,186 61,124 54,925 48,685 61,179 * * * 85 . . . . . . . . . . . . . . . . . . 38,675 32,347 45,084 38,861 32,565 45,183 * * * 90 . . . . . . . . . . . . . . . . . . 22,317 17,464 27,372 22,365 17,419 27,495 * * * 95 . . . . . . . . . . . . . . . . . . 9,378 6,806 12,183 9,342 6,656 12,288 * * * 100 . . . . . . . . . . . . . . . . . 2,442 1,649 3,353 2,405 1,554 3,405 * * * 105 . . . . . . . . . . . . . . . . . 317 205 451 306 181 464 * * *
Illinois
0. . . . . . . . . . . . . . . . . . . 100,000 100,000 100,000 100,000 100,000 100,000 100,000 100,000 100,000 5. . . . . . . . . . . . . . . . . . . 99,183 98,962 99,322 99,278 99,194 99,336 98,109 97,892 98,254 10 . . . . . . . . . . . . . . . . . . 99,115 98,886 99,261 99,220 99,132 99,281 97,986 97,759 98,142 15 . . . . . . . . . . . . . . . . . . 99,020 98,774 99,184 99,141 99,039 99,217 97,825 97,560 98,020 20 . . . . . . . . . . . . . . . . . . 98,671 98,280 98,992 98,831 98,620 99,027 97,267 96,664 97,806 25 . . . . . . . . . . . . . . . . . . 98,174 97,523 98,771 98,435 98,031 98,838 96,204 94,920 97,389 30 . . . . . . . . . . . . . . . . . . 97,711 96,845 98,530 98,079 97,524 98,645 95,202 93,361 96,888 35 . . . . . . . . . . . . . . . . . . 97,206 96,192 98,179 97,658 96,967 98,369 93,982 91,760 96,011 40 . . . . . . . . . . . . . . . . . . 96,504 95,330 97,639 97,055 96,200 97,934 92,444 89,890 94,769 45 . . . . . . . . . . . . . . . . . . 95,438 94,036 96,804 96,123 95,037 97,241 90,315 87,351 92,999 50 . . . . . . . . . . . . . . . . . . 93,805 92,053 95,521 94,674 93,240 96,152 87,340 83,777 90,538 55 . . . . . . . . . . . . . . . . . . 91,317 89,037 93,560 92,440 90,485 94,449 83,213 78,806 87,135 60 . . . . . . . . . . . . . . . . . . 87,580 84,518 90,592 89,041 86,323 91,811 77,567 72,058 82,462 65 . . . . . . . . . . . . . . . . . . 82,081 77,914 86,168 83,962 80,179 87,781 70,045 63,220 76,121 70 . . . . . . . . . . . . . . . . . . 74,268 68,630 79,728 76,563 71,425 81,653 60,408 52,233 67,717 75 . . . . . . . . . . . . . . . . . . 63,688 56,341 70,689 66,281 59,624 72,718 48,753 39,565 57,021 80 . . . . . . . . . . . . . . . . . . 50,413 41,501 58,694 53,017 45,014 60,464 35,756 26,453 44,265 85 . . . . . . . . . . . . . . . . . . 35,187 25,916 44,078 37,374 29,134 45,119 22,774 14,807 30,487 90 . . . . . . . . . . . . . . . . . . 20,318 12,628 28,427 21,701 14,939 28,443 11,847 6,456 17,637 95 . . . . . . . . . . . . . . . . . . 8,860 4,271 14,596 9,402 5,424 13,838 4,632 1,993 7,939 100 . . . . . . . . . . . . . . . . . 2,575 856 5,361 2,646 1,196 4,563 1,220 386 2,507 105 . . . . . . . . . . . . . . . . . 424 83 1,219 403 132 854 188 40 486
See footnotes at end of table.

16 National Vital Statistics Reports, Vol. 60, No. 9, September 14, 2012
Table 1. Survivorship, by age, race, and sex: United States, 50 states, and District of Columbia, 1999–2001—Con.
All races White Black
State and age (years) Total Males Females Total Males Females Total Males Females
Indiana
0. . . . . . . . . . . . . . . . . . . 100,000 100,000 100,000 100,000 100,000 100,000 100,000 100,000 100,000 5. . . . . . . . . . . . . . . . . . . 99,080 98,966 99,164 99,177 99,082 99,246 98,571 97,926 99,017 10 . . . . . . . . . . . . . . . . . . 98,992 98,870 99,084 99,094 98,993 99,169 98,449 97,781 98,919 15 . . . . . . . . . . . . . . . . . . 98,892 98,743 99,013 98,994 98,866 99,097 98,344 97,639 98,853 20 . . . . . . . . . . . . . . . . . . 98,525 98,229 98,802 98,644 98,395 98,875 97,761 96,674 98,671 25 . . . . . . . . . . . . . . . . . . 98,037 97,516 98,548 98,229 97,791 98,657 96,722 94,973 98,286 30 . . . . . . . . . . . . . . . . . . 97,564 96,843 98,282 97,793 97,198 98,385 95,739 93,449 97,817 35 . . . . . . . . . . . . . . . . . . 97,044 96,171 97,921 97,290 96,544 98,039 94,819 92,199 97,221 40 . . . . . . . . . . . . . . . . . . 96,321 95,278 97,369 96,584 95,652 97,523 93,583 90,626 96,303 45 . . . . . . . . . . . . . . . . . . 95,223 93,940 96,514 95,517 94,331 96,718 91,833 88,412 94,996 50 . . . . . . . . . . . . . . . . . . 93,534 91,893 95,193 93,880 92,319 95,467 89,286 85,192 93,080 55 . . . . . . . . . . . . . . . . . . 90,962 88,781 93,163 91,389 89,278 93,535 85,586 80,576 90,281 60 . . . . . . . . . . . . . . . . . . 87,089 84,123 90,078 87,643 84,750 90,579 80,351 74,117 86,230 65 . . . . . . . . . . . . . . . . . . 81,388 77,332 85,463 82,127 78,171 86,128 73,111 65,397 80,469 70 . . . . . . . . . . . . . . . . . . 73,308 67,819 78,732 74,281 68,968 79,565 63,587 54,237 72,508 75 . . . . . . . . . . . . . . . . . . 62,411 55,294 69,290 63,613 56,827 70,195 51,647 41,039 61,983 80 . . . . . . . . . . . . . . . . . . 48,830 40,301 56,819 50,154 42,170 57,611 38,030 27,135 48,970 85 . . . . . . . . . . . . . . . . . . 33,447 24,763 41,797 34,695 26,704 42,246 24,165 14,745 34,410 90 . . . . . . . . . . . . . . . . . . 18,744 11,777 26,063 19,677 13,338 26,036 12,394 6,048 20,346 95 . . . . . . . . . . . . . . . . . . 7,802 3,844 12,682 8,294 4,704 12,321 4,685 1,671 9,361 100 . . . . . . . . . . . . . . . . . 2,113 733 4,286 2,268 1,009 3,938 1,157 269 3,011 105 . . . . . . . . . . . . . . . . . 313 67 860 336 109 715 161 21 589
Iowa
0. . . . . . . . . . . . . . . . . . . 100,000 100,000 100,000 100,000 100,000 100,000 100,000 100,000 100,000 5. . . . . . . . . . . . . . . . . . . 99,356 99,192 99,469 99,329 99,230 99,410 98,832 98,907 98,780 10 . . . . . . . . . . . . . . . . . . 99,275 99,101 99,400 99,243 99,140 99,329 98,701 98,748 98,677 15 . . . . . . . . . . . . . . . . . . 99,184 99,003 99,315 99,154 99,043 99,248 98,543 98,549 98,561 20 . . . . . . . . . . . . . . . . . . 98,870 98,583 99,113 98,827 98,591 99,053 98,189 98,072 98,343 25 . . . . . . . . . . . . . . . . . . 98,493 98,038 98,913 98,484 98,113 98,850 97,609 97,341 97,945 30 . . . . . . . . . . . . . . . . . . 98,155 97,558 98,722 98,148 97,646 98,651 96,958 96,503 97,508 35 . . . . . . . . . . . . . . . . . . 97,741 97,055 98,404 97,745 97,151 98,342 96,192 95,578 96,945 40 . . . . . . . . . . . . . . . . . . 97,164 96,352 97,954 97,168 96,431 97,910 95,091 94,287 96,067 45 . . . . . . . . . . . . . . . . . . 96,296 95,280 97,295 96,310 95,363 97,267 93,432 92,357 94,727 50 . . . . . . . . . . . . . . . . . . 94,967 93,625 96,308 94,987 93,713 96,285 90,968 89,509 92,713 55 . . . . . . . . . . . . . . . . . . 92,931 91,085 94,794 92,952 91,183 94,764 87,372 85,361 89,718 60 . . . . . . . . . . . . . . . . . . 89,828 87,240 92,442 89,853 87,351 92,404 82,182 79,444 85,328 65 . . . . . . . . . . . . . . . . . . 85,152 81,537 88,781 85,200 81,668 88,766 74,977 71,266 79,041 70 . . . . . . . . . . . . . . . . . . 78,303 73,397 83,146 78,399 73,561 83,192 65,305 60,489 70,340 75 . . . . . . . . . . . . . . . . . . 68,515 62,133 74,718 68,646 62,315 74,809 52,971 47,262 58,909 80 . . . . . . . . . . . . . . . . . . 55,470 47,732 62,757 55,597 47,896 62,852 38,885 32,651 45,023 85 . . . . . . . . . . . . . . . . . . 39,564 31,520 47,230 39,634 31,627 47,263 24,459 18,820 30,011 90 . . . . . . . . . . . . . . . . . . 23,121 16,495 29,796 23,101 16,528 29,713 12,271 8,340 16,343 95 . . . . . . . . . . . . . . . . . . 9,935 6,081 14,226 9,857 6,068 14,061 4,447 2,543 6,631 100 . . . . . . . . . . . . . . . . . 2,688 1,342 4,422 2,628 1,327 4,290 1,020 461 1,770 105 . . . . . . . . . . . . . . . . . 372 144 727 353 140 681 125 42 265
Kansas
0. . . . . . . . . . . . . . . . . . . 100,000 100,000 100,000 100,000 100,000 100,000 100,000 100,000 100,000 5. . . . . . . . . . . . . . . . . . . 99,215 99,012 99,357 99,215 99,099 99,304 98,076 97,765 98,322 10 . . . . . . . . . . . . . . . . . . 99,148 98,941 99,295 99,147 99,031 99,236 97,980 97,654 98,244 15 . . . . . . . . . . . . . . . . . . 99,032 98,809 99,195 99,037 98,903 99,145 97,786 97,436 98,075 20 . . . . . . . . . . . . . . . . . . 98,660 98,289 98,981 98,676 98,415 98,918 97,116 96,444 97,766 25 . . . . . . . . . . . . . . . . . . 98,180 97,580 98,751 98,250 97,772 98,727 96,161 95,068 97,299 30 . . . . . . . . . . . . . . . . . . 97,729 96,936 98,510 97,827 97,172 98,494 95,395 94,117 96,745 35 . . . . . . . . . . . . . . . . . . 97,260 96,335 98,180 97,356 96,548 98,185 94,519 93,080 96,047 40 . . . . . . . . . . . . . . . . . . 96,628 95,576 97,678 96,720 95,774 97,689 93,291 91,617 95,075 45 . . . . . . . . . . . . . . . . . . 95,674 94,447 96,903 95,772 94,645 96,927 91,477 89,438 93,658 50 . . . . . . . . . . . . . . . . . . 94,198 92,702 95,706 94,316 92,916 95,755 88,850 86,287 91,584 55 . . . . . . . . . . . . . . . . . . 91,922 90,009 93,868 92,085 90,270 93,960 85,088 81,799 88,565
See footnotes at end of table.

National Vital Statistics Reports, Vol. 60, No. 9, September 14, 2012 17
Table 1. Survivorship, by age, race, and sex: United States, 50 states, and District of Columbia, 1999–2001—Con.
All races White Black
State and age (years) Total Males Females Total Males Females Total Males Females
Kansas—Con.
60 . . . . . . . . . . . . . . . . . . 88,471 85,905 91,072 88,723 86,270 91,239 79,820 75,547 84,232 65 . . . . . . . . . . . . . . . . . . 83,320 79,792 86,879 83,731 80,353 87,170 72,603 67,127 78,145 70 . . . . . . . . . . . . . . . . . . 75,934 71,014 80,804 76,566 71,896 81,218 63,169 56,332 69,864 75 . . . . . . . . . . . . . . . . . . 65,729 59,103 72,186 66,630 60,434 72,690 51,473 43,462 59,119 80 . . . . . . . . . . . . . . . . . . 52,628 44,309 60,564 53,796 46,121 61,093 38,069 29,656 46,120 85 . . . . . . . . . . . . . . . . . . 37,255 28,269 46,126 38,586 30,351 46,572 24,427 16,939 31,930 90 . . . . . . . . . . . . . . . . . . 21,863 14,110 30,302 23,108 15,963 30,555 12,768 7,505 18,580 95 . . . . . . . . . . . . . . . . . . 9,694 4,884 15,925 10,561 6,017 15,963 4,991 2,329 8,423 100 . . . . . . . . . . . . . . . . . 2,856 995 6,015 3,248 1,401 5,941 1,303 443 2,685 105 . . . . . . . . . . . . . . . . . 473 97 1,410 569 166 1,352 197 44 527
Kentucky
0. . . . . . . . . . . . . . . . . . . 100,000 100,000 100,000 100,000 100,000 100,000 100,000 100,000 100,000 5. . . . . . . . . . . . . . . . . . . 99,197 99,063 99,296 99,255 99,106 99,362 98,422 98,711 98,215 10 . . . . . . . . . . . . . . . . . . 99,105 98,966 99,209 99,164 99,011 99,276 98,323 98,608 98,120 15 . . . . . . . . . . . . . . . . . . 98,990 98,827 99,120 99,048 98,873 99,183 98,210 98,449 98,056 20 . . . . . . . . . . . . . . . . . . 98,606 98,302 98,884 98,664 98,356 98,939 97,807 97,821 97,892 25 . . . . . . . . . . . . . . . . . . 98,109 97,581 98,621 98,187 97,656 98,695 97,202 97,055 97,455 30 . . . . . . . . . . . . . . . . . . 97,556 96,836 98,265 97,668 96,942 98,375 96,427 96,027 96,940 35 . . . . . . . . . . . . . . . . . . 96,927 96,061 97,785 97,050 96,149 97,937 95,530 94,960 96,215 40 . . . . . . . . . . . . . . . . . . 96,082 95,036 97,120 96,201 95,078 97,311 94,289 93,500 95,183 45 . . . . . . . . . . . . . . . . . . 94,846 93,514 96,169 94,943 93,483 96,391 92,409 91,347 93,557 50 . . . . . . . . . . . . . . . . . . 92,989 91,199 94,772 93,059 91,092 95,023 89,663 88,171 91,212 55 . . . . . . . . . . . . . . . . . . 90,189 87,698 92,681 90,248 87,548 92,958 85,695 83,545 87,864 60 . . . . . . . . . . . . . . . . . . 86,001 82,496 89,515 86,096 82,388 89,835 80,120 76,964 83,157 65 . . . . . . . . . . . . . . . . . . 79,853 74,987 84,732 80,086 75,082 85,146 72,499 67,936 76,685 70 . . . . . . . . . . . . . . . . . . 71,132 64,630 77,623 71,624 65,159 78,133 62,421 56,220 68,075 75 . . . . . . . . . . . . . . . . . . 59,433 51,309 67,444 60,286 52,512 68,005 50,088 42,227 57,160 80 . . . . . . . . . . . . . . . . . . 45,019 35,911 53,807 46,241 37,857 54,342 36,337 27,450 44,259 85 . . . . . . . . . . . . . . . . . . 29,127 20,762 37,454 30,567 23,112 37,850 22,652 14,425 30,481 90 . . . . . . . . . . . . . . . . . . 14,790 9,026 21,023 16,080 11,048 21,199 11,351 5,569 17,744 95 . . . . . . . . . . . . . . . . . . 5,215 2,589 8,459 5,993 3,710 8,460 4,182 1,390 8,142 100 . . . . . . . . . . . . . . . . . 1,078 412 2,064 1,347 758 2,024 1,009 190 2,681 105 . . . . . . . . . . . . . . . . . 105 29 244 148 79 231 138 12 562
Louisiana
0. . . . . . . . . . . . . . . . . . . 100,000 100,000 100,000 100,000 100,000 100,000 100,000 100,000 100,000 5. . . . . . . . . . . . . . . . . . . 98,887 98,769 98,973 99,348 99,438 99,303 98,373 98,191 98,503 10 . . . . . . . . . . . . . . . . . . 98,773 98,639 98,877 99,249 99,324 99,222 98,235 98,033 98,386 15 . . . . . . . . . . . . . . . . . . 98,635 98,465 98,775 99,116 99,150 99,131 98,084 97,847 98,270 20 . . . . . . . . . . . . . . . . . . 98,188 97,824 98,526 98,697 98,572 98,875 97,594 97,108 98,029 25 . . . . . . . . . . . . . . . . . . 97,496 96,780 98,184 98,152 97,773 98,591 96,641 95,603 97,581 30 . . . . . . . . . . . . . . . . . . 96,742 95,672 97,776 97,580 96,958 98,267 95,614 94,062 97,011 35 . . . . . . . . . . . . . . . . . . 95,936 94,582 97,250 96,959 96,117 97,874 94,376 92,311 96,228 40 . . . . . . . . . . . . . . . . . . 94,916 93,300 96,486 96,112 95,024 97,276 92,854 90,307 95,129 45 . . . . . . . . . . . . . . . . . . 93,481 91,540 95,374 94,874 93,462 96,375 90,828 87,806 93,533 50 . . . . . . . . . . . . . . . . . . 91,380 88,979 93,730 93,024 91,151 95,002 87,985 84,340 91,252 55 . . . . . . . . . . . . . . . . . . 88,316 85,233 91,354 90,272 87,750 92,922 83,937 79,418 88,026 60 . . . . . . . . . . . . . . . . . . 83,905 79,834 87,922 86,247 82,830 89,803 78,289 72,516 83,527 65 . . . . . . . . . . . . . . . . . . 77,644 72,272 82,949 80,469 75,889 85,200 70,621 63,185 77,383 70 . . . . . . . . . . . . . . . . . . 69,037 62,137 75,807 72,478 66,470 78,582 60,680 51,299 69,241 75 . . . . . . . . . . . . . . . . . . 57,729 49,428 65,825 61,837 54,411 69,262 48,600 37,468 58,916 80 . . . . . . . . . . . . . . . . . . 43,971 35,000 52,633 48,680 40,253 56,880 35,147 23,388 46,622 85 . . . . . . . . . . . . . . . . . . 28,879 20,857 36,861 33,803 25,629 41,884 21,891 11,597 33,248 90 . . . . . . . . . . . . . . . . . . 15,113 9,659 20,904 19,452 13,097 26,106 11,007 4,128 20,447 95 . . . . . . . . . . . . . . . . . . 5,615 3,115 8,522 8,484 4,876 12,658 4,106 922 10,207 100 . . . . . . . . . . . . . . . . . 1,261 606 2,102 2,480 1,162 4,238 1,021 109 3,814 105 . . . . . . . . . . . . . . . . . 139 59 249 413 150 834 149 6 961
See footnotes at end of table.

18 National Vital Statistics Reports, Vol. 60, No. 9, September 14, 2012
Table 1. Survivorship, by age, race, and sex: United States, 50 states, and District of Columbia, 1999–2001—Con.
All races White Black
State and age (years) Total Males Females Total Males Females Total Males Females
Maine
0. . . . . . . . . . . . . . . . . . . 100,000 100,000 100,000 100,000 100,000 100,000 * * * 5. . . . . . . . . . . . . . . . . . . 99,463 99,351 99,538 99,481 99,365 99,561 * * * 10 . . . . . . . . . . . . . . . . . . 99,398 99,277 99,483 99,415 99,288 99,505 * * * 15 . . . . . . . . . . . . . . . . . . 99,292 99,176 99,371 99,310 99,188 99,395 * * * 20 . . . . . . . . . . . . . . . . . . 98,965 98,737 99,162 98,981 98,741 99,189 * * * 25 . . . . . . . . . . . . . . . . . . 98,538 98,121 98,927 98,563 98,142 98,954 * * * 30 . . . . . . . . . . . . . . . . . . 98,118 97,519 98,684 98,169 97,593 98,713 * * * 35 . . . . . . . . . . . . . . . . . . 97,688 96,950 98,389 97,700 96,943 98,418 * * * 40 . . . . . . . . . . . . . . . . . . 97,122 96,240 97,962 97,115 96,192 97,994 * * * 45 . . . . . . . . . . . . . . . . . . 96,264 95,182 97,301 96,228 95,070 97,337 * * * 50 . . . . . . . . . . . . . . . . . . 94,913 93,527 96,254 94,848 93,351 96,296 * * * 55 . . . . . . . . . . . . . . . . . . 92,775 90,931 94,595 92,687 90,705 94,646 * * * 60 . . . . . . . . . . . . . . . . . . 89,502 86,908 92,090 89,366 86,681 92,049 * * * 65 . . . . . . . . . . . . . . . . . . 84,556 80,814 88,301 84,353 80,693 88,018 * * * 70 . . . . . . . . . . . . . . . . . . 77,075 71,920 82,216 77,004 72,089 81,901 * * * 75 . . . . . . . . . . . . . . . . . . 66,240 59,683 72,670 66,741 60,384 72,957 * * * 80 . . . . . . . . . . . . . . . . . . 51,629 44,343 58,594 53,383 45,755 60,624 * * * 85 . . . . . . . . . . . . . . . . . . 34,091 27,709 40,223 37,558 29,707 45,123 * * * 90 . . . . . . . . . . . . . . . . . . 17,138 13,261 20,934 21,679 15,250 28,262 * * * 95 . . . . . . . . . . . . . . . . . . 5,564 4,248 6,861 9,269 5,515 13,565 * * * 100 . . . . . . . . . . . . . . . . . 921 758 1,076 2,543 1,200 4,359 * * * 105 . . . . . . . . . . . . . . . . . 57 60 56 370 128 780 * * *
Maryland
0. . . . . . . . . . . . . . . . . . . 100,000 100,000 100,000 100,000 100,000 100,000 100,000 100,000 100,000 5. . . . . . . . . . . . . . . . . . . 99,086 99,016 99,134 99,403 99,339 99,448 98,549 98,653 98,501 10 . . . . . . . . . . . . . . . . . . 99,012 98,937 99,066 99,341 99,266 99,400 98,451 98,555 98,402 15 . . . . . . . . . . . . . . . . . . 98,916 98,818 98,993 99,267 99,183 99,335 98,308 98,361 98,313 20 . . . . . . . . . . . . . . . . . . 98,535 98,250 98,808 98,949 98,755 99,133 97,778 97,471 98,144 25 . . . . . . . . . . . . . . . . . . 97,963 97,345 98,569 98,503 98,089 98,920 96,918 95,990 97,850 30 . . . . . . . . . . . . . . . . . . 97,387 96,486 98,265 98,138 97,580 98,699 95,987 94,510 97,397 35 . . . . . . . . . . . . . . . . . . 96,772 95,687 97,825 97,710 96,996 98,427 94,861 92,896 96,698 40 . . . . . . . . . . . . . . . . . . 95,972 94,705 97,201 97,099 96,205 97,996 93,182 90,524 95,627 45 . . . . . . . . . . . . . . . . . . 94,821 93,287 96,308 96,165 95,018 97,319 90,875 87,329 94,114 50 . . . . . . . . . . . . . . . . . . 93,123 91,165 95,011 94,720 93,200 96,248 87,838 83,278 91,945 55 . . . . . . . . . . . . . . . . . . 90,592 88,000 93,098 92,494 90,442 94,562 83,821 78,228 88,862 60 . . . . . . . . . . . . . . . . . . 86,840 83,347 90,237 89,109 86,315 91,929 78,579 72,014 84,543 65 . . . . . . . . . . . . . . . . . . 81,344 76,675 85,932 84,052 80,277 87,878 71,828 64,451 78,609 70 . . . . . . . . . . . . . . . . . . 73,537 67,468 79,491 76,809 71,846 81,785 63,354 55,359 70,743 75 . . . . . . . . . . . . . . . . . . 62,906 55,475 70,091 66,662 60,386 72,798 52,912 44,667 60,481 80 . . . . . . . . . . . . . . . . . . 49,371 41,166 57,095 53,382 45,992 60,301 40,671 32,651 47,905 85 . . . . . . . . . . . . . . . . . . 33,698 26,188 40,823 37,545 30,088 44,522 27,452 20,344 33,910 90 . . . . . . . . . . . . . . . . . . 18,486 13,260 23,607 21,585 15,616 27,404 15,178 9,766 20,376 95 . . . . . . . . . . . . . . . . . . 7,246 4,817 9,729 9,124 5,737 12,713 6,197 3,072 9,671 100 . . . . . . . . . . . . . . . . . 1,716 1,092 2,373 2,441 1,276 3,841 1,614 497 3,287 105 . . . . . . . . . . . . . . . . . 197 129 266 338 140 619 222 30 704
Massachusetts
0. . . . . . . . . . . . . . . . . . . 100,000 100,000 100,000 100,000 100,000 100,000 100,000 100,000 100,000 5. . . . . . . . . . . . . . . . . . . 99,513 99,344 99,629 99,661 99,739 99,617 98,994 99,169 98,895 10 . . . . . . . . . . . . . . . . . . 99,464 99,291 99,583 99,611 99,685 99,571 98,929 99,107 98,826 15 . . . . . . . . . . . . . . . . . . 99,392 99,207 99,525 99,540 99,598 99,516 98,815 98,992 98,712 20 . . . . . . . . . . . . . . . . . . 99,184 98,910 99,407 99,344 99,326 99,399 98,492 98,503 98,560 25 . . . . . . . . . . . . . . . . . . 98,879 98,457 99,247 99,045 98,894 99,229 98,044 97,808 98,341 30 . . . . . . . . . . . . . . . . . . 98,542 97,977 99,050 98,718 98,435 99,031 97,475 96,963 98,020 35 . . . . . . . . . . . . . . . . . . 98,140 97,452 98,769 98,321 97,911 98,760 96,743 95,954 97,544 40 . . . . . . . . . . . . . . . . . . 97,566 96,736 98,334 97,732 97,167 98,322 95,770 94,697 96,837 45 . . . . . . . . . . . . . . . . . . 96,683 95,648 97,653 96,835 96,040 97,648 94,354 92,897 95,786 50 . . . . . . . . . . . . . . . . . . 95,306 93,953 96,584 95,439 94,297 96,589 92,307 90,326 94,230 55 . . . . . . . . . . . . . . . . . . 93,164 91,323 94,918 93,281 91,620 94,935 89,356 86,659 91,940
See footnotes at end of table.

National Vital Statistics Reports, Vol. 60, No. 9, September 14, 2012 19
Table 1. Survivorship, by age, race, and sex: United States, 50 states, and District of Columbia, 1999–2001—Con.
All races White Black
State and age (years) Total Males Females Total Males Females Total Males Females
Massachusetts—Con.
60 . . . . . . . . . . . . . . . . . . 89,873 87,294 92,342 89,984 87,564 92,371 85,175 81,502 88,606 65 . . . . . . . . . . . . . . . . . . 84,915 81,258 88,411 85,045 81,555 88,452 79,355 74,429 83,827 70 . . . . . . . . . . . . . . . . . . 77,690 72,534 82,577 77,882 72,953 82,618 71,467 65,082 77,137 75 . . . . . . . . . . . . . . . . . . 67,597 60,610 74,089 67,902 61,281 74,101 61,255 53,395 68,102 80 . . . . . . . . . . . . . . . . . . 54,451 45,674 62,362 54,903 46,698 62,306 48,924 39,910 56,532 85 . . . . . . . . . . . . . . . . . . 38,757 29,325 47,479 39,350 30,642 47,315 35,102 26,059 42,832 90 . . . . . . . . . . . . . . . . . . 22,797 14,741 30,917 23,428 16,028 30,646 21,549 14,013 28,375 95 . . . . . . . . . . . . . . . . . . 10,049 5,138 15,835 10,536 5,986 15,537 10,576 5,725 15,463 100 . . . . . . . . . . . . . . . . . 2,894 1,052 5,652 3,130 1,372 5,445 3,784 1,596 6,368 105 . . . . . . . . . . . . . . . . . 454 102 1,190 514 159 1,112 875 265 1,769
Michigan
0. . . . . . . . . . . . . . . . . . . 100,000 100,000 100,000 100,000 100,000 100,000 100,000 100,000 100,000 5. . . . . . . . . . . . . . . . . . . 99,191 98,927 99,368 99,300 99,177 99,391 98,422 98,689 98,275 10 . . . . . . . . . . . . . . . . . . 99,114 98,835 99,308 99,232 99,103 99,330 98,287 98,521 98,173 15 . . . . . . . . . . . . . . . . . . 99,018 98,727 99,225 99,149 99,012 99,255 98,139 98,322 98,078 20 . . . . . . . . . . . . . . . . . . 98,707 98,306 99,029 98,869 98,642 99,070 97,663 97,613 97,836 25 . . . . . . . . . . . . . . . . . . 98,245 97,615 98,804 98,500 98,106 98,875 96,752 96,135 97,457 30 . . . . . . . . . . . . . . . . . . 97,765 96,915 98,547 98,125 97,578 98,660 95,802 94,648 96,990 35 . . . . . . . . . . . . . . . . . . 97,221 96,207 98,171 97,665 96,976 98,346 94,613 92,959 96,252 40 . . . . . . . . . . . . . . . . . . 96,469 95,284 97,594 97,019 96,167 97,870 92,881 90,505 95,165 45 . . . . . . . . . . . . . . . . . . 95,345 93,923 96,708 96,048 94,944 97,155 90,440 87,067 93,629 50 . . . . . . . . . . . . . . . . . . 93,637 91,867 95,354 94,556 93,072 96,056 87,171 82,610 91,442 55 . . . . . . . . . . . . . . . . . . 91,059 88,778 93,296 92,269 90,230 94,343 82,829 76,956 88,355 60 . . . . . . . . . . . . . . . . . . 87,220 84,206 90,204 88,798 85,977 91,674 77,168 69,944 84,060 65 . . . . . . . . . . . . . . . . . . 81,630 77,603 85,628 83,620 79,759 87,551 70,024 61,466 78,196 70 . . . . . . . . . . . . . . . . . . 73,781 68,421 79,042 76,133 70,982 81,299 61,195 51,545 70,418 75 . . . . . . . . . . . . . . . . . . 63,187 56,372 69,809 65,787 59,253 72,236 50,640 40,458 60,511 80 . . . . . . . . . . . . . . . . . . 49,952 41,892 57,579 52,536 44,835 59,867 38,804 28,880 48,613 85 . . . . . . . . . . . . . . . . . . 34,838 26,642 42,761 37,004 29,219 44,472 26,574 17,967 35,470 90 . . . . . . . . . . . . . . . . . . 20,124 13,437 27,074 21,511 15,217 27,864 15,483 9,150 22,573 95 . . . . . . . . . . . . . . . . . . 8,798 4,829 13,496 9,370 5,694 13,451 7,165 3,486 11,852 100 . . . . . . . . . . . . . . . . . 2,570 1,070 4,732 2,671 1,325 4,393 2,398 876 4,765 105 . . . . . . . . . . . . . . . . . 426 122 1,003 416 159 813 514 123 1,331
Minnesota
0. . . . . . . . . . . . . . . . . . . 100,000 100,000 100,000 100,000 100,000 100,000 100,000 100,000 100,000 5. . . . . . . . . . . . . . . . . . . 99,343 99,236 99,426 99,416 99,328 99,485 99,030 98,695 99,279 10 . . . . . . . . . . . . . . . . . . 99,265 99,148 99,358 99,344 99,252 99,418 98,895 98,533 99,170 15 . . . . . . . . . . . . . . . . . . 99,181 99,045 99,294 99,265 99,153 99,360 98,755 98,367 99,059 20 . . . . . . . . . . . . . . . . . . 98,914 98,686 99,124 99,005 98,808 99,191 98,349 97,758 98,864 25 . . . . . . . . . . . . . . . . . . 98,556 98,185 98,915 98,681 98,358 98,999 97,717 96,819 98,554 30 . . . . . . . . . . . . . . . . . . 98,225 97,717 98,727 98,383 97,945 98,820 97,032 95,891 98,127 35 . . . . . . . . . . . . . . . . . . 97,855 97,224 98,483 98,030 97,465 98,597 96,269 94,963 97,554 40 . . . . . . . . . . . . . . . . . . 97,317 96,548 98,088 97,530 96,828 98,238 95,235 93,740 96,744 45 . . . . . . . . . . . . . . . . . . 96,529 95,524 97,544 96,758 95,860 97,668 93,721 91,973 95,559 50 . . . . . . . . . . . . . . . . . . 95,288 93,949 96,653 95,550 94,358 96,765 91,484 89,375 93,801 55 . . . . . . . . . . . . . . . . . . 93,392 91,538 95,289 93,669 92,033 95,341 88,229 85,599 91,178 60 . . . . . . . . . . . . . . . . . . 90,475 87,892 93,121 90,769 88,477 93,112 83,549 80,212 87,282 65 . . . . . . . . . . . . . . . . . . 86,039 82,485 89,669 86,371 83,139 89,663 76,995 72,742 81,578 70 . . . . . . . . . . . . . . . . . . 79,430 74,680 84,248 79,844 75,369 84,365 68,067 62,813 73,464 75 . . . . . . . . . . . . . . . . . . 69,879 63,749 75,984 70,475 64,409 76,482 56,402 50,418 62,456 80 . . . . . . . . . . . . . . . . . . 56,946 49,578 64,051 57,887 50,100 65,344 42,488 36,317 48,590 85 . . . . . . . . . . . . . . . . . . 40,934 33,326 48,319 42,313 33,603 50,809 27,681 22,316 33,012 90 . . . . . . . . . . . . . . . . . . 24,119 17,884 30,443 25,779 17,904 34,059 14,541 10,889 18,280 95 . . . . . . . . . . . . . . . . . . 10,430 6,824 14,394 11,879 6,720 18,132 5,580 3,824 7,472 100 . . . . . . . . . . . . . . . . . 2,823 1,576 4,360 3,605 1,503 6,798 1,369 849 1,967 105 . . . . . . . . . . . . . . . . . 386 179 679 598 161 1,518 181 101 279
See footnotes at end of table.

20 National Vital Statistics Reports, Vol. 60, No. 9, September 14, 2012
Table 1. Survivorship, by age, race, and sex: United States, 50 states, and District of Columbia, 1999–2001—Con.
All races White Black
State and age (years) Total Males Females Total Males Females Total Males Females
Mississippi
0. . . . . . . . . . . . . . . . . . . 100,000 100,000 100,000 100,000 100,000 100,000 100,000 100,000 100,000 5. . . . . . . . . . . . . . . . . . . 98,751 98,578 98,877 99,134 98,995 99,240 98,295 98,054 98,455 10 . . . . . . . . . . . . . . . . . . 98,633 98,441 98,780 99,022 98,865 99,147 98,170 97,909 98,350 15 . . . . . . . . . . . . . . . . . . 98,474 98,242 98,664 98,872 98,679 99,035 98,004 97,694 98,236 20 . . . . . . . . . . . . . . . . . . 97,992 97,584 98,365 98,393 98,016 98,753 97,529 97,046 97,934 25 . . . . . . . . . . . . . . . . . . 97,292 96,580 97,974 97,806 97,198 98,417 96,665 95,792 97,431 30 . . . . . . . . . . . . . . . . . . 96,520 95,480 97,521 97,190 96,347 98,050 95,676 94,362 96,819 35 . . . . . . . . . . . . . . . . . . 95,673 94,351 96,949 96,506 95,444 97,599 94,494 92,686 96,052 40 . . . . . . . . . . . . . . . . . . 94,588 92,993 96,130 95,605 94,284 96,969 92,827 90,337 94,969 45 . . . . . . . . . . . . . . . . . . 93,053 91,120 94,925 94,321 92,670 96,033 90,441 87,024 93,402 50 . . . . . . . . . . . . . . . . . . 90,812 88,402 93,155 92,416 90,283 94,622 87,118 82,626 91,099 55 . . . . . . . . . . . . . . . . . . 87,532 84,439 90,571 89,574 86,757 92,498 82,573 76,891 87,743 60 . . . . . . . . . . . . . . . . . . 82,826 78,752 86,847 85,411 81,625 89,329 76,525 69,595 82,931 65 . . . . . . . . . . . . . . . . . . 76,232 70,833 81,571 79,427 74,357 84,676 68,709 60,623 76,197 70 . . . . . . . . . . . . . . . . . . 67,382 60,310 74,334 71,178 64,487 78,051 58,956 50,092 67,112 75 . . . . . . . . . . . . . . . . . . 56,088 47,283 64,677 60,275 51,911 68,754 47,388 38,498 55,502 80 . . . . . . . . . . . . . . . . . . 42,843 32,768 52,517 46,979 37,352 56,431 34,689 26,799 41,810 85 . . . . . . . . . . . . . . . . . . 28,664 18,921 38,492 32,104 22,733 41,539 22,160 16,310 27,455 90 . . . . . . . . . . . . . . . . . . 15,800 8,373 24,271 18,016 10,814 25,897 11,672 8,284 14,764 95 . . . . . . . . . . . . . . . . . . 6,596 2,533 12,300 7,564 3,604 12,577 4,694 3,307 5,962 100 . . . . . . . . . . . . . . . . . 1,864 451 4,562 2,091 728 4,227 1,303 962 1,610 105 . . . . . . . . . . . . . . . . . 309 39 1,094 322 74 838 220 186 251
Missouri
0. . . . . . . . . . . . . . . . . . . 100,000 100,000 100,000 100,000 100,000 100,000 100,000 100,000 100,000 5. . . . . . . . . . . . . . . . . . . 99,141 99,034 99,216 99,353 99,348 99,366 98,366 98,462 98,328 10 . . . . . . . . . . . . . . . . . . 99,047 98,932 99,129 99,266 99,256 99,283 98,234 98,309 98,217 15 . . . . . . . . . . . . . . . . . . 98,934 98,800 99,037 99,163 99,137 99,198 98,060 98,097 98,082 20 . . . . . . . . . . . . . . . . . . 98,485 98,179 98,768 98,751 98,587 98,931 97,388 97,054 97,787 25 . . . . . . . . . . . . . . . . . . 97,956 97,376 98,515 98,306 97,936 98,696 96,351 95,305 97,401 30 . . . . . . . . . . . . . . . . . . 97,456 96,663 98,228 97,870 97,331 98,431 95,459 93,877 96,979 35 . . . . . . . . . . . . . . . . . . 96,896 95,936 97,836 97,342 96,633 98,077 94,389 92,352 96,311 40 . . . . . . . . . . . . . . . . . . 96,100 94,946 97,238 96,579 95,662 97,526 93,023 90,573 95,318 45 . . . . . . . . . . . . . . . . . . 94,909 93,474 96,327 95,438 94,231 96,681 91,061 88,111 93,805 50 . . . . . . . . . . . . . . . . . . 93,117 91,273 94,943 93,718 92,087 95,387 88,233 84,598 91,586 55 . . . . . . . . . . . . . . . . . . 90,443 88,010 92,851 91,142 88,909 93,416 84,213 79,663 88,366 60 . . . . . . . . . . . . . . . . . . 86,504 83,251 89,725 87,337 84,269 90,443 78,577 72,899 83,763 65 . . . . . . . . . . . . . . . . . . 80,822 76,485 85,124 81,822 77,660 86,028 70,964 63,961 77,332 70 . . . . . . . . . . . . . . . . . . 72,961 67,301 78,548 74,135 68,652 79,642 61,120 52,764 68,649 75 . . . . . . . . . . . . . . . . . . 62,435 55,388 69,322 63,692 56,789 70,543 49,112 39,786 57,497 80 . . . . . . . . . . . . . . . . . . 49,329 41,185 57,091 50,504 42,417 58,288 35,668 26,339 44,196 85 . . . . . . . . . . . . . . . . . . 34,406 26,304 42,274 35,276 27,145 43,226 22,336 14,469 29,958 90 . . . . . . . . . . . . . . . . . . 19,903 13,417 26,622 20,327 13,788 27,138 11,308 6,105 16,920 95 . . . . . . . . . . . . . . . . . . 8,733 4,936 13,146 8,790 4,991 13,231 4,242 1,785 7,359 100 . . . . . . . . . . . . . . . . . 2,570 1,142 4,538 2,501 1,113 4,430 1,052 317 2,218 105 . . . . . . . . . . . . . . . . . 432 140 938 394 127 862 149 29 404
Montana
0. . . . . . . . . . . . . . . . . . . 100,000 100,000 100,000 100,000 100,000 100,000 * * * 5. . . . . . . . . . . . . . . . . . . 99,283 99,359 99,240 99,446 99,253 99,588 * * * 10 . . . . . . . . . . . . . . . . . . 99,168 99,231 99,137 99,323 99,105 99,490 * * * 15 . . . . . . . . . . . . . . . . . . 99,025 99,033 99,054 99,181 98,907 99,408 * * * 20 . . . . . . . . . . . . . . . . . . 98,621 98,541 98,744 98,836 98,497 99,134 * * * 25 . . . . . . . . . . . . . . . . . . 98,115 97,789 98,505 98,391 97,843 98,917 * * * 30 . . . . . . . . . . . . . . . . . . 97,562 96,963 98,246 97,930 97,178 98,679 * * * 35 . . . . . . . . . . . . . . . . . . 96,952 96,114 97,878 97,391 96,410 98,373 * * * 40 . . . . . . . . . . . . . . . . . . 96,219 95,143 97,381 96,693 95,452 97,936 * * * 45 . . . . . . . . . . . . . . . . . . 95,203 93,865 96,625 95,732 94,206 97,259 * * * 50 . . . . . . . . . . . . . . . . . . 93,696 92,030 95,461 94,337 92,495 96,200 * * * 55 . . . . . . . . . . . . . . . . . . 91,424 89,313 93,679 92,259 90,031 94,552 * * *
See footnotes at end of table.

National Vital Statistics Reports, Vol. 60, No. 9, September 14, 2012 21
Table 1. Survivorship, by age, race, and sex: United States, 50 states, and District of Columbia, 1999–2001—Con.
All races White Black
State and age (years) Total Males Females Total Males Females Total Males Females
Montana—Con.
60 . . . . . . . . . . . . . . . . . . 88,031 85,284 90,974 89,139 86,387 92,006 * * * 65 . . . . . . . . . . . . . . . . . . 83,035 79,410 86,923 84,456 80,965 88,124 * * * 70 . . . . . . . . . . . . . . . . . . 75,950 71,165 81,052 77,524 72,923 82,364 * * * 75 . . . . . . . . . . . . . . . . . . 66,081 59,989 72,508 67,444 61,284 73,866 * * * 80 . . . . . . . . . . . . . . . . . . 53,205 45,980 60,692 53,792 45,835 61,973 * * * 85 . . . . . . . . . . . . . . . . . . 37,884 30,458 45,736 37,140 28,244 46,752 * * * 90 . . . . . . . . . . . . . . . . . . 22,330 16,176 29,243 20,353 12,699 29,820 * * * 95 . . . . . . . . . . . . . . . . . . 9,891 6,185 14,515 7,782 3,473 14,655 * * * 100 . . . . . . . . . . . . . . . . . 2,873 1,469 4,919 1,735 448 4,847 * * * 105 . . . . . . . . . . . . . . . . . 456 179 954 179 20 896 * * *
Nebraska
0. . . . . . . . . . . . . . . . . . . 100,000 100,000 100,000 100,000 100,000 100,000 100,000 100,000 100,000 5. . . . . . . . . . . . . . . . . . . 99,235 99,269 99,223 99,343 99,340 99,359 98,568 98,564 98,586 10 . . . . . . . . . . . . . . . . . . 99,149 99,181 99,138 99,250 99,245 99,267 98,405 98,373 98,450 15 . . . . . . . . . . . . . . . . . . 99,038 99,052 99,046 99,158 99,147 99,181 98,253 98,170 98,351 20 . . . . . . . . . . . . . . . . . . 98,670 98,542 98,828 98,808 98,671 98,965 97,792 97,546 98,063 25 . . . . . . . . . . . . . . . . . . 98,262 97,914 98,650 98,445 98,120 98,797 97,088 96,565 97,656 30 . . . . . . . . . . . . . . . . . . 97,897 97,440 98,400 98,112 97,695 98,564 96,196 95,340 97,095 35 . . . . . . . . . . . . . . . . . . 97,483 96,954 98,062 97,681 97,162 98,239 95,240 94,121 96,398 40 . . . . . . . . . . . . . . . . . . 96,894 96,253 97,586 97,096 96,435 97,800 94,029 92,677 95,431 45 . . . . . . . . . . . . . . . . . . 96,013 95,170 96,914 96,224 95,322 97,176 92,277 90,607 93,985 50 . . . . . . . . . . . . . . . . . . 94,675 93,487 95,924 94,903 93,614 96,250 89,685 87,581 91,847 55 . . . . . . . . . . . . . . . . . . 92,618 90,896 94,418 92,878 91,012 94,826 85,924 83,191 88,716 60 . . . . . . . . . . . . . . . . . . 89,473 86,961 92,078 89,793 87,102 92,588 80,558 76,957 84,197 65 . . . . . . . . . . . . . . . . . . 84,723 81,110 88,416 85,148 81,349 89,047 73,152 68,401 77,822 70 . . . . . . . . . . . . . . . . . . 77,784 72,868 82,730 78,340 73,249 83,488 63,213 57,252 69,131 75 . . . . . . . . . . . . . . . . . . 67,910 61,613 74,138 68,550 62,078 74,998 51,039 43,799 57,874 80 . . . . . . . . . . . . . . . . . . 54,729 47,367 61,840 55,363 47,804 62,718 37,057 29,319 44,358 85 . . . . . . . . . . . . . . . . . . 38,719 31,437 45,826 39,204 31,716 46,570 23,019 16,130 29,844 90 . . . . . . . . . . . . . . . . . . 22,297 16,677 28,005 22,524 16,741 28,455 11,396 6,681 16,596 95 . . . . . . . . . . . . . . . . . . 9,330 6,329 12,577 9,339 6,264 12,708 4,082 1,851 7,014 100 . . . . . . . . . . . . . . . . . 2,411 1,475 3,501 2,360 1,417 3,480 932 294 2,012 105 . . . . . . . . . . . . . . . . . 309 173 478 290 158 458 116 22 339
Nevada
0. . . . . . . . . . . . . . . . . . . 100,000 100,000 100,000 100,000 100,000 100,000 100,000 100,000 100,000 5. . . . . . . . . . . . . . . . . . . 99,228 99,156 99,292 99,292 99,223 99,353 98,605 98,861 98,423 10 . . . . . . . . . . . . . . . . . . 99,138 99,055 99,212 99,203 99,119 99,278 98,508 98,753 98,337 15 . . . . . . . . . . . . . . . . . . 99,048 98,933 99,155 99,117 99,001 99,228 98,360 98,535 98,263 20 . . . . . . . . . . . . . . . . . . 98,694 98,453 98,939 98,778 98,551 99,009 97,786 97,631 98,028 25 . . . . . . . . . . . . . . . . . . 98,188 97,724 98,679 98,290 97,853 98,758 96,984 96,424 97,648 30 . . . . . . . . . . . . . . . . . . 97,704 97,048 98,406 97,852 97,250 98,504 96,159 95,191 97,247 35 . . . . . . . . . . . . . . . . . . 97,125 96,316 97,999 97,273 96,512 98,107 95,191 93,956 96,581 40 . . . . . . . . . . . . . . . . . . 96,291 95,293 97,376 96,433 95,469 97,501 93,890 92,505 95,450 45 . . . . . . . . . . . . . . . . . . 95,037 93,764 96,424 95,187 93,925 96,587 92,003 90,517 93,678 50 . . . . . . . . . . . . . . . . . . 93,154 91,473 94,975 93,311 91,615 95,186 89,395 87,683 91,308 55 . . . . . . . . . . . . . . . . . . 90,345 88,073 92,784 90,511 88,197 93,051 85,764 83,648 88,073 60 . . . . . . . . . . . . . . . . . . 86,203 83,117 89,507 86,378 83,226 89,834 80,760 78,005 83,664 65 . . . . . . . . . . . . . . . . . . 80,204 76,076 84,688 80,389 76,184 85,065 73,884 70,334 77,672 70 . . . . . . . . . . . . . . . . . . 71,837 66,468 77,779 72,091 66,595 78,332 64,806 60,346 69,609 75 . . . . . . . . . . . . . . . . . . 60,799 54,124 68,253 61,030 54,295 68,735 53,426 48,135 59,036 80 . . . . . . . . . . . . . . . . . . 47,303 39,637 55,875 47,309 39,868 55,784 40,088 34,517 45,903 85 . . . . . . . . . . . . . . . . . . 32,346 24,780 41,174 31,934 25,051 39,995 26,033 21,214 31,123 90 . . . . . . . . . . . . . . . . . . 18,260 12,270 25,905 17,469 12,518 23,606 13,604 10,455 17,028 95 . . . . . . . . . . . . . . . . . . 7,790 4,336 12,895 6,982 4,493 10,324 5,150 3,774 6,692 100 . . . . . . . . . . . . . . . . . 2,228 952 4,565 1,766 1,011 2,878 1,222 887 1,600 105 . . . . . . . . . . . . . . . . . 365 109 996 234 120 418 150 117 186
See footnotes at end of table.

22 National Vital Statistics Reports, Vol. 60, No. 9, September 14, 2012
Table 1. Survivorship, by age, race, and sex: United States, 50 states, and District of Columbia, 1999–2001—Con.
All races White Black
State and age (years) Total Males Females Total Males Females Total Males Females
New Hampshire
0. . . . . . . . . . . . . . . . . . . 100,000 100,000 100,000 100,000 100,000 100,000 * * * 5. . . . . . . . . . . . . . . . . . . 99,544 99,496 99,578 99,397 99,340 99,442 * * * 10 . . . . . . . . . . . . . . . . . . 99,497 99,444 99,536 99,348 99,284 99,402 * * * 15 . . . . . . . . . . . . . . . . . . 99,416 99,341 99,479 99,268 99,180 99,346 * * * 20 . . . . . . . . . . . . . . . . . . 99,145 98,977 99,303 99,000 98,813 99,180 * * * 25 . . . . . . . . . . . . . . . . . . 98,793 98,444 99,134 98,637 98,272 98,996 * * * 30 . . . . . . . . . . . . . . . . . . 98,483 97,971 98,985 98,339 97,806 98,863 * * * 35 . . . . . . . . . . . . . . . . . . 98,137 97,493 98,771 97,976 97,303 98,639 * * * 40 . . . . . . . . . . . . . . . . . . 97,639 96,842 98,424 97,452 96,610 98,279 * * * 45 . . . . . . . . . . . . . . . . . . 96,852 95,837 97,858 96,634 95,561 97,698 * * * 50 . . . . . . . . . . . . . . . . . . 95,597 94,256 96,935 95,350 93,939 96,759 * * * 55 . . . . . . . . . . . . . . . . . . 93,602 91,779 95,440 93,337 91,438 95,251 * * * 60 . . . . . . . . . . . . . . . . . . 90,464 87,946 93,035 90,211 87,628 92,848 * * * 65 . . . . . . . . . . . . . . . . . . 85,644 82,144 89,223 85,468 81,945 89,070 * * * 70 . . . . . . . . . . . . . . . . . . 78,426 73,660 83,311 78,401 73,738 83,177 * * * 75 . . . . . . . . . . . . . . . . . . 68,199 61,914 74,474 68,427 62,479 74,364 * * * 80 . . . . . . . . . . . . . . . . . . 54,652 46,993 62,027 55,229 48,210 61,968 * * * 85 . . . . . . . . . . . . . . . . . . 38,355 30,413 46,091 39,298 32,200 46,110 * * * 90 . . . . . . . . . . . . . . . . . . 21,867 15,400 28,556 22,976 17,265 28,652 * * * 95 . . . . . . . . . . . . . . . . . . 9,060 5,388 13,306 9,942 6,666 13,430 * * * 100 . . . . . . . . . . . . . . . . . 2,329 1,098 4,014 2,745 1,596 4,095 * * * 105 . . . . . . . . . . . . . . . . . 301 105 638 396 195 663 * * *
New Jersey
0. . . . . . . . . . . . . . . . . . . 100,000 100,000 100,000 100,000 100,000 100,000 100,000 100,000 100,000 5. . . . . . . . . . . . . . . . . . . 99,267 99,191 99,323 99,414 99,371 99,449 98,480 98,265 98,617 10 . . . . . . . . . . . . . . . . . . 99,211 99,125 99,278 99,367 99,318 99,407 98,383 98,142 98,548 15 . . . . . . . . . . . . . . . . . . 99,143 99,052 99,214 99,307 99,256 99,350 98,271 98,021 98,445 20 . . . . . . . . . . . . . . . . . . 98,914 98,748 99,066 99,094 98,970 99,215 97,931 97,565 98,225 25 . . . . . . . . . . . . . . . . . . 98,505 98,167 98,836 98,721 98,452 98,997 97,289 96,585 97,912 30 . . . . . . . . . . . . . . . . . . 98,043 97,477 98,605 98,355 97,926 98,796 96,457 95,369 97,436 35 . . . . . . . . . . . . . . . . . . 97,490 96,745 98,231 97,891 97,295 98,502 95,400 94,002 96,661 40 . . . . . . . . . . . . . . . . . . 96,774 95,873 97,670 97,276 96,505 98,065 93,944 92,211 95,512 45 . . . . . . . . . . . . . . . . . . 95,755 94,662 96,840 96,378 95,373 97,401 91,934 89,821 93,845 50 . . . . . . . . . . . . . . . . . . 94,247 92,844 95,634 94,994 93,634 96,370 89,109 86,474 91,469 55 . . . . . . . . . . . . . . . . . . 91,972 90,060 93,847 92,857 90,964 94,756 85,167 81,791 88,143 60 . . . . . . . . . . . . . . . . . . 88,529 85,832 91,159 89,581 86,914 92,237 79,747 75,362 83,586 65 . . . . . . . . . . . . . . . . . . 83,379 79,547 87,098 84,651 80,907 88,352 72,511 66,820 77,494 70 . . . . . . . . . . . . . . . . . . 75,904 70,544 81,015 77,453 72,301 82,448 63,158 56,010 69,423 75 . . . . . . . . . . . . . . . . . . 65,490 58,383 72,141 67,389 60,623 73,796 51,700 43,263 59,155 80 . . . . . . . . . . . . . . . . . . 52,015 43,384 59,854 54,296 46,048 61,822 38,858 29,693 46,915 85 . . . . . . . . . . . . . . . . . . 36,121 27,301 44,314 38,677 30,048 46,647 25,720 17,204 33,572 90 . . . . . . . . . . . . . . . . . . 20,349 13,344 27,363 22,789 15,572 29,884 14,218 7,843 20,754 95 . . . . . . . . . . . . . . . . . . 8,327 4,477 12,714 10,074 5,728 14,876 6,111 2,560 10,442 100 . . . . . . . . . . . . . . . . . 2,117 872 3,826 2,912 1,283 5,062 1,860 530 3,948 105 . . . . . . . . . . . . . . . . . 272 80 607 458 144 988 356 60 1,011
New Mexico
0. . . . . . . . . . . . . . . . . . . 100,000 100,000 100,000 100,000 100,000 100,000 100,000 100,000 100,000 5. . . . . . . . . . . . . . . . . . . 99,278 99,118 99,396 99,437 99,467 99,419 98,410 97,940 98,831 10 . . . . . . . . . . . . . . . . . . 99,202 99,030 99,333 99,365 99,389 99,353 98,213 97,718 98,656 15 . . . . . . . . . . . . . . . . . . 99,074 98,884 99,223 99,238 99,251 99,239 98,096 97,636 98,502 20 . . . . . . . . . . . . . . . . . . 98,615 98,198 99,007 98,820 98,617 99,050 97,728 97,332 98,062 25 . . . . . . . . . . . . . . . . . . 97,966 97,233 98,684 98,243 97,748 98,774 96,957 96,622 97,223 30 . . . . . . . . . . . . . . . . . . 97,215 96,147 98,273 97,646 96,929 98,401 96,103 95,827 96,303 35 . . . . . . . . . . . . . . . . . . 96,419 95,061 97,772 96,909 95,947 97,913 95,094 94,842 95,265 40 . . . . . . . . . . . . . . . . . . 95,515 93,887 97,141 96,010 94,787 97,275 93,974 93,706 94,167 45 . . . . . . . . . . . . . . . . . . 94,361 92,422 96,297 94,825 93,261 96,431 92,408 92,089 92,664 50 . . . . . . . . . . . . . . . . . . 92,749 90,402 95,090 93,168 91,092 95,280 90,157 89,780 90,491 55 . . . . . . . . . . . . . . . . . . 90,440 87,500 93,385 90,793 87,987 93,651 86,898 86,413 87,356
See footnotes at end of table.

National Vital Statistics Reports, Vol. 60, No. 9, September 14, 2012 23
Table 1. Survivorship, by age, race, and sex: United States, 50 states, and District of Columbia, 1999–2001—Con.
All races White Black
State and age (years) Total Males Females Total Males Females Total Males Females
New Mexico—Con.
60 . . . . . . . . . . . . . . . . . . 87,141 83,317 90,970 87,398 83,590 91,261 82,190 81,495 82,896 65 . . . . . . . . . . . . . . . . . . 82,387 77,377 87,426 82,527 77,488 87,664 75,514 74,417 76,686 70 . . . . . . . . . . . . . . . . . . 75,574 69,198 82,071 75,634 69,278 82,194 66,403 64,593 68,319 75 . . . . . . . . . . . . . . . . . . 66,081 58,465 73,886 66,210 58,732 73,970 54,862 51,788 57,573 80 . . . . . . . . . . . . . . . . . . 53,438 45,371 61,673 53,976 46,064 62,117 40,854 36,710 44,713 85 . . . . . . . . . . . . . . . . . . 37,858 31,031 44,885 39,228 32,264 46,438 26,183 21,543 30,823 90 . . . . . . . . . . . . . . . . . . 21,527 17,626 25,542 23,812 19,196 28,626 13,431 9,507 17,883 95 . . . . . . . . . . . . . . . . . . 8,543 7,649 9,451 10,942 9,053 12,892 4,990 2,756 8,112 100 . . . . . . . . . . . . . . . . . 1,923 2,264 1,703 3,302 3,082 3,537 1,177 439 2,605 105 . . . . . . . . . . . . . . . . . 187 395 100 541 671 459 150 31 521
New York
0. . . . . . . . . . . . . . . . . . . 100,000 100,000 100,000 100,000 100,000 100,000 100,000 100,000 100,000 5. . . . . . . . . . . . . . . . . . . 99,380 99,197 99,497 99,379 99,301 99,433 98,854 98,685 98,958 10 . . . . . . . . . . . . . . . . . . 99,316 99,122 99,445 99,319 99,232 99,384 98,769 98,586 98,888 15 . . . . . . . . . . . . . . . . . . 99,236 99,032 99,376 99,248 99,150 99,323 98,662 98,459 98,803 20 . . . . . . . . . . . . . . . . . . 98,989 98,687 99,232 99,011 98,825 99,181 98,341 97,993 98,627 25 . . . . . . . . . . . . . . . . . . 98,613 98,127 99,041 98,660 98,314 98,997 97,788 97,111 98,376 30 . . . . . . . . . . . . . . . . . . 98,197 97,524 98,808 98,295 97,796 98,787 97,165 96,208 97,992 35 . . . . . . . . . . . . . . . . . . 97,704 96,875 98,469 97,840 97,183 98,492 96,308 95,044 97,396 40 . . . . . . . . . . . . . . . . . . 97,017 96,018 97,951 97,195 96,356 98,033 95,100 93,429 96,540 45 . . . . . . . . . . . . . . . . . . 95,988 94,750 97,156 96,229 95,132 97,326 93,350 91,088 95,299 50 . . . . . . . . . . . . . . . . . . 94,426 92,831 95,938 94,750 93,272 96,224 90,866 87,825 93,478 55 . . . . . . . . . . . . . . . . . . 92,067 89,936 94,086 92,503 90,466 94,519 87,375 83,300 90,829 60 . . . . . . . . . . . . . . . . . . 88,546 85,628 91,294 89,126 86,294 91,903 82,521 77,123 87,023 65 . . . . . . . . . . . . . . . . . . 83,377 79,363 87,143 84,136 80,225 87,942 75,865 68,909 81,653 70 . . . . . . . . . . . . . . . . . . 75,990 70,570 81,040 76,981 71,692 82,075 67,089 58,438 74,275 75 . . . . . . . . . . . . . . . . . . 65,933 58,880 72,397 67,145 60,299 73,617 56,142 45,915 64,535 80 . . . . . . . . . . . . . . . . . . 53,148 44,576 60,803 54,490 46,240 62,041 43,379 32,287 52,406 85 . . . . . . . . . . . . . . . . . . 38,184 29,128 46,454 39,459 30,835 47,449 29,738 19,347 38,539 90 . . . . . . . . . . . . . . . . . . 23,066 15,273 30,736 24,032 16,686 31,240 17,159 9,230 24,533 95 . . . . . . . . . . . . . . . . . . 10,774 5,796 16,385 11,297 6,643 16,370 7,751 3,199 12,689 100 . . . . . . . . . . . . . . . . . 3,465 1,384 6,352 3,634 1,702 6,100 2,488 715 4,890 105 . . . . . . . . . . . . . . . . . 658 174 1,556 681 236 1,384 502 89 1,252
North Carolina
0. . . . . . . . . . . . . . . . . . . 100,000 100,000 100,000 100,000 100,000 100,000 100,000 100,000 100,000 5. . . . . . . . . . . . . . . . . . . 99,010 98,895 99,089 99,317 99,158 99,423 98,289 98,105 98,397 10 . . . . . . . . . . . . . . . . . . 98,923 98,798 99,014 99,237 99,068 99,353 98,189 97,993 98,308 15 . . . . . . . . . . . . . . . . . . 98,812 98,658 98,933 99,124 98,927 99,271 98,081 97,855 98,233 20 . . . . . . . . . . . . . . . . . . 98,441 98,162 98,696 98,778 98,486 99,028 97,656 97,218 98,021 25 . . . . . . . . . . . . . . . . . . 97,928 97,418 98,440 98,320 97,830 98,804 96,959 96,160 97,669 30 . . . . . . . . . . . . . . . . . . 97,439 96,730 98,163 97,902 97,229 98,589 96,201 95,088 97,196 35 . . . . . . . . . . . . . . . . . . 96,856 95,975 97,758 97,403 96,571 98,262 95,148 93,589 96,547 40 . . . . . . . . . . . . . . . . . . 96,019 94,919 97,143 96,681 95,644 97,756 93,486 91,161 95,577 45 . . . . . . . . . . . . . . . . . . 94,767 93,350 96,207 95,594 94,259 96,976 91,064 87,614 94,184 50 . . . . . . . . . . . . . . . . . . 92,894 91,011 94,789 93,946 92,176 95,769 87,756 82,905 92,174 55 . . . . . . . . . . . . . . . . . . 90,107 87,562 92,658 91,462 89,070 93,914 83,278 76,826 89,301 60 . . . . . . . . . . . . . . . . . . 86,027 82,564 89,486 87,768 84,512 91,088 77,421 69,194 85,246 65 . . . . . . . . . . . . . . . . . . 80,192 75,508 84,839 82,387 77,981 86,846 69,941 59,906 79,629 70 . . . . . . . . . . . . . . . . . . 72,117 65,934 78,195 74,794 68,982 80,631 60,734 49,053 72,061 75 . . . . . . . . . . . . . . . . . . 61,494 53,699 69,040 64,380 57,028 71,649 49,855 37,077 62,265 80 . . . . . . . . . . . . . . . . . . 48,523 39,400 57,109 51,117 42,464 59,382 37,728 24,944 50,305 85 . . . . . . . . . . . . . . . . . . 33,948 24,757 42,817 35,662 26,958 44,108 25,261 14,146 36,880 90 . . . . . . . . . . . . . . . . . . 19,877 12,392 27,710 20,414 13,464 27,625 14,159 6,243 23,519 95 . . . . . . . . . . . . . . . . . . 8,979 4,470 14,429 8,679 4,721 13,322 6,153 1,913 12,304 100 . . . . . . . . . . . . . . . . . 2,800 1,016 5,478 2,385 996 4,342 1,870 348 4,878 105 . . . . . . . . . . . . . . . . . 522 123 1,328 353 104 801 348 31 1,320
See footnotes at end of table.

24 National Vital Statistics Reports, Vol. 60, No. 9, September 14, 2012
Table 1. Survivorship, by age, race, and sex: United States, 50 states, and District of Columbia, 1999–2001—Con.
All races White Black
State and age (years) Total Males Females Total Males Females Total Males Females
North Dakota
0. . . . . . . . . . . . . . . . . . . 100,000 100,000 100,000 100,000 100,000 100,000 * * * 5. . . . . . . . . . . . . . . . . . . 99,236 99,148 99,316 99,259 99,090 99,400 * * * 10 . . . . . . . . . . . . . . . . . . 99,189 99,089 99,283 99,221 99,039 99,376 * * * 15 . . . . . . . . . . . . . . . . . . 99,086 98,955 99,213 99,131 98,922 99,314 * * * 20 . . . . . . . . . . . . . . . . . . 98,788 98,563 99,015 98,853 98,567 99,119 * * * 25 . . . . . . . . . . . . . . . . . . 98,393 98,001 98,810 98,525 98,102 98,948 * * * 30 . . . . . . . . . . . . . . . . . . 98,008 97,446 98,614 98,183 97,595 98,790 * * * 35 . . . . . . . . . . . . . . . . . . 97,585 96,883 98,341 97,802 97,076 98,557 * * * 40 . . . . . . . . . . . . . . . . . . 97,021 96,177 97,922 97,271 96,389 98,189 * * * 45 . . . . . . . . . . . . . . . . . . 96,179 95,149 97,271 96,482 95,402 97,604 * * * 50 . . . . . . . . . . . . . . . . . . 94,872 93,566 96,265 95,252 93,893 96,677 * * * 55 . . . . . . . . . . . . . . . . . . 92,847 91,107 94,715 93,334 91,559 95,218 * * * 60 . . . . . . . . . . . . . . . . . . 89,750 87,324 92,346 90,378 87,970 92,938 * * * 65 . . . . . . . . . . . . . . . . . . 85,115 81,622 88,771 85,910 82,550 89,416 * * * 70 . . . . . . . . . . . . . . . . . . 78,356 73,311 83,519 79,298 74,617 84,082 * * * 75 . . . . . . . . . . . . . . . . . . 68,798 61,825 75,887 69,874 63,572 76,250 * * * 80 . . . . . . . . . . . . . . . . . . 56,217 47,225 65,261 57,357 49,356 65,294 * * * 85 . . . . . . . . . . . . . . . . . . 40,956 30,922 51,504 42,035 33,157 51,092 * * * 90 . . . . . . . . . . . . . . . . . . 25,006 15,983 35,582 25,855 17,833 34,739 * * * 95 . . . . . . . . . . . . . . . . . . 11,694 5,789 20,052 12,188 6,860 19,027 * * * 100 . . . . . . . . . . . . . . . . . 3,691 1,247 8,318 3,872 1,614 7,518 * * * 105 . . . . . . . . . . . . . . . . . 665 129 2,202 698 189 1,838 * * *
Ohio
0. . . . . . . . . . . . . . . . . . . 100,000 100,000 100,000 100,000 100,000 100,000 100,000 100,000 100,000 5. . . . . . . . . . . . . . . . . . . 99,111 99,000 99,190 99,265 99,183 99,325 98,311 98,204 98,397 10 . . . . . . . . . . . . . . . . . . 99,035 98,913 99,126 99,192 99,098 99,264 98,218 98,093 98,324 15 . . . . . . . . . . . . . . . . . . 98,943 98,803 99,052 99,102 98,991 99,192 98,106 97,962 98,231 20 . . . . . . . . . . . . . . . . . . 98,645 98,391 98,873 98,820 98,608 99,015 97,702 97,356 98,035 25 . . . . . . . . . . . . . . . . . . 98,236 97,782 98,665 98,435 98,038 98,818 97,105 96,427 97,746 30 . . . . . . . . . . . . . . . . . . 97,818 97,212 98,400 98,070 97,548 98,580 96,371 95,339 97,333 35 . . . . . . . . . . . . . . . . . . 97,307 96,581 98,008 97,601 96,949 98,243 95,412 94,009 96,718 40 . . . . . . . . . . . . . . . . . . 96,577 95,686 97,441 96,926 96,090 97,753 94,011 92,104 95,767 45 . . . . . . . . . . . . . . . . . . 95,481 94,327 96,608 95,893 94,781 96,999 91,929 89,324 94,318 50 . . . . . . . . . . . . . . . . . . 93,822 92,252 95,363 94,307 92,785 95,827 89,013 85,571 92,178 55 . . . . . . . . . . . . . . . . . . 91,310 89,118 93,472 91,882 89,769 93,999 84,996 80,592 89,048 60 . . . . . . . . . . . . . . . . . . 87,541 84,458 90,576 88,227 85,283 91,167 79,547 74,096 84,537 65 . . . . . . . . . . . . . . . . . . 81,965 77,703 86,140 82,821 78,771 86,838 72,274 65,800 78,184 70 . . . . . . . . . . . . . . . . . . 73,945 68,287 79,434 75,075 69,702 80,343 62,849 55,528 69,533 75 . . . . . . . . . . . . . . . . . . 62,927 55,927 69,625 64,416 57,595 70,985 51,222 43,425 58,331 80 . . . . . . . . . . . . . . . . . . 48,913 41,125 56,148 50,839 42,794 58,317 37,919 30,269 44,869 85 . . . . . . . . . . . . . . . . . . 32,833 25,686 39,525 35,117 27,021 42,743 24,261 17,713 30,370 90 . . . . . . . . . . . . . . . . . . 17,533 12,572 22,353 19,779 13,344 26,242 12,499 7,952 17,056 95 . . . . . . . . . . . . . . . . . . 6,597 4,305 8,949 8,197 4,581 12,290 4,691 2,401 7,322 100 . . . . . . . . . . . . . . . . . 1,474 886 2,112 2,166 932 3,842 1,119 406 2,151 105 . . . . . . . . . . . . . . . . . 156 90 230 302 92 669 143 30 375
Oklahoma
0. . . . . . . . . . . . . . . . . . . 100,000 100,000 100,000 100,000 100,000 100,000 100,000 100,000 100,000 5. . . . . . . . . . . . . . . . . . . 99,049 98,941 99,142 99,103 98,985 99,196 98,817 98,387 99,094 10 . . . . . . . . . . . . . . . . . . 98,949 98,843 99,041 98,999 98,878 99,094 98,688 98,271 98,952 15 . . . . . . . . . . . . . . . . . . 98,810 98,658 98,951 98,863 98,696 99,006 98,529 98,086 98,819 20 . . . . . . . . . . . . . . . . . . 98,417 98,150 98,680 98,463 98,176 98,735 98,008 97,349 98,534 25 . . . . . . . . . . . . . . . . . . 97,890 97,396 98,400 97,950 97,454 98,450 97,304 96,310 98,190 30 . . . . . . . . . . . . . . . . . . 97,346 96,626 98,093 97,432 96,712 98,169 96,659 95,442 97,782 35 . . . . . . . . . . . . . . . . . . 96,697 95,790 97,640 96,766 95,848 97,712 95,824 94,370 97,195 40 . . . . . . . . . . . . . . . . . . 95,801 94,688 96,954 95,850 94,708 97,027 94,533 92,819 96,165 45 . . . . . . . . . . . . . . . . . . 94,482 93,089 95,918 94,529 93,087 96,012 92,623 90,549 94,616 50 . . . . . . . . . . . . . . . . . . 92,517 90,719 94,362 92,570 90,705 94,487 89,835 87,270 92,323 55 . . . . . . . . . . . . . . . . . . 89,612 87,227 92,041 89,687 87,223 92,210 85,824 82,606 88,963
See footnotes at end of table.

National Vital Statistics Reports, Vol. 60, No. 9, September 14, 2012 25
Table 1. Survivorship, by age, race, and sex: United States, 50 states, and District of Columbia, 1999–2001—Con.
All races White Black
State and age (years) Total Males Females Total Males Females Total Males Females
Oklahoma—Con.
60 . . . . . . . . . . . . . . . . . . 85,370 82,165 88,618 85,499 82,215 88,847 80,178 76,127 84,113 65 . . . . . . . . . . . . . . . . . . 79,320 75,021 83,655 79,542 75,193 83,962 72,461 67,429 77,282 70 . . . . . . . . . . . . . . . . . . 71,001 65,336 76,659 71,404 65,776 77,084 62,365 56,328 68,010 75 . . . . . . . . . . . . . . . . . . 60,057 52,989 67,059 60,644 53,721 67,565 49,909 43,175 56,102 80 . . . . . . . . . . . . . . . . . . 46,719 38,620 54,641 47,414 39,566 55,135 35,907 29,186 42,023 85 . . . . . . . . . . . . . . . . . . 31,961 24,015 39,985 32,633 24,987 40,341 22,062 16,453 27,289 90 . . . . . . . . . . . . . . . . . . 18,072 11,830 24,902 18,575 12,589 25,031 10,789 7,158 14,379 95 . . . . . . . . . . . . . . . . . . 7,739 4,166 12,214 8,003 4,577 12,147 3,813 2,167 5,608 100 . . . . . . . . . . . . . . . . . 2,229 915 4,235 2,312 1,051 4,116 858 399 1,431 105 . . . . . . . . . . . . . . . . . 370 105 898 382 129 837 105 38 204
Oregon
0. . . . . . . . . . . . . . . . . . . 100,000 100,000 100,000 100,000 100,000 100,000 100,000 100,000 100,000 5. . . . . . . . . . . . . . . . . . . 99,343 99,252 99,413 99,341 99,253 99,408 99,100 98,732 99,389 10 . . . . . . . . . . . . . . . . . . 99,261 99,173 99,329 99,253 99,168 99,317 98,989 98,588 99,313 15 . . . . . . . . . . . . . . . . . . 99,170 99,056 99,265 99,160 99,048 99,253 98,851 98,412 99,213 20 . . . . . . . . . . . . . . . . . . 98,882 98,662 99,090 98,871 98,656 99,074 98,447 97,837 99,005 25 . . . . . . . . . . . . . . . . . . 98,519 98,106 98,929 98,508 98,103 98,912 97,827 96,947 98,707 30 . . . . . . . . . . . . . . . . . . 98,126 97,546 98,718 98,123 97,565 98,694 97,125 96,059 98,236 35 . . . . . . . . . . . . . . . . . . 97,666 96,950 98,407 97,653 96,955 98,375 96,237 95,038 97,541 40 . . . . . . . . . . . . . . . . . . 97,034 96,151 97,945 96,988 96,121 97,886 95,060 93,638 96,648 45 . . . . . . . . . . . . . . . . . . 96,092 94,965 97,249 96,007 94,893 97,151 93,360 91,630 95,360 50 . . . . . . . . . . . . . . . . . . 94,651 93,163 96,174 94,513 93,039 96,024 90,886 88,711 93,512 55 . . . . . . . . . . . . . . . . . . 92,441 90,437 94,495 92,245 90,256 94,287 87,355 84,524 90,860 60 . . . . . . . . . . . . . . . . . . 89,080 86,366 91,864 88,838 86,138 91,611 82,416 78,641 87,082 65 . . . . . . . . . . . . . . . . . . 84,046 80,416 87,771 83,797 80,172 87,525 75,652 70,625 81,782 70 . . . . . . . . . . . . . . . . . . 76,769 72,091 81,523 76,504 71,869 81,229 66,736 60,187 74,531 75 . . . . . . . . . . . . . . . . . . 66,587 60,858 72,319 66,294 60,660 71,946 55,469 47,472 64,982 80 . . . . . . . . . . . . . . . . . . 53,277 46,815 59,559 52,963 46,639 59,121 42,524 33,424 53,090 85 . . . . . . . . . . . . . . . . . . 37,474 31,245 43,530 37,169 31,095 43,075 28,774 19,952 39,446 90 . . . . . . . . . . . . . . . . . . 21,584 16,834 26,323 21,336 16,720 25,934 16,274 9,396 25,541 95 . . . . . . . . . . . . . . . . . . 9,168 6,604 11,846 9,017 6,535 11,601 7,138 3,167 13,574 100 . . . . . . . . . . . . . . . . . 2,476 1,638 3,404 2,417 1,611 3,307 2,199 673 5,457 105 . . . . . . . . . . . . . . . . . 349 214 507 337 208 488 420 77 1,489
Pennsylvania
0. . . . . . . . . . . . . . . . . . . 100,000 100,000 100,000 100,000 100,000 100,000 100,000 100,000 100,000 5. . . . . . . . . . . . . . . . . . . 99,177 99,083 99,246 99,319 99,226 99,387 98,277 98,143 98,371 10 . . . . . . . . . . . . . . . . . . 99,095 98,996 99,168 99,237 99,143 99,307 98,192 98,037 98,309 15 . . . . . . . . . . . . . . . . . . 99,011 98,894 99,104 99,162 99,049 99,251 98,050 97,869 98,192 20 . . . . . . . . . . . . . . . . . . 98,699 98,451 98,928 98,869 98,644 99,075 97,573 97,111 98,007 25 . . . . . . . . . . . . . . . . . . 98,201 97,680 98,706 98,420 97,963 98,861 96,640 95,527 97,694 30 . . . . . . . . . . . . . . . . . . 97,706 96,953 98,446 98,007 97,378 98,623 95,730 94,142 97,236 35 . . . . . . . . . . . . . . . . . . 97,189 96,261 98,104 97,531 96,753 98,298 94,614 92,580 96,538 40 . . . . . . . . . . . . . . . . . . 96,468 95,377 97,543 96,855 95,908 97,791 93,191 90,783 95,460 45 . . . . . . . . . . . . . . . . . . 95,403 94,070 96,721 95,850 94,644 97,048 91,200 88,338 93,883 50 . . . . . . . . . . . . . . . . . . 93,792 92,080 95,492 94,327 92,719 95,936 88,336 84,857 91,589 55 . . . . . . . . . . . . . . . . . . 91,356 89,064 93,637 92,024 89,814 94,244 84,284 79,946 88,313 60 . . . . . . . . . . . . . . . . . . 87,707 84,561 90,822 88,569 85,492 91,645 78,688 73,183 83,731 65 . . . . . . . . . . . . . . . . . . 82,318 78,004 86,565 83,447 79,211 87,660 71,174 64,207 77,486 70 . . . . . . . . . . . . . . . . . . 74,601 68,810 80,223 76,071 70,401 81,634 61,448 52,920 69,069 75 . . . . . . . . . . . . . . . . . . 64,032 56,656 71,067 65,884 58,702 72,797 49,694 39,803 58,518 80 . . . . . . . . . . . . . . . . . . 50,576 41,970 58,570 52,748 44,402 60,534 36,650 26,210 46,163 85 . . . . . . . . . . . . . . . . . . 34,979 26,478 43,030 37,231 28,980 45,003 23,652 14,253 32,914 90 . . . . . . . . . . . . . . . . . . 19,720 13,132 26,379 21,635 15,172 28,015 12,641 5,907 20,358 95 . . . . . . . . . . . . . . . . . . 8,163 4,574 12,215 9,359 5,746 13,225 5,203 1,678 10,331 100 . . . . . . . . . . . . . . . . . 2,143 960 3,701 2,614 1,369 4,099 1,502 285 3,994 105 . . . . . . . . . . . . . . . . . 294 100 603 390 171 685 271 25 1,069
See footnotes at end of table.

26 National Vital Statistics Reports, Vol. 60, No. 9, September 14, 2012
Table 1. Survivorship, by age, race, and sex: United States, 50 states, and District of Columbia, 1999–2001—Con.
All races White Black
State and age (years) Total Males Females Total Males Females Total Males Females
Rhode Island
0. . . . . . . . . . . . . . . . . . . 100,000 100,000 100,000 100,000 100,000 100,000 100,000 100,000 100,000 5. . . . . . . . . . . . . . . . . . . 99,282 99,267 99,292 99,603 99,662 99,565 99,110 98,953 99,231 10 . . . . . . . . . . . . . . . . . . 99,202 99,172 99,226 99,533 99,581 99,507 98,993 98,814 99,137 15 . . . . . . . . . . . . . . . . . . 99,137 99,101 99,169 99,465 99,503 99,449 98,850 98,652 99,014 20 . . . . . . . . . . . . . . . . . . 98,912 98,773 99,049 99,256 99,208 99,330 98,538 98,256 98,790 25 . . . . . . . . . . . . . . . . . . 98,586 98,305 98,862 98,942 98,772 99,136 98,050 97,606 98,463 30 . . . . . . . . . . . . . . . . . . 98,234 97,818 98,642 98,599 98,299 98,920 97,420 96,823 97,984 35 . . . . . . . . . . . . . . . . . . 97,813 97,260 98,352 98,169 97,726 98,626 96,573 95,818 97,293 40 . . . . . . . . . . . . . . . . . . 97,172 96,465 97,860 97,516 96,865 98,174 95,380 94,415 96,305 45 . . . . . . . . . . . . . . . . . . 96,199 95,259 97,112 96,528 95,587 97,467 93,678 92,425 94,900 50 . . . . . . . . . . . . . . . . . . 94,715 93,423 95,970 95,024 93,666 96,365 91,243 89,579 92,911 55 . . . . . . . . . . . . . . . . . . 92,454 90,647 94,225 92,738 90,805 94,654 87,812 85,561 90,104 60 . . . . . . . . . . . . . . . . . . 89,071 86,509 91,572 89,332 86,601 92,024 83,094 79,995 86,170 65 . . . . . . . . . . . . . . . . . . 84,090 80,475 87,583 84,341 80,557 88,034 76,749 72,488 80,719 70 . . . . . . . . . . . . . . . . . . 76,991 72,050 81,701 77,311 72,195 82,238 68,328 62,760 73,318 75 . . . . . . . . . . . . . . . . . . 67,233 60,680 73,304 67,574 60,844 73,867 57,637 50,855 63,600 80 . . . . . . . . . . . . . . . . . . 54,615 46,482 61,907 54,851 46,586 62,319 44,850 37,448 51,506 85 . . . . . . . . . . . . . . . . . . 39,593 30,798 47,613 39,578 30,774 47,647 31,054 24,036 37,652 90 . . . . . . . . . . . . . . . . . . 24,144 16,391 31,730 23,830 16,248 31,250 18,147 12,692 23,652 95 . . . . . . . . . . . . . . . . . . 11,367 6,304 17,021 10,915 6,144 16,195 8,314 5,098 11,895 100 . . . . . . . . . . . . . . . . . 3,665 1,515 6,614 3,338 1,431 5,889 2,701 1,406 4,340 105 . . . . . . . . . . . . . . . . . 690 189 1,611 572 169 1,275 546 234 1,007
South Carolina
0. . . . . . . . . . . . . . . . . . . 100,000 100,000 100,000 100,000 100,000 100,000 100,000 100,000 100,000 5. . . . . . . . . . . . . . . . . . . 98,940 98,835 99,017 99,333 99,373 99,320 98,299 98,076 98,441 10 . . . . . . . . . . . . . . . . . . 98,839 98,724 98,927 99,244 99,288 99,228 98,178 97,921 98,354 15 . . . . . . . . . . . . . . . . . . 98,718 98,574 98,837 99,126 99,149 99,133 98,048 97,749 98,268 20 . . . . . . . . . . . . . . . . . . 98,302 97,994 98,593 98,695 98,550 98,881 97,658 97,202 98,034 25 . . . . . . . . . . . . . . . . . . 97,712 97,119 98,299 98,198 97,843 98,615 96,878 95,957 97,685 30 . . . . . . . . . . . . . . . . . . 97,081 96,237 97,923 97,699 97,135 98,339 95,977 94,671 97,125 35 . . . . . . . . . . . . . . . . . . 96,375 95,320 97,428 97,122 96,366 97,964 94,930 93,233 96,421 40 . . . . . . . . . . . . . . . . . . 95,401 94,116 96,683 96,323 95,351 97,392 93,534 91,435 95,378 45 . . . . . . . . . . . . . . . . . . 93,997 92,366 95,615 95,173 93,872 96,578 91,551 88,903 93,882 50 . . . . . . . . . . . . . . . . . . 91,942 89,785 94,070 93,455 91,659 95,358 88,702 85,287 91,722 55 . . . . . . . . . . . . . . . . . . 88,931 86,009 91,818 90,879 88,370 93,503 84,644 80,209 88,627 60 . . . . . . . . . . . . . . . . . . 84,574 80,589 88,527 87,047 83,564 90,670 79,022 73,254 84,246 65 . . . . . . . . . . . . . . . . . . 78,401 73,027 83,743 81,464 76,713 86,378 71,450 64,078 78,171 70 . . . . . . . . . . . . . . . . . . 69,924 62,924 76,903 73,568 67,319 80,012 61,689 52,618 69,995 75 . . . . . . . . . . . . . . . . . . 58,899 50,276 67,431 62,915 55,172 70,804 49,931 39,401 59,475 80 . . . . . . . . . . . . . . . . . . 45,584 35,894 55,025 49,563 40,788 58,242 36,763 25,815 46,804 85 . . . . . . . . . . . . . . . . . . 30,901 21,703 40,174 34,251 25,849 42,675 23,546 13,965 32,941 90 . . . . . . . . . . . . . . . . . . 17,179 10,301 24,732 19,387 13,050 26,089 12,353 5,762 19,733 95 . . . . . . . . . . . . . . . . . . 7,133 3,457 11,764 8,138 4,738 12,068 4,897 1,632 9,394 100 . . . . . . . . . . . . . . . . . 1,945 715 3,819 2,204 1,079 3,670 1,321 278 3,239 105 . . . . . . . . . . . . . . . . . 294 77 716 321 130 607 212 24 717
South Dakota
0. . . . . . . . . . . . . . . . . . . 100,000 100,000 100,000 100,000 100,000 100,000 * * * 5. . . . . . . . . . . . . . . . . . . 99,117 99,037 99,192 99,344 99,330 99,381 * * * 10 . . . . . . . . . . . . . . . . . . 99,011 98,942 99,074 99,239 99,219 99,283 * * * 15 . . . . . . . . . . . . . . . . . . 98,832 98,751 98,909 99,055 98,983 99,154 * * * 20 . . . . . . . . . . . . . . . . . . 98,435 98,149 98,729 98,726 98,492 98,996 * * * 25 . . . . . . . . . . . . . . . . . . 97,933 97,387 98,504 98,353 97,939 98,814 * * * 30 . . . . . . . . . . . . . . . . . . 97,451 96,751 98,184 97,962 97,427 98,550 * * * 35 . . . . . . . . . . . . . . . . . . 96,920 96,093 97,790 97,526 96,878 98,234 * * * 40 . . . . . . . . . . . . . . . . . . 96,213 95,201 97,271 96,940 96,155 97,788 * * * 45 . . . . . . . . . . . . . . . . . . 95,191 93,890 96,551 96,101 95,090 97,183 * * * 50 . . . . . . . . . . . . . . . . . . 93,683 91,944 95,513 94,835 93,467 96,300 * * * 55 . . . . . . . . . . . . . . . . . . 91,449 89,079 93,973 92,904 90,988 94,968 * * *
See footnotes at end of table.

National Vital Statistics Reports, Vol. 60, No. 9, September 14, 2012 27
Table 1. Survivorship, by age, race, and sex: United States, 50 states, and District of Columbia, 1999–2001—Con.
All races White Black
State and age (years) Total Males Females Total Males Females Total Males Females
South Dakota—Con.
60 . . . . . . . . . . . . . . . . . . 88,185 84,914 91,652 89,988 87,242 92,918 * * * 65 . . . . . . . . . . . . . . . . . . 83,449 78,989 88,136 85,615 81,689 89,736 * * * 70 . . . . . . . . . . . . . . . . . . 76,721 70,784 82,854 79,211 73,679 84,888 * * * 75 . . . . . . . . . . . . . . . . . . 67,340 59,838 75,103 69,974 62,649 77,494 * * * 80 . . . . . . . . . . . . . . . . . . 55,110 46,290 64,225 57,527 48,601 66,673 * * * 85 . . . . . . . . . . . . . . . . . . 40,386 31,327 50,062 42,088 32,724 52,028 * * * 90 . . . . . . . . . . . . . . . . . . 24,992 17,369 33,719 25,627 17,756 34,630 * * * 95 . . . . . . . . . . . . . . . . . . 11,983 7,188 18,096 11,744 6,975 17,859 * * * 100 . . . . . . . . . . . . . . . . . 3,939 1,955 6,870 3,501 1,711 6,178 * * * 105 . . . . . . . . . . . . . . . . . 752 297 1,562 557 216 1,169 * * *
Tennessee
0. . . . . . . . . . . . . . . . . . . 100,000 100,000 100,000 100,000 100,000 100,000 100,000 100,000 100,000 5. . . . . . . . . . . . . . . . . . . 99,126 98,924 99,249 99,371 99,531 99,291 98,352 97,964 98,557 10 . . . . . . . . . . . . . . . . . . 99,037 98,821 99,175 99,294 99,441 99,226 98,209 97,801 98,436 15 . . . . . . . . . . . . . . . . . . 98,904 98,667 99,063 99,168 99,295 99,123 98,032 97,610 98,275 20 . . . . . . . . . . . . . . . . . . 98,471 98,063 98,813 98,757 98,739 98,865 97,547 96,908 98,010 25 . . . . . . . . . . . . . . . . . . 97,868 97,190 98,488 98,231 97,985 98,578 96,683 95,587 97,572 30 . . . . . . . . . . . . . . . . . . 97,263 96,342 98,132 97,702 97,258 98,255 95,768 94,257 97,038 35 . . . . . . . . . . . . . . . . . . 96,597 95,478 97,668 97,094 96,463 97,842 94,656 92,750 96,279 40 . . . . . . . . . . . . . . . . . . 95,693 94,348 96,990 96,245 95,386 97,222 93,165 90,836 95,164 45 . . . . . . . . . . . . . . . . . . 94,359 92,695 95,970 94,990 93,813 96,285 91,073 88,224 93,534 50 . . . . . . . . . . . . . . . . . . 92,363 90,234 94,438 93,103 91,461 94,866 88,069 84,523 91,168 55 . . . . . . . . . . . . . . . . . . 89,393 86,596 92,149 90,290 87,982 92,731 83,804 79,355 87,772 60 . . . . . . . . . . . . . . . . . . 85,055 81,314 88,767 86,165 82,924 89,554 77,946 72,324 82,972 65 . . . . . . . . . . . . . . . . . . 78,870 73,862 83,853 80,254 75,766 84,897 70,128 63,110 76,345 70 . . . . . . . . . . . . . . . . . . 70,365 63,791 76,866 72,093 66,036 78,260 60,096 51,683 67,507 75 . . . . . . . . . . . . . . . . . . 59,227 51,043 67,235 61,276 53,596 68,940 48,003 38,599 56,303 80 . . . . . . . . . . . . . . . . . . 45,795 36,414 54,745 48,002 39,082 56,583 34,707 25,239 43,110 85 . . . . . . . . . . . . . . . . . . 31,012 21,897 39,981 33,067 24,298 41,647 21,658 13,651 29,152 90 . . . . . . . . . . . . . . . . . . 17,246 10,245 24,791 18,788 11,951 25,958 10,955 5,651 16,486 95 . . . . . . . . . . . . . . . . . . 7,194 3,339 12,058 8,037 4,191 12,600 4,128 1,616 7,232 100 . . . . . . . . . . . . . . . . . 1,990 655 4,119 2,283 912 4,231 1,039 280 2,226 105 . . . . . . . . . . . . . . . . . 312 65 852 365 104 838 152 25 422
Texas
0. . . . . . . . . . . . . . . . . . . 100,000 100,000 100,000 100,000 100,000 100,000 100,000 100,000 100,000 5. . . . . . . . . . . . . . . . . . . 99,326 99,185 99,420 99,340 99,270 99,392 98,632 98,417 98,781 10 . . . . . . . . . . . . . . . . . . 99,241 99,084 99,351 99,255 99,173 99,320 98,512 98,274 98,683 15 . . . . . . . . . . . . . . . . . . 99,134 98,960 99,261 99,152 99,052 99,236 98,383 98,119 98,583 20 . . . . . . . . . . . . . . . . . . 98,778 98,475 99,045 98,790 98,564 99,011 97,990 97,575 98,347 25 . . . . . . . . . . . . . . . . . . 98,296 97,779 98,795 98,329 97,886 98,786 97,348 96,648 97,986 30 . . . . . . . . . . . . . . . . . . 97,840 97,132 98,540 97,897 97,279 98,541 96,639 95,691 97,514 35 . . . . . . . . . . . . . . . . . . 97,323 96,457 98,188 97,390 96,604 98,213 95,773 94,594 96,868 40 . . . . . . . . . . . . . . . . . . 96,590 95,535 97,651 96,683 95,694 97,719 94,548 93,085 95,910 45 . . . . . . . . . . . . . . . . . . 95,480 94,154 96,820 95,613 94,343 96,942 92,728 90,880 94,463 50 . . . . . . . . . . . . . . . . . . 93,792 92,066 95,538 93,988 92,308 95,739 90,062 87,673 92,311 55 . . . . . . . . . . . . . . . . . . 91,240 88,935 93,572 91,535 89,271 93,883 86,204 83,082 89,146 60 . . . . . . . . . . . . . . . . . . 87,435 84,313 90,587 87,880 84,805 91,050 80,738 76,658 84,560 65 . . . . . . . . . . . . . . . . . . 81,882 77,657 86,126 82,542 78,392 86,787 73,206 67,972 78,069 70 . . . . . . . . . . . . . . . . . . 74,037 68,429 79,630 74,973 69,506 80,516 63,264 56,813 69,199 75 . . . . . . . . . . . . . . . . . . 63,467 56,352 70,451 64,688 57,844 71,509 50,987 43,515 57,698 80 . . . . . . . . . . . . . . . . . . 50,193 41,875 58,201 51,629 43,741 59,292 37,031 29,319 43,910 85 . . . . . . . . . . . . . . . . . . 35,011 26,656 43,256 36,466 28,650 44,157 23,047 16,396 29,188 90 . . . . . . . . . . . . . . . . . . 20,210 13,482 27,351 21,401 15,167 27,852 11,463 7,021 15,910 95 . . . . . . . . . . . . . . . . . . 8,813 4,875 13,554 9,527 5,887 13,638 4,143 2,066 6,513 100 . . . . . . . . . . . . . . . . . 2,559 1,093 4,687 2,833 1,469 4,577 959 363 1,778 105 . . . . . . . . . . . . . . . . . 419 127 966 475 199 889 121 32 278
See footnotes at end of table.

28 National Vital Statistics Reports, Vol. 60, No. 9, September 14, 2012
Table 1. Survivorship, by age, race, and sex: United States, 50 states, and District of Columbia, 1999–2001—Con.
All races White Black
State and age (years) Total Males Females Total Males Females Total Males Females
Utah
0. . . . . . . . . . . . . . . . . . . 100,000 100,000 100,000 100,000 100,000 100,000 * * * 5. . . . . . . . . . . . . . . . . . . 99,398 99,311 99,471 99,407 99,319 99,479 * * * 10 . . . . . . . . . . . . . . . . . . 99,333 99,234 99,418 99,342 99,243 99,426 * * * 15 . . . . . . . . . . . . . . . . . . 99,244 99,113 99,362 99,251 99,116 99,372 * * * 20 . . . . . . . . . . . . . . . . . . 98,954 98,704 99,190 98,962 98,711 99,200 * * * 25 . . . . . . . . . . . . . . . . . . 98,591 98,164 99,007 98,631 98,223 99,026 * * * 30 . . . . . . . . . . . . . . . . . . 98,151 97,572 98,732 98,254 97,737 98,767 * * * 35 . . . . . . . . . . . . . . . . . . 97,627 96,927 98,340 97,693 97,050 98,344 * * * 40 . . . . . . . . . . . . . . . . . . 96,942 96,115 97,789 96,997 96,185 97,825 * * * 45 . . . . . . . . . . . . . . . . . . 95,981 94,971 97,017 96,073 95,052 97,117 * * * 50 . . . . . . . . . . . . . . . . . . 94,589 93,285 95,929 94,741 93,414 96,101 * * * 55 . . . . . . . . . . . . . . . . . . 92,550 90,780 94,368 92,762 90,982 94,588 * * * 60 . . . . . . . . . . . . . . . . . . 89,554 87,088 92,076 89,793 87,363 92,277 * * * 65 . . . . . . . . . . . . . . . . . . 85,158 81,740 88,627 85,354 82,048 88,708 * * * 70 . . . . . . . . . . . . . . . . . . 78,726 74,154 83,346 78,925 74,471 83,425 * * * 75 . . . . . . . . . . . . . . . . . . 69,464 63,702 75,255 69,659 64,002 75,345 * * * 80 . . . . . . . . . . . . . . . . . . 56,801 50,290 63,230 56,927 50,517 63,242 * * * 85 . . . . . . . . . . . . . . . . . . 40,844 34,870 46,758 40,802 34,973 46,550 * * * 90 . . . . . . . . . . . . . . . . . . 23,744 19,855 27,621 23,497 19,828 27,132 * * * 95 . . . . . . . . . . . . . . . . . . 9,765 8,424 11,086 9,452 8,335 10,546 * * * 100 . . . . . . . . . . . . . . . . . 2,327 2,327 2,348 2,153 2,263 2,088 * * * 105 . . . . . . . . . . . . . . . . . 245 350 184 209 331 144 * * *
Vermont
0. . . . . . . . . . . . . . . . . . . 100,000 100,000 100,000 100,000 100,000 100,000 * * * 5. . . . . . . . . . . . . . . . . . . 99,443 99,570 99,327 99,513 99,741 99,353 * * * 10 . . . . . . . . . . . . . . . . . . 99,371 99,508 99,244 99,427 99,664 99,258 * * * 15 . . . . . . . . . . . . . . . . . . 99,291 99,406 99,187 99,319 99,573 99,132 * * * 20 . . . . . . . . . . . . . . . . . . 99,018 99,048 99,005 99,063 99,218 98,980 * * * 25 . . . . . . . . . . . . . . . . . . 98,590 98,420 98,789 98,661 98,609 98,794 * * * 30 . . . . . . . . . . . . . . . . . . 98,179 97,799 98,586 98,229 97,979 98,559 * * * 35 . . . . . . . . . . . . . . . . . . 97,757 97,210 98,324 97,766 97,359 98,245 * * * 40 . . . . . . . . . . . . . . . . . . 97,171 96,485 97,873 97,176 96,616 97,804 * * * 45 . . . . . . . . . . . . . . . . . . 96,322 95,420 97,235 96,313 95,536 97,153 * * * 50 . . . . . . . . . . . . . . . . . . 95,022 93,782 96,268 95,000 93,894 96,160 * * * 55 . . . . . . . . . . . . . . . . . . 92,991 91,255 94,755 92,960 91,377 94,617 * * * 60 . . . . . . . . . . . . . . . . . . 89,848 87,404 92,350 89,827 87,560 92,193 * * * 65 . . . . . . . . . . . . . . . . . . 85,040 81,654 88,511 85,084 81,883 88,399 * * * 70 . . . . . . . . . . . . . . . . . . 77,928 73,462 82,465 78,068 73,677 82,551 * * * 75 . . . . . . . . . . . . . . . . . . 67,684 62,069 73,250 68,046 62,226 73,823 * * * 80 . . . . . . . . . . . . . . . . . . 53,905 47,443 60,059 54,695 47,527 61,516 * * * 85 . . . . . . . . . . . . . . . . . . 37,206 30,985 43,102 38,518 30,999 45,722 * * * 90 . . . . . . . . . . . . . . . . . . 20,431 15,866 24,863 22,031 15,837 28,299 * * * 95 . . . . . . . . . . . . . . . . . . 7,845 5,620 10,102 9,141 5,589 13,134 * * * 100 . . . . . . . . . . . . . . . . . 1,750 1,159 2,383 2,342 1,146 3,922 * * * 105 . . . . . . . . . . . . . . . . . 177 111 251 299 109 611 * * *
Virginia
0. . . . . . . . . . . . . . . . . . . 100,000 100,000 100,000 100,000 100,000 100,000 100,000 100,000 100,000 5. . . . . . . . . . . . . . . . . . . 99,179 99,064 99,258 99,367 99,264 99,437 98,499 98,301 98,634 10 . . . . . . . . . . . . . . . . . . 99,116 98,996 99,200 99,311 99,203 99,388 98,412 98,218 98,544 15 . . . . . . . . . . . . . . . . . . 99,029 98,905 99,117 99,232 99,125 99,307 98,294 98,076 98,450 20 . . . . . . . . . . . . . . . . . . 98,714 98,468 98,933 98,946 98,740 99,128 97,872 97,445 98,241 25 . . . . . . . . . . . . . . . . . . 98,304 97,884 98,710 98,590 98,242 98,929 97,272 96,570 97,920 30 . . . . . . . . . . . . . . . . . . 97,900 97,312 98,483 98,255 97,766 98,743 96,547 95,519 97,510 35 . . . . . . . . . . . . . . . . . . 97,425 96,711 98,134 97,851 97,248 98,458 95,724 94,455 96,915 40 . . . . . . . . . . . . . . . . . . 96,749 95,893 97,601 97,266 96,517 98,022 94,610 93,095 96,029 45 . . . . . . . . . . . . . . . . . . 95,733 94,653 96,807 96,365 95,397 97,346 92,977 91,136 94,699 50 . . . . . . . . . . . . . . . . . . 94,196 92,743 95,633 94,958 93,653 96,274 90,555 88,224 92,737 55 . . . . . . . . . . . . . . . . . . 91,851 89,821 93,860 92,766 90,964 94,585 87,005 83,944 89,869
See footnotes at end of table.

National Vital Statistics Reports, Vol. 60, No. 9, September 14, 2012 29
Table 1. Survivorship, by age, race, and sex: United States, 50 states, and District of Columbia, 1999–2001—Con.
All races White Black
State and age (years) Total Males Females Total Males Females Total Males Females
Virginia—Con.
60 . . . . . . . . . . . . . . . . . . 88,287 85,417 91,140 89,394 86,876 91,946 81,904 77,791 85,731 65 . . . . . . . . . . . . . . . . . . 82,946 78,938 86,939 84,312 80,797 87,879 74,777 69,248 79,880 70 . . . . . . . . . . . . . . . . . . 75,165 69,762 80,501 76,931 72,077 81,801 65,203 57,991 71,855 75 . . . . . . . . . . . . . . . . . . 64,333 57,514 70,912 66,619 60,238 72,846 53,195 44,281 61,333 80 . . . . . . . . . . . . . . . . . . 50,289 42,587 57,462 53,197 45,491 60,387 39,321 29,443 48,431 85 . . . . . . . . . . . . . . . . . . 33,871 26,754 40,524 37,261 29,386 44,641 25,060 15,947 34,096 90 . . . . . . . . . . . . . . . . . . 18,019 13,114 22,753 21,296 14,973 27,532 12,864 6,404 20,298 95 . . . . . . . . . . . . . . . . . . 6,645 4,454 8,860 8,928 5,357 12,812 4,848 1,679 9,487 100 . . . . . . . . . . . . . . . . . 1,411 893 1,955 2,363 1,149 3,890 1,188 244 3,147 105 . . . . . . . . . . . . . . . . . 135 86 186 323 121 632 163 16 649
Washington
0. . . . . . . . . . . . . . . . . . . 100,000 100,000 100,000 100,000 100,000 100,000 100,000 100,000 100,000 5. . . . . . . . . . . . . . . . . . . 99,431 99,315 99,510 99,396 99,328 99,449 98,935 98,911 98,972 10 . . . . . . . . . . . . . . . . . . 99,363 99,233 99,456 99,325 99,251 99,386 98,817 98,773 98,875 15 . . . . . . . . . . . . . . . . . . 99,277 99,127 99,391 99,242 99,144 99,328 98,705 98,616 98,812 20 . . . . . . . . . . . . . . . . . . 98,985 98,718 99,224 98,954 98,746 99,156 98,412 98,200 98,659 25 . . . . . . . . . . . . . . . . . . 98,584 98,133 99,019 98,559 98,165 98,962 97,803 97,278 98,426 30 . . . . . . . . . . . . . . . . . . 98,228 97,633 98,816 98,221 97,698 98,761 97,302 96,650 98,081 35 . . . . . . . . . . . . . . . . . . 97,822 97,107 98,537 97,788 97,139 98,461 96,641 95,877 97,562 40 . . . . . . . . . . . . . . . . . . 97,231 96,364 98,103 97,184 96,371 98,029 95,650 94,718 96,780 45 . . . . . . . . . . . . . . . . . . 96,321 95,235 97,418 96,272 95,214 97,369 94,154 92,981 95,602 50 . . . . . . . . . . . . . . . . . . 94,915 93,506 96,339 94,876 93,453 96,347 91,923 90,396 93,835 55 . . . . . . . . . . . . . . . . . . 92,750 90,878 94,650 92,733 90,791 94,742 88,653 86,600 91,201 60 . . . . . . . . . . . . . . . . . . 89,452 86,938 92,026 89,467 86,822 92,220 83,871 81,130 87,325 65 . . . . . . . . . . . . . . . . . . 84,534 81,155 88,010 84,580 81,029 88,289 77,150 73,477 81,729 70 . . . . . . . . . . . . . . . . . . 77,476 72,994 82,057 77,493 72,886 82,286 68,021 63,227 73,885 75 . . . . . . . . . . . . . . . . . . 67,619 61,859 73,364 67,536 61,737 73,434 56,495 50,377 63,373 80 . . . . . . . . . . . . . . . . . . 54,677 47,778 61,328 54,429 47,599 61,118 42,738 35,778 50,210 85 . . . . . . . . . . . . . . . . . . 39,156 31,995 46,093 38,693 31,738 45,506 28,105 21,430 35,320 90 . . . . . . . . . . . . . . . . . . 23,247 17,250 29,323 22,638 16,960 28,417 15,035 10,009 20,824 95 . . . . . . . . . . . . . . . . . . 10,385 6,731 14,423 9,840 6,509 13,503 5,967 3,272 9,481 100 . . . . . . . . . . . . . . . . . 3,043 1,642 4,812 2,749 1,542 4,240 1,552 650 2,979 105 . . . . . . . . . . . . . . . . . 487 207 910 407 185 726 226 66 557
West Virginia
0. . . . . . . . . . . . . . . . . . . 100,000 100,000 100,000 100,000 100,000 100,000 100,000 100,000 100,000 5. . . . . . . . . . . . . . . . . . . 99,228 99,290 99,196 99,271 99,342 99,226 98,680 98,925 98,507 10 . . . . . . . . . . . . . . . . . . 99,130 99,193 99,098 99,176 99,243 99,136 98,347 98,679 98,081 15 . . . . . . . . . . . . . . . . . . 98,999 99,062 98,967 99,048 99,111 99,013 98,044 98,542 97,601 20 . . . . . . . . . . . . . . . . . . 98,594 98,532 98,692 98,634 98,565 98,736 97,652 98,228 97,119 25 . . . . . . . . . . . . . . . . . . 98,053 97,739 98,411 98,108 97,778 98,474 97,092 97,660 96,569 30 . . . . . . . . . . . . . . . . . . 97,499 96,986 98,058 97,554 97,012 98,131 96,325 96,846 95,860 35 . . . . . . . . . . . . . . . . . . 96,858 96,168 97,595 96,944 96,228 97,696 95,245 95,672 94,887 40 . . . . . . . . . . . . . . . . . . 95,984 95,044 96,963 96,072 95,093 97,079 93,710 93,967 93,520 45 . . . . . . . . . . . . . . . . . . 94,706 93,385 96,062 94,810 93,472 96,172 91,530 91,538 91,592 50 . . . . . . . . . . . . . . . . . . 92,801 90,921 94,729 92,909 91,049 94,805 88,448 88,101 88,882 55 . . . . . . . . . . . . . . . . . . 89,957 87,299 92,704 90,055 87,466 92,715 84,126 83,296 85,113 60 . . . . . . . . . . . . . . . . . . 85,763 82,072 89,585 85,834 82,264 89,517 78,316 76,730 79,955 65 . . . . . . . . . . . . . . . . . . 79,686 74,731 84,792 79,731 74,915 84,679 70,605 68,044 73,062 70 . . . . . . . . . . . . . . . . . . 71,161 64,842 77,562 71,219 64,964 77,539 60,902 57,096 64,166 75 . . . . . . . . . . . . . . . . . . 59,706 52,323 67,088 59,878 52,315 67,435 49,232 44,219 53,238 80 . . . . . . . . . . . . . . . . . . 45,516 37,881 52,973 45,977 37,695 54,076 36,243 30,514 40,731 85 . . . . . . . . . . . . . . . . . . 29,790 23,354 36,107 30,619 23,017 38,197 23,354 17,858 27,778 90 . . . . . . . . . . . . . . . . . . 15,423 11,383 19,477 16,450 11,021 22,180 12,474 8,283 16,116 95 . . . . . . . . . . . . . . . . . . 5,608 3,958 7,302 6,427 3,717 9,566 5,136 2,782 7,467 100 . . . . . . . . . . . . . . . . . 1,215 857 1,582 1,584 766 2,656 1,483 602 2,542 105 . . . . . . . . . . . . . . . . . 127 97 155 204 81 393 267 73 572
See footnotes at end of table.

30 National Vital Statistics Reports, Vol. 60, No. 9, September 14, 2012
Table 1. Survivorship, by age, race, and sex: United States, 50 states, and District of Columbia, 1999–2001—Con.
All races White Black
State and age (years) Total Males Females Total Males Females Total Males Females
Wisconsin
0. . . . . . . . . . . . . . . . . . . 100,000 100,000 100,000 100,000 100,000 100,000 100,000 100,000 100,000 5. . . . . . . . . . . . . . . . . . . 99,300 99,125 99,418 99,314 99,256 99,361 98,207 97,840 98,412 10 . . . . . . . . . . . . . . . . . . 99,221 99,027 99,358 99,235 99,163 99,297 98,080 97,697 98,300 15 . . . . . . . . . . . . . . . . . . 99,129 98,925 99,276 99,155 99,075 99,224 97,883 97,466 98,139 20 . . . . . . . . . . . . . . . . . . 98,811 98,475 99,098 98,857 98,662 99,048 97,302 96,576 97,886 25 . . . . . . . . . . . . . . . . . . 98,382 97,831 98,895 98,465 98,065 98,873 96,433 95,199 97,507 30 . . . . . . . . . . . . . . . . . . 98,017 97,321 98,682 98,131 97,597 98,680 95,716 94,310 96,951 35 . . . . . . . . . . . . . . . . . . 97,616 96,808 98,399 97,751 97,112 98,410 94,770 93,211 96,151 40 . . . . . . . . . . . . . . . . . . 97,034 96,079 97,968 97,206 96,415 98,021 93,401 91,589 95,010 45 . . . . . . . . . . . . . . . . . . 96,133 94,956 97,295 96,366 95,348 97,419 91,454 89,293 93,390 50 . . . . . . . . . . . . . . . . . . 94,732 93,223 96,244 95,053 93,689 96,471 88,685 86,010 91,095 55 . . . . . . . . . . . . . . . . . . 92,574 90,568 94,608 93,012 91,132 94,972 84,780 81,390 87,857 60 . . . . . . . . . . . . . . . . . . 89,300 86,556 92,085 89,879 87,244 92,613 79,386 75,031 83,317 65 . . . . . . . . . . . . . . . . . . 84,404 80,625 88,244 85,140 81,457 88,942 72,076 66,569 77,036 70 . . . . . . . . . . . . . . . . . . 77,347 72,217 82,520 78,182 73,127 83,345 62,576 55,840 68,560 75 . . . . . . . . . . . . . . . . . . 67,482 60,758 74,194 68,393 61,745 75,090 50,737 43,167 57,597 80 . . . . . . . . . . . . . . . . . . 54,656 46,350 62,693 55,580 47,398 63,541 37,344 29,650 44,352 85 . . . . . . . . . . . . . . . . . . 39,287 30,401 48,062 40,108 31,422 48,683 23,751 17,188 29,963 90 . . . . . . . . . . . . . . . . . . 23,511 15,844 31,674 24,094 16,668 31,911 12,212 7,836 16,656 95 . . . . . . . . . . . . . . . . . . 10,668 5,857 16,555 10,958 6,341 16,430 4,627 2,556 6,953 100 . . . . . . . . . . . . . . . . . 3,219 1,315 6,108 3,298 1,488 5,868 1,142 528 1,922 105 . . . . . . . . . . . . . . . . . 542 147 1,355 549 177 1,224 156 60 299
Wyoming
0. . . . . . . . . . . . . . . . . . . 100,000 100,000 100,000 100,000 100,000 100,000 * * * 5. . . . . . . . . . . . . . . . . . . 99,252 99,391 99,111 99,380 99,443 99,324 * * * 10 . . . . . . . . . . . . . . . . . . 99,114 99,241 98,984 99,244 99,296 99,201 * * * 15 . . . . . . . . . . . . . . . . . . 98,909 98,926 98,895 99,003 98,982 99,037 * * * 20 . . . . . . . . . . . . . . . . . . 98,495 98,348 98,659 98,571 98,443 98,719 * * * 25 . . . . . . . . . . . . . . . . . . 97,923 97,517 98,375 98,077 97,760 98,432 * * * 30 . . . . . . . . . . . . . . . . . . 97,407 96,802 98,076 97,529 96,999 98,117 * * * 35 . . . . . . . . . . . . . . . . . . 96,807 96,042 97,645 96,912 96,164 97,729 * * * 40 . . . . . . . . . . . . . . . . . . 95,984 94,982 97,057 96,163 95,186 97,207 * * * 45 . . . . . . . . . . . . . . . . . . 94,870 93,650 96,167 95,155 93,934 96,452 * * * 50 . . . . . . . . . . . . . . . . . . 93,306 91,862 94,840 93,707 92,194 95,314 * * * 55 . . . . . . . . . . . . . . . . . . 91,003 89,318 92,808 91,539 89,653 93,569 * * * 60 . . . . . . . . . . . . . . . . . . 87,576 85,569 89,730 88,279 85,864 90,888 * * * 65 . . . . . . . . . . . . . . . . . . 82,445 79,982 85,082 83,393 80,233 86,808 * * * 70 . . . . . . . . . . . . . . . . . . 74,900 71,779 78,180 76,263 72,071 80,726 * * * 75 . . . . . . . . . . . . . . . . . . 64,213 60,262 68,303 66,235 60,806 71,970 * * * 80 . . . . . . . . . . . . . . . . . . 50,240 45,404 55,049 53,171 46,475 60,047 * * * 85 . . . . . . . . . . . . . . . . . . 33,899 28,756 39,035 37,642 30,444 45,172 * * * 90 . . . . . . . . . . . . . . . . . . 18,129 13,851 22,648 21,959 15,731 28,953 * * * 95 . . . . . . . . . . . . . . . . . . 6,785 4,381 9,650 9,558 5,686 14,536 * * * 100 . . . . . . . . . . . . . . . . . 1,493 742 2,589 2,702 1,218 5,068 * * * 105 . . . . . . . . . . . . . . . . . 154 52 356 413 125 1,041 * * *
* Figure does not meet standards of reliability or precision; ‘‘Technical Notes.’’

National Vital Statistics Reports, Vol. 60, No. 9, September 14, 2012 31
Table 2. Life expectancy, by age, race, and sex: United States, 50 states, and District of Columbia, 1999–2001
All races White Black
State and age (years) Total Males Females Total Males Females Total Males Females
United States
0. . . . . . . . . . . . . . . . . . . 76.83 74.10 79.45 77.41 74.74 79.97 71.74 68.08 75.12 5. . . . . . . . . . . . . . . . . . . 72.47 69.77 75.04 72.94 70.31 75.46 67.92 64.31 71.22 10 . . . . . . . . . . . . . . . . . . 67.52 64.83 70.09 67.99 65.36 70.51 62.99 59.39 66.28 15 . . . . . . . . . . . . . . . . . . 62.59 59.90 65.15 63.05 60.43 65.56 58.07 54.48 61.35 20 . . . . . . . . . . . . . . . . . . 57.79 55.17 60.27 58.25 55.69 60.69 53.32 49.83 56.48 25 . . . . . . . . . . . . . . . . . . 53.05 50.54 55.41 53.48 51.02 55.81 48.71 45.41 51.67 30 . . . . . . . . . . . . . . . . . . 48.28 45.85 50.55 48.70 46.30 50.94 44.10 40.94 46.91 35 . . . . . . . . . . . . . . . . . . 43.54 41.18 45.73 43.93 41.60 46.10 39.53 36.47 42.22 40 . . . . . . . . . . . . . . . . . . 38.87 36.58 40.98 39.23 36.98 41.31 35.06 32.10 37.65 45 . . . . . . . . . . . . . . . . . . 34.31 32.10 36.31 34.63 32.46 36.61 30.79 27.92 33.26 50 . . . . . . . . . . . . . . . . . . 29.88 27.79 31.74 30.15 28.09 31.99 26.75 24.05 29.03 55 . . . . . . . . . . . . . . . . . . 25.59 23.62 27.31 25.80 23.86 27.52 22.93 20.43 24.98 60 . . . . . . . . . . . . . . . . . . 21.54 19.71 23.09 21.70 19.88 23.25 19.40 17.14 21.18 65 . . . . . . . . . . . . . . . . . . 17.77 16.11 19.12 17.88 16.22 19.23 16.14 14.12 17.65 70 . . . . . . . . . . . . . . . . . . 14.27 12.80 15.40 14.34 12.87 15.47 13.18 11.40 14.41 75 . . . . . . . . . . . . . . . . . . 11.12 9.89 11.99 11.15 9.92 12.02 10.54 9.07 11.49 80 . . . . . . . . . . . . . . . . . . 8.42 7.44 9.05 8.42 7.43 9.04 8.29 7.12 8.96 85 . . . . . . . . . . . . . . . . . . 6.22 5.47 6.62 6.19 5.43 6.59 6.41 5.52 6.86 90 . . . . . . . . . . . . . . . . . . 4.49 3.95 4.71 4.44 3.90 4.67 4.90 4.23 5.16 95 . . . . . . . . . . . . . . . . . . 3.19 2.82 3.29 3.14 2.77 3.24 3.71 3.24 3.84 100 . . . . . . . . . . . . . . . . . 2.27 2.03 2.29 2.22 1.98 2.24 2.81 2.48 2.84 105 . . . . . . . . . . . . . . . . . 1.64 1.48 1.62 1.60 1.44 1.58 2.13 1.91 2.11
Alabama
0. . . . . . . . . . . . . . . . . . . 74.80 71.32 78.34 75.96 72.85 79.14 70.82 66.42 74.94 5. . . . . . . . . . . . . . . . . . . 70.62 67.25 74.08 71.57 68.55 74.67 67.04 62.79 71.08 10 . . . . . . . . . . . . . . . . . . 65.69 62.32 69.15 66.63 63.62 69.73 62.14 57.89 66.17 15 . . . . . . . . . . . . . . . . . . 60.78 57.43 64.23 61.72 58.73 64.80 57.22 52.98 61.25 20 . . . . . . . . . . . . . . . . . . 56.06 52.80 59.40 57.02 54.11 59.99 52.47 48.33 56.38 25 . . . . . . . . . . . . . . . . . . 51.42 48.30 54.60 52.33 49.53 55.17 47.93 43.99 51.63 30 . . . . . . . . . . . . . . . . . . 46.75 43.72 49.83 47.59 44.87 50.35 43.37 39.59 46.91 35 . . . . . . . . . . . . . . . . . . 42.09 39.11 45.11 42.88 40.21 45.57 38.88 35.26 42.27 40 . . . . . . . . . . . . . . . . . . 37.50 34.57 40.45 38.23 35.63 40.84 34.56 31.13 37.74 45 . . . . . . . . . . . . . . . . . . 33.03 30.18 35.89 33.71 31.19 36.22 30.45 27.26 33.40 50 . . . . . . . . . . . . . . . . . . 28.71 25.98 31.44 29.34 26.93 31.72 26.56 23.60 29.25 55 . . . . . . . . . . . . . . . . . . 24.61 22.02 27.16 25.18 22.90 27.40 22.89 20.17 25.29 60 . . . . . . . . . . . . . . . . . . 20.75 18.34 23.08 21.27 19.14 23.29 19.46 16.99 21.57 65 . . . . . . . . . . . . . . . . . . 17.20 14.99 19.26 17.64 15.70 19.43 16.29 14.06 18.14 70 . . . . . . . . . . . . . . . . . . 13.98 12.01 15.75 14.35 12.63 15.86 13.41 11.41 15.02 75 . . . . . . . . . . . . . . . . . . 11.14 9.44 12.61 11.42 9.96 12.65 10.83 9.05 12.25 80 . . . . . . . . . . . . . . . . . . 8.67 7.27 9.87 8.88 7.69 9.86 8.56 7.01 9.83 85 . . . . . . . . . . . . . . . . . . 6.62 5.51 7.56 6.76 5.84 7.52 6.64 5.29 7.78 90 . . . . . . . . . . . . . . . . . . 4.97 4.13 5.68 5.06 4.37 5.61 5.07 3.91 6.07 95 . . . . . . . . . . . . . . . . . . 3.69 3.07 4.20 3.74 3.25 4.13 3.82 2.84 4.69 100 . . . . . . . . . . . . . . . . . 2.73 2.29 3.09 2.75 2.42 3.01 2.87 2.05 3.60 105 . . . . . . . . . . . . . . . . . 2.03 1.72 2.27 2.03 1.81 2.20 2.16 1.50 2.77
Alaska
0. . . . . . . . . . . . . . . . . . . 76.63 74.18 79.41 77.61 75.45 80.10 * * * 5. . . . . . . . . . . . . . . . . . . 72.35 69.96 75.08 73.06 70.94 75.53 * * * 10 . . . . . . . . . . . . . . . . . . 67.41 65.03 70.12 68.11 66.00 70.56 * * * 15 . . . . . . . . . . . . . . . . . . 62.50 60.16 65.18 63.18 61.09 65.61 * * * 20 . . . . . . . . . . . . . . . . . . 57.81 55.57 60.36 58.42 56.40 60.76 * * * 25 . . . . . . . . . . . . . . . . . . 53.22 51.11 55.62 53.70 51.78 55.92 * * * 30 . . . . . . . . . . . . . . . . . . 48.61 46.63 50.84 48.96 47.14 51.05 * * * 35 . . . . . . . . . . . . . . . . . . 43.94 42.07 46.05 44.23 42.51 46.20 * * * 40 . . . . . . . . . . . . . . . . . . 39.26 37.48 41.27 39.52 37.88 41.40 * * * 45 . . . . . . . . . . . . . . . . . . 34.65 32.94 36.57 34.88 33.30 36.69 * * * 50 . . . . . . . . . . . . . . . . . . 30.15 28.52 31.99 30.35 28.84 32.09 * * * 55 . . . . . . . . . . . . . . . . . . 25.84 24.28 27.56 26.00 24.55 27.63 * * *
See footnotes at end of table.

32 National Vital Statistics Reports, Vol. 60, No. 9, September 14, 2012
Table 2. Life expectancy, by age, race, and sex: United States, 50 states, and District of Columbia, 1999–2001—Con.
All races White Black
State and age (years) Total Males Females Total Males Females Total Males Females
Alaska—Con.
60 . . . . . . . . . . . . . . . . . . 21.76 20.30 23.34 21.87 20.51 23.37 * * * 65 . . . . . . . . . . . . . . . . . . 17.97 16.62 19.38 18.02 16.76 19.35 * * * 70 . . . . . . . . . . . . . . . . . . 14.51 13.30 15.73 14.46 13.37 15.56 * * * 75 . . . . . . . . . . . . . . . . . . 11.44 10.40 12.45 11.30 10.40 12.14 * * * 80 . . . . . . . . . . . . . . . . . . 8.79 7.94 9.61 8.55 7.88 9.18 * * * 85 . . . . . . . . . . . . . . . . . . 6.60 5.93 7.24 6.30 5.84 6.73 * * * 90 . . . . . . . . . . . . . . . . . . 4.85 4.36 5.33 4.53 4.24 4.80 * * * 95 . . . . . . . . . . . . . . . . . . 3.52 3.17 3.86 3.21 3.05 3.35 * * * 100 . . . . . . . . . . . . . . . . . 2.54 2.30 2.77 2.27 2.19 2.33 * * * 105 . . . . . . . . . . . . . . . . . 1.85 1.69 2.00 1.62 1.60 1.64 * * *
Arizona
0. . . . . . . . . . . . . . . . . . . 78.15 75.25 81.16 78.49 75.51 81.64 74.03 70.95 77.70 5. . . . . . . . . . . . . . . . . . . 73.74 70.95 76.68 74.08 71.14 77.20 70.49 67.25 74.30 10 . . . . . . . . . . . . . . . . . . 68.81 66.02 71.74 69.14 66.21 72.25 65.56 62.33 69.36 15 . . . . . . . . . . . . . . . . . . 63.89 61.11 66.80 64.21 61.29 67.31 60.62 57.41 64.40 20 . . . . . . . . . . . . . . . . . . 59.13 56.45 61.94 59.43 56.59 62.44 55.89 52.78 59.55 25 . . . . . . . . . . . . . . . . . . 54.44 51.89 57.08 54.71 51.99 57.57 51.26 48.24 54.79 30 . . . . . . . . . . . . . . . . . . 49.72 47.28 52.23 49.98 47.35 52.71 46.59 43.68 49.96 35 . . . . . . . . . . . . . . . . . . 45.02 42.66 47.42 45.26 42.71 47.89 41.97 39.15 45.20 40 . . . . . . . . . . . . . . . . . . 40.37 38.09 42.68 40.60 38.13 43.14 37.44 34.70 40.56 45 . . . . . . . . . . . . . . . . . . 35.83 33.65 38.02 36.03 33.67 38.45 33.03 30.36 36.05 50 . . . . . . . . . . . . . . . . . . 31.44 29.38 33.49 31.61 29.37 33.87 28.80 26.22 31.68 55 . . . . . . . . . . . . . . . . . . 27.22 25.31 29.11 27.35 25.28 29.43 24.79 22.32 27.50 60 . . . . . . . . . . . . . . . . . . 23.22 21.49 24.91 23.31 21.44 25.17 21.02 18.69 23.53 65 . . . . . . . . . . . . . . . . . . 19.48 17.95 20.95 19.53 17.88 21.15 17.56 15.39 19.84 70 . . . . . . . . . . . . . . . . . . 16.05 14.75 17.27 16.07 14.66 17.42 14.44 12.45 16.45 75 . . . . . . . . . . . . . . . . . . 12.98 11.90 13.96 12.97 11.80 14.04 11.65 9.88 13.40 80 . . . . . . . . . . . . . . . . . . 10.28 9.44 11.03 10.24 9.33 11.05 9.22 7.71 10.73 85 . . . . . . . . . . . . . . . . . . 7.98 7.36 8.53 7.91 7.25 8.50 7.18 5.92 8.44 90 . . . . . . . . . . . . . . . . . . 6.09 5.66 6.47 6.00 5.55 6.40 5.51 4.50 6.53 95 . . . . . . . . . . . . . . . . . . 4.58 4.30 4.82 4.49 4.20 4.73 4.19 3.39 4.99 100 . . . . . . . . . . . . . . . . . 3.41 3.25 3.55 3.32 3.16 3.45 3.17 2.55 3.78 105 . . . . . . . . . . . . . . . . . 2.54 2.46 2.61 2.46 2.39 2.51 2.40 1.94 2.85
Arkansas
0. . . . . . . . . . . . . . . . . . . 75.43 72.05 78.99 76.28 73.17 79.59 70.59 67.30 73.58 5. . . . . . . . . . . . . . . . . . . 71.16 67.94 74.60 71.85 68.74 75.16 66.73 63.49 69.71 10 . . . . . . . . . . . . . . . . . . 66.24 63.02 69.66 66.92 63.82 70.22 61.82 58.59 64.78 15 . . . . . . . . . . . . . . . . . . 61.33 58.13 64.74 62.02 58.93 65.30 56.91 53.70 59.86 20 . . . . . . . . . . . . . . . . . . 56.60 53.48 59.91 57.29 54.29 60.47 52.15 49.00 55.02 25 . . . . . . . . . . . . . . . . . . 51.94 48.94 55.11 52.60 49.70 55.66 47.59 44.63 50.26 30 . . . . . . . . . . . . . . . . . . 47.27 44.37 50.32 47.87 45.04 50.84 43.10 40.32 45.59 35 . . . . . . . . . . . . . . . . . . 42.59 39.77 45.55 43.18 40.43 46.06 38.57 35.90 40.95 40 . . . . . . . . . . . . . . . . . . 37.97 35.23 40.84 38.54 35.86 41.33 34.12 31.56 36.40 45 . . . . . . . . . . . . . . . . . . 33.46 30.81 36.23 34.01 31.42 36.69 29.81 27.37 31.95 50 . . . . . . . . . . . . . . . . . . 29.11 26.57 31.76 29.63 27.16 32.16 25.68 23.39 27.66 55 . . . . . . . . . . . . . . . . . . 24.97 22.55 27.46 25.44 23.13 27.79 21.80 19.68 23.56 60 . . . . . . . . . . . . . . . . . . 21.08 18.82 23.38 21.50 19.36 23.63 18.19 16.29 19.73 65 . . . . . . . . . . . . . . . . . . 17.50 15.41 19.57 17.85 15.91 19.73 14.91 13.24 16.20 70 . . . . . . . . . . . . . . . . . . 14.25 12.37 16.06 14.54 12.83 16.14 12.00 10.56 13.03 75 . . . . . . . . . . . . . . . . . . 11.37 9.73 12.91 11.60 10.14 12.93 9.44 8.28 10.26 80 . . . . . . . . . . . . . . . . . . 8.88 7.50 10.17 9.05 7.85 10.12 7.28 6.39 7.91 85 . . . . . . . . . . . . . . . . . . 6.80 5.69 7.84 6.91 5.98 7.75 5.52 4.86 5.98 90 . . . . . . . . . . . . . . . . . . 5.12 4.25 5.94 5.19 4.49 5.82 4.14 3.67 4.45 95 . . . . . . . . . . . . . . . . . . 3.82 3.16 4.43 3.85 3.34 4.30 3.08 2.76 3.29 100 . . . . . . . . . . . . . . . . . 2.83 2.35 3.27 2.84 2.49 3.14 2.29 2.09 2.43 105 . . . . . . . . . . . . . . . . . 2.11 1.76 2.42 2.11 1.87 2.30 1.73 1.60 1.81
See footnotes at end of table.

National Vital Statistics Reports, Vol. 60, No. 9, September 14, 2012 33
Table 2. Life expectancy, by age, race, and sex: United States, 50 states, and District of Columbia, 1999–2001—Con.
All races White Black
State and age (years) Total Males Females Total Males Females Total Males Females
California
0. . . . . . . . . . . . . . . . . . . 78.80 76.02 81.63 78.71 76.11 81.36 73.23 69.97 76.67 5. . . . . . . . . . . . . . . . . . . 74.24 71.56 77.00 74.18 71.61 76.80 69.30 66.05 72.75 10 . . . . . . . . . . . . . . . . . . 69.29 66.61 72.04 69.22 66.66 71.85 64.37 61.12 67.82 15 . . . . . . . . . . . . . . . . . . 64.35 61.67 67.09 64.28 61.72 66.90 59.45 56.21 62.88 20 . . . . . . . . . . . . . . . . . . 59.52 56.90 62.19 59.45 56.95 61.99 54.70 51.58 58.00 25 . . . . . . . . . . . . . . . . . . 54.74 52.22 57.30 54.67 52.26 57.11 50.09 47.17 53.16 30 . . . . . . . . . . . . . . . . . . 49.94 47.49 52.41 49.86 47.52 52.22 45.46 42.67 48.38 35 . . . . . . . . . . . . . . . . . . 45.15 42.75 47.57 45.08 42.79 47.36 40.82 38.12 43.63 40 . . . . . . . . . . . . . . . . . . 40.42 38.07 42.78 40.36 38.14 42.56 36.28 33.64 39.03 45 . . . . . . . . . . . . . . . . . . 35.80 33.51 38.07 35.74 33.59 37.86 31.90 29.32 34.57 50 . . . . . . . . . . . . . . . . . . 31.30 29.10 33.48 31.26 29.21 33.26 27.71 25.21 30.29 55 . . . . . . . . . . . . . . . . . . 26.99 24.89 29.04 26.96 25.02 28.82 23.75 21.34 26.22 60 . . . . . . . . . . . . . . . . . . 22.90 20.93 24.80 22.88 21.09 24.57 20.06 17.76 22.40 65 . . . . . . . . . . . . . . . . . . 19.08 17.27 20.80 19.07 17.45 20.57 16.70 14.52 18.88 70 . . . . . . . . . . . . . . . . . . 15.59 13.95 17.11 15.59 14.15 16.87 13.68 11.65 15.68 75 . . . . . . . . . . . . . . . . . . 12.46 11.04 13.77 12.47 11.24 13.53 11.02 9.17 12.82 80 . . . . . . . . . . . . . . . . . . 9.74 8.54 10.83 9.74 8.75 10.61 8.72 7.09 10.33 85 . . . . . . . . . . . . . . . . . . 7.44 6.48 8.33 7.45 6.68 8.12 6.80 5.40 8.20 90 . . . . . . . . . . . . . . . . . . 5.58 4.83 6.27 5.59 5.01 6.08 5.23 4.07 6.43 95 . . . . . . . . . . . . . . . . . . 4.13 3.56 4.64 4.13 3.72 4.48 4.00 3.05 4.99 100 . . . . . . . . . . . . . . . . . 3.03 2.62 3.39 3.03 2.75 3.26 3.06 2.29 3.85 105 . . . . . . . . . . . . . . . . . 2.22 1.94 2.47 2.22 2.04 2.37 2.35 1.74 2.96
Colorado
0. . . . . . . . . . . . . . . . . . . 78.72 76.29 81.16 78.73 76.23 81.31 74.13 71.71 76.59 5. . . . . . . . . . . . . . . . . . . 74.22 71.91 76.59 74.27 71.81 76.82 70.27 68.08 72.58 10 . . . . . . . . . . . . . . . . . . 69.27 66.95 71.64 69.33 66.86 71.87 65.33 63.13 67.66 15 . . . . . . . . . . . . . . . . . . 64.35 62.03 66.71 64.39 61.94 66.93 60.45 58.28 62.76 20 . . . . . . . . . . . . . . . . . . 59.55 57.30 61.85 59.61 57.20 62.09 55.73 53.65 57.92 25 . . . . . . . . . . . . . . . . . . 54.80 52.63 56.99 54.84 52.52 57.21 51.08 49.10 53.14 30 . . . . . . . . . . . . . . . . . . 50.03 47.94 52.13 50.07 47.81 52.35 46.42 44.52 48.37 35 . . . . . . . . . . . . . . . . . . 45.26 43.22 47.29 45.30 43.10 47.52 41.75 39.92 43.61 40 . . . . . . . . . . . . . . . . . . 40.54 38.55 42.50 40.59 38.45 42.74 37.16 35.40 38.93 45 . . . . . . . . . . . . . . . . . . 35.91 33.98 37.80 35.96 33.89 38.02 32.69 30.99 34.37 50 . . . . . . . . . . . . . . . . . . 31.41 29.55 33.21 31.45 29.49 33.39 28.38 26.76 29.95 55 . . . . . . . . . . . . . . . . . . 27.08 25.32 28.77 27.11 25.27 28.89 24.29 22.76 25.72 60 . . . . . . . . . . . . . . . . . . 22.96 21.31 24.51 22.97 21.29 24.58 20.44 19.04 21.72 65 . . . . . . . . . . . . . . . . . . 19.09 17.59 20.48 19.10 17.58 20.50 16.90 15.63 18.02 70 . . . . . . . . . . . . . . . . . . 15.52 14.17 16.72 15.52 14.16 16.73 13.73 12.59 14.66 75 . . . . . . . . . . . . . . . . . . 12.32 11.15 13.33 12.31 11.14 13.33 10.91 9.94 11.68 80 . . . . . . . . . . . . . . . . . . 9.53 8.57 10.36 9.51 8.55 10.35 8.49 7.70 9.11 85 . . . . . . . . . . . . . . . . . . 7.19 6.44 7.84 7.17 6.41 7.83 6.48 5.87 6.96 90 . . . . . . . . . . . . . . . . . . 5.31 4.75 5.80 5.29 4.72 5.78 4.87 4.41 5.23 95 . . . . . . . . . . . . . . . . . . 3.86 3.45 4.21 3.84 3.43 4.19 3.62 3.29 3.88 100 . . . . . . . . . . . . . . . . . 2.79 2.51 3.02 2.77 2.49 3.00 2.69 2.45 2.86 105 . . . . . . . . . . . . . . . . . 2.02 1.84 2.17 2.00 1.82 2.15 2.00 1.85 2.12
Connecticut
0. . . . . . . . . . . . . . . . . . . 78.90 76.13 81.63 79.36 76.73 81.92 74.81 71.73 77.71 5. . . . . . . . . . . . . . . . . . . 74.45 71.71 77.15 74.84 72.24 77.37 70.72 67.30 73.83 10 . . . . . . . . . . . . . . . . . . 69.49 66.75 72.20 69.88 67.27 72.42 65.77 62.36 68.88 15 . . . . . . . . . . . . . . . . . . 64.54 61.81 67.24 64.92 62.33 67.46 60.84 57.44 63.93 20 . . . . . . . . . . . . . . . . . . 59.69 57.03 62.31 60.07 57.54 62.53 56.05 52.77 59.00 25 . . . . . . . . . . . . . . . . . . 54.92 52.36 57.43 55.29 52.84 57.64 51.37 48.26 54.13 30 . . . . . . . . . . . . . . . . . . 50.15 47.68 52.55 50.48 48.12 52.75 46.76 43.82 49.34 35 . . . . . . . . . . . . . . . . . . 45.37 42.96 47.70 45.68 43.38 47.89 42.19 39.39 44.64 40 . . . . . . . . . . . . . . . . . . 40.63 38.28 42.91 40.94 38.70 43.08 37.79 35.12 40.12 45 . . . . . . . . . . . . . . . . . . 35.98 33.69 38.18 36.28 34.10 38.34 33.53 31.00 35.70 50 . . . . . . . . . . . . . . . . . . 31.45 29.24 33.57 31.74 29.65 33.70 29.40 27.03 31.40 55 . . . . . . . . . . . . . . . . . . 27.09 24.98 29.09 27.36 25.39 29.19 25.41 23.24 27.22
See footnotes at end of table.
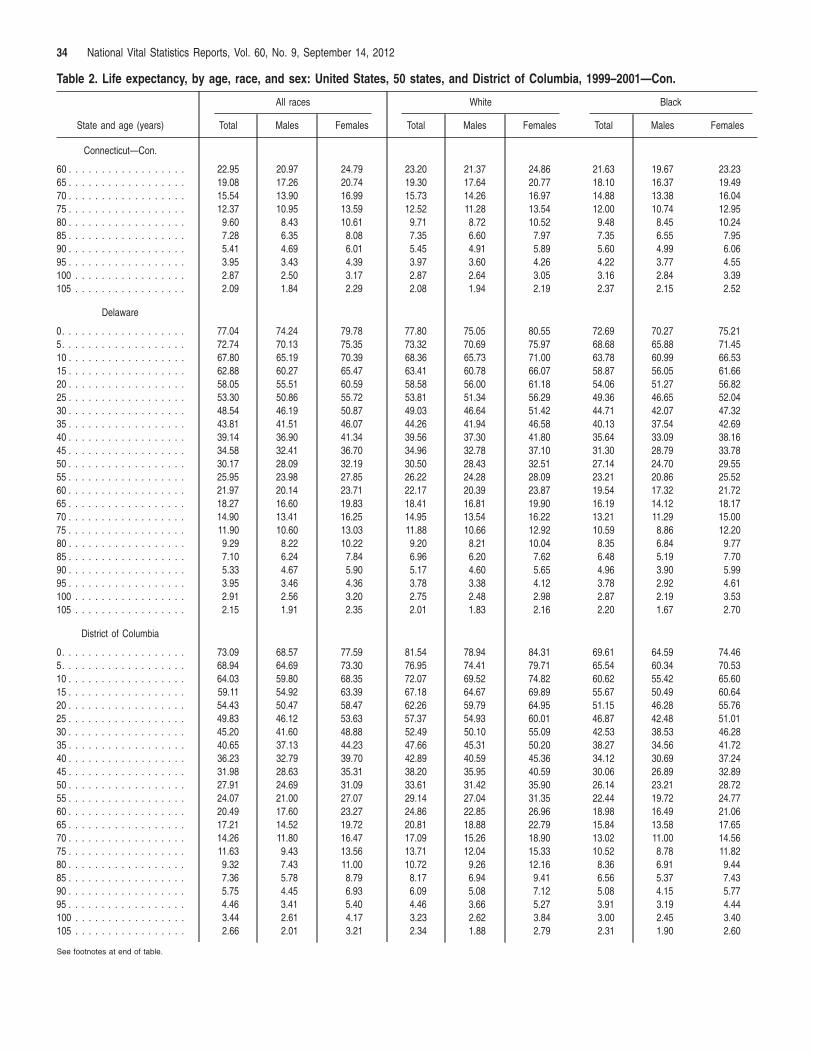
34 National Vital Statistics Reports, Vol. 60, No. 9, September 14, 2012
Table 2. Life expectancy, by age, race, and sex: United States, 50 states, and District of Columbia, 1999–2001—Con.
All races White Black
State and age (years) Total Males Females Total Males Females Total Males Females
Connecticut—Con.
60 . . . . . . . . . . . . . . . . . . 22.95 20.97 24.79 23.20 21.37 24.86 21.63 19.67 23.23 65 . . . . . . . . . . . . . . . . . . 19.08 17.26 20.74 19.30 17.64 20.77 18.10 16.37 19.49 70 . . . . . . . . . . . . . . . . . . 15.54 13.90 16.99 15.73 14.26 16.97 14.88 13.38 16.04 75 . . . . . . . . . . . . . . . . . . 12.37 10.95 13.59 12.52 11.28 13.54 12.00 10.74 12.95 80 . . . . . . . . . . . . . . . . . . 9.60 8.43 10.61 9.71 8.72 10.52 9.48 8.45 10.24 85 . . . . . . . . . . . . . . . . . . 7.28 6.35 8.08 7.35 6.60 7.97 7.35 6.55 7.95 90 . . . . . . . . . . . . . . . . . . 5.41 4.69 6.01 5.45 4.91 5.89 5.60 4.99 6.06 95 . . . . . . . . . . . . . . . . . . 3.95 3.43 4.39 3.97 3.60 4.26 4.22 3.77 4.55 100 . . . . . . . . . . . . . . . . . 2.87 2.50 3.17 2.87 2.64 3.05 3.16 2.84 3.39 105 . . . . . . . . . . . . . . . . . 2.09 1.84 2.29 2.08 1.94 2.19 2.37 2.15 2.52
Delaware
0. . . . . . . . . . . . . . . . . . . 77.04 74.24 79.78 77.80 75.05 80.55 72.69 70.27 75.21 5. . . . . . . . . . . . . . . . . . . 72.74 70.13 75.35 73.32 70.69 75.97 68.68 65.88 71.45 10 . . . . . . . . . . . . . . . . . . 67.80 65.19 70.39 68.36 65.73 71.00 63.78 60.99 66.53 15 . . . . . . . . . . . . . . . . . . 62.88 60.27 65.47 63.41 60.78 66.07 58.87 56.05 61.66 20 . . . . . . . . . . . . . . . . . . 58.05 55.51 60.59 58.58 56.00 61.18 54.06 51.27 56.82 25 . . . . . . . . . . . . . . . . . . 53.30 50.86 55.72 53.81 51.34 56.29 49.36 46.65 52.04 30 . . . . . . . . . . . . . . . . . . 48.54 46.19 50.87 49.03 46.64 51.42 44.71 42.07 47.32 35 . . . . . . . . . . . . . . . . . . 43.81 41.51 46.07 44.26 41.94 46.58 40.13 37.54 42.69 40 . . . . . . . . . . . . . . . . . . 39.14 36.90 41.34 39.56 37.30 41.80 35.64 33.09 38.16 45 . . . . . . . . . . . . . . . . . . 34.58 32.41 36.70 34.96 32.78 37.10 31.30 28.79 33.78 50 . . . . . . . . . . . . . . . . . . 30.17 28.09 32.19 30.50 28.43 32.51 27.14 24.70 29.55 55 . . . . . . . . . . . . . . . . . . 25.95 23.98 27.85 26.22 24.28 28.09 23.21 20.86 25.52 60 . . . . . . . . . . . . . . . . . . 21.97 20.14 23.71 22.17 20.39 23.87 19.54 17.32 21.72 65 . . . . . . . . . . . . . . . . . . 18.27 16.60 19.83 18.41 16.81 19.90 16.19 14.12 18.17 70 . . . . . . . . . . . . . . . . . . 14.90 13.41 16.25 14.95 13.54 16.22 13.21 11.29 15.00 75 . . . . . . . . . . . . . . . . . . 11.90 10.60 13.03 11.88 10.66 12.92 10.59 8.86 12.20 80 . . . . . . . . . . . . . . . . . . 9.29 8.22 10.22 9.20 8.21 10.04 8.35 6.84 9.77 85 . . . . . . . . . . . . . . . . . . 7.10 6.24 7.84 6.96 6.20 7.62 6.48 5.19 7.70 90 . . . . . . . . . . . . . . . . . . 5.33 4.67 5.90 5.17 4.60 5.65 4.96 3.90 5.99 95 . . . . . . . . . . . . . . . . . . 3.95 3.46 4.36 3.78 3.38 4.12 3.78 2.92 4.61 100 . . . . . . . . . . . . . . . . . 2.91 2.56 3.20 2.75 2.48 2.98 2.87 2.19 3.53 105 . . . . . . . . . . . . . . . . . 2.15 1.91 2.35 2.01 1.83 2.16 2.20 1.67 2.70
District of Columbia
0. . . . . . . . . . . . . . . . . . . 73.09 68.57 77.59 81.54 78.94 84.31 69.61 64.59 74.46 5. . . . . . . . . . . . . . . . . . . 68.94 64.69 73.30 76.95 74.41 79.71 65.54 60.34 70.53 10 . . . . . . . . . . . . . . . . . . 64.03 59.80 68.35 72.07 69.52 74.82 60.62 55.42 65.60 15 . . . . . . . . . . . . . . . . . . 59.11 54.92 63.39 67.18 64.67 69.89 55.67 50.49 60.64 20 . . . . . . . . . . . . . . . . . . 54.43 50.47 58.47 62.26 59.79 64.95 51.15 46.28 55.76 25 . . . . . . . . . . . . . . . . . . 49.83 46.12 53.63 57.37 54.93 60.01 46.87 42.48 51.01 30 . . . . . . . . . . . . . . . . . . 45.20 41.60 48.88 52.49 50.10 55.09 42.53 38.53 46.28 35 . . . . . . . . . . . . . . . . . . 40.65 37.13 44.23 47.66 45.31 50.20 38.27 34.56 41.72 40 . . . . . . . . . . . . . . . . . . 36.23 32.79 39.70 42.89 40.59 45.36 34.12 30.69 37.24 45 . . . . . . . . . . . . . . . . . . 31.98 28.63 35.31 38.20 35.95 40.59 30.06 26.89 32.89 50 . . . . . . . . . . . . . . . . . . 27.91 24.69 31.09 33.61 31.42 35.90 26.14 23.21 28.72 55 . . . . . . . . . . . . . . . . . . 24.07 21.00 27.07 29.14 27.04 31.35 22.44 19.72 24.77 60 . . . . . . . . . . . . . . . . . . 20.49 17.60 23.27 24.86 22.85 26.96 18.98 16.49 21.06 65 . . . . . . . . . . . . . . . . . . 17.21 14.52 19.72 20.81 18.88 22.79 15.84 13.58 17.65 70 . . . . . . . . . . . . . . . . . . 14.26 11.80 16.47 17.09 15.26 18.90 13.02 11.00 14.56 75 . . . . . . . . . . . . . . . . . . 11.63 9.43 13.56 13.71 12.04 15.33 10.52 8.78 11.82 80 . . . . . . . . . . . . . . . . . . 9.32 7.43 11.00 10.72 9.26 12.16 8.36 6.91 9.44 85 . . . . . . . . . . . . . . . . . . 7.36 5.78 8.79 8.17 6.94 9.41 6.56 5.37 7.43 90 . . . . . . . . . . . . . . . . . . 5.75 4.45 6.93 6.09 5.08 7.12 5.08 4.15 5.77 95 . . . . . . . . . . . . . . . . . . 4.46 3.41 5.40 4.46 3.66 5.27 3.91 3.19 4.44 100 . . . . . . . . . . . . . . . . . 3.44 2.61 4.17 3.23 2.62 3.84 3.00 2.45 3.40 105 . . . . . . . . . . . . . . . . . 2.66 2.01 3.21 2.34 1.88 2.79 2.31 1.90 2.60
See footnotes at end of table.

National Vital Statistics Reports, Vol. 60, No. 9, September 14, 2012 35
Table 2. Life expectancy, by age, race, and sex: United States, 50 states, and District of Columbia, 1999–2001—Con.
All races White Black
State and age (years) Total Males Females Total Males Females Total Males Females
Florida
0. . . . . . . . . . . . . . . . . . . 78.10 74.97 81.40 78.79 75.64 82.14 72.22 68.98 75.53 5. . . . . . . . . . . . . . . . . . . 73.78 70.69 77.05 74.32 71.21 77.65 68.33 65.14 71.62 10 . . . . . . . . . . . . . . . . . . 68.84 65.75 72.10 69.37 66.26 72.69 63.41 60.23 66.69 15 . . . . . . . . . . . . . . . . . . 63.91 60.83 67.16 64.44 61.34 67.75 58.49 55.33 61.75 20 . . . . . . . . . . . . . . . . . . 59.12 56.12 62.29 59.65 56.61 62.88 53.72 50.64 56.89 25 . . . . . . . . . . . . . . . . . . 54.43 51.54 57.46 54.94 52.01 58.03 49.09 46.15 52.11 30 . . . . . . . . . . . . . . . . . . 49.73 46.93 52.65 50.20 47.36 53.19 44.49 41.63 47.42 35 . . . . . . . . . . . . . . . . . . 45.02 42.29 47.86 45.47 42.70 48.37 39.96 37.18 42.82 40 . . . . . . . . . . . . . . . . . . 40.38 37.72 43.14 40.80 38.11 43.62 35.52 32.76 38.36 45 . . . . . . . . . . . . . . . . . . 35.85 33.28 38.50 36.24 33.64 38.96 31.23 28.48 34.04 50 . . . . . . . . . . . . . . . . . . 31.46 29.00 33.99 31.83 29.33 34.41 27.11 24.40 29.88 55 . . . . . . . . . . . . . . . . . . 27.25 24.92 29.63 27.59 25.22 30.02 23.21 20.57 25.89 60 . . . . . . . . . . . . . . . . . . 23.26 21.10 25.46 23.56 21.37 25.80 19.56 17.04 22.10 65 . . . . . . . . . . . . . . . . . . 19.54 17.58 21.52 19.80 17.80 21.82 16.20 13.86 18.52 70 . . . . . . . . . . . . . . . . . . 16.14 14.39 17.88 16.35 14.57 18.12 13.22 11.05 15.31 75 . . . . . . . . . . . . . . . . . . 13.09 11.56 14.58 13.24 11.71 14.75 10.61 8.65 12.48 80 . . . . . . . . . . . . . . . . . . 10.41 9.12 11.66 10.51 9.24 11.76 8.35 6.65 10.01 85 . . . . . . . . . . . . . . . . . . 8.12 7.08 9.14 8.18 7.16 9.18 6.48 5.04 7.90 90 . . . . . . . . . . . . . . . . . . 6.23 5.41 7.03 6.26 5.46 7.02 4.97 3.78 6.16 95 . . . . . . . . . . . . . . . . . . 4.72 4.09 5.32 4.72 4.12 5.28 3.78 2.82 4.74 100 . . . . . . . . . . . . . . . . . 3.54 3.08 3.98 3.52 3.10 3.92 2.88 2.12 3.63 105 . . . . . . . . . . . . . . . . . 2.65 2.32 2.96 2.62 2.33 2.90 2.20 1.61 2.77
Georgia
0. . . . . . . . . . . . . . . . . . . 75.27 72.28 78.22 76.68 73.88 79.53 72.36 68.29 76.16 5. . . . . . . . . . . . . . . . . . . 71.00 68.11 73.89 72.22 69.48 75.02 68.45 64.53 72.18 10 . . . . . . . . . . . . . . . . . . 66.07 63.17 68.95 67.28 64.54 70.07 63.52 59.60 67.25 15 . . . . . . . . . . . . . . . . . . 61.14 58.26 64.01 62.35 59.62 65.14 58.61 54.71 62.32 20 . . . . . . . . . . . . . . . . . . 56.37 53.56 59.16 57.58 54.92 60.30 53.84 50.01 57.45 25 . . . . . . . . . . . . . . . . . . 51.66 48.95 54.31 52.85 50.28 55.43 49.16 45.47 52.64 30 . . . . . . . . . . . . . . . . . . 46.92 44.28 49.49 48.07 45.57 50.57 44.50 40.89 47.88 35 . . . . . . . . . . . . . . . . . . 42.19 39.60 44.70 43.30 40.85 45.75 39.90 36.37 43.19 40 . . . . . . . . . . . . . . . . . . 37.54 35.01 39.99 38.60 36.20 40.98 35.40 31.96 38.60 45 . . . . . . . . . . . . . . . . . . 33.01 30.55 35.36 34.02 31.68 36.31 31.06 27.73 34.13 50 . . . . . . . . . . . . . . . . . . 28.63 26.28 30.85 29.58 27.33 31.77 26.91 23.71 29.83 55 . . . . . . . . . . . . . . . . . . 24.44 22.24 26.49 25.33 23.20 27.38 23.00 19.96 25.73 60 . . . . . . . . . . . . . . . . . . 20.51 18.48 22.34 21.33 19.33 23.21 19.37 16.51 21.87 65 . . . . . . . . . . . . . . . . . . 16.88 15.06 18.46 17.63 15.79 19.28 16.06 13.42 18.29 70 . . . . . . . . . . . . . . . . . . 13.60 12.01 14.90 14.26 12.62 15.66 13.10 10.70 15.04 75 . . . . . . . . . . . . . . . . . . 10.71 9.38 11.73 11.27 9.86 12.41 10.48 8.38 12.15 80 . . . . . . . . . . . . . . . . . . 8.21 7.17 9.00 8.68 7.54 9.60 8.23 6.45 9.64 85 . . . . . . . . . . . . . . . . . . 6.15 5.39 6.73 6.53 5.66 7.24 6.36 4.90 7.52 90 . . . . . . . . . . . . . . . . . . 4.53 3.99 4.93 4.83 4.18 5.35 4.85 3.68 5.78 95 . . . . . . . . . . . . . . . . . . 3.29 2.94 3.55 3.52 3.06 3.88 3.67 2.76 4.39 100 . . . . . . . . . . . . . . . . . 2.39 2.17 2.55 2.56 2.24 2.80 2.78 2.08 3.31 105 . . . . . . . . . . . . . . . . . 1.75 1.63 1.84 1.87 1.67 2.03 2.11 1.60 2.50
Hawaii
0. . . . . . . . . . . . . . . . . . . 80.23 77.17 83.65 80.64 78.40 83.31 * * * 5. . . . . . . . . . . . . . . . . . . 75.86 72.86 79.24 75.92 73.69 78.59 * * * 10 . . . . . . . . . . . . . . . . . . 70.90 67.89 74.28 70.95 68.71 73.61 * * * 15 . . . . . . . . . . . . . . . . . . 65.94 62.95 69.31 65.98 63.73 68.64 * * * 20 . . . . . . . . . . . . . . . . . . 61.09 58.13 64.41 61.06 58.81 63.73 * * * 25 . . . . . . . . . . . . . . . . . . 56.28 53.39 59.52 56.20 53.98 58.83 * * * 30 . . . . . . . . . . . . . . . . . . 51.49 48.65 54.65 51.36 49.18 53.93 * * * 35 . . . . . . . . . . . . . . . . . . 46.71 43.92 49.82 46.54 44.41 49.04 * * * 40 . . . . . . . . . . . . . . . . . . 41.99 39.23 45.06 41.79 39.72 44.21 * * * 45 . . . . . . . . . . . . . . . . . . 37.35 34.64 40.36 37.13 35.14 39.44 * * * 50 . . . . . . . . . . . . . . . . . . 32.83 30.19 35.76 32.59 30.70 34.78 * * * 55 . . . . . . . . . . . . . . . . . . 28.48 25.93 31.29 28.22 26.45 30.25 * * *
See footnotes at end of table.

36 National Vital Statistics Reports, Vol. 60, No. 9, September 14, 2012
Table 2. Life expectancy, by age, race, and sex: United States, 50 states, and District of Columbia, 1999–2001—Con.
All races White Black
State and age (years) Total Males Females Total Males Females Total Males Females
Hawaii—Con.
60 . . . . . . . . . . . . . . . . . . 24.32 21.91 26.97 24.06 22.43 25.89 * * * 65 . . . . . . . . . . . . . . . . . . 20.42 18.17 22.87 20.15 18.68 21.76 * * * 70 . . . . . . . . . . . . . . . . . . 16.79 14.76 19.02 16.56 15.27 17.93 * * * 75 . . . . . . . . . . . . . . . . . . 13.52 11.75 15.48 13.32 12.23 14.44 * * * 80 . . . . . . . . . . . . . . . . . . 10.64 9.14 12.31 10.46 9.60 11.35 * * * 85 . . . . . . . . . . . . . . . . . . 8.19 6.97 9.55 8.04 7.38 8.70 * * * 90 . . . . . . . . . . . . . . . . . . 6.18 5.22 7.23 6.05 5.57 6.52 * * * 95 . . . . . . . . . . . . . . . . . . 4.58 3.86 5.36 4.47 4.16 4.79 * * * 100 . . . . . . . . . . . . . . . . . 3.35 2.84 3.91 3.28 3.08 3.47 * * * 105 . . . . . . . . . . . . . . . . . 2.45 2.10 2.82 2.40 2.28 2.50 * * *
Idaho
0. . . . . . . . . . . . . . . . . . . 78.29 76.18 80.50 78.44 76.46 80.53 * * * 5. . . . . . . . . . . . . . . . . . . 73.85 71.68 76.12 73.95 71.84 76.15 * * * 10 . . . . . . . . . . . . . . . . . . 68.92 66.74 71.19 69.02 66.91 71.23 * * * 15 . . . . . . . . . . . . . . . . . . 64.01 61.84 66.27 64.12 62.01 66.30 * * * 20 . . . . . . . . . . . . . . . . . . 59.24 57.14 61.41 59.34 57.31 61.44 * * * 25 . . . . . . . . . . . . . . . . . . 54.50 52.51 56.55 54.57 52.62 56.58 * * * 30 . . . . . . . . . . . . . . . . . . 49.72 47.80 51.69 49.79 47.92 51.71 * * * 35 . . . . . . . . . . . . . . . . . . 44.94 43.06 46.86 45.03 43.21 46.88 * * * 40 . . . . . . . . . . . . . . . . . . 40.21 38.37 42.09 40.30 38.53 42.10 * * * 45 . . . . . . . . . . . . . . . . . . 35.57 33.79 37.38 35.65 33.93 37.38 * * * 50 . . . . . . . . . . . . . . . . . . 31.04 29.35 32.75 31.10 29.46 32.75 * * * 55 . . . . . . . . . . . . . . . . . . 26.68 25.10 28.25 26.71 25.16 28.26 * * * 60 . . . . . . . . . . . . . . . . . . 22.52 21.09 23.92 22.54 21.10 23.94 * * * 65 . . . . . . . . . . . . . . . . . . 18.63 17.36 19.82 18.63 17.34 19.86 * * * 70 . . . . . . . . . . . . . . . . . . 15.05 13.98 16.03 15.04 13.93 16.06 * * * 75 . . . . . . . . . . . . . . . . . . 11.86 10.99 12.62 11.84 10.93 12.65 * * * 80 . . . . . . . . . . . . . . . . . . 9.09 8.44 9.64 9.06 8.37 9.67 * * * 85 . . . . . . . . . . . . . . . . . . 6.78 6.34 7.16 6.76 6.26 7.18 * * * 90 . . . . . . . . . . . . . . . . . . 4.95 4.68 5.17 4.92 4.60 5.19 * * * 95 . . . . . . . . . . . . . . . . . . 3.55 3.41 3.66 3.52 3.34 3.68 * * * 100 . . . . . . . . . . . . . . . . . 2.53 2.48 2.57 2.51 2.42 2.58 * * * 105 . . . . . . . . . . . . . . . . . 1.82 1.82 1.82 1.80 1.77 1.83 * * *
Illinois
0. . . . . . . . . . . . . . . . . . . 77.06 73.91 80.26 78.05 75.33 80.78 70.62 66.81 74.20 5. . . . . . . . . . . . . . . . . . . 72.69 69.68 75.80 73.62 70.94 76.31 66.97 63.23 70.51 10 . . . . . . . . . . . . . . . . . . 67.74 64.73 70.85 68.66 65.98 71.35 62.05 58.32 65.58 15 . . . . . . . . . . . . . . . . . . 62.80 59.80 65.90 63.71 61.04 66.40 57.15 53.43 60.66 20 . . . . . . . . . . . . . . . . . . 58.01 55.09 61.02 58.90 56.28 61.52 52.46 48.90 55.79 25 . . . . . . . . . . . . . . . . . . 53.30 50.49 56.16 54.13 51.61 56.63 48.01 44.75 51.02 30 . . . . . . . . . . . . . . . . . . 48.54 45.83 51.29 49.32 46.86 51.74 43.49 40.45 46.27 35 . . . . . . . . . . . . . . . . . . 43.78 41.12 46.46 44.52 42.12 46.88 39.02 36.12 41.67 40 . . . . . . . . . . . . . . . . . . 39.07 36.47 41.70 39.78 37.43 42.07 34.62 31.81 37.18 45 . . . . . . . . . . . . . . . . . . 34.48 31.94 37.04 35.14 32.86 37.35 30.38 27.66 32.83 50 . . . . . . . . . . . . . . . . . . 30.03 27.57 32.50 30.63 28.44 32.75 26.32 23.73 28.65 55 . . . . . . . . . . . . . . . . . . 25.78 23.41 28.13 26.31 24.22 28.29 22.50 20.06 24.67 60 . . . . . . . . . . . . . . . . . . 21.77 19.52 23.96 22.21 20.26 24.03 18.94 16.69 20.92 65 . . . . . . . . . . . . . . . . . . 18.05 15.95 20.05 18.40 16.61 20.01 15.70 13.66 17.44 70 . . . . . . . . . . . . . . . . . . 14.67 12.75 16.46 14.92 13.33 16.31 12.79 10.99 14.29 75 . . . . . . . . . . . . . . . . . . 11.67 9.97 13.23 11.83 10.45 12.99 10.24 8.70 11.48 80 . . . . . . . . . . . . . . . . . . 9.07 7.62 10.40 9.14 8.01 10.09 8.04 6.78 9.05 85 . . . . . . . . . . . . . . . . . . 6.90 5.71 8.00 6.90 6.01 7.65 6.21 5.22 7.01 90 . . . . . . . . . . . . . . . . . . 5.16 4.21 6.04 5.11 4.43 5.67 4.74 3.98 5.35 95 . . . . . . . . . . . . . . . . . . 3.81 3.08 4.48 3.73 3.24 4.13 3.59 3.03 4.03 100 . . . . . . . . . . . . . . . . . 2.80 2.26 3.29 2.70 2.36 2.98 2.71 2.31 3.03 105 . . . . . . . . . . . . . . . . . 2.07 1.67 2.42 1.97 1.75 2.15 2.06 1.78 2.28
See footnotes at end of table.

National Vital Statistics Reports, Vol. 60, No. 9, September 14, 2012 37
Table 2. Life expectancy, by age, race, and sex: United States, 50 states, and District of Columbia, 1999–2001—Con.
All races White Black
State and age (years) Total Males Females Total Males Females Total Males Females
Indiana
0. . . . . . . . . . . . . . . . . . . 76.47 73.55 79.45 76.97 74.24 79.69 71.98 67.47 76.55 5. . . . . . . . . . . . . . . . . . . 72.17 69.31 75.11 72.60 69.92 75.29 68.01 63.88 72.30 10 . . . . . . . . . . . . . . . . . . 67.23 64.37 70.17 67.66 64.99 70.35 63.09 58.97 67.37 15 . . . . . . . . . . . . . . . . . . 62.30 59.45 65.22 62.73 60.06 65.40 58.15 54.05 62.42 20 . . . . . . . . . . . . . . . . . . 57.52 54.75 60.35 57.94 55.34 60.54 53.48 49.57 57.53 25 . . . . . . . . . . . . . . . . . . 52.79 50.13 55.50 53.17 50.67 55.67 49.03 45.41 52.74 30 . . . . . . . . . . . . . . . . . . 48.03 45.46 50.64 48.40 45.96 50.81 44.51 41.11 47.98 35 . . . . . . . . . . . . . . . . . . 43.28 40.76 45.82 43.64 41.25 45.98 39.91 36.63 43.26 40 . . . . . . . . . . . . . . . . . . 38.58 36.12 41.06 38.94 36.61 41.21 35.41 32.22 38.65 45 . . . . . . . . . . . . . . . . . . 34.00 31.59 36.40 34.34 32.09 36.53 31.03 27.96 34.14 50 . . . . . . . . . . . . . . . . . . 29.56 27.24 31.87 29.89 27.73 31.98 26.84 23.92 29.79 55 . . . . . . . . . . . . . . . . . . 25.32 23.10 27.51 25.64 23.58 27.58 22.89 20.14 25.63 60 . . . . . . . . . . . . . . . . . . 21.33 19.23 23.36 21.62 19.70 23.39 19.20 16.66 21.71 65 . . . . . . . . . . . . . . . . . . 17.64 15.69 19.48 17.89 16.14 19.47 15.85 13.54 18.08 70 . . . . . . . . . . . . . . . . . . 14.29 12.52 15.92 14.50 12.94 15.85 12.83 10.79 14.77 75 . . . . . . . . . . . . . . . . . . 11.33 9.77 12.73 11.50 10.15 12.62 10.20 8.44 11.84 80 . . . . . . . . . . . . . . . . . . 8.77 7.45 9.95 8.89 7.79 9.81 7.95 6.49 9.31 85 . . . . . . . . . . . . . . . . . . 6.65 5.58 7.61 6.73 5.86 7.44 6.09 4.92 7.18 90 . . . . . . . . . . . . . . . . . . 4.95 4.11 5.70 5.00 4.34 5.53 4.60 3.70 5.45 95 . . . . . . . . . . . . . . . . . . 3.64 3.00 4.21 3.66 3.19 4.04 3.45 2.77 4.08 100 . . . . . . . . . . . . . . . . . 2.67 2.20 3.08 2.67 2.34 2.93 2.59 2.08 3.04 105 . . . . . . . . . . . . . . . . . 1.97 1.63 2.26 1.96 1.74 2.13 1.96 1.59 2.27
Iowa
0. . . . . . . . . . . . . . . . . . . 78.76 76.11 81.39 78.77 76.19 81.35 72.91 70.81 75.16 5. . . . . . . . . . . . . . . . . . . 74.26 71.72 76.82 74.30 71.78 76.83 68.76 66.58 71.08 10 . . . . . . . . . . . . . . . . . . 69.32 66.79 71.87 69.36 66.84 71.89 63.85 61.68 66.15 15 . . . . . . . . . . . . . . . . . . 64.38 61.85 66.93 64.42 61.90 66.94 58.94 56.80 61.23 20 . . . . . . . . . . . . . . . . . . 59.58 57.10 62.06 59.62 57.17 62.07 54.15 52.07 56.36 25 . . . . . . . . . . . . . . . . . . 54.80 52.41 57.18 54.82 52.44 57.19 49.45 47.44 51.57 30 . . . . . . . . . . . . . . . . . . 49.98 47.65 52.29 50.00 47.68 52.30 44.77 42.83 46.79 35 . . . . . . . . . . . . . . . . . . 45.18 42.89 47.45 45.20 42.91 47.46 40.10 38.22 42.05 40 . . . . . . . . . . . . . . . . . . 40.43 38.18 42.65 40.45 38.21 42.66 35.54 33.70 37.41 45 . . . . . . . . . . . . . . . . . . 35.77 33.58 37.92 35.78 33.61 37.92 31.12 29.35 32.90 50 . . . . . . . . . . . . . . . . . . 31.23 29.12 33.29 31.25 29.15 33.28 26.89 25.20 28.56 55 . . . . . . . . . . . . . . . . . . 26.86 24.86 28.78 26.87 24.89 28.77 22.89 21.30 24.42 60 . . . . . . . . . . . . . . . . . . 22.70 20.84 24.44 22.71 20.86 24.44 19.17 17.69 20.54 65 . . . . . . . . . . . . . . . . . . 18.80 17.11 20.34 18.80 17.13 20.33 15.76 14.42 16.97 70 . . . . . . . . . . . . . . . . . . 15.21 13.72 16.53 15.20 13.72 16.51 12.71 11.52 13.74 75 . . . . . . . . . . . . . . . . . . 12.01 10.73 13.10 11.99 10.73 13.07 10.06 9.03 10.91 80 . . . . . . . . . . . . . . . . . . 9.22 8.19 10.10 9.19 8.18 10.05 7.79 6.95 8.48 85 . . . . . . . . . . . . . . . . . . 6.90 6.11 7.57 6.87 6.10 7.52 5.93 5.26 6.47 90 . . . . . . . . . . . . . . . . . . 5.05 4.47 5.53 5.01 4.46 5.47 4.45 3.93 4.86 95 . . . . . . . . . . . . . . . . . . 3.63 3.24 3.96 3.60 3.22 3.91 3.31 2.93 3.61 100 . . . . . . . . . . . . . . . . . 2.60 2.34 2.80 2.57 2.33 2.76 2.46 2.19 2.68 105 . . . . . . . . . . . . . . . . . 1.87 1.71 1.99 1.85 1.70 1.96 1.85 1.66 2.00
Kansas
0. . . . . . . . . . . . . . . . . . . 77.78 74.84 80.88 78.18 75.46 81.00 71.70 68.47 75.02 5. . . . . . . . . . . . . . . . . . . 73.39 70.58 76.40 73.80 71.14 76.56 68.09 65.01 71.29 10 . . . . . . . . . . . . . . . . . . 68.44 65.63 71.45 68.85 66.19 71.62 63.15 60.08 66.35 15 . . . . . . . . . . . . . . . . . . 63.51 60.71 66.52 63.92 61.27 66.68 58.27 55.21 61.46 20 . . . . . . . . . . . . . . . . . . 58.74 56.02 61.65 59.14 56.56 61.83 53.65 50.75 56.64 25 . . . . . . . . . . . . . . . . . . 54.02 51.40 56.79 54.39 51.91 56.94 49.16 46.45 51.90 30 . . . . . . . . . . . . . . . . . . 49.26 46.73 51.93 49.61 47.22 52.07 44.54 41.89 47.18 35 . . . . . . . . . . . . . . . . . . 44.48 42.01 47.09 44.84 42.51 47.22 39.92 37.33 42.51 40 . . . . . . . . . . . . . . . . . . 39.76 37.32 42.32 40.12 37.83 42.45 35.41 32.89 37.91 45 . . . . . . . . . . . . . . . . . . 35.13 32.73 37.64 35.49 33.25 37.76 31.06 28.62 33.45 50 . . . . . . . . . . . . . . . . . . 30.63 28.30 33.07 30.99 28.82 33.19 26.90 24.57 29.14 55 . . . . . . . . . . . . . . . . . . 26.33 24.07 28.67 26.68 24.59 28.78 22.98 20.77 25.05
See footnotes at end of table.

38 National Vital Statistics Reports, Vol. 60, No. 9, September 14, 2012
Table 2. Life expectancy, by age, race, and sex: United States, 50 states, and District of Columbia, 1999–2001—Con.
All races White Black
State and age (years) Total Males Females Total Males Females Total Males Females
Kansas—Con. 60 . . . . . . . . . . . . . . . . . . 22.25 20.09 24.47 22.59 20.60 24.55 19.32 17.28 21.20 65 . . . . . . . . . . . . . . . . . . 18.46 16.42 20.52 18.78 16.92 20.58 15.98 14.12 17.65 70 . . . . . . . . . . . . . . . . . . 15.00 13.13 16.86 15.29 13.60 16.89 12.98 11.32 14.43 75 . . . . . . . . . . . . . . . . . . 11.92 10.25 13.56 12.18 10.69 13.56 10.34 8.92 11.58 80 . . . . . . . . . . . . . . . . . . 9.25 7.81 10.67 9.47 8.21 10.64 8.09 6.91 9.12 85 . . . . . . . . . . . . . . . . . . 7.02 5.83 8.20 7.20 6.17 8.16 6.23 5.28 7.06 90 . . . . . . . . . . . . . . . . . . 5.22 4.28 6.17 5.37 4.56 6.12 4.74 3.99 5.39 95 . . . . . . . . . . . . . . . . . . 3.84 3.11 4.57 3.95 3.33 4.52 3.57 3.00 4.06 100 . . . . . . . . . . . . . . . . . 2.81 2.26 3.35 2.88 2.43 3.29 2.69 2.26 3.05 105 . . . . . . . . . . . . . . . . . 2.06 1.66 2.45 2.11 1.79 2.40 2.04 1.73 2.29
Kentucky
0. . . . . . . . . . . . . . . . . . . 75.20 72.25 78.20 75.59 72.73 78.42 71.71 69.01 74.46 5. . . . . . . . . . . . . . . . . . . 70.81 67.92 73.75 71.15 68.38 73.92 67.85 64.90 70.79 10 . . . . . . . . . . . . . . . . . . 65.87 62.99 68.81 66.21 63.45 68.98 62.91 59.96 65.86 15 . . . . . . . . . . . . . . . . . . 60.94 58.07 63.87 61.28 58.53 64.05 57.98 55.05 60.90 20 . . . . . . . . . . . . . . . . . . 56.17 53.37 59.02 56.51 53.82 59.20 53.21 50.39 56.00 25 . . . . . . . . . . . . . . . . . . 51.44 48.74 54.17 51.77 49.19 54.34 48.53 45.77 51.24 30 . . . . . . . . . . . . . . . . . . 46.72 44.10 49.36 47.03 44.54 49.50 43.90 41.23 46.50 35 . . . . . . . . . . . . . . . . . . 42.00 39.43 44.59 42.32 39.88 44.71 39.28 36.66 41.83 40 . . . . . . . . . . . . . . . . . . 37.35 34.83 39.87 37.67 35.30 39.99 34.76 32.20 37.25 45 . . . . . . . . . . . . . . . . . . 32.80 30.35 35.24 33.13 30.86 35.34 30.42 27.89 32.85 50 . . . . . . . . . . . . . . . . . . 28.40 26.05 30.72 28.75 26.60 30.81 26.27 23.80 28.63 55 . . . . . . . . . . . . . . . . . . 24.20 21.99 26.35 24.56 22.57 26.44 22.36 19.97 24.62 60 . . . . . . . . . . . . . . . . . . 20.25 18.21 22.19 20.62 18.81 22.26 18.74 16.45 20.86 65 . . . . . . . . . . . . . . . . . . 16.61 14.77 18.29 16.97 15.39 18.34 15.43 13.29 17.40 70 . . . . . . . . . . . . . . . . . . 13.32 11.71 14.73 13.66 12.34 14.75 12.50 10.52 14.27 75 . . . . . . . . . . . . . . . . . . 10.43 9.08 11.55 10.74 9.68 11.56 9.95 8.17 11.51 80 . . . . . . . . . . . . . . . . . . 7.95 6.89 8.82 8.22 7.45 8.81 7.76 6.22 9.12 85 . . . . . . . . . . . . . . . . . . 5.92 5.13 6.56 6.15 5.63 6.53 5.96 4.67 7.11 90 . . . . . . . . . . . . . . . . . . 4.33 3.77 4.77 4.51 4.20 4.74 4.52 3.47 5.47 95 . . . . . . . . . . . . . . . . . . 3.13 2.76 3.42 3.27 3.11 3.38 3.41 2.58 4.16 100 . . . . . . . . . . . . . . . . . 2.26 2.03 2.44 2.36 2.31 2.40 2.58 1.93 3.15 105 . . . . . . . . . . . . . . . . . 1.65 1.52 1.76 1.73 1.73 1.73 1.96 1.47 2.39
Louisiana
0. . . . . . . . . . . . . . . . . . . 74.28 71.12 77.44 76.38 73.47 79.41 70.77 66.45 75.30 5. . . . . . . . . . . . . . . . . . . 70.11 66.99 73.23 71.87 68.88 74.96 66.93 62.66 71.43 10 . . . . . . . . . . . . . . . . . . 65.19 62.08 68.30 66.94 63.95 70.02 62.02 57.76 66.51 15 . . . . . . . . . . . . . . . . . . 60.27 57.18 63.37 62.03 59.06 65.08 57.11 52.86 61.59 20 . . . . . . . . . . . . . . . . . . 55.54 52.54 58.52 57.28 54.39 60.24 52.38 48.24 56.73 25 . . . . . . . . . . . . . . . . . . 50.91 48.08 53.72 52.58 49.81 55.41 47.88 43.96 51.98 30 . . . . . . . . . . . . . . . . . . 46.29 43.60 48.93 47.88 45.21 50.58 43.36 39.64 47.27 35 . . . . . . . . . . . . . . . . . . 41.66 39.08 44.18 43.17 40.58 45.77 38.90 35.34 42.63 40 . . . . . . . . . . . . . . . . . . 37.08 34.58 39.51 38.52 36.02 41.04 34.49 31.07 38.10 45 . . . . . . . . . . . . . . . . . . 32.61 30.19 34.94 33.99 31.58 36.40 30.20 26.88 33.70 50 . . . . . . . . . . . . . . . . . . 28.29 25.99 30.51 29.61 27.31 31.88 26.09 22.88 29.48 55 . . . . . . . . . . . . . . . . . . 24.18 22.01 26.23 25.44 23.27 27.54 22.23 19.13 25.46 60 . . . . . . . . . . . . . . . . . . 20.32 18.32 22.15 21.50 19.49 23.40 18.64 15.70 21.69 65 . . . . . . . . . . . . . . . . . . 16.74 14.96 18.32 17.85 16.03 19.52 15.38 12.63 18.20 70 . . . . . . . . . . . . . . . . . . 13.50 11.98 14.80 14.53 12.94 15.95 12.47 9.96 15.04 75 . . . . . . . . . . . . . . . . . . 10.64 9.40 11.64 11.59 10.23 12.74 9.94 7.70 12.22 80 . . . . . . . . . . . . . . . . . . 8.17 7.23 8.91 9.02 7.93 9.94 7.78 5.85 9.77 85 . . . . . . . . . . . . . . . . . . 6.12 5.47 6.63 6.89 6.04 7.59 5.99 4.39 7.69 90 . . . . . . . . . . . . . . . . . . 4.50 4.09 4.82 5.16 4.54 5.68 4.57 3.26 5.97 95 . . . . . . . . . . . . . . . . . . 3.27 3.03 3.44 3.82 3.38 4.18 3.47 2.43 4.58 100 . . . . . . . . . . . . . . . . . 2.36 2.26 2.44 2.81 2.52 3.05 2.64 1.82 3.50 105 . . . . . . . . . . . . . . . . . 1.73 1.70 1.75 2.08 1.89 2.23 2.03 1.40 2.67
See footnotes at end of table.

National Vital Statistics Reports, Vol. 60, No. 9, September 14, 2012 39
Table 2. Life expectancy, by age, race, and sex: United States, 50 states, and District of Columbia, 1999–2001—Con.
All races White Black
State and age (years) Total Males Females Total Males Females Total Males Females
Maine
0. . . . . . . . . . . . . . . . . . . 77.46 75.23 79.63 78.23 75.59 80.88 * * * 5. . . . . . . . . . . . . . . . . . . 72.87 70.71 74.99 73.63 71.07 76.23 * * * 10 . . . . . . . . . . . . . . . . . . 67.92 65.76 70.03 68.68 66.12 71.27 * * * 15 . . . . . . . . . . . . . . . . . . 62.98 60.83 65.11 63.75 61.18 66.35 * * * 20 . . . . . . . . . . . . . . . . . . 58.18 56.08 60.24 58.95 56.45 61.48 * * * 25 . . . . . . . . . . . . . . . . . . 53.43 51.42 55.38 54.19 51.78 56.62 * * * 30 . . . . . . . . . . . . . . . . . . 48.64 46.72 50.51 49.40 47.05 51.75 * * * 35 . . . . . . . . . . . . . . . . . . 43.85 41.98 45.65 44.63 42.35 46.90 * * * 40 . . . . . . . . . . . . . . . . . . 39.09 37.27 40.84 39.88 37.66 42.09 * * * 45 . . . . . . . . . . . . . . . . . . 34.41 32.66 36.10 35.22 33.08 37.36 * * * 50 . . . . . . . . . . . . . . . . . . 29.86 28.19 31.46 30.69 28.64 32.73 * * * 55 . . . . . . . . . . . . . . . . . . 25.49 23.91 26.97 26.35 24.39 28.26 * * * 60 . . . . . . . . . . . . . . . . . . 21.32 19.90 22.63 22.23 20.40 23.98 * * * 65 . . . . . . . . . . . . . . . . . . 17.41 16.20 18.48 18.39 16.72 19.95 * * * 70 . . . . . . . . . . . . . . . . . . 13.85 12.87 14.65 14.89 13.40 16.24 * * * 75 . . . . . . . . . . . . . . . . . . 10.68 9.98 11.23 11.78 10.49 12.91 * * * 80 . . . . . . . . . . . . . . . . . . 7.97 7.54 8.29 9.08 8.02 10.01 * * * 85 . . . . . . . . . . . . . . . . . . 5.76 5.57 5.90 6.84 6.01 7.56 * * * 90 . . . . . . . . . . . . . . . . . . 4.06 4.04 4.07 5.04 4.42 5.59 * * * 95 . . . . . . . . . . . . . . . . . . 2.82 2.91 2.75 3.67 3.21 4.05 * * * 100 . . . . . . . . . . . . . . . . . 1.96 2.10 1.87 2.65 2.34 2.91 * * * 105 . . . . . . . . . . . . . . . . . 1.40 1.54 1.31 1.93 1.72 2.10 * * *
Maryland
0. . . . . . . . . . . . . . . . . . . 76.36 73.55 79.08 78.13 75.58 80.66 72.20 68.41 75.78 5. . . . . . . . . . . . . . . . . . . 72.06 69.27 74.77 73.60 71.07 76.10 68.26 64.33 71.92 10 . . . . . . . . . . . . . . . . . . 67.11 64.33 69.82 68.64 66.12 71.14 63.32 59.39 66.99 15 . . . . . . . . . . . . . . . . . . 62.17 59.40 64.86 63.69 61.18 66.18 58.41 54.50 62.05 20 . . . . . . . . . . . . . . . . . . 57.40 54.73 59.98 58.89 56.43 61.31 53.71 49.98 57.15 25 . . . . . . . . . . . . . . . . . . 52.72 50.21 55.12 54.14 51.80 56.44 49.16 45.71 52.32 30 . . . . . . . . . . . . . . . . . . 48.02 45.64 50.28 49.33 47.05 51.56 44.62 41.38 47.55 35 . . . . . . . . . . . . . . . . . . 43.31 41.00 45.50 44.54 42.32 46.69 40.11 37.06 42.87 40 . . . . . . . . . . . . . . . . . . 38.65 36.39 40.77 39.80 37.65 41.89 35.79 32.96 38.32 45 . . . . . . . . . . . . . . . . . . 34.08 31.91 36.13 35.16 33.08 37.16 31.63 29.07 33.90 50 . . . . . . . . . . . . . . . . . . 29.66 27.59 31.58 30.66 28.68 32.54 27.63 25.36 29.63 55 . . . . . . . . . . . . . . . . . . 25.41 23.48 27.18 26.33 24.47 28.07 23.83 21.83 25.57 60 . . . . . . . . . . . . . . . . . . 21.39 19.65 22.95 22.23 20.51 23.80 20.25 18.49 21.74 65 . . . . . . . . . . . . . . . . . . 17.66 16.13 18.97 18.41 16.86 19.78 16.91 15.36 18.19 70 . . . . . . . . . . . . . . . . . . 14.26 12.97 15.29 14.89 13.53 16.05 13.83 12.46 14.92 75 . . . . . . . . . . . . . . . . . . 11.22 10.21 11.99 11.76 10.60 12.71 11.05 9.83 12.01 80 . . . . . . . . . . . . . . . . . . 8.59 7.88 9.12 9.04 8.11 9.80 8.60 7.51 9.49 85 . . . . . . . . . . . . . . . . . . 6.41 5.96 6.74 6.79 6.07 7.36 6.54 5.55 7.36 90 . . . . . . . . . . . . . . . . . . 4.68 4.45 4.84 4.99 4.47 5.40 4.86 3.98 5.63 95 . . . . . . . . . . . . . . . . . . 3.36 3.29 3.42 3.61 3.25 3.89 3.56 2.78 4.25 100 . . . . . . . . . . . . . . . . . 2.41 2.43 2.39 2.60 2.36 2.78 2.59 1.94 3.19 105 . . . . . . . . . . . . . . . . . 1.74 1.81 1.69 1.88 1.74 1.99 1.90 1.37 2.40
Massachusetts
0. . . . . . . . . . . . . . . . . . . 78.76 75.79 81.68 79.01 76.35 81.63 76.36 73.14 79.33 5. . . . . . . . . . . . . . . . . . . 74.14 71.29 76.98 74.27 71.54 76.94 72.12 68.75 75.21 10 . . . . . . . . . . . . . . . . . . 69.18 66.32 72.01 69.31 66.58 71.97 67.17 63.79 70.26 15 . . . . . . . . . . . . . . . . . . 64.22 61.38 67.05 64.36 61.63 67.01 62.24 58.86 65.34 20 . . . . . . . . . . . . . . . . . . 59.35 56.55 62.13 59.48 56.80 62.08 57.44 54.14 60.43 25 . . . . . . . . . . . . . . . . . . 54.53 51.80 57.23 54.65 52.03 57.19 52.69 49.50 55.56 30 . . . . . . . . . . . . . . . . . . 49.70 47.04 52.33 49.82 47.26 52.29 47.98 44.91 50.74 35 . . . . . . . . . . . . . . . . . . 44.90 42.28 47.48 45.01 42.50 47.43 43.32 40.36 45.97 40 . . . . . . . . . . . . . . . . . . 40.15 37.57 42.67 40.27 37.81 42.63 38.74 35.86 41.29 45 . . . . . . . . . . . . . . . . . . 35.49 32.97 37.95 35.62 33.22 37.91 34.28 31.50 36.71 50 . . . . . . . . . . . . . . . . . . 30.96 28.52 33.34 31.10 28.78 33.29 29.98 27.32 32.27 55 . . . . . . . . . . . . . . . . . . 26.61 24.26 28.88 26.75 24.55 28.83 25.88 23.37 28.01
See footnotes at end of table.

40 National Vital Statistics Reports, Vol. 60, No. 9, September 14, 2012
Table 2. Life expectancy, by age, race, and sex: United States, 50 states, and District of Columbia, 1999–2001—Con.
All races White Black
State and age (years) Total Males Females Total Males Females Total Males Females
Massachusetts—Con.
60 . . . . . . . . . . . . . . . . . . 22.49 20.26 24.61 22.64 20.56 24.55 22.02 19.68 23.97 65 . . . . . . . . . . . . . . . . . . 18.65 16.57 20.59 18.80 16.88 20.52 18.45 16.30 20.18 70 . . . . . . . . . . . . . . . . . . 15.14 13.24 16.86 15.28 13.56 16.78 15.20 13.27 16.70 75 . . . . . . . . . . . . . . . . . . 12.00 10.33 13.48 12.14 10.65 13.41 12.30 10.61 13.57 80 . . . . . . . . . . . . . . . . . . 9.28 7.87 10.53 9.41 8.17 10.45 9.75 8.33 10.82 85 . . . . . . . . . . . . . . . . . . 7.00 5.87 8.02 7.12 6.13 7.95 7.60 6.44 8.47 90 . . . . . . . . . . . . . . . . . . 5.18 4.30 5.97 5.28 4.53 5.91 5.83 4.92 6.51 95 . . . . . . . . . . . . . . . . . . 3.78 3.11 4.37 3.85 3.31 4.31 4.42 3.72 4.94 100 . . . . . . . . . . . . . . . . . 2.74 2.26 3.16 2.80 2.41 3.11 3.33 2.81 3.71 105 . . . . . . . . . . . . . . . . . 2.00 1.66 2.28 2.04 1.78 2.25 2.51 2.13 2.78
Michigan
0. . . . . . . . . . . . . . . . . . . 76.90 73.98 79.83 77.92 75.26 80.59 71.62 67.38 75.95 5. . . . . . . . . . . . . . . . . . . 72.52 69.77 75.33 73.46 70.88 76.08 67.76 63.26 72.27 10 . . . . . . . . . . . . . . . . . . 67.58 64.84 70.38 68.51 65.93 71.13 62.85 58.36 67.35 15 . . . . . . . . . . . . . . . . . . 62.64 59.90 65.43 63.56 60.98 66.18 57.94 53.47 62.41 20 . . . . . . . . . . . . . . . . . . 57.83 55.15 60.56 58.74 56.20 61.30 53.21 48.84 57.56 25 . . . . . . . . . . . . . . . . . . 53.09 50.52 55.69 53.95 51.50 56.41 48.68 44.55 52.77 30 . . . . . . . . . . . . . . . . . . 48.34 45.87 50.83 49.14 46.76 51.53 44.14 40.21 48.01 35 . . . . . . . . . . . . . . . . . . 43.59 41.19 46.01 44.36 42.03 46.68 39.66 35.90 43.36 40 . . . . . . . . . . . . . . . . . . 38.91 36.56 41.27 39.64 37.37 41.90 35.35 31.80 38.82 45 . . . . . . . . . . . . . . . . . . 34.34 32.05 36.62 35.01 32.81 37.19 31.24 27.95 34.42 50 . . . . . . . . . . . . . . . . . . 29.92 27.71 32.11 30.53 28.42 32.58 27.31 24.32 30.18 55 . . . . . . . . . . . . . . . . . . 25.69 23.58 27.75 26.22 24.23 28.13 23.61 20.91 26.14 60 . . . . . . . . . . . . . . . . . . 21.70 19.72 23.62 22.14 20.30 23.87 20.15 17.75 22.34 65 . . . . . . . . . . . . . . . . . . 18.01 16.17 19.74 18.34 16.67 19.86 16.94 14.84 18.82 70 . . . . . . . . . . . . . . . . . . 14.64 12.99 16.16 14.89 13.41 16.19 14.01 12.21 15.61 75 . . . . . . . . . . . . . . . . . . 11.66 10.21 12.95 11.82 10.55 12.89 11.40 9.86 12.74 80 . . . . . . . . . . . . . . . . . . 9.07 7.86 10.15 9.15 8.12 10.01 9.10 7.81 10.24 85 . . . . . . . . . . . . . . . . . . 6.91 5.93 7.78 6.92 6.12 7.59 7.14 6.07 8.10 90 . . . . . . . . . . . . . . . . . . 5.17 4.41 5.85 5.13 4.54 5.63 5.52 4.63 6.32 95 . . . . . . . . . . . . . . . . . . 3.82 3.25 4.32 3.76 3.33 4.10 4.21 3.49 4.87 100 . . . . . . . . . . . . . . . . . 2.81 2.39 3.17 2.73 2.45 2.96 3.19 2.60 3.73 105 . . . . . . . . . . . . . . . . . 2.08 1.78 2.32 2.00 1.81 2.14 2.42 1.95 2.85
Minnesota
0. . . . . . . . . . . . . . . . . . . 79.26 76.74 81.80 79.75 77.03 82.61 74.06 71.59 76.60 5. . . . . . . . . . . . . . . . . . . 74.77 72.32 77.27 75.21 72.54 78.03 69.78 67.52 72.15 10 . . . . . . . . . . . . . . . . . . 69.83 67.38 72.32 70.27 67.60 73.08 64.87 62.63 67.23 15 . . . . . . . . . . . . . . . . . . 64.89 62.45 67.36 65.32 62.66 68.12 59.96 57.73 62.30 20 . . . . . . . . . . . . . . . . . . 60.06 57.67 62.47 60.48 57.87 63.23 55.20 53.07 57.42 25 . . . . . . . . . . . . . . . . . . 55.26 52.95 57.60 55.67 53.12 58.35 50.54 48.56 52.59 30 . . . . . . . . . . . . . . . . . . 50.44 48.19 52.71 50.83 48.34 53.45 45.87 44.01 47.81 35 . . . . . . . . . . . . . . . . . . 45.62 43.42 47.83 46.01 43.56 48.57 41.22 39.41 43.07 40 . . . . . . . . . . . . . . . . . . 40.86 38.71 43.01 41.23 38.83 43.74 36.64 34.89 38.41 45 . . . . . . . . . . . . . . . . . . 36.17 34.09 38.24 36.54 34.20 38.98 32.19 30.51 33.86 50 . . . . . . . . . . . . . . . . . . 31.61 29.62 33.57 31.97 29.70 34.31 27.91 26.32 29.44 55 . . . . . . . . . . . . . . . . . . 27.20 25.33 29.01 27.55 25.38 29.79 23.84 22.37 25.21 60 . . . . . . . . . . . . . . . . . . 22.99 21.27 24.62 23.35 21.29 25.44 20.03 18.69 21.22 65 . . . . . . . . . . . . . . . . . . 19.03 17.49 20.46 19.40 17.49 21.31 16.51 15.34 17.52 70 . . . . . . . . . . . . . . . . . . 15.40 14.04 16.61 15.77 14.02 17.48 13.33 12.36 14.16 75 . . . . . . . . . . . . . . . . . . 12.14 11.00 13.13 12.52 10.96 14.01 10.55 9.76 11.20 80 . . . . . . . . . . . . . . . . . . 9.31 8.40 10.08 9.68 8.35 10.95 8.17 7.57 8.66 85 . . . . . . . . . . . . . . . . . . 6.95 6.27 7.52 7.29 6.21 8.34 6.21 5.77 6.55 90 . . . . . . . . . . . . . . . . . . 5.07 4.59 5.46 5.38 4.53 6.21 4.64 4.35 4.87 95 . . . . . . . . . . . . . . . . . . 3.63 3.32 3.89 3.90 3.26 4.53 3.44 3.25 3.58 100 . . . . . . . . . . . . . . . . . 2.58 2.39 2.74 2.81 2.34 3.26 2.54 2.43 2.62 105 . . . . . . . . . . . . . . . . . 1.85 1.75 1.94 2.04 1.71 2.34 1.89 1.84 1.93
See footnotes at end of table.

National Vital Statistics Reports, Vol. 60, No. 9, September 14, 2012 41
Table 2. Life expectancy, by age, race, and sex: United States, 50 states, and District of Columbia, 1999–2001—Con.
All races White Black
State and age (years) Total Males Females Total Males Females Total Males Females
Mississippi
0. . . . . . . . . . . . . . . . . . . 73.88 70.30 77.62 75.60 72.25 79.13 70.38 66.72 73.68 5. . . . . . . . . . . . . . . . . . . 69.80 66.30 73.49 71.25 67.97 74.72 66.58 63.03 69.82 10 . . . . . . . . . . . . . . . . . . 64.88 61.39 68.56 66.33 63.06 69.79 61.67 58.12 64.89 15 . . . . . . . . . . . . . . . . . . 59.98 56.51 63.64 61.42 58.17 64.87 56.76 53.24 59.97 20 . . . . . . . . . . . . . . . . . . 55.26 51.87 58.82 56.71 53.54 60.05 52.03 48.58 55.14 25 . . . . . . . . . . . . . . . . . . 50.64 47.38 54.05 52.03 48.97 55.24 47.47 44.18 50.41 30 . . . . . . . . . . . . . . . . . . 46.03 42.90 49.29 47.35 44.38 50.44 42.93 39.81 45.72 35 . . . . . . . . . . . . . . . . . . 41.41 38.38 44.56 42.67 39.78 45.66 38.44 35.48 41.06 40 . . . . . . . . . . . . . . . . . . 36.86 33.91 39.92 38.04 35.24 40.94 34.08 31.34 36.50 45 . . . . . . . . . . . . . . . . . . 32.42 29.55 35.39 33.52 30.80 36.31 29.91 27.43 32.07 50 . . . . . . . . . . . . . . . . . . 28.15 25.38 31.01 29.16 26.55 31.81 25.95 23.75 27.81 55 . . . . . . . . . . . . . . . . . . 24.11 21.44 26.82 25.00 22.52 27.48 22.23 20.33 23.77 60 . . . . . . . . . . . . . . . . . . 20.33 17.80 22.86 21.09 18.77 23.36 18.79 17.19 20.00 65 . . . . . . . . . . . . . . . . . . 16.86 14.50 19.17 17.48 15.35 19.50 15.63 14.35 16.53 70 . . . . . . . . . . . . . . . . . . 13.73 11.57 15.78 14.20 12.29 15.93 12.79 11.83 13.42 75 . . . . . . . . . . . . . . . . . . 10.98 9.05 12.74 11.30 9.65 12.73 10.28 9.63 10.68 80 . . . . . . . . . . . . . . . . . . 8.58 6.95 10.10 8.78 7.42 9.95 8.13 7.75 8.35 85 . . . . . . . . . . . . . . . . . . 6.59 5.24 7.85 6.68 5.61 7.60 6.33 6.18 6.41 90 . . . . . . . . . . . . . . . . . . 5.00 3.91 6.01 4.99 4.18 5.69 4.87 4.89 4.86 95 . . . . . . . . . . . . . . . . . . 3.75 2.90 4.53 3.69 3.09 4.19 3.71 3.85 3.64 100 . . . . . . . . . . . . . . . . . 2.81 2.16 3.40 2.72 2.29 3.06 2.83 3.02 2.73 105 . . . . . . . . . . . . . . . . . 2.11 1.63 2.54 2.01 1.72 2.24 2.16 2.38 2.05
Missouri
0. . . . . . . . . . . . . . . . . . . 76.52 73.59 79.46 77.08 74.29 79.93 70.94 67.22 74.50 5. . . . . . . . . . . . . . . . . . . 72.17 69.30 75.08 72.57 69.77 75.44 67.10 63.25 70.75 10 . . . . . . . . . . . . . . . . . . 67.24 64.37 70.15 67.63 64.84 70.50 62.19 58.35 65.83 15 . . . . . . . . . . . . . . . . . . 62.31 59.45 65.21 62.70 59.91 65.56 57.29 53.47 60.91 20 . . . . . . . . . . . . . . . . . . 57.58 54.81 60.38 57.95 55.23 60.73 52.67 49.01 56.09 25 . . . . . . . . . . . . . . . . . . 52.88 50.24 55.53 53.20 50.58 55.87 48.21 44.86 51.30 30 . . . . . . . . . . . . . . . . . . 48.14 45.60 50.68 48.43 45.88 51.01 43.64 40.51 46.51 35 . . . . . . . . . . . . . . . . . . 43.40 40.92 45.88 43.68 41.19 46.18 39.10 36.14 41.82 40 . . . . . . . . . . . . . . . . . . 38.74 36.32 41.14 39.00 36.58 41.43 34.64 31.79 37.23 45 . . . . . . . . . . . . . . . . . . 34.19 31.85 36.51 34.43 32.10 36.77 30.33 27.61 32.78 50 . . . . . . . . . . . . . . . . . . 29.80 27.55 32.00 30.02 27.78 32.23 26.21 23.65 28.51 55 . . . . . . . . . . . . . . . . . . 25.60 23.48 27.66 25.79 23.68 27.86 22.34 19.95 24.46 60 . . . . . . . . . . . . . . . . . . 21.65 19.67 23.53 21.80 19.84 23.68 18.75 16.56 20.65 65 . . . . . . . . . . . . . . . . . . 17.98 16.17 19.66 18.09 16.30 19.76 15.48 13.51 17.15 70 . . . . . . . . . . . . . . . . . . 14.64 13.03 16.08 14.69 13.10 16.14 12.56 10.82 13.99 75 . . . . . . . . . . . . . . . . . . 11.67 10.27 12.88 11.67 10.29 12.88 10.01 8.53 11.21 80 . . . . . . . . . . . . . . . . . . 9.08 7.93 10.08 9.05 7.92 10.04 7.83 6.61 8.81 85 . . . . . . . . . . . . . . . . . . 6.93 6.01 7.71 6.86 5.97 7.64 6.03 5.06 6.81 90 . . . . . . . . . . . . . . . . . . 5.19 4.49 5.79 5.11 4.43 5.70 4.59 3.84 5.19 95 . . . . . . . . . . . . . . . . . . 3.84 3.33 4.27 3.75 3.26 4.18 3.46 2.90 3.91 100 . . . . . . . . . . . . . . . . . 2.82 2.46 3.13 2.74 2.39 3.04 2.61 2.20 2.94 105 . . . . . . . . . . . . . . . . . 2.09 1.84 2.29 2.02 1.78 2.21 1.99 1.69 2.21
Montana
0. . . . . . . . . . . . . . . . . . . 77.74 75.18 80.56 77.94 75.07 81.24 * * * 5. . . . . . . . . . . . . . . . . . . 73.29 70.65 76.18 73.37 70.63 76.57 * * * 10 . . . . . . . . . . . . . . . . . . 68.38 65.74 71.25 68.46 65.73 71.64 * * * 15 . . . . . . . . . . . . . . . . . . 63.47 60.87 66.31 63.55 60.86 66.70 * * * 20 . . . . . . . . . . . . . . . . . . 58.72 56.16 61.51 58.77 56.10 61.88 * * * 25 . . . . . . . . . . . . . . . . . . 54.01 51.57 56.65 54.02 51.46 57.01 * * * 30 . . . . . . . . . . . . . . . . . . 49.30 46.99 51.80 49.26 46.79 52.14 * * * 35 . . . . . . . . . . . . . . . . . . 44.60 42.38 46.98 44.52 42.14 47.29 * * * 40 . . . . . . . . . . . . . . . . . . 39.92 37.79 42.21 39.82 37.54 42.49 * * * 45 . . . . . . . . . . . . . . . . . . 35.31 33.26 37.52 35.20 33.00 37.77 * * * 50 . . . . . . . . . . . . . . . . . . 30.84 28.87 32.94 30.68 28.56 33.16 * * * 55 . . . . . . . . . . . . . . . . . . 26.54 24.67 28.52 26.31 24.27 28.69 * * *
See footnotes at end of table.

42 National Vital Statistics Reports, Vol. 60, No. 9, September 14, 2012
Table 2. Life expectancy, by age, race, and sex: United States, 50 states, and District of Columbia, 1999–2001—Con.
All races White Black
State and age (years) Total Males Females Total Males Females Total Males Females
Montana—Con.
60 . . . . . . . . . . . . . . . . . . 22.46 20.71 24.28 22.14 20.18 24.41 * * * 65 . . . . . . . . . . . . . . . . . . 18.65 17.05 20.29 18.22 16.36 20.37 * * * 70 . . . . . . . . . . . . . . . . . . 15.14 13.72 16.57 14.61 12.87 16.60 * * * 75 . . . . . . . . . . . . . . . . . . 12.01 10.79 13.21 11.40 9.81 13.21 * * * 80 . . . . . . . . . . . . . . . . . . 9.30 8.29 10.27 8.63 7.25 10.24 * * * 85 . . . . . . . . . . . . . . . . . . 7.03 6.24 7.79 6.36 5.20 7.74 * * * 90 . . . . . . . . . . . . . . . . . . 5.21 4.61 5.78 4.58 3.65 5.71 * * * 95 . . . . . . . . . . . . . . . . . . 3.80 3.37 4.21 3.26 2.53 4.13 * * * 100 . . . . . . . . . . . . . . . . . 2.76 2.46 3.03 2.31 1.77 2.96 * * * 105 . . . . . . . . . . . . . . . . . 2.01 1.81 2.19 1.67 1.28 2.12 * * *
Nebraska
0. . . . . . . . . . . . . . . . . . . 78.37 76.00 80.78 78.63 76.17 81.14 71.88 69.15 74.67 5. . . . . . . . . . . . . . . . . . . 73.97 71.55 76.40 74.14 71.67 76.65 67.91 65.14 70.72 10 . . . . . . . . . . . . . . . . . . 69.03 66.61 71.47 69.21 66.74 71.72 63.02 60.26 65.82 15 . . . . . . . . . . . . . . . . . . 64.10 61.69 66.53 64.27 61.80 66.78 58.11 55.38 60.88 20 . . . . . . . . . . . . . . . . . . 59.33 57.00 61.67 59.49 57.09 61.92 53.37 50.72 56.05 25 . . . . . . . . . . . . . . . . . . 54.57 52.35 56.78 54.70 52.39 57.02 48.74 46.21 51.28 30 . . . . . . . . . . . . . . . . . . 49.76 47.59 51.92 49.88 47.61 52.15 44.17 41.77 46.56 35 . . . . . . . . . . . . . . . . . . 44.96 42.82 47.09 45.09 42.86 47.32 39.58 37.28 41.87 40 . . . . . . . . . . . . . . . . . . 40.22 38.11 42.30 40.34 38.16 42.52 35.06 32.82 37.27 45 . . . . . . . . . . . . . . . . . . 35.56 33.51 37.58 35.68 33.57 37.77 30.68 28.51 32.80 50 . . . . . . . . . . . . . . . . . . 31.03 29.07 32.94 31.14 29.14 33.11 26.49 24.40 28.51 55 . . . . . . . . . . . . . . . . . . 26.66 24.82 28.42 26.76 24.89 28.57 22.53 20.55 24.42 60 . . . . . . . . . . . . . . . . . . 22.50 20.82 24.07 22.59 20.89 24.19 18.85 17.00 20.59 65 . . . . . . . . . . . . . . . . . . 18.61 17.13 19.96 18.68 17.18 20.05 15.50 13.80 17.06 70 . . . . . . . . . . . . . . . . . . 15.04 13.77 16.15 15.07 13.79 16.21 12.53 10.98 13.87 75 . . . . . . . . . . . . . . . . . . 11.84 10.81 12.71 11.85 10.80 12.74 9.90 8.57 11.07 80 . . . . . . . . . . . . . . . . . . 9.07 8.29 9.72 9.05 8.26 9.72 7.68 6.56 8.66 85 . . . . . . . . . . . . . . . . . . 6.76 6.22 7.21 6.73 6.17 7.19 5.86 4.95 6.66 90 . . . . . . . . . . . . . . . . . . 4.93 4.58 5.21 4.89 4.53 5.18 4.41 3.70 5.05 95 . . . . . . . . . . . . . . . . . . 3.53 3.34 3.69 3.49 3.28 3.65 3.30 2.75 3.78 100 . . . . . . . . . . . . . . . . . 2.52 2.42 2.59 2.47 2.38 2.55 2.47 2.06 2.83 105 . . . . . . . . . . . . . . . . . 1.81 1.78 1.83 1.77 1.74 1.80 1.87 1.57 2.12
Nevada
0. . . . . . . . . . . . . . . . . . . 76.05 73.34 79.24 76.03 73.49 78.97 72.57 70.56 74.75 5. . . . . . . . . . . . . . . . . . . 71.64 68.96 74.80 71.57 69.06 74.48 68.58 66.36 70.93 10 . . . . . . . . . . . . . . . . . . 66.70 64.03 69.86 66.63 64.13 69.53 63.65 61.43 66.00 15 . . . . . . . . . . . . . . . . . . 61.76 59.10 64.89 61.68 59.20 64.56 58.74 56.56 61.04 20 . . . . . . . . . . . . . . . . . . 56.97 54.38 60.03 56.89 54.46 59.70 54.06 52.06 56.18 25 . . . . . . . . . . . . . . . . . . 52.25 49.76 55.18 52.15 49.83 54.85 49.49 47.68 51.39 30 . . . . . . . . . . . . . . . . . . 47.50 45.09 50.33 47.38 45.12 49.98 44.89 43.26 46.59 35 . . . . . . . . . . . . . . . . . . 42.76 40.42 45.52 42.64 40.45 45.17 40.32 38.80 41.89 40 . . . . . . . . . . . . . . . . . . 38.11 35.82 40.80 37.99 35.86 40.44 35.85 34.36 37.36 45 . . . . . . . . . . . . . . . . . . 33.58 31.36 36.18 33.45 31.41 35.79 31.53 30.06 33.02 50 . . . . . . . . . . . . . . . . . . 29.20 27.08 31.69 29.07 27.13 31.28 27.37 25.95 28.80 55 . . . . . . . . . . . . . . . . . . 25.03 23.03 27.37 24.89 23.08 26.94 23.42 22.07 24.77 60 . . . . . . . . . . . . . . . . . . 21.10 19.24 23.28 20.95 19.30 22.81 19.71 18.48 20.93 65 . . . . . . . . . . . . . . . . . . 17.49 15.78 19.45 17.32 15.84 18.94 16.30 15.21 17.35 70 . . . . . . . . . . . . . . . . . . 14.22 12.68 15.94 14.01 12.75 15.34 13.21 12.29 14.05 75 . . . . . . . . . . . . . . . . . . 11.33 9.98 12.80 11.08 10.05 12.11 10.48 9.76 11.10 80 . . . . . . . . . . . . . . . . . . 8.83 7.70 10.07 8.55 7.77 9.32 8.12 7.62 8.55 85 . . . . . . . . . . . . . . . . . . 6.75 5.84 7.75 6.45 5.90 6.99 6.16 5.86 6.41 90 . . . . . . . . . . . . . . . . . . 5.07 4.36 5.86 4.78 4.41 5.13 4.58 4.45 4.69 95 . . . . . . . . . . . . . . . . . . 3.77 3.23 4.36 3.49 3.28 3.70 3.37 3.36 3.38 100 . . . . . . . . . . . . . . . . . 2.79 2.40 3.22 2.55 2.43 2.65 2.47 2.53 2.42 105 . . . . . . . . . . . . . . . . . 2.08 1.79 2.38 1.87 1.82 1.91 1.82 1.93 1.75
See footnotes at end of table.

National Vital Statistics Reports, Vol. 60, No. 9, September 14, 2012 43
Table 2. Life expectancy, by age, race, and sex: United States, 50 states, and District of Columbia, 1999–2001—Con.
All races White Black
State and age (years) Total Males Females Total Males Females Total Males Females
New Hampshire
0. . . . . . . . . . . . . . . . . . . 78.79 76.24 81.40 78.88 76.46 81.30 * * * 5. . . . . . . . . . . . . . . . . . . 74.15 71.62 76.74 74.36 71.96 76.76 * * * 10 . . . . . . . . . . . . . . . . . . 69.18 66.66 71.77 69.39 67.00 71.79 * * * 15 . . . . . . . . . . . . . . . . . . 64.24 61.72 66.81 64.44 62.07 66.82 * * * 20 . . . . . . . . . . . . . . . . . . 59.41 56.94 61.93 59.61 57.29 61.93 * * * 25 . . . . . . . . . . . . . . . . . . 54.61 52.23 57.03 54.82 52.59 57.04 * * * 30 . . . . . . . . . . . . . . . . . . 49.77 47.47 52.11 49.98 47.83 52.12 * * * 35 . . . . . . . . . . . . . . . . . . 44.94 42.69 47.22 45.16 43.07 47.23 * * * 40 . . . . . . . . . . . . . . . . . . 40.15 37.96 42.37 40.38 38.36 42.39 * * * 45 . . . . . . . . . . . . . . . . . . 35.46 33.33 37.60 35.70 33.75 37.63 * * * 50 . . . . . . . . . . . . . . . . . . 30.89 28.85 32.94 31.15 29.28 32.97 * * * 55 . . . . . . . . . . . . . . . . . . 26.49 24.55 28.41 26.76 25.01 28.45 * * * 60 . . . . . . . . . . . . . . . . . . 22.32 20.51 24.07 22.60 20.98 24.11 * * * 65 . . . . . . . . . . . . . . . . . . 18.42 16.77 19.99 18.70 17.25 20.02 * * * 70 . . . . . . . . . . . . . . . . . . 14.87 13.40 16.22 15.15 13.88 16.25 * * * 75 . . . . . . . . . . . . . . . . . . 11.71 10.44 12.83 11.98 10.91 12.86 * * * 80 . . . . . . . . . . . . . . . . . . 8.97 7.94 9.88 9.22 8.38 9.91 * * * 85 . . . . . . . . . . . . . . . . . . 6.70 5.90 7.40 6.92 6.30 7.43 * * * 90 . . . . . . . . . . . . . . . . . . 4.90 4.30 5.41 5.08 4.64 5.44 * * * 95 . . . . . . . . . . . . . . . . . . 3.52 3.11 3.88 3.68 3.39 3.91 * * * 100 . . . . . . . . . . . . . . . . . 2.52 2.24 2.76 2.64 2.46 2.78 * * * 105 . . . . . . . . . . . . . . . . . 1.82 1.64 1.97 1.91 1.81 1.99 * * *
New Jersey
0. . . . . . . . . . . . . . . . . . . 77.58 74.77 80.32 78.59 75.82 81.32 72.30 68.85 75.54 5. . . . . . . . . . . . . . . . . . . 73.15 70.37 75.86 74.05 71.30 76.76 68.41 65.05 71.59 10 . . . . . . . . . . . . . . . . . . 68.19 65.42 70.90 69.08 66.33 71.79 63.47 60.13 66.64 15 . . . . . . . . . . . . . . . . . . 63.23 60.47 65.94 64.12 61.37 66.83 58.54 55.20 61.70 20 . . . . . . . . . . . . . . . . . . 58.37 55.64 61.04 59.25 56.54 61.92 53.74 50.44 56.84 25 . . . . . . . . . . . . . . . . . . 53.60 50.96 56.17 54.47 51.83 57.05 49.07 45.93 52.01 30 . . . . . . . . . . . . . . . . . . 48.84 46.30 51.30 49.66 47.09 52.16 44.47 41.48 47.25 35 . . . . . . . . . . . . . . . . . . 44.10 41.63 46.48 44.88 42.38 47.31 39.94 37.05 42.61 40 . . . . . . . . . . . . . . . . . . 39.41 36.99 41.73 40.15 37.70 42.51 35.52 32.72 38.09 45 . . . . . . . . . . . . . . . . . . 34.80 32.42 37.07 35.50 33.12 37.78 31.24 28.52 33.72 50 . . . . . . . . . . . . . . . . . . 30.32 28.01 32.50 30.98 28.69 33.16 27.14 24.52 29.52 55 . . . . . . . . . . . . . . . . . . 26.00 23.79 28.07 26.63 24.45 28.67 23.28 20.77 25.54 60 . . . . . . . . . . . . . . . . . . 21.91 19.83 23.82 22.50 20.46 24.38 19.68 17.32 21.79 65 . . . . . . . . . . . . . . . . . . 18.10 16.19 19.81 18.66 16.79 20.34 16.38 14.20 18.30 70 . . . . . . . . . . . . . . . . . . 14.62 12.92 16.09 15.15 13.47 16.61 13.43 11.45 15.12 75 . . . . . . . . . . . . . . . . . . 11.53 10.07 12.75 12.02 10.56 13.24 10.83 9.07 12.30 80 . . . . . . . . . . . . . . . . . . 8.84 7.66 9.83 9.29 8.09 10.30 8.58 7.07 9.84 85 . . . . . . . . . . . . . . . . . . 6.62 5.71 7.38 7.02 6.07 7.81 6.69 5.43 7.75 90 . . . . . . . . . . . . . . . . . . 4.85 4.18 5.40 5.19 4.48 5.79 5.16 4.14 6.02 95 . . . . . . . . . . . . . . . . . . 3.50 3.04 3.88 3.79 3.26 4.22 3.95 3.13 4.63 100 . . . . . . . . . . . . . . . . . 2.52 2.21 2.76 2.74 2.38 3.04 3.01 2.38 3.53 105 . . . . . . . . . . . . . . . . . 1.82 1.63 1.97 2.00 1.75 2.19 2.31 1.82 2.70
New Mexico
0. . . . . . . . . . . . . . . . . . . 77.26 74.52 80.06 77.89 75.19 80.69 72.97 71.63 74.37 5. . . . . . . . . . . . . . . . . . . 72.82 70.17 75.54 73.33 70.59 76.16 69.13 68.11 70.23 10 . . . . . . . . . . . . . . . . . . 67.87 65.23 70.58 68.38 65.64 71.20 64.26 63.26 65.36 15 . . . . . . . . . . . . . . . . . . 62.96 60.32 65.66 63.46 60.73 66.28 59.34 58.31 60.45 20 . . . . . . . . . . . . . . . . . . 58.24 55.73 60.80 58.72 56.10 61.40 54.55 53.49 55.71 25 . . . . . . . . . . . . . . . . . . 53.60 51.25 55.99 54.05 51.58 56.57 49.96 48.86 51.17 30 . . . . . . . . . . . . . . . . . . 49.00 46.80 51.21 49.37 46.99 51.77 45.38 44.24 46.63 35 . . . . . . . . . . . . . . . . . . 44.38 42.31 46.46 44.72 42.45 47.02 40.84 39.68 42.11 40 . . . . . . . . . . . . . . . . . . 39.78 37.81 41.74 40.12 37.93 42.31 36.29 35.13 37.58 45 . . . . . . . . . . . . . . . . . . 35.23 33.36 37.09 35.58 33.51 37.66 31.86 30.70 33.14 50 . . . . . . . . . . . . . . . . . . 30.80 29.05 32.52 31.17 29.25 33.08 27.59 26.42 28.88 55 . . . . . . . . . . . . . . . . . . 26.52 24.93 28.07 26.92 25.19 28.61 23.53 22.34 24.82
See footnotes at end of table.

Table 2. Life expectancy, by age, race, and sex: United States, 50 states, and District of Columbia, 1999–2001—Con.
All races White Black
State and age (years) Total Males Females Total Males Females Total Males Females
New Mexico—Con.
60 . . . . . . . . . . . . . . . . . .65 . . . . . . . . . . . . . . . . . .70 . . . . . . . . . . . . . . . . . .75 . . . . . . . . . . . . . . . . . .80 . . . . . . . . . . . . . . . . . .85 . . . . . . . . . . . . . . . . . .90 . . . . . . . . . . . . . . . . . .95 . . . . . . . . . . . . . . . . . .100 . . . . . . . . . . . . . . . . .105 . . . . . . . . . . . . . . . . .
New York
0. . . . . . . . . . . . . . . . . . .5. . . . . . . . . . . . . . . . . . .10 . . . . . . . . . . . . . . . . . .15 . . . . . . . . . . . . . . . . . .20 . . . . . . . . . . . . . . . . . .25 . . . . . . . . . . . . . . . . . .30 . . . . . . . . . . . . . . . . . .35 . . . . . . . . . . . . . . . . . .40 . . . . . . . . . . . . . . . . . .45 . . . . . . . . . . . . . . . . . .50 . . . . . . . . . . . . . . . . . .55 . . . . . . . . . . . . . . . . . .60 . . . . . . . . . . . . . . . . . .65 . . . . . . . . . . . . . . . . . .70 . . . . . . . . . . . . . . . . . .75 . . . . . . . . . . . . . . . . . .80 . . . . . . . . . . . . . . . . . .85 . . . . . . . . . . . . . . . . . .90 . . . . . . . . . . . . . . . . . .95 . . . . . . . . . . . . . . . . . .100 . . . . . . . . . . . . . . . . .105 . . . . . . . . . . . . . . . . .
North Carolina
0. . . . . . . . . . . . . . . . . . .5. . . . . . . . . . . . . . . . . . .10 . . . . . . . . . . . . . . . . . .15 . . . . . . . . . . . . . . . . . .20 . . . . . . . . . . . . . . . . . .25 . . . . . . . . . . . . . . . . . .30 . . . . . . . . . . . . . . . . . .35 . . . . . . . . . . . . . . . . . .40 . . . . . . . . . . . . . . . . . .45 . . . . . . . . . . . . . . . . . .50 . . . . . . . . . . . . . . . . . .55 . . . . . . . . . . . . . . . . . .60 . . . . . . . . . . . . . . . . . .65 . . . . . . . . . . . . . . . . . .70 . . . . . . . . . . . . . . . . . .75 . . . . . . . . . . . . . . . . . .80 . . . . . . . . . . . . . . . . . .85 . . . . . . . . . . . . . . . . . .90 . . . . . . . . . . . . . . . . . .95 . . . . . . . . . . . . . . . . . .100 . . . . . . . . . . . . . . . . .105 . . . . . . . . . . . . . . . . .
See footnotes at end of table.
22.4218.5615.0011.788.956.584.693.272.271.61
78.2073.6868.7263.7858.9354.1449.3644.6039.9035.3030.8326.5622.5118.7415.3012.24
9.567.325.504.073.002.21
76.2772.0267.0862.1657.3852.6747.9243.1938.5534.0229.6525.4921.5717.9514.6611.759.207.075.353.992.972.21
21.0417.4614.2111.348.886.825.163.862.872.15
75.1370.7365.7860.8456.0451.3546.6541.9537.3032.7628.3824.2120.2916.6913.4410.59
8.176.184.593.382.491.85
73.0568.8663.9259.0154.2949.6945.0240.3635.7831.3327.0723.0319.2615.8212.7410.05
7.785.914.433.292.451.84
23.7419.6015.7012.15
9.036.434.402.931.941.32
81.1676.5771.6166.6561.7556.8651.9947.1642.3937.7233.1628.7624.5620.6016.9613.6710.78
8.316.284.673.432.52
79.5675.2870.3465.3960.5455.7050.8546.0441.3236.7032.2027.8823.7819.9416.4113.2310.46
8.106.154.603.412.53
22.8619.0515.5512.39
9.617.275.363.892.802.02
78.6674.1569.1964.2459.3954.5949.7845.0040.2835.6631.1826.8722.7918.9815.5012.39
9.667.375.524.072.982.18
77.2772.8067.8662.9358.1453.4048.6243.8539.1634.5830.1425.8821.8618.1114.6911.648.996.795.033.672.671.95
21.3717.8514.6511.829.377.305.614.263.222.44
75.7871.3166.3661.4156.6051.8847.1542.4337.7733.2228.8324.6420.7017.0713.7910.90
8.446.404.783.522.591.92
74.2769.8964.9560.0455.3050.6545.9541.2436.6232.1227.7823.6619.7916.2313.0010.18
7.805.854.323.162.321.72
24.2920.1816.3412.86
9.817.255.213.652.541.78
81.4976.9571.9967.0362.1257.2352.3547.5042.7138.0033.4028.9624.7020.7016.9913.6410.69
8.196.144.523.292.39
80.3475.8070.8565.9161.0656.2051.3146.4841.7037.0232.4528.0423.8319.8616.1912.8810.01
7.585.624.102.962.14
19.7216.2313.1010.32
7.986.064.533.362.501.88
74.2470.0965.1560.2255.4150.7146.0141.4036.8932.5428.3524.3820.6617.2414.1611.429.037.025.384.093.092.34
71.4567.6862.7557.8153.0548.4143.7839.2334.8830.7426.8023.1019.6516.4713.5810.99
8.716.775.193.932.972.25
18.5315.0411.939.247.005.193.802.762.011.50
70.1366.0561.1156.1951.4446.8942.3037.7933.4029.1925.1721.4017.9014.7211.909.457.385.684.323.272.471.89
66.3362.6057.6752.7548.0743.5739.0434.6230.4726.6022.9619.5716.4513.6011.048.796.865.253.952.932.171.63
21.0117.5014.3211.519.097.055.404.083.082.32
77.8473.6568.7063.7658.8754.0149.2144.5039.8735.3530.9926.8222.8719.2115.8512.8510.23
8.006.164.683.532.66
76.6872.9267.9863.0358.1653.3648.6143.9239.3434.8830.5926.4822.6219.0315.7512.8210.26
8.086.274.803.652.78
44 National Vital Statistics Reports, Vol. 60, No. 9, September 14, 2012

National Vital Statistics Reports, Vol. 60, No. 9, September 14, 2012 45
Table 2. Life expectancy, by age, race, and sex: United States, 50 states, and District of Columbia, 1999–2001—Con.
All races White Black
State and age (years) Total Males Females Total Males Females Total Males Females
North Dakota
0. . . . . . . . . . . . . . . . . . . 79.06 75.96 82.61 79.53 76.65 82.67 * * * 5. . . . . . . . . . . . . . . . . . . 74.66 71.60 78.18 75.12 72.35 78.17 * * * 10 . . . . . . . . . . . . . . . . . . 69.70 66.65 73.20 70.14 67.38 73.18 * * * 15 . . . . . . . . . . . . . . . . . . 64.77 61.73 68.25 65.21 62.46 68.23 * * * 20 . . . . . . . . . . . . . . . . . . 59.96 56.97 63.38 60.38 57.68 63.36 * * * 25 . . . . . . . . . . . . . . . . . . 55.19 52.28 58.51 55.57 52.94 58.46 * * * 30 . . . . . . . . . . . . . . . . . . 50.39 47.56 53.62 50.76 48.20 53.55 * * * 35 . . . . . . . . . . . . . . . . . . 45.60 42.82 48.76 45.95 43.44 48.67 * * * 40 . . . . . . . . . . . . . . . . . . 40.85 38.12 43.96 41.18 38.73 43.84 * * * 45 . . . . . . . . . . . . . . . . . . 36.18 33.50 39.24 36.50 34.11 39.09 * * * 50 . . . . . . . . . . . . . . . . . . 31.65 29.02 34.62 31.93 29.61 34.44 * * * 55 . . . . . . . . . . . . . . . . . . 27.28 24.73 30.14 27.54 25.30 29.93 * * * 60 . . . . . . . . . . . . . . . . . . 23.13 20.69 25.85 23.35 21.22 25.59 * * * 65 . . . . . . . . . . . . . . . . . . 19.24 16.95 21.78 19.42 17.44 21.50 * * * 70 . . . . . . . . . . . . . . . . . . 15.67 13.57 17.98 15.82 14.01 17.69 * * * 75 . . . . . . . . . . . . . . . . . . 12.49 10.61 14.53 12.60 10.99 14.24 * * * 80 . . . . . . . . . . . . . . . . . . 9.70 8.09 11.46 9.79 8.42 11.19 * * * 85 . . . . . . . . . . . . . . . . . . 7.36 6.03 8.84 7.42 6.30 8.58 * * * 90 . . . . . . . . . . . . . . . . . . 5.48 4.42 6.66 5.51 4.62 6.43 * * * 95 . . . . . . . . . . . . . . . . . . 4.01 3.20 4.92 4.03 3.35 4.72 * * * 100 . . . . . . . . . . . . . . . . . 2.92 2.31 3.59 2.92 2.43 3.43 * * * 105 . . . . . . . . . . . . . . . . . 2.14 1.69 2.61 2.13 1.77 2.48 * * *
Ohio
0. . . . . . . . . . . . . . . . . . . 76.49 73.94 78.95 77.31 74.58 80.01 71.86 68.60 74.91 5. . . . . . . . . . . . . . . . . . . 72.17 69.68 74.59 72.88 70.19 75.55 68.08 64.84 71.12 10 . . . . . . . . . . . . . . . . . . 67.23 64.74 69.64 67.93 65.25 70.60 63.14 59.91 66.17 15 . . . . . . . . . . . . . . . . . . 62.29 59.80 64.69 62.99 60.32 65.65 58.21 54.99 61.23 20 . . . . . . . . . . . . . . . . . . 57.46 55.04 59.80 58.16 55.54 60.76 53.44 50.31 56.35 25 . . . . . . . . . . . . . . . . . . 52.69 50.37 54.92 53.38 50.85 55.87 48.75 45.77 51.51 30 . . . . . . . . . . . . . . . . . . 47.91 45.65 50.06 48.57 46.09 51.00 44.10 41.26 46.72 35 . . . . . . . . . . . . . . . . . . 43.15 40.93 45.25 43.79 41.36 46.17 39.52 36.81 42.00 40 . . . . . . . . . . . . . . . . . . 38.45 36.29 40.50 39.07 36.71 41.39 35.07 32.52 37.39 45 . . . . . . . . . . . . . . . . . . 33.86 31.77 35.82 34.46 32.18 36.69 30.80 28.45 32.92 50 . . . . . . . . . . . . . . . . . . 32.96 30.89 34.90 33.56 31.29 35.76 29.97 27.66 32.05 55 . . . . . . . . . . . . . . . . . . 25.15 23.30 26.83 25.72 23.66 27.68 22.86 20.94 24.54 60 . . . . . . . . . . . . . . . . . . 21.12 19.44 22.61 21.68 19.76 23.45 19.25 17.54 20.70 65 . . . . . . . . . . . . . . . . . . 17.37 15.90 18.63 17.92 16.18 19.49 15.92 14.43 17.17 70 . . . . . . . . . . . . . . . . . . 13.97 12.73 14.98 14.49 12.94 15.85 12.92 11.62 13.98 75 . . . . . . . . . . . . . . . . . . 10.96 9.97 11.72 11.46 10.11 12.59 10.27 9.15 11.17 80 . . . . . . . . . . . . . . . . . . 8.36 7.64 8.91 8.83 7.72 9.76 7.99 7.03 8.76 85 . . . . . . . . . . . . . . . . . . 6.22 5.74 6.58 6.65 5.78 7.39 6.09 5.28 6.75 90 . . . . . . . . . . . . . . . . . . 4.54 4.25 4.74 4.92 4.25 5.47 4.56 3.89 5.12 95 . . . . . . . . . . . . . . . . . . 3.26 3.12 3.36 3.59 3.10 3.98 3.38 2.84 3.84 100 . . . . . . . . . . . . . . . . . 2.34 2.29 2.36 2.60 2.27 2.88 2.50 2.06 2.87 105 . . . . . . . . . . . . . . . . . 1.69 1.71 1.69 1.91 1.68 2.08 1.87 1.52 2.16
Oklahoma
0. . . . . . . . . . . . . . . . . . . 75.61 72.75 78.59 75.82 73.00 78.75 71.74 68.97 74.34 5. . . . . . . . . . . . . . . . . . . 71.32 68.52 74.27 71.50 68.74 74.38 67.58 65.09 70.01 10 . . . . . . . . . . . . . . . . . . 66.39 63.58 69.34 66.57 63.81 69.45 62.67 60.16 65.11 15 . . . . . . . . . . . . . . . . . . 61.48 58.70 64.40 61.66 58.92 64.51 57.76 55.27 60.19 20 . . . . . . . . . . . . . . . . . . 56.72 53.98 59.57 56.90 54.22 59.68 53.06 50.66 55.36 25 . . . . . . . . . . . . . . . . . . 52.01 49.38 54.73 52.18 49.60 54.85 48.42 46.18 50.54 30 . . . . . . . . . . . . . . . . . . 47.29 44.76 49.90 47.44 44.96 50.00 43.73 41.58 45.74 35 . . . . . . . . . . . . . . . . . . 42.58 40.12 45.12 42.75 40.34 45.22 39.09 37.02 41.00 40 . . . . . . . . . . . . . . . . . . 37.96 35.56 40.42 38.14 35.80 40.52 34.58 32.60 36.41 45 . . . . . . . . . . . . . . . . . . 33.45 31.13 35.82 33.63 31.38 35.92 30.24 28.35 31.97 50 . . . . . . . . . . . . . . . . . . 29.11 26.87 31.37 29.29 27.13 31.46 26.10 24.32 27.69 55 . . . . . . . . . . . . . . . . . . 24.96 22.84 27.09 25.14 23.11 27.17 22.20 20.54 23.64
See footnotes at end of table.

46 National Vital Statistics Reports, Vol. 60, No. 9, September 14, 2012
Table 2. Life expectancy, by age, race, and sex: United States, 50 states, and District of Columbia, 1999–2001—Con.
All races White Black
State and age (years) Total Males Females Total Males Females Total Males Females
Oklahoma—Con.
60 . . . . . . . . . . . . . . . . . . 21.07 19.08 23.04 21.24 19.35 23.10 18.57 17.06 19.85 65 . . . . . . . . . . . . . . . . . . 17.48 15.65 19.25 17.64 15.92 19.29 15.27 13.93 16.37 70 . . . . . . . . . . . . . . . . . . 14.22 12.58 15.77 14.35 12.82 15.77 12.32 11.16 13.25 75 . . . . . . . . . . . . . . . . . . 11.34 9.91 12.65 11.44 10.12 12.62 9.76 8.79 10.51 80 . . . . . . . . . . . . . . . . . . 8.84 7.66 9.93 8.91 7.83 9.89 7.58 6.80 8.18 85 . . . . . . . . . . . . . . . . . . 6.76 5.81 7.64 6.81 5.95 7.58 5.79 5.19 6.25 90 . . . . . . . . . . . . . . . . . . 5.09 4.35 5.77 5.11 4.46 5.70 4.37 3.92 4.71 95 . . . . . . . . . . . . . . . . . . 3.79 3.23 4.30 3.79 3.31 4.22 3.28 2.95 3.52 100 . . . . . . . . . . . . . . . . . 2.81 2.40 3.17 2.80 2.46 3.10 2.46 2.23 2.62 105 . . . . . . . . . . . . . . . . . 2.09 1.80 2.34 2.08 1.84 2.28 1.86 1.70 1.97
Oregon
0. . . . . . . . . . . . . . . . . . . 78.09 75.82 80.37 77.96 75.72 80.20 74.03 70.67 78.24 5. . . . . . . . . . . . . . . . . . . 73.60 71.38 75.84 73.47 71.29 75.67 69.69 66.56 73.72 10 . . . . . . . . . . . . . . . . . . 68.66 66.43 70.91 68.53 66.35 70.74 64.77 61.66 68.77 15 . . . . . . . . . . . . . . . . . . 63.72 61.51 65.95 63.59 61.42 65.79 59.85 56.76 63.84 20 . . . . . . . . . . . . . . . . . . 58.90 56.74 61.06 58.77 56.66 60.90 55.09 52.08 58.97 25 . . . . . . . . . . . . . . . . . . 54.10 52.05 56.16 53.98 51.96 56.00 50.42 47.53 54.14 30 . . . . . . . . . . . . . . . . . . 49.31 47.34 51.27 49.18 47.23 51.11 45.77 42.95 49.38 35 . . . . . . . . . . . . . . . . . . 44.53 42.61 46.43 44.40 42.51 46.27 41.16 38.38 44.72 40 . . . . . . . . . . . . . . . . . . 39.80 37.94 41.63 39.69 37.86 41.49 36.64 33.92 40.10 45 . . . . . . . . . . . . . . . . . . 35.17 33.38 36.91 35.07 33.32 36.78 32.26 29.60 35.61 50 . . . . . . . . . . . . . . . . . . 30.66 28.98 32.29 30.58 28.93 32.18 28.07 25.49 31.26 55 . . . . . . . . . . . . . . . . . . 26.33 24.77 27.82 26.27 24.74 27.73 24.09 21.62 27.10 60 . . . . . . . . . . . . . . . . . . 22.22 20.81 23.54 22.17 20.79 23.46 20.38 18.04 23.16 65 . . . . . . . . . . . . . . . . . . 18.40 17.16 19.51 18.35 17.14 19.43 16.97 14.79 19.49 70 . . . . . . . . . . . . . . . . . . 14.89 13.84 15.80 14.84 13.82 15.73 13.89 11.91 16.13 75 . . . . . . . . . . . . . . . . . . 11.77 10.91 12.48 11.73 10.89 12.42 11.19 9.41 13.12 80 . . . . . . . . . . . . . . . . . . 9.06 8.41 9.59 9.02 8.39 9.54 8.82 7.31 10.48 85 . . . . . . . . . . . . . . . . . . 6.81 6.35 7.18 6.78 6.33 7.14 6.84 5.59 8.23 90 . . . . . . . . . . . . . . . . . . 5.01 4.71 5.25 4.99 4.70 5.22 5.24 4.22 6.36 95 . . . . . . . . . . . . . . . . . . 3.63 3.46 3.77 3.61 3.44 3.75 3.97 3.18 4.85 100 . . . . . . . . . . . . . . . . . 2.62 2.53 2.68 2.60 2.52 2.67 3.00 2.39 3.67 105 . . . . . . . . . . . . . . . . . 1.90 1.87 1.92 1.89 1.86 1.91 2.28 1.82 2.77
Pennsylvania
0. . . . . . . . . . . . . . . . . . . 77.02 74.09 79.90 77.87 75.03 80.65 71.32 67.26 75.34 5. . . . . . . . . . . . . . . . . . . 72.65 69.77 75.50 73.39 70.61 76.14 67.56 63.52 71.58 10 . . . . . . . . . . . . . . . . . . 67.71 64.83 70.56 68.45 65.67 71.20 62.61 58.58 66.62 15 . . . . . . . . . . . . . . . . . . 62.76 59.89 65.60 63.50 60.73 66.24 57.70 53.68 61.70 20 . . . . . . . . . . . . . . . . . . 57.95 55.15 60.72 58.68 55.96 61.35 52.97 49.07 56.81 25 . . . . . . . . . . . . . . . . . . 53.23 50.56 55.85 53.94 51.34 56.48 48.46 44.84 51.98 30 . . . . . . . . . . . . . . . . . . 48.49 45.93 50.99 49.16 46.63 51.61 43.89 40.47 47.21 35 . . . . . . . . . . . . . . . . . . 43.73 41.24 46.16 44.38 41.91 46.77 39.38 36.11 42.54 40 . . . . . . . . . . . . . . . . . . 39.04 36.60 41.41 39.67 37.26 42.00 34.94 31.77 37.99 45 . . . . . . . . . . . . . . . . . . 34.45 32.07 36.74 35.06 32.72 37.30 30.65 27.58 33.58 50 . . . . . . . . . . . . . . . . . . 29.99 27.70 32.17 30.59 28.35 32.70 26.55 23.60 29.35 55 . . . . . . . . . . . . . . . . . . 25.72 23.55 27.76 26.28 24.18 28.24 22.70 19.89 25.35 60 . . . . . . . . . . . . . . . . . . 21.68 19.66 23.54 22.21 20.26 23.97 19.13 16.48 21.59 65 . . . . . . . . . . . . . . . . . . 17.93 16.09 19.56 18.41 16.66 19.93 15.88 13.42 18.12 70 . . . . . . . . . . . . . . . . . . 14.51 12.89 15.90 14.93 13.42 16.21 12.98 10.74 15.01 75 . . . . . . . . . . . . . . . . . . 11.47 10.10 12.61 11.84 10.57 12.86 10.44 8.44 12.25 80 . . . . . . . . . . . . . . . . . . 8.84 7.74 9.74 9.14 8.16 9.93 8.26 6.52 9.85 85 . . . . . . . . . . . . . . . . . . 6.65 5.82 7.33 6.90 6.17 7.47 6.44 4.98 7.80 90 . . . . . . . . . . . . . . . . . . 4.91 4.30 5.39 5.09 4.59 5.48 4.97 3.76 6.10 95 . . . . . . . . . . . . . . . . . . 3.57 3.16 3.90 3.71 3.38 3.95 3.81 2.84 4.72 100 . . . . . . . . . . . . . . . . . 2.58 2.31 2.79 2.68 2.48 2.82 2.92 2.15 3.63 105 . . . . . . . . . . . . . . . . . 1.88 1.72 2.01 1.95 1.84 2.02 2.25 1.65 2.79
See footnotes at end of table.

National Vital Statistics Reports, Vol. 60, No. 9, September 14, 2012 47
Table 2. Life expectancy, by age, race, and sex: United States, 50 states, and District of Columbia, 1999–2001—Con.
All races White Black
State and age (years) Total Males Females Total Males Females Total Males Females
Rhode Island
0. . . . . . . . . . . . . . . . . . . 78.65 75.83 81.42 78.85 76.06 81.60 74.84 72.18 77.39 5. . . . . . . . . . . . . . . . . . . 74.21 71.39 76.99 74.16 71.31 76.95 70.51 67.93 72.99 10 . . . . . . . . . . . . . . . . . . 69.27 66.45 72.04 69.21 66.37 71.99 65.59 63.03 68.05 15 . . . . . . . . . . . . . . . . . . 64.31 61.50 67.08 64.25 61.42 67.03 60.68 58.12 63.13 20 . . . . . . . . . . . . . . . . . . 59.45 56.69 62.16 59.38 56.59 62.11 55.86 53.35 58.27 25 . . . . . . . . . . . . . . . . . . 54.64 51.95 57.27 54.56 51.83 57.23 51.13 48.69 53.46 30 . . . . . . . . . . . . . . . . . . 49.83 47.20 52.40 49.74 47.07 52.35 46.44 44.06 48.70 35 . . . . . . . . . . . . . . . . . . 45.03 42.45 47.54 44.95 42.33 47.49 41.82 39.49 44.03 40 . . . . . . . . . . . . . . . . . . 40.31 37.78 42.77 40.23 37.68 42.70 37.31 35.04 39.46 45 . . . . . . . . . . . . . . . . . . 35.69 33.22 38.08 35.62 33.15 37.99 32.94 30.74 35.00 50 . . . . . . . . . . . . . . . . . . 31.21 28.82 33.50 31.14 28.77 33.39 28.75 26.63 30.69 55 . . . . . . . . . . . . . . . . . . 26.91 24.63 29.07 26.84 24.60 28.95 24.77 22.76 26.57 60 . . . . . . . . . . . . . . . . . . 22.83 20.68 24.83 22.76 20.66 24.70 21.03 19.16 22.66 65 . . . . . . . . . . . . . . . . . . 19.02 17.03 20.84 18.95 17.01 20.70 17.55 15.87 19.01 70 . . . . . . . . . . . . . . . . . . 15.53 13.71 17.15 15.44 13.68 16.97 14.39 12.93 15.67 75 . . . . . . . . . . . . . . . . . . 12.41 10.79 13.82 12.28 10.74 13.60 11.58 10.36 12.67 80 . . . . . . . . . . . . . . . . . . 9.68 8.31 10.88 9.53 8.25 10.63 9.16 8.16 10.04 85 . . . . . . . . . . . . . . . . . . 7.38 6.26 8.38 7.23 6.19 8.11 7.12 6.33 7.80 90 . . . . . . . . . . . . . . . . . . 5.53 4.64 6.31 5.37 4.57 6.05 5.44 4.86 5.95 95 . . . . . . . . . . . . . . . . . . 4.08 3.40 4.67 3.93 3.34 4.43 4.12 3.70 4.47 100 . . . . . . . . . . . . . . . . . 2.98 2.48 3.42 2.85 2.43 3.21 3.09 2.81 3.33 105 . . . . . . . . . . . . . . . . . 2.19 1.83 2.50 2.08 1.79 2.32 2.33 2.14 2.48
South Carolina
0. . . . . . . . . . . . . . . . . . . 75.04 71.68 78.49 76.70 73.76 79.77 71.45 67.34 75.41 5. . . . . . . . . . . . . . . . . . . 70.83 67.52 74.26 72.20 69.22 75.31 67.67 63.65 71.59 10 . . . . . . . . . . . . . . . . . . 65.90 62.59 69.33 67.27 64.27 70.38 62.75 58.74 66.65 15 . . . . . . . . . . . . . . . . . . 60.98 57.68 64.39 62.34 59.36 65.44 57.83 53.84 61.71 20 . . . . . . . . . . . . . . . . . . 56.22 53.01 59.54 57.60 54.70 60.60 53.05 49.13 56.85 25 . . . . . . . . . . . . . . . . . . 51.55 48.46 54.71 52.88 50.08 55.76 48.46 44.73 52.04 30 . . . . . . . . . . . . . . . . . . 46.87 43.88 49.91 48.14 45.43 50.91 43.89 40.30 47.33 35 . . . . . . . . . . . . . . . . . . 42.19 39.28 45.15 43.41 40.77 46.09 39.34 35.89 42.65 40 . . . . . . . . . . . . . . . . . . 37.60 34.75 40.48 38.75 36.18 41.35 34.89 31.54 38.09 45 . . . . . . . . . . . . . . . . . . 33.12 30.36 35.90 34.18 31.70 36.67 30.59 27.36 33.66 50 . . . . . . . . . . . . . . . . . . 28.80 26.15 31.44 29.76 27.41 32.11 26.49 23.41 29.39 55 . . . . . . . . . . . . . . . . . . 24.68 22.18 27.15 25.53 23.33 27.69 22.63 19.73 25.32 60 . . . . . . . . . . . . . . . . . . 20.82 18.50 23.06 21.54 19.52 23.47 19.06 16.35 21.50 65 . . . . . . . . . . . . . . . . . . 17.25 15.14 19.23 17.83 16.02 19.51 15.80 13.32 17.97 70 . . . . . . . . . . . . . . . . . . 14.02 12.16 15.70 14.47 12.89 15.85 12.89 10.66 14.76 75 . . . . . . . . . . . . . . . . . . 11.16 9.57 12.54 11.47 10.16 12.56 10.32 8.39 11.91 80 . . . . . . . . . . . . . . . . . . 8.68 7.39 9.78 8.87 7.85 9.71 8.11 6.49 9.45 85 . . . . . . . . . . . . . . . . . . 6.61 5.61 7.46 6.71 5.95 7.32 6.28 4.96 7.37 90 . . . . . . . . . . . . . . . . . . 4.95 4.20 5.57 4.97 4.45 5.40 4.80 3.76 5.66 95 . . . . . . . . . . . . . . . . . . 3.66 3.13 4.09 3.64 3.30 3.91 3.65 2.84 4.30 100 . . . . . . . . . . . . . . . . . 2.69 2.34 2.98 2.65 2.44 2.81 2.76 2.16 3.25 105 . . . . . . . . . . . . . . . . . 1.99 1.76 2.17 1.94 1.83 2.03 2.11 1.66 2.46
South Dakota
0. . . . . . . . . . . . . . . . . . . 78.34 75.19 81.79 79.33 76.35 82.61 * * * 5. . . . . . . . . . . . . . . . . . . 74.03 70.92 77.45 74.85 71.86 78.11 * * * 10 . . . . . . . . . . . . . . . . . . 69.11 65.98 72.54 69.93 66.94 73.19 * * * 15 . . . . . . . . . . . . . . . . . . 64.23 61.10 67.66 65.05 62.09 68.28 * * * 20 . . . . . . . . . . . . . . . . . . 59.48 56.46 62.78 60.26 57.39 63.39 * * * 25 . . . . . . . . . . . . . . . . . . 54.77 51.88 57.91 55.48 52.70 58.50 * * * 30 . . . . . . . . . . . . . . . . . . 50.03 47.21 53.10 50.69 47.96 53.65 * * * 35 . . . . . . . . . . . . . . . . . . 45.29 42.51 48.30 45.90 43.22 48.81 * * * 40 . . . . . . . . . . . . . . . . . . 40.60 37.89 43.54 41.17 38.52 44.02 * * * 45 . . . . . . . . . . . . . . . . . . 36.01 33.38 38.85 36.50 33.92 39.28 * * * 50 . . . . . . . . . . . . . . . . . . 31.55 29.03 34.24 31.95 29.47 34.62 * * * 55 . . . . . . . . . . . . . . . . . . 27.25 24.88 29.76 27.56 25.20 30.06 * * *
See footnotes at end of table.

48 National Vital Statistics Reports, Vol. 60, No. 9, September 14, 2012
Table 2. Life expectancy, by age, race, and sex: United States, 50 states, and District of Columbia, 1999–2001—Con.
All races White Black
State and age (years) Total Males Females Total Males Females Total Males Females
South Dakota—Con.
60 . . . . . . . . . . . . . . . . . . 23.16 20.97 25.44 23.37 21.16 25.67 * * * 65 . . . . . . . . . . . . . . . . . . 19.33 17.34 21.35 19.43 17.42 21.48 * * * 70 . . . . . . . . . . . . . . . . . . 15.79 14.05 17.54 15.78 14.03 17.56 * * * 75 . . . . . . . . . . . . . . . . . . 12.62 11.14 14.08 12.52 11.04 13.98 * * * 80 . . . . . . . . . . . . . . . . . . 9.85 8.66 11.02 9.66 8.48 10.82 * * * 85 . . . . . . . . . . . . . . . . . . 7.51 6.59 8.41 7.27 6.38 8.13 * * * 90 . . . . . . . . . . . . . . . . . . 5.61 4.94 6.26 5.34 4.71 5.95 * * * 95 . . . . . . . . . . . . . . . . . . 4.13 3.65 4.57 3.86 3.43 4.25 * * * 100 . . . . . . . . . . . . . . . . . 3.01 2.70 3.29 2.76 2.50 2.99 * * * 105 . . . . . . . . . . . . . . . . . 2.19 2.00 2.36 1.98 1.83 2.11 * * *
Tennessee
0. . . . . . . . . . . . . . . . . . . 75.29 71.98 78.66 76.22 73.31 79.28 70.68 66.86 74.16 5. . . . . . . . . . . . . . . . . . . 70.95 67.75 74.25 71.70 68.64 74.84 66.85 63.24 70.23 10 . . . . . . . . . . . . . . . . . . 66.01 62.82 69.30 66.75 63.70 69.89 61.94 58.34 65.31 15 . . . . . . . . . . . . . . . . . . 61.10 57.92 64.38 61.83 58.79 64.96 57.05 53.45 60.42 20 . . . . . . . . . . . . . . . . . . 56.35 53.26 59.54 57.08 54.11 60.12 52.32 48.81 55.57 25 . . . . . . . . . . . . . . . . . . 51.68 48.71 54.72 52.37 49.51 55.29 47.77 44.45 50.81 30 . . . . . . . . . . . . . . . . . . 46.99 44.12 49.91 47.64 44.86 50.46 43.20 40.04 46.07 35 . . . . . . . . . . . . . . . . . . 42.30 39.49 45.14 42.92 40.21 45.66 38.67 35.65 41.42 40 . . . . . . . . . . . . . . . . . . 37.67 34.94 40.43 38.28 35.63 40.94 34.25 31.35 36.87 45 . . . . . . . . . . . . . . . . . . 33.17 30.51 35.84 33.75 31.18 36.31 29.98 27.20 32.47 50 . . . . . . . . . . . . . . . . . . 28.82 26.27 31.37 29.38 26.92 31.81 25.91 23.27 28.24 55 . . . . . . . . . . . . . . . . . . 24.69 22.26 27.09 25.21 22.88 27.49 22.09 19.62 24.23 60 . . . . . . . . . . . . . . . . . . 20.82 18.54 23.02 21.29 19.11 23.37 18.56 16.27 20.48 65 . . . . . . . . . . . . . . . . . . 17.24 15.14 19.21 17.66 15.67 19.50 15.34 13.27 17.03 70 . . . . . . . . . . . . . . . . . . 14.01 12.12 15.72 14.37 12.59 15.93 12.46 10.63 13.92 75 . . . . . . . . . . . . . . . . . . 11.16 9.50 12.60 11.44 9.91 12.73 9.96 8.38 11.17 80 . . . . . . . . . . . . . . . . . . 8.68 7.31 9.88 8.90 7.65 9.94 7.81 6.50 8.82 85 . . . . . . . . . . . . . . . . . . 6.62 5.52 7.59 6.78 5.80 7.60 6.03 4.98 6.84 90 . . . . . . . . . . . . . . . . . . 4.97 4.11 5.72 5.07 4.34 5.69 4.61 3.78 5.24 95 . . . . . . . . . . . . . . . . . . 3.69 3.05 4.25 3.75 3.22 4.19 3.49 2.87 3.97 100 . . . . . . . . . . . . . . . . . 2.73 2.26 3.13 2.76 2.39 3.06 2.65 2.18 3.00 105 . . . . . . . . . . . . . . . . . 2.04 1.70 2.31 2.04 1.79 2.24 2.02 1.68 2.27
Texas
0. . . . . . . . . . . . . . . . . . . 77.04 74.12 80.05 77.51 74.74 80.35 72.06 69.18 74.76 5. . . . . . . . . . . . . . . . . . . 72.56 69.72 75.51 73.02 70.29 75.83 68.05 65.28 70.68 10 . . . . . . . . . . . . . . . . . . 67.62 64.79 70.56 68.08 65.35 70.89 63.13 60.37 65.75 15 . . . . . . . . . . . . . . . . . . 62.69 59.87 65.62 63.15 60.43 65.94 58.21 55.46 60.81 20 . . . . . . . . . . . . . . . . . . 57.91 55.15 60.76 58.37 55.71 61.09 53.43 50.76 55.95 25 . . . . . . . . . . . . . . . . . . 53.18 50.52 55.90 53.63 51.08 56.22 48.77 46.22 51.14 30 . . . . . . . . . . . . . . . . . . 48.41 45.84 51.04 48.86 46.39 51.35 44.11 41.66 46.38 35 . . . . . . . . . . . . . . . . . . 43.66 41.14 46.21 44.10 41.69 46.52 39.48 37.11 41.67 40 . . . . . . . . . . . . . . . . . . 38.97 36.52 41.45 39.40 37.06 41.74 34.96 32.67 37.06 45 . . . . . . . . . . . . . . . . . . 34.39 32.01 36.79 34.81 32.56 37.05 30.60 28.40 32.59 50 . . . . . . . . . . . . . . . . . . 29.96 27.68 32.25 30.37 28.22 32.48 26.42 24.34 28.29 55 . . . . . . . . . . . . . . . . . . 25.72 23.56 27.87 26.11 24.08 28.07 22.49 20.54 24.20 60 . . . . . . . . . . . . . . . . . . 21.73 19.70 23.70 22.08 20.21 23.86 18.83 17.04 20.36 65 . . . . . . . . . . . . . . . . . . 18.02 16.17 19.79 18.34 16.65 19.90 15.50 13.88 16.84 70 . . . . . . . . . . . . . . . . . . 14.65 12.99 16.19 14.93 13.44 16.25 12.53 11.10 13.66 75 . . . . . . . . . . . . . . . . . . 11.66 10.22 12.95 11.89 10.63 12.96 9.92 8.71 10.87 80 . . . . . . . . . . . . . . . . . . 9.06 7.88 10.13 9.24 8.24 10.10 7.71 6.72 8.48 85 . . . . . . . . . . . . . . . . . . 6.90 5.95 7.75 7.03 6.26 7.68 5.89 5.11 6.50 90 . . . . . . . . . . . . . . . . . . 5.16 4.43 5.80 5.25 4.69 5.72 4.44 3.85 4.91 95 . . . . . . . . . . . . . . . . . . 3.80 3.27 4.28 3.86 3.47 4.18 3.33 2.89 3.67 100 . . . . . . . . . . . . . . . . . 2.79 2.41 3.12 2.82 2.57 3.03 2.49 2.17 2.73 105 . . . . . . . . . . . . . . . . . 2.06 1.80 2.28 2.07 1.91 2.20 1.88 1.66 2.05
See footnotes at end of table.

National Vital Statistics Reports, Vol. 60, No. 9, September 14, 2012 49
Table 2. Life expectancy, by age, race, and sex: United States, 50 states, and District of Columbia, 1999–2001—Con.
All races White Black
State and age (years) Total Males Females Total Males Females Total Males Females
Utah
0. . . . . . . . . . . . . . . . . . . 78.89 76.84 80.95 78.93 76.95 80.93 * * * 5. . . . . . . . . . . . . . . . . . . 74.36 72.37 76.37 74.40 72.47 76.35 * * * 10 . . . . . . . . . . . . . . . . . . 69.41 67.42 71.41 69.45 67.52 71.39 * * * 15 . . . . . . . . . . . . . . . . . . 64.47 62.50 66.45 64.51 62.61 66.42 * * * 20 . . . . . . . . . . . . . . . . . . 59.65 57.75 61.56 59.69 57.85 61.53 * * * 25 . . . . . . . . . . . . . . . . . . 54.86 53.05 56.67 54.88 53.13 56.64 * * * 30 . . . . . . . . . . . . . . . . . . 50.09 48.36 51.82 50.08 48.38 51.78 * * * 35 . . . . . . . . . . . . . . . . . . 45.35 43.66 47.02 45.35 43.70 46.99 * * * 40 . . . . . . . . . . . . . . . . . . 40.65 39.01 42.27 40.66 39.07 42.22 * * * 45 . . . . . . . . . . . . . . . . . . 36.03 34.45 37.58 36.03 34.51 37.51 * * * 50 . . . . . . . . . . . . . . . . . . 31.52 30.02 32.98 31.50 30.06 32.88 * * * 55 . . . . . . . . . . . . . . . . . . 27.16 25.77 28.48 27.11 25.80 28.37 * * * 60 . . . . . . . . . . . . . . . . . . 22.98 21.76 24.13 22.92 21.76 24.01 * * * 65 . . . . . . . . . . . . . . . . . . 19.03 18.01 19.96 18.97 17.99 19.87 * * * 70 . . . . . . . . . . . . . . . . . . 15.37 14.58 16.06 15.30 14.56 15.96 * * * 75 . . . . . . . . . . . . . . . . . . 12.06 11.54 12.50 11.99 11.51 12.38 * * * 80 . . . . . . . . . . . . . . . . . . 9.17 8.93 9.37 9.08 8.89 9.24 * * * 85 . . . . . . . . . . . . . . . . . . 6.75 6.76 6.75 6.66 6.72 6.63 * * * 90 . . . . . . . . . . . . . . . . . . 4.82 5.02 4.69 4.73 4.98 4.57 * * * 95 . . . . . . . . . . . . . . . . . . 3.37 3.68 3.17 3.29 3.64 3.07 * * * 100 . . . . . . . . . . . . . . . . . 2.34 2.69 2.12 2.27 2.66 2.04 * * * 105 . . . . . . . . . . . . . . . . . 1.65 1.98 1.45 1.60 1.95 1.39 * * *
Vermont
0. . . . . . . . . . . . . . . . . . . 78.24 76.18 80.29 78.57 76.30 80.90 * * * 5. . . . . . . . . . . . . . . . . . . 73.67 71.50 75.82 73.95 71.50 76.42 * * * 10 . . . . . . . . . . . . . . . . . . 68.72 66.54 70.88 69.01 66.55 71.49 * * * 15 . . . . . . . . . . . . . . . . . . 63.78 61.61 65.92 64.08 61.61 66.58 * * * 20 . . . . . . . . . . . . . . . . . . 58.95 56.82 61.04 59.24 56.82 61.68 * * * 25 . . . . . . . . . . . . . . . . . . 54.19 52.17 56.17 54.47 52.15 56.79 * * * 30 . . . . . . . . . . . . . . . . . . 49.41 47.48 51.28 49.70 47.47 51.92 * * * 35 . . . . . . . . . . . . . . . . . . 44.61 42.76 46.41 44.92 42.76 47.08 * * * 40 . . . . . . . . . . . . . . . . . . 39.86 38.06 41.61 40.18 38.07 42.28 * * * 45 . . . . . . . . . . . . . . . . . . 35.19 33.45 36.87 35.51 33.47 37.54 * * * 50 . . . . . . . . . . . . . . . . . . 30.63 28.99 32.21 30.97 29.01 32.90 * * * 55 . . . . . . . . . . . . . . . . . . 26.24 24.72 27.68 26.59 24.73 28.40 * * * 60 . . . . . . . . . . . . . . . . . . 22.07 20.69 23.33 22.42 20.69 24.07 * * * 65 . . . . . . . . . . . . . . . . . . 18.17 16.96 19.23 18.52 16.95 19.99 * * * 70 . . . . . . . . . . . . . . . . . . 14.58 13.56 15.44 14.95 13.54 16.22 * * * 75 . . . . . . . . . . . . . . . . . . 11.39 10.57 12.05 11.77 10.55 12.82 * * * 80 . . . . . . . . . . . . . . . . . . 8.64 8.03 9.12 9.00 8.01 9.86 * * * 85 . . . . . . . . . . . . . . . . . . 6.37 5.96 6.69 6.71 5.95 7.38 * * * 90 . . . . . . . . . . . . . . . . . . 4.59 4.34 4.78 4.90 4.33 5.39 * * * 95 . . . . . . . . . . . . . . . . . . 3.26 3.12 3.35 3.52 3.12 3.86 * * * 100 . . . . . . . . . . . . . . . . . 2.30 2.25 2.34 2.51 2.24 2.74 * * * 105 . . . . . . . . . . . . . . . . . 1.65 1.64 1.65 1.81 1.64 1.95 * * *
Virginia
0. . . . . . . . . . . . . . . . . . . 76.95 74.48 79.34 78.17 75.62 80.69 72.79 69.37 76.20 5. . . . . . . . . . . . . . . . . . . 72.58 70.18 74.92 73.66 71.17 76.14 68.89 65.56 72.25 10 . . . . . . . . . . . . . . . . . . 67.63 65.22 69.97 68.70 66.21 71.18 63.94 60.61 67.31 15 . . . . . . . . . . . . . . . . . . 62.68 60.28 65.02 63.75 61.26 66.24 59.02 55.69 62.37 20 . . . . . . . . . . . . . . . . . . 57.87 55.54 60.14 58.93 56.49 61.35 54.26 51.04 57.50 25 . . . . . . . . . . . . . . . . . . 53.10 50.85 55.27 54.13 51.77 56.47 49.58 46.48 52.68 30 . . . . . . . . . . . . . . . . . . 48.31 46.14 50.39 49.31 47.00 51.57 44.93 41.96 47.89 35 . . . . . . . . . . . . . . . . . . 43.54 41.41 45.56 44.50 42.24 46.71 40.30 37.40 43.17 40 . . . . . . . . . . . . . . . . . . 38.82 36.74 40.79 39.75 37.54 41.91 35.74 32.91 38.54 45 . . . . . . . . . . . . . . . . . . 34.21 32.19 36.11 35.10 32.95 37.18 31.32 28.56 34.05 50 . . . . . . . . . . . . . . . . . . 29.72 27.79 31.52 30.58 28.51 32.56 27.09 24.42 29.71 55 . . . . . . . . . . . . . . . . . . 25.41 23.61 27.06 26.24 24.28 28.10 23.08 20.53 25.57
See footnotes at end of table.

50 National Vital Statistics Reports, Vol. 60, No. 9, September 14, 2012
Table 2. Life expectancy, by age, race, and sex: United States, 50 states, and District of Columbia, 1999–2001—Con.
All races White Black
State and age (years) Total Males Females Total Males Females Total Males Females
Virginia—Con.
60 . . . . . . . . . . . . . . . . . . 21.33 19.69 22.79 22.13 20.30 23.83 19.36 16.94 21.68 65 . . . . . . . . . . . . . . . . . . 17.53 16.09 18.76 18.30 16.62 19.81 15.95 13.71 18.07 70 . . . . . . . . . . . . . . . . . . 14.07 12.86 15.05 14.80 13.31 16.08 12.91 10.86 14.80 75 . . . . . . . . . . . . . . . . . . 11.00 10.05 11.72 11.69 10.42 12.73 10.24 8.44 11.89 80 . . . . . . . . . . . . . . . . . . 8.35 7.67 8.86 8.98 7.96 9.82 7.96 6.43 9.38 85 . . . . . . . . . . . . . . . . . . 6.17 5.74 6.49 6.74 5.96 7.38 6.09 4.82 7.27 90 . . . . . . . . . . . . . . . . . . 4.46 4.22 4.62 4.95 4.38 5.41 4.59 3.57 5.54 95 . . . . . . . . . . . . . . . . . . 3.17 3.08 3.24 3.59 3.19 3.90 3.44 2.64 4.17 100 . . . . . . . . . . . . . . . . . 2.25 2.25 2.25 2.58 2.32 2.79 2.58 1.97 3.13 105 . . . . . . . . . . . . . . . . . 1.62 1.67 1.59 1.87 1.71 2.00 1.95 1.49 2.35
Washington
0. . . . . . . . . . . . . . . . . . . 78.64 76.18 81.14 78.51 76.10 80.98 74.29 71.90 77.11 5. . . . . . . . . . . . . . . . . . . 74.09 71.70 76.53 73.98 71.61 76.42 70.08 67.68 72.90 10 . . . . . . . . . . . . . . . . . . 69.14 66.76 71.57 69.03 66.67 71.47 65.16 62.78 67.97 15 . . . . . . . . . . . . . . . . . . 64.19 61.82 66.62 64.09 61.74 66.51 60.23 57.87 63.01 20 . . . . . . . . . . . . . . . . . . 59.37 57.07 61.72 59.27 56.97 61.62 55.40 53.10 58.11 25 . . . . . . . . . . . . . . . . . . 54.61 52.39 56.85 54.49 52.30 56.74 50.73 48.58 53.24 30 . . . . . . . . . . . . . . . . . . 49.79 47.65 51.96 49.67 47.53 51.85 45.98 43.88 48.42 35 . . . . . . . . . . . . . . . . . . 44.99 42.89 47.10 44.88 42.79 47.00 41.28 39.22 43.66 40 . . . . . . . . . . . . . . . . . . 40.25 38.20 42.29 40.14 38.11 42.19 36.68 34.66 38.99 45 . . . . . . . . . . . . . . . . . . 35.60 33.62 37.57 35.50 33.54 37.46 32.22 30.26 34.44 50 . . . . . . . . . . . . . . . . . . 31.09 29.20 32.96 30.98 29.13 32.83 27.94 26.05 30.04 55 . . . . . . . . . . . . . . . . . . 26.75 24.96 28.50 26.64 24.90 28.34 23.87 22.08 25.83 60 . . . . . . . . . . . . . . . . . . 22.64 20.98 24.24 22.51 20.92 24.04 20.08 18.39 21.86 65 . . . . . . . . . . . . . . . . . . 18.80 17.28 20.23 18.66 17.22 19.99 16.60 15.03 18.17 70 . . . . . . . . . . . . . . . . . . 15.28 13.92 16.50 15.12 13.85 16.26 13.48 12.04 14.82 75 . . . . . . . . . . . . . . . . . . 12.12 10.95 13.14 11.97 10.88 12.90 10.70 9.46 11.85 80 . . . . . . . . . . . . . . . . . . 9.38 8.42 10.21 9.22 8.35 9.97 8.32 7.28 9.28 85 . . . . . . . . . . . . . . . . . . 7.08 6.34 7.73 6.94 6.27 7.51 6.35 5.52 7.13 90 . . . . . . . . . . . . . . . . . . 5.24 4.69 5.72 5.11 4.62 5.52 4.78 4.13 5.38 95 . . . . . . . . . . . . . . . . . . 3.82 3.42 4.16 3.71 3.37 3.99 3.56 3.07 4.01 100 . . . . . . . . . . . . . . . . . 2.77 2.49 2.99 2.67 2.45 2.85 2.65 2.28 2.97 105 . . . . . . . . . . . . . . . . . 2.01 1.83 2.16 1.94 1.80 2.05 1.98 1.72 2.21
West Virginia
0. . . . . . . . . . . . . . . . . . . 75.28 72.75 77.84 75.51 72.75 78.36 71.34 69.87 72.65 5. . . . . . . . . . . . . . . . . . . 70.86 68.26 73.47 71.06 68.22 73.96 67.28 65.61 68.73 10 . . . . . . . . . . . . . . . . . . 65.92 63.32 68.54 66.13 63.29 69.03 62.50 60.77 64.02 15 . . . . . . . . . . . . . . . . . . 61.01 58.40 63.62 61.21 58.37 64.11 57.69 55.85 59.32 20 . . . . . . . . . . . . . . . . . . 56.25 53.70 58.79 56.45 53.67 59.28 52.91 51.02 54.61 25 . . . . . . . . . . . . . . . . . . 51.54 49.12 53.95 51.74 49.09 54.43 48.20 46.30 49.90 30 . . . . . . . . . . . . . . . . . . 46.82 44.48 49.14 47.02 44.45 49.62 43.56 41.67 45.25 35 . . . . . . . . . . . . . . . . . . 42.11 39.83 44.36 42.30 39.79 44.82 39.02 37.15 40.69 40 . . . . . . . . . . . . . . . . . . 37.47 35.27 39.63 37.66 35.24 40.09 34.62 32.78 36.24 45 . . . . . . . . . . . . . . . . . . 32.94 30.85 34.98 33.13 30.80 35.45 30.38 28.58 31.95 50 . . . . . . . . . . . . . . . . . . 28.56 26.62 30.43 28.75 26.55 30.92 26.35 24.59 27.85 55 . . . . . . . . . . . . . . . . . . 24.38 22.61 26.04 24.58 22.53 26.56 22.57 20.85 23.96 60 . . . . . . . . . . . . . . . . . . 20.45 18.88 21.85 20.66 18.79 22.41 19.05 17.41 20.34 65 . . . . . . . . . . . . . . . . . . 16.80 15.48 17.94 17.04 15.37 18.54 15.84 14.30 17.01 70 . . . . . . . . . . . . . . . . . . 13.50 12.44 14.36 13.76 12.33 15.00 12.96 11.55 14.01 75 . . . . . . . . . . . . . . . . . . 10.59 9.80 11.19 10.87 9.69 11.85 10.42 9.17 11.36 80 . . . . . . . . . . . . . . . . . . 8.10 7.58 8.48 8.38 7.46 9.14 8.25 7.17 9.07 85 . . . . . . . . . . . . . . . . . . 6.05 5.75 6.26 6.33 5.65 6.88 6.44 5.53 7.14 90 . . . . . . . . . . . . . . . . . . 4.43 4.31 4.51 4.70 4.21 5.08 4.97 4.22 5.55 95 . . . . . . . . . . . . . . . . . . 3.21 3.21 3.21 3.44 3.12 3.69 3.81 3.21 4.28 100 . . . . . . . . . . . . . . . . . 2.32 2.39 2.27 2.52 2.32 2.67 2.92 2.44 3.28 105 . . . . . . . . . . . . . . . . . 1.70 1.80 1.63 1.86 1.74 1.94 2.24 1.87 2.52
See footnotes at end of table.

National Vital Statistics Reports, Vol. 60, No. 9, September 14, 2012 51
Table 2. Life expectancy, by age, race, and sex: United States, 50 states, and District of Columbia, 1999–2001—Con.
All races White Black
State and age (years) Total Males Females Total Males Females Total Males Females
Wisconsin
0. . . . . . . . . . . . . . . . . . . 78.56 75.61 81.64 78.93 76.12 81.87 71.51 68.41 74.34 5. . . . . . . . . . . . . . . . . . . 74.11 71.27 77.11 74.47 71.68 77.39 67.80 64.91 70.53 10 . . . . . . . . . . . . . . . . . . 69.16 66.33 72.15 69.52 66.75 72.44 62.88 60.00 65.61 15 . . . . . . . . . . . . . . . . . . 64.22 61.40 67.21 64.58 61.80 67.49 58.00 55.13 60.71 20 . . . . . . . . . . . . . . . . . . 59.42 56.67 62.33 59.76 57.05 62.60 53.33 50.61 55.86 25 . . . . . . . . . . . . . . . . . . 54.67 52.02 57.45 54.99 52.38 57.71 48.79 46.31 51.07 30 . . . . . . . . . . . . . . . . . . 49.86 47.28 52.57 50.17 47.62 52.82 44.14 41.72 46.34 35 . . . . . . . . . . . . . . . . . . 45.06 42.52 47.71 45.35 42.85 47.95 39.55 37.18 41.71 40 . . . . . . . . . . . . . . . . . . 40.31 37.82 42.91 40.59 38.14 43.13 35.09 32.80 37.18 45 . . . . . . . . . . . . . . . . . . 35.67 33.24 38.19 35.92 33.53 38.38 30.78 28.57 32.78 50 . . . . . . . . . . . . . . . . . . 31.15 28.81 33.57 31.38 29.08 33.73 26.66 24.56 28.53 55 . . . . . . . . . . . . . . . . . . 26.82 24.57 29.11 27.01 24.82 29.22 22.77 20.81 24.49 60 . . . . . . . . . . . . . . . . . . 22.70 20.59 24.83 22.86 20.81 24.90 19.14 17.35 20.68 65 . . . . . . . . . . . . . . . . . . 18.87 16.91 20.80 18.99 17.10 20.82 15.81 14.22 17.15 70 . . . . . . . . . . . . . . . . . . 15.35 13.57 17.06 15.44 13.75 17.04 12.82 11.46 13.95 75 . . . . . . . . . . . . . . . . . . 12.21 10.64 13.67 12.28 10.80 13.62 10.21 9.07 11.11 80 . . . . . . . . . . . . . . . . . . 9.46 8.14 10.70 9.51 8.29 10.62 7.96 7.07 8.66 85 . . . . . . . . . . . . . . . . . . 7.17 6.10 8.18 7.19 6.22 8.07 6.10 5.43 6.62 90 . . . . . . . . . . . . . . . . . . 5.32 4.49 6.11 5.33 4.59 5.99 4.61 4.13 4.97 95 . . . . . . . . . . . . . . . . . . 3.89 3.27 4.48 3.89 3.35 4.37 3.45 3.13 3.69 100 . . . . . . . . . . . . . . . . . 2.83 2.38 3.25 2.81 2.44 3.14 2.58 2.37 2.73 105 . . . . . . . . . . . . . . . . . 2.07 1.75 2.35 2.05 1.79 2.26 1.94 1.82 2.02
Wyoming
0. . . . . . . . . . . . . . . . . . . 76.64 74.83 78.55 77.74 75.33 80.41 * * * 5. . . . . . . . . . . . . . . . . . . 72.20 70.29 74.25 73.21 70.74 75.95 * * * 10 . . . . . . . . . . . . . . . . . . 67.30 65.39 69.34 68.31 65.84 71.04 * * * 15 . . . . . . . . . . . . . . . . . . 62.43 60.59 64.40 63.47 61.04 66.15 * * * 20 . . . . . . . . . . . . . . . . . . 57.69 55.93 59.54 58.74 56.36 61.36 * * * 25 . . . . . . . . . . . . . . . . . . 53.01 51.38 54.71 54.02 51.74 56.53 * * * 30 . . . . . . . . . . . . . . . . . . 48.28 46.74 49.87 49.31 47.13 51.70 * * * 35 . . . . . . . . . . . . . . . . . . 43.56 42.09 45.08 44.61 42.51 46.90 * * * 40 . . . . . . . . . . . . . . . . . . 38.91 37.53 40.33 39.94 37.92 42.14 * * * 45 . . . . . . . . . . . . . . . . . . 34.34 33.03 35.68 35.33 33.39 37.45 * * * 50 . . . . . . . . . . . . . . . . . . 29.87 28.62 31.14 30.84 28.97 32.86 * * * 55 . . . . . . . . . . . . . . . . . . 25.55 24.36 26.77 26.50 24.72 28.42 * * * 60 . . . . . . . . . . . . . . . . . . 21.45 20.31 22.59 22.38 20.69 24.18 * * * 65 . . . . . . . . . . . . . . . . . . 17.62 16.55 18.68 18.54 16.96 20.20 * * * 70 . . . . . . . . . . . . . . . . . . 14.13 13.13 15.10 15.02 13.58 16.52 * * * 75 . . . . . . . . . . . . . . . . . . 11.04 10.14 11.90 11.90 10.61 13.21 * * * 80 . . . . . . . . . . . . . . . . . . 8.39 7.62 9.14 9.19 8.09 10.31 * * * 85 . . . . . . . . . . . . . . . . . . 6.22 5.58 6.84 6.93 6.03 7.86 * * * 90 . . . . . . . . . . . . . . . . . . 4.51 4.00 5.01 5.12 4.41 5.86 * * * 95 . . . . . . . . . . . . . . . . . . 3.23 2.84 3.61 3.74 3.19 4.30 * * * 100 . . . . . . . . . . . . . . . . . 2.31 2.02 2.59 2.71 2.30 3.12 * * * 105 . . . . . . . . . . . . . . . . . 1.68 1.47 1.87 1.98 1.69 2.26 * * *
* Figure does not meet standards of reliability or precision; see ‘‘Technical Notes.’’

52 National Vital Statistics Reports, Vol. 60, No. 9, September 14, 2012
Technical Notes In many ways, the methodology used to construct the decennial
state life tables for 1999–2001 is similar to that used for the national tables for 1999–2001 (2). However, differences do exist in the technique for smoothing the curve for the probability of dying (qx). The qx is calculated first based on the observed data (mortality counts and census populations). The distribution of qx is then smoothed using the technique described in this report. A combination of several statistical methods is used to allow for the flexibility of smoothing. Some of these methods have been used in previous decennial life tables, and some are new applications developed for use in constructing the current state-specific tables. The new methods and those specific to construction of the state life tables are described in this report. Additional details about the general methodology used in construction of both national and state tables are available from the methodology report for the national life tables (2). Methodologies common to all state life tables are described in the text, while specific applications for individual states are described in tabular form (Table I).
Data used for computing state life tables
The data used in preparing the 1999–2001 state decennial life tables (Table II) consist of:
a. A complete count of resident deaths occurring in the United States during the 3-year period of 1999–2001. These data come from death certificates filed in state vital statistics offices and are reported to the National Center for Health Statistics as part of the National Vital Statistics System (NVSS).
b. Population counts for each state on the census date April 1, 2000. c. Birth counts (also from NVSS) for each year from 1997 through
2001, inclusive.
The data are disaggregated by age, sex, and race. Race-specific tables are published for white and black populations separately, while tables for the total population include other races in addition to white and black.
Birth counts, rather than population counts, are used in calculating the denominators of the mortality rates at ages under 2 years. This is justified because census populations for ages under 2 years are believed to be underenumerated (8). Thus, birth counts may be expected to produce a more accurate estimate of the average population under age 2 during the 3-year period than is provided by the population enumerated on the census date.
With regard to census data, actuarial theory indicates that the population counts used in calculations should ideally be those as of a central date during the 3-year period, in this case, July 1, 2000. For calculation of the decennial life tables, the enumerated populations as of April 1, 2000, are used as if they were populations as of July 1. This is done to be consistent with death rates published for the United States and each state. Death rates for census years in published U.S. vital statistics use populations as of April 1 in the denominator. However, the difference between the two sets of population counts is very small.
Some preliminary adjustments were made to the data before the life tables were constructed. The description of these preliminary
adjustments is available from the methodology report for the national life tables (2). One of these adjustments is for missing age at death. No age at death was reported for 1,134 deaths out of a total of 7,211,175 (0.016 percent) deaths during 1999–2001. Age was imputed for these deaths based on the assumption that they are distributed among the various age groups in the same proportions as deaths where age is reported. The imputed ages at death used in the national tables were also used for the state tables, so no additional age imputation was needed for each state.
In six states (Iowa, Minnesota, Nebraska, New Mexico, Oregon, and Rhode Island), the total number of deaths ranged between 300 and 700 among black male or black female populations and did not meet publication criteria for estimation reliability as in previous decennial life tables (5,8). For these populations, qx was calculated for each single year from 1970 through 2001 (6). Using these annual qx values, a mixed probability model was then used to estimate the age-specific qx for 1999–2001 for these populations (6).
Because of the issue of data reliability (age misreporting or small populations) for the oldest ages (i.e., ages 85 and over), the indices of the life table for ages over 85 were not derived from observed data but were extrapolated from a statistical model (see below).
Componential smoothing methods The life table parameter qx is the proportion of a group of
persons at exact age x in a given year who are expected to die before attaining age x + 1. The qx is also called the probability of dying. Other parameters in the complete life table are derived from qx, which itself depends on the number of deaths Dx and the midyear population Px for each age interval x to x + 1 observed during the calendar year of interest. The age distribution of the probability of dying should be, according to demographic and actuarial theory, regular and smooth (4). In practice, however, especially when the number of deaths is small, the observed age distribution of qx tends to be irregular. In general, the smaller the number of deaths, the more jagged and less smooth the age distribution becomes. Therefore, smoothing procedures are often applied to observed data, including Dx, Px, and qx, to achieve a more regular and smooth age distribution.
The age-specific number of deaths Dx, population counts Px, and probability of dying qx were smoothed by applying multiple statistical methods either separately or jointly: a) Beer’s graduation technique applied to Dx and Px ; b) the Heligman-Pollard (HP) parametric model directly applied to observed (i.e., unsmoothed) qx; c) the HP parametric model applied to smoothed qx (by Beer’s method); and d) locally weighted smoothing (LOESS) applied to observed qx. Methods a, b, and d are considered one-step smoothing processes, while method c is a two-step process. Descriptions of these four smoothing methods are given in the following sections.
Beer’s graduation technique on Dx , Px
For each gender and race- and state-specific population, Dx for years 1999–2001 and Px for decennial year 2000 were smoothed separately using Beer’s graduation technique. Beer’s ordinary minimized fifth difference formula was applied by using Beer’s multipliers on observed deaths in 5-year age intervals to get smoothed single year of age data. Similarly, Beer’s multipliers were applied to

National Vital Statistics Reports, Vol. 60, No. 9, September 14, 2012 53
Table I. Componential smoothing methods, by ages used to construct final qx curves for state populations
Method1 White White Black Black States and area for qx males females males females Males Females
Alabama . . . . . . . . . . . Beer 0–24 0–24 0–24 0–24 0–19 0–24 LOESS . . . . . . . . . . . . . . . . . . merge 25–40 25–40 25–40 25–40 20–25 25–30 HP on data 41–110 41–110 41–110 . . . . . . 31–110 HP on Beer . . . . . . . . . 41–110 26–110 . . .
Alaska. . . . . . . . . . . . . Beer 0–24 . . . . . . . . . 0–13 . . . LOESS . . . . . . . . . . . . . . . . . . merge 25–40 . . . . . . . . . 14–19 8–14 HP on data 41–110 . . . . . . . . . 20–110 0–7, 15–110 HP on Beer . . . 0–110 . . . . . . . . . . . .
Arizona . . . . . . . . . . . . Beer 0–24 0–24 . . . . . . 0–19 . . . LOESS . . . . . . 0–24 0–21 . . . . . . merge 25–40 25–40 25–40 22–40 20–25 . . . HP on data 41–110 41–110 41–110 41–110 . . . . . . HP on Beer . . . . . . . . . . . . 26–110 0–110
Arkansas . . . . . . . . . . . Beer . . . 0–24 0–24 0–24 0–19 . . . LOESS 0–24 . . . . . . . . . . . . . . . merge 25–40 25–40 25–40 25–40 20–25 . . . HP on data 41–110 41–110 41–110 . . . . . . . . . HP on Beer . . . . . . . . . 41–110 26–110 0–110
California . . . . . . . . . . . Beer 0–24 0–24 0–24 0–24 0–19 . . . LOESS . . . . . . . . . . . . . . . . . . merge 25–40 25–40 25–40 25–40 20–25 . . . HP on data 41–110 41–110 41–110 41–110 . . . . . . HP on Beer . . . . . . . . . . . . 26–110 0–110
Colorado . . . . . . . . . . . Beer 0–24 0–24 0–24 . . . 0–19 . . . LOESS . . . . . . . . . 0–24 . . . . . . merge 25–40 25–40 25–40 25–40 20–25 . . . HP on data 41–110 41–110 41–110 . . . . . . . . . HP on Beer . . . . . . . . . 41–110 26–110 0–110
Connecticut . . . . . . . . . . Beer 0–24 0–24 . . . 0–24 0–19 0–24 LOESS . . . . . . 0–24 . . . . . . . . . merge 25–40 25–40 25–40 25–40 20–25 25–27 HP on data 41–110 41–110 41–110 . . . . . . 28–110 HP on Beer . . . . . . . . . 41–110 26–110 . . .
Delaware . . . . . . . . . . . Beer 0–13 . . . . . . 0–10 0–5 . . . LOESS . . . 0–24 0–24 . . . . . . . . . merge 14–19 25–40 25–40 11–14 13–Jun . . . HP on data 20–110 41–110 41–110 . . . . . . . . . HP on Beer . . . . . . . . . 15–110 14–110 0–110
District of Columbia . . . . . Beer 0–8 . . . . . . . . . 0–2 . . . LOESS . . . . . . 0–24 0–21 . . . . . . merge 19–Sep . . . 25–40 22–40 3–13 . . . HP on data . . . . . . 41–110 41–110 . . . . . . HP on Beer 20–110 0–110 . . . . . . 14–110 0–110
Florida. . . . . . . . . . . . . Beer 0–24 0–24 0–24 0–24 0–19 0–24 LOESS . . . . . . . . . . . . . . . . . . merge 25–40 25–40 25–40 25–40 20–25 25–30 HP on data 41–110 41–110 . . . . . . . . . . . . HP on Beer . . . . . . 41–110 41–110 26–110 31–110
Georgia . . . . . . . . . . . . Beer 0–24 0–24 0–24 0–24 0–19 0–36 LOESS . . . . . . . . . . . . . . . . . . merge 25–40 25–40 25–40 25–40 20–25 37–41 HP on data 41–110 41–110 41–110 . . . . . . . . . HP on Beer . . . . . . . . . 41–110 26–110 42–110
See footnotes at end of table.

Table I. Componential smoothing methods, by ages used to construct final qx curves for state populations—Con.
States and area
Method1
for qx
White males
White females
Black males
Black females Males Females
Hawaii . . . . . . . . . . . . .
Idaho . . . . . . . . . . . . .
Illinois . . . . . . . . . . . . .
Indiana . . . . . . . . . . . .
Iowa . . . . . . . . . . . . . .
Kansas . . . . . . . . . . . .
Kentucky . . . . . . . . . . .
Louisiana . . . . . . . . . . .
Maine . . . . . . . . . . . . .
Maryland . . . . . . . . . . .
Massachusetts . . . . . . . .
See footnotes at end of table.
Beer LOESS merge HP on data HP on Beer
Beer LOESS merge HP on data HP on Beer
Beer LOESS merge HP on data HP on Beer
Beer LOESS merge HP on data HP on Beer
Beer LOESS merge HP on data HP on Beer
Beer LOESS merge HP on data HP on Beer
Beer LOESS merge HP on data HP on Beer
Beer LOESS merge HP on data HP on Beer
Beer LOESS merge HP on data HP on Beer
Beer LOESS merge HP on data HP on Beer
Beer LOESS merge HP on data HP on Beer
. . . 0–24
25–40 41–110
. . .
. . . 0–24
25–40 41–110
. . .
0–24 . . .
25–40 41–110
. . .
0–24 . . .
25–40 41–110
. . .
0–24 . . .
25–40 41–110
. . .
0–24 . . .
25–40 41–110
. . .
0–24 . . .
25–40 41–110
. . .
. . . 0–24
25–40 41–110
. . .
0–24 . . .
25–40 41–110
. . .
0–24 . . .
25–40 41–110
. . .
. . . 0–24
25–40 41–110
. . .
. . .
. . .
. . .
. . . 0–110
0–24 . . .
25–40 41–110
. . .
0–24 . . .
25–40 41–110
. . .
0–24 . . .
25–40 41–110
. . .
0–24 . . .
25–40 41–110
. . .
0–24 . . .
25–40 41–110
. . .
0–24 . . .
25–40 41–110
. . .
. . . 0–24 . . .
25–40 41–110
. . .
. . .
. . . 0–110
. . .
0–24 . . .
25–40 41–110
. . .
. . . 0–24
25–40 41–110
. . .
. . .
. . .
. . .
. . .
. . .
. . .
. . .
. . .
. . .
. . .
0–24 . . .
25–40 41–110
. . .
0–24 . . .
25–40 41–110
. . .
. . . 0–24
25–40 41–110
. . .
0–24 . . .
25–40 41–110
. . .
. . . 0–24
25–40 41–110
. . .
0–24 . . .
25–40 . . .
41–110
. . .
. . .
. . .
. . .
. . .
. . . 0–24
25–40 41–110
. . .
. . . 0–24
25–40 41–110
. . .
. . .
. . .
. . .
. . .
. . .
. . .
. . .
. . .
. . .
. . .
0–22 . . .
23–40 . . .
41–110
. . . 0–24 25–40
. . . 41–110
. . . 0–24
25–40 41–110
. . .
0–12 . . .
13–16 17–110
. . .
0–22 . . .
23–40 . . .
41–110
0–24 . . .
25–40 . . .
41–110
. . .
. . .
. . .
. . .
. . .
0–24 . . .
25–40 41–110
. . .
. . . 0–13 . . .
14–110 . . .
0–19 . . .
20–25 . . .
26–110
. . .
. . .
. . .
. . . 0–110
0–19 . . .
20–25 . . .
26–110
0–19 . . .
20–25 . . .
26–110
0–13 . . .
14–19 20–110
. . .
0–19 . . .
20–25 . . .
26–110
0–19 . . .
20–25 . . .
26–110
0–19 . . .
20–25 . . .
26–110
0–19 . . .
20–25 . . .
26–110
0–19 . . .
20–25 . . .
26–110
0–19 . . .
20–25 . . .
26–110
0–22 . . .
23–25 . . .
26–110
0–36 . . .
37–41 . . .
42–110
. . .
. . .
. . .
. . . 0–110
0–13 . . .
14–19 . . .
20–110
9–32 . . .
33–38 0–8
39–110
. . .
. . .
. . .
. . . 0–110
0–22 . . .
23–25 . . .
26–110
0–41 . . .
42–48 . . .
49–110
0–54 . . .
55–60 . . .
61–110
0–24 . . .
25–30 . . .
31–110
. . .
. . .
. . .
. . . 0–110
54 National Vital Statistics Reports, Vol. 60, No. 9, September 14, 2012

Table I. Componential smoothing methods, by ages used to construct final qx curves for state populations—Con.
States and area
Method1
for qx
White males
White females
Black males
Black females Males Females
Michigan . . . . . . . . . . .
Minnesota. . . . . . . . . . .
Mississippi . . . . . . . . . .
Missouri . . . . . . . . . . . .
Montana . . . . . . . . . . .
Nebraska . . . . . . . . . . .
Nevada . . . . . . . . . . . .
New Hampshire . . . . . . .
New Jersey. . . . . . . . . .
New Mexico . . . . . . . . .
New York . . . . . . . . . . .
See footnotes at end of table.
Beer LOESS merge HP on data HP on Beer
Beer LOESS merge HP on data HP on Beer
Beer LOESS merge HP on data HP on Beer
Beer LOESS merge HP on data HP on Beer
Beer LOESS merge HP on data HP on Beer
Beer LOESS merge HP on data HP on Beer
Beer LOESS merge HP on data HP on Beer
Beer LOESS merge HP on data HP on Beer
Beer LOESS merge HP on data HP on Beer
Beer LOESS merge HP on data HP on Beer
Beer LOESS merge HP on data HP on Beer
0–24 . . .
25–40 41–110
. . .
0–24 . . .
25–40 41–110
. . .
0–24 . . .
25–40 41–110
. . .
. . . 0–24
25–40 41–110
. . .
0–24 . . .
25–40 . . .
41–110
. . . 0–24
25–40 41–110
. . .
0–24 . . .
25–40 41–110
. . .
0–24 . . .
25–40 41–110
. . .
0–24 . . .
25–40 41–110
. . .
. . . 0–24
25–40 41–110
. . .
0–24 . . .
25–40 41–110
. . .
0–24 . . .
25–40 41–110
. . .
0–24 . . .
25–40 41–110
. . .
0–13 . . .
14–19 20–110
. . .
0–24 . . .
25–40 41–110
. . .
. . . 0–24
25–40 41–110
. . .
0–25 . . .
26–31 . . .
32–110
0–24 . . .
25–40 41–110
. . .
0–24 . . .
25–40 41–110
. . .
0–24 . . .
25–40 41–110
. . .
. . .
. . .
. . .
. . . 0–110
0–24 . . .
25–40 41–110
. . .
. . . 0–24
25–40 41–110
. . .
. . . 0–24
25–40 41–110
. . .
0–24 . . .
25–40 41–110
. . .
. . . 0–24
25–40 41–110
. . .
. . .
. . .
. . .
. . .
. . .
. . . 0–24
25–40 41–110
. . .
. . . 0–24
25–40 41–110
. . .
. . .
. . .
. . .
. . .
. . .
0–24 . . .
25–40 41–110
. . .
. . . 0–24
25–40 41–110
. . .
0–24 . . .
25–40 41–110
. . .
0–24 . . .
25–40 . . .
41–110
. . . 0–24
25–40 41–110
. . .
0–24 . . .
25–40 . . .
41–110
0–34 . . .
35–40 . . .
41–110
. . .
. . .
. . .
. . .
. . .
. . . 0–24
25–40 41–110
. . .
0–38 . . .
39–42 . . .
43–110
. . .
. . .
. . .
. . .
. . .
0–21 . . .
22–30 31–110
. . .
. . . 0–24
25–40 41–110
. . .
0–24 . . .
25–40 . . .
41–110
0–19 . . .
20–25 . . .
26–110
0–19 . . .
20–25 . . .
26–110
0–19 . . .
20–25 . . .
26–110
0–19 . . .
20–25 . . .
26–110
. . .
. . .
. . .
. . . 0–110
13–15 . . .
16–21 . . .
0–12, 22–110
0–19 . . .
20–25 . . .
26–110
. . .
. . .
. . .
. . . 0–110
0–19 . . .
20–25 . . .
26–110
0–20 . . . . . . . . .
21–110
0–19 . . .
20–25 . . .
26–110
. . .
. . .
. . .
. . . 0–110
0–44 . . .
45–50 . . .
51–110
0–19 . . .
20–25 26–110
. . .
0–32 . . .
33–38 . . .
39–110
0–5, 14–34 . . .
6–13, 35–40 . . .
41–110
0–29 . . .
30–35 . . .
36–110
0–19 . . .
20–25 26–110
. . .
. . .
. . .
. . .
. . . 0–110
0–39 . . .
40–45 . . .
46–110
. . .
. . . 45–50 0–44
51–110
. . .
. . .
. . .
. . . 0–110
National Vital Statistics Reports, Vol. 60, No. 9, September 14, 2012 55

Table I. Componential smoothing methods, by ages used to construct final qx curves for state populations—Con.
States and area
Method1
for qx
White males
White females
Black males
Black females Males Females
North Carolina . . . . . . . .
North Dakota . . . . . . . . .
Ohio . . . . . . . . . . . . . .
Oklahoma. . . . . . . . . . .
Oregon . . . . . . . . . . . .
Pennsylvania . . . . . . . . .
Rhode Island . . . . . . . . .
South Carolina . . . . . . . .
South Dakota . . . . . . . .
Tennessee . . . . . . . . . .
Texas . . . . . . . . . . . . .
See footnotes at end of table.
Beer LOESS merge HP on data HP on Beer
Beer LOESS merge HP on data HP on Beer
Beer LOESS merge HP on data HP on Beer
Beer LOESS merge HP on data HP on Beer
Beer LOESS merge HP on data HP on Beer
Beer LOESS merge HP on data HP on Beer
Beer LOESS merge HP on data HP on Beer
Beer LOESS merge HP on data HP on Beer
Beer LOESS merge HP on data HP on Beer
Beer LOESS merge HP on data HP on Beer
Beer LOESS merge HP on data HP on Beer
0–24 . . .
25–40 41–110
. . .
0–24 . . .
25–40 41–110
. . .
0–24 . . .
25–40 41–110
. . .
0–24 . . .
25–40 41–110
. . .
0–24 . . .
25–40 41–110
. . .
0–24 . . .
25–40 41–110
. . .
. . . 0–24
25–40 41–110
. . .
. . . 0–24
25–40 41–110
. . .
. . .
. . .
. . . 0–110
. . .
. . . 0–24
25–40 41–110
. . .
0–24 . . .
25–40 41–110
. . .
. . . 0–24
25–40 41–110
. . .
. . .
. . .
. . . 0–110
. . .
0–24 . . .
25–40 41–110
. . .
0–24 . . .
25–40 41–110
. . .
0–24 . . .
25–40 41–110
. . .
0–24 . . .
25–40 41–110
. . .
. . .
. . .
. . .
. . . 0–110
0–24 . . .
25–40 41–110
. . .
0–24 . . .
25–40 41–110
. . .
0–24 . . .
25–40 41–110
. . .
0–24 . . .
25–40 41–110
. . .
0–24 . . .
25–40 41–110
. . .
. . .
. . .
. . .
. . .
. . .
. . . 0–24
25–40 41–110
. . .
. . . 0–24
25–40 41–110
. . .
. . . 0–24
25–40 41–110
. . .
0–24 . . .
25–40 41–110
. . .
. . . 0–24
25–40 41–110
. . .
0–24 . . .
25–40 41–110
. . .
. . .
. . .
. . .
. . .
. . .
0–24 . . .
25–40 41–110
. . .
0–24 . . .
25–40 41–110
. . .
0–24 . . .
25–40 . . .
41–110
. . .
. . .
. . .
. . .
. . .
0–24 . . .
25–40 . . .
41–110
. . . 0–24
25–40 . . .
41–110
. . . 0–24
25–40 41–110
. . .
0–24 . . .
25–40 . . .
41–110
. . . 0–24
25–40 41–110
. . .
0–17 . . .
18–40 . . .
41–110
. . .
. . .
. . .
. . .
. . .
. . .
. . .
. . . 0–110
. . .
0–24 . . .
25–40 . . .
41–110
0–19 . . .
20–25 . . .
26–110
. . .
. . .
. . .
. . . 0–110
0–19 . . .
20–25 . . .
26–110
0–19 . . .
20–25 . . .
26–110
0–19 . . .
20–25 . . .
26–110
0–19 . . .
20–25 . . .
26–110
0–19 . . .
20–25 . . .
26–110
0–19 . . .
20–25 . . .
26–110
. . .
. . .
. . .
. . . 0–110
0–19 . . .
20–25 . . .
26–110
0–19 . . .
20–25 . . .
26–110
0–19 . . .
20–25 26–110
. . .
. . .
. . .
. . .
. . . 0–110
0–24 . . .
25–30 . . .
31–110
0–19 . . .
20–25 . . .
26–110
0–29 . . .
30–35 . . .
36–110
0–36 . . .
37–41 . . .
42–110
0–28 . . .
29–34 . . .
35–110
0–28 . . .
29–34 . . .
35–110
0–28 . . .
29–34 35–110
. . .
. . .
. . .
. . .
. . . 0–110
. . .
. . .
. . .
. . . 0–110
56 National Vital Statistics Reports, Vol. 60, No. 9, September 14, 2012

Table I. Componential smoothing methods, by ages used to construct final qx curves for state populations—Con.
States and area
Method1
for qx
White males
White females
Black males
Black females Males Females
Utah . . . . . . . . . . . . . .
Vermont . . . . . . . . . . . .
Virginia . . . . . . . . . . . .
Washington . . . . . . . . . .
West Virginia . . . . . . . . .
Wisconsin. . . . . . . . . . .
Wyoming . . . . . . . . . . .
Beer LOESS merge HP on data HP on Beer
Beer LOESS merge HP on data HP on Beer
Beer LOESS merge HP on data HP on Beer
Beer LOESS merge HP on data HP on Beer
Beer LOESS merge HP on data HP on Beer
Beer LOESS merge HP on data HP on Beer
Beer LOESS merge HP on data HP on Beer
0–24 . . .
25–40 41–110
. . .
. . . 0–24
25–40 41–110
. . .
0–24 . . .
25–40 41–110
. . .
0–24 . . .
25–40 41–110
. . .
. . . 0–24
25–40 41–110
. . .
0–24 . . .
25–40 41–110
. . .
. . .
. . .
. . . 0–110
. . .
0–20 . . .
21–41 42–110
. . .
. . .
. . .
. . . 0–110
. . .
0–24 . . .
25–40 41–110
. . .
0–24 . . .
25–40 41–110
. . .
0–24 . . .
25–40 41–110
. . .
0–24 . . .
25–40 41–110
. . .
14–21 . . . . . .
0–13, 22–110 . . .
. . .
. . .
. . .
. . .
. . .
. . .
. . .
. . .
. . .
. . .
0–24 . . .
25–40 41–110
. . .
. . .
. . .
. . . 0–110
. . .
0, 9–17 . . . . . .
1–8, 18–110 . . .
0–24 . . .
25–40 41–110
. . .
. . .
. . .
. . .
. . .
. . .
. . .
. . .
. . .
. . .
. . .
. . .
. . .
. . .
. . .
. . .
0–24 . . .
25–40 . . .
41–110
. . . 0–15
16–23 . . .
24–110
. . .
. . .
. . . 0–110
. . .
. . .
. . .
. . .
. . . 0–110
. . .
. . .
. . .
. . .
. . .
0–18 . . .
19–22 . . .
23–110
. . .
. . .
. . .
. . . 0–110
0–19 . . .
20–25 . . .
26–110
0–19 . . .
20–25 . . .
26–110
8–13 . . .
14–19 . . .
0–7, 20–110
0–19 . . .
20–25 . . .
26–110
0–16 . . .
17–35 . . .
36–110
0–22 . . .
23–25 . . .
26–110
10–13 0–9, 14–35
36–40 . . .
41–110
0–37 . . .
38–40 . . .
41–110
. . .
. . .
. . .
. . . 0–110
0–21 . . .
22–27 . . .
28–110
. . .
. . .
. . .
. . . 0–110
. . . 0–8, 14–43
9–13, 44–48 . . .
49–110
. . . Category not applicable. 1Beer is Beer’s graduation technique; LOESS is locally weighted smoothing; merge is merging smoothing Heligman-Pollard equation on data; HP on Beer is applying the Heligman-Pollard equation on results from
NOTE: qx is the probability of dying between ages x and x + 1 years.
results Beer’s
from Beer/LOESS to HPs using method; see ‘‘Technical Notes.’’
a transition formula; HP on data is applying the
National Vital Statistics Reports, Vol. 60, No. 9, September 14, 2012 57
population estimates in 5-year age intervals to get smoothed estimates for single-year age intervals.
Details of Beer’s method are presented in the methodology report for the national decennial tables (2).
Calculation of probability of dying, qx, for smoothing
The probability of dying, qx, was calculated based on either observed D and P or Beer’s smoothed D and P using the x x x x
following method: For ages under 2 years, births Ex instead of Px
were used to calculate qx. The first life table quantities to be calculated were the values of dx, the number of deaths occurring between exact age x and x + 1 in the life table cohort commencing with per 100,000 (l0) live births. This was calculated by the formula
dx = l0 Dx/Ex x < 2 [1]
where dx is the estimated number of deaths per 100,000 (lo) births occurring in 1999–2001 between exact ages x and x + 1; Dx is the actual death count (adjusted for nonreporting of age) in this 3-year period; and Ex is the weighted average of births for 1997, 1998, 1999, 2000, and 2001 (2).
The unrounded values of dx were then used to calculate the number of survivors lx up to age 2 years by successive applications of the formula
lx + 1 = lx – dx x < 2 [2]
The probability of dying within each age category for ages under 2 years was then estimated as dx divided by lx, as in
qx = dx / lx x < 2 [3]

58 National Vital Statistics Reports, Vol. 60, No. 9, September 14, 2012
For ages 2 years and over, the following method was used to calculate q : m denotes the ratio d /L , commonly called the central x x x x
death rate. Assuming a uniform distribution of deaths over the year at age x,
2mqx =
x x ≤ 22 + mx [4]
This approximation is appropriate when the life table is constructed by single years of age and is the basis of the calculation for probabilities of dying at ages 2–85 years. Completion of the calculation depends, therefore, on the ability to calculate the central death rate mx at different ages. To do this, different methods were used for ages 2–4 and 5–85 years, as described below.
Dx denotes the adjusted number of deaths in a population category at age x (in completed years) during 1999–2001 (i.e., 3 years), and Px denotes the population at age x in the middle of the period. The central death rate, mx, was then computed as
Dx mx = 3Px [5]
As previously noted, the populations actually used were those as of April 1, 2000.
However, because the number of deaths occurring in a single year of age during 1999–2001 was drawn from three consecutive annual population counts, it was considered that the accuracy of these mx values would be improved by replacing 3Px in the denominator of formula 5 by the sum of the populations at ages x – 1, x, and x + 1. This is because the change in the death rates in very young ages (2–4 years) is substantial across cohorts; therefore, the corresponding population count is more accurate than Px from a centered year when used as the denominator. Thus, the formula becomes
Dx =mx Px – 1 + Px + Px + 1 [6]
The combination of formulas 4 and 6 is equivalent to the single formula
Dxqx = 2 ≤ x ≤ 4 [7] Px – 1 + Px + Px + 1 + 2
1 Dx
where the values of Dx and Px were obtained from either observed data or interpolated data using Beer’s graduation technique. This formula was used for ages 2–4 years.
The combination of formulas 4 and 5 is equivalent to
Dxqx = 5 ≤ x ≤ 85 [8]13Px + Dx2
This formula was used for ages 5–85 years, and the values of Dx
and Px were also obtained by using either observed data or Beer’s interpolation. The last age for the Beer’s smoothed qx was 79 years, because older age groups could not be interpolated without data for ages over 85.
Smoothing with Heligman-Pollard equation, extrapolating qx to 130 years
In a recent study using vital statistics mortality data, the Heligman-Pollard (HP) equation was found to fit well with current U.S. age-specific mortality (9). The HP equation is a nonlinear model consisting of three components and eight parameters:
qx = A (x + B)C
+ D exp[–E(log x – log F )2 ] + GH x
1 – qx [9]
where parameters A, B, and C in the first term of the equation measure mortality in the first year of life, the rate of change in mortality from birth to the first year of life, and the rate of mortality decline in childhood, respectively. The second term of the equation describes mortality for ages in the middle of the life span (approximately between ages 10 and 40 years), where a so-called ‘‘accident hump’’ often appears, and parameters D, E, and F measure respectively the location, width, and height of this accident hump. Parameters G and H in the third term measure mortality change in the oldest ages of the life span (4).
In constructing the national decennial life tables, only the third term (GHx) of the HP equation was used to smooth and extrapolate qx at ages 65 and over (2). Because the observed qx values in the national tables were based on large numbers of deaths, Beer’s graduation technique was deemed sufficient as a smoothing method for the younger ages. In contrast, the state life tables are based on much smaller numbers of deaths and, thus, Beer’s technique was not always sufficient alone to obtain a smooth qx distribution by age. To enhance the smoothness of qx in the state life tables, the following procedure was used: First, a two-step approach was applied using the complete HP equation to fit Beer’s smoothed qx
from ages 0 to 79 years, and then qx was extrapolated to age 130 years using the method described in the following paragraph. Second, the HP model was applied to the observed qx directly. This one-step smoothing procedure was applied to qx for ages 0–85 years, and then the smoothed qx were extrapolated to age 130. Both one- and two-step smoothing results for qx were compared with the observed qx by using plots, and the one with the better fit (i.e., with smaller errors) was selected for constructing the final life tables.
Using the HP model, qx was estimated for all ages up to 130 by extrapolation. However, in the final life tables, estimates were truncated to age 109. This is consistent with the method used for calculation of the national life tables and for previous decennial life tables. The extrapolation formula is
^ (x + B̂ )C^ ^ ^ ^ ^ ^ xA + D exp[– E (log x – log F)2] + GH
^ qx = ^^ (x + B̂ )C ^ ^ ^ ^ ^ x1 + A + D exp[– E (log x – log F)2] + GH [10]
^ ^ where A to H were estimated from equation 9 with an error term allowed.

National Vital Statistics Reports, Vol. 60, No. 9, September 14, 2012 59
Locally weighted smoothing
The locally weighted smoothing (LOESS) procedure was applied using the SAS/LOESS procedure (SAS, 2008). In contrast to Beer’s method, which uses a smoothing window containing 25 adjacent ages, the size of the smoothing window in LOESS is flexible; therefore, the degree of smoothness is flexible and can be applied differently to individual states according to the age-specific pattern observed in the data. For the state life tables, this method was applied in smoothing qx for the younger ages, from 0 to 35 years, for populations in which the mortality change from age to age is substantial, rendering the results of Beer’s method unsatisfactory. The size of the smoothing window was varied by using 5 percent, 8 percent, 10 percent, and 12 percent of the age range. The LOESS method was also applied to qx values for the black population of six small states in which the mortality rates qx for ages with zero observed deaths were estimated using historical data (see next section).
Small states: Estimating qx with probability model and 32 years’ mortality data
A mixed probability model was used to estimate qx for states with population subgroups having between 300 and 700 deaths. This model uses observed data for previous years to estimate qx values for ages for which there are no deaths or insufficient deaths to calculate a reliable estimate. NCHS has well-documented mortality data dating from 1968. In these cases, qx was estimated using mortality data from 1970 to 2001. A mixed probability distribution model which includes two probability components, a discrete component specified at 0, and a continuous component for values greater than 0, was used to estimate qx in the current life table based on 32 years’ data.
Let Y represent age-specific mortality rates, a natural model for Y is a mixed probability distribution model where Y = 0 with probability 1 – p , where 0 < p < 1; otherwise, for positive rates, Y follows a continuous distribution with cumulative distribution function (cdf) F (y; θ1), with θ1 representing a vector of parameters. The distribution of Y is a mixture of discrete and continuous components, as in
P (Y ≤ y) = Gm(y;p,θ1) = (1 – p)H(y) + pF(y;θ1) [1
where H(y) is a step function:
0, y < 0H(y) = { 1, y ≥ 0}
1]
The corresponding generalized probability density is
g (y; p, θ ) = (1 – p)1–I [y > 0] [pf (y; θ )] I [y > 0] m 1 1 y ≥ 0 [12]
where f (y; θ1) is a probability density function conditional on Y > 0 and corresponding to F (y; θ1), I (A) = 1 if A occurs, and I (A) = 0 if A does not occur. The goal is to estimate the mean of the mixed distribution,
E(Y) = pE(YzY > 0) [13]
which is a function of θ ≡ (p, θ1). Observe that equation 13 is a product of two factors, p and α ≡ E (Y ? Y> 0), corresponding to the two distribution components. Equation 13 can be estimated using
the maximum likelihood estimates of p and α, as in a mixed lognormal, or by regressing each of the two factors on covariates and then taking the product of the two regressions, as in two-part Hurdle or zero-inflated models (6). With this estimator, the confidence interval bands can help determine the reliability of the estimated death curve.
Selecting smoothed curve sections of qx for different ages; merging selected sections into final qx curve for whole life span (0–130 years)
Smoothed qx curves from all methods were plotted against the observed qx, and the one with the best fit was selected for specific age sections. Selected qx curves from each age section were merged to form the final qx curve from ages 0 to 130 years. To merge two curve sections, a graduating process was applied using
1 qF = [(b – x)qA
x x + (x – a)qBx ]b – a [14]
where qFx is a merged (final) curve section, qA
x is the section with younger ages, and qB
x is the section with older ages. For example, suppose qA
x for ages 0 to 13 years smoothed by Beer’s graduation technique is merged with qB
x for ages 7 years and over smoothed by the HP method. For the overlapping ages (7 to 13 years), the final qF
x
would be calculated as
1 qF
x = [(14 – x)qA x – 6)qBx + ( x ] for age x = 7,8,9,10,11,12,13 14 – 6
To check and ensure the fidelity of the smoothed qx , the final composite qx curve was plotted against the observed data for all populations. The final qx composition for sex- and race-specific populations for every state is given in Table I, and examples (Iowa) of plots of final qx compared with observed data are shown in Figures Ia and Ib.
Computing qx for total, total white, and total black populations based on corresponding sex-specific populations Data for each state consist of composite values of the popula
tion according to sex and race. Figures for the total U.S. population were computed by combining data for all males and females. Figures for the total white and total black populations were similarly computed by combining males and females for the respective race groups. The parameter qx in each state’s six sex-specific populations was smoothed (using the methods previously described) prior to creating qx values for the three groups with both sexes combined (all races total, total white, and total black populations) for each state. For consistency, the death number DT and population denominator PT were computed from two separately smoothed sex-specific populations rather than directly smoothing the data for the combined deaths and populations. We denote the combined, female, and male populations using superscripts T, F, and M, respectively. Then the number of deaths and population for the combined population is
qF F M M
DT = x Px qx Pxx F +
1 – 0.5 q Mx 1 – 0.5 qx [15]
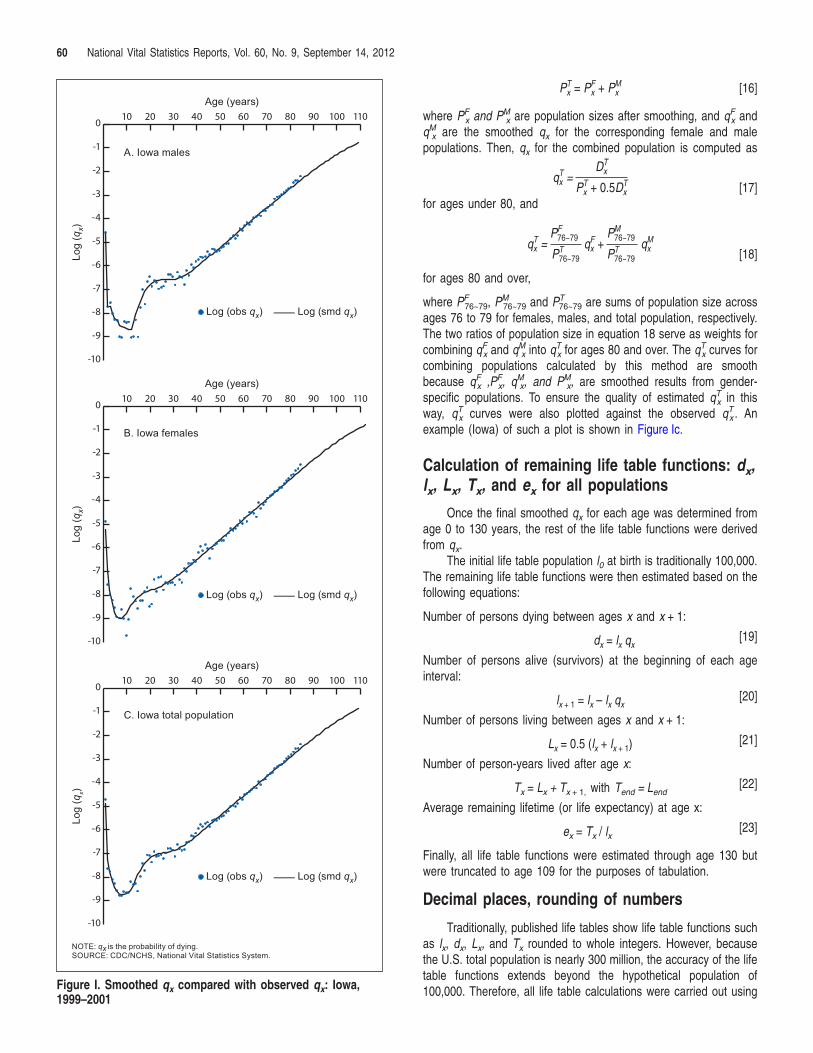
� L
� L
� L
NOTE: qx is the probability of dying. SOURCE: CDC/NCHS, National Vital Statistics System.
Age (years)
Log (obs qx) og (smd qx)
-10
-9
-8
-7
-6
-5
-4
-3
-2
-1
0 10 20 30 40 50 60 70 80 90 100 110
C. Iowa total population
Age (years)
Log (obs qx) og (smd qx)
10 20 30 40 50 60 70 80 90 100 110
-10
-9
-8
-7
-6
-5
-4
-3
-2
-1
0
B. Iowa females
Age (years)
A. Iowa males
Log (obs qx) og (smd qx)
10 20 30 40 50 60 70 80 90 100 110
-10
-9
-8
-7
-6
-5
-4
-3
-2
-1
0
Log
(q x )
Log
(q x )
Log
(q x )
Figure I. Smoothed qx compared with observed qx: Iowa, 1999–2001
60 National Vital Statistics Reports, Vol. 60, No. 9, September 14, 2012
T F MP = P + P [16]x x x
where PF and PM x x are population sizes after smoothing, and qF
x andqM
x are the smoothed qx for the corresponding female and male populations. Then, q for the combined population is computed as x
T Dx x Tq =
PTx + 0.5Dx [17]
for ages under 80, and
F M T F MP76~79 P76~79 q = q + qx x xP76~79
T P76~79 T [18]
T
for ages 80 and over,
where PF , PM 76~79 76~79 and PT
76~79 are sums of population size across ages 76 to 79 for females, males, and total population, respectively. The two ratios of population size in equation 18 serve as weights for combining qF M T T
x and q x into qx for ages 80 and over. The qx curves for combining populations calculated by this method are smooth because qF
x ,PFx, qM
x, and PMx, are smoothed results from gender-
specific populations. To ensure the quality of estimated qTx in this
way, qTx curves were also plotted against the observed qT
x . An example (Iowa) of such a plot is shown in Figure Ic.
Calculation of remaining life table functions: dx, lx, Lx, Tx, and ex for all populations
Once the final smoothed qx for each age was determined from age 0 to 130 years, the rest of the life table functions were derived from qx.
The initial life table population l0 at birth is traditionally 100,000. The remaining life table functions were then estimated based on the following equations:
Number of persons dying between ages x and x + 1:
[19]d = l qx x x
Number of persons alive (survivors) at the beginning of each age interval:
[20]lx + 1 = lx – lx qx
Number of persons living between ages x and x + 1:
[21]Lx = 0.5 (lx + lx + 1)
Number of person-years lived after age x:
[22]Tx = Lx + Tx + 1, with Tend = Lend
Average remaining lifetime (or life expectancy) at age x:
[23]ex = Tx / lx
Finally, all life table functions were estimated through age 130 but were truncated to age 109 for the purposes of tabulation.
Decimal places, rounding of numbers
Traditionally, published life tables show life table functions such as lx, dx, Lx, and Tx rounded to whole integers. However, because the U.S. total population is nearly 300 million, the accuracy of the life table functions extends beyond the hypothetical population of 100,000. Therefore, all life table calculations were carried out using

National Vital Statistics Reports, Vol. 60, No. 9, September 14, 2012 61
q2x(1 – qx)S2(qx) = Dx [24]
(Px – 1 – 0.5Dx – 1 / 3)(2 – qx) =Px 2 [25]
3q PD =
x x x 1 – 0.5qx [26]
floating point precision, allowing for fractional deaths and fractional years of life lived. This creates a problem for users who want to reproduce the life table estimates from the rounded numbers in the tables.
Thus, users of the decennial life tables are cautioned that the life table calculations are based on additional significant digits than shown, and back-calculation using the rounded numbers cannot be expected to reproduce the exact published results.
Calculation of standard errors of qx and ex
Standard errors (SEs) for the decennial life table functions, specifically for the probabilities of dying and for life expectancies, were calculated based on an assumption that the age-specific deaths follow a binomial distribution. It is important to consider that these SEs reflect only stochastic variation. Stochastic variation is not the only source of error for life table functions; measurement error, such as age misstatement on death certificates or on census reports, also affects the accuracy of life table functions. While the extent of measurement error on life table functions has not been quantified, it is generally thought that measurement errors may be larger than stochastic errors (8). The SEs presented are rather small because the life tables for the United States and each state are based on relatively large numbers of deaths. Errors from the smoothing procedure on qx are not given or included in standard error calculation here. Smoothing involved a complicated multiple method and stage procedure. Incorporating these methods into the estimation of the SEs would be unnecessarily complex. Any error introduced by smoothing would be very small compared with the stochastic variation and can, therefore, be safely ignored.
A binomial distribution assumption yields the following estimate for the variance of qx (11):
where Dx is the age-specific number of deaths and qx is the probability of dying. For ages under 80, Dx is the age-specific number of deaths from vital statistics data, smoothed by interpolation and adjusted for the number of deaths with missing ages. For ages 80 and over, Dx was calculated based on the extrapolated estimate of qx:
Note that Dx is the number of deaths in a 3-year data collection period (1999–2001), and Px is the population at age x in the middle of this period.
end – 1
end S2 ∑ ly
2 (ey + 1 + 0.5)2 S2(qy
l 2 (eend)+
y = xS 2(e ) = )
x 2 [27]lx
S2(qend) S2(eend) = 4qend [28]
For the variances of life expectancies at ages 0–109 years, an equation from Chiang (11) with a slight modification was used (8):
where the ‘‘end’’ age is the age 1 year before the life expectancy becomes zero for the population. For all populations, this end age falls into a range between 109 and 120 years. An approximate estimation for the variances of life expectancy at the end age is:
This is based on the relationship between ex and mx at the end age. That is, eend = 1/mend = (2-qend)/2qend . A linear approximation of S2(ex) at the end age gives S2(eend) = ()[(2-qend)/2qend]/) qend)2
S2(qend). The S2 (qx) and S2(ex) were calculated until the end age but truncated at age 109 for the published life tables.
All S2(qx) and S2(ex) were published in tables corresponding to the state-specific life tables that they describe.

62 National Vital Statistics Reports, Vol. 60, No. 9, September 14, 2012
Table II. Decennial life tables, by single year of age: 50 states and District of Columbia, 1999–2001
(Available from: http://www.cdc.gov/nchs/nvss/mortality/lewk4.htm)
AL-1. Life table for the total population: Alabama AL-2. Life table for males: Alabama AL-3. Life table for females: Alabama AL-4. Life table for the white population: Alabama AL-5. Life table for white males: Alabama AL-6. Life table for white females: Alabama AL-7. Life table for the black population: Alabama AL-8. Life table for black males: Alabama AL-9. Life table for black females: Alabama AL-10. Standard errors of the probability of dying: Alabama AL-11. Standard errors of the average remaining lifetime: Alabama AK-1. Life table for the total population: Alaska AK-2. Life table for males: Alaska AK-3. Life table for females: Alaska AK-4. Life table for the white population: Alaska AK-5. Life table for white males: Alaska AK-6. Life table for white females: Alaska AK-7. Life table for the black population: Alaska AK-8. Life table for black males: Alaska AK-9. Life table for black females: Alaska AK-10. Standard errors of the probability of dying: Alaska AK-11. Standard errors of the average remaining lifetime: Alaska AZ-1. Life table for the total population: Arizona AZ-2. Life table for males: Arizona AZ-3. Life table for females: Arizona AZ-4. Life table for the white population: Arizona AZ-5. Life table for white males: Arizona AZ-6. Life table for white females: Arizona AZ-7. Life table for the black population: Arizona AZ-8. Life table for black males: Arizona AZ-9. Life table for black females: Arizona AZ-10. Standard errors of the probability of dying: Arizona AZ-11. Standard errors of the average remaining lifetime: Arizona AR-1. Life table for the total population: Arkansas AR-2. Life table for males: Arkansas AR-3. Life table for females: Arkansas AR-4. Life table for the white population: Arkansas AR-5. Life table for white males: Arkansas AR-6. Life table for white females: Arkansas AR-7. Life table for the black population: Arkansas AR-8. Life table for black males: Arkansas AR-9. Life table for black females: Arkansas AR-10. Standard errors of the probability of dying: Arkansas AR-11. Standard errors of the average remaining lifetime: Arkansas CA-1. Life table for the total population: California CA-2. Life table for males: California CA-3. Life table for females: California CA-4. Life table for the white population: California CA-5. Life table for white males: California CA-6. Life table for white females: California CA-7. Life table for the black population: California CA-8. Life table for black males: California CA-9. Life table for black females: California CA-10. Standard errors of the probability of dying: California
CA-11. Standard errors of the average remaining lifetime: California CO-1. Life table for the total population: Colorado CO-2. Life table for males: Colorado CO-3. Life table for females: Colorado CO-4. Life table for the white population: Colorado CO-5. Life table for white males: Colorado CO-6. Life table for white females: Colorado CO-7. Life table for the black population: Colorado CO-8. Life table for black males: Colorado CO-9. Life table for black females: Colorado CO-10. Standard errors of the probability of dying: Colorado CO-11. Standard errors of the average remaining lifetime: Colorado CT-1. Life table for the total population: Connecticut CT-2. Life table for males: Connecticut CT-3. Life table for females: Connecticut CT-4. Life table for the white population: Connecticut CT-5. Life table for white males: Connecticut CT-6. Life table for white females: Connecticut CT-7. Life table for the black population: Connecticut CT-8. Life table for black males: Connecticut CT-9. Life table for black females: Connecticut CT-10. Standard errors of the probability of dying: Connecticut CT-11. Standard errors of the average remaining lifetime: Connecticut DE-1. Life table for the total population: Delaware DE-2. Life table for males: Delaware DE-3. Life table for females: Delaware DE-4. Life table for the white population: Delaware DE-5. Life table for white males: Delaware DE-6. Life table for white females: Delaware DE-7. Life table for the black population: Delaware DE-8. Life table for black males: Delaware DE-9. Life table for black females: Delaware DE-10. Standard errors of the probability of dying: Delaware DE-11. Standard errors of the average remaining lifetime: Delaware DC-1. Life table for the total population: District of Columbia DC-2. Life table for males: District of Columbia DC-3. Life table for females: District of Columbia DC-4. Life table for the white population: District of Columbia DC-5. Life table for white males: District of Columbia DC-6. Life table for white females: District of Columbia DC-7. Life table for the black population: District of Columbia DC-8. Life table for black males: District of Columbia DC-9. Life table for black females: District of Columbia DC-10. Standard errors of the probability of dying: District of Columbia DC-11. Standard errors of the average remaining lifetime: District of
Columbia FL-1. Life table for the total population: Florida FL-2. Life table for males: Florida FL-3. Life table for females: Florida FL-4. Life table for the white population: Florida FL-5. Life table for white males: Florida FL-6. Life table for white females: Florida FL-7. Life table for the black population: Florida FL-8. Life table for black males: Florida

National Vital Statistics Reports, Vol. 60, No. 9, September 14, 2012 63
FL-9. Life table for black females: Florida FL-10. Standard errors of the probability of dying: Florida FL-11. Standard errors of the average remaining lifetime: Florida GA-1. Life table for the total population: Georgia GA-2. Life table for males: Georgia GA-3. Life table for females: Georgia GA-4. Life table for the white population: Georgia GA-5. Life table for white males: Georgia GA-6. Life table for white females: Georgia GA-7. Life table for the black population: Georgia GA-8. Life table for black males: Georgia GA-9. Life table for black females: Georgia GA-10. Standard errors of the probability of dying: Georgia GA-11. Standard errors of the average remaining lifetime: Georgia HI-1. Life table for the total population: Hawaii HI-2. Life table for males: Hawaii HI-3. Life table for females: Hawaii HI-4. Life table for the white population: Hawaii HI-5. Life table for white males: Hawaii HI-6. Life table for white females: Hawaii HI-7. Life table for the black population: Hawaii HI-8. Life table for black males: Hawaii HI-9. Life table for black females: Hawaii HI-10. Standard errors of the probability of dying: Hawaii HI-11. Standard errors of the average remaining lifetime: Hawaii ID-1. Life table for the total population: Idaho ID-2. Life table for males: Idaho ID-3. Life table for females: Idaho ID-4. Life table for the white population: Idaho ID-5. Life table for white males: Idaho ID-6. Life table for white females: Idaho ID-7. Life table for the black population: Idaho ID-8. Life table for black males: Idaho ID-9. Life table for black females: Idaho ID-10. Standard errors of the probability of dying: Idaho ID-11. Standard errors of the average remaining lifetime: Idaho IL-1. Life table for the total population: Illinois IL-2. Life table for males: Illinois IL-3. Life table for females: Illinois IL-4. Life table for the white population: Illinois IL-5. Life table for white males: Illinois IL-6. Life table for white females: Illinois IL-7. Life table for the black population: Illinois IL-8. Life table for black males: Illinois IL-9. Life table for black females: Illinois IL-10. Standard errors of the probability of dying: Illinois IL-11. Standard errors of the average remaining lifetime: Illinois IN-1. Life table for the total population: Indiana IN-2. Life table for males: Indiana IN-3. Life table for females: Indiana IN-4. Life table for the white population: Indiana IN-5. Life table for white males: Indiana IN-6. Life table for white females: Indiana IN-7. Life table for the black population: Indiana IN-8. Life table for black males: Indiana IN-9. Life table for black females: Indiana IN-10. Standard errors of the probability of dying: Indiana IN-11. Standard errors of the average remaining lifetime: Indiana
IA-1. Life table for the total population: Iowa IA-2. Life table for males: Iowa IA-3. Life table for females: Iowa IA-4. Life table for the white population: Iowa IA-5. Life table for white males: Iowa IA-6. Life table for white females: Iowa IA-7. Life table for the black population: Iowa IA-8. Life table for black males: Iowa IA-9. Life table for black females: Iowa IA-10. Standard errors of the probability of dying: Iowa IA-11. Standard errors of the average remaining lifetime: Iowa KS-1. Life table for the total population: Kansas KS-2. Life table for males: Kansas KS-3. Life table for females: Kansas KS-4. Life table for the white population: Kansas KS-5. Life table for white males: Kansas KS-6. Life table for white females: Kansas KS-7. Life table for the black population: Kansas KS-8. Life table for black males: Kansas KS-9. Life table for black females: Kansas KS-10. Standard errors of the probability of dying: Kansas KS-11. Standard errors of the average remaining lifetime: Kansas KY-1. Life table for the total population: Kentucky KY-2. Life table for males: Kentucky KY-3. Life table for females: Kentucky KY-4. Life table for the white population: Kentucky KY-5. Life table for white males: Kentucky KY-6. Life table for white females: Kentucky KY-7. Life table for the black population: Kentucky KY-8. Life table for black males: Kentucky KY-9. Life table for black females: Kentucky KY-10. Standard errors of the probability of dying: Kentucky KY-11. Standard errors of the average remaining lifetime: Kentucky LA-1. Life table for the total population: Louisiana LA-2. Life table for males: Louisiana LA-3. Life table for females: Louisiana LA-4. Life table for the white population: Louisiana LA-5. Life table for white males: Louisiana LA-6. Life table for white females: Louisiana LA-7. Life table for the black population: Louisiana LA-8. Life table for black males: Louisiana LA-9. Life table for black females: Louisiana LA-10. Standard errors of the probability of dying: Louisiana LA-11. Standard errors of the average remaining lifetime: Louisiana ME-1. Life table for the total population: Maine ME-2. Life table for males: Maine ME-3. Life table for females: Maine ME-4. Life table for the white population: Maine ME-5. Life table for white males: Maine ME-6. Life table for white females: Maine ME-7. Life table for the black population: Maine ME-8. Life table for black males: Maine ME-9. Life table for black females: Maine ME-10. Standard errors of the probability of dying: Maine ME-11. Standard errors of the average remaining lifetime: Maine MD-1. Life table for the total population: Maryland MD-2. Life table for males: Maryland MD-3. Life table for females: Maryland
64 National Vital Statistics Reports, Vol. 60, No. 9, September 14, 2012
MD-4. Life table for the white population: Maryland MD-5. Life table for white males: Maryland MD-6. Life table for white females: Maryland MD-7. Life table for the black population: Maryland MD-8. Life table for black males: Maryland MD-9. Life table for black females: Maryland MD-10. Standard errors of the probability of dying: Maryland MD-11. Standard errors of the average remaining lifetime: Maryland MA-1. Life table for the total population: Massachusetts MA-2. Life table for males: Massachusetts MA-3. Life table for females: Massachusetts MA-4. Life table for the white population: Massachusetts MA-5. Life table for white males: Massachusetts MA-6. Life table for white females: Massachusetts MA-7. Life table for the black population: Massachusetts MA-8. Life table for black males: Massachusetts MA-9. Life table for black females: Massachusetts MA-10. Standard errors of the probability of dying: Massachusetts MA-11. Standard errors of the average remaining lifetime: Massachusetts MI-1. Life table for the total population: Michigan MI-2. Life table for males: Michigan MI-3. Life table for females: Michigan MI-4. Life table for the white population: Michigan MI-5. Life table for white males: Michigan MI-6. Life table for white females: Michigan MI-7. Life table for the black population: Michigan MI-8. Life table for black males: Michigan MI-9. Life table for black females: Michigan MI-10. Standard errors of the probability of dying: Michigan MI-11. Standard errors of the average remaining lifetime: Michigan MN-1. Life table for the total population: Minnesota MN-2. Life table for males: Minnesota MN-3. Life table for females: Minnesota MN-4. Life table for the white population: Minnesota MN-5. Life table for white males: Minnesota MN-6. Life table for white females: Minnesota MN-7. Life table for the black population: Minnesota MN-8. Life table for black males: Minnesota MN-9. Life table for black females: Minnesota MN-10. Standard errors of the probability of dying: Minnesota MN-11. Standard errors of the average remaining lifetime: Minnesota MS-1. Life table for the total population: Mississippi MS-2. Life table for males: Mississippi MS-3. Life table for females: Mississippi MS-4. Life table for the white population: Mississippi MS-5. Life table for white males: Mississippi MS-6. Life table for white females: Mississippi MS-7. Life table for the black population: Mississippi MS-8. Life table for black males: Mississippi MS-9. Life table for black females: Mississippi MS-10. Standard errors of the probability of dying: Mississippi MS-11. Standard errors of the average remaining lifetime: Mississippi MO-1. Life table for the total population: Missouri MO-2. Life table for males: Missouri MO-3. Life table for females: Missouri MO-4. Life table for the white population: Missouri MO-5. Life table for white males: Missouri MO-6. Life table for white females: Missouri
MO-7. Life table for the black population: Missouri MO-8. Life table for black males: Missouri MO-9. Life table for black females: Missouri MO-10. Standard errors of the probability of dying: Missouri MO-11. Standard errors of the average remaining lifetime: Missouri MT-1. Life table for the total population: Montana MT-2. Life table for males: Montana MT-3. Life table for females: Montana MT-4. Life table for the white population: Montana MT-5. Life table for white males: Montana MT-6. Life table for white females: Montana MT-7. Life table for the black population: Montana MT-8. Life table for black males: Montana MT-9. Life table for black females: Montana MT-10. Standard errors of the probability of dying: Montana MT-11. Standard errors of the average remaining lifetime: Montana NE-1. Life table for the total population: Nebraska NE-2. Life table for males: Nebraska NE-3. Life table for females: Nebraska NE-4. Life table for the white population: Nebraska NE-5. Life table for white males: Nebraska NE-6. Life table for white females: Nebraska NE-7. Life table for the black population: Nebraska NE-8. Life table for black males: Nebraska NE-9. Life table for black females: Nebraska NE-10. Standard errors of the probability of dying: Nebraska NE-11. Standard errors of the average remaining lifetime: Nebraska NV-1. Life table for the total population: Nevada NV-2. Life table for males: Nevada NV-3. Life table for females: Nevada NV-4. Life table for the white population: Nevada NV-5. Life table for white males: Nevada NV-6. Life table for white females: Nevada NV-7. Life table for the black population: Nevada NV-8. Life table for black males: Nevada NV-9. Life table for black females: Nevada NV-10. Standard errors of the probability of dying: Nevada NV-11. Standard errors of the average remaining lifetime: Nevada NH-1. Life table for the total population: New Hampshire NH-2. Life table for males: New Hampshire NH-3. Life table for females: New Hampshire NH-4. Life table for the white population: New Hampshire NH-5. Life table for white males: New Hampshire NH-6. Life table for white females: New Hampshire NH-7. Life table for the black population: New Hampshire NH-8. Life table for black males: New Hampshire NH-9. Life table for black females: New Hampshire NH-10. Standard errors of the probability of dying: New Hampshire NH-11. Standard errors of the average remaining lifetime: New
Hampshire NJ-1. Life table for the total population: New Jersey NJ-2. Life table for males: New Jersey NJ-3. Life table for females: New Jersey NJ-4. Life table for the white population: New Jersey NJ-5. Life table for white males: New Jersey NJ-6. Life table for white females: New Jersey NJ-7. Life table for the black population: New Jersey NJ-8. Life table for black males: New Jersey

National Vital Statistics Reports, Vol. 60, No. 9, September 14, 2012 65
NJ-9. Life table for black females: New Jersey NJ-10. Standard errors of the probability of dying: New Jersey NJ-11. Standard errors of the average remaining lifetime: New Jersey NM-1. Life table for the total population: New Mexico NM-2. Life table for males: New Mexico NM-3. Life table for females: New Mexico NM-4. Life table for the white population: New Mexico NM-5. Life table for white males: New Mexico NM-6. Life table for white females: New Mexico NM-7. Life table for the black population: New Mexico NM-8. Life table for black males: New Mexico NM-9. Life table for black females: New Mexico NM-10. Standard errors of the probability of dying: New Mexico NM-11. Standard errors of the average remaining lifetime: New Mexico NY-1. Life table for the total population: New York NY-2. Life table for males: New York NY-3. Life table for females: New York NY-4. Life table for the white population: New York NY-5. Life table for white males: New York NY-6. Life table for white females: New York NY-7. Life table for the black population: New York NY-8. Life table for black males: New York NY-9. Life table for black females: New York NY-10. Standard errors of the probability of dying: New York NY-11. Standard errors of the average remaining lifetime: New York NC-1. Life table for the total population: North Carolina NC-2. Life table for males: North Carolina NC-3. Life table for females: North Carolina NC-4. Life table for the white population: North Carolina NC-5. Life table for white males: North Carolina NC-6. Life table for white females: North Carolina NC-7. Life table for the black population: North Carolina NC-8. Life table for black males: North Carolina NC-9. Life table for black females: North Carolina NC-10. Standard errors of the probability of dying: North Carolina NC-11. Standard errors of the average remaining lifetime: North Carolina ND-1. Life table for the total population: North Dakota ND-2. Life table for males: North Dakota ND-3. Life table for females: North Dakota ND-4. Life table for the white population: North Dakota ND-5. Life table for white males: North Dakota ND-6. Life table for white females: North Dakota ND-7. Life table for the black population: North Dakota ND-8. Life table for black males: North Dakota ND-9. Life table for black females: North Dakota ND-10. Standard errors of the probability of dying: North Dakota ND-11. Standard errors of the average remaining lifetime: North Dakota OH-1. Life table for the total population: Ohio OH-2. Life table for males: Ohio OH-3. Life table for females: Ohio OH-4. Life table for the white population: Ohio OH-5. Life table for white males: Ohio OH-6. Life table for white females: Ohio OH-7. Life table for the black population: Ohio OH-8. Life table for black males: Ohio OH-9. Life table for black females: Ohio OH-10. Standard errors of the probability of dying: Ohio OH-11. Standard errors of the average remaining lifetime: Ohio
OK-1. Life table for the total population: Oklahoma OK-2. Life table for males: Oklahoma OK-3. Life table for females: Oklahoma OK-4. Life table for the white population: Oklahoma OK-5. Life table for white males: Oklahoma OK-6. Life table for white females: Oklahoma OK-7. Life table for the black population: Oklahoma OK-8. Life table for black males: Oklahoma OK-9. Life table for black females: Oklahoma OK-10. Standard errors of the probability of dying: Oklahoma OK-11. Standard errors of the average remaining lifetime: Oklahoma OR-1. Life table for the total population: Oregon OR-2. Life table for males: Oregon OR-3. Life table for females: Oregon OR-4. Life table for the white population: Oregon OR-5. Life table for white males: Oregon OR-6. Life table for white females: Oregon OR-7. Life table for the black population: Oregon OR-8. Life table for black males: Oregon OR-9. Life table for black females: Oregon OR-10. Standard errors of the probability of dying: Oregon OR-11. Standard errors of the average remaining lifetime: Oregon PA-1. Life table for the total population: Pennsylvania PA-2. Life table for males: Pennsylvania PA-3. Life table for females: Pennsylvania PA-4. Life table for the white population: Pennsylvania PA-5. Life table for white males: Pennsylvania PA-6. Life table for white females: Pennsylvania PA-7. Life table for the black population: Pennsylvania PA-8. Life table for black males: Pennsylvania PA-9. Life table for black females: Pennsylvania PA-10. Standard errors of the probability of dying: Pennsylvania PA-11. Standard errors of the average remaining lifetime: Pennsylvania RI-1. Life table for the total population: Rhode Island RI-2. Life table for males: Rhode Island RI-3. Life table for females: Rhode Island RI-4. Life table for the white population: Rhode Island RI-5. Life table for white males: Rhode Island RI-6. Life table for white females: Rhode Island RI-7. Life table for the black population: Rhode Island RI-8. Life table for black males: Rhode Island RI-9. Life table for black females: Rhode Island RI-10. Standard errors of the probability of dying: Rhode Island RI-11. Standard errors of the average remaining lifetime: Rhode Island SC-1. Life table for the total population: South Carolina SC-2. Life table for males: South Carolina SC-3. Life table for females: South Carolina SC-4. Life table for the white population: South Carolina SC-5. Life table for white males: South Carolina SC-6. Life table for white females: South Carolina SC-7. Life table for the black population: South Carolina SC-8. Life table for black males: South Carolina SC-9. Life table for black females: South Carolina SC-10. Standard errors of the probability of dying: South Carolina SC-11. Standard errors of the average remaining lifetime: South Carolina SD-1. Life table for the total population: South Dakota SD-2. Life table for males: South Dakota SD-3. Life table for females: South Dakota

66 National Vital Statistics Reports, Vol. 60, No. 9, September 14, 2012
SD-4. Life table for the white population: South Dakota SD-5. Life table for white males: South Dakota SD-6. Life table for white females: South Dakota SD-7. Life table for the black population: South Dakota SD-8. Life table for black males: South Dakota SD-9. Life table for black females: South Dakota SD-10. Standard errors of the probability of dying: South Dakota SD-11. Standard errors of the average remaining lifetime: South Dakota TN-1. Life table for the total population: Tennessee TN-2. Life table for males: Tennessee TN-3. Life table for females: Tennessee TN-4. Life table for the white population: Tennessee TN-5. Life table for white males: Tennessee TN-6. Life table for white females: Tennessee TN-7. Life table for the black population: Tennessee TN-8. Life table for black males: Tennessee TN-9. Life table for black females: Tennessee TN-10. Standard errors of the probability of dying: Tennessee TN-11. Standard errors of the average remaining lifetime: Tennessee TX-1. Life table for the total population: Texas TX-2. Life table for males: Texas TX-3. Life table for females: Texas TX-4. Life table for the white population: Texas TX-5. Life table for white males: Texas TX-6. Life table for white females: Texas TX-7. Life table for the black population: Texas TX-8. Life table for black males: Texas TX-9. Life table for black females: Texas TX-10. Standard errors of the probability of dying: Texas TX-11. Standard errors of the average remaining lifetime: Texas UT-1. Life table for the total population: Utah UT-2. Life table for males: Utah UT-3. Life table for females: Utah UT-4. Life table for the white population: Utah UT-5. Life table for white males: Utah UT-6. Life table for white females: Utah UT-7. Life table for the black population: Utah UT-8. Life table for black males: Utah UT-9. Life table for black females: Utah UT-10. Standard errors of the probability of dying: Utah UT-11. Standard errors of the average remaining lifetime: Utah VT-1. Life table for the total population: Vermont VT-2. Life table for males: Vermont VT-3. Life table for females: Vermont VT-4. Life table for the white population: Vermont VT-5. Life table for white males: Vermont VT-6. Life table for white females: Vermont VT-7. Life table for the black population: Vermont VT-8. Life table for black males: Vermont VT-9. Life table for black females: Vermont VT-10. Standard errors of the probability of dying: Vermont VT-11. Standard errors of the average remaining lifetime: Vermont VA-1. Life table for the total population: Virginia VA-2. Life table for males: Virginia
VA-3. Life table for females: Virginia VA-4. Life table for the white population: Virginia VA-5. Life table for white males: Virginia VA-6. Life table for white females: Virginia VA-7. Life table for the black population: Virginia VA-8. Life table for black males: Virginia VA-9. Life table for black females: Virginia VA-10. Standard errors of the probability of dying: Virginia VA-11. Standard errors of the average remaining lifetime: Virginia WA-1. Life table for the total population: Washington WA-2. Life table for males: Washington WA-3. Life table for females: Washington WA-4. Life table for the white population: Washington WA-5. Life table for white males: Washington WA-6. Life table for white females: Washington WA-7. Life table for the black population: Washington WA-8. Life table for black males: Washington WA-9. Life table for black females: Washington WA-10. Standard errors of the probability of dying: Washington WA-11. Standard errors of the average remaining lifetime: Washington WV-1. Life table for the total population: West Virginia WV-2. Life table for males: West Virginia WV-3. Life table for females: West Virginia WV-4. Life table for the white population: West Virginia WV-5. Life table for white males: West Virginia WV-6. Life table for white females: West Virginia WV-7. Life table for the black population: West Virginia WV-8. Life table for black males: West Virginia WV-9. Life table for black females: West Virginia WV-10. Standard errors of the probability of dying: West Virginia WV-11. Standard errors of the average remaining lifetime: West Virginia WI-1. Life table for the total population: Wisconsin WI-2. Life table for males: Wisconsin WI-3. Life table for females: Wisconsin WI-4. Life table for the white population: Wisconsin WI-5. Life table for white males: Wisconsin WI-6. Life table for white females: Wisconsin WI-7. Life table for the black population: Wisconsin WI-8. Life table for black males: Wisconsin WI-9. Life table for black females: Wisconsin WI-10. Standard errors of the probability of dying: Wisconsin WI-11. Standard errors of the average remaining lifetime: Wisconsin WY-1. Life table for the total population: Wyoming WY-2. Life table for males: Wyoming WY-3. Life table for females: Wyoming WY-4. Life table for the white population: Wyoming WY-5. Life table for white males: Wyoming WY-6. Life table for white females: Wyoming WY-7. Life table for the black population: Wyoming WY-8. Life table for black males: Wyoming WY-9. Life table for black females: Wyoming WY-10. Standard errors of the probability of dying: Wyoming WY-11. Standard errors of the average remaining lifetime: Wyoming

National Vital Statistics Reports, Vol. 60, No. 9, September 14, 2012 67
This report is dedicated to the memory of Dr. Lester R. ‘‘Randy’’ Curtin (1951–2012).

U.S. DEPARTMENT OF HEALTH & HUMAN SERVICES
Centers for Disease Control and Prevention National Center for Health Statistics 3311 Toledo Road Hyattsville, MD 20782
FIRST CLASS MAIL POSTAGE & FEES PAID
CDC/NCHS PERMIT NO. G-284
OFFICIAL BUSINESS PENALTY FOR PRIVATE USE, $300
National Vital Statistics Reports, Vol. 60, No. 9, September 14, 2012
Contents
Abstract . . . . . . . . . . . . . . . . . . . . . . . . . . . . . . . . . . . . . . . 1 Introduction . . . . . . . . . . . . . . . . . . . . . . . . . . . . . . . . . . . . . 1 Data and Methods . . . . . . . . . . . . . . . . . . . . . . . . . . . . . . . . 1
Explanation of life table and standard error table columns . . . . . . . . 2 Results and Discussion. . . . . . . . . . . . . . . . . . . . . . . . . . . . . . 3
Life tables for the 50 states and District of Columbia . . . . . . . . . . . 3 References . . . . . . . . . . . . . . . . . . . . . . . . . . . . . . . . . . . . . 9 List of Detailed Tables . . . . . . . . . . . . . . . . . . . . . . . . . . . . . . 9 Technical Notes . . . . . . . . . . . . . . . . . . . . . . . . . . . . . . . . . . 52
Acknowledgments
The authors are grateful to Benjamin Kedem and Anastasia Voulgaraki of the University of Maryland’s Mathematics Department for their support in research on modeling extreme death rates; to Jiraphan Suntornchost, Shaun Garin, and Flor M. Garay for their assistance in editing tables and checking for errors in Excel files; to Van Parsons, Meena Khare, Donald J. Malec, Julia Holmes, and Ryne Paulose for their comments and suggestions on the draft report; and to Donna Hoyert for her assistance in posting the detailed life tables online. This report was prepared for the Division of Vital Statistics under the general direction of Charles J. Rothwell, Director of Vital Statistics, and Robert N. Anderson, Chief of the Mortality Statistics Branch. Registration Methods staff and Data Acquisition and Evaluation Branch staff provided consultation to state vital statistics offices regarding collection of the death certificate data on which this report is based. This report was edited and produced by CDC/OSELS/NCHS/OD/Office of Information Services, Information Design and Publishing Staff: Jane Sudol edited the report; typesetting was done by Jacqueline Davis, Annette Holman, and Zung T. Le; and graphics were produced by Jesse Guay (contractor).
Suggested citation
Wei R, Anderson RN, Curtin LR, Arias E. U.S. decennial life tables for 1999–2001: State life tables. National vital statistics reports; vol 60 no 9. Hyattsville, MD: National Center for Health Statistics. 2012.
Copyright information
All material appearing in this report is in the public domain and may be reproduced or copied without permission; citation as to source, however, is appreciated.
National Center for Health Statistics
Edward J. Sondik, Ph.D., Director Jennifer H. Madans, Ph.D., Associate Director
for Science
Division of Vital Statistics Charles J. Rothwell, M.S., Director
Office of Research and Methodology Nathaniel Schenker, Ph.D., Director
For e-mail updates on NCHS publication releases, subscribe online at: http://www.cdc.gov/nchs/govdelivery.htm. For questions or general information about NCHS: Tel: 1–800–232–4636 • E-mail: [email protected] • Internet: http://www.cdc.gov/nchs
DHHS Publication No. (PHS) 2012–1120 • CS232561


![REVIEWS AND DESCRIPTIONS OF TABLES AND BOOKS …€¦ · REVIEWS AND DESCRIPTIONS OF TABLES AND BOOKS 42[F] ... and the reviewer noticed no serious errors. ... Chapter III. Matrices](https://img.dokumen.tips/doc/110x75/5b6a40997f8b9af64d8bcc3a/reviews-and-descriptions-of-tables-and-books-reviews-and-descriptions-of-tables.jpg)