Embed Size (px)
Citation preview

State at a Glance
ISSN : 2455-8133 (Online)Volume 1(7), 2016
ENVIS Centre on Himalayan EcologyG.B. Pant National Institute of Himalayan Environment and Sustainable Development(An Autonomous Institute of Ministry of Environment, Forest and Climate Change, Government of India)Kosi-Katarmal, Almora-263 643, Uttarakhand (India)
ENVIS Centre on Himalayan EcologyG.B. Pant National Institute of Himalayan Environment and Sustainable Development(An Autonomous Institute of Ministry of Environment, Forest and Climate Change, Government of India)Kosi-Katarmal, Almora-263 643, Uttarakhand (India)
Mizoram

Volume 1 (7), 2016
Dr. P. P. DhyaniDirectorGBPNIHESD
Series EditorsG.C.S. NegiS. SharmaR. Joshi
ENVIS TeamDr. P. P. Dhyani, Coordinator
Dr. S. Sharma, Scientist-in-Charge
Mr. Nayan Sahu, Programme Officer
Mr. V. C. Sharma, Information Officer
Mr. S. K. Sinha, IT Assistant
Online available at: http://gbpihedenvis.nic.in/Mizoram_glance.html
Cover Photo Credits: ENVIS Centre: Mizoram Status of Environment and Related Issues.
Disclaimer: The information furnished in this volume is made available with the sole purpose of providing and wider dissemination of scientific information from secondary sources and is not meant for commercial use and purposes. ENVIS-GBPNIHESD Centre is not responsible for, any mistake, misprint or factual error, if any.
ENVIS Advisory Committee
CHAIRMANProf. S.S. Bargali, Kumaun University, Nainital, Uttarakhand, India
Prof. Varun Joshi, Guru Govind Singh Indraprastha University, Dwarka, New Delhi, India
Dr. G.C.S. Negi, Theme Head - BCM & ES, GBPNIHESD, Kosi-Katarmal, Almora, Uttarakhand, India
Mr. Ranjan Joshi, Theme Head – WPM, GBPNIHESD ,Kosi-Katarmal, Almora, Uttarakhand, India
Dr. Sandipan Mukherjee, Scientist, GBPNIHESD , Kosi-Katarmal, Almora, Uttarakhand, India
Dr. Subrat Sharma, Theme Head – CC, GBPNIHESD, Kosi-Katarmal, Almora, Uttarakhand, India
MEMBERS
MEMBERS SECRETARY
State at a Glance: MizoramCopyright ©: 2016, GBPNIHESD, Kosi-Katarmal, Almora

Volume 1(7), 2016
State at a Glance:Mizoram
Compiled by
Vipin Chandra Sharma, Nayan Sahu and S.K. Sinha
Editor-in-chief Editorial Board
Dr. P.P. Dhyani Prof. R.S. Tripathi, FNA
Dr. Eklabya Sharma, FNA
Prof. A.R. Nautiyal
Executive Editor Mr. Ranjan Joshi
Dr. G.C.S. Negi
Managing Editor
Dr. Subrat Sharma
ENVIS Centre on Himalayan Ecology
G.B. Pant National Institute of
Himalayan Environment & Sustainable Development
(An Autonomous Institute of Ministry of Environment, Forest and Climate Change, Government of India)
Kosi-Katarmal, Almora-263 643, Uttarakhand

Preface
The majestic Himalaya, which breezes life into all inter-dependent
components of ecological systems and environment, needs to be
better understood and expressed through various mechanisms. In
particular, availability of „data‟ that helps in turning simple 'opinions'
into 'facts' proves to be extremely useful for pointing present
ecological and socio-economic patterns, and further assisting in
future projections. Realizing this fact, a new publication series of
"ENVIS Centre on Himalayan Ecology" has been initiated that
attempts to collect, collate and synthesize available data/information on different aspects of
the Indian Himalayan Region (IHR). In this context, comparative analysis between past and
present status of various interlinked components such as people, land, water, climate,
natural resources, etc. reveals crucial cues about the past planning status, current pace of
development, and future growth prospects. In India, there exist a number of specialized
government agencies and departments which collect and compile such datasets and make
them available through various mechanisms. In these endeavors, compilation of datasets in
a condensed volume for each Himalayan State is likely to be more useful for a wide range of
information seekers, users and stakeholders.
In the above context, "ENVIS Centre on Himalayan Ecology" at G.B. Pant
National Institute of Himalayan Environment and Sustainable Development has prepared this
issue on "Mizoram" State. This publication, seventh in its series, covers temporal trends
across important segments, e.g., Social, Education, Health and Family welfare, Climate,
Land, Water, Agriculture, Horticulture, Livestock, Forests, Minerals and Petroleum, Industry,
Road and Transport, etc. I am hopeful that this compendium based on secondary information
would be useful for understanding of environment and developmental status of this
Himalayan state, and cater to the need of various stakeholders. I urge the readers to provide
comments and views so as to enable us to further improve the forthcoming similar issues on
other states of IHR. I take this opportunity to thank all colleagues of the Institute, particularly
the ENVIS team for their valuable contribution and MoEF&CC for their generous funding
support. The critical review of this issue by readers will guide us to further improve other
similar publications in future.
P.P. Dhyani Director
G.B. Pant National Institute of Himalayan Environment & Sustainable Development
From the Editorial Desk
Augmentation of authentic data base on physical, biological and socio-economic aspects of
the Himalayan mountains has always been challenging and fascinating to academicians,
researchers, planners and policy makers and implementing agencies, particularly when this
region is viewed as “data deficient” by the Inter Governmental Panel on Climate Change
(IPCC). Authentic data base is not only important to acquire fundamental knowledge but also
proves crucial for formulating policies and development planning. "ENVIS Centre on
Himalayan Ecology" of this Institute has been given a task by the MoEF&CC, Govt. of India
to compile such a data base for the Indian Himalayan states. Therefore, continuing with the
series of past such publications for Himachal Pradesh, Arunachal Pradesh, Jammu &
Kashmir, Sikkim, Uttarakhand and Nagaland we have now taken up the state of „Mizoram‟ by
collecting, collating and compiling secondary data base available with various sources. In
coming years, we will bring out such publications on other states of Indian Himalayan region.
We hope that readers will find this compilation a useful reference for baseline information.
Suggestions to improve this publication series are always welcome.
Editorial Team

CONTENTS
Profile Page No
About Mizoram i-ii
Fact Sheet iii-iv
Social 01-10
Education 11-19
Health and Family Welfare 21-28
Climate 29-32
Land 33-39
Water 41-52
Agriculture 53-65
Horticulture 67-76
Livestock 77-86
Forests and Protected Areas 87-94
Minerals and Petroleum 95-97
Industry 99-107
Road and Transport 109-120
Miscellaneous 121-128
Web Directory 129-135

i
Mizoram at a glance
Mizoram is one of the prominent state of Northeast
India, with Aizawl as its capital city. The name
Mizoram is derived from Mi (people), Zo (lofty
place, such as a hill) and Ram (land), and thus
Mizoram implies "Land of the hill people".
Like several other northeastern states of India,
Mizoram was previously part of Assam until 1972,
when it was carved out as a Union Territory. It
became the 23rd state of India, a step above Union
Territory; on 20 February 1987. Mizoram's population
was 1,091,014, according to a 2011 census. It is the
2nd least populous state in the country. Mizoram
covers an area of approximately 21,087 square
kilometers. About 91% of the state is forested. About
95% of current Mizoram population is of diverse
tribal origins who settled in the state, mostly from
southeast Asia, over waves of migration starting about 16th century but mainly in 18th
century. This is the highest concentration of tribal people among all states of India, and they
are currently protected under Indian constitution as a Scheduled Tribe. The tribes converted
from Animist religions to Christianity over the first half of 20th century. Mizoram is one of
three states of India with a Christian majority (87%). Its people belong to various
denominations, mostly Presbyterian in its North and Baptists in South. Mizoram is a highly
literate agrarian economy, but suffers from slash-and-burn jhum or shifting cultivation, and
poor crop yields. In recent years, the jhum farming practices are steadily being replaced with
a significant horticulture and bamboo products industry. The state's gross state domestic
product for 2012 was estimated at 6,991 crore (US$1.0 billion). The state has about 871
kilometers of national highways, with NH-54 and NH-150 connecting it to Assam and
Manipur respectively. It is also a growing transit point for trade with Myanmar and
Bangladesh.
Mizoram is a land of rolling hills, valleys, rivers and lakes. As many as 21 major hill ranges
or peaks of different heights run through the length and breadth of the state, with plains
scattered here and there. The average heights of the hills to the west of the state are about

ii
1,000 meters (3,300 ft). These gradually rise up to 1,300 meters (4,300 ft) to the east. Some
areas, however, have higher ranges which go up to a height of over 2,000 meters (6,600 ft).
Phawngpui Tlang also known as the Blue Mountain, situated in the south-eastern part of the
state, is the highest peak in Mizoram at 2,210 meters (7,250 ft). About 76% of the state is
covered by forests, 8% is fallows land, 3% is barren and considered uncultivable area, while
cultivable and sown area constitutes the rest. As per state of forest report 2015, it is the state
with maximum forest cover as percentage of their own geographical area (88.93%).
Mizoram terrain is, according to Geological Survey of India, an immature topography, and
the physiographic expression consists of several, almost North-South longitudinal valleys
containing series of small and flat hummocks, mostly anticlinal, parallel to sub-parallel hill
ranges and narrow adjoining synclinal valleys with series of topographic highs. The general
geology of western Mizoram consists of repetitive succession of Neogene sedimentary rocks
of Surma Group and Tipam formation viz. sandstone, siltstone, mudstone and rare pockets of
shell limestone. The eastern part is Barail Group. Mizoram, lies in seismic zone V, according
to the India Meteorological Department; as with other northeastern states of India, this means
the state has the highest risk of earthquakes relative to other parts of India.
The biggest river in Mizoram is Chhimtuipui, also known as Kaladan, Kolodyne or
Chimtuipui. It originates in Chin state in Burma and passes through Saiha and Lawngtlai
districts in the southern tip of Mizoram, goes back to Burma's Rakhine state. Although many
more rivers and streams drain the hill ranges, the most important and useful rivers are the
Tlawng, Tut, Tuirial and Tuivawl which flow through the northern territory and eventually
join the Barak River in Cachar District. The rivers have a gentle drainage gradient
particularly in the south. The Palak lake is the biggest in Mizoram and covers 30 hectares (74
acres). The lake is situated in Saiha district of southern Mizoram. It is believed that the lake
was created as a result of an earthquake or a flood. The local people believe that a submerged
village remains intact deep under the waters. The Tam Dil lake is a natural lake situated 85
kilometres (53 mi) from Aizawl. Legends believe, that a huge mustard plant once stood at
this place. When the plant was cut down, jets of water sprayed from the plant and created a
pool of water, thus the lake was named Ţam Dil which means of 'lake of mustard plant'.
Today the lake is an important tourist attraction and a holiday resort. The most significant
lake in Mizo history, Rih Dil, is ironically located in Burma, a few kilometres from the Indo-
Burma border. It was believed that the departed souls pass through this lake before making
their way to heaven.
Source: www.mizoram.gov.in (Accessed on 12.01.2017)

iii
Fact Sheet - Mizoram
Geographical Data
Geographical Area Total 21,081 sq. km.
North – South 277 Km
East - West 121 Km
Latitude 21o 58' to 24
o 35' N
Longitude 92o 15' to 93
o 29' E
Demographic Details [Census, 2011]
Population Total 10,97,206
Males 5,55,339
Females 5,41,867
Rural 5,25,435
Urban 5,71,771
Females per 1000 Males 975
Density of Population 52
Growth of Population (%) [2001-2011] 23.48
Child Population in the Age Group (0-6)
Total 1,68,531
Males 85,561
Females 82,970
Literacy Data
Total 8,48,175
Males 4,38,529
Females 4,09,646
Literacy Rate (%)
Total 91.33
Males 93.35
Females 89.27
Scheduled Caste (SC) Population
Total 1218
Males 807
Females 411
iv
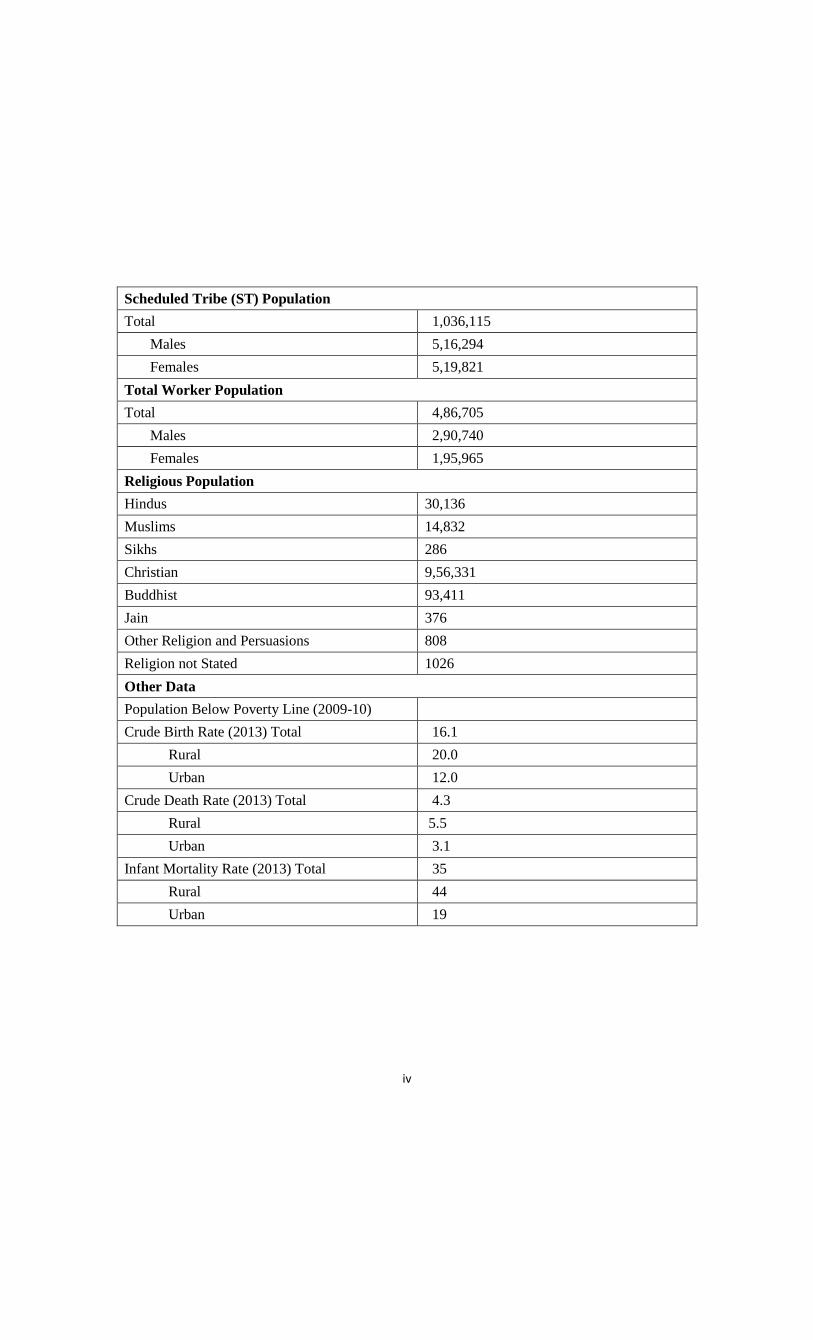
Scheduled Tribe (ST) Population
Total 1,036,115
Males 5,16,294
Females 5,19,821
Total Worker Population
Total 4,86,705
Males 2,90,740
Females 1,95,965
Religious Population
Hindus 30,136
Muslims 14,832
Sikhs 286
Christian 9,56,331
Buddhist 93,411
Jain 376
Other Religion and Persuasions 808
Religion not Stated 1026
Other Data
Population Below Poverty Line (2009-10)
Crude Birth Rate (2013) Total 16.1
Rural 20.0
Urban 12.0
Crude Death Rate (2013) Total 4.3
Rural 5.5
Urban 3.1
Infant Mortality Rate (2013) Total 35
Rural 44
Urban 19

v
More Information about Mizoram
Administrative Structure
State Capital Aizawl
No. of Towns [as per 2011 Census] 23
No. of Villages [as per 2011 Census]
Total 830
Inhabited 704
Uninhabited 126
No. of Districts 8
No. of Tehsils (Sub-districts/divisions) 26
No. of Blocks 26
No. of Parliament Constituencies
Lok Sabha 1
Rajya Sabha 1
No. of Assembly Constituencies [Vidhan Sabha] 40
Developmental Indicators
Net State Domestic Product (NSDP) at Current Prices
[2013-14] (Rs. in crore)
Rs. 9,302
Net State Domestic Product (NSDP) at Constant
Prices[2013-14] (Rs. in crore)
Rs. 5,022
Per Capita Net State Domestic Product (NSDP) at
Current Prices [2013-14] (Rs. in crore)
Rs. 76,120
Per Capita Net State Domestic Product (NSDP) at
Constant Prices [2013-14] (Rs. in crore)
Rs. 41,094
Gross State Domestic Product (GSDP) at Current
Prices [2013-14] (Rs. in crore)
Rs. 10,297
Gross State Domestic Product (GSDP) at Constant
Prices[2013-14] (Rs. in crore)
Rs. 5,608
Forest Data [2015 Assessment]
Forest Cover Total 18,748 km2
Very Dense Forest (VDF) 138 km2
Moderate Dense Forest (MDF) 5,858 km2
Open Forest 12,752 km2
Recorded Forest Area (Total) 5,641 km2
Reserved Forests Area 4,483 km2

vi
Protected Forests Area Nil
Unclassed Forest Area 1,158 km2
Protected Areas and Conservation Sites
No. of Wild Life Sanctuaries 8
No. of National Parks 2
No. of Tiger Reserves 1
Others
Average Rain Fall 250 mm annually
Temperature 11o–21
oC in winter
20o–30
oC in summer
State Animal Serow (Saza)
(Naemorhedus sumatraensis)
State Bird Hume's Bartailed Pheasant (Vavu)
(Syrmaticus humiae)
State Flower Renanthera imschootiana (Senhri; Red
Vanda)
State Tree Mesual ferrea(Nahar)
State Languages Aso, Chho, Halam, 'Hinar', Lai,
Lusei, Mara, Miu - Khumi, Paite and
Thado – Kuki, English and Hindi
Major Rivers Tlawng (185.15 km)
Major Towns Aizawl, Kolasib, Serchhip,
Lunglei
Major Crops Rice, Maize
Major Plantations Tea, Rubber, Coffee, Tung Oil
Major Fruits, Vegetables & Spices Banana, Pineapple, Orange,
Passion Fruit, Chilies and Ginger
Major Minerals Coal, Limestone
Airports Lengpui Airport (Aizawl)
Source: Centre for Development and Peace Studies (Statistical Hand Book of Nagaland, 2014)
NEDFI Databank; Economic Survey of India 2008-09; NITI Aayog
http // censusindia.gov.in
http //www.frienvis.nic.in/KidsCentre/State-Animals-Birds-Trees-Flowers-of-India_1500.aspx
http //knowindia.gov.in/knowindia/national_symbols.php?id=16#naga
http //www.mizoram.nic.in/about/glance.htm (accessed on 25.10.2016)
http //mdoner.gov.in/content/mizoram-3

Social State at a Glance: Mizoram, Vol. 1(7), 2016
ENVIS Centre on Himalayan Ecology 1
Social
List of Tables
1.1: Human Population and Decadal Growth Rate
1.2: Decennial Population, Sex Ratio, Growth Rate & Population Density
1.3: District-wise Population
1.4: District-wise Child Population
1.5: District-wise Scheduled Castes (SC) Population
1.6: District-wise Scheduled Tribe (ST) Population
1.7: District-wise Literate Population and Literacy Rate
1.8: Details of Decadal Population
1.9: Administrative Units
1.10: Number of Districts, DRDAs, Blocks and Villages
1.11: Gross State Domestic Product (GSDP) at Current & Constant Prices
1.12: Per Capita Net State Domestic Product (NSDP) of State at Current & Constant
Prices
1.13: Net State Domestic Product (NSDP) at Current & Constant Prices
1.14: Population below the Poverty Line
1.15: Distribution of Households by Source of Lighting
1.16: Slum Households Classified by Source and Location of Drinking Water
1.17: Details of Statutory and Slum Reported Towns with Type-wise Slum Population
1.18: Drainage Connectivity for Waste Water
1.19: Primary Source of Energy for Cooking
1.20: Availability of Drinking Water Facility

Social State at a Glance: Mizoram, Vol. 1(7), 2016
ENVIS Centre on Himalayan Ecology 2
Table 1.1: Human Population and Decadal Growth Rate
Human Population (Census, 2001)
Males 4,59,109
Females 4,29,464
Total 8,88,573
Rural 4,47,567
Urban 4,41,006
Human Population (Census, 2011)
Males 5,55,339
Females 5,41,867
Total 10,97,206
Rural 5,25,435
Urban 5,71,771
Child Population in the Age Group (0-6) years
Males 85,561
Females 82,970
Total 1,68,531
Percent Decadal Growth Rate
1991-2001 +28.82
2001-2011 +23.48
Table 1.2: Decennial Population, Sex Ratio, Growth Rate and Population Density
Year Population Females
per 1000 males
Decennial growth rate Density
(per km2)
2001 888573 935 +28.82 42
2011 1097206 975 +23.48 52
Source (Tables 1.1-1.2): Office of the Registrar General of India, Ministry of Home Affairs, Govt. of India
Census of India, 2001, 2011.
http://censusindia.gov.in (Accessed on 02.08.2016)

Social State at a Glance: Mizoram, Vol. 1(7), 2016
ENVIS Centre on Himalayan Ecology 3
Table 1.3: District-wise Population (Census, 2011)
State/District Persons Males Females
Mizoram
Total 10,97,206 5,55,339 5,41,867
Rural 5,25,435 2,69,135 2,56,300
Urban 5,71,771 2,86,204 2,85,567
Mamit
Total 86,364 44,828 41,536
Rural 71,465 37,135 34,330
Urban 14,899 7,693 7,206
Kolasib
Total 83,955 42,918 41,037
Rural 37,077 19,097 17,980
Urban 46,878 23,821 23,057
Aizawl
Total 4,00,309 1,99,270 2,01,039
Rural 85,555 43,780 41,775
Urban 3,14,754 1,55,490 1,59,264
Champhai
Total 1,25,745 63,388 62,357
Rural 77,216 39,110 38,106
Urban 48,529 24,278 24,251
Serchhip
Total 64,937 32,851 32,086
Rural 32,918 16,643 16,275
Urban 32,019 16,208 15,811
Lunglei
Total 1,61,428 82,891 78,537
Rural 92,676 47,577 45,099
Urban 68,752 35,314 33,438
Lawngtlai
Total 1,17,894 60,599 57,295
Rural 97,064 49,940 47,124
Urban 20,830 10,659 10,171
Saiha
Total 56,574 28,594 27,980
Rural 31,464 15,853 15,611
Urban 25,110 12,741 12,369
Source: Office of the Registrar General of India, Ministry of Home Affairs, Govt. of India
Census of India, 2011.
http://censusindia.gov.in (Accessed on 02.06.2016)

Social State at a Glance: Mizoram, Vol. 1(7), 2016
ENVIS Centre on Himalayan Ecology 4
Table 1.4: District-wise Child Population (Census, 2011)
State/
District Total Population
Child Population in the
Age Group (0-6) years
Persons Males Females Persons Males Females
Mizoram 10,97,206 5,55,339 5,41,867 1,68,531 85,561 82,970
Mamit 86,364 44,828 41,536 15,495 7,828 7,667
Kolasib 83,955 42,918 41,037 13,482 6,810 6,672
Aizawl 4,00,309 1,99,270 2,01,039 52,357 26,450 25,907
Champhai 1,25,745 63,388 62,357 20,645 10,474 10,171
Serchhip 64,937 32,851 32,086 9,299 4,771 4,528
Lunglei 1,61,428 82,891 78,537 25,117 12,798 12,319
Lawngtlai 1,17,894 60,599 57,295 22,483 11,433 11,050
Saiha 56,574 28,594 27,980 9,653 4,997 4,656
Table 1.5: District-wise Scheduled Castes (SC) Population (Census, 2011)
District Total Persons Males Females
Total Rural Urban Total Rural Urban Total Rural Urban
Mamit 51 38 13 42 31 11 9 7 2
Kolasib 84 17 67 59 12 47 25 5 20
Aizawl 627 46 581 388 36 352 239 10 229
Champhai 17 10 7 16 9 7 1 1 0
Serchhip 32 13 19 20 8 12 12 5 7
Lunglei 178 65 113 125 38 87 53 27 26
Lawngtlai 146 97 49 105 68 37 41 29 12
Saiha 83 12 71 52 7 45 31 5 26
Total 1218 298 920 807 209 598 411 89 322
Source (Tables 1.4-1.5): Office of the Registrar General of India, Ministry of Home, Govt. of India
Census of India, 2011.
http://censusindia.gov.in (Accessed on 02.08.2016)

Social State at a Glance: Mizoram, Vol. 1(7), 2016
ENVIS Centre on Himalayan Ecology 5
Table 1.6: District-wise Scheduled Tribe (ST) Population (Census, 2011)
District Total Persons Males Females
Total Rural Urban Total Rural Urban Total Rural Urban
Mamit 82,080 68,096 13,984 42,075 34,999 7,076 40,005 33,097 6,908
Kolasib 73,609 32,582 41,027 36,917 16,585 20,332 36,692 15,997 20,695
Aizawl 3,73,542 83,343 2,90,199 1,82,517 42,249 1,40,268 1,91,025 41,094 1,49,931
Champhai 1,23,466 75,747 47,719 61,954 38,217 23,737 61,512 37,530 23,982
Serchhip 62,889 32,474 30,415 31,381 16,368 15,013 31,508 16,106 15,402
Lunglei 1,53,533 91,310 62,223 77,180 46,663 30,517 76,353 44,647 31,706
Lawngtlai 1,12,354 92,877 19,477 57,044 47,356 9,688 55,310 45,521 9,789
Saiha 54,642 31,038 23,604 27,226 15,550 11,676 27,416 15,488 11,928
Total 10,36,115 5,07,467 5,28,648 5,16,294 2,57,987 2,58,307 5,19,821 2,49,480 2,70,341
Table 1.7: District-wise Literate Population and Literacy Rate (Census, 2011)
District Literate Population Literacy Rate*
(%)
Persons Males Females Persons Rural Urban
Mamit 60,191 32,977 27,214 85.96 84.52 92.63
Kolasib 65,895 34,147 31,748 94.54 91.49 96.83
Aizawl 3,40,595 1,69,547 1,71,048 98.50 97.52 98.78
Champhai 1,00,802 51,440 49,362 93.51 90.29 98.70
Serchhip 54,476 27,598 26,878 98.76 98.43 99.09
Lunglei 1,21,122 64,515 56,607 89.40 82.60 98.99
Lawngtlai 62,861 36,444 26,417 66.41 59.87 94.95
Saiha 42,233 21,861 20,372 88.41 84.66 92.96
Total 8,48,175 4,38,529 4,09,646 91.58 84.31 98.10
*Literacy Rate as per the Provisional Data of Census, 2011
Source (Tables 1.6-1.7): Office of the Registrar General of India, Ministry of Home, Govt. of India
Census of India, 2011.
http://censusindia.gov.in (Accessed on 02.08.2016)
Social State at a Glance: Mizoram, Vol. 1(7), 2016
ENVIS Centre on Himalayan Ecology 6
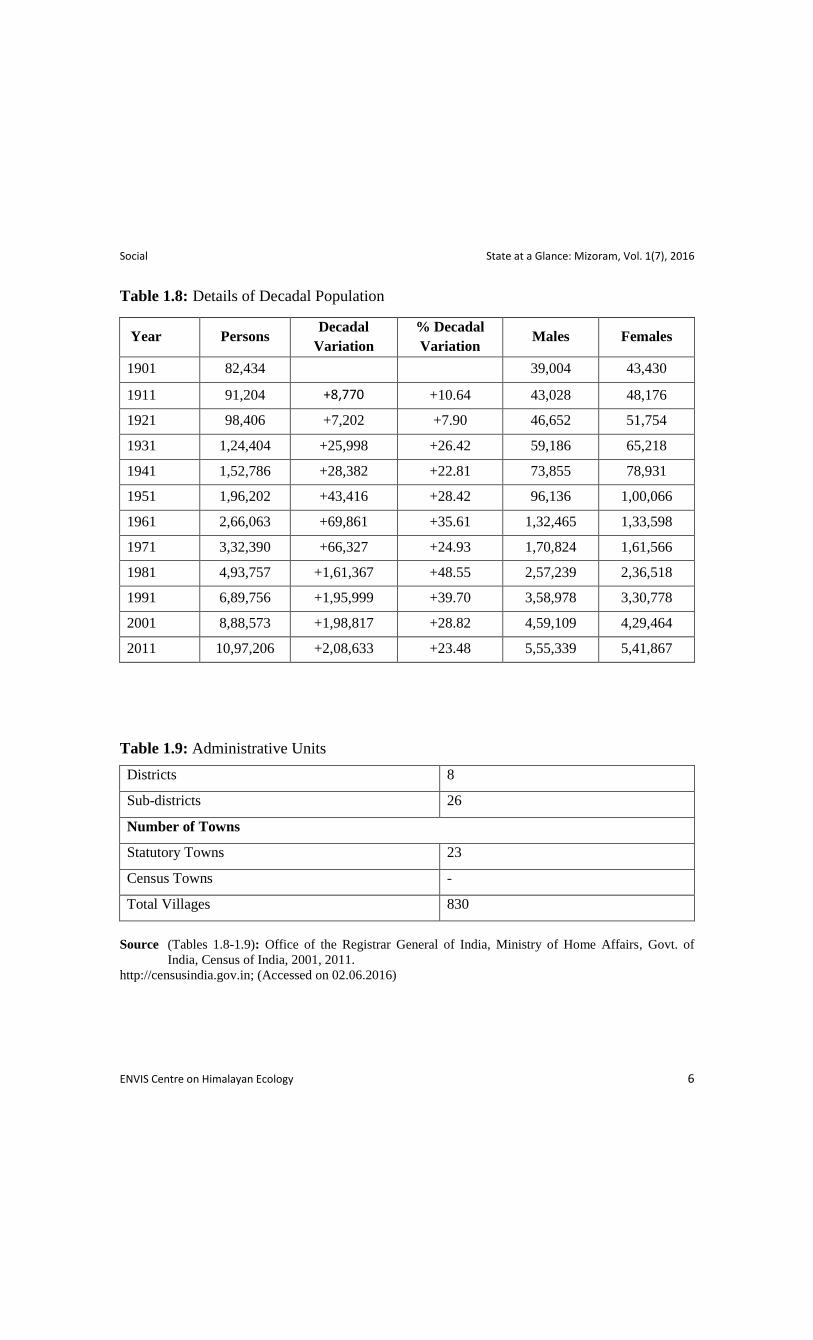
Table 1.8: Details of Decadal Population
Year Persons Decadal
Variation
% Decadal
Variation Males Females
1901 82,434 39,004 43,430
1911 91,204 +8,770 +10.64 43,028 48,176
1921 98,406 +7,202 +7.90 46,652 51,754
1931 1,24,404 +25,998 +26.42 59,186 65,218
1941 1,52,786 +28,382 +22.81 73,855 78,931
1951 1,96,202 +43,416 +28.42 96,136 1,00,066
1961 2,66,063 +69,861 +35.61 1,32,465 1,33,598
1971 3,32,390 +66,327 +24.93 1,70,824 1,61,566
1981 4,93,757 +1,61,367 +48.55 2,57,239 2,36,518
1991 6,89,756 +1,95,999 +39.70 3,58,978 3,30,778
2001 8,88,573 +1,98,817 +28.82 4,59,109 4,29,464
2011 10,97,206 +2,08,633 +23.48 5,55,339 5,41,867
Table 1.9: Administrative Units
Districts 8
Sub-districts 26
Number of Towns
Statutory Towns 23
Census Towns -
Total Villages 830
Source (Tables 1.8-1.9): Office of the Registrar General of India, Ministry of Home Affairs, Govt. of
India, Census of India, 2001, 2011.
http://censusindia.gov.in; (Accessed on 02.06.2016)

Social State at a Glance: Mizoram, Vol. 1(7), 2016
ENVIS Centre on Himalayan Ecology 7
Table 1.10: Number of Districts, DRDAs, Blocks and Villages
Year 2012
Number of District covered under NREGA# 8
DRDAs -
Blocks 26
Total Villages* 830
DRDAs = District Rural Development Agencies; NREGA = National Rural Employment Guarantee Act
(*) As per Census, 2001. (#): As per information from State Govt.
Source: Ministry of Rural Development, Central Statistical Organization, Govt. of India
(Statistical Year Book, India, 2016).
http://mospi.nic.in/Mospi_New/upload/SYB2016/index1.html (Accessed on 08.06.2016)
Table 1.11: Gross State Domestic Product (GSDP) at Current & Constant (2004-05)
Prices
Year at Current Prices at Constant Prices
GSDP
(Rs. in Crore)
Growth Rate
(%)
GSDP
(Rs. in Crore)
Growth
Rate (%)
2010-11 6,388 21.44 4,979 17.18
2011-12 6,890 7.86 4,852 -2.55
2012-13 8,363 21.38 5,203 7.23
2013-14 10,297 23.13 5,608 7.78
2014-15 NA NA NA NA
Table 1.12: Per Capita Net State Domestic Product (NSDP) of State at Current &
Constant Prices
Year at Current Prices at Constant Prices
Per Capita NSDP
(Rs. in Crore)
Growth Rate
(%)
Per Capita NSDP
(Rs. in Crore)
Growth
Rate (%)
2010-11 50,956 19.29 40,072 15.48
2011-12 53,624 5.24 37,921 -5.37
2012-13 63,413 18.25 39,347 3.76
2013-14 76,120 20.04 41,094 4.44
2014-15 NA NA NA NA
Social State at a Glance: Mizoram, Vol. 1(7), 2016
ENVIS Centre on Himalayan Ecology 8
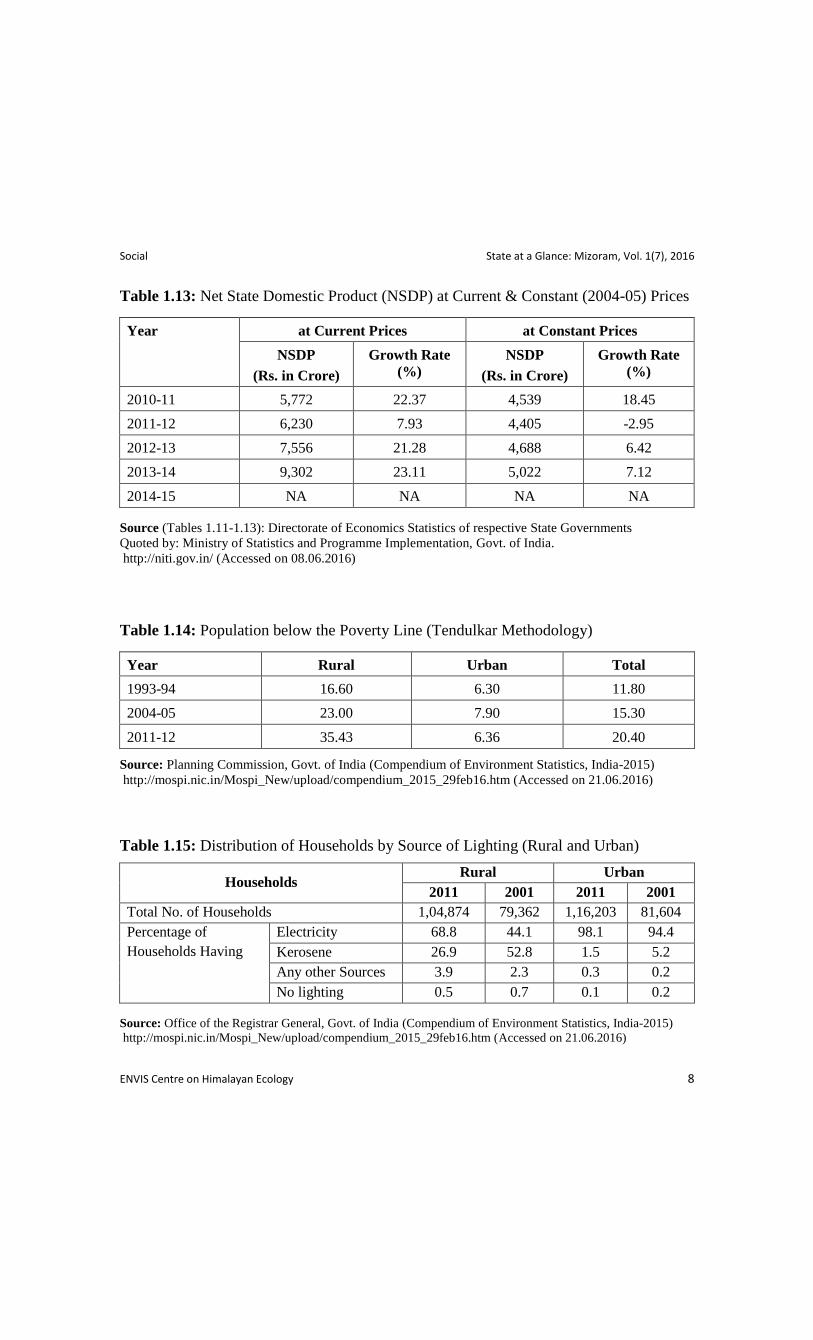
Table 1.13: Net State Domestic Product (NSDP) at Current & Constant (2004-05) Prices
Year at Current Prices at Constant Prices
NSDP
(Rs. in Crore)
Growth Rate
(%)
NSDP
(Rs. in Crore)
Growth Rate
(%)
2010-11 5,772 22.37 4,539 18.45
2011-12 6,230 7.93 4,405 -2.95
2012-13 7,556 21.28 4,688 6.42
2013-14 9,302 23.11 5,022 7.12
2014-15 NA NA NA NA
Source (Tables 1.11-1.13): Directorate of Economics Statistics of respective State Governments
Quoted by: Ministry of Statistics and Programme Implementation, Govt. of India.
http://niti.gov.in/ (Accessed on 08.06.2016)
Table 1.14: Population below the Poverty Line (Tendulkar Methodology)
Year Rural Urban Total
1993-94 16.60 6.30 11.80
2004-05 23.00 7.90 15.30
2011-12 35.43 6.36 20.40
Source: Planning Commission, Govt. of India (Compendium of Environment Statistics, India-2015)
http://mospi.nic.in/Mospi_New/upload/compendium_2015_29feb16.htm (Accessed on 21.06.2016)
Table 1.15: Distribution of Households by Source of Lighting (Rural and Urban)
Households Rural Urban
2011 2001 2011 2001
Total No. of Households 1,04,874 79,362 1,16,203 81,604
Percentage of
Households Having
Electricity 68.8 44.1 98.1 94.4
Kerosene 26.9 52.8 1.5 5.2
Any other Sources 3.9 2.3 0.3 0.2
No lighting 0.5 0.7 0.1 0.2
Source: Office of the Registrar General, Govt. of India (Compendium of Environment Statistics, India-2015)
http://mospi.nic.in/Mospi_New/upload/compendium_2015_29feb16.htm (Accessed on 21.06.2016)

Social State at a Glance: Mizoram, Vol. 1(7), 2016
ENVIS Centre on Himalayan Ecology 9
Table 1.16: Slum Households Classified by Source and Location of Drinking Water
(Census, 2011)
Number of Households by Source of Drinking Water
Total Well
Number of
Households
Tap Hand Pump
& Tube Well,
Borehole
Well All
Others Treated
Source
Untreated
Source Covered Uncovered
16240 9,189 1707 377 460 289 4,218
Note: This appendix excludes institutional households
Source: Census of India 2011, Slum Houses, Household Amenities and Assets.
http://censusindia.gov.in/ (Accessed on 21.06.2016)
Table 1.17: Details of Statutory and Slum Reported Towns with Type-wise Slum
Population (Census, 2011)
Towns Type wise slum population
Statutory Towns Slum Reported
Towns
Total
Population
Notified
Slums
Recognised
Slums
Identified
Slums
23 1 78,561 0 78,561 0
Table 1.18: Drainage Connectivity for Waste Water (Census, 2011)
Total number of Households Waste Water Outlet Connected to
Closed Drainage Open Drainage No Drainage
16240 3,866 9,964 2,410
Source (Tables 1.17-1.18): Slum Census of India, 2011 (Compendium of Environment Statistics, India-2015)
http://mospi.nic.in/Mospi_New/upload/compendium_2015_29feb16.htm (Accessed on 21.06.2016)
Social State at a Glance: Mizoram, Vol. 1(7), 2016
ENVIS Centre on Himalayan Ecology 10
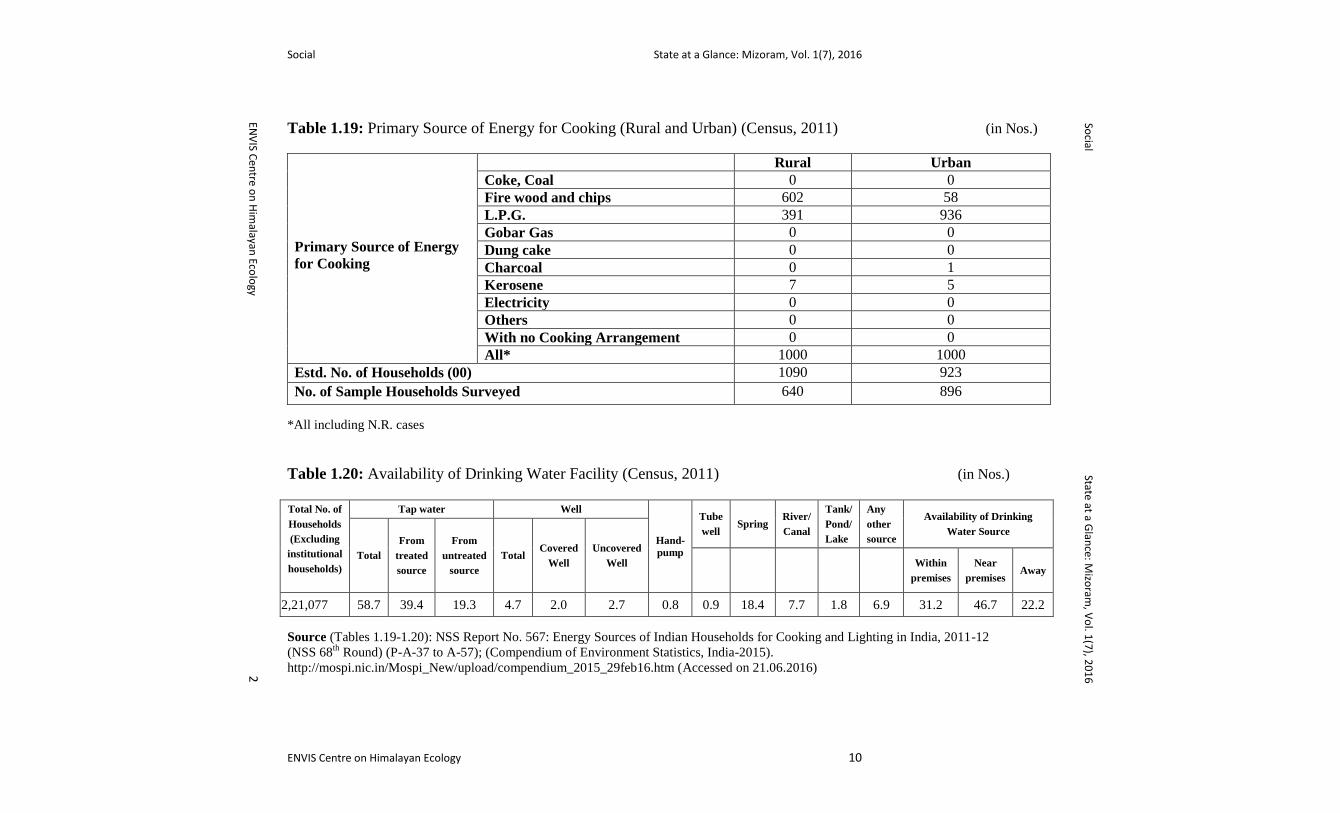
Table 1.19: Primary Source of Energy for Cooking (Rural and Urban) (Census, 2011) (in Nos.)
Primary Source of Energy
for Cooking
Rural Urban
Coke, Coal 0 0
Fire wood and chips 602 58
L.P.G. 391 936
Gobar Gas 0 0
Dung cake 0 0
Charcoal 0 1
Kerosene 7 5
Electricity 0 0
Others 0 0
With no Cooking Arrangement 0 0
All* 1000 1000
Estd. No. of Households (00) 1090 923
No. of Sample Households Surveyed 640 896
*All including N.R. cases
Table 1.20: Availability of Drinking Water Facility (Census, 2011) (in Nos.)
Total No. of
Households
(Excluding
institutional
households)
Tap water Well
Hand-
pump
Tube
well Spring
River/
Canal
Tank/
Pond/
Lake
Any
other
source
Availability of Drinking
Water Source
Total
From
treated
source
From
untreated
source
Total Covered
Well
Uncovered
Well
Within
premises
Near
premises Away
2,21,077 58.7 39.4 19.3 4.7 2.0 2.7 0.8 0.9 18.4 7.7 1.8 6.9 31.2 46.7 22.2
Source (Tables 1.19-1.20): NSS Report No. 567: Energy Sources of Indian Households for Cooking and Lighting in India, 2011-12
(NSS 68th
Round) (P-A-37 to A-57); (Compendium of Environment Statistics, India-2015).
http://mospi.nic.in/Mospi_New/upload/compendium_2015_29feb16.htm (Accessed on 21.06.2016)
Social
State at a Glan
ce: Mizo
ram, V
ol. 1
(7), 2
01
6
ENV
IS Cen
tre on
Him
alayan Eco
logy
2

Education State at a Glance: Mizoram, Vol. 1(7), 2016
ENVIS Centre on Himalayan Ecology 11
Education
List of Tables
2.1: Number of Educational Institutions
2.2: Number of Institutions by Management
2.3: Number of Educational Institutions of Higher and Professionals Education
2.4: Enrolment in different Discipline
2.5: Student Teacher Ratio in different Categories of Educational Institutions/Schools
2.6: Number of Teachers in Educational Institutions
2.7: Pupil Teacher Ratio in Higher Education
2.8: Number of Teachers in Universities and Colleges
2.9: Gross Enrolment Ratio (GER) in All Categories
2.10: Gender Parity Index (GPI) in different Classes
2.11: Gender Parity Index (GPI) in Scheduled Castes & Scheduled Tribes
2.12: Literacy Rate
2.13: Number of Universities and University level Institutions
2.14: Specialization-wise Colleges
2.15: Details of Universities
Education State at a Glance: Mizoram, Vol. 1(7), 2016
ENVIS Centre on Himalayan Ecology 12
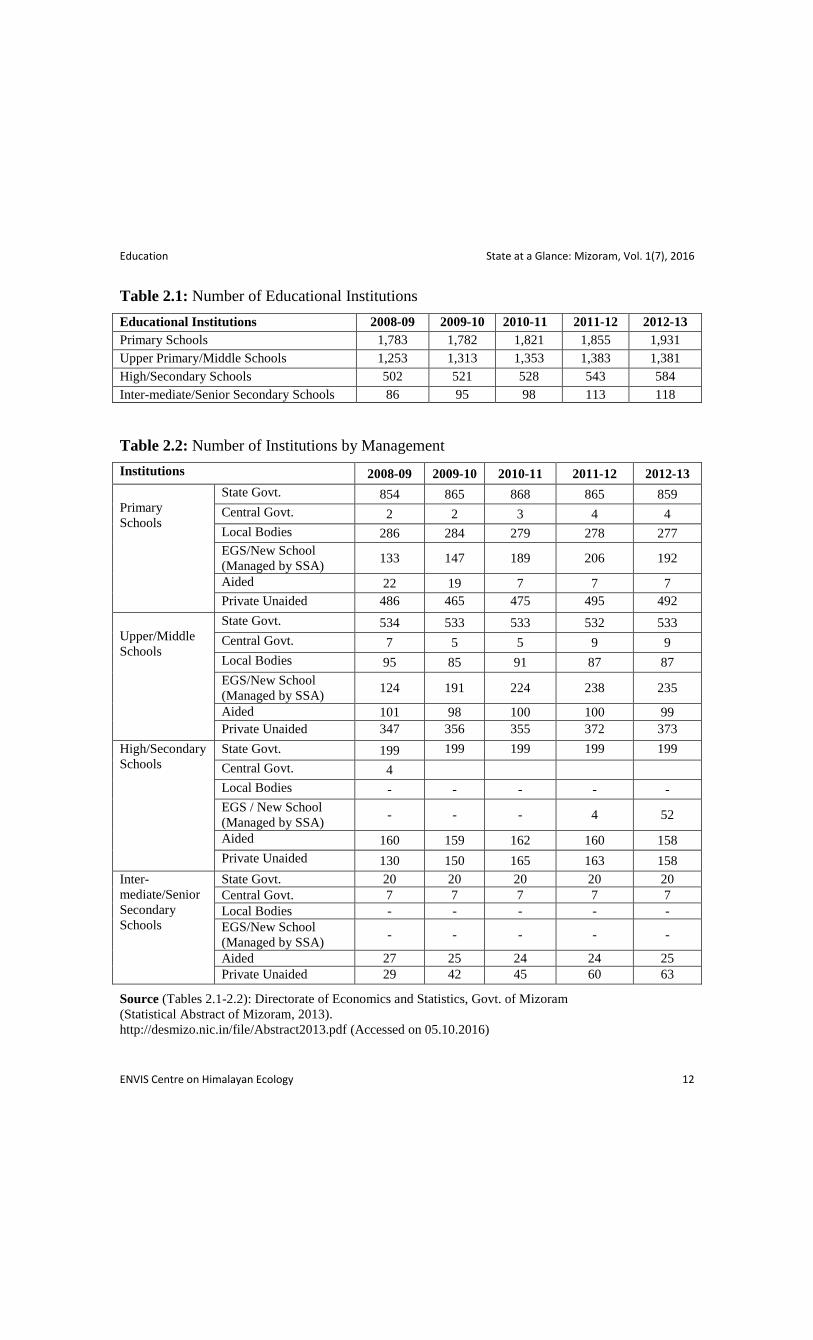
Table 2.1: Number of Educational Institutions
Educational Institutions 2008-09 2009-10 2010-11 2011-12 2012-13
Primary Schools 1,783 1,782 1,821 1,855 1,931
Upper Primary/Middle Schools 1,253 1,313 1,353 1,383 1,381
High/Secondary Schools 502 521 528 543 584
Inter-mediate/Senior Secondary Schools 86 95 98 113 118
Table 2.2: Number of Institutions by Management
Institutions 2008-09 2009-10 2010-11 2011-12 2012-13
Primary
Schools
State Govt. 854 865 868 865 859
Central Govt. 2 2 3 4 4
Local Bodies 286 284 279 278 277
EGS/New School
(Managed by SSA) 133 147 189 206 192
Aided 22 19 7 7 7
Private Unaided 486 465 475 495 492
Upper/Middle
Schools
State Govt. 534 533 533 532 533
Central Govt. 7 5 5 9 9
Local Bodies 95 85 91 87 87
EGS/New School
(Managed by SSA) 124 191 224 238 235
Aided 101 98 100 100 99
Private Unaided 347 356 355 372 373
High/Secondary
Schools
State Govt. 199 199 199 199 199
Central Govt. 4
Local Bodies - - - - -
EGS / New School
(Managed by SSA) - - - 4 52
Aided 160 159 162 160 158
Private Unaided 130 150 165 163 158
Inter-
mediate/Senior
Secondary
Schools
State Govt. 20 20 20 20 20
Central Govt. 7 7 7 7 7
Local Bodies - - - - -
EGS/New School
(Managed by SSA) - - - - -
Aided 27 25 24 24 25
Private Unaided 29 42 45 60 63
Source (Tables 2.1-2.2): Directorate of Economics and Statistics, Govt. of Mizoram
(Statistical Abstract of Mizoram, 2013).
http://desmizo.nic.in/file/Abstract2013.pdf (Accessed on 05.10.2016)
Education State at a Glance: Mizoram, Vol. 1(7), 2016
ENVIS Centre on Himalayan Ecology 13
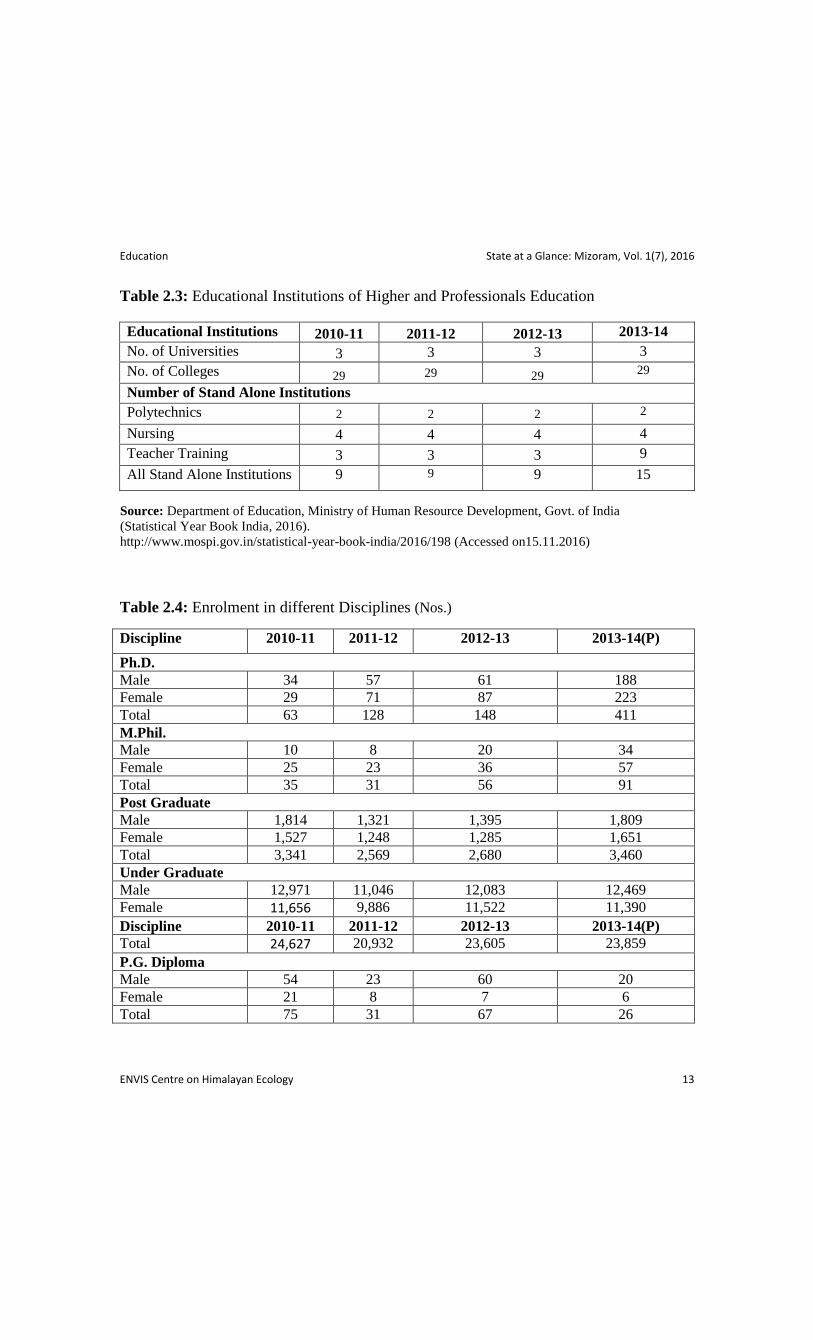
Table 2.3: Educational Institutions of Higher and Professionals Education
Educational Institutions 2010-11 2011-12 2012-13 2013-14
No. of Universities 3 3 3 3
No. of Colleges 29 29 29 29
Number of Stand Alone Institutions
Polytechnics 2 2 2 2
Nursing 4 4 4 4
Teacher Training 3 3 3 9
All Stand Alone Institutions 9 9 9 15
Source: Department of Education, Ministry of Human Resource Development, Govt. of India
(Statistical Year Book India, 2016).
http://www.mospi.gov.in/statistical-year-book-india/2016/198 (Accessed on15.11.2016)
Table 2.4: Enrolment in different Disciplines (Nos.)
Discipline 2010-11 2011-12 2012-13 2013-14(P)
Ph.D.
Male 34 57 61 188
Female 29 71 87 223
Total 63 128 148 411
M.Phil.
Male 10 8 20 34
Female 25 23 36 57
Total 35 31 56 91
Post Graduate
Male 1,814 1,321 1,395 1,809
Female 1,527 1,248 1,285 1,651
Total 3,341 2,569 2,680 3,460
Under Graduate
Male 12,971 11,046 12,083 12,469
Female 11,656 9,886 11,522 11,390
Discipline 2010-11 2011-12 2012-13 2013-14(P)
Total 24,627 20,932 23,605 23,859
P.G. Diploma
Male 54 23 60 20
Female 21 8 7 6
Total 75 31 67 26

Education State at a Glance: Mizoram, Vol. 1(7), 2016
ENVIS Centre on Himalayan Ecology 14
Diploma
Male 593 629 604 421
Female 1,112 1,073 1,117 938
Total 1,705 1,702 1,721 1,359
Certificate
Male 0 2 5 3
Female 0 6 20 18
Total 0 8 25 21
Integrated
Male 0 0 0 0
Female 0 0 0 0
Total 0 0 0 0
Grand Total
Male 1,5476 13,086 14,203 14,944
Female 14,370 12,315 14,074 14,283
Total 29,846 25,401 28,277 29,227
Enrolment in Stand Alone Institutions
Polytechnics 499 465 454 421
Nursing 398 373 386 398
Teacher Training 401 446 484 564
All Stand Alone
Institutions
1,298 1,284 938 1,383
Enrollment in School Education Institutions
Intermediate/Senior
Secondary Schools
18,437 20,250 20,240 21,484
High/Secondary
Schools
31,473 36,168 39,485 40,558
Upper Primary
Schools
65,006 64,223 78,644 68,562
Primary Schools 1,50,601 144671 1,76,069 1,49,401
Total of All
Schools
2,65,517
2,65,312
3,14,438
2,80,005
P: Provisional
Source: Department of Higher Education, Ministry of Human Resource Development, Govt. of India
(Statistical Year Book India, 2016).
http://www.mospi.gov.in/statistical-year-book-india/2016/198 (Accessed on 15.11.2016)

Education State at a Glance: Mizoram, Vol. 1(7), 2016
ENVIS Centre on Himalayan Ecology 15
Table 2.5: Student Teacher Ratio in different Categories of Educational
Institutions / Schools
Year 2008-09 2009-10 2010-11 2011-12 2012-13
Primary Schools Teachers 8,716 8,477 8,310 8,488 8,703
Pupils 1,51,899 1,56,396 1,66,152 1,64,272 1,61,581
Ratio 1.17 1.18 1.20 1.19 1.19
Upper/Middle
Schools
Teachers 7,754 7,564 7,824 9,712 9,883
Pupils 64,887 66,776 69,318 87,726 89,755
Ratio 1.08 1.09 1.09 1.09 1.09
High Schools Teachers 3,886 3,853 3,870 4,212 4,414
Pupils 44,576 48,811 50,252 48,741 38,870
Ratio 1.11 1.13 1.13 1.12 1.09
Higher Secondary
Schools
Teachers 1,058 1224 1224 1367 1468
Pupils 14,649 17,049 18,437 20,250 21,472
Ratio 1.13 1.14 1.15 1.15 1.15
Source: Directorate of Economics and Statistics, Govt. of Mizoram
(Statistical Abstract of Mizoram, 2013).
http://desmizo.nic.in/file/Abstract2013.pdf (Accessed on 05.10.2016)

Education State at a Glance: Mizoram, Vol. 1(7), 2016
ENVIS Centre on Himalayan Ecology 16
Table 2.6: Number of Teachers in Educational Institutions (by stages of Institutions)
Year 2010-11 2011-12 2012-13
Primary/Junior Basic Schools
Total 8,310 8,488 8,703
Men 3,953 4,050 NA
Women 4,357 4,438 NA
%age of Trained Teacher 42 42 NA
Middle/Senior Basic Schools
Total 7,824 9,638 NA
Men 5,217 6,005 NA
Women 2,607 3,633 NA
%age of Trained Teacher 51 43 NA
High/Secondary Schools
Total 3,870 4,212 4,330
Men 2,732 2,785 2,816
Women 1,138 1,427 1,514
%age of Trained Teacher 43 42 NA
Higher Secondary Schools (**)
Total 1,224 1,367 1,379
Men 702 794 774
Women 522 573 605
% age of Trained Teacher 34 38 NA
Total No. of Teachers in all Schools
Total 21,228 23,705 NA
Men 12,604 13,634 NA
Women 8,624 10,071 NA
(**) Includes Higher Secondary Schools (10+2 pattern), Intermediate/Pre-Degree/Junior Colleges
(Old pattern).
Source: Department of Education, Ministry of Human Resource Development, Govt. of India
(Statistical Year Book India, 2016).
http://www.mospi.gov.in/statistical-year-book-india/2016/198 (Accessed on 15.11.2016)
Education State at a Glance: Mizoram, Vol. 1(7), 2016
ENVIS Centre on Himalayan Ecology 17
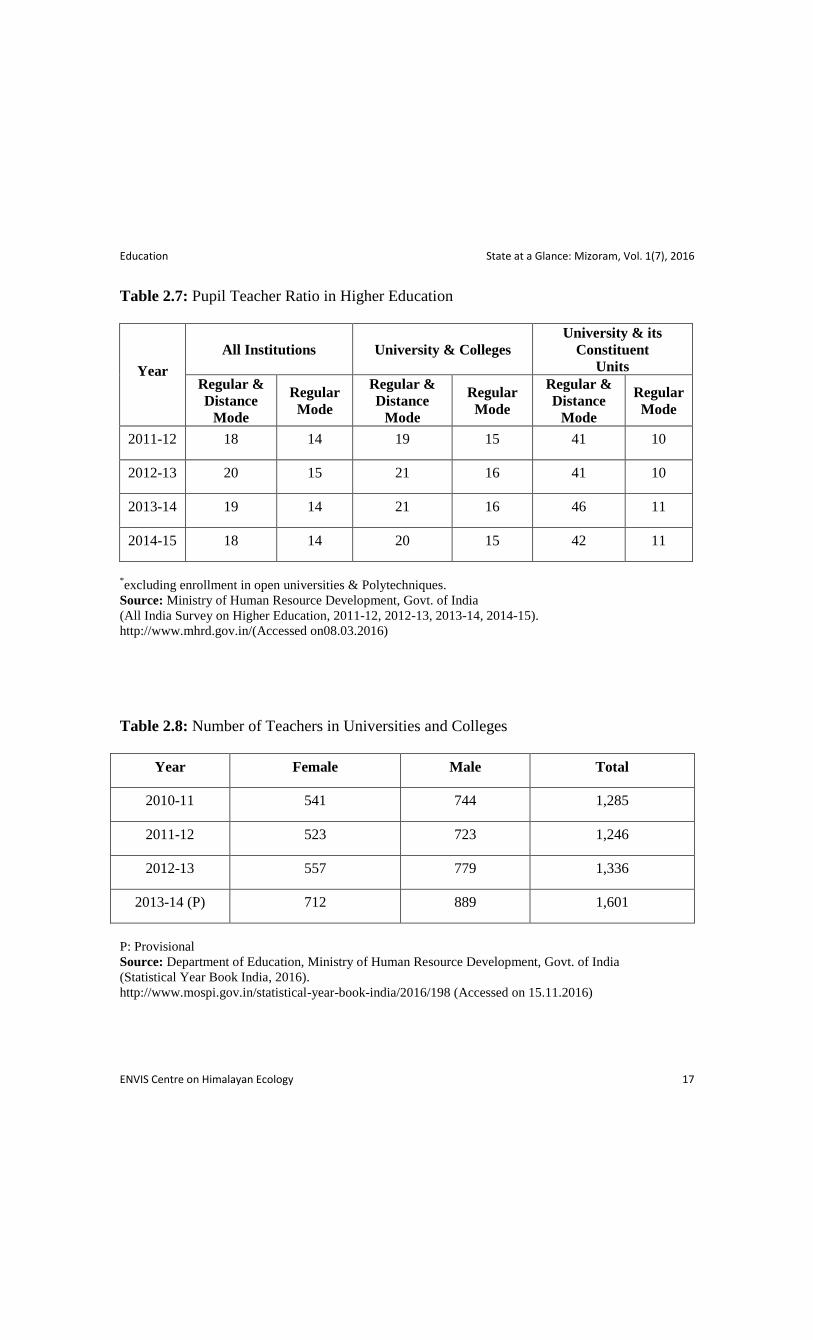
Table 2.7: Pupil Teacher Ratio in Higher Education
Year
All Institutions University & Colleges
University & its
Constituent
Units
Regular &
Distance
Mode
Regular
Mode
Regular &
Distance
Mode
Regular
Mode
Regular &
Distance
Mode
Regular
Mode
2011-12 18 14 19 15 41 10
2012-13 20 15 21 16 41 10
2013-14 19 14 21 16 46 11
2014-15 18 14 20 15 42 11
*excluding enrollment in open universities & Polytechniques.
Source: Ministry of Human Resource Development, Govt. of India
(All India Survey on Higher Education, 2011-12, 2012-13, 2013-14, 2014-15).
http://www.mhrd.gov.in/(Accessed on08.03.2016)
Table 2.8: Number of Teachers in Universities and Colleges
Year Female Male Total
2010-11 541 744 1,285
2011-12 523 723 1,246
2012-13 557 779 1,336
2013-14 (P) 712 889 1,601
P: Provisional
Source: Department of Education, Ministry of Human Resource Development, Govt. of India
(Statistical Year Book India, 2016).
http://www.mospi.gov.in/statistical-year-book-india/2016/198 (Accessed on 15.11.2016)

Education State at a Glance: Mizoram, Vol. 1(7), 2016
ENVIS Centre on Himalayan Ecology 18
Table 2.9: Gross Enrolment Ratio (GER) in All Categories
Year
Classes I-V
(6-10 Years)
Classes VI-VIII
(11-13 Years)
Classes IX-X
(14-15 Years)
Classes XI-XII
(16-17 Years)
Boys Girls Total Boys Girls Total Boys Girls Total Boys Girls Total
2010-11 191.7 180.0 186.0 108.2 101.3 104.8 75.4 78.3 76.8 41.2 40.2 40.7
2011-12 124.9 117.6 121.3 95.3 90.5 92.9 78.6 82.5 80.5 45.5 46.7 46.1
Source: Ministry of Human Resource Development, Govt. of India
(Various issues of Statistics of School Education, 2007-08, 2008-09, 2009-10, 2010-11).
http://mhrd.gov.in/statist?field_statistics_category_tid=32 (Accessed on 08.11.2016)
Table 2.10: Gender Parity Index (GPI) in different Classes
Year Classes
I-V
Classes
VI-VIII
Classes
IX-X
Classes
XI-XII
2010-11 0.94 0.94 1.04 0.98
2011-12 0.94 0.95 1.05 1.03
Table 2.11: Gender Parity Index (GPI) in Scheduled Castes & Scheduled Tribes
Year Scheduled Caste (SC) Scheduled Tribe (ST)
Classes
I-V
Classes
VI-VIII
Classes
IX-X
Classes
XI-XII
Classes
I-V
Classes
VI-VIII
Classes
IX-X
Classes
XI-XII
2010-11 1.05 1.06 0.92 0.94 0.93 1.05 1.04 0.96
2011-12 1.03 1.07 0.92 0.97 1.05 1.09 1.06 0.99
Source (Tables 2.10-2.11): Ministry of Human Resource Development, Govt. of India
(Statistics of School Education, 2007-08, 2008-09, 2009-10, 2010-11).
http://mhrd.gov.in/statist?field_statistics_category_tid=32 (Accessed on 08.10.2016)

Education State at a Glance: Mizoram, Vol. 1(7), 2016
ENVIS Centre on Himalayan Ecology 19
Table 2.12: Literacy Rate
Year Literacy Rate (%)
Male Female Total
1991 85.61 78.60 82.27
2001 90.70 86.70 88.80
2011 93.72 89.40 91.58
Source: Census of India 2011, Govt. of India.
http://censusindia.gov.in/ (Accessed on 10.10.2016)
Table 2.13: Universities and University level Institutions
Year Central
University
State
University
Private
University
Deemed
University
Institutions at
National
Importance
Total
2011-12 1 - 1 - 1 3
2012-13 1 - 1 - 1 3
2013-14 1 - 1 - 1 3
2014-15 1 - 1 - 1 3
Table 2.14: Specialization-wise Colleges (2014-15) (in Nos.)
General Education/Teacher
Education
Engineering &
Technology
Law Nursing Para
Medical
Veterinary Total
23 1 1 1 1 1 1 29
Source (Tables 2.13-2.14): Ministry of Human Resource Development, Govt. of India
(All India Survey on Higher Education, 2014-15).
http://aishe.nic.in/aishe/home; http://uk.gov.in/pages/display/1174-deemed-universities (Accessed on 10.10.2016)
Table 2.15: Details of Universities
Source: University Grants Commission, New Delhi-110 002, Govt. of India
http://www.ugc.ac.in/ (Accessed on 21.10.2016)
Categories Number Name URL
Central University 1 Mizoram University, Mizoram http://www.mzu.edu.in/
Private University 1 The Institute of Chartered
Financial Analysts of India
University
http://www.iumizoram.edu.in/

Health & Family Welfare State at a Glance: Mizoram, Vol. 1(7), 2016
ENVIS Centre on Himalayan Ecology 21
Health & Family Welfare
List of Tables
3.1: Hospitals and Bed Positions in Government Hospitals
3.2: Doctors and Surgeons in Government Hospitals
3.3: Hospitals and Bed Strength under Ayush Systems
3.4: Dispensaries under Ayush Systems
3.5: Details of Health Infrastructure
3.6: District-wise Health Infrastructure
3.7: Number of Hospitals and Doctors
3.8: Para Medical Staff at different Hospitals
3.9: Shortfall in Health Infrastructure
3.10: Building Position of Health Centre’s
3.11: Medical Staffs in Primary Health Centers (PHCs) & Community Health Centre’s
(CHCs)
3.12: Facilities available at Sub Centre’s
3.13: Facilities Available at Primary Health Centre’s
3.14: Facilities available at Community Health Centre’s
3.15: Licensed Blood Banks
3.16: Estimated Crude Birth Rates (CBR), Crude Death Rates (CDR) and Infant
Mortality Rates (IMR) by Residence

Health & Family Welfare State at a Glance: Mizoram, Vol. 1(7), 2016
ENVIS Centre on Himalayan Ecology 22
Table 3.1: Hospitals and Bed Positions in Government Hospitals (in Nos.)
Year Hospitals Beds
2012 27 1430
2013 22 1064
2014 36 1630
Table 3.2: Doctors and Surgeons in Government Hospitals (as on 1st
January) (in Nos.)
Year Allopathic Doctors Dental Surgeons
2012 439 32
2013 211 27
2014 327 60
2015 315 75
Source (Tables 3.1.-3.2): Directorate General of State Health Services, Govt. of India
(Statistical Year Book, India 2016).
http://www.mospi.gov.in/statistical-year-book-india/2016/199 (Accessed on 21.11.2016)
Table 3.3: Hospitals and Bed Strength under Ayush Systems (as on 1st April)
(in Nos.)
Year Homeopathy
Hospitals Beds
2012 8 80
2013 8 80
2014 8 80
Health & Family Welfare State at a Glance: Mizoram, Vol. 1(7), 2016
ENVIS Centre on Himalayan Ecology 23
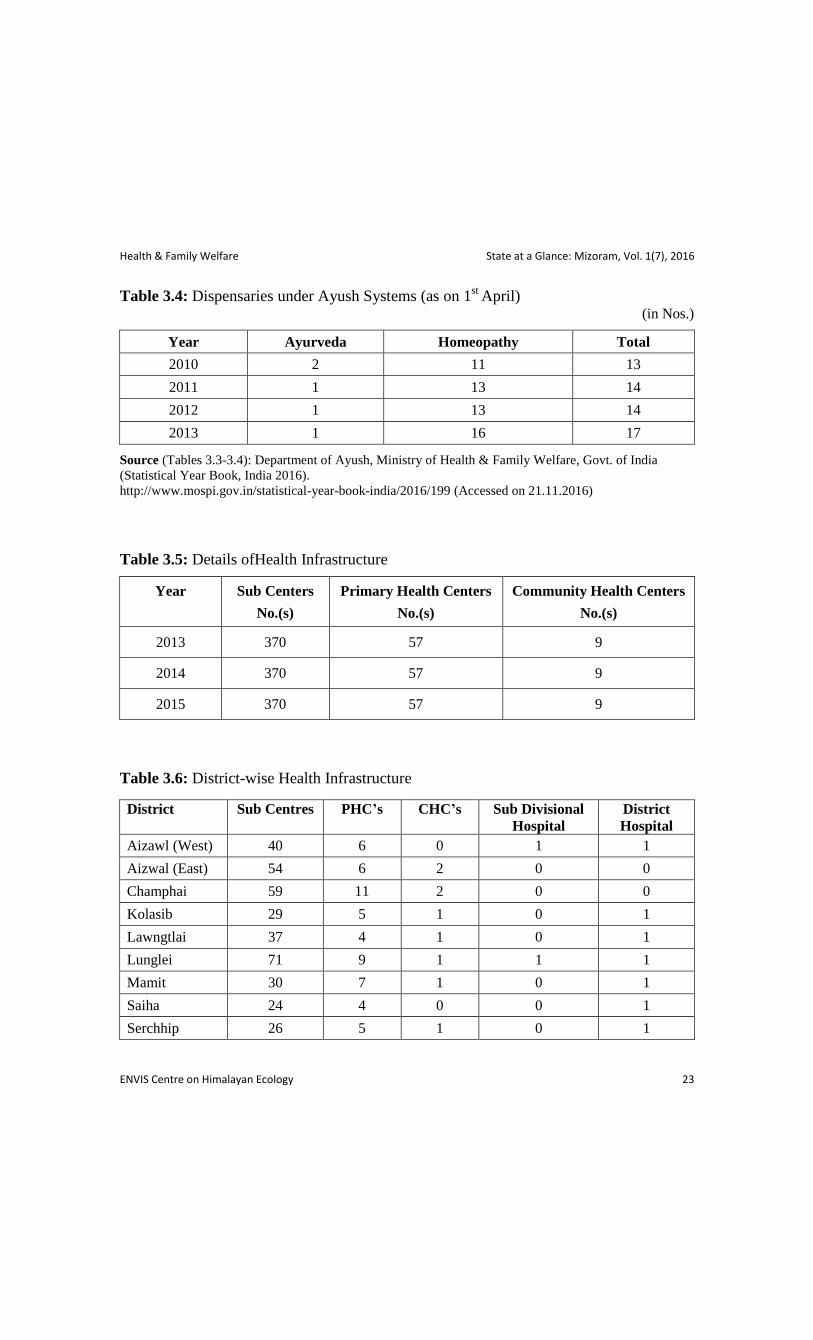
Table 3.4: Dispensaries under Ayush Systems (as on 1st
April) (in Nos.)
Year Ayurveda Homeopathy Total
2010 2 11 13
2011 1 13 14
2012 1 13 14
2013 1 16 17
Source (Tables 3.3-3.4): Department of Ayush, Ministry of Health & Family Welfare, Govt. of India
(Statistical Year Book, India 2016).
http://www.mospi.gov.in/statistical-year-book-india/2016/199 (Accessed on 21.11.2016)
Table 3.5: Details ofHealth Infrastructure
Year Sub Centers
No.(s)
Primary Health Centers
No.(s)
Community Health Centers
No.(s)
2013 370 57 9
2014 370 57 9
2015 370 57 9
Table 3.6: District-wise Health Infrastructure
District Sub Centres PHC’s CHC’s Sub Divisional
Hospital
District
Hospital
Aizawl (West) 40 6 0 1 1
Aizwal (East) 54 6 2 0 0
Champhai 59 11 2 0 0
Kolasib 29 5 1 0 1
Lawngtlai 37 4 1 0 1
Lunglei 71 9 1 1 1
Mamit 30 7 1 0 1
Saiha 24 4 0 0 1
Serchhip 26 5 1 0 1
Health & Family Welfare State at a Glance: Mizoram, Vol. 1(7), 2016
ENVIS Centre on Himalayan Ecology 24
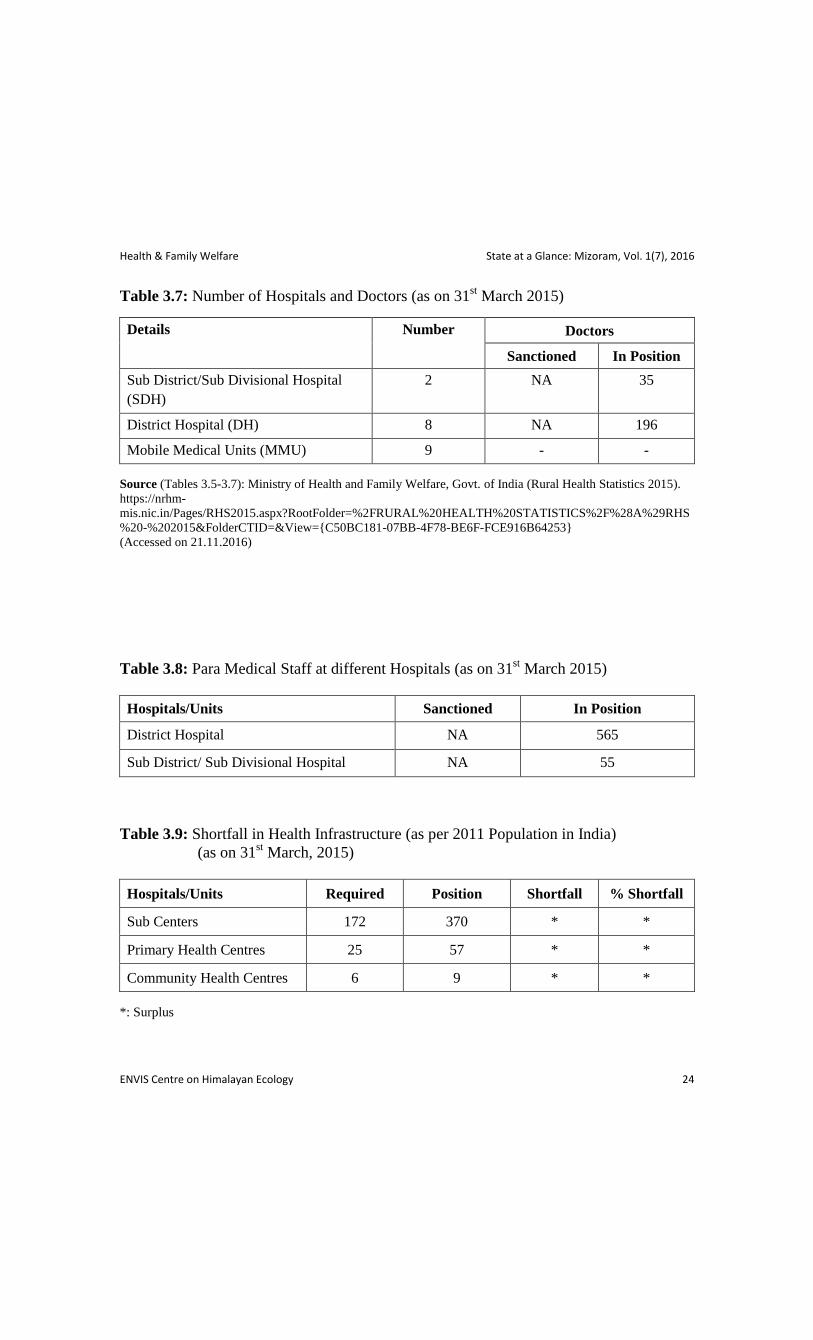
Table 3.7: Number of Hospitals and Doctors (as on 31st March 2015)
Details Number Doctors
Sanctioned In Position
Sub District/Sub Divisional Hospital
(SDH)
2 NA 35
District Hospital (DH) 8 NA 196
Mobile Medical Units (MMU) 9 - -
Source (Tables 3.5-3.7): Ministry of Health and Family Welfare, Govt. of India (Rural Health Statistics 2015).
https://nrhm-
mis.nic.in/Pages/RHS2015.aspx?RootFolder=%2FRURAL%20HEALTH%20STATISTICS%2F%28A%29RHS
%20-%202015&FolderCTID=&View={C50BC181-07BB-4F78-BE6F-FCE916B64253}
(Accessed on 21.11.2016)
Table 3.8: Para Medical Staff at different Hospitals (as on 31st March 2015)
Hospitals/Units Sanctioned In Position
District Hospital NA 565
Sub District/ Sub Divisional Hospital NA 55
Table 3.9: Shortfall in Health Infrastructure (as per 2011 Population in India)
(as on 31st March, 2015)
Hospitals/Units Required Position Shortfall % Shortfall
Sub Centers 172 370 * *
Primary Health Centres 25 57 * *
Community Health Centres 6 9 * *
*: Surplus

Health & Family Welfare State at a Glance: Mizoram, Vol. 1(7), 2016
ENVIS Centre on Himalayan Ecology 25
Table 3.10: Building Position of Health Centre’s (2015) (in Nos.)
Total Sub Centre’s Primary Health
Centres (PHC’s)
Community Health
Centres (CHC’s)
Govt. Buildings 370 57 9
Rented Buildings 0 0 0
Rent Free Panchayat/Vol.
Society Buildings 0 0 0
Buildings Under
Construction 0 0 0
Source (Tables 3.8-3.10): Ministry of Health and Family Welfare, Govt. of India
(Rural Health Statistics, 2015).
https://nrhmmis.nic.in/Pages/RHS2015.aspx?RootFolder=%2FRURAL%20HEALTH%20STATISTICS%2
F(A)RHS%20-%202015&FolderCTID=&View=%7BC50BC181-07BB-4F78-BE6F-
FCE916B64253%7D#
(Accessed on 21.11.2016)
Table 3.11: Medical Staffs in Primary Health Centers (PHCs) & Community Health
Centres (CHCs) (2015) (in Nos.)
Details Doctors at
PHC’s
#
Specialist
at CHC’s
Radiographers
at CHC’s
Pharmacists
at PHC’s &
CHC’s
Lab
Technician
at PHC’s
& CHC’s
Nursing Staff
at PHC’s &
CHC’s
Required 57 36 9 66 66 120
Sanctioned 152 0 NA NA NA NA
In Position 49 0 5 46 61 224
Vacant 103 0 NA NA NA NA
Shortfall 8 36 4 20 5 *
*: Surplus; #: in position data for 2013-14 & Sanctioned data for 2011 used

Health & Family Welfare State at a Glance: Mizoram, Vol. 1(7), 2016
ENVIS Centre on Himalayan Ecology 26
Table 3.12: Facilities available at Sub Centre’s (as on 31st March 2015)
Number of Sub
Centres
Functioning
Without Water
Supply
Without Electricity
Supply
Without All-
Weather Motorable
Approach Road
Number % Number % Number %
370 130 35.1 0 0 50 13.5
Table 3.13: Facilities Available at Primary Health Centre’s(as on 31st March, 2015)
Number of
Primary Health
Centers
Functioning
With Labour
Room
With
Operation
Theatre
With at
Least 4 Beds
With
Telephone
With
Computer
Nos. % Nos. % Nos. % Nos. % Nos. %
57 57 100.0 57 100.0 57 100.0 57 100.0 54 94.7
Source (Tables 3.11-3.13): Ministry of Health and Family Welfare, Govt. of India
(Rural Health Statistics, 2015).
https://nrhmmis.nic.in/Pages/RHS2015.aspx?RootFolder=%2FRURAL%20HEALTH%20STATISTICS%2
F(A)RHS%20-%202015&FolderCTID=&View=%7BC50BC181-07BB-4F78-BE6F-
FCE916B64253%7D#
(Accessed on 21.11.2016)
Health & Family Welfare State at a Glance: Mizoram, Vol. 1(7), 2016
ENVIS Centre on Himalayan Ecology 27
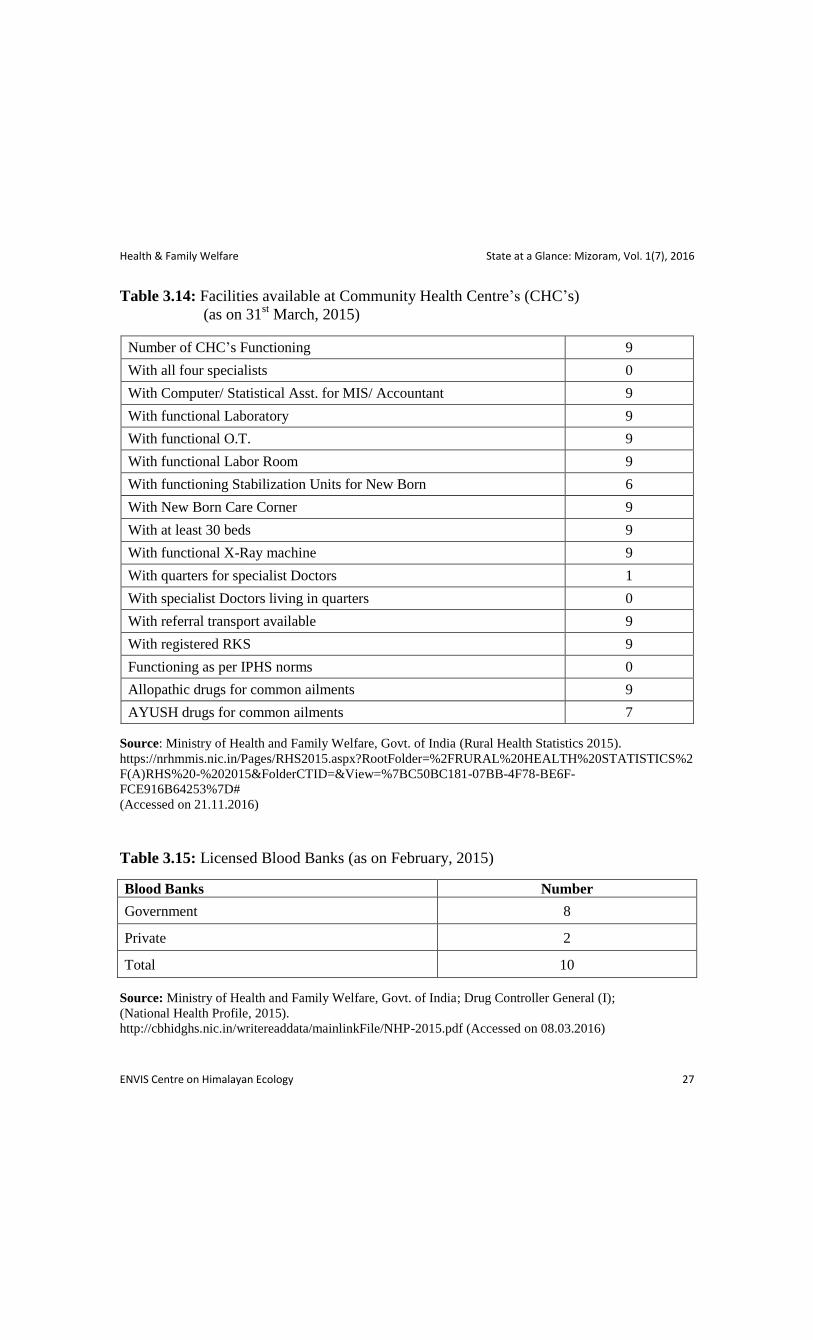
Table 3.14: Facilities available at Community Health Centre’s (CHC’s)
(as on 31st March, 2015)
Number of CHC’s Functioning 9
With all four specialists 0
With Computer/ Statistical Asst. for MIS/ Accountant 9
With functional Laboratory 9
With functional O.T. 9
With functional Labor Room 9
With functioning Stabilization Units for New Born 6
With New Born Care Corner 9
With at least 30 beds 9
With functional X-Ray machine 9
With quarters for specialist Doctors 1
With specialist Doctors living in quarters 0
With referral transport available 9
With registered RKS 9
Functioning as per IPHS norms 0
Allopathic drugs for common ailments 9
AYUSH drugs for common ailments 7
Source: Ministry of Health and Family Welfare, Govt. of India (Rural Health Statistics 2015).
https://nrhmmis.nic.in/Pages/RHS2015.aspx?RootFolder=%2FRURAL%20HEALTH%20STATISTICS%2
F(A)RHS%20-%202015&FolderCTID=&View=%7BC50BC181-07BB-4F78-BE6F-
FCE916B64253%7D#
(Accessed on 21.11.2016)
Table 3.15: Licensed Blood Banks (as on February, 2015)
Blood Banks Number
Government 8
Private 2
Total 10
Source: Ministry of Health and Family Welfare, Govt. of India; Drug Controller General (I);
(National Health Profile, 2015).
http://cbhidghs.nic.in/writereaddata/mainlinkFile/NHP-2015.pdf (Accessed on 08.03.2016)

Health & Family Welfare State at a Glance: Mizoram, Vol. 1(7), 2016
ENVIS Centre on Himalayan Ecology 28
Table 3.16: Estimated Crude Birth Rates (CBR), Crude Death Rates (CDR) and Infant
Mortality Rates (IMR) by Residence
(Per Thousand)
Year 2009 2010 2011 2012 2013
CBR
Total 17.6 17.1 16.6 16.3 16.1
Rural 21.7 21.1 20.6 20.2 20.0
Urban 13.2 13.0 12.6 12.2 12.0
CDR
Total 4.5 4.5 4.4 4.4 4.3
Rural 5.0 5.4 5.4 5.5 5.5
Urban 4.1 3.7 3.4 3.1 3.1
IMR
Total 36 37 34 35 35
Rural 45 47 43 44 44
Urban 19 21 19 19 19
Note: Infant Mortality Rate for smaller States & Union Territories is based on three-year period 2009-13.
Source: Office of the Registrar General of India, Ministry of Home Affairs, Govt. of India
(SRS Bulletin Sept, 2009, 2010, 2011, 2012, 2013, 2014 Vol. 48 No-2 & SRS Bulletin Sept, 2014, Vol.49
No-1).
http://censusindia.gov.in/vital_statistics/SRS_Bulletins/Bulletins.aspx
(Accessed on 04.11.2016)

Climate State at a Glance: Mizoram, Vol. 1(7), 2016
ENVIS Centre on Himalayan Ecology 29
Climate
List of Tables
4.1: District-wise Rainfall
4.2: District-wise Average Monthly Rainfall
4.3: Month-wise Average Rainfall
4.4: Month-wise Relative Humidity
4.5: Month-wise Minimum and Maximum Average Temperature
Climate State at a Glance: Mizoram, Vol. 1(7), 2016
ENVIS Centre on Himalayan Ecology 30
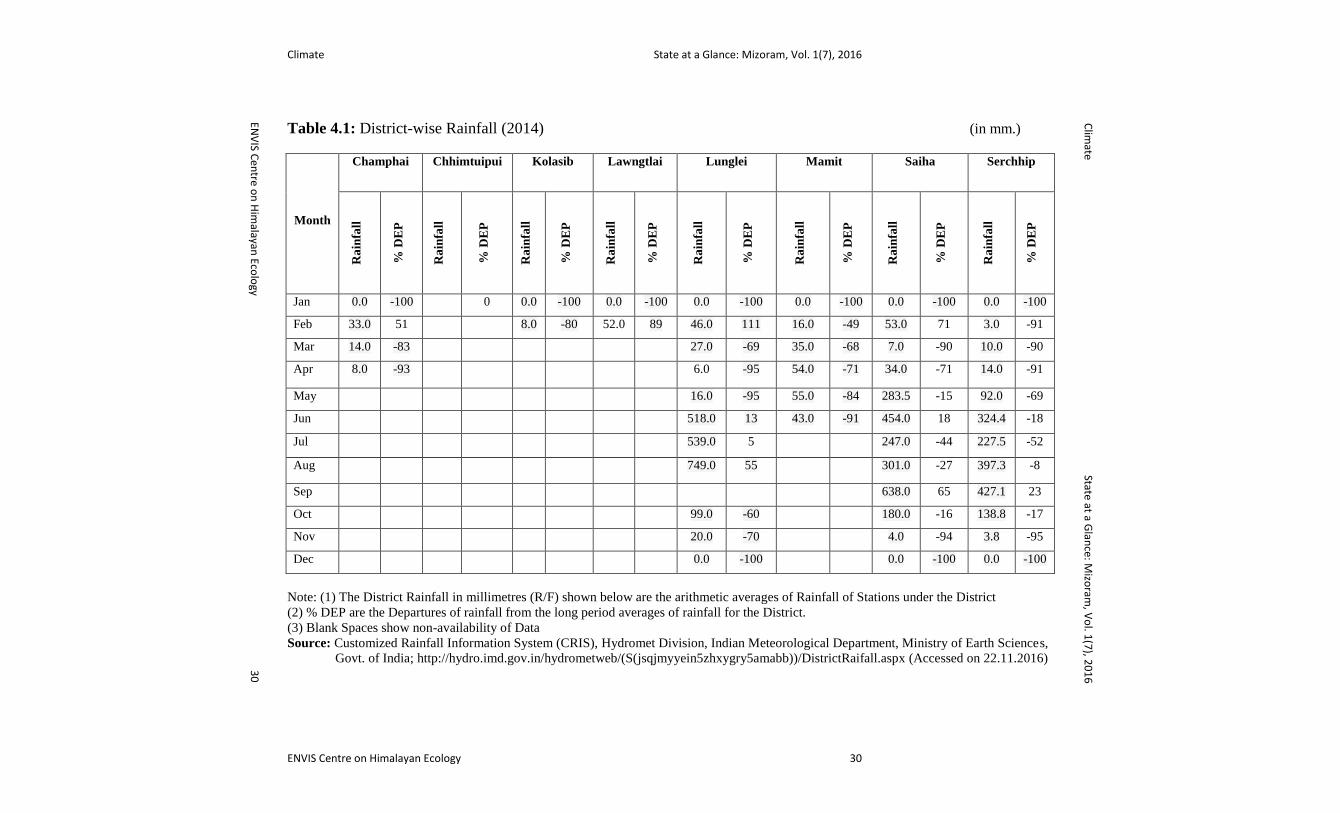
Table 4.1: District-wise Rainfall (2014) (in mm.)
Month
Champhai Chhimtuipui Kolasib Lawngtlai Lunglei Mamit Saiha Serchhip
Ra
infa
ll
% D
EP
Ra
infa
ll
% D
EP
Ra
infa
ll
% D
EP
Ra
infa
ll
% D
EP
Ra
infa
ll
% D
EP
Ra
infa
ll
% D
EP
Ra
infa
ll
% D
EP
Ra
infa
ll
% D
EP
Jan 0.0 -100 0 0.0 -100 0.0 -100 0.0 -100 0.0 -100 0.0 -100 0.0 -100
Feb 33.0 51 8.0 -80 52.0 89 46.0 111 16.0 -49 53.0 71 3.0 -91
Mar 14.0 -83 27.0 -69 35.0 -68 7.0 -90 10.0 -90
Apr 8.0 -93 6.0 -95 54.0 -71 34.0 -71 14.0 -91
May 16.0 -95 55.0 -84 283.5 -15 92.0 -69
Jun 518.0 13 43.0 -91 454.0 18 324.4 -18
Jul 539.0 5 247.0 -44 227.5 -52
Aug 749.0 55 301.0 -27 397.3 -8
Sep 638.0 65 427.1 23
Oct 99.0 -60 180.0 -16 138.8 -17
Nov 20.0 -70 4.0 -94 3.8 -95
Dec 0.0 -100 0.0 -100 0.0 -100
Note: (1) The District Rainfall in millimetres (R/F) shown below are the arithmetic averages of Rainfall of Stations under the District
(2) % DEP are the Departures of rainfall from the long period averages of rainfall for the District.
(3) Blank Spaces show non-availability of Data
Source: Customized Rainfall Information System (CRIS), Hydromet Division, Indian Meteorological Department, Ministry of Earth Sciences,
Govt. of India; http://hydro.imd.gov.in/hydrometweb/(S(jsqjmyyein5zhxygry5amabb))/DistrictRaifall.aspx (Accessed on 22.11.2016)
Clim
ate State at a G
lance: M
izoram
, Vo
l. 1(7
), 20
16
ENV
IS Cen
tre on
Him
alayan Eco
logy
30
Climate State at a Glance: Mizoram, Vol. 1(7), 2016
ENVIS Centre on Himalayan Ecology 31
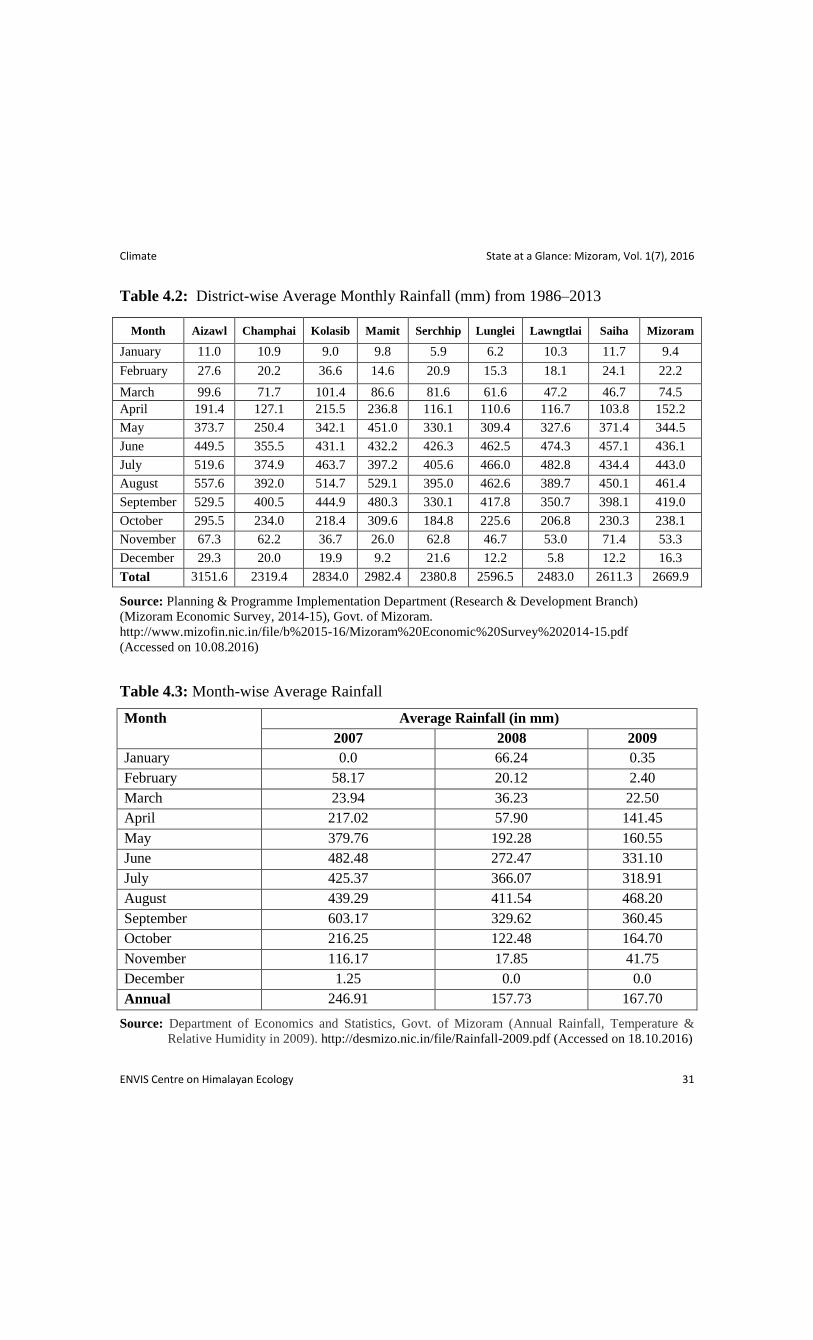
Table 4.2: District-wise Average Monthly Rainfall (mm) from 1986–2013
Month Aizawl Champhai Kolasib Mamit Serchhip Lunglei Lawngtlai Saiha Mizoram
January 11.0 10.9 9.0 9.8 5.9 6.2 10.3 11.7 9.4
February 27.6 20.2 36.6 14.6 20.9 15.3 18.1 24.1 22.2
March 99.6 71.7 101.4 86.6 81.6 61.6 47.2 46.7 74.5
April 191.4 127.1 215.5 236.8 116.1 110.6 116.7 103.8 152.2
May 373.7 250.4 342.1 451.0 330.1 309.4 327.6 371.4 344.5
June 449.5 355.5 431.1 432.2 426.3 462.5 474.3 457.1 436.1
July 519.6 374.9 463.7 397.2 405.6 466.0 482.8 434.4 443.0
August 557.6 392.0 514.7 529.1 395.0 462.6 389.7 450.1 461.4
September 529.5 400.5 444.9 480.3 330.1 417.8 350.7 398.1 419.0
October 295.5 234.0 218.4 309.6 184.8 225.6 206.8 230.3 238.1
November 67.3 62.2 36.7 26.0 62.8 46.7 53.0 71.4 53.3
December 29.3 20.0 19.9 9.2 21.6 12.2 5.8 12.2 16.3
Total 3151.6 2319.4 2834.0 2982.4 2380.8 2596.5 2483.0 2611.3 2669.9
Source: Planning & Programme Implementation Department (Research & Development Branch)
(Mizoram Economic Survey, 2014-15), Govt. of Mizoram.
http://www.mizofin.nic.in/file/b%2015-16/Mizoram%20Economic%20Survey%202014-15.pdf
(Accessed on 10.08.2016)
Table 4.3: Month-wise Average Rainfall
Month Average Rainfall (in mm)
2007 2008 2009
January 0.0 66.24 0.35
February 58.17 20.12 2.40
March 23.94 36.23 22.50
April 217.02 57.90 141.45
May 379.76 192.28 160.55
June 482.48 272.47 331.10
July 425.37 366.07 318.91
August 439.29 411.54 468.20
September 603.17 329.62 360.45
October 216.25 122.48 164.70
November 116.17 17.85 41.75
December 1.25 0.0 0.0
Annual 246.91 157.73 167.70
Source: Department of Economics and Statistics, Govt. of Mizoram (Annual Rainfall, Temperature &
Relative Humidity in 2009). http://desmizo.nic.in/file/Rainfall-2009.pdf (Accessed on 18.10.2016)

Climate State at a Glance: Mizoram, Vol. 1(7), 2016
ENVIS Centre on Himalayan Ecology 32
Table 4.4: Month-wise Relative Humidity in Aizawl
Month
Relative Humidity (%)
Maximum Minimum
2007 2008 2009 2007 2008 2009
January 87 95 82 54 38 52
February 88 94 70 49 51 34
March 91 93 84 32 48 20
April 96 85 96 50 47 44
May 96 98 98 51 62 64
June 98 100 97 81 68 75
July 100 100 97 84 87 74
August 100 100 100 81 80 78
September 100 100 98 61 70 70
October 100 100 96 59 64 64
November 100 98 100 76 58 55
December 85 88 86 50 58 57
Average 95 96 92 61 61 57
Table 4.5: Month-wise Minimum and Maximum Average Temperature (ºC) in Aizawl
Month Maximum Minimum
2007 2008 2009 2007 2008 2009
January 11.18 11.75 13.33 23.45 22.25 24.42
February 11.84 11.79 15.56 23.13 22.87 26.99
March 16.06 16.89 18.80 26.87 27.60 28.85
April 17.39 18.72 19.57 27.57 30.47 29.67
May 19.62 19.37 19.77 28.19 28.46 28.77
June 20.65 19.85 20.49 27.31 27.03 27.39
July 20.46 19.28 21.02 26.13 26.48 27.90
August 20.65 19.75 20.83 26.97 26.29 27.02
September 20.59 20.06 20.79 27.17 27.76 28.24
October 19.90 18.75 19.87 27.65 26.71 28.33
November 16.29 14.98 17.18 25.34 26.42 26.54
December 12.78 13.76 13.15 23.99 23.65 24.08
Source (Tables 4.4–4.5): Department of Economics and Statistics, Govt. of Mizoram
(Annual Rainfall, Temperature & Relative Humidity in 2009).
http://desmizo.nic.in/file/Rainfall-2009.pdf (Accessed on 18.10.2016)

Land State at a Glance: Mizoram, Vol. 1(7), 2016
ENVIS Centre on Himalayan Ecology 33
Land
List of Tables
5.1: Land Use Classification
5.2: Gross Irrigated Area by Sources
5.3: Wasteland Area in the State
5.4: District-wise and Category-wise Distribution of Wastelands

Land State at a Glance: Mizoram, Vol. 1(7), 2016
ENVIS Centre on Himalayan Ecology 34
Table 5.1: Land Use Classification (Part-A)
(Area is in thousand hectares)
Year Geographical
Area
Reported
area for
land
utilization
statistics
Forests
Not available for Cultivation Other uncultivated land excluding
Area under
non-
agricultural
uses
Barren &
uncultivable
land
Total
Permanent
pastures &
other
grazing
lands
Land
under misc.
tree crops
& groves
(not incl. in
net area
sown)
Cultiva-
ble
waste
land
Total
2003-04 2108 2085 1594 125 9 134 6 15 6 27
2004-05 2108 2076 1594 126 9 135 5 10 5 20
2005-06 2108 1952 1594 125 9 134 5 10 5 20
2006-07 2108 2106 1594 125 9 134 5 69 5 79
2007-08 2108 2112 1594 125 9 134 5 67 5 77
2008-09 2108 2080 1594 124 9 133 5 17 5 27
2009-10 2108 2101 1585 87 8 95 5 39 7 51
2010-11 2108 2099 1585 87 8 95 5 37 7 49
2011-12 2108 2075 1585 87 8 95 5 41 7 53
2012-13 2108 2094 1585 87 8 95 5 41 7 53
Source: Directorate of Agriculture, Directorate of Economics & Statistics, Govt. of India (Statistical Year Book India, 2016).
http://mospi.nic.in/Mospi_New/upload/SYB2016/index.html (Accessed on 10.06.2016)
Land
State at a Glan
ce: Mizo
ram, V
ol. 1
(7), 2
01
6
ENV
IS Cen
tre on
Him
alayan Eco
logy
34
Land State at a Glance: Mizoram, Vol. 1(7), 2016
ENVIS Centre on Himalayan Ecology 35
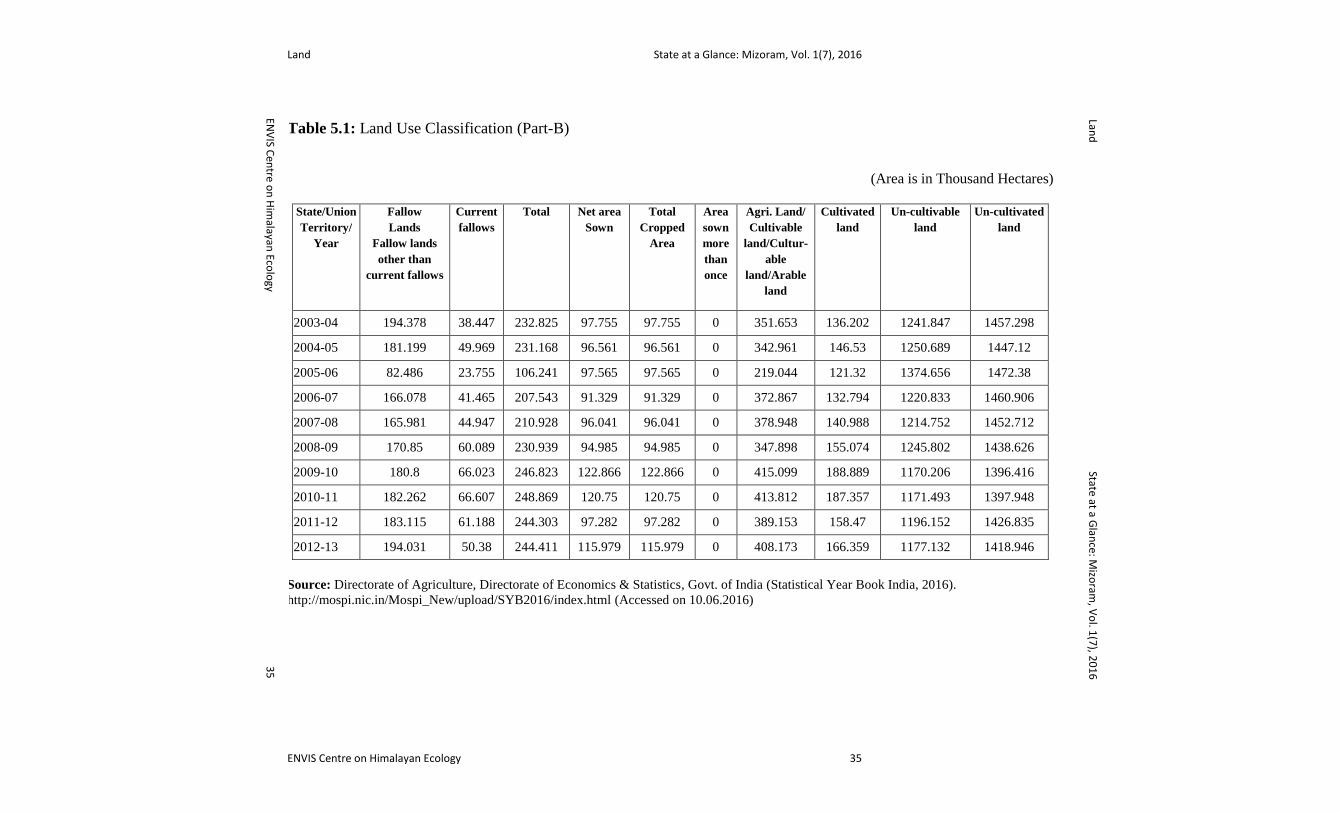
Table 5.1: Land Use Classification (Part-B)
(Area is in Thousand Hectares)
State/Union
Territory/
Year
Fallow
Lands
Fallow lands
other than
current fallows
Current
fallows
Total
Net area
Sown
Total
Cropped
Area
Area
sown
more
than
once
Agri. Land/
Cultivable
land/Cultur-
able
land/Arable
land
Cultivated
land
Un-cultivable
land
Un-cultivated
land
2003-04 194.378 38.447 232.825 97.755 97.755 0 351.653 136.202 1241.847 1457.298
2004-05 181.199 49.969 231.168 96.561 96.561 0 342.961 146.53 1250.689 1447.12
2005-06 82.486 23.755 106.241 97.565 97.565 0 219.044 121.32 1374.656 1472.38
2006-07 166.078 41.465 207.543 91.329 91.329 0 372.867 132.794 1220.833 1460.906
2007-08 165.981 44.947 210.928 96.041 96.041 0 378.948 140.988 1214.752 1452.712
2008-09 170.85 60.089 230.939 94.985 94.985 0 347.898 155.074 1245.802 1438.626
2009-10 180.8 66.023 246.823 122.866 122.866 0 415.099 188.889 1170.206 1396.416
2010-11 182.262 66.607 248.869 120.75 120.75 0 413.812 187.357 1171.493 1397.948
2011-12 183.115 61.188 244.303 97.282 97.282 0 389.153 158.47 1196.152 1426.835
2012-13 194.031 50.38 244.411 115.979 115.979 0 408.173 166.359 1177.132 1418.946
Source: Directorate of Agriculture, Directorate of Economics & Statistics, Govt. of India (Statistical Year Book India, 2016).
http://mospi.nic.in/Mospi_New/upload/SYB2016/index.html (Accessed on 10.06.2016)
Land
State at a Glan
ce: Mizo
ram, V
ol. 1
(7), 2
01
6
ENV
IS Cen
tre on
Him
alayan Eco
logy
35
Land State at a Glance: Mizoram, Vol. 1(7), 2016
ENVIS Centre on Himalayan Ecology 36
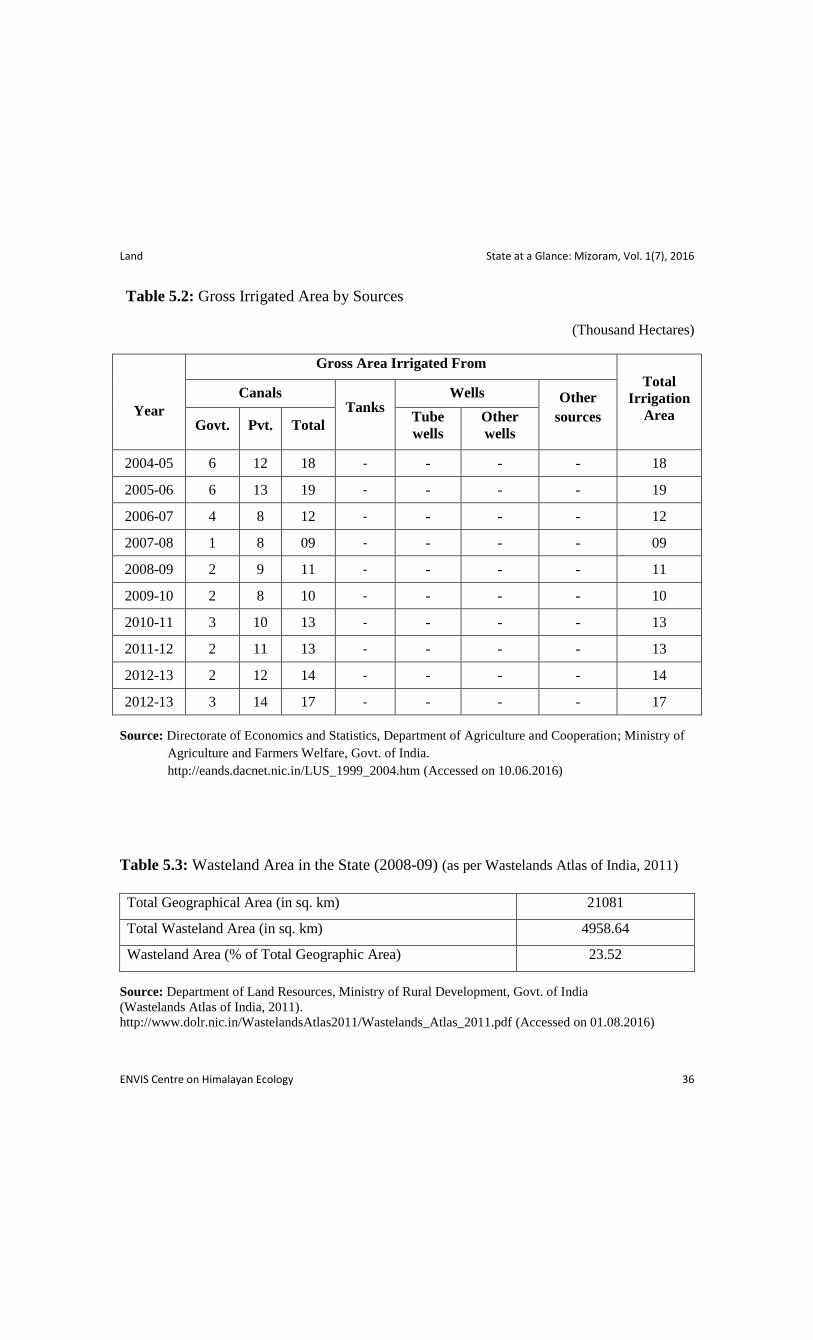
Table 5.2: Gross Irrigated Area by Sources
(Thousand Hectares)
Year
Gross Area Irrigated From
Total
Irrigation
Area
Canals Tanks
Wells Other
sources Govt. Pvt. Total
Tube
wells
Other
wells
2004-05 6 12 18 - - - - 18
2005-06 6 13 19 - - - - 19
2006-07 4 8 12 - - - - 12
2007-08 1 8 09 - - - - 09
2008-09 2 9 11 - - - - 11
2009-10 2 8 10 - - - - 10
2010-11 3 10 13 - - - - 13
2011-12 2 11 13 - - - - 13
2012-13 2 12 14 - - - - 14
2012-13 3 14 17 - - - - 17
Source: Directorate of Economics and Statistics, Department of Agriculture and Cooperation; Ministry of
Agriculture and Farmers Welfare, Govt. of India.
http://eands.dacnet.nic.in/LUS_1999_2004.htm (Accessed on 10.06.2016)
Table 5.3: Wasteland Area in the State (2008-09) (as per Wastelands Atlas of India, 2011)
Total Geographical Area (in sq. km) 21081
Total Wasteland Area (in sq. km) 4958.64
Wasteland Area (% of Total Geographic Area) 23.52
Source: Department of Land Resources, Ministry of Rural Development, Govt. of India
(Wastelands Atlas of India, 2011).
http://www.dolr.nic.in/WastelandsAtlas2011/Wastelands_Atlas_2011.pdf (Accessed on 01.08.2016)
Land State at a Glance: Mizoram, Vol. 1(7), 2016
ENVIS Centre on Himalayan Ecology 37
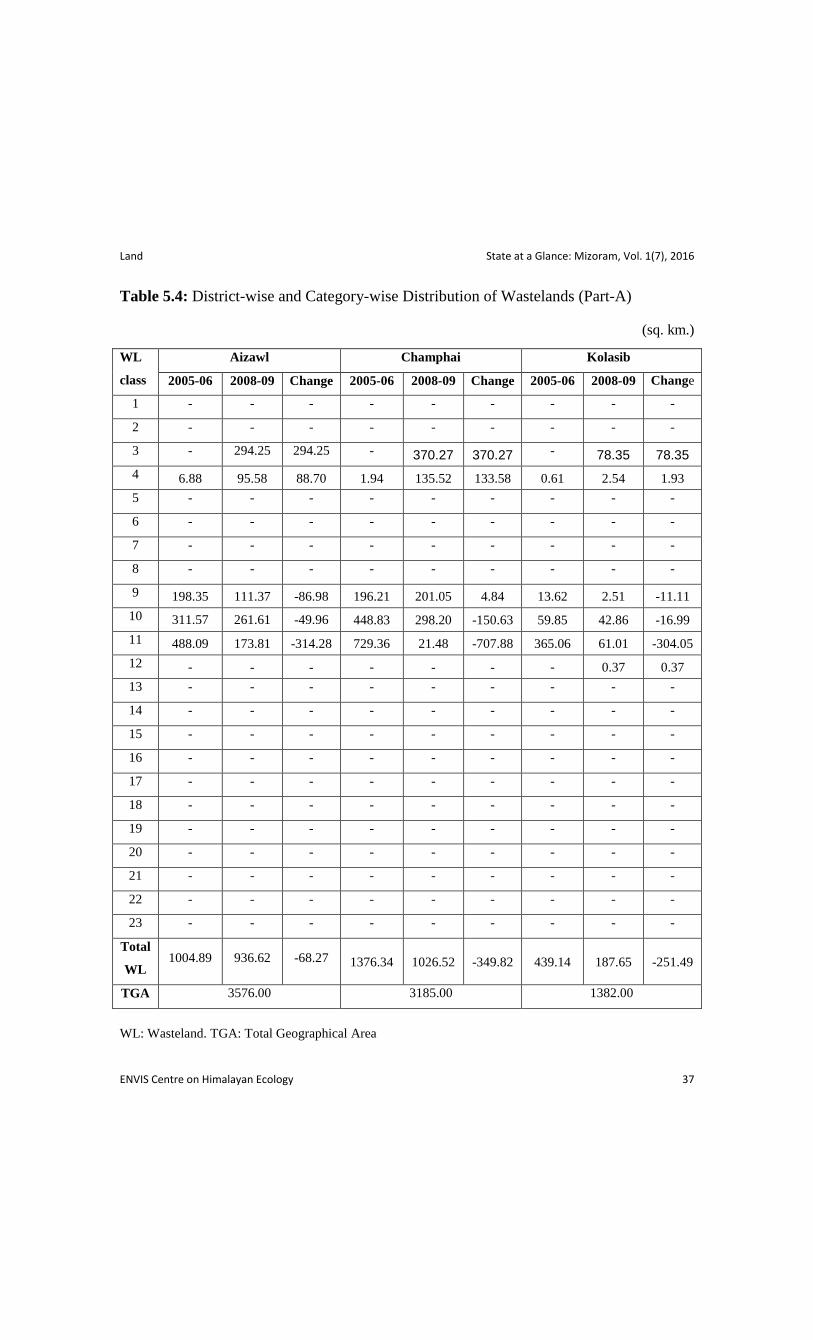
Table 5.4: District-wise and Category-wise Distribution of Wastelands (Part-A)
(sq. km.)
WL
class
Aizawl Champhai Kolasib
2005-06 2008-09 Change 2005-06 2008-09 Change 2005-06 2008-09 Change
1 - - - - - - - - -
2 - - - - - - - - -
3 - 294.25 294.25 - 370.27 370.27 - 78.35 78.35
4 6.88 95.58 88.70 1.94 135.52 133.58 0.61 2.54 1.93
5 - - - - - - - - -
6 - - - - - - - - -
7 - - - - - - - - -
8 - - - - - - - - -
9 198.35 111.37 -86.98 196.21 201.05 4.84 13.62 2.51 -11.11
10 311.57 261.61 -49.96 448.83 298.20 -150.63 59.85 42.86 -16.99
11 488.09 173.81 -314.28 729.36 21.48 -707.88 365.06 61.01 -304.05
12 - - - - - - - 0.37 0.37
13 - - - - - - - - -
14 - - - - - - - - -
15 - - - - - - - - -
16 - - - - - - - - -
17 - - - - - - - - -
18 - - - - - - - - -
19 - - - - - - - - -
20 - - - - - - - - -
21 - - - - - - - - -
22 - - - - - - - - -
23 - - - - - - - - -
Total
WL 1004.89 936.62 -68.27 1376.34 1026.52 -349.82 439.14 187.65 -251.49
TGA 3576.00 3185.00 1382.00
WL: Wasteland. TGA: Total Geographical Area
Land State at a Glance: Mizoram, Vol. 1(7), 2016
ENVIS Centre on Himalayan Ecology 38
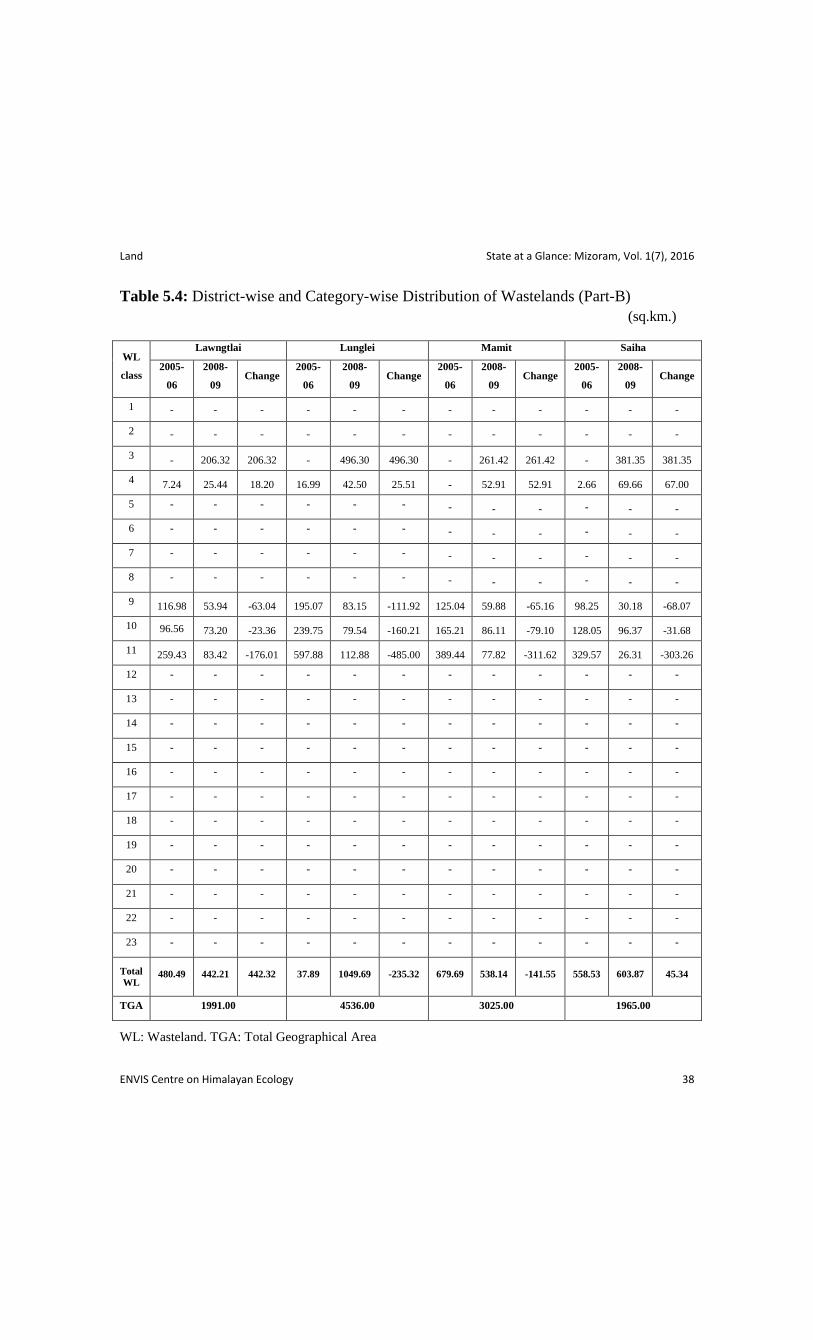
Table 5.4: District-wise and Category-wise Distribution of Wastelands (Part-B)
(sq.km.)
WL
class
Lawngtlai Lunglei Mamit Saiha
2005-
06
2008-
09 Change
2005-
06
2008-
09 Change
2005-
06
2008-
09 Change
2005-
06
2008-
09 Change
1 - - - - - - - - - - - -
2 - - - - - - - - - - - -
3 - 206.32 206.32 - 496.30 496.30 - 261.42 261.42 - 381.35 381.35
4 7.24 25.44 18.20 16.99 42.50 25.51 - 52.91 52.91 2.66 69.66 67.00
5 - - - - - - - - - - - -
6 - - - - - - - - - - - -
7 - - - - - - - - - - - -
8 - - - - - - - - - - - -
9 116.98 53.94 -63.04 195.07 83.15 -111.92 125.04 59.88 -65.16 98.25 30.18 -68.07
10 96.56 73.20 -23.36 239.75 79.54 -160.21 165.21 86.11 -79.10 128.05 96.37 -31.68
11 259.43 83.42 -176.01 597.88 112.88 -485.00 389.44 77.82 -311.62 329.57 26.31 -303.26
12 - - - - - - - - - - - -
13 - - - - - - - - - - - -
14 - - - - - - - - - - - -
15 - - - - - - - - - - - -
16 - - - - - - - - - - - -
17 - - - - - - - - - - - -
18 - - - - - - - - - - - -
19 - - - - - - - - - - - -
20 - - - - - - - - - - - -
21 - - - - - - - - - - - -
22 - - - - - - - - - - - -
23 - - - - - - - - - - - -
Total
WL 480.49 442.21 442.32 37.89 1049.69 -235.32 679.69 538.14 -141.55 558.53 603.87 45.34
TGA 1991.00 4536.00 3025.00 1965.00
WL: Wasteland. TGA: Total Geographical Area

Land State at a Glance: Mizoram, Vol. 1(7), 2016
ENVIS Centre on Himalayan Ecology 39
Table 5.4: District-wise and Category-wise Distribution of Wastelands (Part-C) (sq. km.)
WL
class
Serchhip Total
2005-06 2008-09 Change 2005-06 2008-09 Change
1 - - - - - -
2 - - - - - -
3 - 177.57 177.57 - 2265.82 2265.82
4 - 48.10 48.10 36.32 472.25 435.93
5 - - - - - -
6 - - - - - -
7 - - - - - -
8 - - - - - -
9 85.01 70.62 -14.39 1028.53 612.71 -415.82
10 139.21 111.46 -27.75 1589.03 1049.37 -539.66
11 208.43 1.39 -207.04 3367.26 558.12 -2809.14
12 - - - - 0.37 0.37
13 - - - - - -
14 - - - - - -
15 - - - - - -
16 - - - - - -
17 - - - - - -
18 - - - - - -
19 - - - - - -
20 - - - - - -
21 - - - - - -
22 - - - - - -
23 - - - - - -
Total
WL
432.65 409.15 -23.50 6021.14 4958.64 -1062.50
TGA 1421.00 21081.00
WL: Wasteland; TGA: Total Geographical Area
1. Gullied and/ or ravenous land (Medium), 2. Gullied and/or ravenous land (Deep), 3. Land with Dense Scrub, 4. Land
with Open Scrub, 5. Water logged and Marshy land (Permanent), 6. Waterlogged and Marshy land (Seasonal), 7. Land
affected by salinity/alkalinity (Medium), 8. Land affected by salinity/alkalinity (Strong), 9. Shifting Cultivation -
Current Jhum, 10. Shifting Cultivation - Abandoned Jhum, 11. Under-utilised/degraded forest (Scrub domin), 12.
Under-utilised/degraded forest (Agriculture), 13. Degraded pastures/ grazing land, 14. Degraded land under plantation
crop, 15. Sands-Riverine, 16.Sands-Coastal, 17. Sands-Desertic, 18. Sands-Semi Stab.-Stab>40m, 19. Sands-Semi
Stab.-Stab 15-40m, 20. Mining Wastelands, 21. Industrial Wastelands, 22. Barren Rocky/Stony waste, 23. Snow
covered/Glacial area
Source: Department of Land Resources, Ministry of Rural Development, Govt. of India
(Wastelands Atlas of India, 2011).
http://www.dolr.nic.in/WastelandsAtlas2011/Wastelands_Atlas_2011.pdf (Accessed on 01.06.2016)
Water State at a Glance: Mizoram, Vol. 1(7), 2016
ENVIS Centre on Himalayan Ecology 41
Water
List of Tables
6.1: Distribution of Large Dams Completed
6.2: Live Storage Capacity of Large Dams/Reservoirs/Projects
6.3: Ultimate Irrigation Potential
6.4: Plan-wise Financial Expenditure on Major and Medium Irrigation
6.5: Achievements of Bharat Nirman on Irrigation Potential Creation including Minor
Irrigation
6.6: Year-wise Achievements of Irrigation Potential Created/Utilised in respect of
Minor Irrigation Projects of XI plan
6.7: Financial Expenditure on Flood Management Work
6.8: List of on-going Projects under Command Area Development and Water
Management (CADWM) Programme during the period of XIth
Plan
6.9: Central Grant Released under the Command Area Development Programme
(CADP)
6.10: Rural Water Supply Facilities
6.11: Installation of Off-Grid/Decentralized Renewable Energy Systems/Devices
6.12: Source-wise Estimated Potential of Renewable Power
6.13: Installed Capacity of Power Utilities (Including allocated shares in Joint &
Central sector utilities)
6.14: Electricity-Installed Capacity, Generation and Consumption
6.15: Status of Hydropower Potential Development
6.16: Electricity Sold to Ultimate Consumers
6.17: Towns and Villages Electrified
6.18: Consumption of Electricity by Users and Per Capita Consumption
6.19: Year-wise Achievements of Irrigation Potential Created/Utilised in respect of
Minor Irrigation Projects of XIth
plan
6.20: Ground Water Resources Availability, Utilization and Stage of Development
Water State at a Glance: Mizoram, Vol. 1(7), 2016
ENVIS Centre on Himalayan Ecology 42
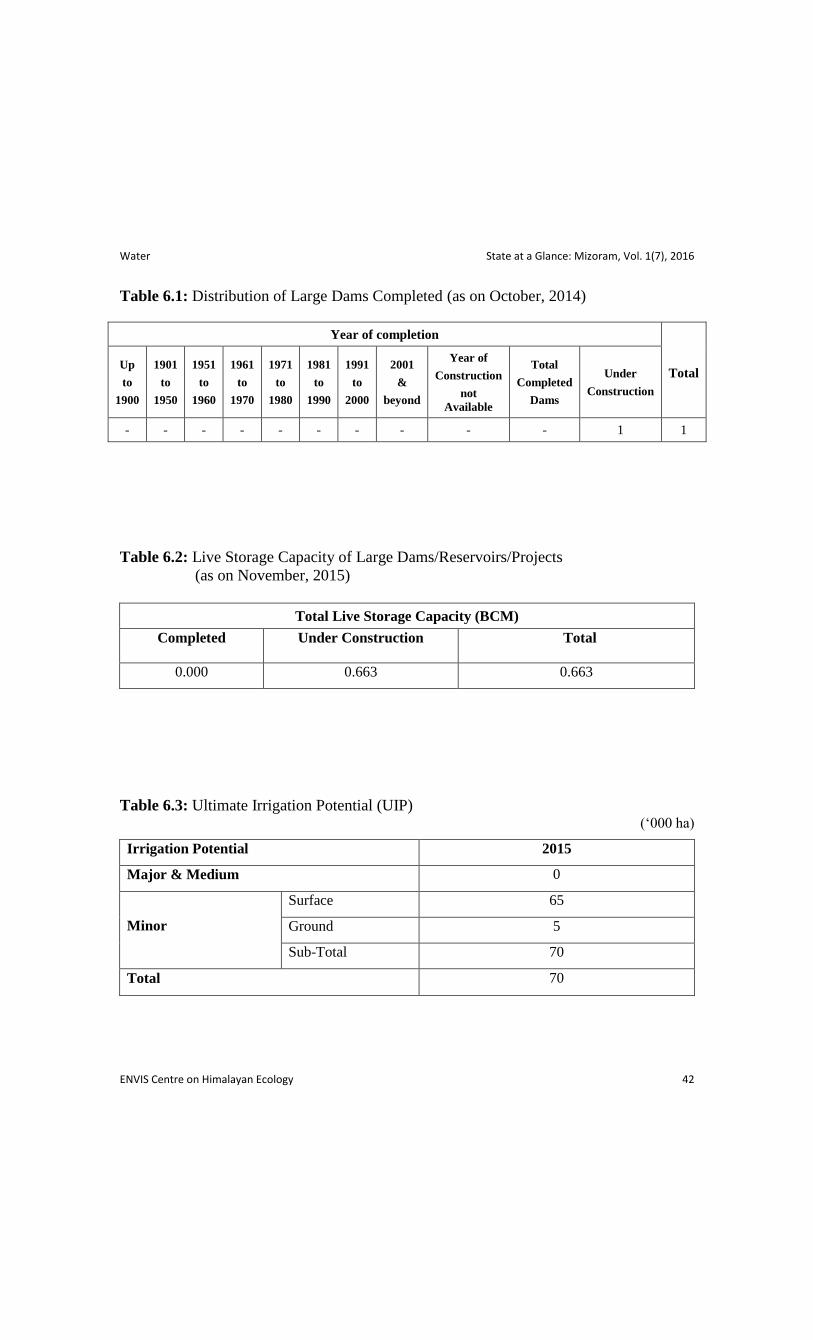
Table 6.1: Distribution of Large Dams Completed (as on October, 2014)
Year of completion
Total Up
to
1900
1901
to
1950
1951
to
1960
1961
to
1970
1971
to
1980
1981
to
1990
1991
to
2000
2001
&
beyond
Year of
Construction
not
Available
Total
Completed
Dams
Under
Construction
- - - - - - - - - - 1 1
Table 6.2: Live Storage Capacity of Large Dams/Reservoirs/Projects
(as on November, 2015)
Total Live Storage Capacity (BCM)
Completed Under Construction Total
0.000 0.663 0.663
Table 6.3: Ultimate Irrigation Potential (UIP) (‘000 ha)
Irrigation Potential 2015
Major & Medium 0
Minor
Surface 65
Ground 5
Sub-Total 70
Total 70
Water State at a Glance: Mizoram, Vol. 1(7), 2016
ENVIS Centre on Himalayan Ecology 43
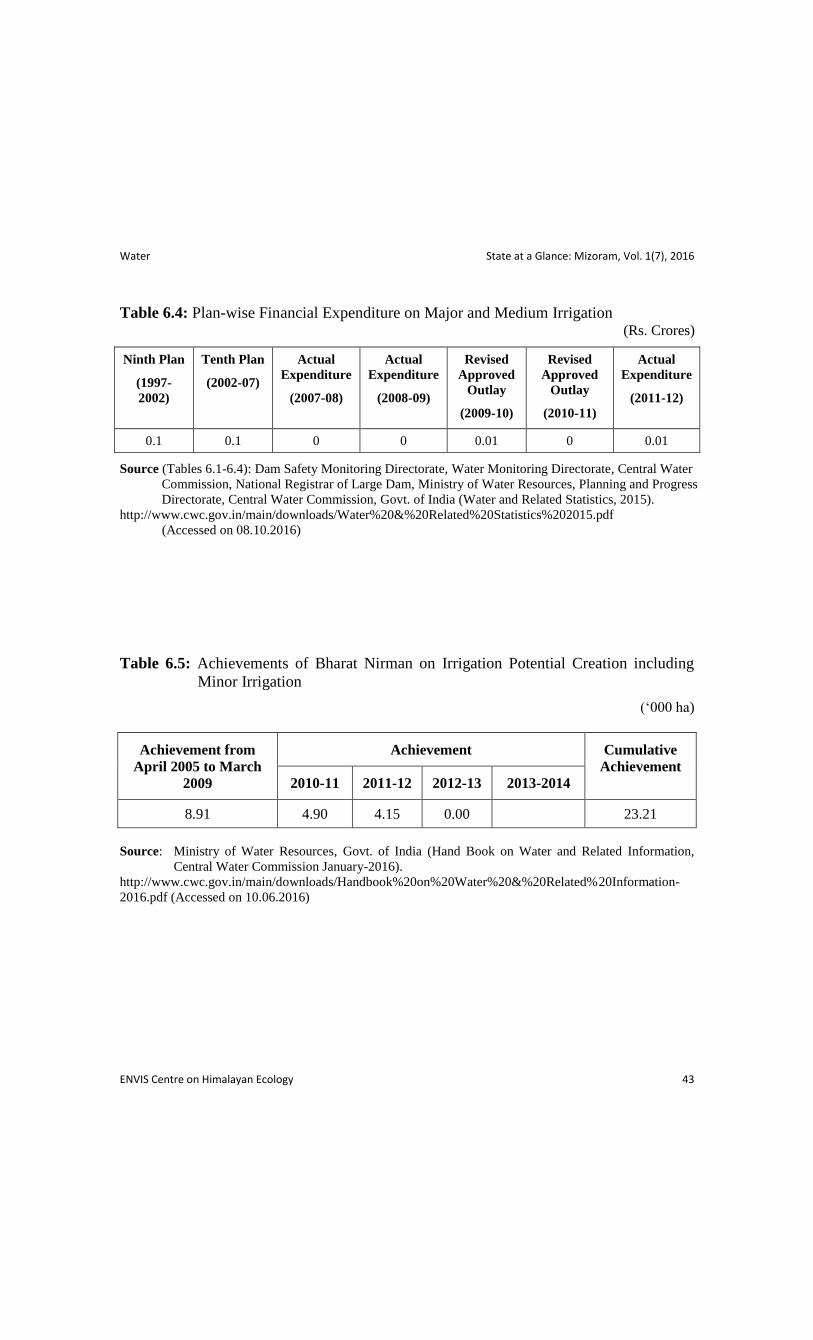
Table 6.4: Plan-wise Financial Expenditure on Major and Medium Irrigation (Rs. Crores)
Ninth Plan
(1997-
2002)
Tenth Plan
(2002-07)
Actual
Expenditure
(2007-08)
Actual
Expenditure
(2008-09)
Revised
Approved
Outlay
(2009-10)
Revised
Approved
Outlay
(2010-11)
Actual
Expenditure
(2011-12)
0.1 0.1 0 0 0.01 0 0.01
Source (Tables 6.1-6.4): Dam Safety Monitoring Directorate, Water Monitoring Directorate, Central Water
Commission, National Registrar of Large Dam, Ministry of Water Resources, Planning and Progress
Directorate, Central Water Commission, Govt. of India (Water and Related Statistics, 2015).
http://www.cwc.gov.in/main/downloads/Water%20&%20Related%20Statistics%202015.pdf
(Accessed on 08.10.2016)
Table 6.5: Achievements of Bharat Nirman on Irrigation Potential Creation including
Minor Irrigation
(‘000 ha)
Achievement from
April 2005 to March
2009
Achievement Cumulative
Achievement
2010-11 2011-12 2012-13 2013-2014
8.91 4.90 4.15 0.00 23.21
Source: Ministry of Water Resources, Govt. of India (Hand Book on Water and Related Information,
Central Water Commission January-2016).
http://www.cwc.gov.in/main/downloads/Handbook%20on%20Water%20&%20Related% 20Information-
2016.pdf (Accessed on 10.06.2016)

Water State at a Glance: Mizoram, Vol. 1(7), 2016
ENVIS Centre on Himalayan Ecology 44
Table 6.6:Year-wise Achievements of Irrigation Potential Created/Utilised in respect of
Minor Irrigation Projects of XI plan* ('000 ha)
Ultimate Irrigation Potential 70
Cumulative achievement Up to X Plan IPC 21.26
IPU 14.95
XI
Pla
n
Target IPC 21.26
IPU NF
Achievement IPC IPC 9
IPU NF
Achievement IPC IPC 9
IPU NF
Achievement 2009-10 IPC 3.87
IPU 2.3
Achievement 2010-11 IPC 4.93
IPU NF
Likely Achievement 2011-12 IPC 3.68
IPU 2.2
*: Figures under reconciliation with states; IPC: Irrigation Potential Created; IPU: Irrigation Potential
Utilised
Table 6.7: Financial Expenditure on Flood Management Work (Rs. Crores)
During
IX Plan
(1997-
02)
Upto
IX
Plan
(1997-
02)
During
X Plan
(2002-
07)
Upto
X Plan
(2002-
07)
Actual
Expenditure
(2007-08)
Actual
Expenditure
(2008-09)
Revised
Approved
Outlay
(2009-10)
Revised
Approved
Outlay
(2010-11)
Actual
Expenditure
(2011-12)
0.00 1.11 0.00 1.11 0.00 0.00 0.0 0.00 1.50
Source: Planning and Progress Directorate, Central Water Commission, Water Resources Information
System Directorate, Information System Organisation, Water Planning & Projects Wing, Govt. of
India (Water and Related Statistics, 2015).
http://www.cwc.gov.in/main/downloads/Water%20&%20Related%20Statistics%202015.pdf
(Accessed on 20.09.2016)

Water State at a Glance: Mizoram, Vol. 1(7), 2016
ENVIS Centre on Himalayan Ecology 45
Table 6.8: List of on-going Projects under Command Area Development and Water
Management (CADWM) Programme during the period of XIth
Plan (2007-08
to 2011-12) (as on March, 2013)
(‘000 ha)
Project Name Districts
benefitted
Year of
Inclusion
CCA CCA Covered
till
31.3.2013
Reported balance of
executable CCA
Cluster of5 Minor
Irrigation Projects at
Changki Valley
Aizawl,
Champai 2011-12 0.222 0.053 0.169
Cluster of 60 MI
Schemes Phase-II
Aizawl, Lunget and
Chhimtuipui District
2003-04 3.04 0 3.04
Total 3.262 0.053 3.209
CCA - Cultural Command Area
Table 6.9: Central grant Released under the Command Area Development Programme
(CADP)
Total up to end
of
VIII Plan
Up to IX
Plan
(Lacs)
Up to X
Plan
(Lacs)
Total
XI
Plan
(Lacs)
During XII Plan Cumulative
Up to 2014-15
(Lacs) 2012-
13
2013-
14
2014-
15
0.0 11.9 73.0 19.4 0.0 92.4
Source (Tables 6.8-6.9): Planning and Progress Directorate, Central Water Commission, Ministry of Water
Resource, (CAD wing) Govt. of India (Water and Related Statistics, 2015).
http://www.cwc.gov.in/main/downloads/Water%20&%20Related%20Statistics%202015.pdf
(Accessed on 08.05.2016)

Water State at a Glance: Mizoram, Vol. 1(7), 2016
ENVIS Centre on Himalayan Ecology 46
Table 6.10: Rural Water Supply Facilities
Year 2003-04 2004-05 2005-06 2006-07 2007-08 2008-09 2009-10 2010-11 2011-12 2012-13
No. of
villages
provided with
piped
water supply
88 73 92 94 81 54 110 65 106 29
No. of hand
pump tube
wells
installed
263 88 68 49 - 222 111 91 18 54
No. of rain
Water
harvesting
tanks
constructed
1567 485 805 1257 1616 504 789 38 55 17
No. of village
springs
improved
9 122 32 19 116 16 19 16 1 -
No. of
impounding
reservoirs
constructed
7 7 2 6 1 1 1 - - -
No. of rural
schools
provided
with drinking
water
facilities
180 140 400 1986 - - - 126 - 733
Ground water
based - - - - - - - 2* - -
(-) Nil; *: Newly introduced Project by the concerned Department
Source: Directorate of Economics & Statistics Government of Mizoram
(Statistical Abstract of Mizoram, 2013).
http://desmizo.nic.in/file/Abstract2013.pdf (Accessed on 10.8.2016)
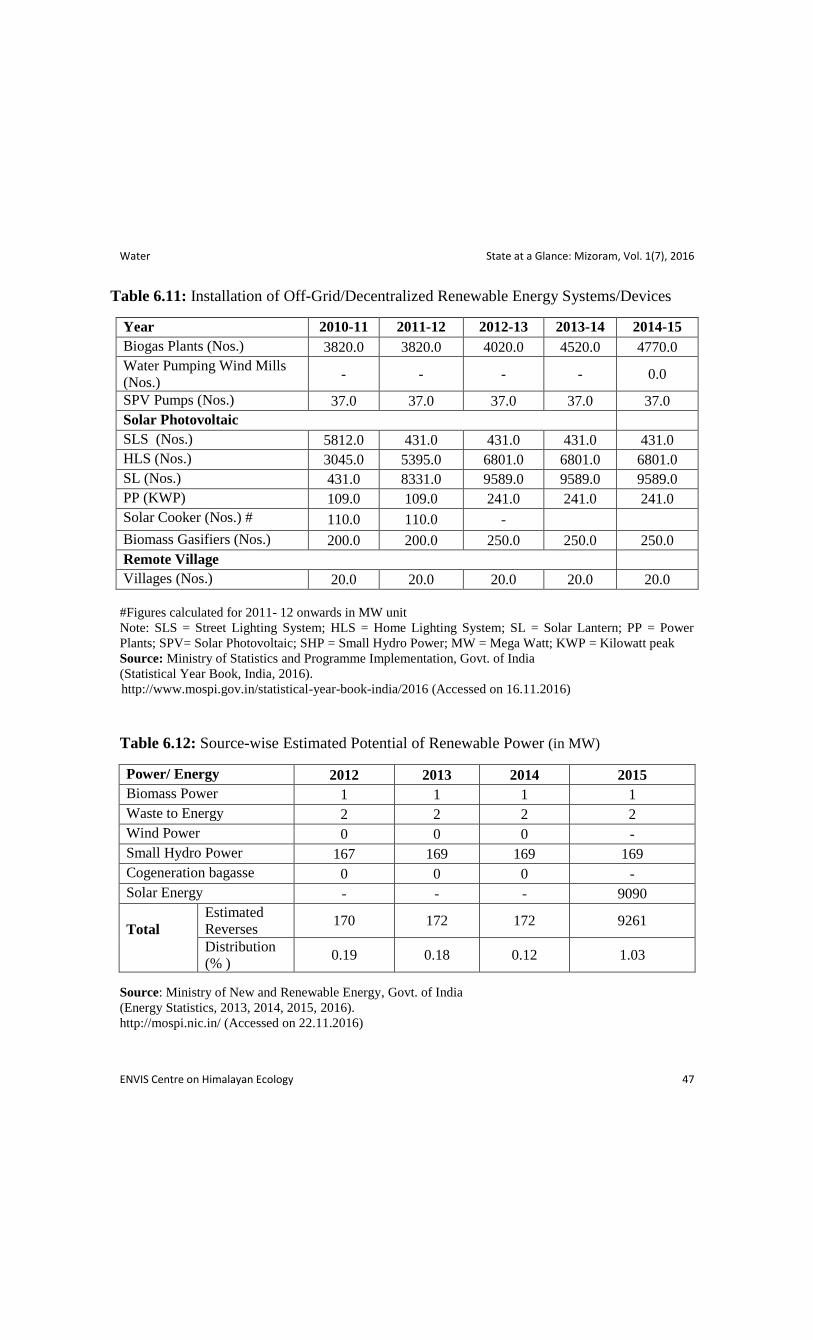
Water State at a Glance: Mizoram, Vol. 1(7), 2016
ENVIS Centre on Himalayan Ecology 47
Table 6.11: Installation of Off-Grid/Decentralized Renewable Energy Systems/Devices
Year 2010-11 2011-12 2012-13 2013-14 2014-15
Biogas Plants (Nos.) 3820.0 3820.0 4020.0 4520.0 4770.0
Water Pumping Wind Mills
(Nos.) - - - - 0.0
SPV Pumps (Nos.) 37.0 37.0 37.0 37.0 37.0
Solar Photovoltaic
SLS (Nos.) 5812.0 431.0 431.0 431.0 431.0
HLS (Nos.) 3045.0 5395.0 6801.0 6801.0 6801.0
SL (Nos.) 431.0 8331.0 9589.0 9589.0 9589.0
PP (KWP) 109.0 109.0 241.0 241.0 241.0
Solar Cooker (Nos.) # 110.0 110.0 - Biomass Gasifiers (Nos.) 200.0 200.0 250.0 250.0 250.0
Remote Village
Villages (Nos.) 20.0 20.0 20.0 20.0 20.0
#Figures calculated for 2011- 12 onwards in MW unit
Note: SLS = Street Lighting System; HLS = Home Lighting System; SL = Solar Lantern; PP = Power
Plants; SPV= Solar Photovoltaic; SHP = Small Hydro Power; MW = Mega Watt; KWP = Kilowatt peak
Source: Ministry of Statistics and Programme Implementation, Govt. of India
(Statistical Year Book, India, 2016).
http://www.mospi.gov.in/statistical-year-book-india/2016 (Accessed on 16.11.2016)
Table 6.12: Source-wise Estimated Potential of Renewable Power (in MW)
Power/ Energy 2012 2013 2014 2015
Biomass Power 1 1 1 1
Waste to Energy 2 2 2 2
Wind Power 0 0 0 -
Small Hydro Power 167 169 169 169
Cogeneration bagasse 0 0 0 -
Solar Energy - - - 9090
Total
Estimated
Reverses 170 172 172 9261
Distribution
(% ) 0.19 0.18 0.12 1.03
Source: Ministry of New and Renewable Energy, Govt. of India
(Energy Statistics, 2013, 2014, 2015, 2016).
http://mospi.nic.in/ (Accessed on 22.11.2016)
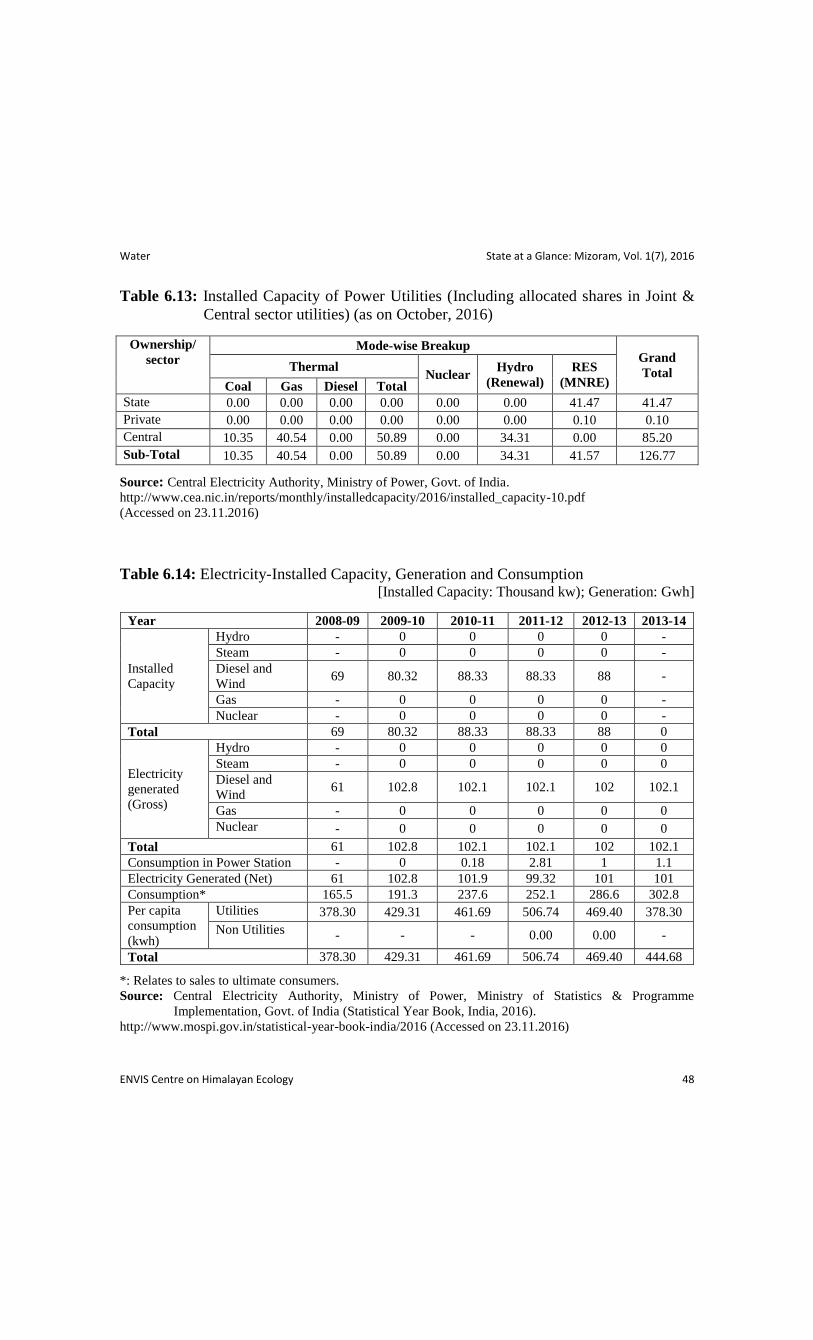
Water State at a Glance: Mizoram, Vol. 1(7), 2016
ENVIS Centre on Himalayan Ecology 48
Table 6.13: Installed Capacity of Power Utilities (Including allocated shares in Joint &
Central sector utilities) (as on October, 2016)
Ownership/
sector Mode-wise Breakup
Grand
Total Thermal
Nuclear Hydro
(Renewal)
RES
(MNRE) Coal Gas Diesel Total
State 0.00 0.00 0.00 0.00 0.00 0.00 41.47 41.47
Private 0.00 0.00 0.00 0.00 0.00 0.00 0.10 0.10
Central 10.35 40.54 0.00 50.89 0.00 34.31 0.00 85.20
Sub-Total 10.35 40.54 0.00 50.89 0.00 34.31 41.57 126.77
Source: Central Electricity Authority, Ministry of Power, Govt. of India.
http://www.cea.nic.in/reports/monthly/installedcapacity/2016/installed_capacity-10.pdf
(Accessed on 23.11.2016)
Table 6.14: Electricity-Installed Capacity, Generation and Consumption [Installed Capacity: Thousand kw); Generation: Gwh]
Year 2008-09 2009-10 2010-11 2011-12 2012-13 2013-14
Installed
Capacity
Hydro - 0 0 0 0 -
Steam - 0 0 0 0 -
Diesel and
Wind 69 80.32 88.33 88.33 88 -
Gas - 0 0 0 0 -
Nuclear - 0 0 0 0 -
Total 69 80.32 88.33 88.33 88 0
Electricity
generated
(Gross)
Hydro - 0 0 0 0 0
Steam - 0 0 0 0 0
Diesel and
Wind 61 102.8 102.1 102.1 102 102.1
Gas - 0 0 0 0 0
Nuclear - 0 0 0 0 0
Total 61 102.8 102.1 102.1 102 102.1
Consumption in Power Station - 0 0.18 2.81 1 1.1
Electricity Generated (Net) 61 102.8 101.9 99.32 101 101
Consumption* 165.5 191.3 237.6 252.1 286.6 302.8
Per capita
consumption
(kwh)
Utilities 378.30 429.31 461.69 506.74 469.40 378.30
Non Utilities - - - 0.00 0.00 -
Total 378.30 429.31 461.69 506.74 469.40 444.68
*: Relates to sales to ultimate consumers.
Source: Central Electricity Authority, Ministry of Power, Ministry of Statistics & Programme
Implementation, Govt. of India (Statistical Year Book, India, 2016).
http://www.mospi.gov.in/statistical-year-book-india/2016 (Accessed on 23.11.2016)

Water State at a Glance: Mizoram, Vol. 1(7), 2016
ENVIS Centre on Himalayan Ecology 49
Table 6.15: Status of Hydropower Potential Development (Installed Capacity)
Capacity as on 31.03.2015 as on 31.08. 2016
Identified Capacity Total (MW) 2196 2196
Above 25 MW 2131 2131
Capacity Developed
Mega Watts 0.00 0.00
Percent 0.00 0.00
Capacity under Construction
Mega Watts 60.0 60.0
Percent 2.82 2.82
Capacity Operation & Under Construction
Mega Watts 60.0 60.0
Percent 2.82 2.82
Capacity yet to be Developed
Mega Watts 2071.0 2071.0
Percent 97.18 97.18
Source: Central Electricity Authority, Ministry of Power, Govt. of India.
http://cea.nic.in/reports/monthly/hydro/2015/hydro_potential_region-08.pdf (Accessed on 23.11.2016)
Table 6.16: Electricity Sold to Ultimate Consumers (Utilities only) (Gwh)
Electricity Sold 2009-10 2010-11 2011-12 2012-13 2013-14
Total sold to ultimate consumers 191.33 237.56 252.05 286.60 302.79
Domestic 129.16 174.40 170.92 197.59 200.15
Commercial 11.86 14.65 18.89 21.10 23.57
Industrial Power at low & medium voltage 1.75 1.57 1.76 1.81 2.09
Industrial Power at high voltage 0.63 0.31 0.33 1.47 4.99
Public lighting 5.15 7.04 6.04 5.36 7.48
Traction 0.00 0.00 0.00 0.00 0.00
Agriculture 0.50 0.12 0.09 0.08 0.06
Public water works & sewage pumping 30.62 27.29 36.28 37.23 40.21
Miscellaneous 11.66 12.18 17.74 21.96 24.24
Source: Ministry of Statistics and Programme Implementation, Govt. of India
(Statistical Year Book, India, 2016).
http://www.mospi.gov.in/statistical-year-book-india/2016 (Accessed on 03.06.2016)
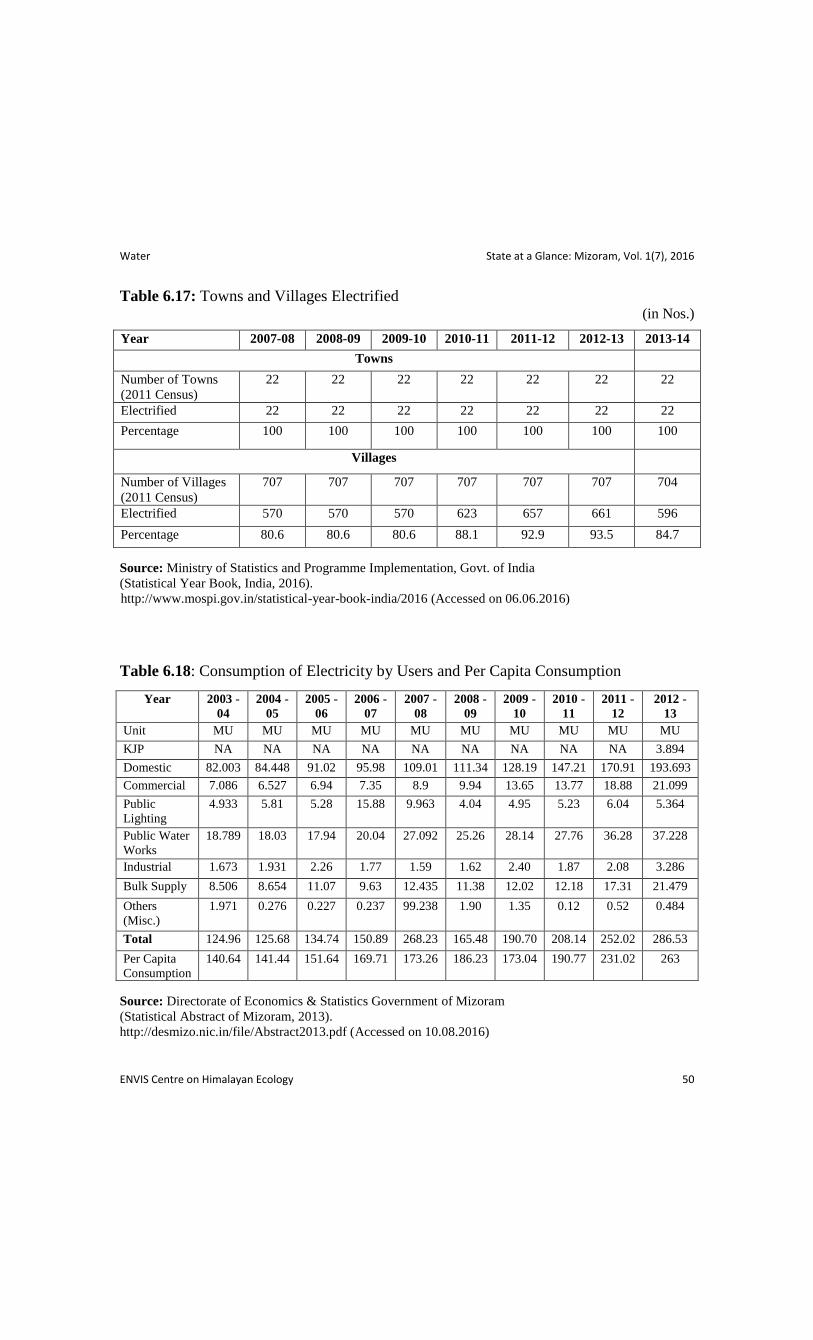
Water State at a Glance: Mizoram, Vol. 1(7), 2016
ENVIS Centre on Himalayan Ecology 50
Table 6.17: Towns and Villages Electrified (in Nos.)
Year 2007-08 2008-09 2009-10 2010-11 2011-12 2012-13 2013-14
Towns
Number of Towns
(2011 Census)
22 22 22 22 22 22 22
Electrified 22 22 22 22 22 22 22
Percentage 100 100 100 100 100 100 100
Villages
Number of Villages
(2011 Census)
707 707 707 707 707 707 704
Electrified 570 570 570 623 657 661 596
Percentage 80.6 80.6 80.6 88.1 92.9 93.5 84.7
Source: Ministry of Statistics and Programme Implementation, Govt. of India
(Statistical Year Book, India, 2016).
http://www.mospi.gov.in/statistical-year-book-india/2016 (Accessed on 06.06.2016)
Table 6.18: Consumption of Electricity by Users and Per Capita Consumption
Year 2003 -
04
2004 -
05
2005 -
06
2006 -
07
2007 -
08
2008 -
09
2009 -
10
2010 -
11
2011 -
12
2012 -
13
Unit MU MU MU MU MU MU MU MU MU MU
KJP NA NA NA NA NA NA NA NA NA 3.894
Domestic 82.003 84.448 91.02 95.98 109.01 111.34 128.19 147.21 170.91 193.693
Commercial 7.086 6.527 6.94 7.35 8.9 9.94 13.65 13.77 18.88 21.099
Public
Lighting
4.933 5.81 5.28 15.88 9.963 4.04 4.95 5.23 6.04 5.364
Public Water
Works
18.789 18.03 17.94 20.04 27.092 25.26 28.14 27.76 36.28 37.228
Industrial 1.673 1.931 2.26 1.77 1.59 1.62 2.40 1.87 2.08 3.286
Bulk Supply 8.506 8.654 11.07 9.63 12.435 11.38 12.02 12.18 17.31 21.479
Others
(Misc.)
1.971 0.276 0.227 0.237 99.238 1.90 1.35 0.12 0.52 0.484
Total 124.96 125.68 134.74 150.89 268.23 165.48 190.70 208.14 252.02 286.53
Per Capita
Consumption
140.64 141.44 151.64 169.71 173.26 186.23 173.04 190.77 231.02 263
Source: Directorate of Economics & Statistics Government of Mizoram
(Statistical Abstract of Mizoram, 2013).
http://desmizo.nic.in/file/Abstract2013.pdf (Accessed on 10.08.2016)
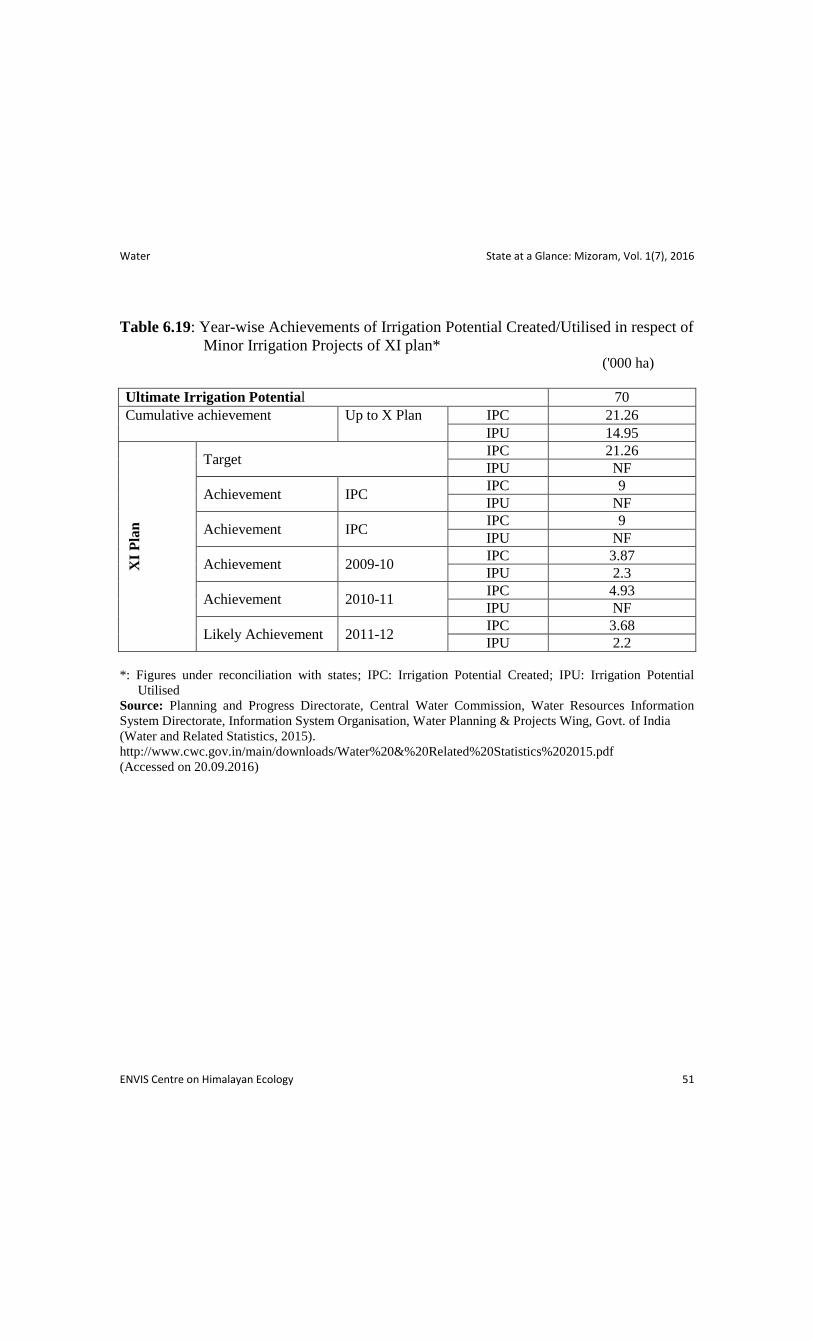
Water State at a Glance: Mizoram, Vol. 1(7), 2016
ENVIS Centre on Himalayan Ecology 51
Table 6.19: Year-wise Achievements of Irrigation Potential Created/Utilised in respect of
Minor Irrigation Projects of XI plan* ('000 ha)
Ultimate Irrigation Potential 70
Cumulative achievement Up to X Plan IPC 21.26
IPU 14.95
XI
Pla
n
Target IPC 21.26
IPU NF
Achievement IPC IPC 9
IPU NF
Achievement IPC IPC 9
IPU NF
Achievement 2009-10 IPC 3.87
IPU 2.3
Achievement 2010-11 IPC 4.93
IPU NF
Likely Achievement 2011-12 IPC 3.68
IPU 2.2
*: Figures under reconciliation with states; IPC: Irrigation Potential Created; IPU: Irrigation Potential
Utilised
Source: Planning and Progress Directorate, Central Water Commission, Water Resources Information
System Directorate, Information System Organisation, Water Planning & Projects Wing, Govt. of India
(Water and Related Statistics, 2015).
http://www.cwc.gov.in/main/downloads/Water%20&%20Related%20Statistics%202015.pdf
(Accessed on 20.09.2016)
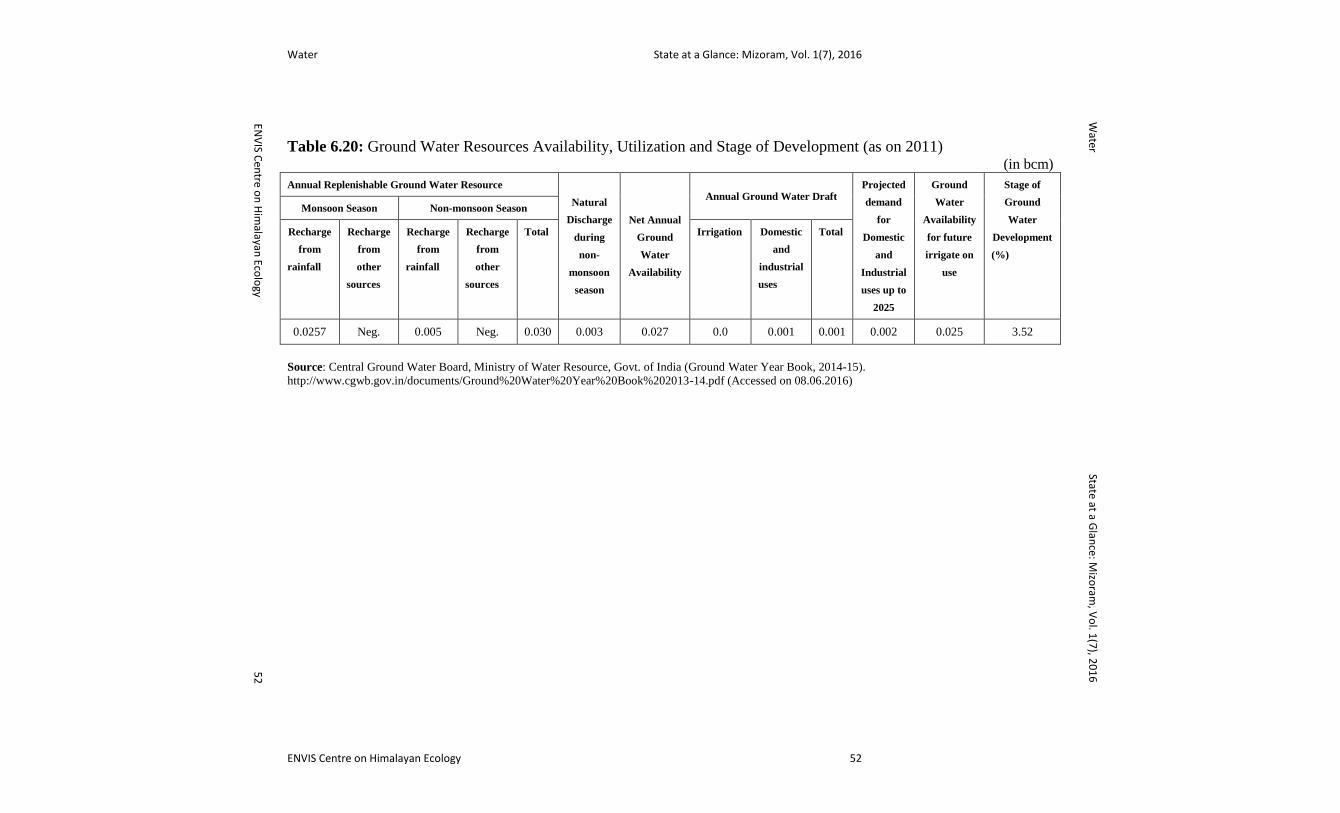
Water State at a Glance: Mizoram, Vol. 1(7), 2016
ENVIS Centre on Himalayan Ecology 52
Table 6.20: Ground Water Resources Availability, Utilization and Stage of Development (as on 2011) (in bcm)
Annual Replenishable Ground Water Resource
Natural
Discharge
during
non-
monsoon
season
Net Annual
Ground
Water
Availability
Annual Ground Water Draft Projected
demand
for
Domestic
and
Industrial
uses up to
2025
Ground
Water
Availability
for future
irrigate on
use
Stage of
Ground
Water
Development
(%)
Monsoon Season Non-monsoon Season
Recharge
from
rainfall
Recharge
from
other
sources
Recharge
from
rainfall
Recharge
from
other
sources
Total Irrigation Domestic
and
industrial
uses
Total
0.0257 Neg. 0.005 Neg. 0.030 0.003 0.027 0.0 0.001 0.001 0.002 0.025 3.52
Source: Central Ground Water Board, Ministry of Water Resource, Govt. of India (Ground Water Year Book, 2014-15).
http://www.cgwb.gov.in/documents/Ground%20Water%20Year%20Book%202013-14.pdf (Accessed on 08.06.2016)
Water
State at a Glan
ce: Mizo
ram, V
ol. 1
(7), 2
01
6
ENV
IS Cen
tre on
Him
alayan Eco
logy
52

Agriculture State at a Glance: Mizoram, Vol. 1(7), 2016
ENVIS Centre on Himalayan Ecology 53
Agriculture
List of Tables
7.1: Agriculture Area & Production of Principal Crops
7.2: Average Yield of Principal Crops
7.3: Area, Production & Average Yield of Important Agricultural Crops
7.4: Yield of Foodgrains
7.5: Net Area under Irrigation by Sources
7.6: Gross Area under Irrigation by Crops
7.7: Area Irrigated Under Minor Irrigation Project
7.8: Consumption of Fertilizer and Pesticide
7.9: Estimated Consumption of Fertilizer
7.10: Fish Production
7.11: Quantity of Inland Fish Production, Fish Seed Production and Distribution
7.12: Area under Pisciculture
7.13: Gross State Domestic Product (GSDP) from Agriculture and Allied Sector at
Constant Prices
7.14: Share of Agriculture and Allied Sector in Gross State Domestic Product (GSDP)
at Current Prices
7.15: Number and Area of Operational Holdings for all Social Groups
7.16: Size-wise Number and Area of Operational Holdings for all Social Groups
7.17: Number and Area of Operational Holdings for Scheduled Tribes (ST) by all Size
Groups
7.18: Percentage Distribution of Number and Area of Operational Holdings for All
Social Groups
7.19: Estimated Number of Rural, Agricultural and Indebted Households
7.20: Comparison of Outlay and Expenditure in Agricultural and Allied Sector
7.21: Number of Kisan Credit Cards Issued

Agriculture State at a Glance: Mizoram, Vol. 1(7), 2016
ENVIS Centre on Himalayan Ecology 54
Table 7.1: Agriculture Area & Production of Principal Crops (Part A)
[A= Area in Hectare; P=Production in M.T.]
Foodgrains 2010-11 2011-12 2012-13 2013-14 2014-15
Rice
Area 40.7 38.5 14.6 38.8 36.9
Production 47.2 54.3 30.5 59.0 60.7
Yield 1160 1411 2088 1522 1643
Maize
Area 9.0 6.9 6.1 5.8 5.7
Production 13.6 8.4 8.0 8.2 8.6
Yield 1508 1214 1314 1420 1515
Coarse Cereals
Area 8.7 6.7 5.9 5.6 5.6
Production 13.1 8.1 7.7 8.0 8.4
Yield 1502 1214 1305 1424 1521
Pulses (Other
than Tur)
Area 2.4 2.1 2.0 2.4 2.5
Production 3.1 2.2 1.9 3.4 3.5
Yield 1273 1047 956 1412 1433
Pulses(Other
than Gram)
Area 1.5 1.7 1.1 1.4 1.8
Production 3.0 3.1 1.3 2.2 2.5
Yield 1948 1818 1264 1563 1392
Total Pulses
Area 4.0 3.8 3.1 3.9 4.2
Production 6.1 5.3 3.3 5.7 6.0
Yield 1534 1389 1061 1468 1416
Total
Foodgrains
Area 53.7 49.2 23.8 48.4 46.8
Production 66.9 68.0 41.8 72.8 75.3
Yield 1246 1382 1756 1506 1607
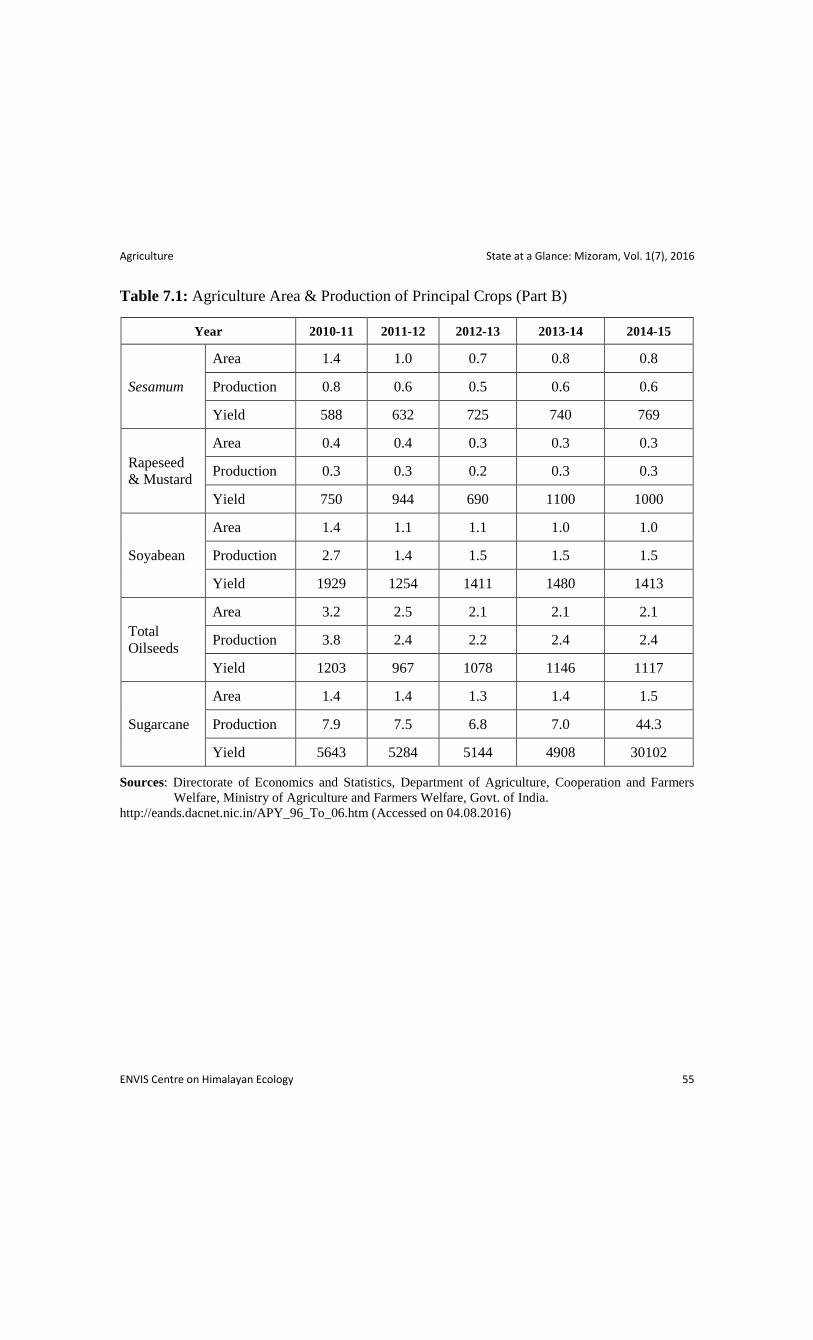
Agriculture State at a Glance: Mizoram, Vol. 1(7), 2016
ENVIS Centre on Himalayan Ecology 55
Table 7.1: Agriculture Area & Production of Principal Crops (Part B)
Year 2010-11 2011-12 2012-13 2013-14 2014-15
Sesamum
Area 1.4 1.0 0.7 0.8 0.8
Production 0.8 0.6 0.5 0.6 0.6
Yield 588 632 725 740 769
Rapeseed
& Mustard
Area 0.4 0.4 0.3 0.3 0.3
Production 0.3 0.3 0.2 0.3 0.3
Yield 750 944 690 1100 1000
Soyabean
Area 1.4 1.1 1.1 1.0 1.0
Production 2.7 1.4 1.5 1.5 1.5
Yield 1929 1254 1411 1480 1413
Total
Oilseeds
Area 3.2 2.5 2.1 2.1 2.1
Production 3.8 2.4 2.2 2.4 2.4
Yield 1203 967 1078 1146 1117
Sugarcane
Area 1.4 1.4 1.3 1.4 1.5
Production 7.9 7.5 6.8 7.0 44.3
Yield 5643 5284 5144 4908 30102
Sources: Directorate of Economics and Statistics, Department of Agriculture, Cooperation and Farmers
Welfare, Ministry of Agriculture and Farmers Welfare, Govt. of India.
http://eands.dacnet.nic.in/APY_96_To_06.htm (Accessed on 04.08.2016)

Agriculture State at a Glance: Mizoram, Vol. 1(7), 2016
ENVIS Centre on Himalayan Ecology 56
Table 7.2: Average Yield of Principal Crops (kg/ha)
Year 2009-10 2010-11 2011-12 2012-13 2013-14
Food grains (Cereals)
Rice 938.8 1160.3 1410.9 2087.7 1522.1
Maize 1346.6 1507.8 1214.5 1314.1 1420.4
Food grains (Pulses)
Other Pulses 1666.7 1538.5 1250.0 1061.5 1467.5
Oilseeds
Sesamum 654.2 588.2 631.6 724.6 740.3
Rapeseed &Mustard 750.0 750.0 944.4 689.7 1100.0
Cotton 75.6 # # # #
Jute 276.9 324.0 324.5 342.7 342.8
Mesta - 337.5 345.2 198.9 199.7
Tea 0.9 - - - -
Banana - 196.7 184.4 - 150.0
Sugar 29980.4 43000.0 43512.8 43519.7 43524.2
Potatoes - 50.0 66.7 .- 135.1
Coconut - 3.3 - - 77.4
Pepper - 0.5 - - 0.4
Chillies - 36.0 - - 36.0
Ginger 57.9 66.6 - - 67.7
Turmeric 50.0 41.7 - - 41.7
Tea 1.2 - - - -
Sources: 1.Directorate of Economics and Statistics, Ministry of Agriculture, Govt. of India
(Statistical Year Book, India, 2016).
2. Tea Board, Ministry of Commerce & Industry, Govt. of India
3. Coffee Board, Ministry of Commerce & Industry, Govt. of India
4. Rubber Board, Ministry of Commerce & Industry, Govt. of India
http://www.mospi.gov.in/statistical-year-book-india/2016 (Accessed on 27.05.2016)

Agriculture State at a Glance: Mizoram, Vol. 1(7), 2016
ENVIS Centre on Himalayan Ecology 57
Table 7.3: Area, Production & Average Yield of Important Agricultural Crops
Year 2003-04 2004-
05
2005-
06
2006-
07*
2007-
08
2008-
09
2009-
10
2010-
11
2011-
12
2012-
13
Paddy
Area 59,196 57,085 56,460 52,851 54,541 51,990 47,204 40,692 38,976 39,342
Production
(MT) 1,14,630 1,07,661 1,07,740 42,091 15,688 68,917 66,132 67,428 75,566 77,471
Yield
(kg per ha) 1,936 1,886 1,908 796 288 1,326 1,401 1,657 1,939 1,969
Maize
Area 10,481 10,505 11,742 10,775 7,328 9,558 8,551 9,005 6,905 6,175
Production
(MT) 20,282 19,788 22,703 20,969 729 9,318 11,510 13,499 8,397 8,064
Yield
(kg per ha) 1,935 1,884 1,933 1,946 99 975 1,346 1,499 1,216 1,305
Pulses
Area 4,892 6,741 6,861 5,054 5,048 3,931 3,920 3,957 3,836 3,099
Production
(MT) 4,313 7,971 8,663 5,833 2,632 3,646 6,479 6,065 5,331 3,288
Yield (kg
per ha) 881 1182 1262 1154 521 927 1653 1532 1389 1060
Oilseeds
Area 7,532 5,817 5,870 4,075 8,485 3,275 2,741 3,140 2,474 2,063
Production
(MT) 5,478 5,321 5,560 3,755 748 2,514 2,988 3,727 2,382 2,224
Yield (kg
per ha) 727 914 947 921 88 768 1090 1186 963 1078
Sugarcane
Area 1,393 1,357 1,383 1,340 883 1,342 1,434 1,418 1,463 1,323
Production
(MT) 6,174 13,565 15,953 12,187 828 13,696 12,368 7,900 7,456 6,795
Yield
(kg per ha) 4,432 9,996 11,535 9,095 937 10,206 8,625 5,571 5,096 5,139
Potato
Area 363 504 953 639 330 269 285 431 409 286
Production
(MT) 893 2,531 3,891 1,652 1,158 1,569 2,235 3,699 2,868 7,012
Yield (kg
per ha) 2,460 5,022 4,083 2,585 3,509 5,833 7,842 286 1,440 5,034
*Production of Paddy has decreased sharply due to onset of Mautam famine. (Bamboo flowering)
*Production of oilseeds and Sugarcane has decreased sharply due to onset of Mautam Famine (Bamboo Flowering) in
2006-2007 and 2007-2008.
Source: Directorate of Economics & Statistics Government of Mizoram (Statistical Abstract of Mizoram, 2013).
http://desmizo.nic.in/file/Abstract2013.pdf (Accessed on 10.08.2016)

Agriculture State at a Glance: Mizoram, Vol. 1(7), 2016
ENVIS Centre on Himalayan Ecology 58
Table 7.4: Yield of Foodgrains (in kg/ha)
Year Yield of Kharif
Foodgrains
Yield of Rabi Foodgrains Yield of Total
Foodgrains
2004-05 1894 1,720 1,888
2005-06 1745 1,939 1,754
2006-07 767 1,174 822
2007-08 263 1,286 285
2008-09 887 1,263 898
2009-10 1014 2,111 1,047
2010-11 1223 1,895 1,246
2011-12 1351 1,992 1,382
2012-13 1779 1,435 1,756
2013-14* # # #
Notes: *Fourth Advance Estimates.
# included in others; NA: Not Available
Source: Directorate of Economics and Statistics, Department of Agriculture, Cooperation and Welfare,
Ministry of Agriculture and Farmers Welfare, Govt. of India (Agricultural Statistics at a Glance, 2014).
http://eands.dacnet.nic.in/PDF/Agricultural-Statistics-At-Glance2014.pdf (Accessed on 27.08.2016)
Table 7.5: Net Area under Irrigation by Sources ('000 ha)
Year 2008-09 2009-10 2010-11 2011-12 2012-13
Canals
Government 2 2 3 2 2
Private 9 8 10 11 12
Total 11 10 12 13 14
Wells
Tanks - - - - -
Tube Wells - - - - -
Other Wells - - - - -
Other Sources - - - -
Total 11 10 12 13 14
Source: Directorate of Economics and Statistics, Ministry of Agriculture, Ministry of Statistics &
Programme Implementation, Govt. of India (Statistical Year Book India, 2016).
http://www.mospi.gov.in/statistical-year-book-india/2016 (Accessed on 03.08.2016)

Agriculture State at a Glance: Mizoram, Vol. 1(7), 2016
ENVIS Centre on Himalayan Ecology 59
Table 7.6: Gross Area under Irrigation by Crops ('000 ha)
Year 2008-09 2009-10 2010-11 2011-12 2012-13
Rice 11 10 12 13 15
Jowar - - - - -
Bajra - - - - -
Maize - - - - -
Ragi - - - - -
Wheat - - - - -
Barley - - - - -
Other Cereals & Millets - - - - -
Total Cereals & Millets 11 10 12 13 15
Total Pulses - - - - -
Total Foodgrains 11 10 12 13 15
Sugarcane - - - - -
Condiments & Spices - - - - -
Fruits & Vegetables
(including root crops) - - - - -
Other Food Crops - - - - -
Total Food Crops 11 10 12 13 15
Total Oilseeds - - - - -
Cotton - - - - -
Tobacco - - - - -
Fodder crops - - - - -
Other Non-Food Crops - - - - -
Total Non-Food Crops - - - - -
Total Irrigated Area under all
crops 11 10 12 13 15
Note: '0' relates to the area below 500 hectares; Total may not tally due to rounding off of the figures.
Source: Directorate of Economics and Statistics, Ministry of Agriculture, Ministry of Statistics &
Programme Implementation, Govt. of India (Statistical Year Book India, 2016).
http://www.mospi.gov.in/statistical-year-book-india/2016 (Accessed on 03.08.2016)
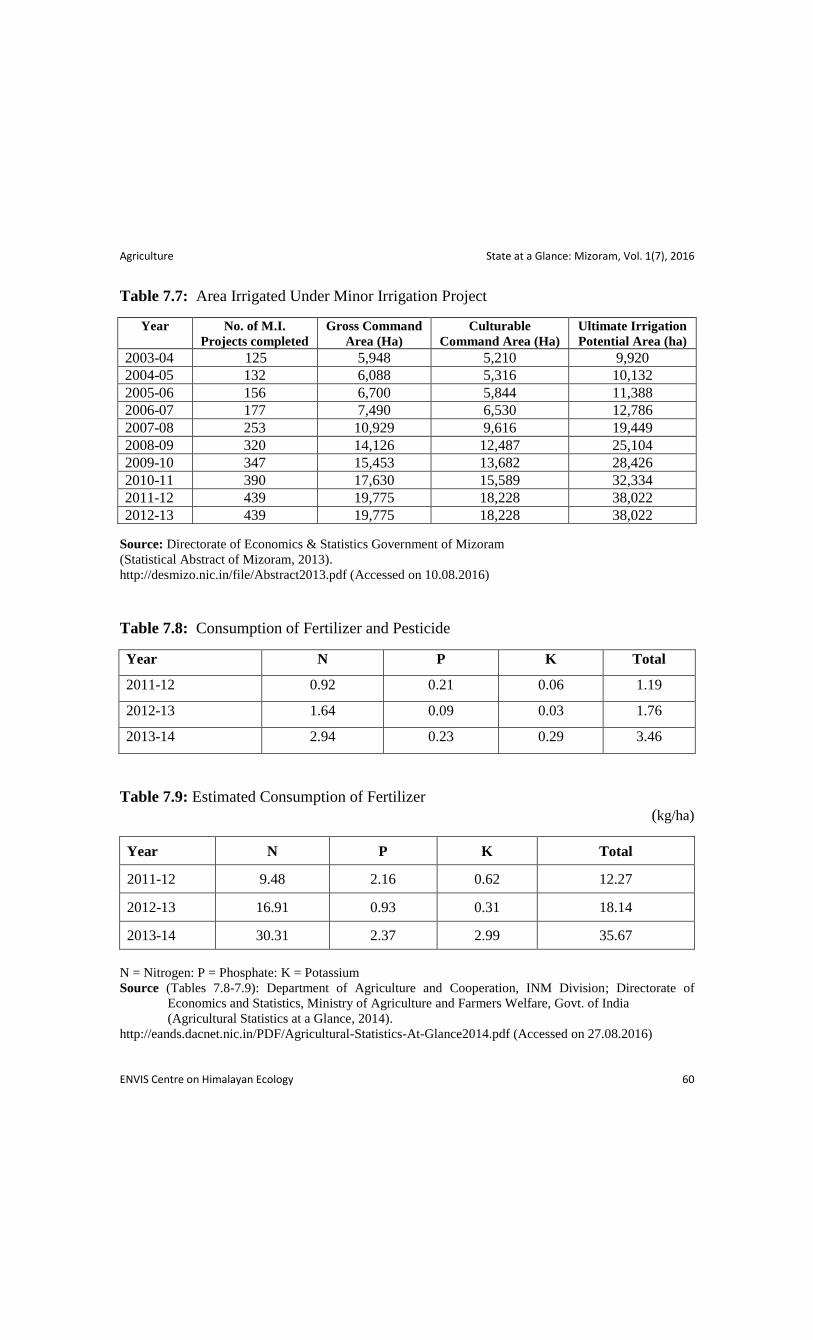
Agriculture State at a Glance: Mizoram, Vol. 1(7), 2016
ENVIS Centre on Himalayan Ecology 60
Table 7.7: Area Irrigated Under Minor Irrigation Project
Year No. of M.I.
Projects completed
Gross Command
Area (Ha)
Culturable
Command Area (Ha)
Ultimate Irrigation
Potential Area (ha)
2003-04 125 5,948 5,210 9,920
2004-05 132 6,088 5,316 10,132
2005-06 156 6,700 5,844 11,388
2006-07 177 7,490 6,530 12,786
2007-08 253 10,929 9,616 19,449
2008-09 320 14,126 12,487 25,104
2009-10 347 15,453 13,682 28,426
2010-11 390 17,630 15,589 32,334
2011-12 439 19,775 18,228 38,022
2012-13 439 19,775 18,228 38,022
Source: Directorate of Economics & Statistics Government of Mizoram
(Statistical Abstract of Mizoram, 2013).
http://desmizo.nic.in/file/Abstract2013.pdf (Accessed on 10.08.2016)
Table 7.8: Consumption of Fertilizer and Pesticide
Year N P K Total
2011-12 0.92 0.21 0.06 1.19
2012-13 1.64 0.09 0.03 1.76
2013-14 2.94 0.23 0.29 3.46
Table 7.9: Estimated Consumption of Fertilizer
(kg/ha)
Year N P K Total
2011-12 9.48 2.16 0.62 12.27
2012-13 16.91 0.93 0.31 18.14
2013-14 30.31 2.37 2.99 35.67
N = Nitrogen: P = Phosphate: K = Potassium
Source (Tables 7.8-7.9): Department of Agriculture and Cooperation, INM Division; Directorate of
Economics and Statistics, Ministry of Agriculture and Farmers Welfare, Govt. of India
(Agricultural Statistics at a Glance, 2014).
http://eands.dacnet.nic.in/PDF/Agricultural-Statistics-At-Glance2014.pdf (Accessed on 27.08.2016)

Agriculture State at a Glance: Mizoram, Vol. 1(7), 2016
ENVIS Centre on Himalayan Ecology 61
Table 7.10: Fish Production
Year Fish Production
(in Tonnes)
Marine Inland Total
2011-12 0 2,928 2,928
2012-13 0 5,430 5,430
Source: Department of Animal Husbandry, Dairying & Fisheries. Ministry of Agriculture, Department of
Agriculture & Cooperation, Directorate of Economics & Statistics
(Agricultural Statistics at a Glance, 2014).
http://eands.dacnet.nic.in/PDF/Agricultural-Statistics-At-Glance2014.pdf (Accessed on 04.8.2016)
Table 7.11: Quantity of Inland Fish Production, Fish Seed Production and Distribution
Year Fish Production inland
(Qtls.)
Fish seed production
(Lakhs)
Fish seed distribution
(Lakhs)
2003-04 33,800 150 190.65
2004-05 36,800 160 356.64
2005-06 37,500 185.42 393.43
2006-07 37,580 172 390.00
2007-08 27,646.50 165 232.50
2008-09 28,912 110 165.10
2009-10 29,160 160 229.00
2010-11 48,900 172 871.00
2011-12 49,909 645 645.00
2012-13 54,500 240 240.00
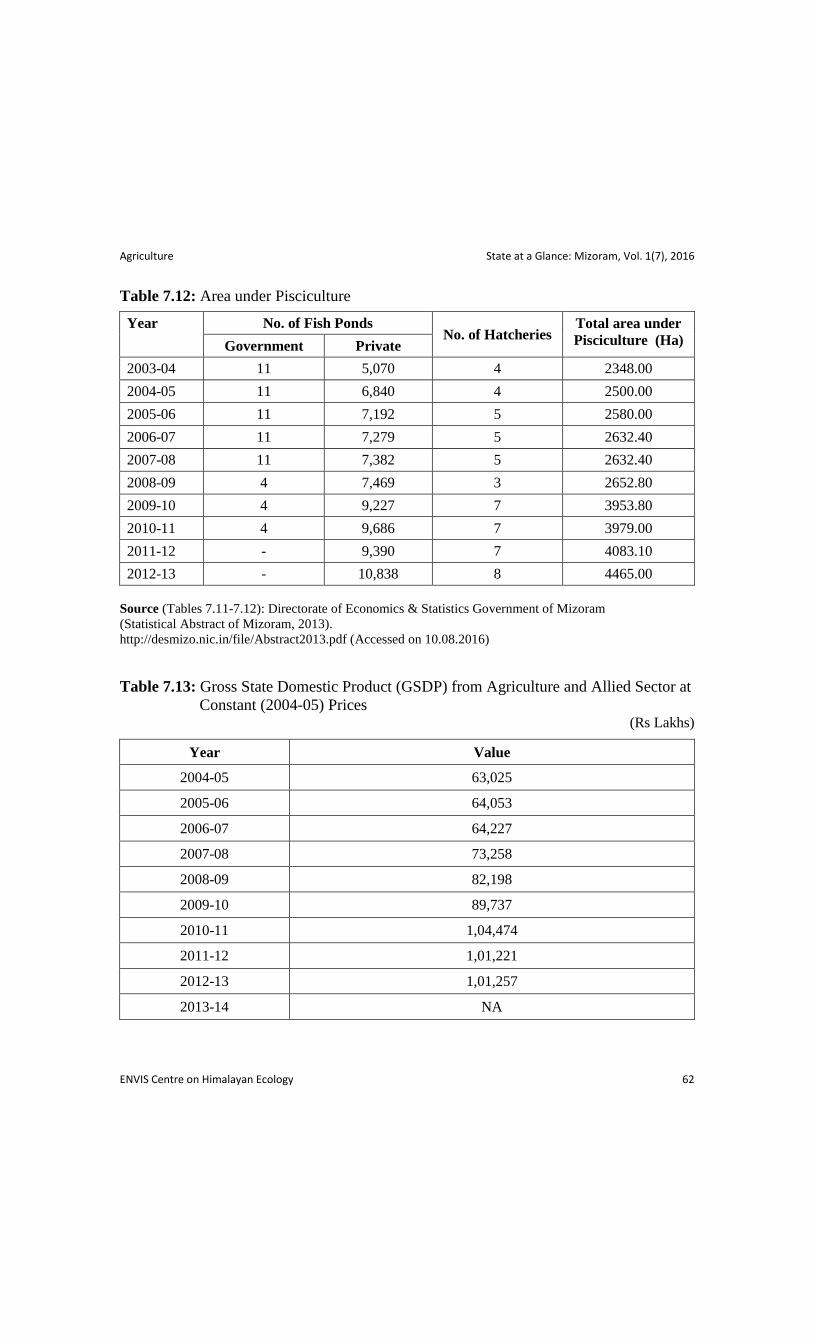
Agriculture State at a Glance: Mizoram, Vol. 1(7), 2016
ENVIS Centre on Himalayan Ecology 62
Table 7.12: Area under Pisciculture
Year No. of Fish Ponds No. of Hatcheries
Total area under
Pisciculture (Ha) Government Private
2003-04 11 5,070 4 2348.00
2004-05 11 6,840 4 2500.00
2005-06 11 7,192 5 2580.00
2006-07 11 7,279 5 2632.40
2007-08 11 7,382 5 2632.40
2008-09 4 7,469 3 2652.80
2009-10 4 9,227 7 3953.80
2010-11 4 9,686 7 3979.00
2011-12 - 9,390 7 4083.10
2012-13 - 10,838 8 4465.00
Source (Tables 7.11-7.12): Directorate of Economics & Statistics Government of Mizoram
(Statistical Abstract of Mizoram, 2013).
http://desmizo.nic.in/file/Abstract2013.pdf (Accessed on 10.08.2016)
Table 7.13: Gross State Domestic Product (GSDP) from Agriculture and Allied Sector at
Constant (2004-05) Prices (Rs Lakhs)
Year Value
2004-05 63,025
2005-06 64,053
2006-07 64,227
2007-08 73,258
2008-09 82,198
2009-10 89,737
2010-11 1,04,474
2011-12 1,01,221
2012-13 1,01,257
2013-14 NA

Agriculture State at a Glance: Mizoram, Vol. 1(7), 2016
ENVIS Centre on Himalayan Ecology 63
Table 7.14: Share of Agriculture and Allied Sector in Gross State Domestic Product
(GSDP) at Current Prices
(Rs. Lakhs)
Year GSDP from
Agriculture and
allied Sector
% Share of Agriculture
and Allied in Total GSDP
% Growth over Previous
Year
2011-12 1,37,955 20.02 -
2012-13 1,51,960 18.17 10.15
2013-14 NA NA NA
NA: Not Available. Notes: Agriculture and Allied includes Agriculture, forestry, logging and fishing.
Source (Tables 7.13-7.14): Central Statistics Office (CSO). Ministry of Agriculture, Department of
Agriculture & Cooperation, Directorate of Economics & Statistics, Govt. of India
(Agricultural Statistics at a Glance, 2014).
http://eands.dacnet.nic.in/PDF/Agricultural-Statistics-At-Glance2014.pdf (Accessed on 04.08.2016)
Tables 7.15: Number and Area of Operational Holdings for all Social Groups
(Number in ‘000; Area in ‘000 ha)
2005-06 2010-11 % Variation
Number Area Number Area Number Area
90 110 92 105 2.36 -4.61
Table 7.16: Size-wise Number and Area of Operational Holdings for all Social Groups
(2010-11)
[Number in ‘000; Area in ‘000 ha]
Marginal Small Semi Medium Medium Large
Number Area Number Area Number Area Number Area Number Area
50 30 30 38 10 24 2 9 Neg. 4

Agriculture State at a Glance: Mizoram, Vol. 1(7), 2016
ENVIS Centre on Himalayan Ecology 64
Table 7.17: Number and Area of Operational Holdings for Scheduled Tribes (ST) by all
Size Groups (2010-11) [Number in ‘000; Area in ‘000 ha]
Marginal Small Semi Medium Medium Large
Number Area Number Area Number Area Number Area Number Area
50 30 30 38 10 24 2 9 Neg. 4
Table 7.18: Percentage Distribution of Number and Area of Operational Holdings for
All Social Groups (2010-11)
Number Area
Marginal Small Semi
Medium
Medium Large Marginal Small Semi
Medium
Medium Large
54.65 32.38 10.80 1.88 0.29 28.79 36.00 22.94 8.47 3.80
Source (Tables 7.15-7.18): Department of Agriculture, Cooperation and Farmers Welfare, Ministry of
Agriculture and Farmers Welfare, Govt. of India (Agricultural Census, 2010-11).
http://agcensus.nic.in/document/agcensus2010/completereport.pdf (Accessed on 27.08.2016)
Table 7.19: Estimated Number of Rural, Agricultural and Indebted Households (2014)
Estimated Number of Rural Households (’00) 936
Estimated Number Agricultural Households (’00) 758
Estimated Number of Agricultural Households having loan (’00) 47
% of Agricultural Households Indebted 6.2
Source: NSS KI (70/33): Key Indicators of Situation of Agricultural Households in India Agricultural
Directorate of Economics and Statistics, Ministry of Agriculture, Govt. of India (Agricultural
Statistics at a Glance, 2014).
http://eands.dacnet.nic.in/latest_2006.htm (Accessed 28.08.2016)

Agriculture State at a Glance: Mizoram, Vol. 1(7), 2016
ENVIS Centre on Himalayan Ecology 65
Table 7.20: Comparison of Outlay and Expenditure in Agricultural and Allied Sector
(Rs. in crore at current prices)
Eleventh Plan Outlay
Agricultural and Allied Sector 536.31
% of Total Plan 9.6
Eleventh Plan Outlay
Agricultural and Allied Sector 387.86
% of Total Plan 7.1
Twelfth Plan Outlay
Agricultural and Allied Sector 346
% of Total Plan 2.8
Increase in Twelfth Plan over Eleventh Plan Expenditure (%) -
Source: Department of Agriculture and Cooperation, Directorate of Economics and Statistics, Govt. of
India; 12th
Plan Document, Planning Commission (Pocket Book of Agricultural Statistics, 2014)
http://eands.dacnet.nic.in/PDF/Pocket-Book2014.pdf (Accessed on 29.08.2016)
Table 7.21: Number of Kisan Credit Cards Issued up to 31 March 2014
Bank Number of Kisan Credit Cards
Cooperative Banks 616
Regional Rural Banks 6,586
Commercial Banks 23,688
Total 30,890
Source: Department of Agriculture, Cooperation and Welfare, Ministry of Agriculture and Farmers
Welfare, Govt. of India (Agricultural Statistics at a Glance, 2014).
http://eands.dacnet.nic.in/PDF/Agricultural-Statistics-At-Glance2014.pdf (Accessed on 27.08.2016)
Horticulture State at a Glance: Mizoram, Vol. 1(7), 2016
ENVIS Centre on Himalayan Ecology 67
Horticulture
List of Tables
8.1: Area, Production and Productivity of Fruits
8.2: Area and Production of different Fruits
8.3: Area, Production and Productivity of Vegetables
8.4: Area and Production of different Vegetables
8.5: Area and Production of various Horticulture Crops
8.6: Area, Production and Productivity of Flowers
8.7: Area and Production of Flowers
8.8: Area and Production of Roots & Tubers
8.9: Area, Production & Productivity of Major Spices
8.10: Area, Production & Average Yield of Important Horticulture Crops

Horticulture State at a Glance: Mizoram, Vol. 1(7), 2016
ENVIS Centre on Himalayan Ecology 68
Table 8.1: Area, Production and Productivity of Fruits
Year Area (‘000 ha) Production(in ‘000 MT) Productivity (in MT/ha)
2009-10 27.1 328.3 12.1
2010-11 27.0 211.5 7.8
2011-12 43.7 275.7 6.3
2012-13 37.2 293.0 5.9
2013-14 57.6 343.9 6.0
Source: National Horticulture Board, Ministry of Agriculture, Govt. of India
(Indian Horticulture Database, 2013, 2014).
http://nhb.gov.in/PDFViwer.aspx?enc=3ZOO8K5CzcdC/Yq6HcdIxC0U1kZZenFuNVXacDLxz28=
(Accessed on 27.06.2016)
Table 8.2: Area and Production of different Fruits, Part-A [Area in '000 ha; Production in '000 Tonne]
Year 2009-10 2010-11 2011-12 2012-13 2013-14 2014-15
Apple Area - - - - - -
Production - - - - - -
Pear Area - - - - 0.001 0.007
Production - - - - 0.005 0.04
Peach Area - - - 0.05 0.075 0.12
Production - - - 0.38 0.577 0.92
Plum Area - - - 0.12 0.145 0.173
Production - - - 1.10 1.348 1.61
Pomegranate Area - - - 0.01 0.01 0.013
Production - - - 0.02 0.02 0.03
Strawberry Area - - - - 0.001 0.143
Production - - - - 0.02 2.86
Guava Area - 0.4 0.4 0.4 0.4 0.4
Production - 2.3 2.4 2.5 2.5 2.6
Litchi Area - 0.4 0.4 0.4 0.4 0.5
Production - 1.6 1.7 1.7 1.7 1.9
Mango Area - 0.7 0.7 0.8 0.8 0.9
Production - 2.9 3.1 3.5 3.7 4.2
Pineapple Area 0.4 1.5 2.7 3.0 4.1 4.9
Production 6.3 13.6 19.7 22.0 30.1 32.9
Pomegranate Area - - - 0.0 0.0 0.0
Production - - 0.1 0.0 0.0 0.0
Banana Area 8.7 10.0 10.1 10.5 10.8 10.9
Production 207.7 118.6 119.1 127.5 140.9 141.0
Grapes Area 1.2 1.6 1.9 2.4 2.5 2.5
Production 18.4 20.4 24.3 20.8 23.9 22.6
Papaya Area 0.8 0.8 0.9 1.0 1.1 1.3
Production 20.3 6.8 18.2 23.1 24.6 26.5
Sapota Area - 3.4 - 0.0 0.0 0.0
Production - 17.0 - 0.0 0.0 0.0
Source: Horticulture Statistics Division, Department of Agriculture, Cooperation and Farmers Welfare. Ministry of
Statistics & Programme Implementation; Ministry of Agriculture, Govt. of India (Statistical Year Book India,
2016), Government of Mizoram (Economic Survey, 2014-15).
http://www.mospi.gov.in/statistical-year-book-india/2016
http://www.mizofin.nic.in/file/b%2015-16/Mizoram%20Economic%20Survey%202014-15.pdf
(Accessed on 03.06.2016)

Horticulture State at a Glance: Mizoram, Vol. 1(7), 2016
ENVIS Centre on Himalayan Ecology 69
Table 8.2: Area and Production of different Fruits, Part-B [Area in '000 ha; Production in '000 Tonne]
Year 2009-10 2010-11 2011-12 2012-13 2013-14 2014-15
Avocado Area - - - 0.31 0.32 0.35
Production - - - 5.08 5.25 5.74
Aonla Area - - - 0.21 0.275 0.3
Production - - - 0.9 1.21 1.32
Lime / Lemon Area - - - 7.93 8 8.07
Production - - - 25.14 25.6 25.82
Mandarin
Orange
Area - - - 8.96 13.508 18.59
Production - - - 24.1 40.43 55.96
Sweet Orange
(Mosambi)
Area - - - 1.5 1.52 1.59
Production - - - 4.65 4.864 5.09
Custard apple Area - - - 0.003 0.003 0.003
Production - - - 0.01 0.01 0.01
Jackfruit Area - - - 0.05 0.05 0.051
Production - - - 2.48 2.5 2.55
Kiwi Area - - - 0.2 0.25 0.29
Production - - - 0.69 0.875 1.02
Passionate
fruit
Area - - - 0.7 0.838 0.986
Production - - - 1.47 1.94 2.29
Tamarind Area - - - 0.01 0.01 0.011
Production - - - 0.02 0.026 0.03
Source: Horticulture Statistics Division, Department of Agriculture, Cooperation and Farmers Welfare. Ministry of
Statistics & Programme Implementation; Ministry of Agriculture, Govt. of India
(Statistical Year Book India, 2016), Government of Mizoram (Economic Survey, 2014-15).
http://www.mospi.gov.in/statistical-year-book-india/2016
http://www.mizofin.nic.in/file/b%2015-16/Mizoram%20Economic%20Survey%202014-15.pdf
(Accessed on 03.06.2016)
Table 8.3: Area, Production and Productivity of Vegetables
Year Area
(‘000 ha)
Production
(in ‘000 MT)
Productivity
(in MT/ha)
2008-09 14.4 114.4 7.9
2009-10 10.6 179.1 16.9
2010-11 17.5 115.6 6.6
2011-12 37.4 221.1 5.9
2012-13 39.3 236.7 6.0
2013-14 41.1 254.1 6.2
Source: National Horticulture Board, Ministry of Agriculture, Govt. of India
(Indian Horticulture Database, 2011, 2013, 2014).
http://nhb.gov.in/PDFViwer.aspx?enc=3ZOO8K5CzcdC/Yq6HcdIxC0U1kZZenFuNVXacDLxz28=
(Accessed on 27.06.2016)
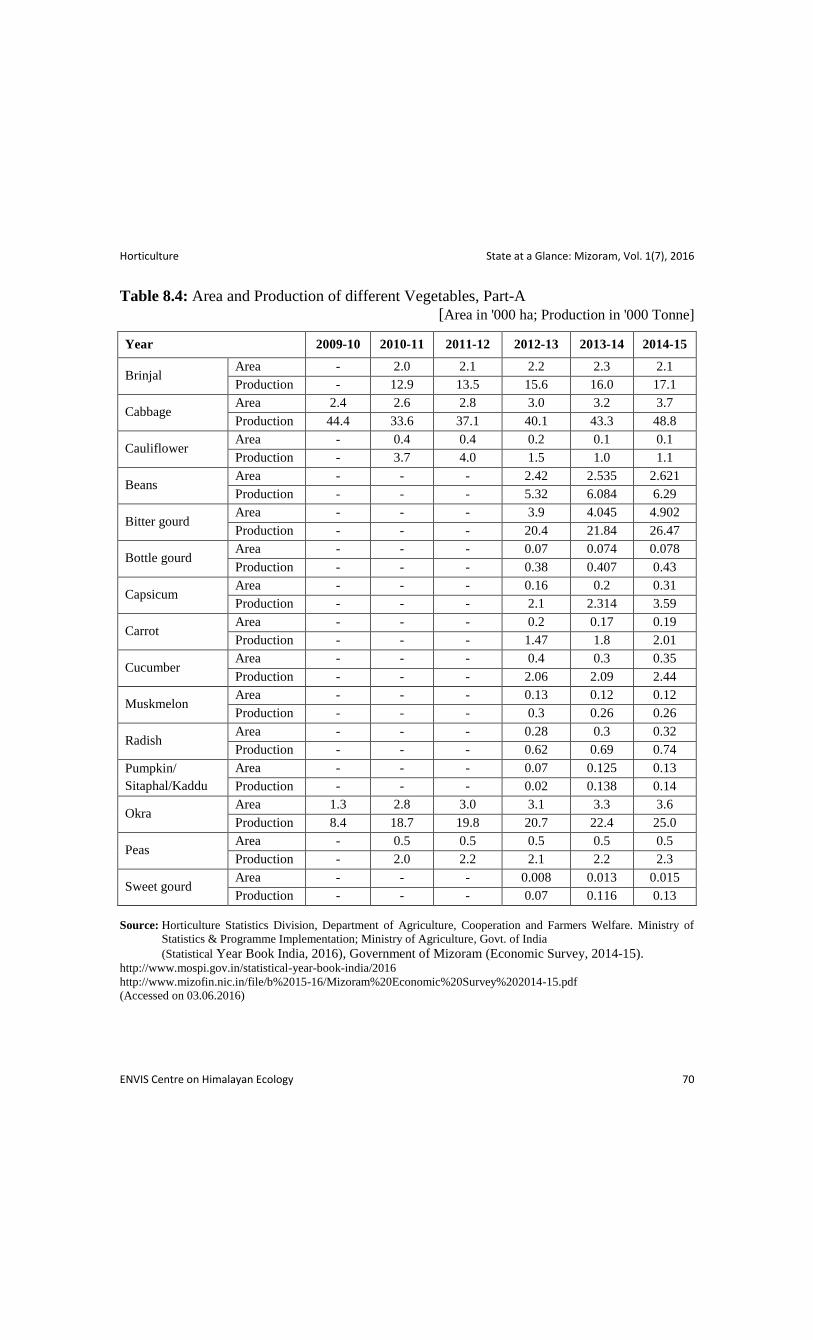
Horticulture State at a Glance: Mizoram, Vol. 1(7), 2016
ENVIS Centre on Himalayan Ecology 70
Table 8.4: Area and Production of different Vegetables, Part-A
[Area in '000 ha; Production in '000 Tonne]
Year 2009-10 2010-11 2011-12 2012-13 2013-14 2014-15
Brinjal Area - 2.0 2.1 2.2 2.3 2.1
Production - 12.9 13.5 15.6 16.0 17.1
Cabbage Area 2.4 2.6 2.8 3.0 3.2 3.7
Production 44.4 33.6 37.1 40.1 43.3 48.8
Cauliflower Area - 0.4 0.4 0.2 0.1 0.1
Production - 3.7 4.0 1.5 1.0 1.1
Beans Area - - - 2.42 2.535 2.621
Production - - - 5.32 6.084 6.29
Bitter gourd Area - - - 3.9 4.045 4.902
Production - - - 20.4 21.84 26.47
Bottle gourd Area - - - 0.07 0.074 0.078
Production - - - 0.38 0.407 0.43
Capsicum Area - - - 0.16 0.2 0.31
Production - - - 2.1 2.314 3.59
Carrot Area - - - 0.2 0.17 0.19
Production - - - 1.47 1.8 2.01
Cucumber Area - - - 0.4 0.3 0.35
Production - - - 2.06 2.09 2.44
Muskmelon Area - - - 0.13 0.12 0.12
Production - - - 0.3 0.26 0.26
Radish Area - - - 0.28 0.3 0.32
Production - - - 0.62 0.69 0.74
Pumpkin/
Sitaphal/Kaddu
Area - - - 0.07 0.125 0.13
Production - - - 0.02 0.138 0.14
Okra Area 1.3 2.8 3.0 3.1 3.3 3.6
Production 8.4 18.7 19.8 20.7 22.4 25.0
Peas Area - 0.5 0.5 0.5 0.5 0.5
Production - 2.0 2.2 2.1 2.2 2.3
Sweet gourd Area - - - 0.008 0.013 0.015
Production - - - 0.07 0.116 0.13
Source: Horticulture Statistics Division, Department of Agriculture, Cooperation and Farmers Welfare. Ministry of
Statistics & Programme Implementation; Ministry of Agriculture, Govt. of India
(Statistical Year Book India, 2016), Government of Mizoram (Economic Survey, 2014-15). http://www.mospi.gov.in/statistical-year-book-india/2016
http://www.mizofin.nic.in/file/b%2015-16/Mizoram%20Economic%20Survey%202014-15.pdf
(Accessed on 03.06.2016)

Horticulture State at a Glance: Mizoram, Vol. 1(7), 2016
ENVIS Centre on Himalayan Ecology 71
Table 8.4: Area and Production of different Vegetables, Part-B
[Area in '000 Hectare; Production in '000 Tonne]
Year 2009-10 2010-11 2011-12 2012-13 2013-14 2014-15
Tomato Area 0.6 0.7 0.7 0.8 0.9 1.1
Production 6.7 6.2 6.4 7.4 8.3 10.1
Onion Area - 0.1 0.5 0.4 0.4 1.3
Production - 0.7 4.4 4.0 3.7 10.0
Potato Area 1.5 2.0 0.2 0.3 0.2 0.1
Production 20.9 2.3 2.5 3.2 3.0 1.4
Sweet Potato Area - 0.1 0.1 0.2 0.2 0.2
Production - 0.7 0.7 1.1 1.2 1.2
Tapioca Area - 0.1 0.1 - 0.1 0.1
Production - 0.7 1.0 - 1.9 1.9
Watermelon Area - - - 0.35 0.30 0.32
Production - - - 0.10 0.88 0.94
Cowpea Area - - - 2.55 2.64 2.75
Production - - - 5.97 6.336 6.6
Chayote Area - - - 4.5 4.86 4.782
Production - - - 75.02 80.02 81.92
Snake gourd Area - - - 0.04 0.045 0.036
Production - - - 0.02 0.017 0.02
Pakchoi Area - - - - 0.02 0.024
Production - - - - 0.3 0.36
Knolkhol Area - - - 0.38 0.4 0.42
Production - - - 2.74 2.92 3.07
Broccoli Area - - - 0.72 0.77 0.82
Production - - - 5.47 5.87 6.25
Others Area 4.7 - 27.1 28.8 29.9 31.2
Production 98.7 - 129.5 141.1 151.1 154.8
Others (local
Vegetables)
Area - - - 11.46 13.12 13.15
Production - - - 9.62 10.81 11.7
Source: Horticulture Statistics Division, Department of Agriculture, Cooperation and Farmers Welfare. Ministry of
Statistics & Programme Implementation; Ministry of Agriculture, Govt. of India
(Statistical Year Book India, 2016), Government of Mizoram (Economic Survey, 2014-15).
http://www.mospi.gov.in/statistical-year-book-india/2016
http://www.mizofin.nic.in/file/b%2015-16/Mizoram%20Economic%20Survey%202014-15.pdf
(Accessed on 03.06.2016)

Horticulture State at a Glance: Mizoram, Vol. 1(7), 2016
ENVIS Centre on Himalayan Ecology 72
Table 8.5: Area and Production of various Horticulture Crops
[A=Area in '000 ha; P=Production in '000 Tonne]
Year 2009-10 2010-11 2011-12 2012-13 2013-14 2014-15
Fruits Area 27.10 27.00 43.68 49.68 57.55 60.27
Production 328.30 211.50 275.71 292.95 343.90 350.91
Vegetables Area 10.60 17.50 37.42 39.33 41.10 44.03
Production 179.10 115.60 221.00 236.68 254.14 273.76
Flowers Area - 0.10 0.13 0.16 0.20 0.20
Production - 0.00 0.00 166.83 171.57 181.54
Nuts Area - - - - - -
Production - - - - - -
Aroma &
Medicinal
Area 1.90 1.90 0.02 1.02 1.11 1.10
Production 13.90 13.90 0.06 0.71 0.90 0.95
Plantation
Crops
Area 6.60 6.60 5.03 7.59 7.60 10.78
Production 8.20 8.20 14.45 4.38 4.40 7.38
Spices Area 22.70 21.40 20.65 22.47 22.47 23.30
Production 80.60 110.50 114.98 59.62 59.62 65.72
Mushroom Production - - - - - -
Honey Production - - - - - -
Grand Total Area 68.90 74.50 106.93 120.25 130.03 139.68
Production 610.10 459.70 626.20 761.16 835.75 882.10
Source: Horticulture Statistics Division, Department of Agriculture, Cooperation and Farmers Welfare. Ministry of
Statistics & Programme Implementation; Ministry of Agriculture, Govt. of India (Statistical Year Book India,
2016).
http://www.mospi.gov.in/statistical-year-book-india/2016 (Accessed on 03.06.2016)
Table 8.6: Area, Production and Productivity of Flowers
Year Area
(‘000 ha)
Production (Loose in '000 MT) & (Cut in Lakh Nos.)
Loose Cut
2008-09 0.2 0.00 168.0
2009-10 0.0 0.00 142.0
2010-11 0.1 0.00 162.0
2011-12 0.1 0.00 349.0
2012-13 0.0 166.8 605.2
2013-14 0.2 171.6 1.2
Source: National Horticulture Board, Ministry of Agriculture, Govt. of India
(Indian Horticulture Database, 2011, 2013, 2014).
http://nhb.gov.in/PDFViwer.aspx?enc=3ZOO8K5CzcdC/Yq6HcdIxC0U1kZZenFuNVXacDLxz28=
(Accessed on 27.06.2016)

Horticulture State at a Glance: Mizoram, Vol. 1(7), 2016
ENVIS Centre on Himalayan Ecology 73
Table 8.7:Area and Production of Flowers
[Area = 000‘Ha. Production = 000‘Mt.]
Crops 2012-2013 2013-2014 2014-2015
Area Production Area Production Area Production
Anthurium 0.051 141.27 0.36 83.42 0.108 180.67
Rose 0.010 45.8 0.02 60.1 0.03 90.15
Orchids 0.012 0.77 0.02 0.79 0.029 1.15
Gerbera 0.023 32.20 0.023 32.4 0.025 35.22
Carnation - - 0.025 23.1 0.025 23.10
Nerine (Dafodil) - - 0.03 0.1 0.003 0.10
Others 0.067 166.83 0.071 171.47 0.086 207.70
Total 0.163 386.87 0.311 612.66 0.306 538.08
Table 8.8:Area and Production of Roots & Tubers
[Area = 000‘Ha. Production = 000‘Mt.]
Crops 2012-2013 2013-2014 2014-2015
Area Production Area Production Area Production
Potato 0.25 3.15 0.24 3 0.25 3.13
Sweet Potato 0.17 1.09 0.19 1.235 0.25 1.63
Tapioca 0.13 1.89 0.13 1.9 0.13 1.90
Colocasia 0.95 6.95 1.01 7.57 1.05 7.88
Others (Telhawng) 0.09 0.56 0.1 0.63 0.12 0.76
Total 1.59 13.64 1.69 14.705 1.8 15.28
Source (Tables 8.7-8.8): Planning & Programme Implementation Department, Government of Mizoram
(Economic Survey, 2014–15).
http://www.mizofin.nic.in/file/b%2015-16/Mizoram%20Economic%20Survey%202014-15.pdf
(Accessed on 10.08.2016)

Horticulture State at a Glance: Mizoram, Vol. 1(7), 2016
ENVIS Centre on Himalayan Ecology 74
Table 8.9: Area, Production & Productivity of Major Spices
Year
Area
(‘000 ha)
Production
('000 MT)
Productivity
(in MT/ha)
2008-09 5.1 24.5 4.8
2009-10 5.1 24.5 4.8
2010-11 21.4 110.5 5.2
2011-12 20.6 115.0 5.6
2012-13 22.5 59.6 2.7
2013-14 22.5 59.6 2.7
Source: National Horticulture Board, Ministry of Agriculture, Govt. of India
(Indian Horticulture Database, 2011, 2013, 2014).
http://nhb.gov.in/PDFViwer.aspx?enc=3ZOO8K5CzcdC/Yq6HcdIxC0U1kZZenFuNVXacDLxz28=
(Accessed on 27.06.2016)

Horticulture State at a Glance: Mizoram, Vol. 1(7), 2016
ENVIS Centre on Himalayan Ecology 75
Table 8.10: Area, Production & Average Yield of Important Horticulture Crops
[A(Area) = ‘000 ha; P(Production)= ‘000MT; Y(Yield)=MT/ha]
Year 2003-04 2004-05 2005-06 2006-07 2007-08 2008-09 2009-10 2010-11 2011-12 2012-13
Orange
A 5400 4409 5258 5395 6395 8275 5348 6516 8360 8960
P 18930 26233 33020 34366 11567 10757 13265 19700 22230 24100
Y 3.50 5.95 6.28 637 1.80 1.30 2.48 2.48 2.65 2.69
Banana
A 3384 3820 4520 5020 6220 7220 8660 10040 10090 10540
P 59287 83046 104818 119676 98800 66424 84810 115360 119060 127534
Y 17.52 21.74 23.19 23.84 15.88 9.20 9.80 11.49 2.65 12.10
Grape
A 18 38 107 276 276 1172 1232 1575 1880 2380
P 212 447 1521 4217 10416 9962 13736 19609 24300 20801
Y 11.70 11.70 14.20 15.20 15.50 8.50 11.15 12.45 12.93 8.74
Cabbage
A 209 310 275 236 200 2985 2400 2600 2800 3020
P 3284 4736 4287 3684 5000 38805 21600 33462 37100 40080
Y 15.70 15.20 15.50 15.60 25.00 13.00 9.00 12.87 13.25 13.27
Passion
Fruit
A 520 729 929 1109 8944 4084 3150 1522 450 700
P 1461 2282 3354 4979 44720 13530 164111 6220 900 1470
Y 2.81 3.13 3.61 4.49 5.00 3.31 5.21 4.10 2.00 2.10
Tomato
A 18 20 16 17 17 620 635 675 700 800
P 307 304 274 225 298 4960 5715 6075 6420 7390
Y 16.25 18.80 19.74 23.70 17.50 8.00 9.00 9.00 9.17 9.24
Birdeye
Chilly
A 673 702 714 792 100 7185 8700 8815 8900 9020
P 646 687 721 1077 200 24429 47850 48483 9790 8208
Y 0.96 0.98 1.01 1.36 2.00 3.40 5.50 5.50 1.10 0.91
Chow A 580 583 604 664 714 3200 2250 3500 4000 4500
Ho
rticultu
re State at a G
lance: M
izoram
, Vo
l. 1(7
), 20
16
ENV
IS Cen
tre on
Him
alayan Eco
logy
75
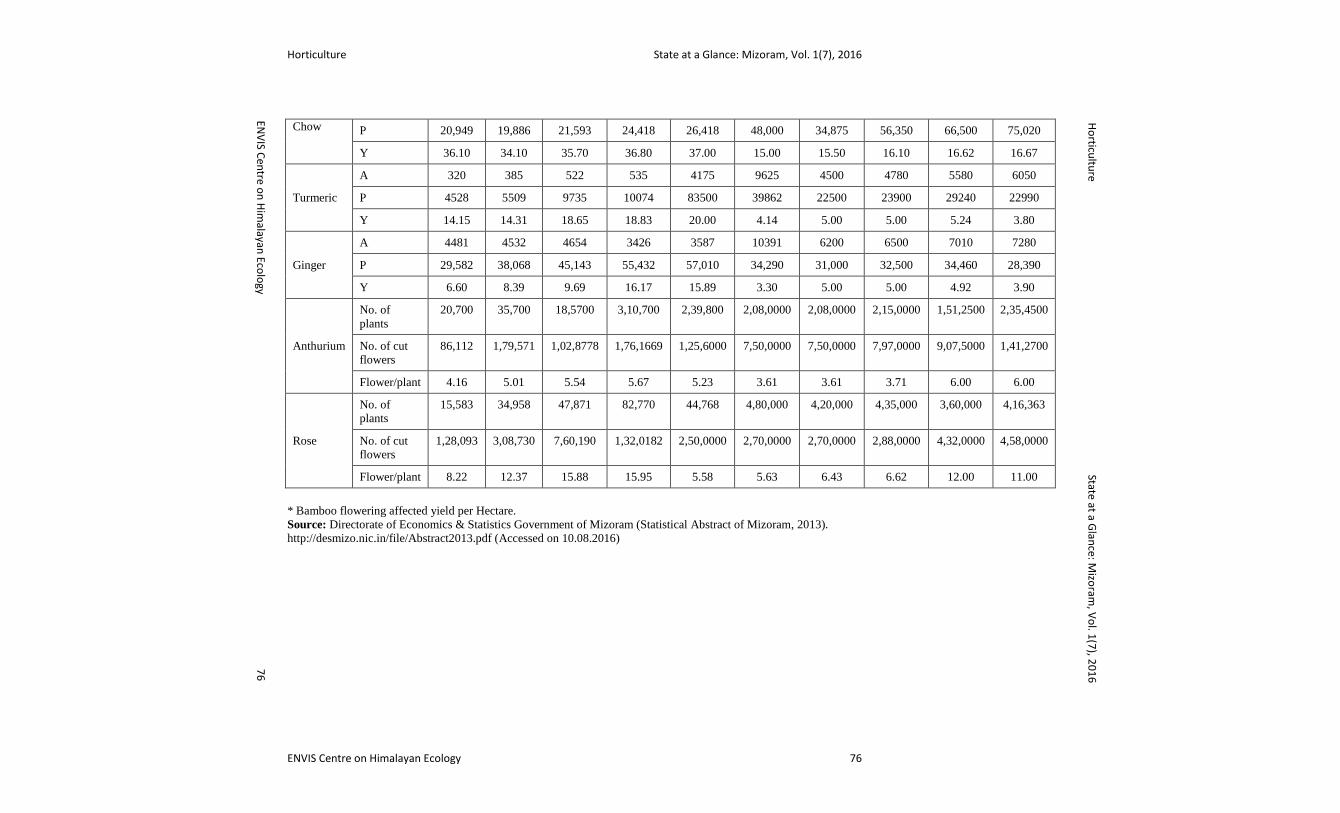
Horticulture State at a Glance: Mizoram, Vol. 1(7), 2016
ENVIS Centre on Himalayan Ecology 76
Chow P 20,949 19,886 21,593 24,418 26,418 48,000 34,875 56,350 66,500 75,020
Y 36.10 34.10 35.70 36.80 37.00 15.00 15.50 16.10 16.62 16.67
Turmeric
A 320 385 522 535 4175 9625 4500 4780 5580 6050
P 4528 5509 9735 10074 83500 39862 22500 23900 29240 22990
Y 14.15 14.31 18.65 18.83 20.00 4.14 5.00 5.00 5.24 3.80
Ginger
A 4481 4532 4654 3426 3587 10391 6200 6500 7010 7280
P 29,582 38,068 45,143 55,432 57,010 34,290 31,000 32,500 34,460 28,390
Y 6.60 8.39 9.69 16.17 15.89 3.30 5.00 5.00 4.92 3.90
Anthurium
No. of
plants
20,700 35,700 18,5700 3,10,700 2,39,800 2,08,0000 2,08,0000 2,15,0000 1,51,2500 2,35,4500
No. of cut
flowers
86,112 1,79,571 1,02,8778 1,76,1669 1,25,6000 7,50,0000 7,50,0000 7,97,0000 9,07,5000 1,41,2700
Flower/plant 4.16 5.01 5.54 5.67 5.23 3.61 3.61 3.71 6.00 6.00
Rose
No. of
plants
15,583 34,958 47,871 82,770 44,768 4,80,000 4,20,000 4,35,000 3,60,000 4,16,363
No. of cut
flowers
1,28,093 3,08,730 7,60,190 1,32,0182 2,50,0000 2,70,0000 2,70,0000 2,88,0000 4,32,0000 4,58,0000
Flower/plant 8.22 12.37 15.88 15.95 5.58 5.63 6.43 6.62 12.00 11.00
* Bamboo flowering affected yield per Hectare.
Source: Directorate of Economics & Statistics Government of Mizoram (Statistical Abstract of Mizoram, 2013).
http://desmizo.nic.in/file/Abstract2013.pdf (Accessed on 10.08.2016)
Ho
rticultu
re State at a G
lance: M
izoram
, Vo
l. 1(7
), 20
16
ENV
IS Cen
tre on
Him
alayan Eco
logy
76
Livestock State at a Glance: Mizoram, Vol. 1(7), 2016
ENVIS Centre on Himalayan Ecology 77
Livestock 9.1: Livestock Population
9.2: Estimates of Milk, Egg & Meat Production
9.3: Milk Production by Cows and Buffaloes
9.4: Per Capita Availability of Milk and Eggs
9.5: Estimates of Egg Production from Fowls
9.6: Backyard Poultry in Rural and Urban Combined for Fowls for Fowls under
Chickens
9.7: Number of Households and Households Enterprises Owning Animals/Poultry
Birds
9.8: Details of Bovines by Sex
9.9: Number of Cattle, Buffaloes, Sheep, Goats and Pigs per Thousand Households
9.10: Buffaloes by Age, Sex and Use in Rural and Urban Combined for Male & Female
9.11: Sheep by Age and Sex in Rural and Urban Combined for Exotic/ Crossbred for
Indigenous and Total Sheep
9.12: Goats by Age, Sex and Use in Rural and Urban Combined
9.13: Pigs by age and sex in Rural and Urban Combined for Exotic/Crossbred for
Indigenous and total Pigs
9.14: Horses & Ponies by Age, Sex and Use in Rural and Urban Combined
9.15: Mules and Donkeys by age and sex in Rural and Urban Combined
9.16: Dogs, Rabbits and Elephants in Rural and Urban Combined
9.17: Estimate of Meat Production from Pigs and Poultry
9.18: Veterinary Institutions
9.19: Artificial Inseminations Performed
9.20: Animals Insured under Livestock Insurance Scheme
9.21: Estimates of Major Livestock Products
9.22: Funds Released under Central Sector Scheme of Integrated Sample Survey for
Estimation of major Livestock Products

Livestock State at a Glance: Mizoram, Vol. 1(7), 2016
ENVIS Centre on Himalayan Ecology 78
Table 9.1: Livestock Population (Nos. in ‘000)
Year Cattle
Buffalos Goats Sheep Pigs
Horses
&
Ponies
Mules Mithun Donkeys Yak Camel
Total
Livestock
CB ND Total
2003 9 27 36 6 17 1 218 2 0.04 2 - - - 280.0
2007 10.73 24.20 34.93 5.83 15.71 0.97 267.36 1.39 - 1.94 - - - 328.14
2012 11.30 23.28 34.57 5.17 22.21 0.65 245.24 0.72 0.01 3.29 0.00 0.00 0.00 311.86
CB- Crossbred, ND- Nondescript
Table 9.2: Estimates of Milk, Egg & Meat Production
Year Milk Production
(‘000 Tonnes)
Egg Production
(Lakh Nos.)
Meat Production*
(‘000 Tonnes)
2009-10 10.63 370.92 10.23
2010-11 11.43 387.32 9.70
2011-12 13.91 349.33 13.16
2012-13 13.63 352.02 12.08
2013-14 15.30 362.31 12.19
*Meat production from recognized sectors
Source (Tables 9.1-9.2): Department of Animal husbandry, Dairying and Fisheries, Ministry of Agriculture, Govt. of India
(Basic Animal Husbandry and Fisheries Statistics, 2010, 2012, 2013, 2014, 2015).
http://dahd.nic.in/Division/statistics/animal-husbandry-statistics-division (Accessed on 20.08.2016)
Livestock
State at a Glan
ce: Mizo
ram, V
ol. 1
(7), 2
01
6
ENV
IS Cen
tre on
Him
alayan Eco
logy
78

Livestock State at a Glance: Mizoram, Vol. 1(7), 2016
ENVIS Centre on Himalayan Ecology 79
Table 9.3: Milk Production by Cows and Buffaloes
(‘000 Tonnes)
Year Cows
Buffaloes Goat
Total Crossbred (CB) Nondescript (ND) Total
2009-10 6.87 3.15 10.02 0.61 - 10.63
2010-11 7.71 3.12 10.83 0.60 - 11.43
2011-12 12.00 2.00 14.00 0.01 - 14.01
2012-13 11.99 1.64 13.63 -- -- 13.63
2013-14 13.63 1.67 15.30 - - 15.30
Table 9.4: Per Capita Availability of Milk and Eggs
Year Per Capita Availability
Milk (gm/day) Eggs (Number/Annum)
2009-10 29 38
2010-11 31 39
2011-12 35 32
2012-13 36 34
2013-14 40 35
Table 9.5: Estimates of Egg Production from Fowls
Year
Fowls
Estimated Number
of Layers (‘000)
Average Yield/Year
(Number)
Egg Production
(Lakh Nos.)
2009-10 327.00 113.43 370.92
2010-11 332.00 116.66 387.32
2011-12 335.71 104.06 349.33
2012-13 339.00 103.84 352.02
2013-14 343.45 105.49 362.31
Source (Tables 9.3-9.5): Department of Animal Husbandry, Dairying and Fisheries, Ministry of
Agriculture, Govt. of India (Basic Animal Husbandry and Fisheries Statistics, 2015).
http://dahd.nic.in/Division/statistics/animal-husbandry-statistics-division (Accessed on 20.08.2016)
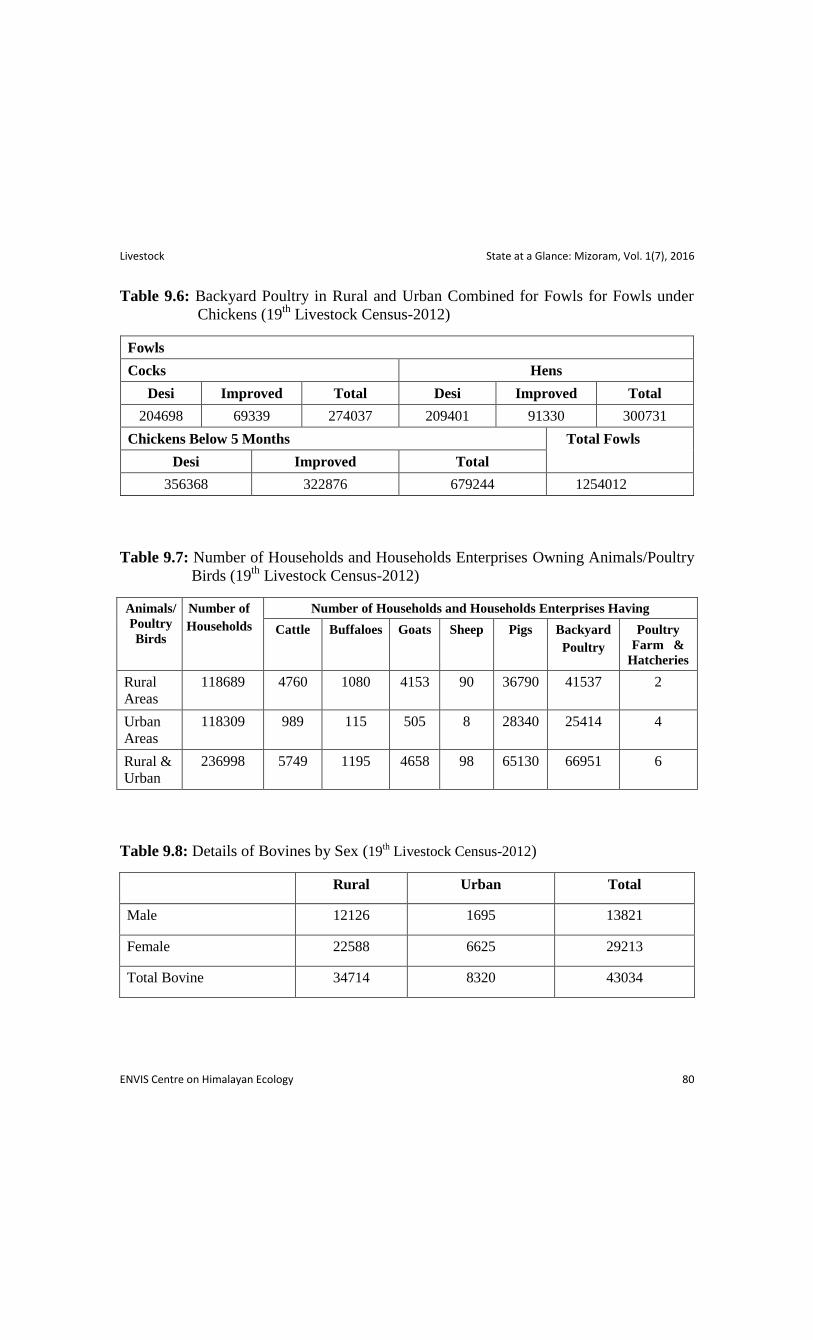
Livestock State at a Glance: Mizoram, Vol. 1(7), 2016
ENVIS Centre on Himalayan Ecology 80
Table 9.6: Backyard Poultry in Rural and Urban Combined for Fowls for Fowls under
Chickens (19th
Livestock Census-2012)
Fowls
Cocks Hens
Desi Improved Total Desi Improved Total
204698 69339 274037 209401 91330 300731
Chickens Below 5 Months Total Fowls
Desi Improved Total
356368 322876 679244 1254012
Table 9.7: Number of Households and Households Enterprises Owning Animals/Poultry
Birds (19th
Livestock Census-2012)
Animals/
Poultry
Birds
Number of
Households
Number of Households and Households Enterprises Having
Cattle Buffaloes Goats Sheep Pigs Backyard
Poultry
Poultry
Farm &
Hatcheries
Rural
Areas
118689 4760 1080 4153 90 36790 41537 2
Urban
Areas
118309 989 115 505 8 28340 25414 4
Rural &
Urban
236998 5749 1195 4658 98 65130 66951 6
Table 9.8: Details of Bovines by Sex (19
th Livestock Census-2012)
Rural Urban Total
Male 12126 1695 13821
Female 22588 6625 29213
Total Bovine 34714 8320 43034
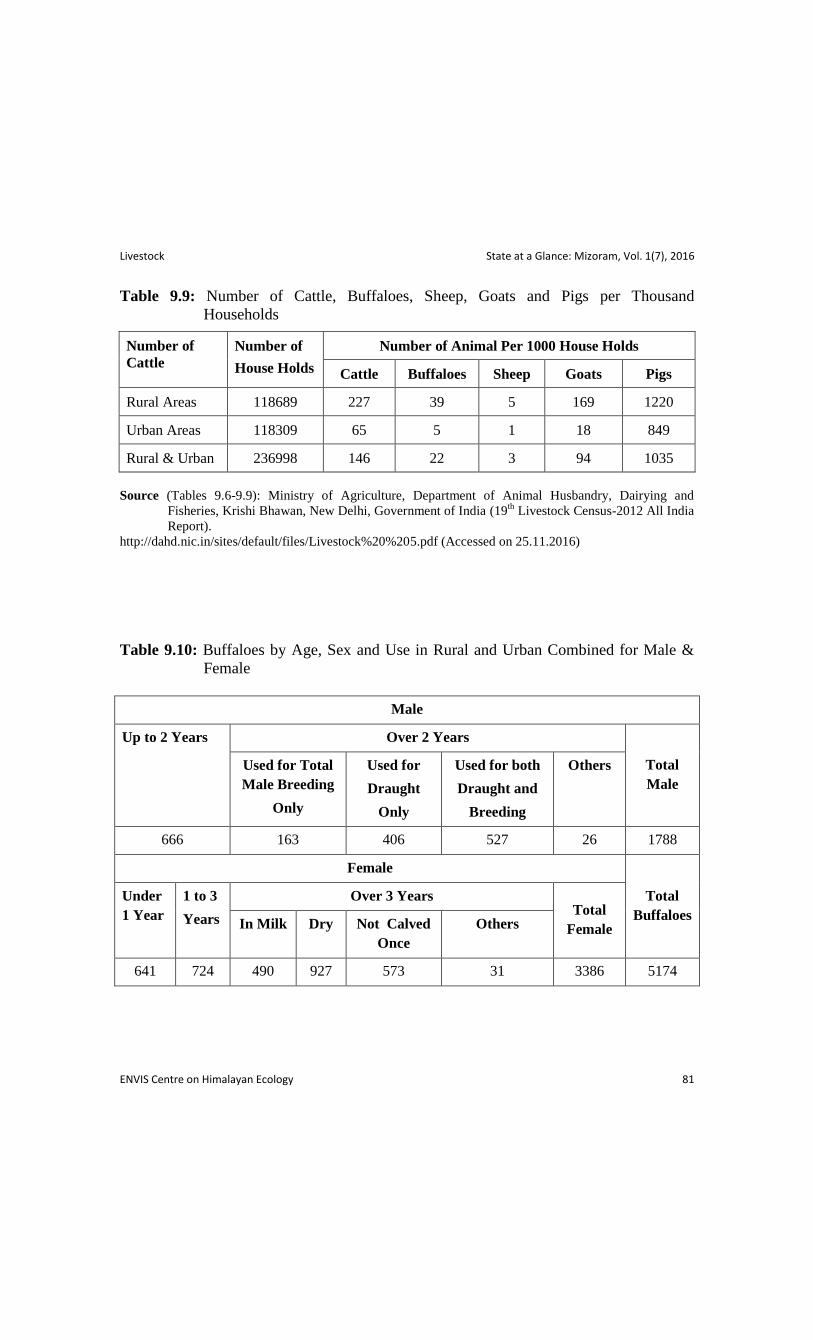
Livestock State at a Glance: Mizoram, Vol. 1(7), 2016
ENVIS Centre on Himalayan Ecology 81
Table 9.9: Number of Cattle, Buffaloes, Sheep, Goats and Pigs per Thousand
Households
Number of
Cattle
Number of
House Holds
Number of Animal Per 1000 House Holds
Cattle Buffaloes Sheep Goats Pigs
Rural Areas 118689 227 39 5 169 1220
Urban Areas 118309 65 5 1 18 849
Rural & Urban 236998 146 22 3 94 1035
Source (Tables 9.6-9.9): Ministry of Agriculture, Department of Animal Husbandry, Dairying and
Fisheries, Krishi Bhawan, New Delhi, Government of India (19th
Livestock Census-2012 All India
Report).
http://dahd.nic.in/sites/default/files/Livestock%20%205.pdf (Accessed on 25.11.2016)
Table 9.10: Buffaloes by Age, Sex and Use in Rural and Urban Combined for Male &
Female
Male
Up to 2 Years Over 2 Years
Total
Male
Used for Total
Male Breeding
Only
Used for
Draught
Only
Used for both
Draught and
Breeding
Others
666 163 406 527 26 1788
Female
Total
Buffaloes
Under
1 Year
1 to 3
Years
Over 3 Years Total
Female In Milk Dry Not Calved
Once
Others
641 724 490 927 573 31 3386 5174

Livestock State at a Glance: Mizoram, Vol. 1(7), 2016
ENVIS Centre on Himalayan Ecology 82
Table 9.11: Sheep by Age and Sex in Rural and Urban Combined for Exotic/ Crossbred
for Indigenous and Total Sheep
Exotic / Crossbred Sheep
Total Exotic /
Crossbred Sheep
Male Female
Under 1
year
1 Year
and
Above
Total Under 1
year
1 Year and
Above
Total
78 163 241 75 267 342 583
Indigenous Sheep
Total
Indigenous
Sheep
Total
Sheep
Male Female
Under 1
year
1 Year
and
Above
Total
Indigenous
Sheep
Under 1
year
1 Year and
Above
Total
17 12 29 15 23 38 67 650
Table 9.12: Goats by Age, Sex and Use in Rural and Urban Combined
Male Female
Total
Goats Under 1
Year
1 Year
and Above Total
Under
1 Year
1 Year and Above
Total In Milk Dry
Not Calved
Once
3859 4463 8322 3896 3436 3741 2811 13884 22206
Source (Tables 9.10-9.12): Ministry of Agriculture, Department of Animal Husbandry, Dairying and
Fisheries, Krishi Bhawan, New Delhi, Government of India (19th
Livestock Census-2012 All India
Report).
http://dahd.nic.in/sites/default/files/Livestock%20%205.pdf (Accessed on 25.11.2016)

Livestock State at a Glance: Mizoram, Vol. 1(7), 2016
ENVIS Centre on Himalayan Ecology 83
Table 9.13: Pigs by age and sex in Rural and Urban Combined for Exotic/Crossbred for
Indigenous and total Pigs
Exotic / Crossbred Pigs
Total Exotic /
Crossbred Pigs
Male Female
Under 6
Months
6 Months
& Above
Total Under 6
Months
6 Months
& Above
Total
62677 52513 115190 49098 48664 97762 212952
Indigenous Pigs Total
Indigenous
Pigs
Total
Pigs Male Female
Under 6
Months
6 Months
& Above
Total Under 6
Months
6 Months
& Above
Total
7605 8438 16043 7626 8617 16243 32286 245238
Table 9.14: Horses & Ponies by Age, Sex and Use in Rural and Urban Combined
Male Female Total
Horses
& Ponies Under 3
Year
3 Year and Above Total Under 3
Year
3 Year
and
Above
Total
Used for
Cart and
Carriage
Used for
Sport
126 277 12 415 81 226 307 722
Table 9.15: Mules and Donkeys by age and sex in Rural and Urban Combined
Mules Donkeys
Under
3 year
3 Year
and
Above
Total
Mules
Male Female
Total
Donkeys Under
3 year
3 Year
and
Above
Total
Under
3 year
3 Year
and
Above
Total
6 0 6 0 0 0 0 0 0 0
Table 9.16: Dogs, Rabbits and Elephants in Rural and Urban Combined
Dogs Rabbits Elephants
Male Female Total Male Female Total Male Female Total
20840 18938 39778 466 587 1053 2 1 3
Source (Tables 9.13-9.16): Ministry of Agriculture, Department of Animal Husbandry, Dairying and
Fisheries, Krishi Bhawan, New Delhi, Government of India (19th
Livestock Census-2012 All India
Report).
http://dahd.nic.in/sites/default/files/Livestock%20%205.pdf (Accessed on 25.11.2016)

Livestock State at a Glance: Mizoram, Vol. 1(7), 2016
ENVIS Centre on Himalayan Ecology 84
Table 9.17: Estimate of Meat Production from Pigs and Poultry (Part-A)
Year Cattle Buffalo Goat
Estimated
Number of
Animals
Slaughtered
(‘000)
Average
Annual
Yield /
animal
(kg)
Meat
Production
(‘000
Tonnes)
Estimated
Number of
Animals
Slaughtered
(‘000)
Average
Annual
Yield /
animal
(kg)
Meat
Production
(‘000
Tonnes)
Estimated
Number of
Animals
Slaughtered
(‘000)
Average
Annual
Yield /
animal
(kg)
Meat
Production
(‘000
Tonnes)
2010-11 24 137 3 0.4 140 0.1 5 10 0.05
2011-12 26 128 3 0.7 136 0.1 8 8 0.1
2012-13 26.99 126.57 3.42 0.75 134.85 0.10 7.97 8.40 0.07
2013-14 27.12 127.53 3.46 0.72 136.98 0.10 8.21 8.29 0.07
2014-15 28.03 128.20 3.59 0.81 134.93 0.11 8.23 8.31 0.07
Table 9.17: Estimate of Meat Production from Pigs and Poultry (Part-B)
Year Sheep Pig Poultry
Estimated
Number of
Animals
Slaughtered
(‘000)
Average
Annual
Yield /
animal
(kg)
Meat
Production
(‘000
Tonnes)
Estimated
Number of
Animals
Slaughtered
(‘000)
Average
Annual
Yield /
animal
(kg)
Meat
Production
(‘000
Tonnes)
Estimated
Number of
Animals
Slaughtered
(‘000)
Average
Annual
Yield /
animal
(kg)
Meat
Production
(‘000
Tonnes)
2010-11 - - - 49.67 91.51 4.54 645.77 2.73 1.76
2011-12 - - - 86.00 86.00 7.00 823.00 3.00 2.00
2012-13 - - - 79.57 86.61 6.89 238937.62 1.03 245.15
2013-14 - - - 79.71 86.86 6.92 855.79 1.86 1.59
2014-15 0.00 0.00 0.00 80.85 87.43 7.07 886.04 1.88 1.66
Source: Department of Animal Husbandry, Dairying and Fisheries, Ministry of Agriculture, Govt. of India
(Basic Animal Husbandry and Fisheries Statistics, 2015).
http://dahd.nic.in/Division/statistics/animal-husbandry-statistics-division (Accessed 20.08.2016)
Livestock
State at a Glan
ce: Mizo
ram, V
ol. 1
(7), 2
01
6
ENV
IS Cen
tre on
Him
alayan Eco
logy
84
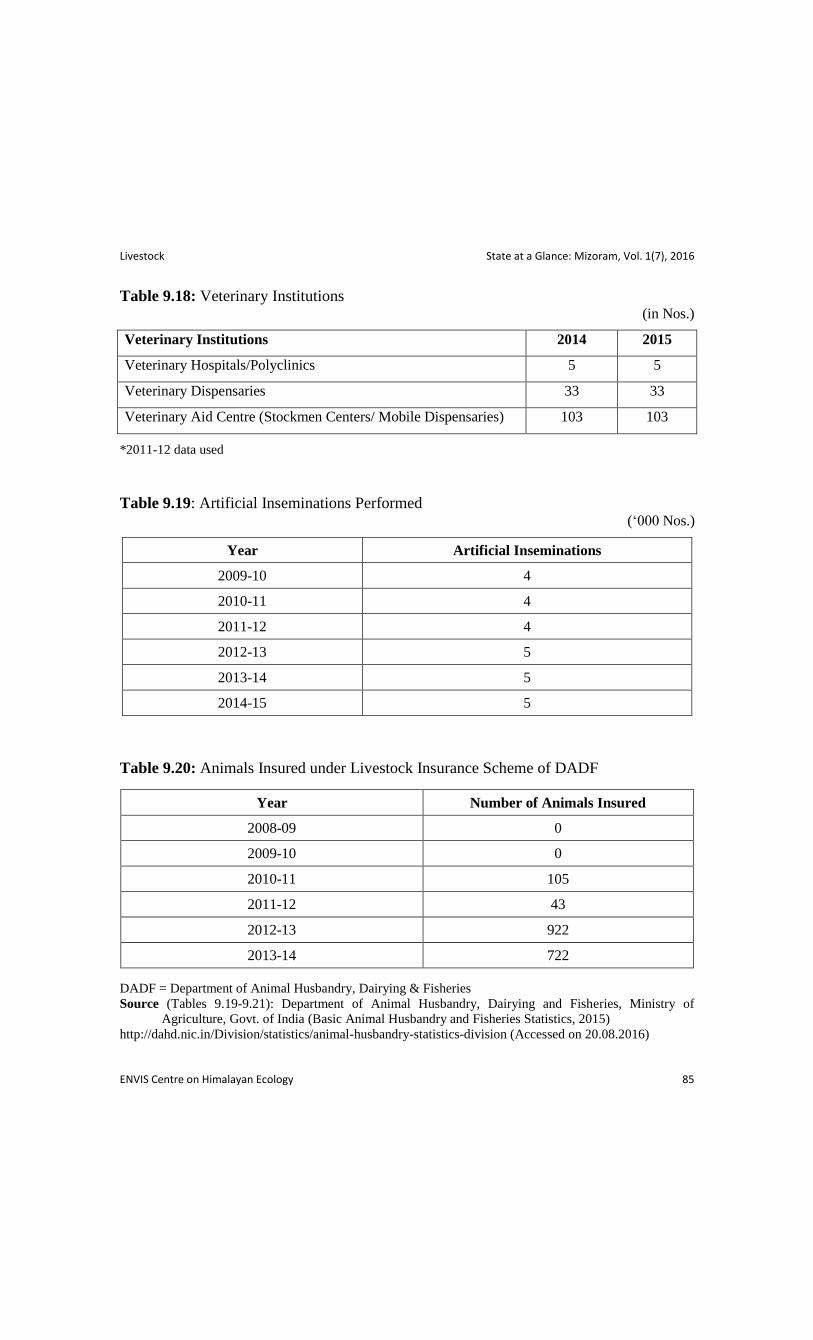
Livestock State at a Glance: Mizoram, Vol. 1(7), 2016
ENVIS Centre on Himalayan Ecology 85
Table 9.18: Veterinary Institutions (in Nos.)
Veterinary Institutions 2014 2015
Veterinary Hospitals/Polyclinics 5 5
Veterinary Dispensaries 33 33
Veterinary Aid Centre (Stockmen Centers/ Mobile Dispensaries) 103 103
*2011-12 data used
Table 9.19: Artificial Inseminations Performed (‘000 Nos.)
Year Artificial Inseminations
2009-10 4
2010-11 4
2011-12 4
2012-13 5
2013-14 5
2014-15 5
Table 9.20: Animals Insured under Livestock Insurance Scheme of DADF
Year Number of Animals Insured
2008-09 0
2009-10 0
2010-11 105
2011-12 43
2012-13 922
2013-14 722
DADF = Department of Animal Husbandry, Dairying & Fisheries
Source (Tables 9.19-9.21): Department of Animal Husbandry, Dairying and Fisheries, Ministry of
Agriculture, Govt. of India (Basic Animal Husbandry and Fisheries Statistics, 2015)
http://dahd.nic.in/Division/statistics/animal-husbandry-statistics-division (Accessed on 20.08.2016)
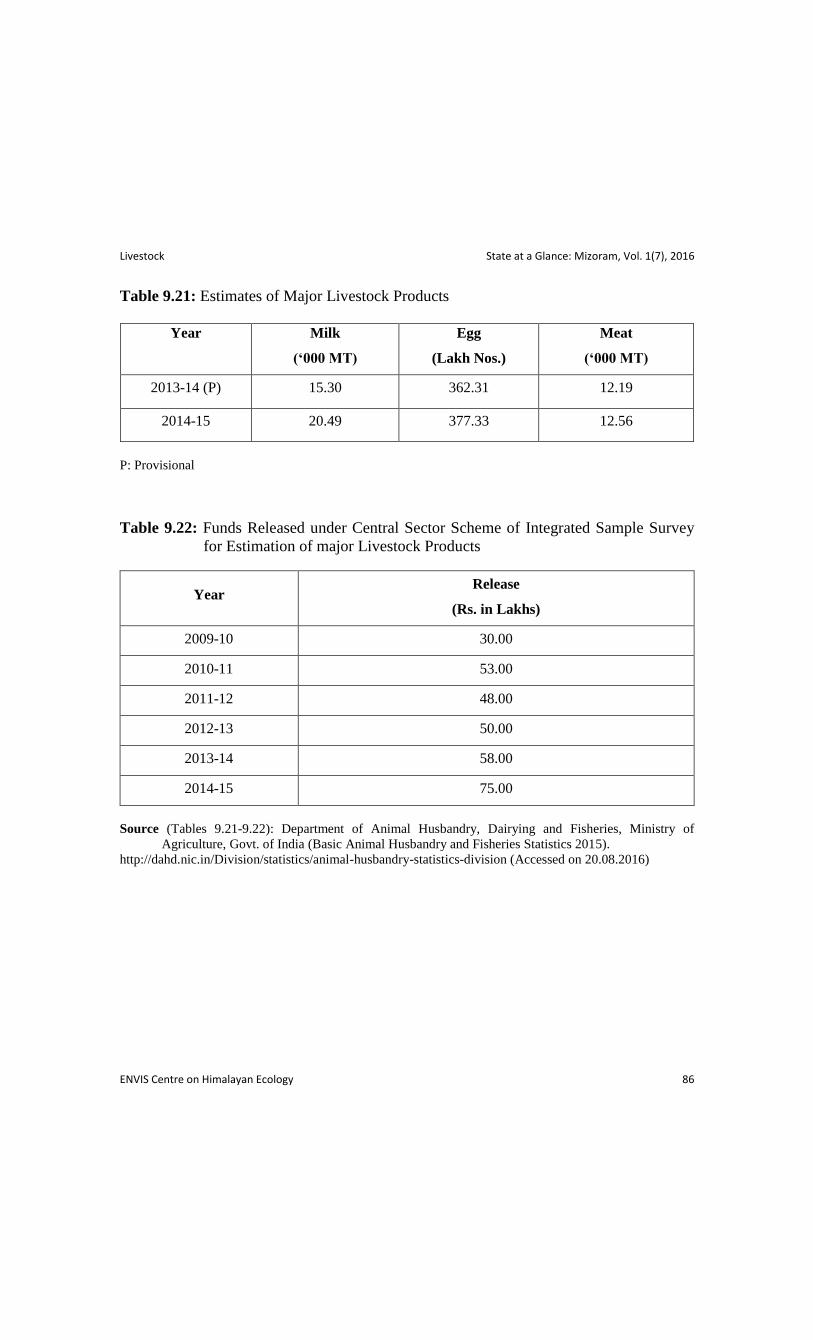
Livestock State at a Glance: Mizoram, Vol. 1(7), 2016
ENVIS Centre on Himalayan Ecology 86
Table 9.21: Estimates of Major Livestock Products
Year Milk
(‘000 MT)
Egg
(Lakh Nos.)
Meat
(‘000 MT)
2013-14 (P) 15.30 362.31 12.19
2014-15 20.49 377.33 12.56
P: Provisional
Table 9.22: Funds Released under Central Sector Scheme of Integrated Sample Survey
for Estimation of major Livestock Products
Year Release
(Rs. in Lakhs)
2009-10 30.00
2010-11 53.00
2011-12 48.00
2012-13 50.00
2013-14 58.00
2014-15 75.00
Source (Tables 9.21-9.22): Department of Animal Husbandry, Dairying and Fisheries, Ministry of
Agriculture, Govt. of India (Basic Animal Husbandry and Fisheries Statistics 2015).
http://dahd.nic.in/Division/statistics/animal-husbandry-statistics-division (Accessed on 20.08.2016)

Forests & Protected Areas State at a Glance: Mizoram, Vol. 1(7), 2016
ENVIS Centre on Himalayan Ecology 87
Forests & Protected Areas
List of Tables
10.1: Assessment of Recorded Forest Area
10.2: Assessment of Forest Cover
10.3: Year-wise Forest Cover
10.4: District-wise Forest Cover
10.5: Forest Cover Change Matrix
10.6: Altitude-wise Forest Cover
10.7: Forest Cover within/outside Green Wash
10.8: Estimates of Tree Cover
10.9: Growing Stock in different Forest Area
10.10: Out-turn of Forest Procedure & Revenue Collected
10.11: Revenue and Expenditure From/on Forests
10.12: Grants-in-Aids for Forests
10.13: Detail of National Parks, Wildlife Sanctuaries
10.14: Forest Occupancy and Population Estimates of Tigers
10.15: Quantity of Forest Produce

Forests & Protected Areas State at a Glance: Mizoram, Vol. 1(7), 2016
ENVIS Centre on Himalayan Ecology 88
Table 10.1: Assessment of Recorded Forest Area (in sq. km.)
Forest Year of Assessment
2011 2013 2015
Reserved Forests 7,909 7,909 4483
Protected Forest 3,568 3,568 0
Un classed Forest 5,240 5,240 1,158
Total Forest Area 16,717 16,717 5,641
% of Forest Area to State’s Geographical Area 79.30 79.30 26.76
% of India’s Forest Area 2.17 2.17 0.74
Table 10.2: Assessment of Forest Cover (in sq. km.)
Forest Year of Assessment
2011 2013 2015
Geographical Area 21,081 21,081 21,081
Very Dense Forest 134 138 138
Moderate Dense Forest 6,086 5,900 5,858
Open Forest 12,897 13,016 12,752
Total Forest Cover 19,117 19,054 18,748
% of Forest Cover to State’s Geographical Area 90.68 90.35 88.93
% of India’s Forest Area 2.76 2.73 2.67
Table 10.3: Year-wise Forest Cover (in sq. km.)
Year of Assessment Total Forest Cover
2001 16,397
2003 18,583
2005 18,684
2007 19,240
2009 19,240
2011 19,117
2013 19,054
2015 18,748
Source (Tables 10.1-10.3): Forest Survey of India, Dehradun, Uttarakhand, Ministry of Environment,
Forest and Climate Change, Govt. of India (India State of Forest Report, 2011, 2013, 2015).
http://fsi.nic.in/ (Accessed on 16.08.2016)

Forests & Protected Areas State at a Glance: Mizoram, Vol. 1(7), 2016
ENVIS Centre on Himalayan Ecology 89
Table 10.4: District-wise Forest Cover
(in sq. km.)
District Geographical
Area (G.A.)
2015 Assessment Percent
of G.A.
(%)
Change Scrub Very
Dense
Forest
Mod.
Dense
Forest
Open
Forest
Total
Aizwal 3575 28 1135 2022 3185 89.09 -64 0
Champhai 3185 60 1042 1570 2673 83.92 -93 0
Kolasib 1382 0 187 1027 1214 87.84 -15 0
Lawngtlai 2557 0 705 1632 2337 91.40 -13 0
Lunglei 4536 1 1186 2954 4141 91.29 -55 0
Mamit 3025 43 654 2044 2741 90.61 -35 0
Sahia 1400 0 551 696 1247 89.07 -18 0
Serchhip 1421 6 398 807 1211 85.22 -13 0
Grand
Total 21081 138 5858 12752 18748 88.93 -306 0
Table 10.5: Forest Cover Change Matrix (in sq. km.)
2013 Assessment 2015 Assessment Total
(ISFR 2013) VDF MDF OF Scrub NF
Very Dense Forest (VDF) 138 0 0 0 0 138
Moderately Dense Forest 0 5858 4 0 38 5900
Open Forest 0 0 12744 0 272 13016
Scrub 0 0 0 0 0 0
Non Forest (NF) 0 0 4 0 2023 2027
Total (ISFR 2015) 138 5858 12752 0 2333 21081
Net Change 0 -42 -264 0 306
Source (Tables 10.4-10.5): Forest Survey of India, Dehradun, Uttarakhand, Ministry of Environment,
Forest and Climate Change, Govt. of India (India State of Forest Report, 2011, 2013, 2015).
http://fsi.nic.in/ (Accessed on 20.08.2016)

Forests & Protected Areas State at a Glance: Mizoram, Vol. 1(7), 2016
ENVIS Centre on Himalayan Ecology 90
Table 10.6: Altitude-wise Forest Cover (in sq. km.)
Altitude Zone 2015 Assessment
VDF MDF OF Total
0-500m 1 1713 6499 8213
500-1000m 37 2718 4588 7343
1000-2000m 99 1426 1665 3190
2000-3000m 1 1 0 2
Total 138 5858 12752 18748
VDF=Very Dense Forest; MDF= Moderate Dense Forest; OF= Open Forest
Table 10.7: Forest Cover within/outside Green Wash (in sq. km.)
Forest Cover within Green Wash
Very Dense Forest 136
Moderately Dense Forest 5700
Open Forest 12517
Sub Total 18353
Forest Cover outside Green Wash
Very Dense Forest 2
Moderately Dense Forest 158
Open Forest 235
Sub Total 395
Total Forest Cover 18748
Tree Cover 535
Total Forest & Tree Cover 19283
Per capita Forest & Tree Cover(ha) 1769
Of State’s Geographical Area (%) 91.47
Of India’s Forest & Tree Cover (%) 2.43

Forests & Protected Areas State at a Glance: Mizoram, Vol. 1(7), 2016
ENVIS Centre on Himalayan Ecology 91
Table 10.8: Estimates of Tree Cover
Year Tree Cover
Area (sq. km.) % of G.A.
2011 190 0.90
2013 223 1.06
2015 535 2.54
Source (Tables 10.6-10.8): Forest Survey of India, Dehradun, Uttarakhand, Ministry of Environment,
Forest and Climate Change, Govt. of India (India State of Forest Report, 2011, 2013, 2015).
http://fsi.nic.in/ (Accessed on 16.08.2016)
Table 10.9: Growing Stock in different Forest Area
Growing Stock 2015 Assessment
(volume in million Cu. M)
Growing Stock in Recorded Forest Area 60.59
Growing Stock in TOF 8.91
TOF= Tree outside Forests
Source: Forest Survey of India, Dehradun, Uttarakhand, Ministry of Environment, Forest and Climate
Change, Govt. of India (India State of Forest Report, 2015).
http://fsi.nic.in/ (Accessed on 16.08.2016)

Forests & Protected Areas State at a Glance: Mizoram, Vol. 1(7), 2016
ENVIS Centre on Himalayan Ecology 92
Table 10.10: Out-turn of Forest Procedure & Revenue Collected
Items Unit
2012-2013 2013-2014 2014-2015 up to
January
Quantity
extracted
Revenue
(Rs. in
Lakh)
Quantity
extracted
Revenue
(Rs. in
Lakh)
Quantity
extracted
Revenue
(Rs. in
Lakh)
Sawn Timber
DTO Cu. M 278.48 178.72 922.53 56.27 726.6 5.42
Seized &
Compounded
Cu. M 1548.35 30.13 7364 56.85 69.97 31.57
Auction Sale Cu. M 38231 27.29 L.S. 9.71 L.S. 42.38
Firewood
Permit System Cu. M 693 0.40 2245.5 1.31 322 0.24
Illegal/ Seized Cu. M 583.6 1.54 2244 2.21 581 0.88
Bamboo
Permit Lakh 0.59 0.70 9.29 27.95 21.41 8.96
Illegal Lakh 2.25 28.42 0.99 4 0.54 3.53
Broom stick
Permit Qtls. 535 2.50 87 0.11 187.70 1.31
Source: Planning & Programme Implementation Department, Government of Mizoram
(Economic Survey Mizoram, 2014-15).
http://www.mizofin.nic.in/file/b%2015-16/Mizoram%20Economic%20Survey%202014-15.pdf
(Accessed on 10.08.2016)
Table 10.11: Revenue and Expenditure From/On Forests
Year 2010-11 2011-12 2012-13 2013-14
Revenue 20655 17800 18700 23800
Expenditure 1036703 632282 821781 928610
Net Revenue/Deficit -1016048 -614481 -803081 -904810
Source: Indian Council of Forestry Research and Education, Ministry of Statistics & Programme
Implementation, (Statistical Year Book, India, 2016).
http://www.mospi.gov.in/statistical-year-book-india/2016 (Accessed on 10.07.2016)

Forests & Protected Areas State at a Glance: Mizoram, Vol. 1(7), 2016
ENVIS Centre on Himalayan Ecology 93
Table 10.12: Grants-in-Aids for Forests by 13th
Finance Commission
Year Grant-in-Aid(in Rs.Crore)
2010-11 21.4
2011-12 21.4
2012-13 42.8
2013-14 42.8
2014-15 42.8
2010-2015 171.2
Source: Indian Council Forestry Research Education (ICFRE), MoEF & CC, Govt. of India; State Forest
Departments (Forestry Statistics India, 2011).
http://www.icfre.org/UserFiles/File/Institute-ICFRE/2013/Stat/Forestry-stat-07Mar13.htm
(Accessed on 20.08.2016)
Table 10.13: Detail of National Parks, Wildlife Sanctuaries
Name of District Name of NPs /Sanctuaries/
Conservation Reserve
Year of
Establishment
Area
(km2)
National Parks (2)
Champhai Murlen 1991 100.00
Lawngtlai Phawngpui Blue Mountain 1992 50.00
Total Area 150.00
Wildlife Sanctuaries (8)
Dampa WLS 1985 500.00
Khawnglung WLS 1992 35.00
Lengteng WLS 1999 60.00
Ngengpui WLS 1991 110.00
Pualreng WLS 2004 50.00
Tawi WLS 1978 35.75
Thorangtlang WLS 2002 50.00
Tokalo WLS 2007 250.00
Total Area 1090.75
Source: Wildlife Institute of India, MoEF & CC, Govt. of India
http://wii.gov.in/images//images/documents/n_parks_nov_2015.pdf
http://wii.gov.in/images//images/documents/wls_nov_2015.pdf (Accessed on 22.06.2016)
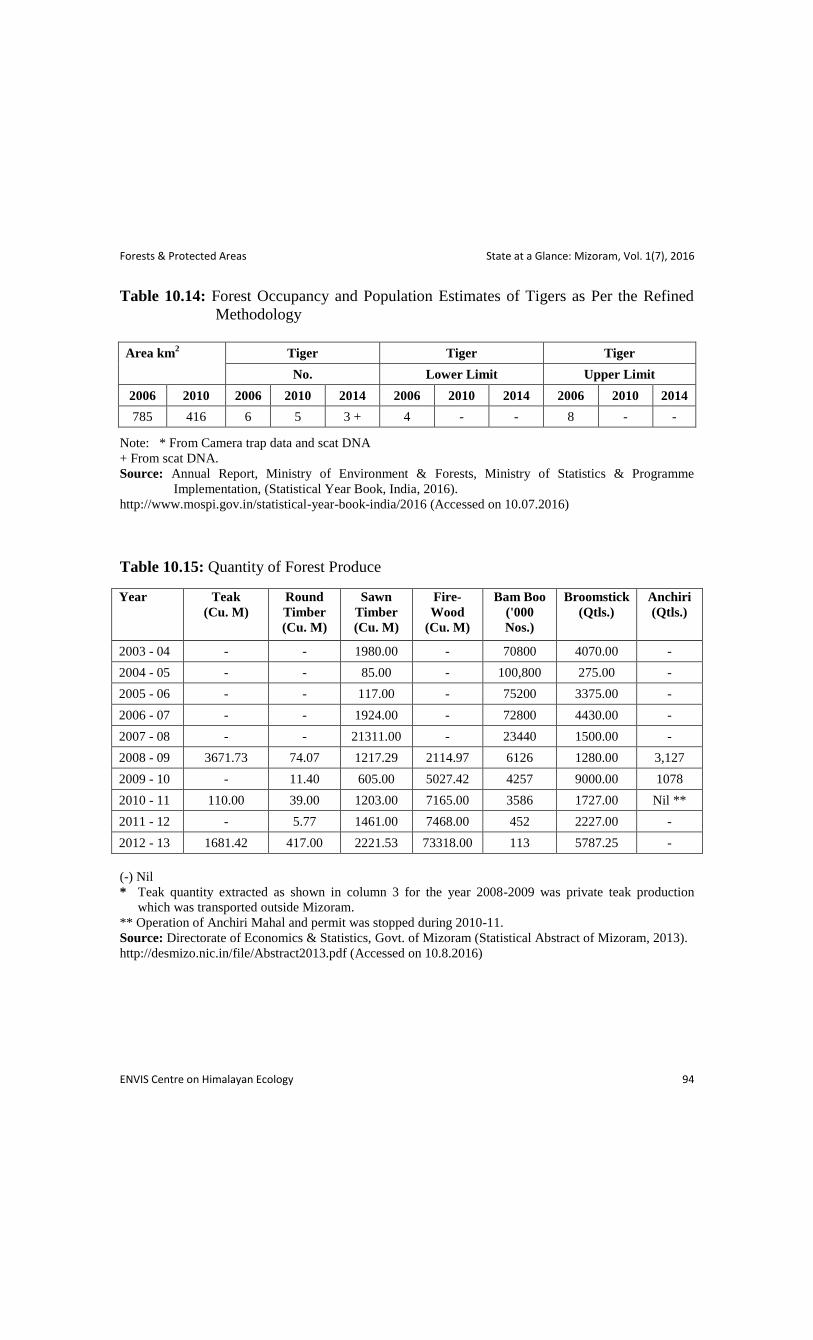
Forests & Protected Areas State at a Glance: Mizoram, Vol. 1(7), 2016
ENVIS Centre on Himalayan Ecology 94
Table 10.14: Forest Occupancy and Population Estimates of Tigers as Per the Refined
Methodology
Area km2 Tiger Tiger Tiger
No. Lower Limit Upper Limit
2006 2010 2006 2010 2014 2006 2010 2014 2006 2010 2014
785 416 6 5 3 + 4 - - 8 - -
Note: * From Camera trap data and scat DNA
+ From scat DNA.
Source: Annual Report, Ministry of Environment & Forests, Ministry of Statistics & Programme
Implementation, (Statistical Year Book, India, 2016).
http://www.mospi.gov.in/statistical-year-book-india/2016 (Accessed on 10.07.2016)
Table 10.15: Quantity of Forest Produce
Year Teak
(Cu. M)
Round
Timber
(Cu. M)
Sawn
Timber
(Cu. M)
Fire-
Wood
(Cu. M)
Bam Boo
('000
Nos.)
Broomstick
(Qtls.)
Anchiri
(Qtls.)
2003 - 04 - - 1980.00 - 70800 4070.00 -
2004 - 05 - - 85.00 - 100,800 275.00 -
2005 - 06 - - 117.00 - 75200 3375.00 -
2006 - 07 - - 1924.00 - 72800 4430.00 -
2007 - 08 - - 21311.00 - 23440 1500.00 -
2008 - 09 3671.73 74.07 1217.29 2114.97 6126 1280.00 3,127
2009 - 10 - 11.40 605.00 5027.42 4257 9000.00 1078
2010 - 11 110.00 39.00 1203.00 7165.00 3586 1727.00 Nil **
2011 - 12 - 5.77 1461.00 7468.00 452 2227.00 -
2012 - 13 1681.42 417.00 2221.53 73318.00 113 5787.25 -
(-) Nil
* Teak quantity extracted as shown in column 3 for the year 2008-2009 was private teak production
which was transported outside Mizoram.
** Operation of Anchiri Mahal and permit was stopped during 2010-11.
Source: Directorate of Economics & Statistics, Govt. of Mizoram (Statistical Abstract of Mizoram, 2013).
http://desmizo.nic.in/file/Abstract2013.pdf (Accessed on 10.8.2016)
Minerals and Petroleum State at a Glance: Mizoram, Vol. 1(7), 2016
ENVIS Centre on Himalayan Ecology 95
Minerals and Petroleum
List of Tables
11.1: Value of Mineral Production
11.2: Value of Mineral Production by Mineral Groups
11.3: LPG Storage and Bottling Capacity Expansion by Public Sector Oil Marketing
Companies
11.4: Company-wise Number of Liquefied Petroleum Gas (LPG) Distributors
11.5: Company-wise Number of Liquefied Petroleum Gas (LPG) Domestic Consumers
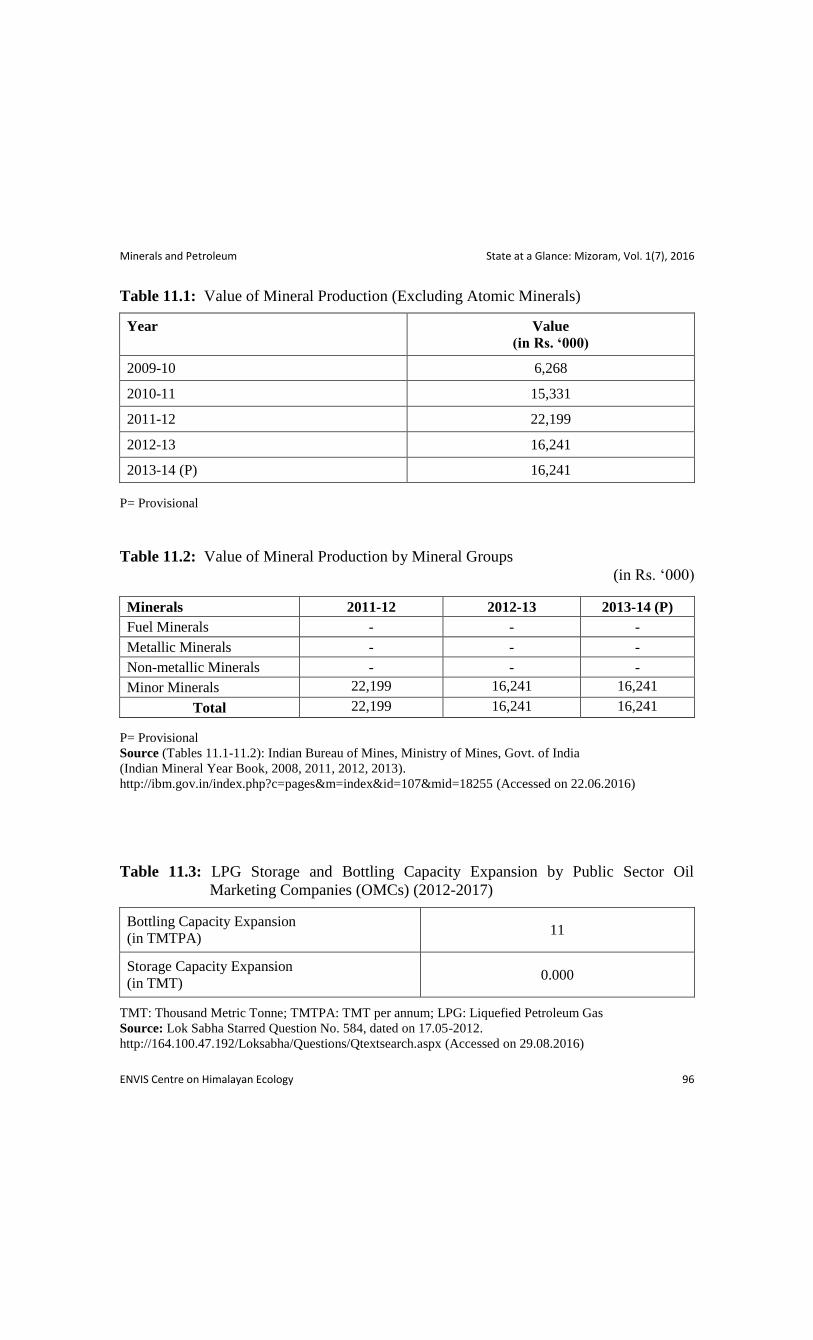
Minerals and Petroleum State at a Glance: Mizoram, Vol. 1(7), 2016
ENVIS Centre on Himalayan Ecology 96
Table 11.1: Value of Mineral Production (Excluding Atomic Minerals)
Year Value
(in Rs. ‘000)
2009-10 6,268
2010-11 15,331
2011-12 22,199
2012-13 16,241
2013-14 (P) 16,241
P= Provisional
Table 11.2: Value of Mineral Production by Mineral Groups
(in Rs. ‘000)
Minerals 2011-12 2012-13 2013-14 (P)
Fuel Minerals - - -
Metallic Minerals - - -
Non-metallic Minerals - - -
Minor Minerals 22,199 16,241 16,241
Total 22,199 16,241 16,241
P= Provisional
Source (Tables 11.1-11.2): Indian Bureau of Mines, Ministry of Mines, Govt. of India
(Indian Mineral Year Book, 2008, 2011, 2012, 2013).
http://ibm.gov.in/index.php?c=pages&m=index&id=107&mid=18255 (Accessed on 22.06.2016)
Table 11.3: LPG Storage and Bottling Capacity Expansion by Public Sector Oil
Marketing Companies (OMCs) (2012-2017)
Bottling Capacity Expansion
(in TMTPA) 11
Storage Capacity Expansion
(in TMT) 0.000
TMT: Thousand Metric Tonne; TMTPA: TMT per annum; LPG: Liquefied Petroleum Gas
Source: Lok Sabha Starred Question No. 584, dated on 17.05-2012.
http://164.100.47.192/Loksabha/Questions/Qtextsearch.aspx (Accessed on 29.08.2016)

Minerals and Petroleum State at a Glance: Mizoram, Vol. 1(7), 2016
ENVIS Centre on Himalayan Ecology 97
Table 11.4: Company-wise Number of Liquefied Petroleum Gas (LPG) Distributors
(as on 31.03.2015)
(in ‘000 Nos.)
IOCL 54
BPCL 0
HPCL 0
Industry 54
IOCL: Indian Oil Corporation Ltd.; BPCL: Bharat Petroleum Corporation Ltd.; HPCL: Hindustan
Petroleum Corporation Ltd.
Source: Ministry of Petroleum and Natural Gas, Govt. of India (ON869).
http://petroleum.nic.in/ (Accessed on 08.05.2016)
Table 11.5: Company-wise Number of Liquefied Petroleum Gas (LPG) Domestic
Consumers (as on 31.03.2015) (in ‘000 Nos.)
IOCL 293261
BPCL 0
HPCL 0
Industry 293261
IOCL: Indian Oil Corporation Ltd.; BPCL: Bharat Petroleum Corporation Ltd.; HPCL: Hindustan
Petroleum Corporation Ltd.
Source: Ministry of Petroleum and Natural Gas, Govt. of India (13203), (ON320), (ON869);
Lok Sabha Starred Question No. 1130, dated on 12.03-2015.
http://164.100.47.192/Loksabha/Questions/Qtextsearch.aspx (Accessed on 29.08.2016)

Industry State at a Glance: Mizoram, Vol. 1(7), 2016
ENVIS Centre on Himalayan Ecology 99
Industry
List of Tables
12.1: Industrial Infrastructure
12.2: Industry at a Glance
12.3: Number of Small Scale Industrial Units, Employment and Investment
12.4: Number of Small Scale Industrial Units Assisted, Amount of GIA disbursed and
Handloom weaving and Handicraft Training Centres
12.5: Grant-in-Aid in provided under the main scheme of NMFP
12.6: Per Capita Income
12.7: Number of Units and Employment Registered Under Small Scale Industries
12.8: Industry-Wise Production and Employment of KVI
12.9: Growth Rate of Gross State Domestic Product (GSDP) in Industry Sector
12.10: Gross State Domestic Product by Industry of Origin
12.11: Percentage (%) Share to Total State Gross State Domestic Product (GSDP)

Industry State at a Glance: Mizoram, Vol. 1(7), 2016
ENVIS Centre on Himalayan Ecology 100
Table 12.1: Industrial Infrastructure
Industrial Area Total
Area (in
Bighas)
Present Status
Industrial Estate, Zuangtui 314.70 Out of 231 demarcated, 197 plots are allotted to
165 Industrial units
Industrial Growth Centre,
Luangmual
940.78
Allotment process is yet to be started and 29 units
are now given provisional allotments and expected
to accommodate many more enterprises.
Industrial Estate, Bairabi 26.20 Yet to be developed
Industrial Estate, Kolasib 32.33 Yet to be developed
IIDC, Pukpui 76.68 Demarcation of stall completed, and allotment is
given to 2 units.
Industrial Estate,
Hmunhmeltha
104.40 Yet to be developed
Export Promotion Industrial
Park at Lengte
1390.22
32 plots had been developed and allotted to
entrepreneurs, 3 units are now in operation. Up-
gradation of the Park is being done and expected to
accommodate some more small enterprises.
Bamboo Technology Park at
Sairang
148.2
The park is ready for plot allotment. Entrepreneurs
are allotted plots for bamboo related activities.
Source: Government of Mizoram Planning & Programme Implementation Department
(Research & Development Branch) (Mizoram Economic Survey, 2014-15).
http://www.mizofin.nic.in/file/b%2015-16/Mizoram%20Economic%20Survey%202014-15.pdf
(Accessed on 10.08.2016)

Industry State at a Glance: Mizoram, Vol. 1(7), 2016
ENVIS Centre on Himalayan Ecology 101
Table 12.2: Industry at a Glance
Head Aizawl
(31/03/2014)
Lawngtlai
(31/03/2015)
Kolasib
(31/03/2014)
Units Particulars Units Particulars Units Particulars
Registered Industrial
Unit Nos. 933 Nos. 183 Nos. 154
Total Industrial Unit Nos. 933 Nos. 183 Nos. 154
Registered Medium &
Large Unit Nos. 05 Nos. Nil Nos. Nil
Estimated Avg. No. of
Daily Worker
Employed In Small
Scale Industry
Nos. 09 Nos. 04 Nos. 12
Employment In Large
And Medium Industries Nos. 377 Nos. Nil Nos. Nil
No. of Industrial Area No. 02 No. Nil No. 04
Turnover of Small
Scale Industry in
Lakhs 15500.35
In
Lakhs 9898.19
In
Lakhs
Not
available
with DIC
Turnover of Large And
Medium Industries
in
Lakhs 1071.69
In
Lakhs Nil
In
Lakhs
Does not
arise
Source: DIC, Aizawl, Lawnqtlal & Kolasib, Ministry of MSME, Govt. of India, Brief Industrial Profile of
Aizawl, Lawnqtlal & Kolasib, Mizoram.
http://dcmsme.gov.in/dips/Aizawl.pdf; http://dcmsme.gov.in/dips/Dist_Lawngtlai_Mizoram_5416.pdf
http://dcmsme.gov.in/dips/Kolasib.pdf (Accessed on 19.10.2016)
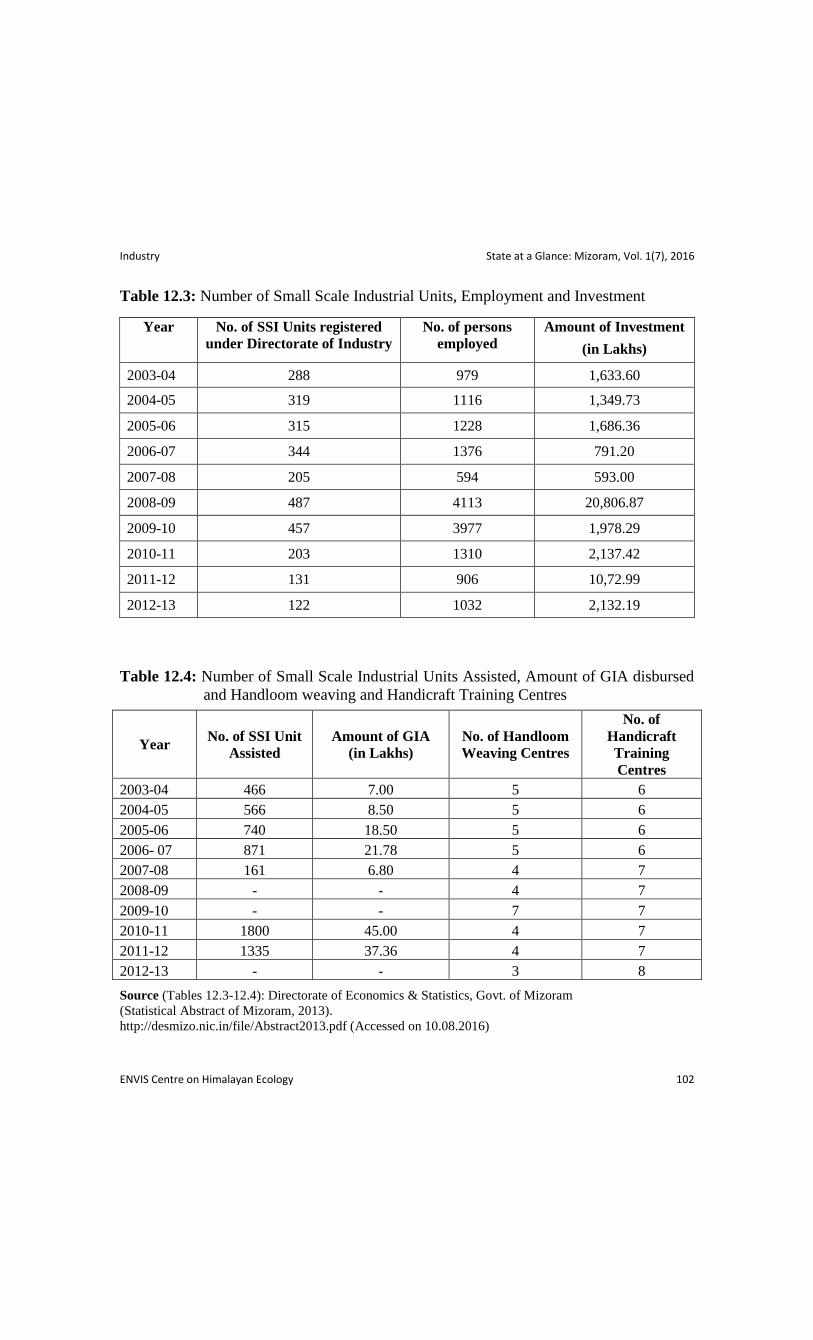
Industry State at a Glance: Mizoram, Vol. 1(7), 2016
ENVIS Centre on Himalayan Ecology 102
Table 12.3: Number of Small Scale Industrial Units, Employment and Investment
Year No. of SSI Units registered
under Directorate of Industry
No. of persons
employed
Amount of Investment
(in Lakhs)
2003-04 288 979 1,633.60
2004-05 319 1116 1,349.73
2005-06 315 1228 1,686.36
2006-07 344 1376 791.20
2007-08 205 594 593.00
2008-09 487 4113 20,806.87
2009-10 457 3977 1,978.29
2010-11 203 1310 2,137.42
2011-12 131 906 10,72.99
2012-13 122 1032 2,132.19
Table 12.4: Number of Small Scale Industrial Units Assisted, Amount of GIA disbursed
and Handloom weaving and Handicraft Training Centres
Year No. of SSI Unit
Assisted
Amount of GIA
(in Lakhs)
No. of Handloom
Weaving Centres
No. of
Handicraft
Training
Centres
2003-04 466 7.00 5 6
2004-05 566 8.50 5 6
2005-06 740 18.50 5 6
2006- 07 871 21.78 5 6
2007-08 161 6.80 4 7
2008-09 - - 4 7
2009-10 - - 7 7
2010-11 1800 45.00 4 7
2011-12 1335 37.36 4 7
2012-13 - - 3 8
Source (Tables 12.3-12.4): Directorate of Economics & Statistics, Govt. of Mizoram
(Statistical Abstract of Mizoram, 2013).
http://desmizo.nic.in/file/Abstract2013.pdf (Accessed on 10.08.2016)
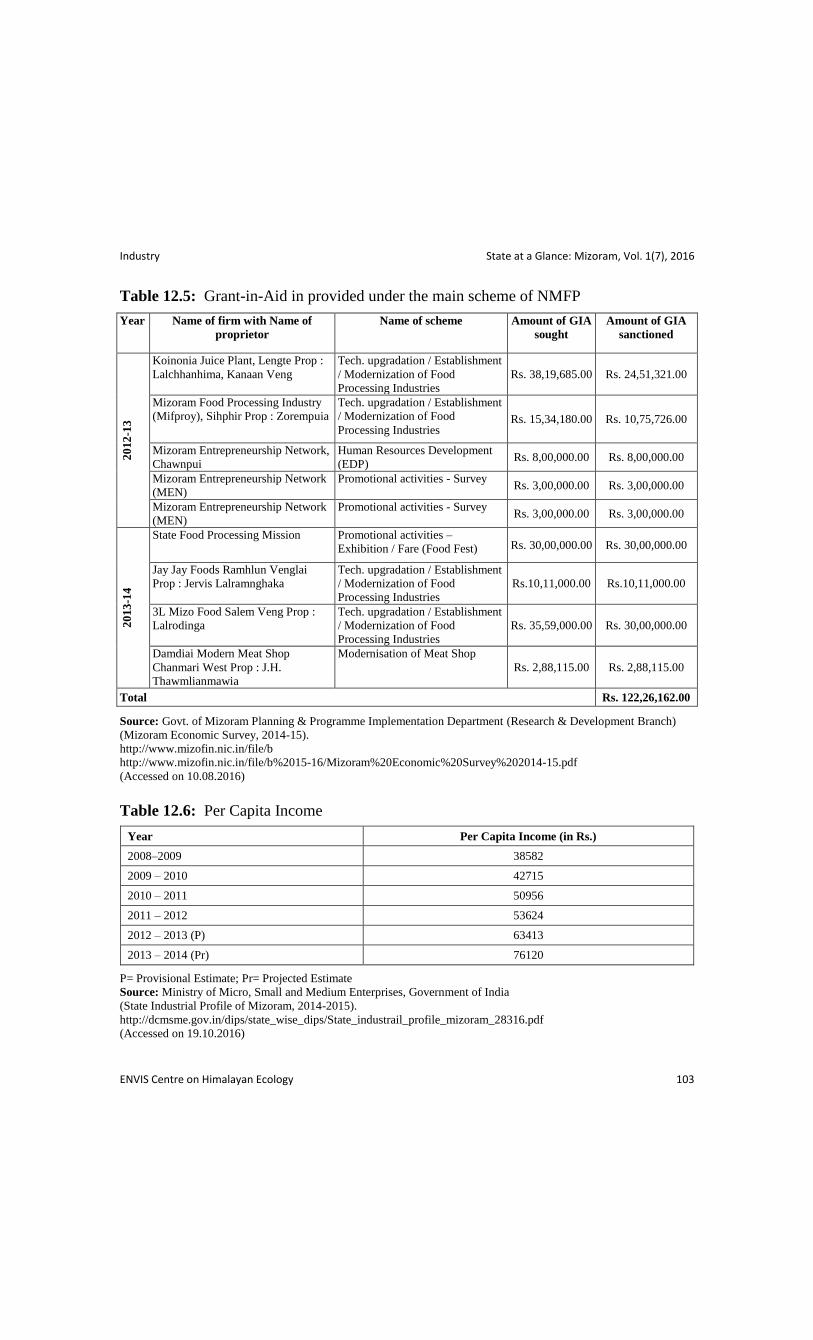
Industry State at a Glance: Mizoram, Vol. 1(7), 2016
ENVIS Centre on Himalayan Ecology 103
Table 12.5: Grant-in-Aid in provided under the main scheme of NMFP
Year Name of firm with Name of
proprietor
Name of scheme Amount of GIA
sought
Amount of GIA
sanctioned
20
12
-13
Koinonia Juice Plant, Lengte Prop :
Lalchhanhima, Kanaan Veng
Tech. upgradation / Establishment
/ Modernization of Food
Processing Industries
Rs. 38,19,685.00 Rs. 24,51,321.00
Mizoram Food Processing Industry
(Mifproy), Sihphir Prop : Zorempuia
Tech. upgradation / Establishment
/ Modernization of Food
Processing Industries Rs. 15,34,180.00 Rs. 10,75,726.00
Mizoram Entrepreneurship Network,
Chawnpui
Human Resources Development
(EDP) Rs. 8,00,000.00 Rs. 8,00,000.00
Mizoram Entrepreneurship Network
(MEN)
Promotional activities - Survey Rs. 3,00,000.00 Rs. 3,00,000.00
Mizoram Entrepreneurship Network
(MEN)
Promotional activities - Survey Rs. 3,00,000.00 Rs. 3,00,000.00
20
13
-14
State Food Processing Mission Promotional activities –
Exhibition / Fare (Food Fest) Rs. 30,00,000.00 Rs. 30,00,000.00
Jay Jay Foods Ramhlun Venglai
Prop : Jervis Lalramnghaka
Tech. upgradation / Establishment
/ Modernization of Food
Processing Industries
Rs.10,11,000.00 Rs.10,11,000.00
3L Mizo Food Salem Veng Prop :
Lalrodinga
Tech. upgradation / Establishment
/ Modernization of Food
Processing Industries
Rs. 35,59,000.00 Rs. 30,00,000.00
Damdiai Modern Meat Shop
Chanmari West Prop : J.H.
Thawmlianmawia
Modernisation of Meat Shop
Rs. 2,88,115.00 Rs. 2,88,115.00
Total Rs. 122,26,162.00
Source: Govt. of Mizoram Planning & Programme Implementation Department (Research & Development Branch)
(Mizoram Economic Survey, 2014-15).
http://www.mizofin.nic.in/file/b
http://www.mizofin.nic.in/file/b%2015-16/Mizoram%20Economic%20Survey%202014-15.pdf
(Accessed on 10.08.2016)
Table 12.6: Per Capita Income
Year Per Capita Income (in Rs.)
2008–2009 38582
2009 – 2010 42715
2010 – 2011 50956
2011 – 2012 53624
2012 – 2013 (P) 63413
2013 – 2014 (Pr) 76120
P= Provisional Estimate; Pr= Projected Estimate
Source: Ministry of Micro, Small and Medium Enterprises, Government of India
(State Industrial Profile of Mizoram, 2014-2015).
http://dcmsme.gov.in/dips/state_wise_dips/State_industrail_profile_mizoram_28316.pdf
(Accessed on 19.10.2016)
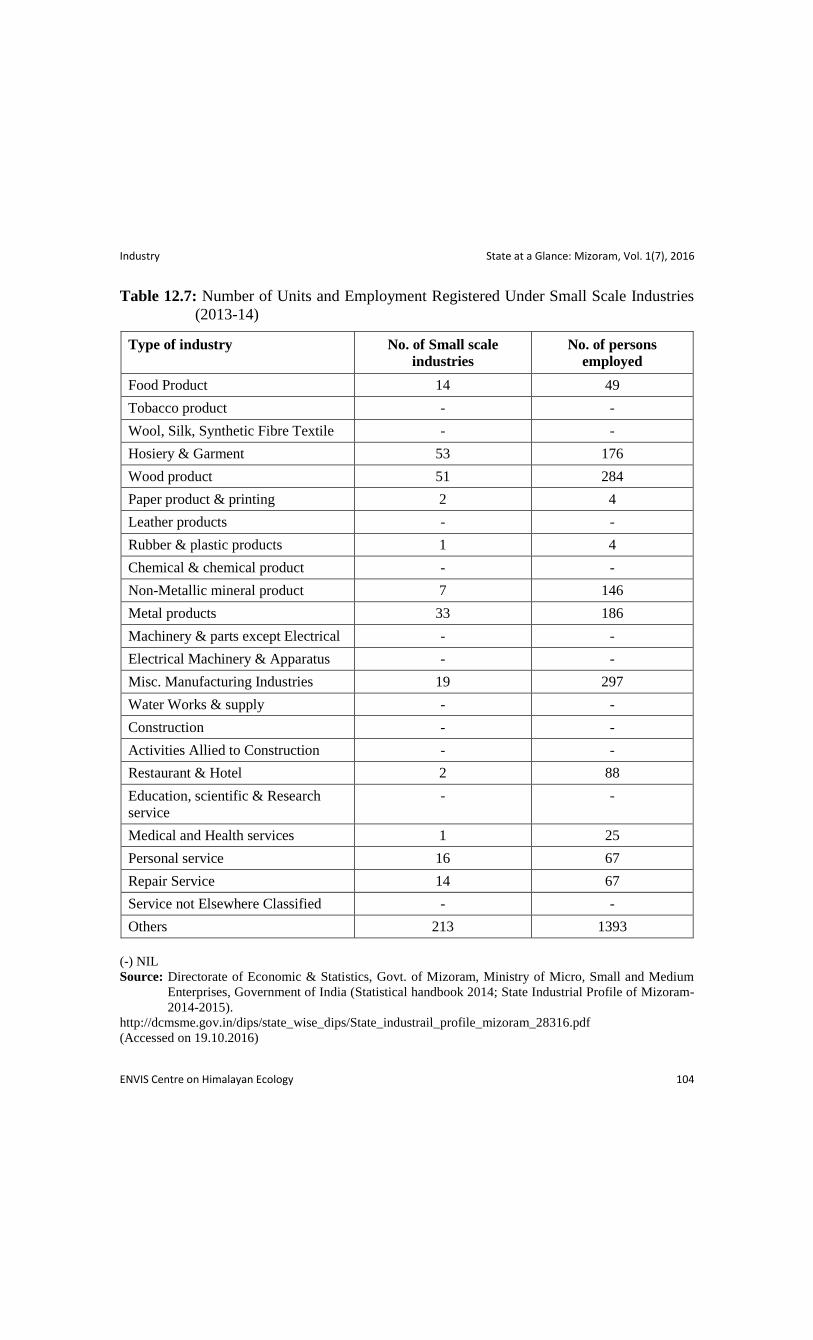
Industry State at a Glance: Mizoram, Vol. 1(7), 2016
ENVIS Centre on Himalayan Ecology 104
Table 12.7: Number of Units and Employment Registered Under Small Scale Industries
(2013-14)
Type of industry No. of Small scale
industries
No. of persons
employed
Food Product 14 49
Tobacco product - -
Wool, Silk, Synthetic Fibre Textile - -
Hosiery & Garment 53 176
Wood product 51 284
Paper product & printing 2 4
Leather products - -
Rubber & plastic products 1 4
Chemical & chemical product - -
Non-Metallic mineral product 7 146
Metal products 33 186
Machinery & parts except Electrical - -
Electrical Machinery & Apparatus - -
Misc. Manufacturing Industries 19 297
Water Works & supply - -
Construction - -
Activities Allied to Construction - -
Restaurant & Hotel 2 88
Education, scientific & Research
service
- -
Medical and Health services 1 25
Personal service 16 67
Repair Service 14 67
Service not Elsewhere Classified - -
Others 213 1393
(-) NIL
Source: Directorate of Economic & Statistics, Govt. of Mizoram, Ministry of Micro, Small and Medium
Enterprises, Government of India (Statistical handbook 2014; State Industrial Profile of Mizoram-
2014-2015).
http://dcmsme.gov.in/dips/state_wise_dips/State_industrail_profile_mizoram_28316.pdf
(Accessed on 19.10.2016)
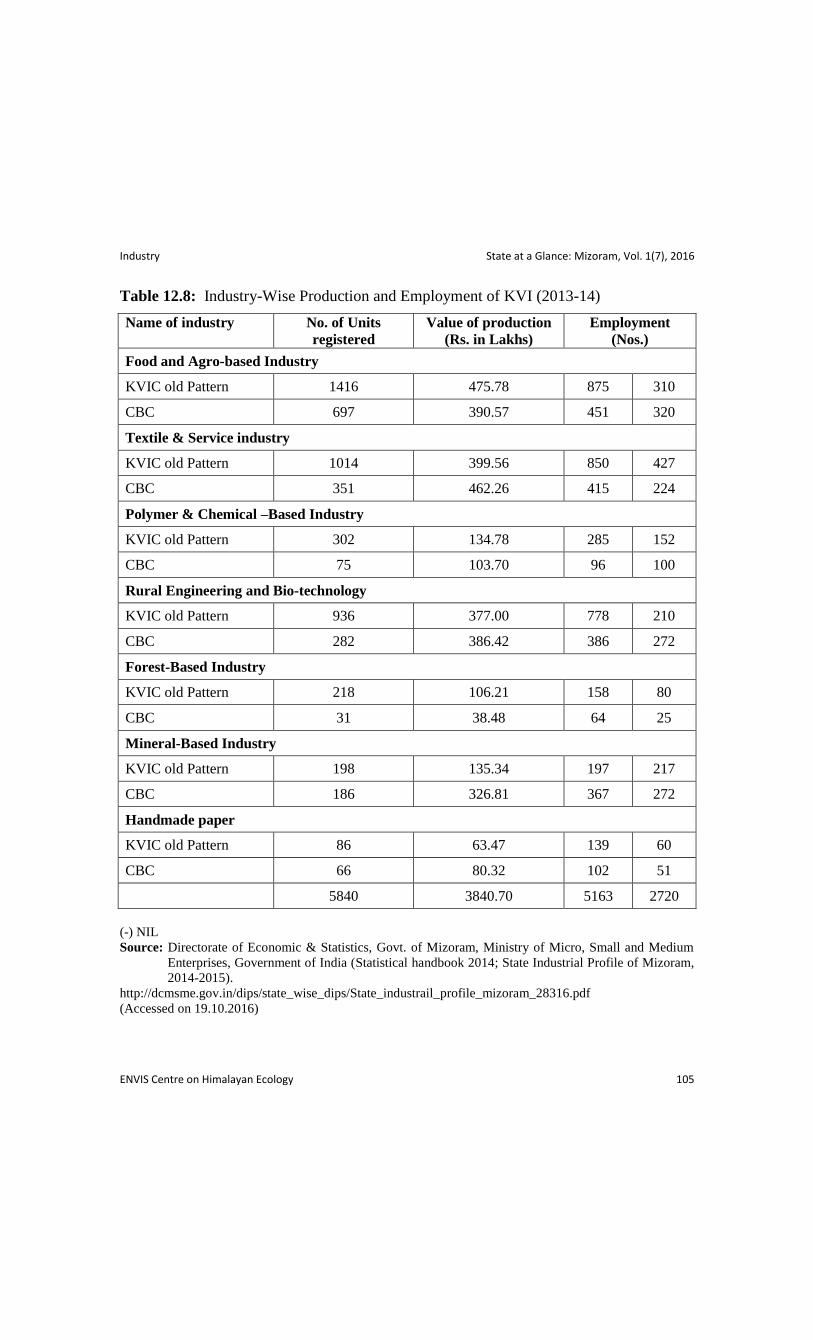
Industry State at a Glance: Mizoram, Vol. 1(7), 2016
ENVIS Centre on Himalayan Ecology 105
Table 12.8: Industry-Wise Production and Employment of KVI (2013-14)
Name of industry No. of Units
registered
Value of production
(Rs. in Lakhs)
Employment
(Nos.)
Food and Agro-based Industry
KVIC old Pattern 1416 475.78 875 310
CBC 697 390.57 451 320
Textile & Service industry
KVIC old Pattern 1014 399.56 850 427
CBC 351 462.26 415 224
Polymer & Chemical –Based Industry
KVIC old Pattern 302 134.78 285 152
CBC 75 103.70 96 100
Rural Engineering and Bio-technology
KVIC old Pattern 936 377.00 778 210
CBC 282 386.42 386 272
Forest-Based Industry
KVIC old Pattern 218 106.21 158 80
CBC 31 38.48 64 25
Mineral-Based Industry
KVIC old Pattern 198 135.34 197 217
CBC 186 326.81 367 272
Handmade paper
KVIC old Pattern 86 63.47 139 60
CBC 66 80.32 102 51
5840 3840.70 5163 2720
(-) NIL
Source: Directorate of Economic & Statistics, Govt. of Mizoram, Ministry of Micro, Small and Medium
Enterprises, Government of India (Statistical handbook 2014; State Industrial Profile of Mizoram,
2014-2015).
http://dcmsme.gov.in/dips/state_wise_dips/State_industrail_profile_mizoram_28316.pdf
(Accessed on 19.10.2016)
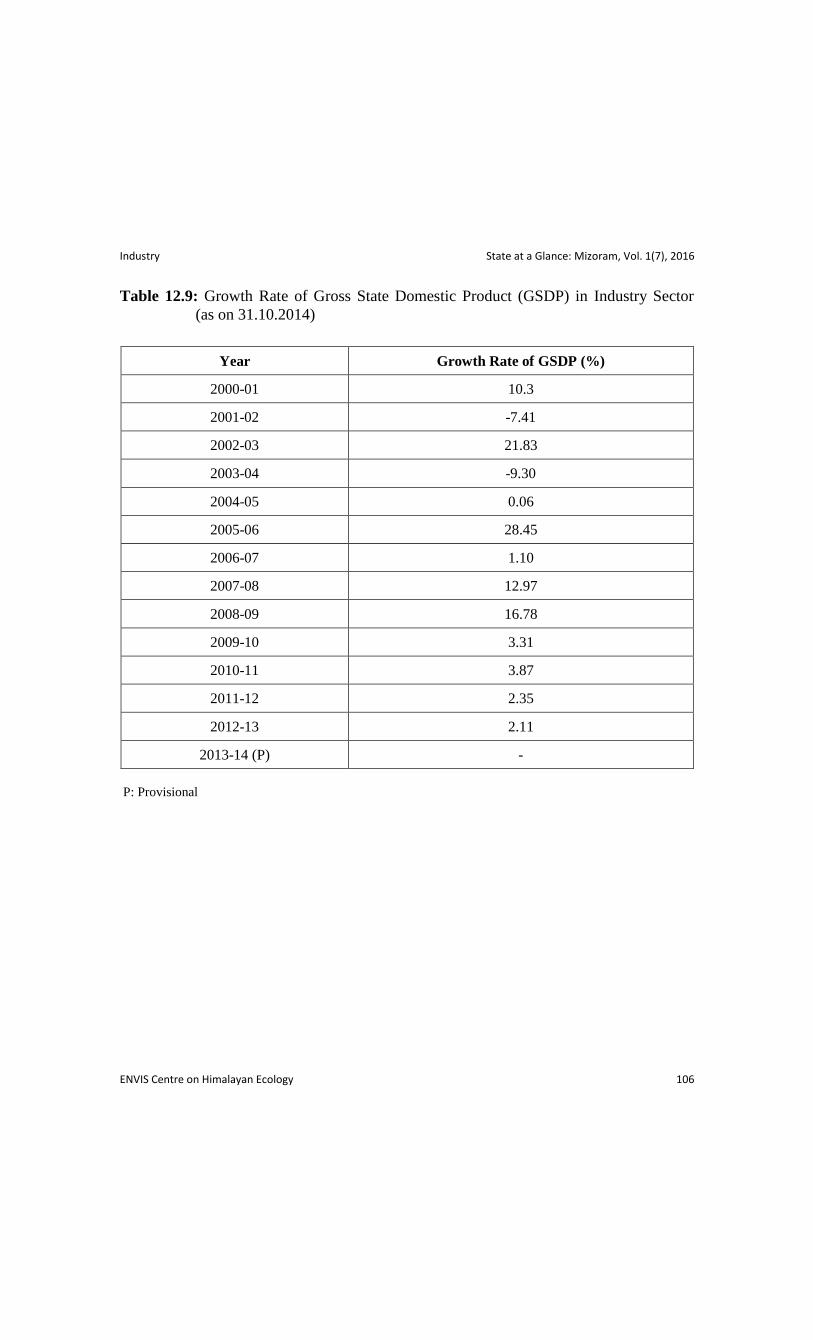
Industry State at a Glance: Mizoram, Vol. 1(7), 2016
ENVIS Centre on Himalayan Ecology 106
Table 12.9: Growth Rate of Gross State Domestic Product (GSDP) in Industry Sector
(as on 31.10.2014)
Year Growth Rate of GSDP (%)
2000-01 10.3
2001-02 -7.41
2002-03 21.83
2003-04 -9.30
2004-05 0.06
2005-06 28.45
2006-07 1.10
2007-08 12.97
2008-09 16.78
2009-10 3.31
2010-11 3.87
2011-12 2.35
2012-13 2.11
2013-14 (P) -
P: Provisional
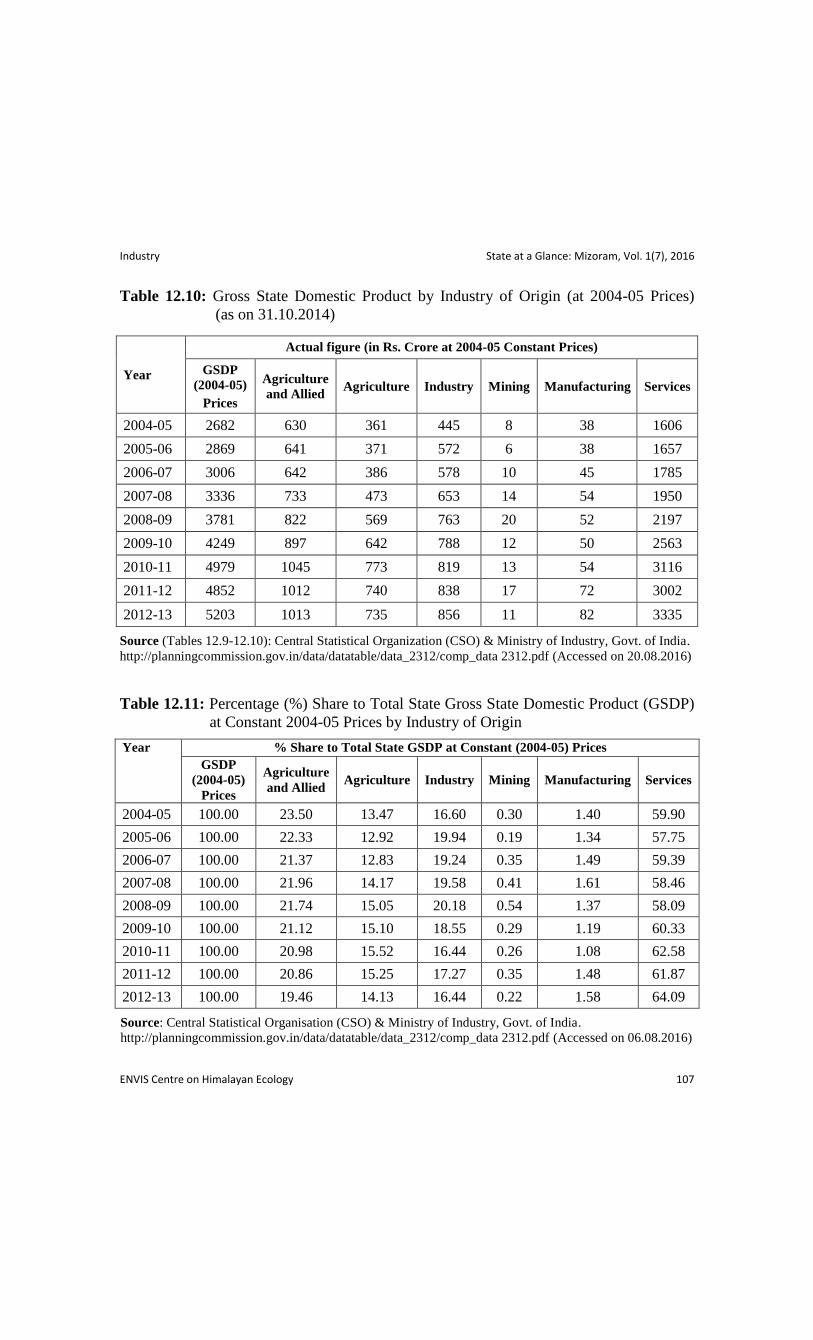
Industry State at a Glance: Mizoram, Vol. 1(7), 2016
ENVIS Centre on Himalayan Ecology 107
Table 12.10: Gross State Domestic Product by Industry of Origin (at 2004-05 Prices)
(as on 31.10.2014)
Year
Actual figure (in Rs. Crore at 2004-05 Constant Prices)
GSDP
(2004-05)
Prices
Agriculture
and Allied Agriculture Industry Mining Manufacturing Services
2004-05 2682 630 361 445 8 38 1606
2005-06 2869 641 371 572 6 38 1657
2006-07 3006 642 386 578 10 45 1785
2007-08 3336 733 473 653 14 54 1950
2008-09 3781 822 569 763 20 52 2197
2009-10 4249 897 642 788 12 50 2563
2010-11 4979 1045 773 819 13 54 3116
2011-12 4852 1012 740 838 17 72 3002
2012-13 5203 1013 735 856 11 82 3335
Source (Tables 12.9-12.10): Central Statistical Organization (CSO) & Ministry of Industry, Govt. of India.
http://planningcommission.gov.in/data/datatable/data_2312/comp_data 2312.pdf (Accessed on 20.08.2016)
Table 12.11: Percentage (%) Share to Total State Gross State Domestic Product (GSDP)
at Constant 2004-05 Prices by Industry of Origin
Year % Share to Total State GSDP at Constant (2004-05) Prices
GSDP
(2004-05)
Prices
Agriculture
and Allied Agriculture Industry Mining Manufacturing Services
2004-05 100.00 23.50 13.47 16.60 0.30 1.40 59.90
2005-06 100.00 22.33 12.92 19.94 0.19 1.34 57.75
2006-07 100.00 21.37 12.83 19.24 0.35 1.49 59.39
2007-08 100.00 21.96 14.17 19.58 0.41 1.61 58.46
2008-09 100.00 21.74 15.05 20.18 0.54 1.37 58.09
2009-10 100.00 21.12 15.10 18.55 0.29 1.19 60.33
2010-11 100.00 20.98 15.52 16.44 0.26 1.08 62.58
2011-12 100.00 20.86 15.25 17.27 0.35 1.48 61.87
2012-13 100.00 19.46 14.13 16.44 0.22 1.58 64.09
Source: Central Statistical Organisation (CSO) & Ministry of Industry, Govt. of India.
http://planningcommission.gov.in/data/datatable/data_2312/comp_data 2312.pdf (Accessed on 06.08.2016)

Road and Transport State at a Glance: Mizoram, Vol. 1(7), 2016
ENVIS Centre on Himalayan Ecology 109
Road and Transport
List of Tables
13.1: Surfaced & Total Length of Roads
13.2: Surfaced & Total Length of State Highways
13.3: Total and Surfaced Length of other PWD Roads
13.4: Length of National Highways
13.5: Lane-wise Length of National Highways
13.6: Length of other PWD Roads by Type of Surface
13.7: Total and Surfaced Length of Rural Roads
13.8: Length of Pradhan Mantri Gram Sadak Yojana (PMGSY) Roads
13.9: Total and Surfaced Length of Urban Roads
13.10: Length of Urban Roads
13.11: Length of Military Engineering Service Roads
13.12: Total and Surfaced Length of Project Roads
13.13: Length of Project Road
13.14: Length of Road under Forest Department
13.15: Length of Road under Border Road Organization
13.16: Outlay and Expenditure on Roads and Bridges
13.17: National Highways
13.18: Registered Motor Vehicles
13.19: Details of Road Accidents
13.20: Details of Person Killed in Road Accidents
13.21: Details of Person Injured in Road Accidents
13.22: Types of Accidents
13.23: Severity of Road Accidents
13.24: Number of accidents/ persons killed/ persons injured in road accidents in Urban &
Rural areas

Road and Transport State at a Glance: Mizoram, Vol. 1(7), 2016
ENVIS Centre on Himalayan Ecology 110
Table 13.1: Surfaced & Total Length of Roads (in km.)
Year Surfaced Total
2009 6383 7742
2010 6929 8727
2011 7001 9810
2012 8099 11293
2013 8518 10939
2014 7079 9803
2015 7278 9831
Table 13.2: Surfaced & Total Length of State Highways (in km.)
Year Surfaced Total
2009 259 259
2010 696 700
2011 696 700
2012 696 700
2013 310 310
2014 214 214
2015 214 214
Table 13.3: Total and Surfaced Length of other PWD Roads (in km.)
Year Surfaced Total
2009 3392 4700
2010 3301 5036
2011 3120 5852
2012 3164 6005
2013 3499 5560
2014 2853 4786
2015 2853 4786
PWD: Public Works Department
Source (Tables 13.1-13.3): Ministry of Road Transport & Highways, Govt. of India
(Basic Road Statistics of India, 2008-09, 2009-10, 2010-11, 2011-12, 2012-13, 2013-14, 2014-15).
http://morth.nic.in/ (Accessed on 05.10.2016)
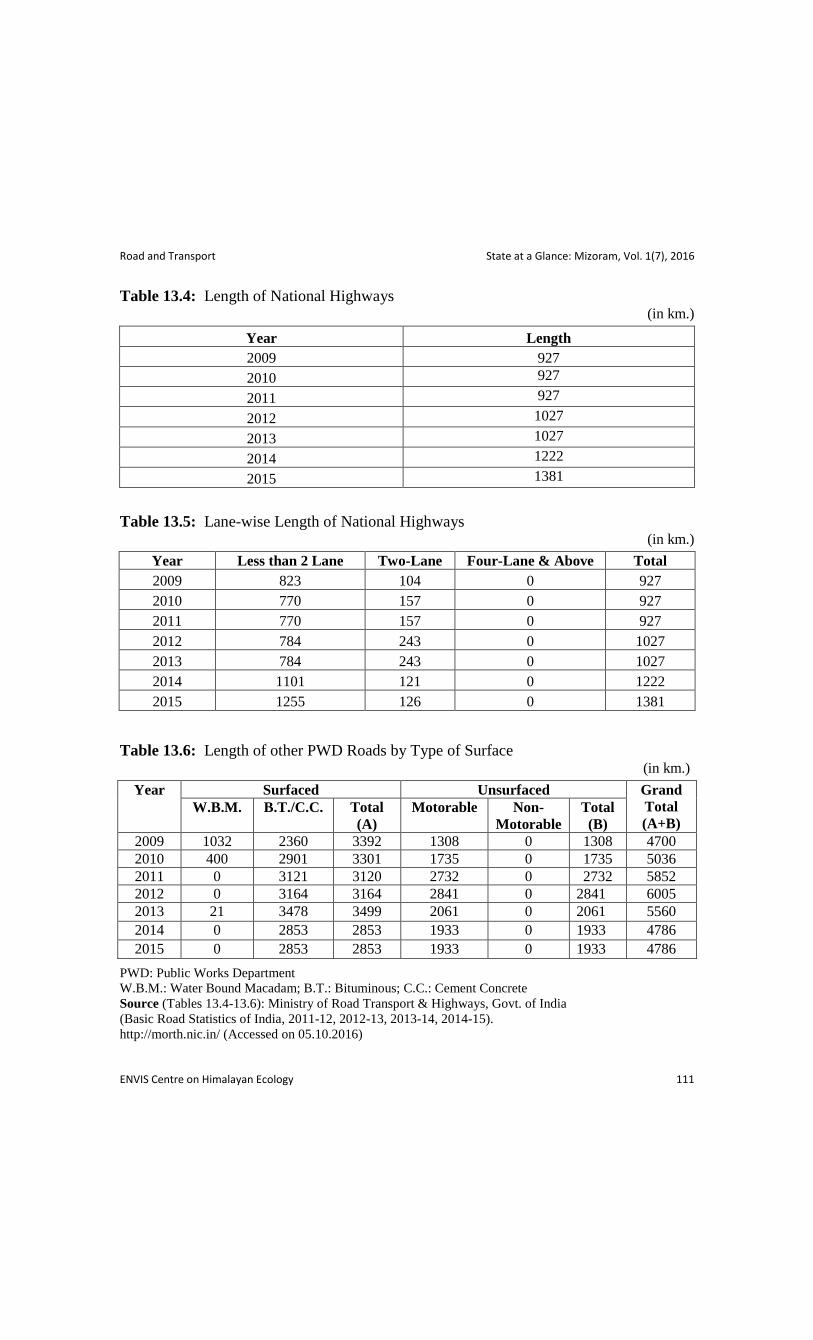
Road and Transport State at a Glance: Mizoram, Vol. 1(7), 2016
ENVIS Centre on Himalayan Ecology 111
Table 13.4: Length of National Highways (in km.)
Year Length
2009 927
2010 927
2011 927
2012 1027
2013 1027
2014 1222
2015 1381
Table 13.5: Lane-wise Length of National Highways (in km.)
Year Less than 2 Lane Two-Lane Four-Lane & Above Total
2009 823 104 0 927
2010 770 157 0 927
2011 770 157 0 927
2012 784 243 0 1027
2013 784 243 0 1027
2014 1101 121 0 1222
2015 1255 126 0 1381
Table 13.6: Length of other PWD Roads by Type of Surface (in km.)
Year Surfaced Unsurfaced Grand
Total
(A+B) W.B.M. B.T./C.C. Total
(A)
Motorable Non-
Motorable
Total
(B)
2009 1032 2360 3392 1308 0 1308 4700
2010 400 2901 3301 1735 0 1735 5036
2011 0 3121 3120 2732 0 2732 5852
2012 0 3164 3164 2841 0 2841 6005
2013 21 3478 3499 2061 0 2061 5560
2014 0 2853 2853 1933 0 1933 4786
2015 0 2853 2853 1933 0 1933 4786
PWD: Public Works Department
W.B.M.: Water Bound Macadam; B.T.: Bituminous; C.C.: Cement Concrete
Source (Tables 13.4-13.6): Ministry of Road Transport & Highways, Govt. of India
(Basic Road Statistics of India, 2011-12, 2012-13, 2013-14, 2014-15).
http://morth.nic.in/ (Accessed on 05.10.2016)
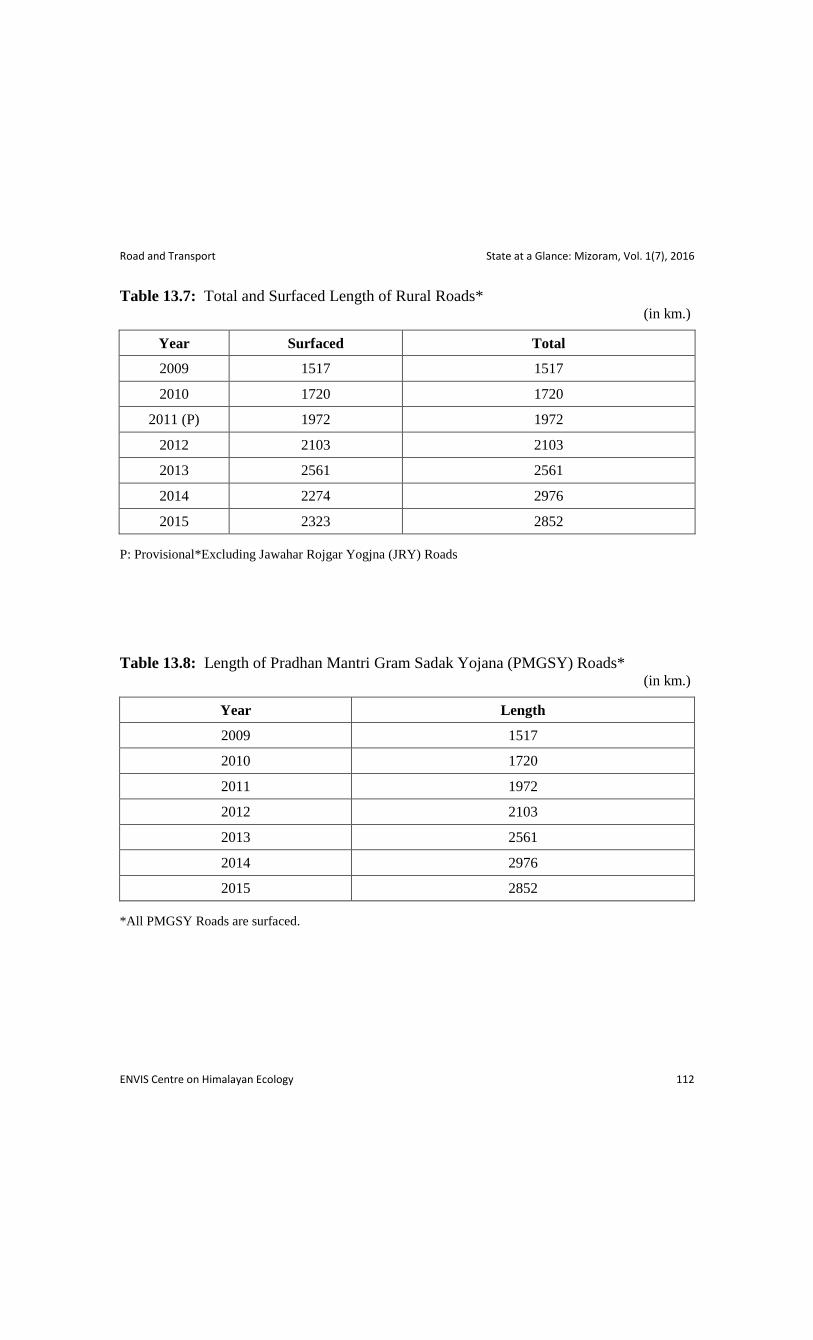
Road and Transport State at a Glance: Mizoram, Vol. 1(7), 2016
ENVIS Centre on Himalayan Ecology 112
Table 13.7: Total and Surfaced Length of Rural Roads* (in km.)
Year Surfaced Total
2009 1517 1517
2010 1720 1720
2011 (P) 1972 1972
2012 2103 2103
2013 2561 2561
2014 2274 2976
2015 2323 2852
P: Provisional*Excluding Jawahar Rojgar Yogjna (JRY) Roads
Table 13.8: Length of Pradhan Mantri Gram Sadak Yojana (PMGSY) Roads* (in km.)
Year Length
2009 1517
2010 1720
2011 1972
2012 2103
2013 2561
2014 2976
2015 2852
*All PMGSY Roads are surfaced.

Road and Transport State at a Glance: Mizoram, Vol. 1(7), 2016
ENVIS Centre on Himalayan Ecology 113
Table 13.9: Total and Surfaced Length of Urban Roads (in km.)
Year Surfaced Total
2009 272 311
2010 272 311
2011 283 324
2012 324 377
2013 326 388
2014 299 346
2015 299 346
*Excluding Jawahar Rojgar Yogjna (JRY) Roads
Source (Tables 13.7-13.9): Ministry of Rural Development, Ministry of Road Transport & Highways,
Govt. of India; State Rural Works Departments/ Local Self- Government; Departments/State
Panchayati Raj Departments/State Rural Road Departments and National Rural Road
Development Agency (Basic Road Statistics of India, 2008-09, 2009-10, 2010-11, 2011-12, 2012-
13, 2013-14, 2014-15)
http://morth.nic.in/ (Accessed on 05.10.2016)
Table 13.10: Length of Urban Roads (in km.)
Year Surfaced Unsurfaced Grand
Total
(A+B) W.B.M. B.T./C.C. Total
(A)
Motorable Non-
Motorable
Total
(B)
2009 3 269 272 39 0 39 311
2010 3 269 272 39 0 39 311
2011 6 277 283 42 0 42 324
2012 3 321 324 53 0 53 377
2013 4 322 326 62 0 62 388
2014 3 296 299 47 0 47 346
2015 3 296 299 47 0 47 346
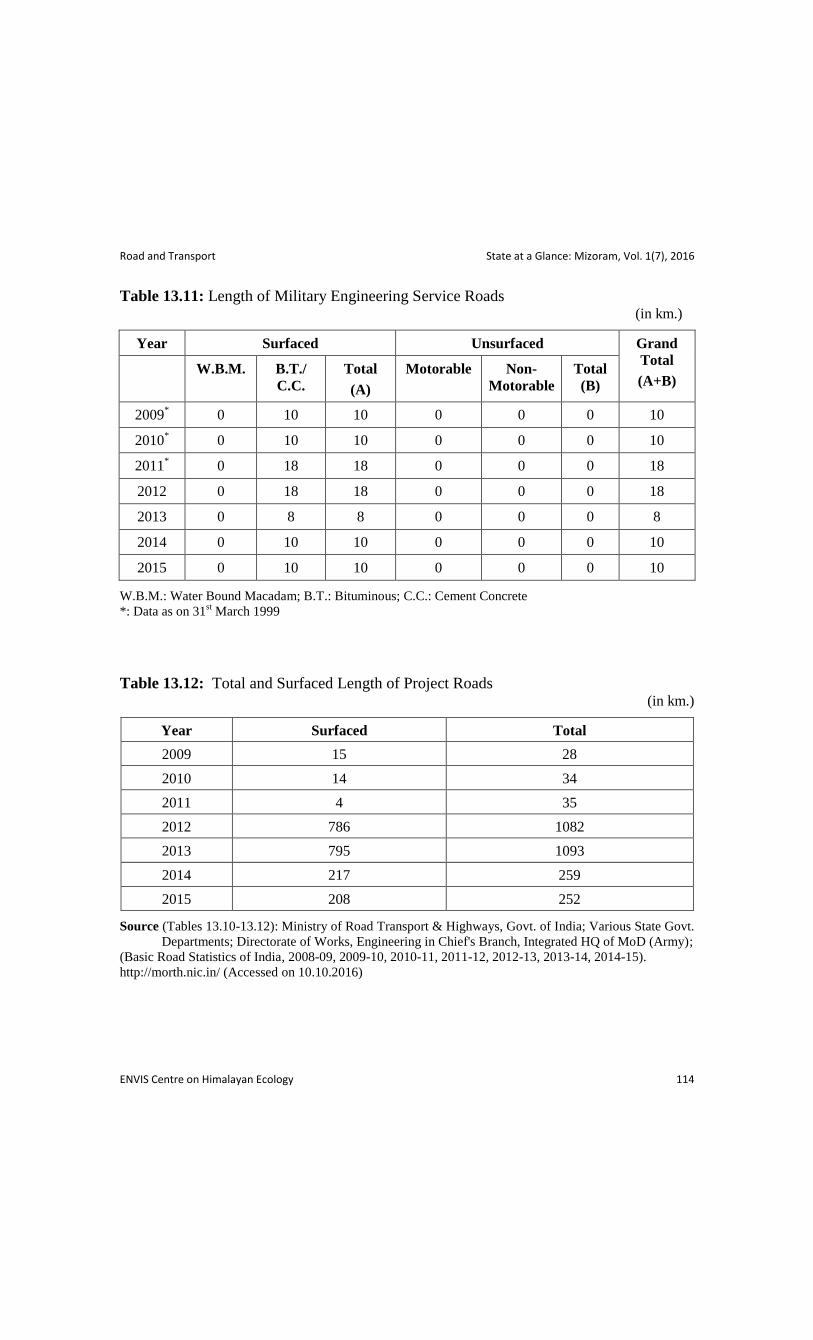
Road and Transport State at a Glance: Mizoram, Vol. 1(7), 2016
ENVIS Centre on Himalayan Ecology 114
Table 13.11: Length of Military Engineering Service Roads (in km.)
Year Surfaced Unsurfaced Grand
Total
(A+B) W.B.M. B.T./
C.C.
Total
(A)
Motorable Non-
Motorable
Total
(B)
2009* 0 10 10 0 0 0 10
2010* 0 10 10 0 0 0 10
2011* 0 18 18 0 0 0 18
2012 0 18 18 0 0 0 18
2013 0 8 8 0 0 0 8
2014 0 10 10 0 0 0 10
2015 0 10 10 0 0 0 10
W.B.M.: Water Bound Macadam; B.T.: Bituminous; C.C.: Cement Concrete
*: Data as on 31st March 1999
Table 13.12: Total and Surfaced Length of Project Roads (in km.)
Year Surfaced Total
2009 15 28
2010 14 34
2011 4 35
2012 786 1082
2013 795 1093
2014 217 259
2015 208 252
Source (Tables 13.10-13.12): Ministry of Road Transport & Highways, Govt. of India; Various State Govt.
Departments; Directorate of Works, Engineering in Chief's Branch, Integrated HQ of MoD (Army);
(Basic Road Statistics of India, 2008-09, 2009-10, 2010-11, 2011-12, 2012-13, 2013-14, 2014-15).
http://morth.nic.in/ (Accessed on 10.10.2016)

Road and Transport State at a Glance: Mizoram, Vol. 1(7), 2016
ENVIS Centre on Himalayan Ecology 115
Table 13.13: Length of Project Roads (in km.)
Year Surfaced Unsurfaced Grand
Total
(A+B) W.B.M. B.T./C.C. Total
(A)
Motorable Non-
Motorable
Total
(B)
2009 0 15 15 7 6 13 28
2010 0 14 14 16 4 20 34
2011 0 4 4 28 3 31 35
2012 0 786 786 296 0 296 1082
2013 3 792 995 298 0 298 1093
2014 56 161 217 42 0 42 259
2015 46 162 208 44 0 44 252
Table 13.14: Length of Road under Forest Department (in km.)
Year Surfaced Unsurfaced Grand
Total
(A+B) W.B.M. B.T./C.C. Total
(A)
Motorable Non-
Motorable
Total
(B)
2009 0 15 15 7 6 13 28
2010 0 14 14 16 4 20 34
2011 0 4 4 31 0 31 35
2012* 0 4 4 31 0 31 35
2013 3 10 13 33 0 33 46
2014 3 10 13 33 0 33 46
2015# 3 10 13 33 0 33 46
*: As on 31st March 2011; #: As on 31
st March 2014
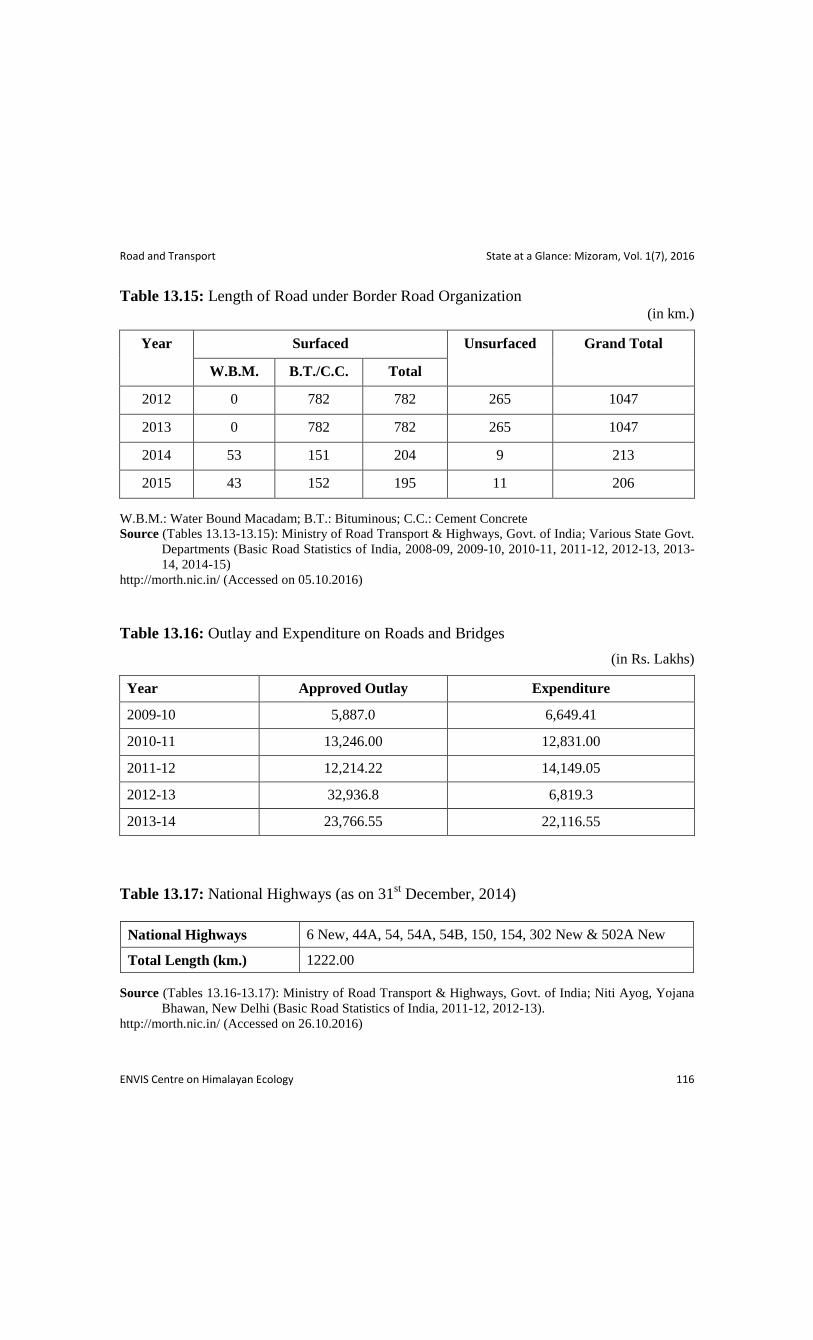
Road and Transport State at a Glance: Mizoram, Vol. 1(7), 2016
ENVIS Centre on Himalayan Ecology 116
Table 13.15: Length of Road under Border Road Organization (in km.)
Year Surfaced Unsurfaced Grand Total
W.B.M. B.T./C.C. Total
2012 0 782 782 265 1047
2013 0 782 782 265 1047
2014 53 151 204 9 213
2015 43 152 195 11 206
W.B.M.: Water Bound Macadam; B.T.: Bituminous; C.C.: Cement Concrete
Source (Tables 13.13-13.15): Ministry of Road Transport & Highways, Govt. of India; Various State Govt.
Departments (Basic Road Statistics of India, 2008-09, 2009-10, 2010-11, 2011-12, 2012-13, 2013-
14, 2014-15)
http://morth.nic.in/ (Accessed on 05.10.2016)
Table 13.16: Outlay and Expenditure on Roads and Bridges
(in Rs. Lakhs)
Year Approved Outlay Expenditure
2009-10 5,887.0 6,649.41
2010-11 13,246.00 12,831.00
2011-12 12,214.22 14,149.05
2012-13 32,936.8 6,819.3
2013-14 23,766.55 22,116.55
Table 13.17: National Highways (as on 31st December, 2014)
National Highways 6 New, 44A, 54, 54A, 54B, 150, 154, 302 New & 502A New
Total Length (km.) 1222.00
Source (Tables 13.16-13.17): Ministry of Road Transport & Highways, Govt. of India; Niti Ayog, Yojana
Bhawan, New Delhi (Basic Road Statistics of India, 2011-12, 2012-13).
http://morth.nic.in/ (Accessed on 26.10.2016)
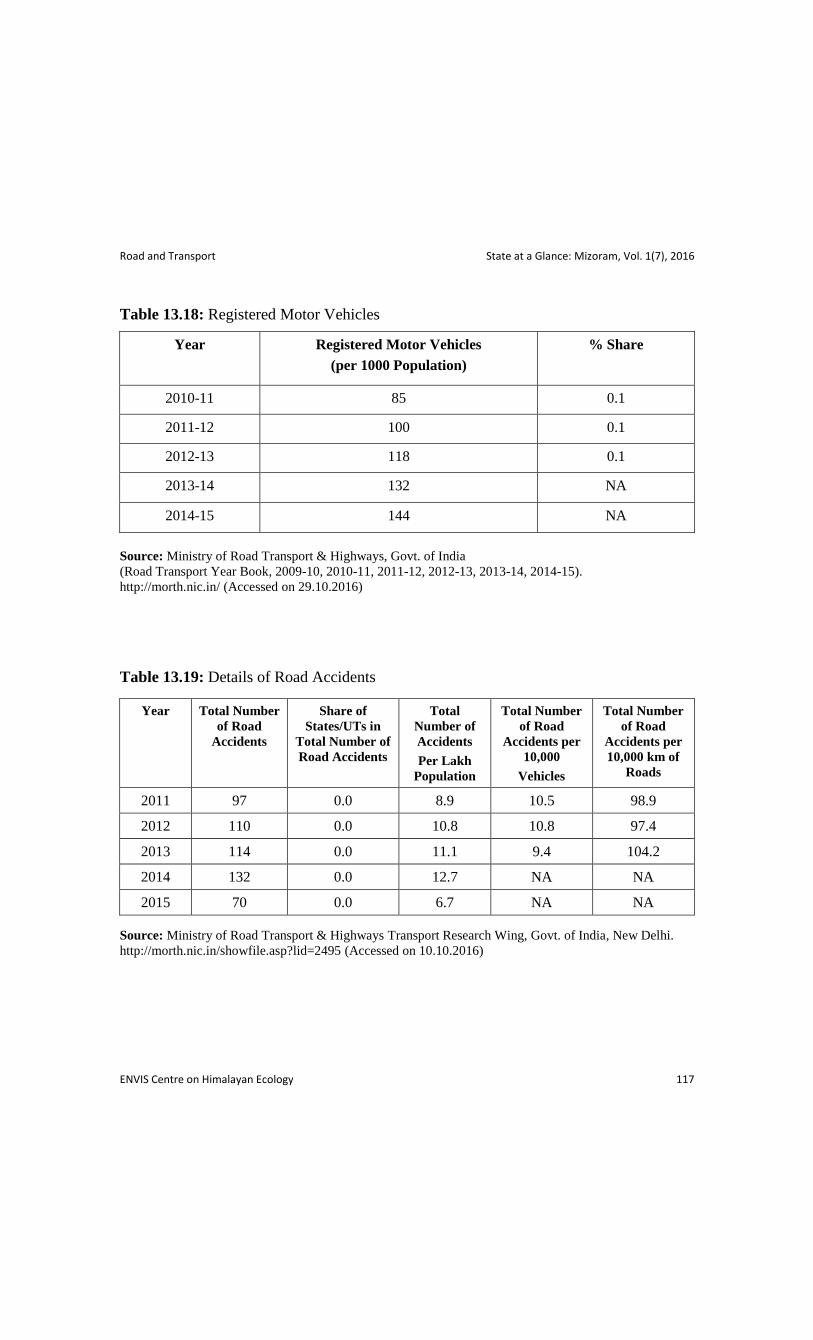
Road and Transport State at a Glance: Mizoram, Vol. 1(7), 2016
ENVIS Centre on Himalayan Ecology 117
Table 13.18: Registered Motor Vehicles
Year Registered Motor Vehicles
(per 1000 Population)
% Share
2010-11 85 0.1
2011-12 100 0.1
2012-13 118 0.1
2013-14 132 NA
2014-15 144 NA
Source: Ministry of Road Transport & Highways, Govt. of India
(Road Transport Year Book, 2009-10, 2010-11, 2011-12, 2012-13, 2013-14, 2014-15).
http://morth.nic.in/ (Accessed on 29.10.2016)
Table 13.19: Details of Road Accidents
Year Total Number
of Road
Accidents
Share of
States/UTs in
Total Number of
Road Accidents
Total
Number of
Accidents
Per Lakh
Population
Total Number
of Road
Accidents per
10,000
Vehicles
Total Number
of Road
Accidents per
10,000 km of
Roads
2011 97 0.0 8.9 10.5 98.9
2012 110 0.0 10.8 10.8 97.4
2013 114 0.0 11.1 9.4 104.2
2014 132 0.0 12.7 NA NA
2015 70 0.0 6.7 NA NA
Source: Ministry of Road Transport & Highways Transport Research Wing, Govt. of India, New Delhi.
http://morth.nic.in/showfile.asp?lid=2495 (Accessed on 10.10.2016)

Road and Transport State at a Glance: Mizoram, Vol. 1(7), 2016
ENVIS Centre on Himalayan Ecology 118
Table 13.20: Details of Person Killed in Road Accidents
Year Total
Number of
Persons
Killed in
Road
Accidents
Share of
States/UTs in
Total Number of
Persons Killed in
Road Accidents
Total Number
of Persons
Killed in Road
Accidents
(per Lakh
Population)
Total Number
of Persons
Killed in Road
Accidents
(per 10,000
Vehicles)
Total Number of
Persons
Killed in Road
Accidents
(per 10,000 km
of Roads)
2011 81 0.1 7.4 8.7 82.6
2012 77 0.1 7.6 7.6 68.2
2013 97 0.1 9.4 8.0 88.7
2014 103 0.1 9.9 - -
2015 72 0.0 6.9 - -
Table 13.21: Details of Person Injured in Road Accidents
Year Total
Number of
Persons
Injured in
Road
Accidents
Share of
States/UTs in
Total Number
of Persons
Injured in
Road
Accidents
Total Number of
Persons
Injured in Road
Accidents
(per Lakh
Population)
Total Number
of Persons
Injured in
Road Accidents
(per 10,000
Vehicles)
Total Number of
Persons
Injured in Road
Accidents
(per10,000 km of
Road)
2011 215 0.04 19.7 23.2 219.2
2012 172 0.0 16.9 16.9 152.3
2013 264 0.1 25.7 21.8 241.3
2014 234 0.0 22.5 - -
2015 103 0.0 9.8 - -
Source (Tables 13.20-13.21): Ministry of Road Transport & Highways Transport Research Wing: Govt. of
India, New Delhi.
http://morth.nic.in/ (Accessed on 10.10.2016)

Road and Transport State at a Glance: Mizoram, Vol. 1(7), 2016
ENVIS Centre on Himalayan Ecology 119
Table 13.22: Types of Accidents (2015)
Type of Accidents Number
Fatal Accidents 50
Grievous Injury Accidents 15
Minor Injury Accidents 1
Non-Injury Accidents 4
Total Accidents 70
Table 13.23: Severity* of Road Accidents
Year Number
2011 83.5
2012 70
2013 85.1
2014 78
2015 102.9
* Accident Severity: Road accident deaths per 100 accidents

Road and Transport State at a Glance: Mizoram, Vol. 1(7), 2016
ENVIS Centre on Himalayan Ecology 120
Table 13.24: Number of accidents/ persons killed/ persons injured in road accidents in
Urban & Rural areas
Year Urban Rural Total
Total Injured Killed Total Injured Killed Total Injured Killed
2013 46 24 79 68 73 185 114 97 264
2014 70 42 83 62 61 151 132 103 234
2015 36 31 34 34 41 69 70 72 103
Source (Tables 13.23-13.24): Ministry of Road Transport & Highways Transport Research Wing, Govt. of
India, New Delhi.
http://morth.nic.in/ (Accessed on 10.10.2016)
Miscellaneous State at a Glance: Mizoram, Vol. 1(7), 2016
ENVIS Centre on Himalayan Ecology 121
Miscellaneous
14.1: Number of Tourists Arrived
14.2: District-wise Number of Tourist Spots, Tourist Lodges, Availability of Rooms
and Beds
14.3: Number of Registered Newspapers and Periodicals
14.4: Number of Registered Newspapers and Periodicals by Language
14.5: Incidence of Cognizable Crime under IPC
14.6: Juveniles Delinquency IPC Cases
14.7: Physical Outcomes under MGNREGA
14.8: Status and Achievements of Postal Services
14.9: Number of Commercial Banks
14.10: Trends in Government Employees by Sex
14.11: Fire Service Statistics
14.12: Number of Fair Price Shops in Mizoram
14.13: Number of Gas Agencies, Domestic Subscribers & Petrol Pumps
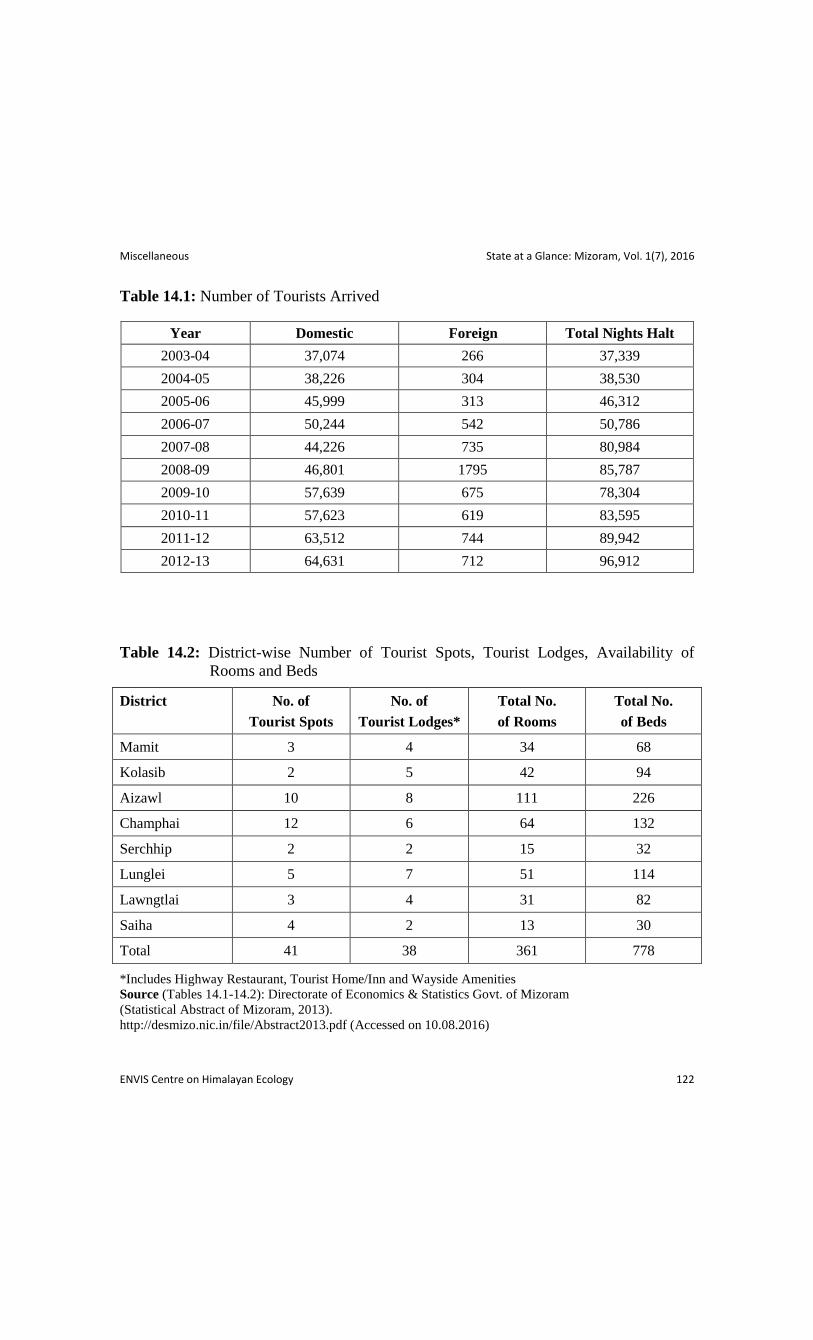
Miscellaneous State at a Glance: Mizoram, Vol. 1(7), 2016
ENVIS Centre on Himalayan Ecology 122
Table 14.1: Number of Tourists Arrived
Year Domestic Foreign Total Nights Halt
2003-04 37,074 266 37,339
2004-05 38,226 304 38,530
2005-06 45,999 313 46,312
2006-07 50,244 542 50,786
2007-08 44,226 735 80,984
2008-09 46,801 1795 85,787
2009-10 57,639 675 78,304
2010-11 57,623 619 83,595
2011-12 63,512 744 89,942
2012-13 64,631 712 96,912
Table 14.2: District-wise Number of Tourist Spots, Tourist Lodges, Availability of
Rooms and Beds
District No. of
Tourist Spots
No. of
Tourist Lodges*
Total No.
of Rooms
Total No.
of Beds
Mamit 3 4 34 68
Kolasib 2 5 42 94
Aizawl 10 8 111 226
Champhai 12 6 64 132
Serchhip 2 2 15 32
Lunglei 5 7 51 114
Lawngtlai 3 4 31 82
Saiha 4 2 13 30
Total 41 38 361 778
*Includes Highway Restaurant, Tourist Home/Inn and Wayside Amenities
Source (Tables 14.1-14.2): Directorate of Economics & Statistics Govt. of Mizoram
(Statistical Abstract of Mizoram, 2013).
http://desmizo.nic.in/file/Abstract2013.pdf (Accessed on 10.08.2016)

Miscellaneous State at a Glance: Mizoram, Vol. 1(7), 2016
ENVIS Centre on Himalayan Ecology 123
Table 14.3: Number of Registered Newspapers and Periodicals (as on 31st
March)
Details 2008-09 2009-10 2010-11 2011-12 2012-13 2013-14
Daily 45 46 47 48 48 49
Bi/Tri Weekly 14 14 14 14 14 15
Weekly 38 38 38 40 40 40
Fortnightly 7 7 7 8 8 8
Monthly 26 37 43 44 48 48
Quarterly 6 6 8 8 8 9
Annual - - 0 0 0 0
Others 4 4 6 6 7 7
Total 140 152 163 168 173 176
Table 14.4: Number of Registered Newspapers and Periodicals by Language
Year 2008-09 2009-10 2010-11 2011-12 2012-13 2013-14
English 4 4 5 5 5 5
Hindi - - - - 0 0
Assamese - - - - 0 0
Bengali - - - - 0 0
Oriya - - - - 0 0
Bi-lingual 10 10 10 10 10 10
Multi-lingual 6 7 7 7 7 7
Others 120 131 141 146 151 154
Total 140 152 163 168 173 176
Source (Tables 14.3-14.4): Registrar of Newspapers for India, Ministry of Information and Broadcasting,
Department of Agriculture, Cooperation and Farmers Welfare; Ministry of Statistics &
Programme Implementation, Govt. of India (Statistical Year Book, India, 2016).
http://www.mospi.gov.in/statistical-year-book-india/2016 (Accessed on 03.06.2016)
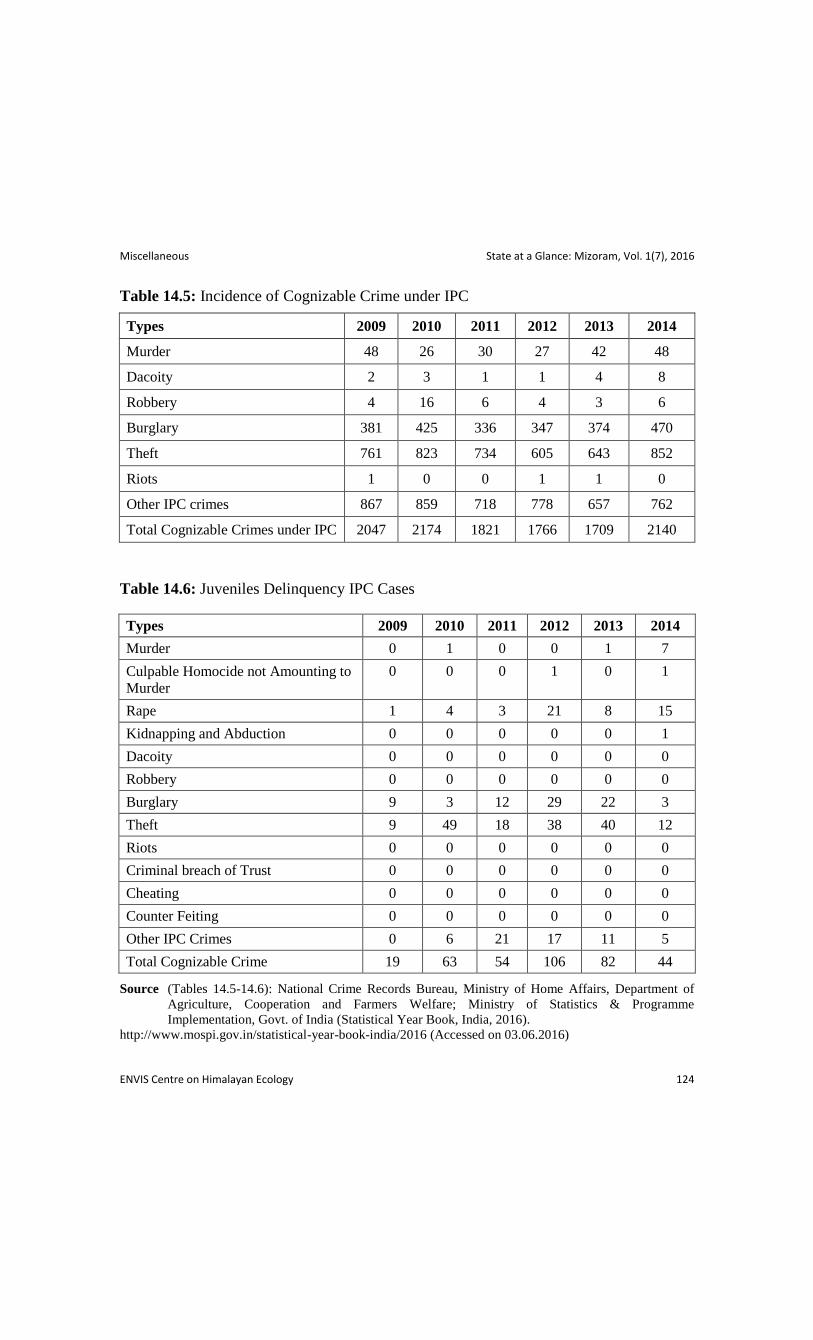
Miscellaneous State at a Glance: Mizoram, Vol. 1(7), 2016
ENVIS Centre on Himalayan Ecology 124
Table 14.5: Incidence of Cognizable Crime under IPC
Types 2009 2010 2011 2012 2013 2014
Murder 48 26 30 27 42 48
Dacoity 2 3 1 1 4 8
Robbery 4 16 6 4 3 6
Burglary 381 425 336 347 374 470
Theft 761 823 734 605 643 852
Riots 1 0 0 1 1 0
Other IPC crimes 867 859 718 778 657 762
Total Cognizable Crimes under IPC 2047 2174 1821 1766 1709 2140
Table 14.6: Juveniles Delinquency IPC Cases
Types 2009 2010 2011 2012 2013 2014
Murder 0 1 0 0 1 7
Culpable Homocide not Amounting to
Murder
0 0 0 1 0 1
Rape 1 4 3 21 8 15
Kidnapping and Abduction 0 0 0 0 0 1
Dacoity 0 0 0 0 0 0
Robbery 0 0 0 0 0 0
Burglary 9 3 12 29 22 3
Theft 9 49 18 38 40 12
Riots 0 0 0 0 0 0
Criminal breach of Trust 0 0 0 0 0 0
Cheating 0 0 0 0 0 0
Counter Feiting 0 0 0 0 0 0
Other IPC Crimes 0 6 21 17 11 5
Total Cognizable Crime 19 63 54 106 82 44
Source (Tables 14.5-14.6): National Crime Records Bureau, Ministry of Home Affairs, Department of
Agriculture, Cooperation and Farmers Welfare; Ministry of Statistics & Programme
Implementation, Govt. of India (Statistical Year Book, India, 2016).
http://www.mospi.gov.in/statistical-year-book-india/2016 (Accessed on 03.06.2016)

Miscellaneous State at a Glance: Mizoram, Vol. 1(7), 2016
ENVIS Centre on Himalayan Ecology 125
Table 14.7: Physical Outcomes under MGNREGA
Year 2010-11 (P) 2011-12 (P) 2012-13 (P)
Total Works Taken-up 3320 11844 12344
Wo
rk (
Ass
ests
) co
mp
lete
d
Rural Connectivity 1349 1042 3308
Flood Control and Protection 105 61 178
Water Conservation and Water Harvesting 143 23 138
Drought Proofing 502 161 313
Micro Irrigation Works 7 3 15
Provision of Irrigation facility to Land Owned by 6 0 0
Renovation of Traditional Water bodies 4 3 20
Land Development 386 167 723
Any Other activity Approved by MRD 8 83 489
Rajiv Gandhi Seva Kendra NA 26 32
Total 2510 1569 5216
% Age of Works Completed 75.6 13.2 42.3
Source: Ministry of Rural Development, Department of Agriculture, Cooperation and Farmers Welfare. Ministry of
Statistics & Programme Implementation, Government of India (Statistical Year Book, India, 2016
http://www.mospi.gov.in/statistical-year-book-india/2016 (Accessed on 03.06.2016)
Table 14.8: Status and Achievements of Postal Services (2014-15)
Number of Post Offices in Mizoram Division
Head Post Office 1
Sub-Post Offices 38
Total 389
Revenue Collection (i.e. up to 10th February, 2015)
Postal Life Insurance Rs. 2,88,10,119.00
Rural Postal Life Insurance Rs. 1,04,45,424.00
Total Rs. 3,92,55,543.00
Sale of Postage Stamps Rs. 74,99,036.30
Savings Bank Target Rs. 8,00,00,000.00
Achievement Rs. 3,96,00,000.00
Business Development Rs. 1,97,60,920.30
Source: Government of Mizoram Planning & Programme Implementation Department (Research & Development
Branch), Govt. of Mizoram (Mizoram Economic Survey, 2014-15).
http://www.mizofin.nic.in/file/b%2015-16/Mizoram%20Economic%20Survey%202014-15.pdf
(Accessed on 10.08.2016)

Miscellaneous State at a Glance: Mizoram, Vol. 1(7), 2016
ENVIS Centre on Himalayan Ecology 126
Table 14.9: Number of Commercial Banks in Mizoram
Year
Nationalized Banks Regional
Rural
Banks
State
Cooperative
Banks
Other
Commercial
Banks (MUCO)
Total SBI Others
2003-04 24 2 53 10 1 90
2004-05 24 2 54 11 1 92
2005-06 24 2 54 11 1 92
2006-07 26 3 54 11 1 97
2007-08 26 9 60 11 1 107
2008- 09 26 11 60 11 1 109
2009-10 29 11 61 11 1 113
2010-11 31 13 62 12 1 119
2011-12 29 21 64 13 1 128
2012-13 31 26 71 12 1 141
Table 14.10: Trends in Government Employees by Sex
Year
Males Females
Total
Number of females
per 1000 male
employees Nos. Percentage Nos. Percentage
1981 15,816 83.98 3,015 16.01 18,831 191
1983 17,058 82.83 3,536 17.17 20,594 207
1985 22,453 82.84 4,651 17.16 27,104 207
1987 24,007 80.98 5,637 19.02 29,644 235
1994 31,910 78.95 8,510 21.05 40,420 267
1996 33,229 77.99 9,380 22.01 42,609 282
1998 37,002 79.28 9,672 20.72 46,674 261
2000 38,919 78.01 10,973 22.00 49,892 282
2002 39,564 78.00 11,157 22.00 50,721 282
2008 42,206 75.05 13,457 23.93 56,239 319
2009 40,219 74.96 13,434 25.03 53,653 329
2012 41,400 74.64 14,065 25.36 55,465 340

Miscellaneous State at a Glance: Mizoram, Vol. 1(7), 2016
ENVIS Centre on Himalayan Ecology 127
Table 14.11: Fire Service Statistics
Year Incident
(in Nos.)
Loss of Life Injuries in Nos. Property
Damaged
(` in Lakhs)
Property
Salvaged
(` in Lakhs)
No. of
Fire
Stations Major Minor
2003 - 04 110 - - 1 44.02 139.25 7
2004 - 05 135 3 - 7 145.35 122.40 7
2005 - 06 192 - - 12 432.28 547.13 7
2006 - 07 155 - - - 72.14 340.06 7
2007 - 08 68 1 - 1 127.70 1119.56 8
2008 - 09 177 4 - 9 1208.78 67.74 8
2009 - 10 198 8 16 16 230.47 36.31 8
2010 - 11 143 2 - - 138.86 93.40 8
2011 - 12 270 5 - - 1270.99 977.74 8
2012 - 13 477 6 - 10 1035.31 3103.07 9
(-) Nil; Note: Fire data for Mamit District is not available; *Including Tlabung Fire Station
Source (Tables 14.9-14.11): Directorate of Economics & Statistics, Govt. of Mizoram
(Statistical Abstract of Mizoram, 2013).
http://desmizo.nic.in/file/Abstract2013.pdf (Accessed on 10.08.2016)
Table 14.12: Number of Fair Price Shops
Year No. of Fair Price Shops Total
Rural Urban
2003-04 - - 1091
2004-05 - - -
2005-06 - - 1058
2006-07 818 387 1205
2007-08 814 391 1205
2008- 09 829 397 1226
2009- 10 834 405 1239
2010- 11 838 406 1244
2011- 12 817 370 1187
2012-13 824 373 1197
(-) Data not Available

Miscellaneous State at a Glance: Mizoram, Vol. 1(7), 2016
ENVIS Centre on Himalayan Ecology 128
Table 14.13: Number of Gas Agencies, Domestic Subscribers & Petrol Pumps
Year No. of Gas Agencies No. of LPG Domestic
Subscribers
No. of Petrol Pumps
2003-04 19 1,53,061 N.R.
2004-05 19 - N.R.
2005-06 20 1,61,247 12
2006-07 21 1,79,737 15
2007-08 24 1,89,168 18
2008-09 21 1,91,779 23
2009-10 24 2,01,546 25
2010-11 24 2,55,703 25
2011-12 24 2,43,785 27
2012-13 33 2,56,015 26
Source (Tables 14.12-14.13): Directorate of Economics & Statistics, Govt. of Mizoram
(Statistical Abstract of Mizoram, 2013).
http://desmizo.nic.in/file/Abstract2013.pdf (Accessed on 10.08.2016)

Web Directory State at a Glance: Mizoram, Vol. 1(7), 2016
ENVIS Centre on Himalayan Ecology 129
Web Directory
List of Tables
15.1: List of Apex Bodies
15.2: Legislative Assembly and Council
15.3: Districts (Official Website)
15.4: Directorate, Divisions/ Units/ Wings
15.5: State Departments
15.6: Boards / Undertakings

Web Directory State at a Glance: Mizoram, Vol. 1(7), 2016
ENVIS Centre on Himalayan Ecology 130
Table 15.1: List of Apex Bodies
Name Web Address
Raj Bhawan, Mizoram https://rajbhavan.mizoram.gov.in/
Chief Minister of Mizoram https://cmonline.mizoram.gov.in/
Official Portal of Mizoram Government http://mizoram.nic.in/
State Election Commission (SEC), Mizoram https://sec.mizoram.gov.in/
Mizoram Finance Commission http://mizofincom.nic.in/
State Information Commission (SIC), Mizoram https://mic.mizoram.gov.in/page/Profile.html
Mizoram Public Service Commission https://mpsc.mizoram.gov.in/
Table 15.2: Legislative Assembly and Council
Name Web Address
Legislative Assembly (Vidhan Sabha), Mizoram http://www.mizoramassembly.in/
Table 15.3: Districts (Official Website)
S.N. Name Web Address
1 Aizawl http://aizawl.nic.in/
2 Champhai http://champhai.nic.in/
3 Kolasib http://kolasib.nic.in/
4 Lawngtlai http://lawngtlai.nic.in/
5 Lunglei http://lunglei.nic.in/
6 Mamit http://mamit.nic.in/
7 Saiha http://saiha.nic.in/
8 Serchhip http://serchhip.nic.in/
Source (Tables 15.1-15.3): National Portal Secretariat, National Informatics Centre, New Delhi, India.
http://goidirectory.nic.in (Accessed on 25.11.2016)
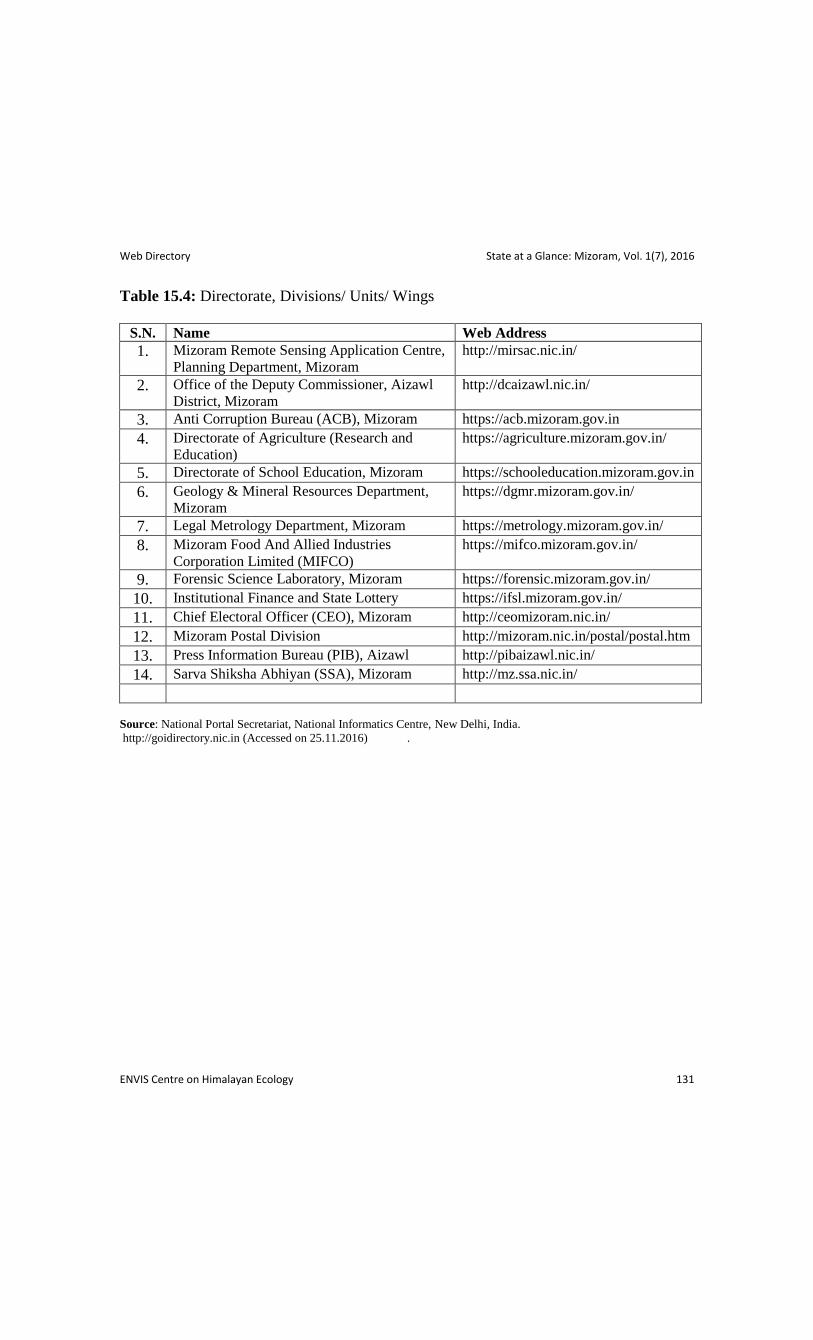
Web Directory State at a Glance: Mizoram, Vol. 1(7), 2016
ENVIS Centre on Himalayan Ecology 131
Table 15.4: Directorate, Divisions/ Units/ Wings
S.N. Name Web Address
1. Mizoram Remote Sensing Application Centre,
Planning Department, Mizoram http://mirsac.nic.in/
2. Office of the Deputy Commissioner, Aizawl
District, Mizoram http://dcaizawl.nic.in/
3. Anti Corruption Bureau (ACB), Mizoram https://acb.mizoram.gov.in
4. Directorate of Agriculture (Research and
Education)
https://agriculture.mizoram.gov.in/
5. Directorate of School Education, Mizoram https://schooleducation.mizoram.gov.in
6. Geology & Mineral Resources Department,
Mizoram
https://dgmr.mizoram.gov.in/
7. Legal Metrology Department, Mizoram https://metrology.mizoram.gov.in/
8. Mizoram Food And Allied Industries
Corporation Limited (MIFCO)
https://mifco.mizoram.gov.in/
9. Forensic Science Laboratory, Mizoram https://forensic.mizoram.gov.in/
10. Institutional Finance and State Lottery https://ifsl.mizoram.gov.in/
11. Chief Electoral Officer (CEO), Mizoram http://ceomizoram.nic.in/
12. Mizoram Postal Division http://mizoram.nic.in/postal/postal.htm
13. Press Information Bureau (PIB), Aizawl http://pibaizawl.nic.in/
14. Sarva Shiksha Abhiyan (SSA), Mizoram http://mz.ssa.nic.in/
Source: National Portal Secretariat, National Informatics Centre, New Delhi, India.
http://goidirectory.nic.in (Accessed on 25.11.2016) .

Web Directory State at a Glance: Mizoram, Vol. 1(7), 2016
ENVIS Centre on Himalayan Ecology 132
Table 15.5: State Departments
S.N. Name Web Address
1. Agriculture Department
1. Directorate of Agriculture (Research and
Education)
2. Mizoram Agricultural Marketing
Corporation Limited
http://agriculturemizoram.nic.in/
1. https://agriculture.mizoram.gov.in/
2. https://mamco.mizoram.gov.in/
2. Animal Husbandry and Veterinary
Department, Mizoram
https://ahvety.mizoram.gov.in/
3. Art and Culture Department, Mizoram https://mizoculture.mizoram.gov.in/
4. Co-operation Department, Mizoram https://coop.mizoram.gov.in/
5. Disaster management and Rehabilitation
Department, Mizoram
https://dmr.mizoram.gov.in/
6. Economics and Statistics Department,
Mizoram
http://desmizo.nic.in/
7. Election Department, Mizoram https://sec.mizoram.gov.in/
8. Environment and Forest Department,
Mizoram
https://forest.mizoram.gov.in/
9. Excise and Narcotic Department, Mizoram https://excise.mizoram.gov.in/
10. Finance Department, Mizoram
1. Institutional Finance and State Lottery
2. Mizoram Finance Commission
http://mizofin.nic.in/
1. https://ifsl.mizoram.gov.in/
2. http://mizofincom.nic.in/
11. Fisheries Department, Mizoram https://fisheries.mizoram.gov.in/
12. Food and Civil Supplies Department,
Mizoram
1. Legal Metrology Department, Mizoram
2. Mizoram Food And Allied Industries
Corporation Limited (MIFCO)
3. PDS Portal of Mizoram, Food, Civil
Supplies and Consumer Affairs
Department, Mizoram
https://fcsca.mizoram.gov.in/
1. https://metrology.mizoram.gov.in/
2. https://mifco.mizoram.gov.in/
3. http://mizorampds.nic.in/
13. General Administration Department,
Mizoram
1. Civil Sub-Division, Vairengte,
Mizoram
2. Mizoram House, New Delhi
https://gad.mizoram.gov.in/
1. https://vairengte.mizoram.gov.in/
2. http://mizoramhouse.nic.in/

Web Directory State at a Glance: Mizoram, Vol. 1(7), 2016
ENVIS Centre on Himalayan Ecology 133
14. Health and Family Welfare Department,
Mizoram
1. Mizoram State AIDS Control Society
(MSACS)
2. Mizoram State Tobacco Control
Society
http://health.mizoram.gov.in/
1. http://mizoramsacs.nic.in/
2. https://tobaccocontrol.mizoram.gov.in/
15. Higher and Technical Education
Department, Mizoram
1. Mizoram University
https://dhte.mizoram.gov.in/
1. http://www.mzu.edu.in/
16. Home Department, Mizoram NA
17. Horticulture Department, Mizoram https://horticulture.mizoram.gov.in/
18. Industries Department, Mizoram
1. Geology & Mineral Resources
Department, Mizoram
2. Industrial Training Institute, Aizawl,
Mizoram
3. Mizoram Khadi and Village
Industries Board
4. Zoram Industrial Development
Corporation Limited (ZIDCO),
Mizoram
https://industries.mizoram.gov.in/
1. https://dgmr.mizoram.gov.in/
2. https://itiaizawl.mizoram.gov.in/
3. https://mizokvib.mizoram.gov.in/
4. https://zidco.mizoram.gov.in/
19. Information and Communication
Technology Department, Mizoram
1. Mizoram State E-Governance
Society
2. Mizoram State Wide Area Network
(MSWAN)
3. Zoram Electronics Development
Corporation Limited (ZENICS)
https://dict.mizoram.gov.in/
1. https://msegs.mizoram.gov.in/
2. https://swan.mizoram.gov.in/
3. https://zenics.mizoram.gov.in/
20. Information and Public Relations
Department, Mizoram
https://dipr.mizoram.gov.in/
21. Labour, Employment & Industrial Training
Department, Mizoram
https://let.mizoram.gov.in/
22. Land Revenue and Settlement Department,
Mizoram
New Land Use Policy, Mizoram
https://landrevenue.mizoram.gov.in/
https://nlup.mizoram.gov.in/
23. Law and Judicial Department, Mizoram https://landj.mizoram.gov.in/
24. Local Administration Department, Mizoram https://lad.mizoram.gov.in/
25. Minor Irrigation Department, Mizoram https://irrigation.mizoram.gov.in/
26. Personnel and Administrative Reforms
Department, Mizoram
Administrative Training Institute (ATI),
Mizoram
http://mizodpar.nic.in/
https://ati.mizoram.gov.in/

Web Directory State at a Glance: Mizoram, Vol. 1(7), 2016
ENVIS Centre on Himalayan Ecology 134
27. Planning and Programme Implementation
Department, Mizoram
https://planning.mizoram.gov.in/
28. Mizoram Remote Sensing Application
Centre, Planning Department, Mizoram
http://mirsac.nic.in/
29. Forensic Science Laboratory, Mizoram https://forensic.mizoram.gov.in/
30. Power and Electricity Department, Mizoram
1. Mizoram State Load Despatch
Centre (SLDC)
2. Zoram Energy Development
Agency (ZEDA), Mizoram
https://power.mizoram.gov.in/
1. https://sldc.mizoram.gov.in/
2. https://zeda.mizoram.gov.in/
31. Printing and Stationeries Department,
Mizoram
https://printingstationery.mizoram.gov.in/
32. Prison Department, Mizoram https://prisons.mizoram.gov.in/
33. Public Health Engineering Department,
Mizoram
http://phed.mizoram.gov.in/
34. Public Works Department, Mizoram https://pwd.mizoram.gov.in/
35. Rural Development Department, Mizoram
National Rural Employment Guarantee Act,
Mizoram
http://mizorural.nic.in/
http://mizonrega.nic.in/
36. Sainik Welfare & Resettlement Department,
Mizoram
https://sainikwr.mizoram.gov.in/
37. School Education Department, Mizoram
1. Directorate of School Education,
Mizoram
2. Mizoram Board of School
Education
3. Rashtriya Madhyamik Shiksha
Abhiyan (RMSA), Mizoram
http://mizoram.nic.in/dept/school.htm
1. https://schooleducation.mizoram.gov.in/
2. http://mbse.edu.in/
3. https://rmsa.mizoram.gov.in/
38. Science and Technology Department,
Mizoram
http://mirsac.nic.in/
39. Sericulture Department, Mizoram https://sericulture.mizoram.gov.in/
40. Social Welfare Department, Mizoram https://socialwelfare.mizoram.gov.in/
41. Sports and Youth Services Department,
Mizoram
https://sys.mizoram.gov.in/
42. Taxation Department, Mizoram http://zotax.nic.in/
43. Tourism Department, Mizoram https://tourism.mizoram.gov.in/
44. Trade and Commerce Department, Mizoram https://tradeandcommerce.mizoram.gov.in/
45. Transport Department, Mizoram https://transport.mizoram.gov.in/
46. Urban Development and Poverty Alleviation
Department, Mizoram
Aizawl Municipal Council, Mizoram
http://udpamizoram.nic.in/
https://amc.mizoram.gov.in/
47. Vigilance Department, Mizoram https://vigilance.mizoram.gov.in/
Source: National Portal Secretariat, National Informatics Centre, New Delhi, India.
http://goidirectory.nic.in (Accessed on 25.11.2016)

Web Directory State at a Glance: Mizoram, Vol. 1(7), 2016
ENVIS Centre on Himalayan Ecology 135
Table 15.6: Boards / Undertakings
S.N. Name Web Address
1. Mizoram Agricultural Marketing Corporation
Limited
https://mamco.mizoram.gov.in/
2. Mizoram Board of School Education http://mbse.edu.in/
3. Mizoram Khadi and Village Industries Board https://mizokvib.mizoram.gov.in/
4. Zoram Electronics Development Corporation
Limited (ZENICS)
https://zenics.mizoram.gov.in/
5. Zoram Industrial Development Corporation
Limited (ZIDCO), Mizoram
https://zidco.mizoram.gov.in/
6. Bamboo Development Agency, Mizoram http://mizobamboo.nic.in/
7. Mizoram State Tobacco Control Society https://tobaccocontrol.mizoram.gov.in/
8. Zoram Energy Development Agency (ZEDA),
Mizoram
https://zeda.mizoram.gov.in/
9. SCERT - State Council of Educational
Research and Training, Mizoram
https://scert.mizoram.gov.in/
Source: National Portal Secretariat, National Informatics Centre, New Delhi, India.
http://goidirectory.nic.in (Accessed on 25.11.2016)
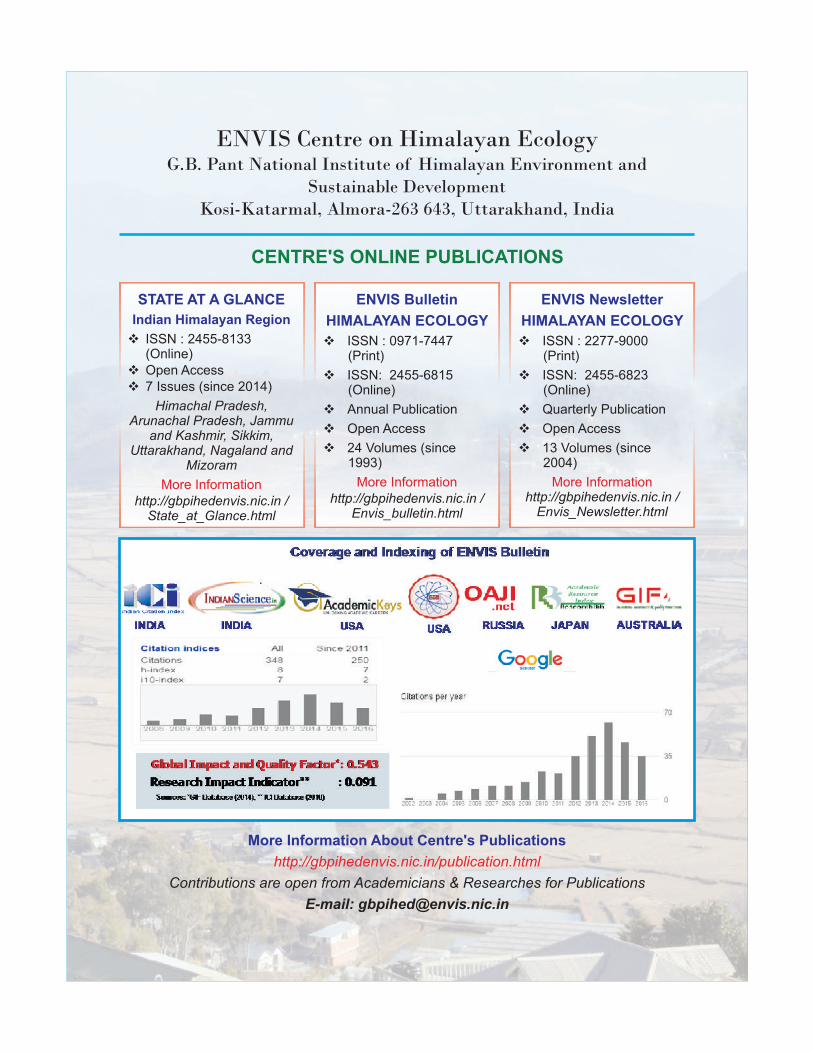
ENVIS Centre on Himalayan EcologyG.B. Pant National Institute of Himalayan Environment and
Sustainable DevelopmentKosi-Katarmal, Almora-263 643, Uttarakhand, India
CENTRE'S ONLINE PUBLICATIONS
STATE AT A GLANCE
Indian Himalayan Region
vISSN : 2455-8133 (Online)
vOpen Access v7 Issues (since 2014)
Himachal Pradesh, Arunachal Pradesh, Jammu
and Kashmir, Sikkim, Uttarakhand, Nagaland and
Mizoram
http://gbpihedenvis.nic.in / State_at_Glance.html
More Information
ENVIS Bulletin
HIMALAYAN ECOLOGY
vISSN : 0971-7447 (Print)
vISSN: 2455-6815 (Online)
vAnnual Publication
vOpen Access
v24 Volumes (since 1993)
http://gbpihedenvis.nic.in / Envis_bulletin.html
More Information
ENVIS Newsletter
HIMALAYAN ECOLOGY
vISSN : 2277-9000 (Print)
vISSN: 2455-6823 (Online)
vQuarterly Publication
vOpen Access
v13 Volumes (since 2004)
http://gbpihedenvis.nic.in / Envis_Newsletter.html
More Information
More Information About Centre's Publications
http://gbpihedenvis.nic.in/publication.html
Contributions are open from Academicians & Researches for Publications
E-mail: [email protected]
ENVIS CENTREHimalayan Ecology
G.B. Pant National Institute of Himalayan Environment and Sustainable Development Kosi-Katarmal, Almora-263 643, Uttarakhand, India
E-mail : [email protected] ENVIS URL : http://gbpihedenvis.nic.inGBPNIHESD URL : http://gbpihed.gov.in
ENVIS Centre on Himalayan Ecology at the G.B. Pant National Institute of
Himalayan Environment and Sustainable Development (GBPNIHESD) was
established in 1992-93 with the financial support from the Ministry of
Environment, Forest & Climate Change (MoEF&CC), Government of India,
New Delhi. The Centre is collecting, collating, compiling and building
quantitative and qualitative databases of information related to various
aspects of Himalayan Ecology. Through print/electronic media, the Centre is
regularly disseminating all available information, free of cost, to various
stakeholders/users, which include all District Information Centres (working
in the Himalayan states of the country), ENVIS Centres of the MoEF&CC
Universities, Research Centers, Engineering Colleges, Govt. Institutions,
NGOs and experts/individuals working in the Indian Himalayan Region
(IHR). The main mandate of the Centre is to spread environmental
awareness and help research and development in areas related to Himalayan
Ecology.
Consul
, Nain
ital