Embed Size (px)
Citation preview

Stat 217 – Week 10

Outline
Exam 2 Lab 7 Questions on Chi-square, ANOVA,
Regression HW 7 Lab 8
Notes for Thursday’s lab Notes for final exam Notes for final project report

Exam 2
Average around .78 Most common errors very easy to fix!
evaluation vs. interpretation of p-value Reject/Fail to reject Ho – make a decision What is it the probability of?
Interpretation of confidence interval vs. level I’m 95% confidence that – make parameter clear, context If I were to take thousands of intervals, what would be true
roughly 95% of the time What conclusions would you draw from this analysis?
Be sure to address significance, causation, and generalizability with brief justifications in each case.

Lab 3
Very good model for final project report Attention grabbing introduction
Purpose, predictions, why reader should continue Lots of data collection details (lots!) Full discussion of descriptive statistics, relate to
context, expectations Include output, tie inferential results back to
descriptive statistics, justify all statements Critique your study at end Proofreading, page breaks, organization, lead-ins,
formatting advice (see BB page)

Lab 3
Now Ho: =0 where represents the average price
difference in the population of all textbooks at the two stores (El Corral – Aida’s)
Ha: >0 t-statistic: 4.14, p-value = .000 (Minitab)
Strong evidence is a genuine difference on average As long as believe random sample, normal population
95% confidence interval for : (3.77, 11.35) I’m 95% confident that the average price difference is
between $3.77 and $11.35 per book Meaningful difference?

Two categorical variables
Compare observed counts to expected counts (under null model) for every cell of table
Test statistic: How to find test-statistic: Minitab
Expected counts, cell contributions, test statistic, p-value
Small p-value reject H0 at least one differs Technical conditions
All expected counts at least 5, randomness
cellsall expected
expectedobserved 22 )(

Minitab output

Last Time – Chi-square Tests
Whenever have a two-way table: Independent random samples, binary response
Ho: 1=2=3= =I
Independent random samples, categorical response Ho: population distributions are the same
Randomized experiment, categorical response Ho: No treatment effect
Random sample, two categorical variables Ho: No association between variable 1 and variable 2

One quantitative and one categorical When? Want to compare more than 2 means
Ho: 1=… = I Ha: not all the population means are equal
How? Compare variability between groups to variability within groups (sampling variability) F-statistic (larger than expect to get under Ho?)
One-sided p-value Minitab

Minitab output

Two quantitative variables
Creating and describing scatterplots Direction, form, strength Correlation coefficient r measures strength of
linear association Modeling a linear relationship
Using Minitab to determine the equation Using equation to make (reasonable) predictions
about response variable from explanatory variable Interpretation of slope and intercept in context
bxay ˆ

Last Time – Two quantitative variables Ho: no association or =0 Ha: is an/positive/negative association Minitab output
t test statistic from “coefficient of x” row two-sided p-value SE(b) = amount of random variation of slopes
from sample to sample Strength of evidence (p-value) vs. strength of
association
P. 605

Example: Gesell data
Can we predict later intelligence based on when the child first speaks?
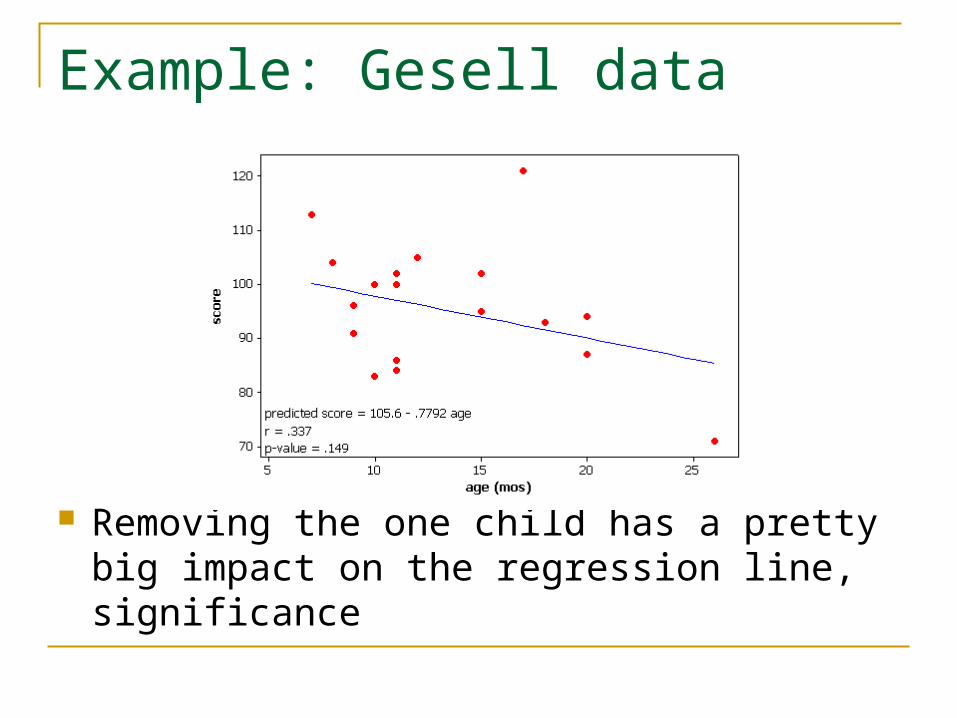
Removing the one child has a pretty big impact on the regression line, significance
Example: Gesell data

Example: Gesell data
Best conclusion? Some evidence that children who take a
particularly long time to speak may have lower IQ scores, but otherwise no relationship between age of first words and later IQ.
For children who take between 5 and 20 months, no relationship…

This week
HW 7 due tomorrow Lab 8 due Thursday Course evaluations Thursday in lab
Mandatory! Time in lab: review questions (Rebecca), finish
Lab 8, finish final project report
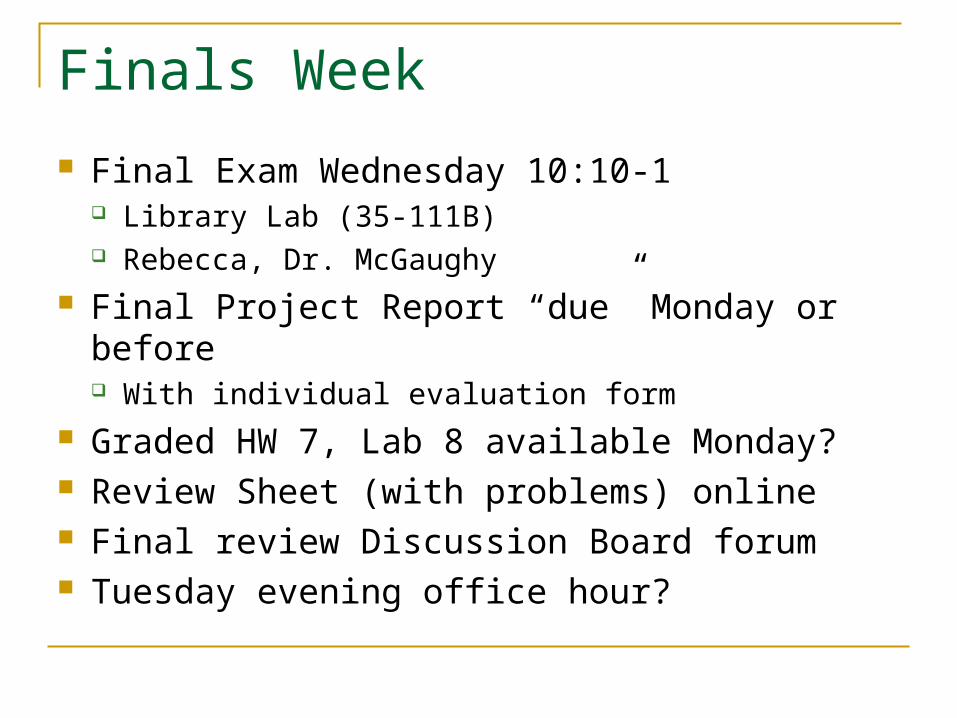
Finals Week
Final Exam Wednesday 10:10-1 Library Lab (35-111B) Rebecca, Dr. McGaughy
Final Project Report “due” Monday or before With individual evaluation form
Graded HW 7, Lab 8 available Monday? Review Sheet (with problems) online Final review Discussion Board forum Tuesday evening office hour?

Format of Final Exam
Multiple choice (~30-40 min, ~20%) Big ideas, not memorization, little calculation
(calculator) Short, long written answers
Like midterms, partial credit Open 3 pages of notes (to be turned in), Minitab, TOS
Calculator applet Cumulative though some emphasis on more recent
material Some very familiar questions Recognizing which procedure to use Sampling distributions!
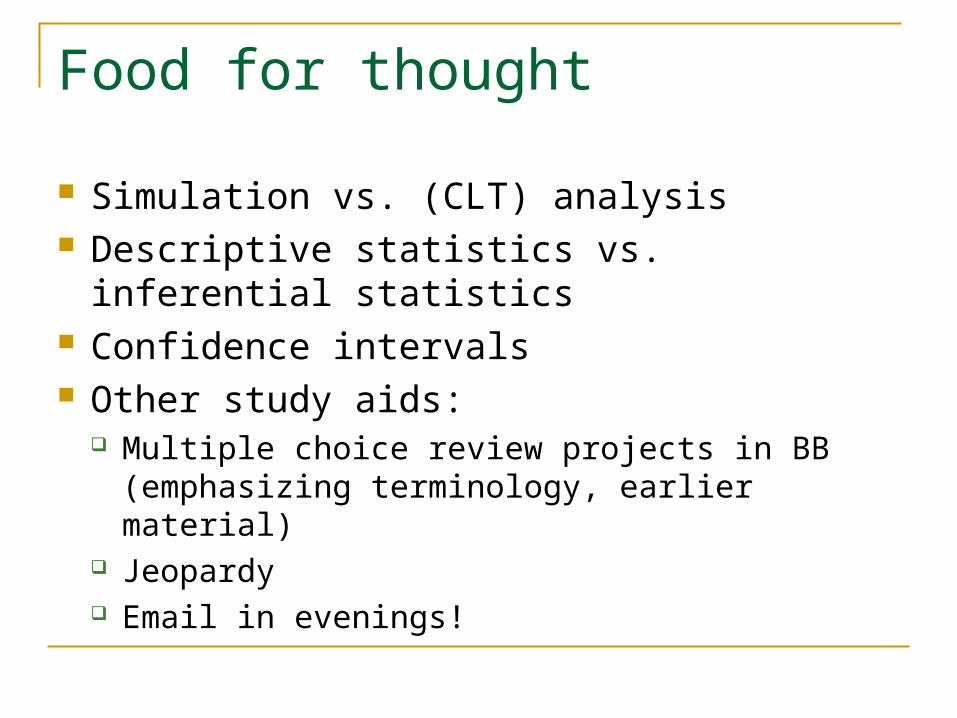
Food for thought
Simulation vs. (CLT) analysis Descriptive statistics vs. inferential statistics Confidence intervals Other study aids:
Multiple choice review projects in BB (emphasizing terminology, earlier material)
Jeopardy Email in evenings!

Submitting final project
Either hard copy to Stat Department office or email Make sure you email your data file to me See notes and reminders in Blackboard

Thanks!!