Embed Size (px)
Citation preview
JOURNAL OF RESEARCH of the Notional Bure~u of Standards-A. Physics and Chemistry Vol. 74A, No.6, November-December 1970
Stark Effect and Hyperfine Structure of HeN Measured With an Electric Resonance Maser Spectrometer
H. E. Radford * and C. V. Kurtz
Institute for Basic Standards, National Bureau of Standards, Washington, D.C. 20234
(July 20, 1970)
Tne 449 MHz !·type doub ling spectrum of HeN has bee n measu red to high precision with a molecul ar beam maser spectromete r. Hyperfi ne s tru cture due to both the nitrogen nucleus and the proton was resolved, and the coupling co nst.ant of the proton I . J interac tion was found to be - 27.3 ± 1.6 kHz. The spectrometer is also suited to precise meas ure ments of Stark effects in molecules of the linear and sy mmetri c top variety , and Stark shifts of up to 10' times the zero-field line width have been measured in the HeN spectrum. Analysis of these measure me nt s yie lds the value /J. = 2.940 ± 0.001 0 for the dipole moment of the V2 = 1 st.ate of HeN.
Ke y words: Dipole moment ; HeN resonance spec trum ; maser spec trome ter; Stark effec t; voltage s tandard .
1. Introduction
An electric resonance spectrometer is a microwave spectrometer tuned by the molecular Stark effec t: A variable electric field, in an electrode structure called a Stark cell, is used to bring spectral lines into resonance, one at a time, with a fixed-frequency oscillator. It is essential that the electric field be uniform and exac tly related to the applied voltage. When, as is customary, the Stark cell has the form of a parallel plate capacitor, the critical factors are the flatness, parallelism, and cleanliness of the two plates , and the thermal stability of their mounting. The best such Stark cells have been made from metallized optical flats, separated by ground quartz spacers and mounted in vacuum [1].t
Given a uniform and stable Stark field, the chief remaining design problem of an electric resonance spectrometer is that of superposing a radio frequency or microwave alternating field on the doc Stark field. Furthermore, if molecules enter the uniform field through a region of nonuniform field, as at the edges of a parallel plate capacitor, the alternating field must be excluded from such regions. This injecting and shaping of alternating fields has been done in two ways: For
, work at radio frequencies, lines can be scratched in the metal coating of the optical flats, making a pattern of radio frequency electrodes and guards which, when connected to a source oscillator, excite the radio frequency field and confine it to the correct region [2]. For work at high microwave frequencies the Stark electrodes can double as a parallel plate waveguide or
*Presenl address: Smithsonian Astrophysical Observatory, Cambridge. Mass. 02140. I Figures in brackets indica te the literature referen ces a t the end of this paper.
Fabry-Perot resonator [3, 4], microwave energy being fed in and confined by an array of coupling holes, or horns and lenses .
These methods have their disadvantages. The radio frequency method requires a conventional molecular beam s pectrometer, a complex apparatus, and is difficult to use at the high frequen cies that correspond to large Stark shifts . Of the high frequency methods , the Fabry-Perot resonator works well in a simple microwave absorption spectrometer but suffers from the fact that the spacing of the plates determines their microwave properties as well as the strength and uniformity of the Stark field. The parallel plate waveguide cell has not been tri ed, but probably would give sufficient resolution only in a molecular beam apparatus, since molecules would have to be kept out of the edge regions where the microwave beam enters and leaves the Stark cell.
This paper describes a new type of electric resonance spectrometer, one in which the Stark cell is made into a half-wave parallel line resonator. While providing a convenient distribution of radio frequency field strength, this type of Stark cell is free of the high frequency limitation of the electrode-and-guard method and also free of the spacing sensitivity of the FabryPerot method. A novel Q-enhancing technique permits the spectrometer to be operated as a beam maser, an apparatus that offers the high resolution of a conventional molecular beam spectrometer with considerable reduction in its complexity.
As a test molecule for the electric resonance maser, HeN was chosen. Microwave absorption measurements [5] had established the frequencies of its UHF spectrum with fair precision, and the Stark effect of
791

this spectrum was expected to be both large and easy to interpret. Since completing observations on the HeN spectrum, we have learned of similar work at Harvard University by Tomasevich and Klemperer [6], with a conventional molecular beam apparatus. Together with observations on the low radio·frequency Stark spectra of HeN and DeN, they report observations on the UHF spectrum of HeN which are essentially identical to those reported here, and of equal precision.
2. Apparatus
The mechanics of molecular beam masers are well known, and need be mentioned only briefly. Gas mole· cules effuse into a high vacuum vessel and a fraction of them, those entering in roughly the right direction and occupying certain energy states, are focused into a beam by an electrostatic state selector, a cylindrical bundle of rods wired to give a high potential difference between each adjacent pair of rods. The unfocused mao jority of molecules is removed, either by vacuum pumps or, in the case of condensible gases like HeN, by the more economical means of a cold trap. The state selector-cold trap assembly of the present maser was constructed by H. Takuma, for original service in a low radio frequency beam maser [7]. Vacuum pumping for the entire system is done by a single 4-in oil diffusion pump_
From the state selector, the beam passes into a highQ resonator, which is driven at its resonance frequency by an rf oscillator. If this frequency is tuned to the energy separation of two molecular states, one of which is focused and the other not, then transitions induced in the beam molecules by the rf field will change the energy density within the resonator, and this change can be detected by a sensitive receiver coupled to the resonator. 'As in the convention1;l1 molecular beam spectrometer, the minimum width of the resonance line is determined by the time of flight of a typical beam molecule through the resonator, and is very small, a few kHz or less.
2.1. Waveguide-Shielded Linear Resonators
Because of their propensity to radiate, parallel transmission lines and other linear resonators ordinarily make poor, low Q resonators at UHF and higher frequencies, but this failing can be corrected through an elegant stratagem devised by Halford [8]. The principle is to prevent the resonator from radiating by depriving it of electromagnetic field modes which can accept its radiation. Although this might seem difficult to do, it is not. One simply puts the resonator-into a section of rectangular waveguide which is small enough to support only one mode of propagation, the so-called dominant mode, and then one orients the resonator so that its radiation field is orthogonal to the waveguide field. Actually, perfect orthogonality of the two fields is not possible nor is it desirable, since a residual coupling is useful for exciting the resonator and for monitoring its behavior. Halford, working with helical resonators at X-band frequencies, used the waveguide simultaneously as a transmission line for this purpose.
At lower frequencies, where long runs of waveguide are awkward, it is equally effective to short-circuit both ends of the waveguide and couple to its internal field with electric probes and coaxial cables.
We have found that a variety of unlikely looking metal shapes become high-Q resonators when placed inside the waveguide. A straight wire dipole, the sort of thing often used as an antenna because of its efficiency as a radiator, becomes a half-wave resonator with a Q of several thousand. Bent into a helical coil, the dipole retains most of its Q and works well as a miniature cavity for paramagnetic resonance experiments [9]. Other high-Q resonators include half-wave lengths of wire or strip stock bent into semicircular ., form, and full wavelengths bent into circular form, and also the parallel line shapes that these curved resonators take when flattened. Tests conducted at UHF and S-band frequencies on these various shapes, made of copper and with dimensions scaled according to the wavelength, showed no strong dependence of the Q on frequency. The highest Q's were measured for resonators made of thin strip stock, approximately 1/8 wavelength wide, supported well away from the waveguide walls by dielectric posts which were attached to the resonators at voltage node points_ When oriented so as to couple very lightly to the waveguide field, these strip resonators had Q's of 6000 or more. Except for the parallel-line types, where line spacings less than about 1/30 wavelength were deleterious, the shape of the strip resonators had no effect on the Q.
2.2. The Stark Cell Resonator
Metallized glass flats are lossy at UHF frequencies, and it seemed unlikely that a resonator of reasonable Q could be made out of a traditional Stark cell, even though the geometry was roughly correct. Instead, the resonator was made from two rectangular slabs of solid aluminum, 2.5 X 10 X 20 cm, ground flat to ± 2 X 10⁻⁵ cm over their entire inner surfaces. The slabs were cross-cut from a 30 cm diam billet of type 2024 aluminum, stress-relieved, and ground under I
the supervision of S_ Gerner in the NBS optical shop. 1
The aluminum flats are mounted with their 10 cm dimension vertical, separated by four quartz spacers ground to a length of 1.00000 ± 0.00005 cm. Light spring pressure establishes the contact between flats and spacers_ Folded quarter-wave lines, made of copper sheet interleaved with PTFE, are mounted near the ends of the flats and make spring-finger contact with them. By providing rf short circuits while maintaining doc insulation, these folded lines make the assembly into a half-wave resonator and still permit doc voltages to be applied to the flats. A halfwave resonator is used, in spite of its somewhat inconvenient length as compared to a quarter-wave resonator, because of its more favorable rf field distribution. The rf electric field intensity is zero at the two ends of a half-wave resonator and is weak for a considerable distance inward_ Hence, beam molecules are unlikely to undergo rf transitions in the two end regions, where the fringing component of the doc field is appreciable. Fringing fields from the edges
792
_I
of the r esonator, and local fi eld perturbations due to the quartz spacers, are kept away from the molecular beam path by making the aluminum flats broad as compared to the gap width.
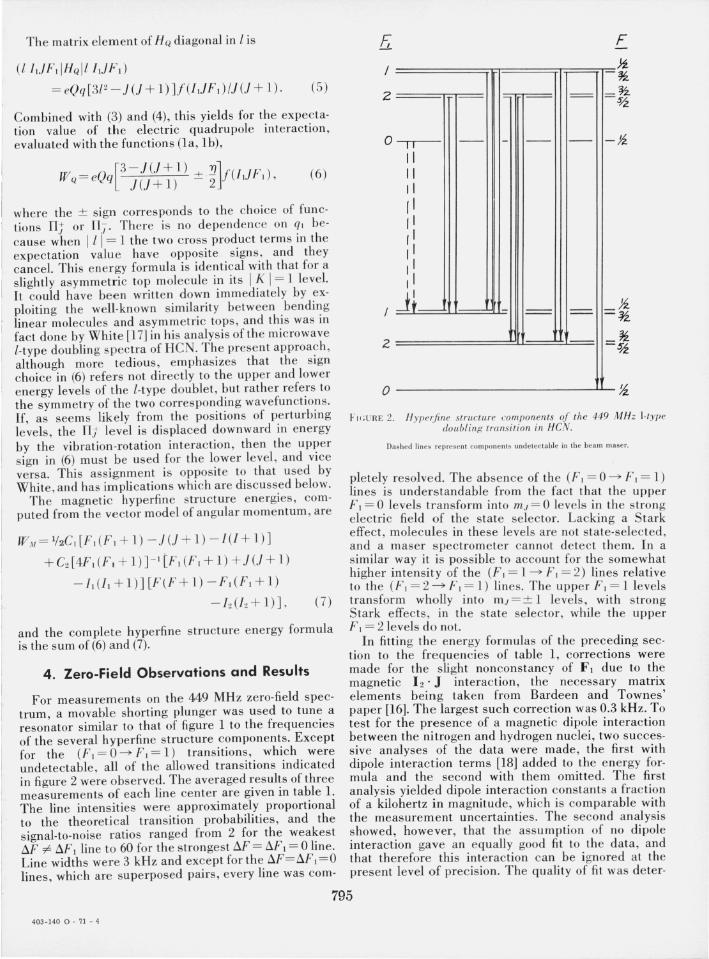
Figure 1 shows how the resonator is positioned within its vac uum vessel, a 15 cm i.d. Pyrex tube, and its waveguide shield box. The support structure, a nylon and Pyrex cage, is omitted for clarity. Beam molecules, entering from the state selector on the left, travel lengthwise between the resonator plates, eventually collide with them, and are pumped away. To resonate at 475 MHz, a convenient frequency for th e HCN electric resonance observations, the resonator must have a le ngth of about 28 cm. The extra 8 cm is pro· vided by copper sheet extensions, soldered to the right· hand folded line and making spring- finger contact with the aluminum flats_
The shield box shown in figure 1 is a length of WR 1800 waveguide, short-circuited at each end, and split along the zero-current line for convenient installation. The dimensions of the box are such that all of its rectangular mode resonances lie above 600 MHz. The waveguide field is excited by an electric probe, the upper one shown in figure 1, and may be oriented with respect to the resonator field by rotating the entire shield box on its two support flanges. Sufficient coupling between the two fi elds ordinarily results when the box is positjoned 10 to 20 deg from the horizontal. The lower probe shown in figure 1 is the signal detecting probe. With its perpendicular mounting it is insensitive to the waveguide field, but it is made long enough to pick up the resonator field with approximately critical coupling.
Designed mainly to give doc field uniformity , the Stark cell r esonator violates several of the design rules me ntioned above for high-Q linear resonators, especially those concerning plate thickness a nd separation , and the absence of lossy material nearby. The measured Q, with the shield box positioned for approximately critical coupling, is 500, while under similar conditions the copper strip resonators have a Q of 3000. Since the sensitivity of a maser spectrometer depends not linearly but rather on the square root of the Q [10], this is not too serious a loss. Indications are that the Q could be dqubled, at no cost in doc field uniformity, by replacing the Pyrex vacuum vessel with one made of quartz or other low-loss glass.
FJ(;URE 1. Simplified view 0/ the Sta rk cell resonator, glass vacuum vessel , and waveguide shield.
2.3. Spectrometer Circuits
The HCN spectrum lies at the upper end of the halfme ter amateur communi cation band, and can be detected with a s tandard commun ciations receiver preceded by a UHF converter. With minor retuning, a Parks half-meter converter [11] ,2 an inexpensive transistor unit with a rated noise fi gure of 4 dB, was found to give adequate sensitivity. The converter input is connected directly to the lower probe of the waveguide shield (fig. 1) by a short coaxial lin e_ A comm ercial phase-locked UHF signal generator, connected to the upper probe , supplies excitation at a stabilized frequenc y to the waveguide field.
A state selector voltage of 15 kV, sufficient for saturated focusing behavior, is produced by two 7.5 k V rf-type power supplies of opposite polarity. A merc urywetted relay driven by an audio oscillator turns these power supplies on and off at a 25 Hz rate by interrupting the cathode circuits of their rf oscillators, and thereby imparts a square wave modulation to the focused beam intensity. This modulation method permits the use of lock-in detection without , as in the alternative Stark modulation method , disturbing the positions of the spectral lines.
The doc Stark voltage, derived from a stack of radio B batteries , is connected through rf interference filters directly to the folded quarter-wave lines at one end of the resonator. The filters are necessary to keep out UHF emission s from nearby trucks and taxicabs , to which the maser receiver is very sensitive. By means of a calibrated volt box and precision potentiometer, the Stark voltage can be measured to an accuracy of ± 2 parts in 105•
3. Zero-Field Spectrum of HeN
The lowest excited vibration-rotation level of HC N, a bending level with vibrational quantum numbe r V2 = 1 and angular momentum quantum number J = 1, lies 712 cm- I above the ground state. Its fractional population is about 7 X 10- 4 which , while not large, is enough to yield a fairly intense radio spectrum. Centered at 449 MHz, this spectrum con sists of the several hyperfine structure components of a single transition, the · AI = 0 tran sition between the two [·type doubling· sublevels of the J = 1 level. The frequency of this transition, considering its hyperfine structure to be condensed to zero, is the "[-type doubling frequency," VI, an accurate value of which is required for later analysis of the Stark effect. The following computation of hyperfine structure permits VI to be determined within ± 1 part in 106 from measurements on the 449 MHz spectrum.
3 .1. Wavefunctions
The V2 = 1 bending vibration of HCN is very nearly a conical pendulum motion of the h ydrogen nucleus
t This item of commercial apparatus is identified sol ely to spec tfy the experimental method, and is not thereby endorsed by the U.S. Government. A lis l of manufacture rs and model numbe rs of other equipment is ava ilab le on reques t 10 the au th or.
793

about the C- N axis. The two possible directions of rotation are represented by the fun ctions lji(l) and lji(-l), where lli is the angular momentum of the rotary vibration projected along the symmetry axis of the molecule. When the molecule is at the same time rotating in its normal end-over-end way, the vibrational angular momentum vector becomes twisted slightly away from the symmetry axis , and this interaction between vibration and rotation causes an "1-type" doubling of every energy level in the vibrational state. A quantum meC'hanical analysis [12] shows that for a state with V2 = 1 the energy separation of the two members of a doublet is qJ (j + 1) , where J is the quantum number of resultant angular momentum, vibrational plus rotational. The factor q depends on various constants of the molecule and on the energy separations of the different vibrational states that are admixed by the vibration-rotation perturbation. To account for this admixture, the wavefunctions of the double t rotational levels in the lowest bending state of HCN can be written as:
(la)
ITt = [2 + 0'2] - ' /2 [lji, (l = 1) + tjJ, (l = - 1)] + O'ljiJ (l = 0)
(lb)
The bracketed sum-and-difference functions are the usual first order wave functions for dege-nerate levels. The selection rules for vibration-rotation perturbations permit only levels of the same parity, the same total angular momentum, and with l-values differing at most by 1 to be affected_ Thus a IT - level can be perturbed by certain levels of ~ - (l = 0) and 6. - (l = 2) vibrational states and a IT + level can be perturbed by certain levels of ~ + and 6.+ vibrational states [13]. Since HCN has no known ~ - states, and the 6. states are few and far removed in energy, the chief effect of the perturbation is felt by the II + level: it acquires a small l = 0 character and is shifted in energy_ This neglect of perturbations by 6. states is perfectly justified for the J = 1 level, the level of main interest here, because 6. states have no J = 1 levels that can perturb it.
As can be demonstrated by applying the operator J x to (1 b), a molecule in one of the II + levels will have a component of vibrational angular momentum perpendicular to the symmetry axis, of magnitude proportional to the admixture coefficient, 0'. This can have an effect on the hyperfine structure and Stark effect, and so it is necessary to know the size of 0'.
Perturbation theory gives an immediate rough estimate: 0' = [qJ (j + 1) /w2],/2 where W2 is the bending frequency , and for J = 1, this is 0' = 5 X 10⁻³. At the accuracy level of the present experiment, a better value of lX, which could be computed from the l-type doubling theory, is not needed.
3.2. Hyperfine Structure
Except for complications caused by vibration, HCN is a standard case [14] of hyperfine structure due to two
nuclei, only one of which has an electric quadrupole moment. The hyperfine structure Hamiltonian is
(2)
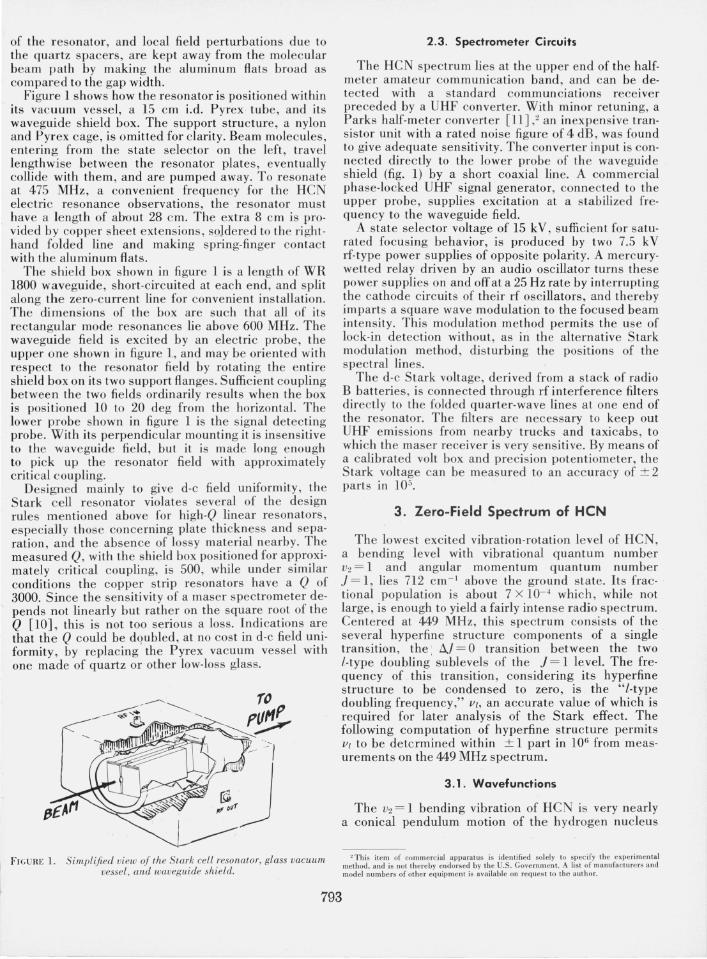
where H Q is the electric quadrupole interaction of the nitrogen nucleus with the molecular charge distribution, and the remaining two terms represent the magnetic coupling of the nitrogen and hydrogen nuclei with the molecular currents. The coupling constants depend on J and l, and are discussed in detail by Tomasevitch and Klemperer [6]. The magnetic dipole interaction between the two nuclei is negligible because of their large separation. Because the nitrogen nuclear spin I, is tightly coupled to the molecular angular momentum J, but the hydrogen nuclear spin 12 is not, the hyperfine structure is best calculated with the F" F coupling scheme, i.e., considering F, = I, + J as well as F = F, + L to be constants of the motion. For the present case, the quantum number F takes on the values I F, ± 1f2 1, where F, = 0,1 ,2. The corresponding hyperfine structure sublevels of the two l-type doubling levels are shown by figure 2, which also indicates the various hyperfine structure components of the 449 MHz transition.
The effects of vibration on the hyperfine structure are large enough to be detectable only in the electric quadrupole interaction. They show up in the form of matrix elements of H Q which are off-diagonal in the quantum number l. Using the expanded form of the quadrupole operator given by Frosch and Foley [15] we find, by matrix multiplication, these matrix elements to be:
(l I,JF,IHQll ± 1 I,JFd = eQq, (21 ± I)[J (.J + 1)
- l(l ± 1)]'/2 (3)
X! (l,JFdlJ (j + 1),
and for II I = 1, the only important case,
As is customary, Q represents the quadrupole moment of the nucleus and !(IIJF,) represents Casimir's function of the quantum numbers It, J, and F" as defined by Bardeen and Townes [16]. The small q's measure the distortion of the molecular electric field caused by vibration: q2 measures a departure from azimuthal isotropy in the field gradient and q, measures a divergence of the principle axes of the field distribution from the principle axes of the nuclear framework. Departures from azimuthal isotropy are characteristic of asymmetric top molecules , for which they are commonly specified by a dimensionless parameter YJ. The relationship between YJ and q2 is YJ = q2/q, where q is the electric field gradient, at the quadrupolar nucleus , in the direction of the symmetry axis of the nuclear framework. Effects due to q, are too small to be concerned with except in rare cases, one of which is the strong-field correction mentioned in section . 6.
794
--- --- -------
Th e matrix element of HQ diagonal in lis
( l/IJFI IHQ ll hlFI )
= eQq[31 2 - J(.J + 1)]f(lIJFI )IJ(.J + 1) . (5)
Combined with (3) and (4), this yields for the expectation value of the electric quadrupole interaction , evaluated with the functions (la, Ib),
(6)
where the ± sign corresponds to the choice of fun ctions TIj or TIJ - There is no depe ndence on ql because when II I = 1 the two cross product terms in the expectation value have opposite - sign s, and they cancel. This ener gy formula is identical with that for a slightly asymmetric top molecule in its I K 1= 1 level. It could have been written down imm ediately by exploiting the well-known similarity between bending linear molecules and asymme tric tops, and this was in fact done by White [17] in his analysis of th e microwave l-type doubling spectra of HCN. The present approach , although more tedious , emphasizes that the sign choice in (6) refer s not direc tly to the upper and lower energy levels of the l-type double t, but rather refers to the symmetry of the two corresponding wavefun ctions. If, as seems likely from the positions of perturbing levels, th e TI.t le vel is displaced downward in energy by the vibration-rotation interaction , the n the upper sign in (6) must be used for the lower level, and vice versa. Thi s assignment is opposite to that used by White, and has implications which are discussed below.
The magnetic hyperfine structure energies, computed from the vector model of angular mome ntum , are
Wl/ = 1/£ I [F I (F I + 1) - J (J + 1) - / (I + 1) ]
+ C2 [4FI (F. + 1)] - I tFI (F I + 1) + J (.J + 1)
- JI(l1 + 1) ] [FtF + 1) - FI (FI + 1)
- / 2(12+ 1) ], (7)
and the complete hyperfine structure energy formula is the sum of (6) and (7) .
4. Zero-Field Observations and Results
For measurem ents on the 449 MHz zero-field spectrum, a movable shorting plunger was used to tune a resonator similar to that of fi gure 1 to the frequencies of the several hyperfine s tructure components. Except for the (F 1= 0 ~ F 1= 1) transitions, which were undetectable, all of the allowed transitions indicated in figure 2 were observed. The averaged results of three measurements of each line center are given in table 1. The line intensities were approximately proportional to the theoreti cal transition probabilities, and the signal-to-noise ratios ranged from 2 for the weakest t1F =i' t1F. line to 60 for the s trongest t1F = t1Fl = 0 line . Line widths were 3 kHz and except for the t1F= t1FI = 0 lines, which are superposed pairs, every line was com-
F,
/
2
o
/
2
o
,---
-- -
II -- - -- -- -
II II II II II II ,I II II
Jt. - -- -- --- -- -
=
HYl'erjine structure components of th e 449 MHz I-type doub l ing tra nsitio n in HeN.
Dashed lines represent components undetecta ble in th e bea m maser.
pletely r esolved. The abse nce of the (F I = 0 ~ F 1= 1) lines is unders tandable fro m the fact that the upper Fl = 0 le vels transform into m J = 0 levels in th e s trong electric field of the state selector. Lacking a Stark effect , molecules in these levels are not state-selected , and a maser s pectrometer cannot detect the m. In a similar way it is possible to account for the somewhat higher intensity of the (FI = 1 ~ FI = 2) lines relative to the (FI = 2---7 FI = 1) lines. The upperFI = llevels transform wholly into mJ = ± 1 le vels, with s trong S tark e ffects , in the state selector , while th e upper FI = 2 le vels do not.
In fitting the energy formulas of the preceding section to the fre quencies of table 1, corrections were made for the slight nonconstancy of Fl due to the magnetic 12 • J interaction, the necessary matrix elements being taken from Bardeen and Townes' paper [16]. The largest such correction was 0.3 kHz. To test for the presence of a magnetic dipole interaction between the nitrogen and hydrogen nuclei, two su cces· sive analyses of the data were made, the first with dipole interaction terms [18] added to the energy formula and the second with them omitted. The firs t analysis yielded dipole interaction constants a frac tion of a kilohertz in magnitude, which is comparable with the measurement uncertainties. The second analysis showed, howe ver, that the assumption of no dipole interaction gave an equally good fit to the data, and that therefore this interaction can be ignored at the present level of precision. The quality of fit was de ter-
795
403-14 0 0 - 71 - 4
mined by recomputing the frequencies of the 14 lines, using the constants determined in the analysis, and then evaluating the rms frequency error, weighted according to line intensity. This rms error was 0.3 kHz with the dipole interaction included, and 0.4 kHz without. The molecular cons tants determined in the two analyses differed slightly, but well within the experimental uncertainties, and the final results given here are the mean values.
VI = 448943. 1 ± 0.4 kHz eQq =- 4809.2 ± 1.1 kHz I eQq'Y) I = 392 .2 ± 1.6 kHz C, = 12.2 ± 0.2 kHz C2 = - 27_3 ± 1.6 kHz
In each result, the quoted uncertainty is the variation of the constant which shifts one of the strong lines of the spectrum by 0.4 kHz, the rms fitting error.
5. Discussion
Except for the proton coupling constant, C2 , all of these molecular constants have been measured previously, with less precision, by absorption spectroscopy on HCN gas. Yarmus [5] observed a single broad line for the J = 1 level, corresponding to the eight !1F, = 0 transitions of table 1. His derived value of the l-type doubling frequency, 448947 ± 10 kHz, agrees within 4 kHz with the present value of VI. The doubling frequency may also be predicted from measurements on higher rotational levels: based on the recent work of Maki and Lide [19] this predicted value is 448943 ± 1 kHz, in near-perfect agreement with the present value. Within their experimental uncertainties, the values of
TABLE 1. Zero-field UHF spectrum of the V2 = 1 J = 1 leveL of HCN
Th e line frequenc ies are averages of three measureme nts and have an estimated uncertainty of 3 kHz divided b y the relative intensity.
F, -> F; F -> F ' v(kHz) Observed reI. intensity
1-> 0 1/2-> 1/2 450821.1 6 3/2-> 1/2 450801.7 10
1-> 2 3/2-> 5/2 449608.2 16 1/2-> 3/2 449593.8 8 3/2-> 3/2 449573.6 2
2 -> 2 3/2 -> 5/2 448996.3 2 ~/2-> 5/2J 448962.7 32 3/2 -> 3/2 5/2 -> 3/2 448928.9 2
1-> 1 1/2 -> 3/2 448864.3 2
W2 -> 3/2J 448844.9 8 1/2 -> 1/2 3/2-> 1/2 448825.0 2
2-> 1 3/2 -> 3/2 448233.3 1 3/2 -> 1/2 448213.1 6 5/2-> 3/2 448199.6 10
0-> 1 1/2-> 1/2 Not state-1/2-> 3/2 selec ted.
eQq and C, derived by Yarmus and the magnitude of eQq'Y) derived by White [17] from absorption measurements on higher rotational levels also agree with the present more precise values_ The sign of 'Y) cannot be determined from either the maser spectrum or the gas absorption spectrum without further information about which of the two levels, II; or II, of eq (1), is the upper level of each doublet. If n; is the upper level, as assumed by White , then the disposition of lines in the observed spectrum requires 'Y) to be negative; if n; is the lower level, as suggested in section 3.2 , then 'Y) must be positive. This is not a trivial matter, since of the possible sources of electrical asymmetry in HCN some yield positive values of 'Y) and some yield negative values [17J. Knowledge of the actual sign of 'Y) can be used to eliminate some of these possibilities.
From unpublished information kindly given us by G. Tomasevitch, it appears that the Harvard and NBS measurements of the 449 MHz spectrum, made independently but by similar methods, disagree uniformly by about 1 kHz on each spectral line position, the Harvard measurements being higher. Consequently, the two values of the L-type doubling frequency differ by 1 kHz, as compared to 0.8 kHz allowed by the combined experimental uncertainties. The hyperfine structure constants , which are determined from line spacings within the spectrum and are hence free of the 1 kHz discrepancy, are in excellent agreement.
6. Electric Resonance Spectrum of HeN
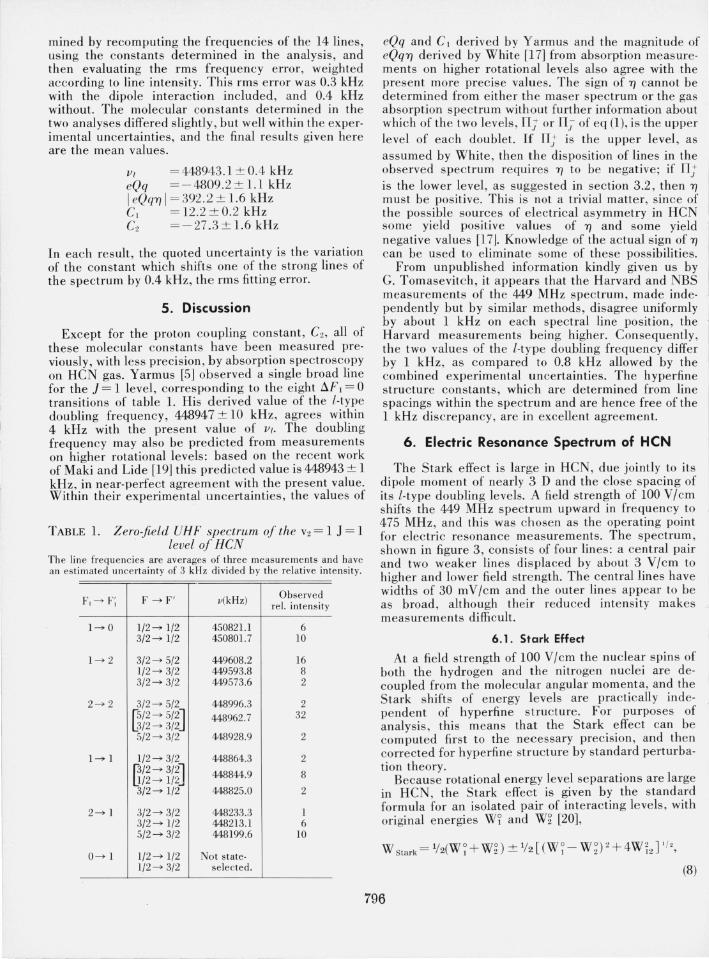
The Stark effect is large in HCN, due jointly to its dipole moment of nearly 3 D and the close spacing of its l-type doubling levels. A field strength of 100 V / cm shifts the 449 MHz spectrum upward in frequency to 475 MHz, and this was chosen as the operating point for electric resonance measurements. The spectrum , shown in figure 3, consists of four lines: a central pair and two weaker lines displaced by about 3 V/cm to higher and lower field strength. The central lines have widths of 30 m V /cm and the outer lines appear to be as broad, although their reduced intensity makes measurements difficult.
6.1_ Stark Effect
At a field strength of 100 V/cm the nuclear spins of both the hydrogen and the nitrogen nuclei are decoupled from the molecular angular momenta, and the Stark shifts of energy levels are practically independent of hyperfine structure. For purposes of analysis, this means that the Stark effect can be computed first to the necessary precision, and then corrected for hyperfine structure by standard perturbation theory.
Because rotational energy level separations are large in HCN, the Stark effect is given by the standard formula for an isolated pair of interacting levels, with original energies W? and Wz [20],
(8)
796

I 101.5
I 101.7
1 I I 107./
I 107.3 104.4 104.6
FIELD STRENGTH - V/cm
F1GUHE 3. Electric resonance spectrum oj HeN al a fixedfreqll.ency of 474.898 MHz.
The doc electric field is parailci to the rf electric fi e ld.
where in thi s case W~ - W~= q}(.J + l) , the l-type doubling interval, and W'2, the matrix element of the interaction, is th e Stark matrix element (fl , I p.-' E In-n. From the vector model of angular mome ntum , p.: E may be rewri tten as
w E = (wJ )(J·E )!J2 = (wJ )m.,E!J(.J + l), (9)
which is useful for computing matrix elements diagonal in ). The quantity (w J), a scalar, may be evaluated in any coordinate system, but most easily in a coordinate sys tem attached to the molecule, in which } z= t. Thu s
(10)
In a linear molecule, such as HCN in it s ground state, perpendicular components of the permanent dipole moment must vanish because of symmetry (jJ-x= jJ-y= O). This is not necessarily true for th e bending vibrational s tate, but any perpendicular co mpon ent will certainly be very small , and will be neglected temporarily. The Stark matrix element, evaluated with the fun ctions (la) and (lb), is then
W' 2 = (IT., I wE I n j) = II I m,jJ-Efj (.J + 1) , (11)
where jJ- has been written for jJ-z (1 + (\'2/2) _1/2, and represents the experimentally determined dipole moment. Since (\' has the approximate value 2XI0 - 3}(.J + l) , the J-dependence of the dipole moment from this source is negligible for low} values.
6.2. Strong Field Hyperfine Structure
The Stark effect depends only on the absolute value of the quantum number m../, and so it leaves a twofold degeneracy of the sublevels labeled by + m..] and - m..]. Since the electric quadrupole interaction couples sublevels with the same value of tn.] + tn" this means that a quadratic secular equation must be solved for the hyperfine structure of the sublevels m." tn, =± 1 ,+1. The procedure is similar to that used by Bhattacharya and Gordy [21] for the ground vibrational state of HCN, but with the effects of vibrational angular momentum included. For the present case, with I = } = l = 1, the results are
for m., = O:
(12)
for I 171./ I = 1, tn.] + tn, ot= 0:
W"j:~ = eQq(l ± 1) (3mr - 2)/40+ G,m,tn./ + G21712171.],
for I 171./ I = 1, tn./ + tn, = 0:
Wlij:~ = eQq (1 ± 1) /40 - C, [± ] [(m.2G2 ) 2 + (3eQq/20) 2(1 ± 1) 2] 1/2.
The sign choice ± again refers to the two l-type doublet levels, but [± ] refers to the two 1171, I = 1 sublevels, form erly degenerate, that are now separated by th e electric quardupole interaction.
7. Corrections
The perturbation calc ulation of energies can be carried to second order to evaluate certain small corrections and to show that others are negligible.
a. Interl71ediate field effects. - The quadrupole interaction co uples the sublevels I71J = 0 and I tn, I = 1, and causes energy shifts of order (W Q) 2/W Sta rk' These shifts are comparable with the line width, and were computed and applied to each line of the electric resonance spectrum. Similar effects in the magnetic hyperfine structure are negligible.
b. Rotational Stark Effect. - The normal secondorder Stark effect of linear molecules, of order (jJ-EJ2/ W rob also causes level shifts comparable with the line width , but it affects both components of the l-type doublet equally, or very nearly so. The / effect on the electric resonance spectrum is negligible.
c. Field-induced electric quadrupole interactions.Strong fields mix the l-type doublet wavefunctions (1) and destroy the strict cancellation of certain quadrupole matrix elements. One such field-induced interaction is that involving !1l = 2 matrix eleme nts across the l-type doublet , of order W~ W Sta rk/(Il vl)2. Another is that involving !1l = 1 matrix ele ments within each component of the l-type doublet , of order W Q [W Sta rk/
W vib] 1/ 2. At a field strength of 100 V/cm both cause level shifts of less than one tenth of the observed line width. This is negligible, but barely so. Reduced line
797
widths or stronger fields would require corrections to be made for these interactions.
8. Results and Discussion
The matter of line widths is of first importance in a precision electric resonance spectrometer, and the observed width of 30 mV/cm is disappointingly large. The expected width, based on the quadratic Stark effect, is t:..E = t:..v/2kE, where k is the Stark coeffi· cient and has the approximate value 2.5 kHz/(V/cm)2. For t:..v=3 kHz, the measured frequency width at zero field, this predicts a width of 6 m V/cm, some five times smaller than the observed width, at a field strength of 100 V/cm. Two possible sources of the excess width are nonuniformity of the Stark field (although the field was expected to be much better than this) and uiuesolved structure in the lines.
There is some evidence on the question of field uniformity, in the form of resonance spectra observed with a Stark cell of much poorer quality. This cell was made from steel plates 6 mm thick , surface-ground in an instrument shop and then electroplated with silver. The plates showed a warpage, when placed to· gether, of about 1/10 mm, and had to be clamped across their quartz spacers in order to get contact with all four spacers. Line widths observed with this Stark cell at the same field strength, were also 30 m V/cm. Thi~ observation does not rule out all broadening due to field nonuniformity, for the overall geometry of the two cells was similar and the fringing fields at the beam entrance holes, for example, should be much the same. Tests were made with a mica beam stop to investigate the effects of fringing fields, but the beam stop reduced the signal intensity so much that the results were inconclusive.
Unresolved structure could be present in the two central lines of the electric resonance spectrum, which are actually superposed line pairs because of the ± m./ degeneracy. The quadrupole interaction does not split these line pairs as it does the two outlying lines of the spectrum, but a small linear Stark effect, sensitive to the sign of mJ as well as its absolute value, would do so. Such a linear Stark effect would result from a component of the electric dipole moment perpendicular to the molecular axis. The necessary size of this dipole moment can be calculated with the Stark effect operator (10) and the wavefunctions (1), and turns out to be approximately 10- 2 D for a line splitting of 20 m V / cm. Gyroscopic distortion effects in a bending linear rotor might generate a perpendicular moment of this size, but it is somewhat doubtful. Experimental verification can be sought by comparing the widths of the central lines of the spectrum with the widths of the outlying lines. Since it is apparent from the spectrum of figure 3 that the outlying lines are not greatly narrower than the central lines, we conclude that unresolved structure is not an important source of excess line width , and that a perpendicular component of the dipole moment, if any exists, is less than 10 - 3 D in SIze.
The center lines of the electric resonance spectrum were measured repeatedly over a period of several
days to check the stability of the maser spectrometer. The minute-to-minute voltage readings of the line centers, at constant frequency, did not differ by more than 2 or 3 parts in 105, which is consistent with the line width of 3 parts in 10 4 and the signal-to-noise ratio of 8/1. The long-term stability was found, however, to be considerably worse. Measurements made a few days apart differed by as much as 4 parts in 10\ and on a weekly basis there was a comparable net drift toward higher voltages. We have not made a thorough study of these instabilities, and do not know their cause, although certain sources of trouble can be ruled out. Instabilities in the frequency and voltage measuring apparatus are in the part· per· million range or smaller, and so cannot contribute. Thermal effects, in our air-conditioned laboratory, should be no larger. The observed monotonic drift is suggestive of a gradual change in the chemical or mechanical properties of the Stark celi, such as a relaxation of strain in the aluminum plates or their mounting, or the buildup of a dielectric film on the plate surfaces. Aluminized glass Stark cells have proved troublesome in other laboratories, presumably due to oxidation since a gold flash coating removes the difficulty. Oil migration from the diffusion pump is a distinct possibility, and could be checked by replacing the present room-temperature chevron baffle with a cooled baffle. We note finally , that a non-uniform dielectric film buildup could account for both the long· term instabilities and the excess line widths. It is, in our opinion, the most likely source of imprecision in the present spectrometer.
A value of the HeN electric dipole moment may be derived by fitting eqs (8), (11), and (12) to the electric resonance spectrum, including the corrections of section 7. The result is .
JL = 2.940 ± 0.001 D.
This is based on measurements made near the start of the stability tests, but the assigned uncertainty is large enough to include all later measurements as well. This figure agrees, within experimental errors, with Tomasevitch and Klemperer's [6] value 2.9416±0.00I6 D.
9. References
[lJ Muenter,1. S., J. Chern. Phys. 48,4544 (1968). [2/ Schwartz,1. c., and Trischka, J. W. , Phys. Rev. 88, 1085 (1952). [3] Beers, Y. , and Russell. T. W.o IEEE Trans. Instrumentation and
measurement 1M- IS 380 (1966). [4/ Hara, K., Kobayashi, T., Matsui, T., Nakase, T. , Yonezaki, G.,
and Endo T. (private communication). [5J Yarmus, L., Phys. Rev. 104,365 (1956). [6/ Tomasevitch , G., and Klemperer, W. (private communication). [7/ Takuma, H., Evenson, K. M. , and Shigenari, T. , J. Phys. Soc.
Japan 21, 1622 (1966). [8] Halford D. (private communication). [9] Halford , D. , and McConnell, H. M., J. Chern. Phys. 41,898
(1964). [10] Beers, Y., Rev. Sci. Instrum. 32,23 (1961). [11J Parks Electronics Laboratory, Beaverton Oregon. [l2/ Nielsen, H. H., Rev. Mod. Phys. 23,90 (1951).
798
11 3 1 Herzbe rg, C., Infrared and Raman Spectra (Van Nos trand (:0. , 1 nc., Prince ton, 1945) p. 37S.
[141 Town es, C. H., and Schawlow, A. L. , Mi crowave Spectroscopy (McGraw·Hill Book Co., New York , 1955) p. 164.
[lS I Frosch, R. A. , and Foley, H. M. , Phys. Rev. 88,1337 (1952). [1 61 Bardeen, 1. , and Townes, C. H. , Phys. Rev. 73, 97 (194S). [1 71 White, R. L. , J. Chern . Phys. 23,249 (1954). [lSI Ref. 14, p. 203.
119 1 Maki , A. G. , JI". and Lide, D. R. , Jr., 1. Chem. Phys. 47,3206 (1967).
1201 Ref. 14, p. 253. [211 Bhattacharya, B. N ., and Gordy, W. , Ph ys . Re v. 119,144(1960).
(Paper 74A6- 642)
799


![phcn ˛ s^{ p-hcn · 2013-06-04 · 2010 P\p-hcn ˛ s^{_p-hcn 2 2010 P\p-hcn ˛ s^{_p-hcn 3 BapJw ae-bmf kmln-Xy-Ønse ]pXp-Im-gvN-Iƒ A\p- ... sk{I-´dn & FUn- ... Nne `mjmNcn{X](https://img.dokumen.tips/doc/110x75/5e62a302362f9d70db37e34c/phcn-s-p-2013-06-04-2010-pp-hcn-sp-hcn-2-2010-pp-hcn-sp-hcn.jpg)