Embed Size (px)
Citation preview
STANDOFF RAMAN SPECTROSCOPY SYSTEM FOR DETECTION OF EXPLOSIVES, CHEMICAL WARFARE AGENTS SIMULANTS AND TOXIC
INDUSTRIAL COMPOUNDS
By
William Ortiz Rivera
A thesis submitted in partial fulfillment of the requirements for the degree of
MASTER OF SCIENCE In
Chemistry
UNIVERSITY OF PUERTO RICO MAYAGUEZ CAMPUS
2008
Approved by: _____________________________ ______________________ Samuel P. Hernández Rivera, Ph.D. Date President, Graduate Committee ___________________________ ______________________ Mayra E. Cádiz García, Ph.D. Date Member, Graduate Committee ____________________________ ______________________ Nairmen Mina Camilde, Ph.D. Date Member, Graduate Committee ____________________________ ______________________ Ivan Baiges Valentin, Ph.D. Date Representative of Graduate studies ____________________________ ______________________ Francis Patron, Ph.D. Date Chairperson of the Department

ABSTRACT
In this work a remote Raman system has been designed, assembled and tested for
detecting explosives, Toxic Industrial Compounds (TIC) and Chemical Warfare Agents
Simulants (CWAS) at laboratory scale up to 7 m target-telescope distance. The prototype
system consists of a Renishaw Raman Microspectrometer, model RM2000, equipped
with a charge-coupled device (CCD) detector, a telescope, a fiber optic assembly and a
single wavelength/frequency laser source (514/488 nm and 532 nm). The telescope was
coupled to the Raman microscope using an optical fiber and filters for rejection of laser
radiation and Rayleigh scattering. Two convex lenses collimate the light from the
telescope output, which is directed into the fiber optic from which the focusing objective
was removed. The output of the fiber was directly coupled to the Raman system by a 5x
objective. To test the standoff sensing system, the VIS Raman Telescope was used in
detection of secondary explosives: 2,4,6-trinitrotoluene (TNT), 2,4-dinitrotoluene (2,4-
DNT), hexahydro-1,3,5-trinitro-1,3,5-triazine (RDX), triacetone triperoxide (TATP) and
plastic explosive C4, with detection limits below 10 mg. The TICs used were benzene,
toluene, xylenes, chloroform, CCl4 and CS2. Other compounds studied were Chemical
Warfare Agents Simulants dimethylmethyl phosphonate (DMMP), 2-chloroethyl ethyl
sulfide (2-CEES). Solid samples (explosives) were deposited on stainless steel plates and
liquid samples were transferred into 5 mL glass vials. Both types of samples were placed
at a distance of 7 m from the telescope. Raman spectra of compounds were acquired in
the Raman shift range of 100-3200 cm-1 using laser powers varying from 50 mW to 1 W
and integration times of 1 to 30 s.
ii

RESUMEN
En este trabajo se diseñó un sistema de detección remota Raman, el cual se utilizó en la
detección de explosivos, simulantes de agentes de guerra químicos y compuestos tóxicos
industriales a una distancia del telescopio-muestra de 7 m. El diseño consiste de un
microespectrómetro Raman Renishaw modelo RM2000 equipado con un detector CCD,
un telescopio, una fibra óptica y una fuente de láser (514/488 nm o 532 nm). El
telescopio se acopló al microscopio Raman por medio de una fibra óptica. Dos lentes
convexos coliman la luz proveniente de la salida del telescopio, la cual converge
directamente sobre la fibra óptica, la salida de la fibra se acopló al sistema Raman
mediante un objetivo de 5x. El sistema de detección remota se verificó utilizando
explosivos secundarios: TNT, 2,4-DNT, RDX, TATP y el explosivo plástico C4, con
limites de detección por debajo de 10 mg. Los compuestos tóxicos industriales empleados
fueron benceno, tolueno, xylenos, cloroformo, CCl4 y CS2. Otros compuestos estudiados
fueron los simulantes de agentes de guerra químicos: dimetilmetilfosfonato (DMMP) y 2-
cloroetiletilsulfuro (2-CEES). Las muestras solidas se depositaron sobre láminas de acero
inoxidable y las muestras líquidas se transfirieron a frascos de 5 mL. Ambos tipos de
muestras se colocaron a una distancia de 7 m del telescopio. Los espectros de los
compuestos se adquirieron en el rango de dispersión Raman de 100-3200 cm-1 utilizando
potencias del láser de 50 mW a 1 W y tiempos de integración de 1 a 30 s.
iii

To my family
iv

ACKNOWLEDGEMENTS
I would like to express my most sincere appreciation to all the people that in one way or
another have contributed positively in the completion of this research.
Sincerely I thank the Almighty for giving me the wisdom, patience and above all
perseverance to be able to overcome all obstacles and challenges in the wonderful world
of science.
I immensely thank my advisor Dr. Samuel P. Hernández for giving me the opportunity to
do research under his guidance and supervision in the Center for Chemical Sensors
Development. I also wish to share this acknowledgement with my partners and peers
from Dr. Hernández’s laboratory, especially Leonardo Pacheco for his valuable
intellectual contribution to this research.
To my friends: Omar, Wilman, Pedro, Oliva, Luis Fernando, Sandra, Bibiana, Hilsamar,
Jorge and Jenifier for all the pleasant and fun moments we shared in my stay in graduate
study.
v
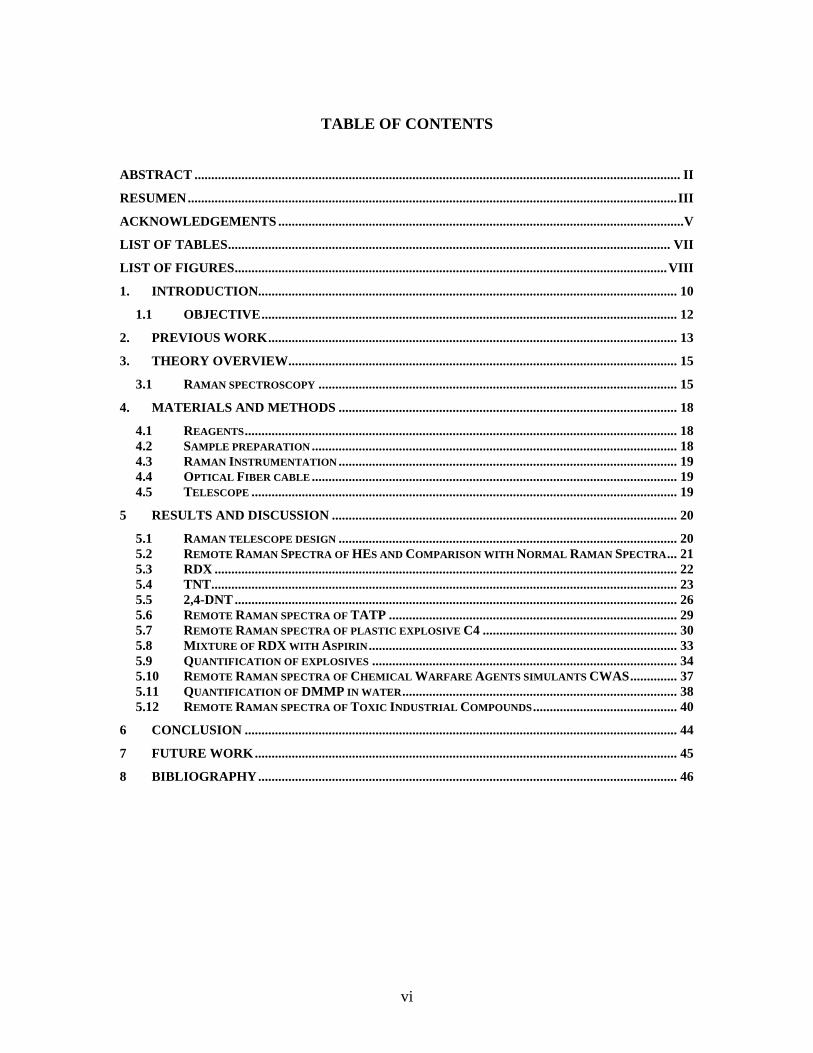
TABLE OF CONTENTS
ABSTRACT ................................................................................................................................................. II RESUMEN..................................................................................................................................................III ACKNOWLEDGEMENTS .........................................................................................................................V LIST OF TABLES.................................................................................................................................... VII LIST OF FIGURES.................................................................................................................................VIII 1. INTRODUCTION............................................................................................................................. 10
1.1 OBJECTIVE............................................................................................................................ 12 2. PREVIOUS WORK.......................................................................................................................... 13 3. THEORY OVERVIEW.................................................................................................................... 15
3.1 RAMAN SPECTROSCOPY ........................................................................................................... 15 4. MATERIALS AND METHODS ..................................................................................................... 18
4.1 REAGENTS................................................................................................................................. 18 4.2 SAMPLE PREPARATION ............................................................................................................. 18 4.3 RAMAN INSTRUMENTATION ..................................................................................................... 19 4.4 OPTICAL FIBER CABLE ............................................................................................................. 19 4.5 TELESCOPE ............................................................................................................................... 19
5 RESULTS AND DISCUSSION ....................................................................................................... 20 5.1 RAMAN TELESCOPE DESIGN ..................................................................................................... 20 5.2 REMOTE RAMAN SPECTRA OF HES AND COMPARISON WITH NORMAL RAMAN SPECTRA... 21 5.3 RDX .......................................................................................................................................... 22 5.4 TNT........................................................................................................................................... 23 5.5 2,4-DNT .................................................................................................................................... 26 5.6 REMOTE RAMAN SPECTRA OF TATP ...................................................................................... 29 5.7 REMOTE RAMAN SPECTRA OF PLASTIC EXPLOSIVE C4 .......................................................... 30 5.8 MIXTURE OF RDX WITH ASPIRIN............................................................................................ 33 5.9 QUANTIFICATION OF EXPLOSIVES ........................................................................................... 34 5.10 REMOTE RAMAN SPECTRA OF CHEMICAL WARFARE AGENTS SIMULANTS CWAS.............. 37 5.11 QUANTIFICATION OF DMMP IN WATER.................................................................................. 38 5.12 REMOTE RAMAN SPECTRA OF TOXIC INDUSTRIAL COMPOUNDS........................................... 40
6 CONCLUSION ................................................................................................................................. 44 7 FUTURE WORK.............................................................................................................................. 45 8 BIBLIOGRAPHY............................................................................................................................. 46
vi
LIST OF TABLES
Table 1 Assignments of vibrational modes of TNT.......................................................... 25
Table 2 Assignments of vibrational modes of 2,4-DNT................................................... 28
Table 3. Assignments of vibrational modes of RDX........................................................ 32
Table 4. Detection limits of C4 at different conditions. ................................................... 36
Table 5. Detection limits were calculated for condition: P =1W, beam diameter 3.5 mm,
acquisition time=10s, distance=7 m................................................................... 37
vii
LIST OF FIGURES
Figure 1. Energy Diagram for Raman Scattering. ............................................................ 17
Figure 2. Design of standoff VIS Raman Telescope. ...................................................... 20
Figure 3 Remote Raman spectrum of RDX at 7 m, 488 nm, 1W and 10 s....................... 22
Figure 4 Raman telescope and Raman microscope spectra of RDX. ............................... 23
Figure 5 Remote Raman spectrum of TNT at 7 m, 514 nm, 1W and 10 sec.................... 23
Figure 6 Comparison of Raman telescope and Raman microscope spectra of TNT. ....... 24
Figure 7 Remote Raman spectrum of 2,4-DNT at 7 m, 514 nm, 1W and 10 sec. ............ 26
Figure 8 Comparison of Raman telescope and Raman microscope spectra of DNT........ 27
Figure 9 Remote Raman spectra of TATP........................................................................ 29
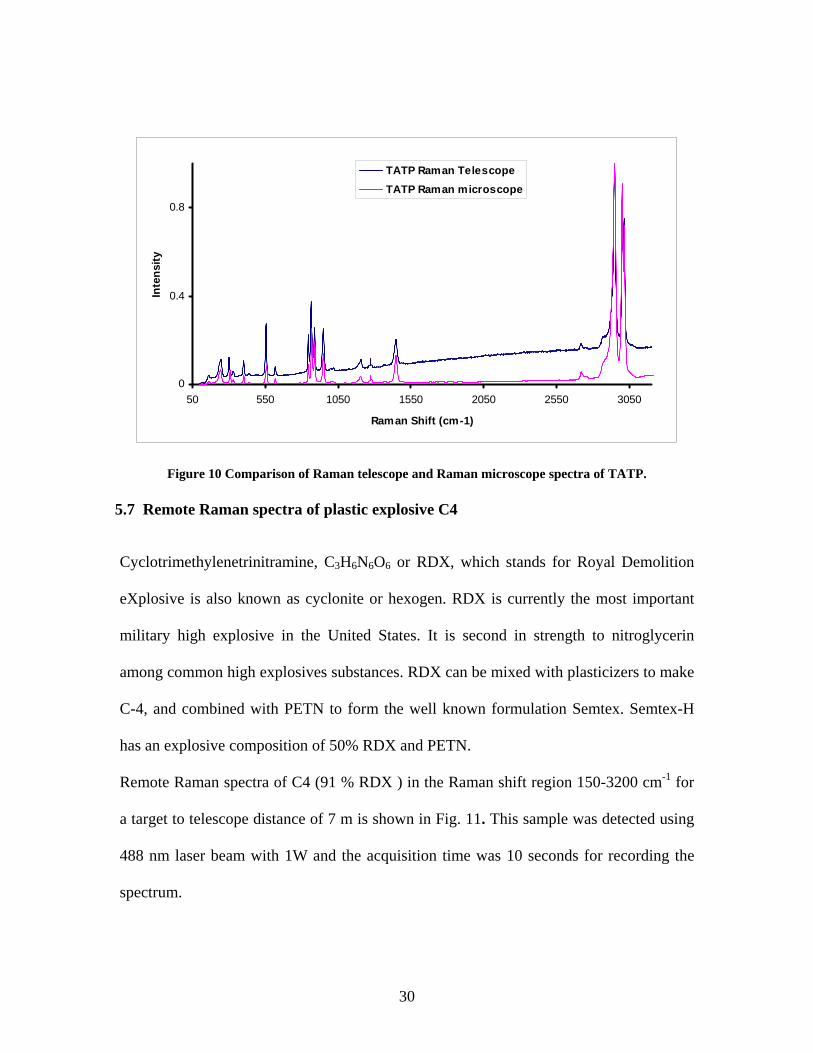
Figure 10 Comparison of Raman telescope and Raman microscope spectra of TATP.... 30
Figure 11 Remote Raman spectrum of C4 at 7 m, 488 nm, 1W and 10s. ........................ 31
Figure 12 Remote Raman fingerprint region of C4. ......................................................... 31
Figure 13 Remote Raman spectra of mixture of RDX and aspirin................................... 33
Figure 14 Calibration graphs for C4, varying power laser and acquisition time.............. 35
Figure 15 Detection of C4 varying amount, power and integration time ......................... 35
Figure 16 Remote Raman of Chemical Warfare Agents simulants.................................. 38
Figure 17 DMMP’s area used to quantification in water.................................................. 39
Figure 18 Calibration graphs for DMMP in water............................................................ 40
Figure 19 Raman spectra of aromatic compounds in fingerprint region. ......................... 41
Figure 20 Raman spectra of isomers of xylenes in the 150–1800 cm-1 ............................ 42
Figure 21 Raman spectra for carbon disulfide, carbon tetrachloride, and cyclohexane
used in this work ................................................................................................ 43
viii

1. INTRODUCTION
During recent years, the world has suffered many terrorist attacks by use of explosives
and chemical warfare agents, such as the attack in London on July 7, 2005 (also called
the 7/7 bombings), where several explosions in a bus and four subway stations occurred
almost simultaneously during the rush hours of the morning. These events completely
affected the entire underground network and buses, casting shadows on the joy of
Londoners, who had been recently selected as hosts for the 2012 Olympic Games. On the
other hand, another fatal attack occurred in New York, also called 9/11 where an Al
Qaeda related terrorist group highjacked several commercial aircrafts and destined them
to crash into the World Trace Center buildings, where many people lost their lives. These
and other terrible events have motivated many countries to focus their research toward
the detection of explosives, hazardous liquids, and chemical agents that can be employed
by terrorist organizations as threats against troops and/or civilians. The anticipation of
future attacks requires a wide array of detection systems for potential deployment
scenarios.1, 2
An explosive is described as a metastable agent before detonation. Actual detonation is
characterized by extremely rapid reaction rates, measured in milliseconds. Products of
this detonation are gasses, heat and high pressures. Explosives can be classified by their
performance and uses. Primary explosives also known as low explosives undergo very
rapid transition from burning to detonation. These are capable of transmitting the
detonation to less sensitive explosives. Detonation can occur by heat or shock. Examples
of primary explosives are mercury fulminate and lead azide. Secondary explosives, also
10
known as high explosives, cannot be detonated readily by heat or shock and they are less
sensitive than primary explosives, so they need the later to detonate. Examples of
secondary explosives are 2,4-dinitrotoluene (DNT), 2,4,6-trinitrotoluene (TNT),
triacetone triperoxide (TATP) and hexahydro-1,3,5-trinitro-1,3,5-triazine (RDX). TNT is
one of the high explosives that has been used for military purposes since 1902.
Chemical Warfare Agents (CWA) most likely to be used as terrorist weapons, according
to terrorism experts include nerve agents, blister agents, choking agents and blood agents.
Nerve agents are a group of particularly toxic chemical warfare agents.3, 4 They were
developed just before and during World War II and are chemically related to
organophosphorus insecticides. The principal compounds in this group are: Tabun (GA),
Sarin (GB), Soman (GD), and methylphosphonothioic acid (VX). Characterization of
hydrolysis and or degradation products of CWA has been documented to provide still
another capability to detect possible attacks to water systems.2, 3
During the last few years, the topic of explosives detection has been an active research
area. The need for security screening introduced a variety of schemes for detection of
trace amounts of energetic materials.5 Several techniques have been employed to detect
and identify explosives, hazardous liquids and chemical warfare agents simulants
including HPLC/MS, GC/MS, IMS, Infrared Spectroscopy, Raman Spectroscopy, among
others. Vibrational spectroscopy has the advantage that provides chemical information
besides detection capabilities. Raman spectroscopy is a non-destructive and non-invasive
technique that requires little sample treatment and has the potential for remote sensing.
11
There is a need for more sensitive and selective remote detection techniques for
explosives operating at ambient conditions, in situ and in real-time scale. Therefore,
Standoff Raman spectroscopy (SRS) provides a method for identifying chemicals in a
sample located meters from the excitation source. In fact, telescope based Raman
spectroscopy detection methods have been reported for standoff detection of chemicals
using both visible and UV laser excitation.6-13 This distance can vary from a few
centimeters, for monitoring chemicals in a manufacturing process, to tens of meters when
examining potentially-dangerous samples such as explosives. SRS has been demonstrated
and is used in several areas, including explosives detection, atmospheric analysis and
detection of different organic and inorganic compounds.
1.1 OBJECTIVE
The objective of this work was to design and assemble a visible region Raman telescope
and to demonstrate, at laboratory scale, the capability of Raman Spectroscopy as a tool in
remote sensing technology. The standoff sensing system was tested for the detection of
explosives (TNT, RDX, PETN, C4 and Semtex) and hazardous liquids (benzene, toluene,
ethyl benzene, xylenes (BTEX)). Other compounds that were studied included Chemical
Warfare Agents Simulants, such as dimethylmethyl phosphonate (DMMP), 2-chloroethyl
ethyl sulfide (2-CEES) and di-isopropylmethyphosphonate (DIMP)). This objective was
accomplished using a Raman Microspectrometer equipped with 488 and 514 nm
excitation lines from a Coherent INNOVA 308 Ar+. The spectroscopic system was
coupled to a reflective optical telescope typically used in astronomy via optical fibers of
600 µm inner diameter.
12
2. PREVIOUS WORK
During the past few years, researchers have dedicated part of their time and efforts to
study the detection of explosives, hazardous liquids, and chemical agents on many
surfaces and into bottles. Recent work has led to development of methods to couple
Raman system to light collecting systems, i.e., telescopes.
In 2003, Sharma et al. developed a version of a visible region, standoff Raman
spectroscopic system, using Maksutov-Cassegrain telescope and a pulsed laser (20 Hz,
532 nm, Nd:YAG).12 This system was capable of measuring the Raman spectra of
benzene in liquid and vapor phase and minerals located at a distance of 4.5-10 m from the
telescope. Sharma et al. in 2005 used a small portable Raman system for standoff
detection and identification of various types of organic chemicals including benzene,
toluene, ethyl benzene and xylenes (BTEX).13 Both fiber optic (FO) coupled and a
directly coupled telescope to an f/2.2 spectrograph were developed and tested. A
frequency-doubled Nd:YAG pulsed laser (20 Hz, 532 nm, 35 mJ/pulse) were used as
excitation source. The operational range of the FO coupled Raman system was tested to
66 m, and the directly coupled system was tested to a distance of 120 m. They also
measured remote Raman spectra of two explosives: tri-aminotrinitrobenzene (TATB) and
beta-HMX at 10 m standoff distance.
Carter et al. (2005) designed and demonstrated a standoff Raman system for detecting
high explosive materials at distances up to 50 meters in ambient light conditions.15 In the
system, light was collected using an 8-in. Schmidt–Cassegrain telescope fiber-coupled to
13
an f/1.8 spectrograph with a gated intensified charge-coupled device (ICCD) detector. A
frequency-doubled Nd:YAG (532 nm) pulsed (10 Hz) laser was used as the excitation
source for measuring remote spectra of samples containing up to 8% explosive materials.
The explosives RDX, TNT, and PETN as well as nitrate- and chlorate-containing
materials were used to evaluate the performance of the system with samples placed at
distances of 27 and 50 meters. Laser power studies were performed to determine the
effects of laser heating and photodegradation on the samples.
In 2006 Aunupam et al. obtained Raman spectra of common minerals and organic
(benzene, cyclohexane, 2-propanol, naphthalene, etc.) compounds from a small portable
instrument at a distance of 10 m in a well illuminated laboratory with a single 532 nm
laser pulse of energy of 35 mJ/pulse. 14
14
3. THEORY OVERVIEW
3.1 Raman spectroscopy
Raman spectroscopy is a high resolution photonic technique that provides in a few
seconds to minutes spectroscopic information that can be used to convey chemical and
structural information about any organic and inorganic compounds. The Raman effect
was originally observed in 1928 (Figure 1) by the physicist Chandrasakhar V. Raman. Sir
C.V. Raman first observed the phenomenon using sunlight and was awarded the Nobel
Prize in Physics for this discovery in 1930.17
The Raman event occurs when a monochromatic light of frequency νo encounters a
sample (gas, solid or liquid). When analyzing the light scattered by the sample, it is found
that most of the scattered light presents the same frequency as the incident light
(elastically scattered radiation). The light that keeps the same frequency νo that the
incident light is known as elastic or Rayleigh scattering and provides no information on
the composition of the sample. A small fraction of the emerging light photons shows
frequency shifts resulting from the interaction of light with matter (inelastically scattered
radiation). Scattered light that presents different frequencies to that of the incident
radiation is known as Raman scattering. The new frequencies νo +νR and νo -νR are
Raman frequencies, which are characteristic of the nature and physical state of the sample
and independent of the incident radiation.
Variations in the observed frequency in Raman scattering phenomenon, are equivalent to
variations in energies. Ions and atoms chemically bonded to form molecules and
crystalline networks are subjected to constant vibrational and rotational movements; these
15
oscillations are observed at certain frequencies based on the masses of particles involved
and the dynamic behavior of the bond that exist. Each of these vibrational and rotational
movements of the molecule and correspond to a certain value of molecular energy.
When the photon beam incident light, with energy (hvo) much greater than the difference
in energy between two vibrational (or rotational) levels of the molecule collides with the
molecule, most of the photons pass by without interacting with the molecular system; but
a small fraction are scattered (of the order of 1 scattered photon per 106 incident photons).
This scattering can be interpreted as the following process: the incident photon leads the
molecule temporarily to a higher level of energy vibrational or rotational (virtual state)
which is not an allowed or stationary state, which quickly decays to an allowed energy
level emitting a photon.
If scattered photon is the result of the photon-molecule interaction, its frequency differs
of the incident frequency, this collision is termed inelastic. This means that there is a
transfer of energy between the photon and the molecule, in this case two phenomena may
occur: If the scattered photon has lower frequency than the incident one, there is a
transfer of energy from photon to the molecule that after moving into a forbidden energy
state, and returns to its allowed initial energy state, the photon is scattered with frequency
νo -νR and Stokes Raman dispersion occurs. Another possible phenomenon occurs if the
scattered photon has a higher frequency than the incident, there is a transfer of energy
from the molecule to the photon; this means that initially before the collision occurred the
molecule was not in its lowest vibrational state, but one of higher energy. After the
collision takes place, the photon is scattered with a frequency νo + νR and Raman anti-
Stokes scattering occurs.
16
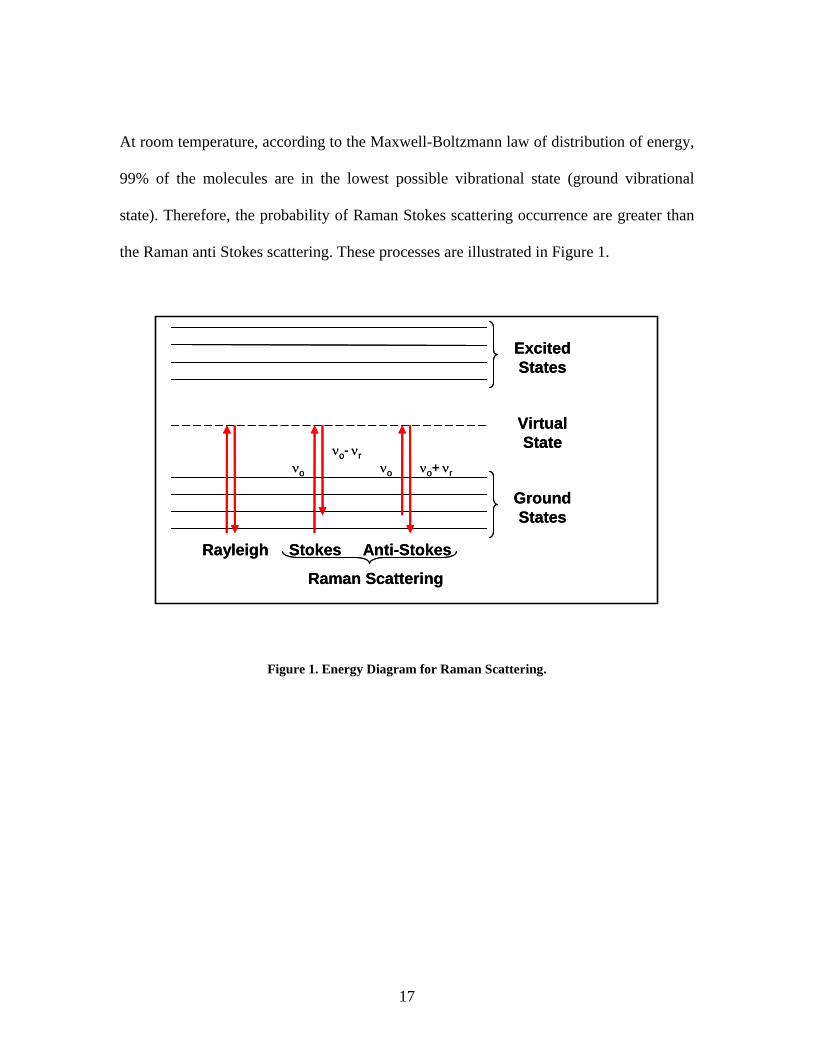
At room temperature, according to the Maxwell-Boltzmann law of distribution of energy,
99% of the molecules are in the lowest possible vibrational state (ground vibrational
state). Therefore, the probability of Raman Stokes scattering occurrence are greater than
the Raman anti Stokes scattering. These processes are illustrated in Figure 1.
Excited States
Ground States
Virtual State
νo νo+ νrνo
νo- νr
Rayleigh Stokes Anti-Stokes
Raman Scattering
Excited States
Ground States
Virtual State
νo νo+ νrνo
νo- νr
Rayleigh Stokes Anti-Stokes
Raman Scattering
Figure 1. Energy Diagram for Raman Scattering.
17
4. MATERIALS AND METHODS
4.1 Reagents
The reagents that were used in this investigation were:
1. High explosives (HE), precursors and formulations: 2,4,6-trinitrotoluene (TNT,
99% Chem Service, West Chester, PA); hexahydro-1,3,5-trinitro-1,3,5-triazine
(RDX, 99%, Chem Service); pentaerythritol tetranitrate (PETN), C4, Semtex-H;
acetone (CH3COCH3, 98% w/w, Aldrich-Sigma Chemical Co., Milwaukee, WI),
hydrogen peroxide (H2O2 50% in water, Aldrich-Sigma).
2. Toxic Industrial Compounds (TICs): methyl ether (CH3OCH3, Aldrich-Sigma);
ethylbenzene, certified Fisher Scientific, International, (Cat # O2751-1, > 99%),
toluene ACS certified, Fisher Cat. # AC42455-5000 (>99%), (o-m-p) xylenes,
certified Fisher Scientific International, (Cat # O5078-1, >99%).
3. Chemical Warfare Agents Simulants (CWAS): dimethylmethyl
phosphonate (DMMP, Fisher Scientific International, Chicago, IL); diisopropyl
methylphosphonate (DIMP, Alfa Aesar, Ward Hill, MA), 2-chloroethyl ethyl
sulfide (2-CEES, Sigma Aldrich Chemical Company, St. Louis, MO).
4.2 Sample preparation
All liquid reagents were deposited in glass vials, and solids reagents were deposited on
the stainless steel slides.
18

4.3 Raman Instrumentation
Renishaw Raman Microspectrometer RM2000 system was employed for the vibrational
spectroscopy measurements. The 514.5 and 488 laser lines of a Coherent INNOVA 308
argon ion laser and the 532 nm of a Coherent VERDI, 6 watts maximum power, solid state
diode laser system were employed as excitation sources. Raman spectra of samples were
collected in the Raman Shift range of 200-3600 cm-1. Integration time from 1 to 30 seconds
were used.
4.4 Optical Fiber cable
Premium Grade Xtreme XSR solarization-resistant Optical Fiber Assemblies were
obtained from Ocean Optics, Inc. In particular, reflection/backscattering fiber optics
probes operating in a wavelength range of 180-900 nm of 600 µm in diameter model #
AL 1217 were used to interface the telescope to the Raman Microspectrometer
4.5 Telescope
A Meade ETX-125AT 5.0"/125mm Maksutov-Cassegrain reflective telescope (1900 mm;
f/15) with motorized guidance system (Altazimuth Mount, Autostar computerized
controller), 26 mm (73x) 1.25" eyepiece, 8x25 finderscope was used as light collector.
The system was equipped with a tripod and a bench stand to allow for various
applications.
19

5 RESULTS AND DISCUSSION
5.1 Raman telescope design
The experimental setup for the prototype standoff Raman spectroscopy based system is
schematically shown in Fig. 2. The prototype system consists of a Renishaw Raman
Microspectrometer, model RM2000, equipped with an charge-coupled device (CCD)
detector and the appropriate filters for rejection of satellite plasma lines (laser line filters)
and laser radiation to block Rayleigh scattered light (notch filters), a telescope, a fiber
optic assembly, and a single line/frequency laser system operating at 514/488nm (argon
ion) and 532 nm (frequency doubled Nd:YAG solid state diode).
Figure 2. Design of standoff VIS Raman Telescope.
12’
Telescope CCD
Objective 5X
Edge Filter
Optic FiberSample
Distance from telescope Laser
20
The telescope (MEADE ETX-125, Maksutov-Cassegrain design, 125 mm clear aperture,
1900 mm focal length, f /15) was coupled to the Raman microscope with an optical fiber
(non-imaging, 600 µ diameter, model AL 1217, Ocean Optics, Inc.). Two lenses
collimate the light from the telescope output, which is directed into the fiber optic from
which the focusing objective was removed. The output of the fiber optic assembly was
directly coupled to the Raman system by 5x objective. Neat liquid samples were placed
into 5 mL glass vials and placed about 7-10 meters from telescope. Solid samples were
smeared onto stainless steel plates under controlled conditions. Spectra of all compounds
were measured in the Raman Shift range of 100-3200 cm-1 at laser powers from 50 mW
to 1 W and integration times of 1 – 30 s.
5.2 Remote Raman Spectra of HEs and Comparison with Normal Raman
Spectra
Remote Raman spectrum of RDX in region 150-3200 cm-1 at a distance of 7 m from the
telescope is shown in Fig. 3. This sample was detected using a laser excitation
wavelength of 514 nm with 1W power and an acquisition time of ten seconds for
recording the spectrum. Figure 4 shows a comparison between the normal (or
spontaneous) Raman (NR) spectrum of the important nitroaromatic high explosive (HE).
Figures 4, 6, 8 and 10 illustrate a comparison between the Raman spectra employing
telescope and microscope. For the Raman telescope spectrum of TNT, an absence of
bands around 3100 cm-1 and at low frequencies is observed. For DNT’s Raman telescope
spectrum, no spectral difference is found except for low frequencies. However, for the
21

situation of RDX an absence of bands in the fingerprint region around 1400-1600 cm-1
and low frequencies are observed as well. There is no evidence about this phenomena,
possibly this situation is due to optical interferences and fluorescence, which is persistent
in every spectrum except for TATP and more notable in RDX.
5.3 RDX
RDX
0
2500
5000
7500
10000
50 550 1050 1550 2050 2550 3050
Raman shift(cm-1)
Inte
nsity
Figure 3 Remote Raman spectrum of RDX at 7 m, 488 nm, 1W and 10 s.
22
0
0.2
0.4
0.6
0.8
1
1.2
1.4
50 550 1050 1550 2050 2550 3050
Raman Shift (cm-1)
Inte
nsity
RDX Raman microscopeRDX Raman Telescope
Figure 4 Raman telescope and Raman microscope spectra of RDX. 5.4 TNT
TNT
0
200
400
600
800
1000
1200
1400
150 650 1150 1650 2150 2650 3150
Raman shift (cm-1)
Inte
nsity
Figure 5 Remote Raman spectrum of TNT at 7 m, 514 nm, 1W and 10 sec.
23

0
0.2
0.4
0.6
0.8
1
1.2
50 550 1050 1550 2050 2550 3050
Raman shift (cm-1)
Inte
nsity
TNT Raman telescopeTNT Raman microscope
Figure 6 Comparison of Raman telescope and Raman microscope spectra of TNT.
The most important Raman signals that allowed the identification of TNT can be
observed in table 1, Bands of the C-H region are observed at 3016 and 2955 cm-1. These
bands can be assigned to the aromatic C-H asymmetric stretching vibration and
symmetric stretch, respectively, and belong to the alkyl CH3 group. The principal peaks
of high intensity are 1365 cm-1 (NO2 symmetric stretching vibration), 1535 cm-1
(asymmetric NO2 stretching), 1617 cm-1 (2,6-NO2 asymmetric stretching vibration), 1210
cm-1 (C-H (ring) in plane bend, ring breathing). Very weak bands are observed at 822
cm-1 (nitro-group scissoring mode), and 792 cm-1 (C-CH3 stretching, 2,4,6-NO2
scissoring).
24

Table 1 Assignments of vibrational modes of TNT
Raman Frequencies cm -1 Assignments
326 2,4,6 C-N in plane torsion
366 Methyl group deformation
792 C-CH3 stretching, 2,4,6 NO2 scissors
822 2,4,6 NO2 scissors
914 C-H (ring) out of plane bend
941 C-H (ring) out of plane bend
1091 C-H (ring) in plane bend
1175 Symmetric methyl C-C-H bending
1210 C-H (ring) in plane bend, ring breathing
1361 NO2 symmetric, C-N stretching
1538 NO2 Asymmetric stretching
1616 2,6 NO2 Asymmetric stretching\
2956 C-H Asymmetric stretching
3016 Aromatic C-H stretching
3065 Aromatic C-H stretching
25
5.5 2,4-DNT
The remote Raman spectrum of 2,4-DNT (DNT), in the region 150-3200 cm-1,and at a
distance of 7 m from the telescope is shown in Fig. 7. This sample was detected using a
514 nm laser beam with 1W and the acquisition time was 10 seconds for recording the
spectrum. The reference micro Raman spectrum of DNT is compared to the RRS
spectrum of DNT in Figure 6. According to the literature 2,4-DNT is characterized by six
prominent bands in (table 2) the 750-1650 cm-1 region: a very strong peak at 1350 cm-1
(NO2 symmetric stretching mode), two bands at 1514 cm-1 (asymmetric NO2 stretching)
and 1607 cm-1 (aromatic – NO2 conjugation), one band at 1193 cm-1 (C-H in plane bend),
a band at 1075 cm-1 (C-N-O bending mode) and one band at 792 cm-1 (C-H out-of-plane
bend).
2,4-DNT
0
500
1000
1500
2000
2500
3000
3500
150 650 1150 1650 2150 2650 3150
Raman Shift (cm-1)
Inte
nsity
Figure 7 Remote Raman spectrum of 2,4-DNT at 7 m, 514 nm, 1W and 10 sec.
26

0
0.2
0.4
0.6
0.8
1
1.2
50 550 1050 1550 2050 2550 3050
Ramna shift (cm-1)
Inte
nsity
DNT Raman telescopeDNT Raman microscope
Figure 8 Comparison of Raman telescope and Raman microscope spectra of DNT. The Raman Shift signal at 2940 cm-1 was assigned to the asymmetric C-H vibration of
the CH3 group. The peak found at 3100 cm-1 corresponds to the aromatic C-H stretching
vibration.
27

Table 2 Assignments of vibrational modes of 2,4-DNT.
Raman cm-1 Tentative Assignment 2,4-DNT
3100 aromatic C-H stretching vibration
3070 aromatic C-H stretching vibration
3021 aromatic C-H stretching vibration
2940 asymmetric C-H vibration of the CH3 group
1607 aromatic- NO2 conjugation
1514 asymmetric NO2 stretching vibration
1445 C-C ring stretching
1350 symmetric NO2 stretching vibration
1193 H-C-C in plane bend
1147 symmetric methyl H-C –H bend
1123 methyl H-C-H asymmetric bend
1075 C-N-Ó bend
1020 Out- of- plane bend of ring H
830 methyl rock
792 out-of- plane C-H and C-N bend
780 Nitro-group scissoring mode
717 C-N-Ó bend
560 ring deformation
100-500 Skeletal deformation of the aromatic ring
28

5.6 Remote Raman spectra of TATP
Figure 9 shows the remote Raman spectra of triacetone triperoxide. TATP is an explosive
used by terrorist which has appeared as a weapon of mass destruction in the Middle East.
It can be as or more powerful than some military analogs. TATP is one of the most
sensitive explosives known, being extremely sensitive to impact, temperature change and
friction. TATP can be easily prepared in a basement lab using commercially available
starting materials obtained from, e.g., hardware stores, pharmacies, and stores selling
cosmetics. TATP is a fairly easy explosive to prepare but highly unstable, as far as
explosives manufacturing goes. All it requires is acetone, hydrogen peroxide and a strong
acid such as hydrochloric or sulfuric acid.
The most important bands in the Raman spectrum of TATP appear around 860-1000 cm-1
corresponding to peroxide O-O stretching mode. The low-frequency bands near 550-600
cm-1 corresponding to the O-C-O bending motion.21
TATP
0
500
1000
1500
2000
2500
3000
3500
4000
150 350 550 750 950 1150 1350 1550 1750Raman Shift (cm-1)
Inte
nsity
Figure 9 Remote Raman spectra of TATP.
29
0
0.4
0.8
50 550 1050 1550 2050 2550 3050
Raman Shift (cm-1)
Inte
nsity
TATP Raman TelescopeTATP Raman microscope
Figure 10 Comparison of Raman telescope and Raman microscope spectra of TATP.
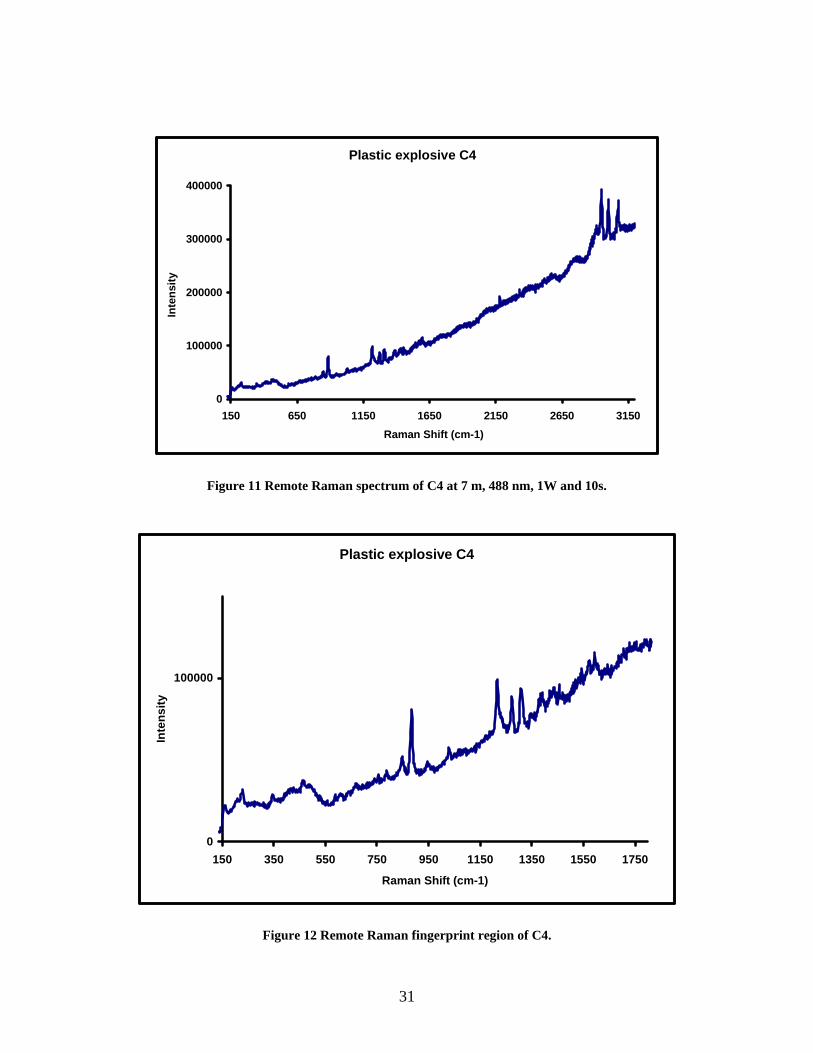
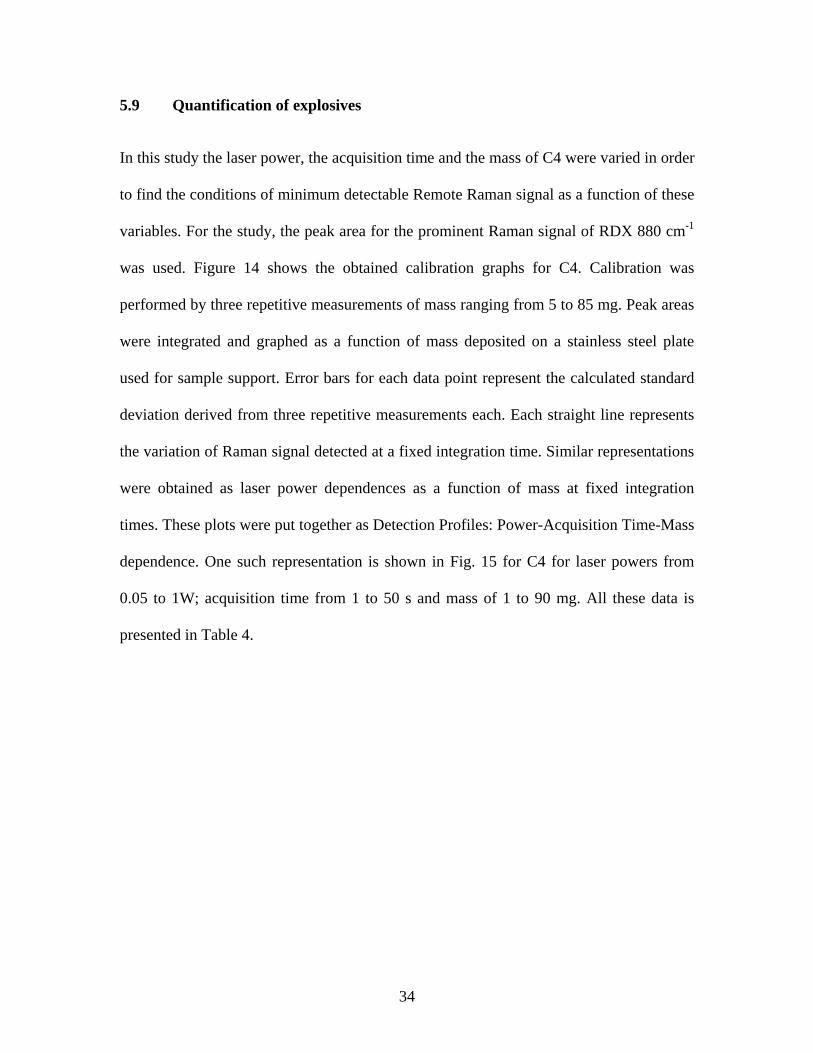
5.7 Remote Raman spectra of plastic explosive C4
Cyclotrimethylenetrinitramine, C3H6N6O6 or RDX, which stands for Royal Demolition
eXplosive is also known as cyclonite or hexogen. RDX is currently the most important
military high explosive in the United States. It is second in strength to nitroglycerin
among common high explosives substances. RDX can be mixed with plasticizers to make
C-4, and combined with PETN to form the well known formulation Semtex. Semtex-H
has an explosive composition of 50% RDX and PETN.
Remote Raman spectra of C4 (91 % RDX ) in the Raman shift region 150-3200 cm-1 for
a target to telescope distance of 7 m is shown in Fig. 11. This sample was detected using
488 nm laser beam with 1W and the acquisition time was 10 seconds for recording the
spectrum.
30
Plastic explosive C4
0
100000
200000
300000
400000
150 650 1150 1650 2150 2650 3150Raman Shift (cm-1)
Inte
nsity
Figure 11 Remote Raman spectrum of C4 at 7 m, 488 nm, 1W and 10s.
Plastic explosive C4
0
100000
150 350 550 750 950 1150 1350 1550 1750
Raman Shift (cm-1)
Inte
nsity
Figure 12 Remote Raman fingerprint region of C4.
31

Raman signals can be identified in the symmetric and asymmetric C-H bond-stretching
region shown in Figure 11. These signals are centered at 2982, 2989, 3068 and 3077 cm-1
(Table 3). 18 Several bands are observed in the fingerprint region NO2 deformations and
stretches coupled to C-H and N-N and C-N-C deformations between 1300 and
1000 cm-1 19 The most important and strongest Raman peak are at 880 and 1222 cm-1 are
attributed to the symmetric ring-breathing mode and the N-N bond stretch, respectively
(figure 12). 20
Table 3. Assignments of vibrational modes of RDX
Frequency vibrational mode
370- 380 C-N-C deformation a
849 – 860 CH2 rocking and C-N-C deformation a
870- 900 ring stretching b
1200-1350 N-N strectch and Symmetric NO2
1520 – 1590 asymmetric NO2 strectch
2980-3070 C-H stretching
a y b Indicates assignments from ref [18] and [20] respectively
32

5.8 Mixture of RDX with Aspirin
Remote Raman spectra of RDX, aspirin and their 50% mixture in the fingerprint region
150-1800 cm-1 at a distance of 7 m from the telescope are shown in Fig. 13. These
samples were detected using 488 nm laser beam with 1W and the acquisition time was 10
seconds for recording the spectrum. In the laboratory made mixture, it is possible to
differentiate the peaks at 880 and 1600 cm-1, corresponding to the symmetric ring-
breathing in RDX and the C=O stretching mode in aspirin.
Figure 13 Remote Raman spectra of mixture of RDX and aspirin.
33
5.9 Quantification of explosives
In this study the laser power, the acquisition time and the mass of C4 were varied in order
to find the conditions of minimum detectable Remote Raman signal as a function of these
variables. For the study, the peak area for the prominent Raman signal of RDX 880 cm-1
was used. Figure 14 shows the obtained calibration graphs for C4. Calibration was
performed by three repetitive measurements of mass ranging from 5 to 85 mg. Peak areas
were integrated and graphed as a function of mass deposited on a stainless steel plate
used for sample support. Error bars for each data point represent the calculated standard
deviation derived from three repetitive measurements each. Each straight line represents
the variation of Raman signal detected at a fixed integration time. Similar representations
were obtained as laser power dependences as a function of mass at fixed integration
times. These plots were put together as Detection Profiles: Power-Acquisition Time-Mass
dependence. One such representation is shown in Fig. 15 for C4 for laser powers from
0.05 to 1W; acquisition time from 1 to 50 s and mass of 1 to 90 mg. All these data is
presented in Table 4.
34
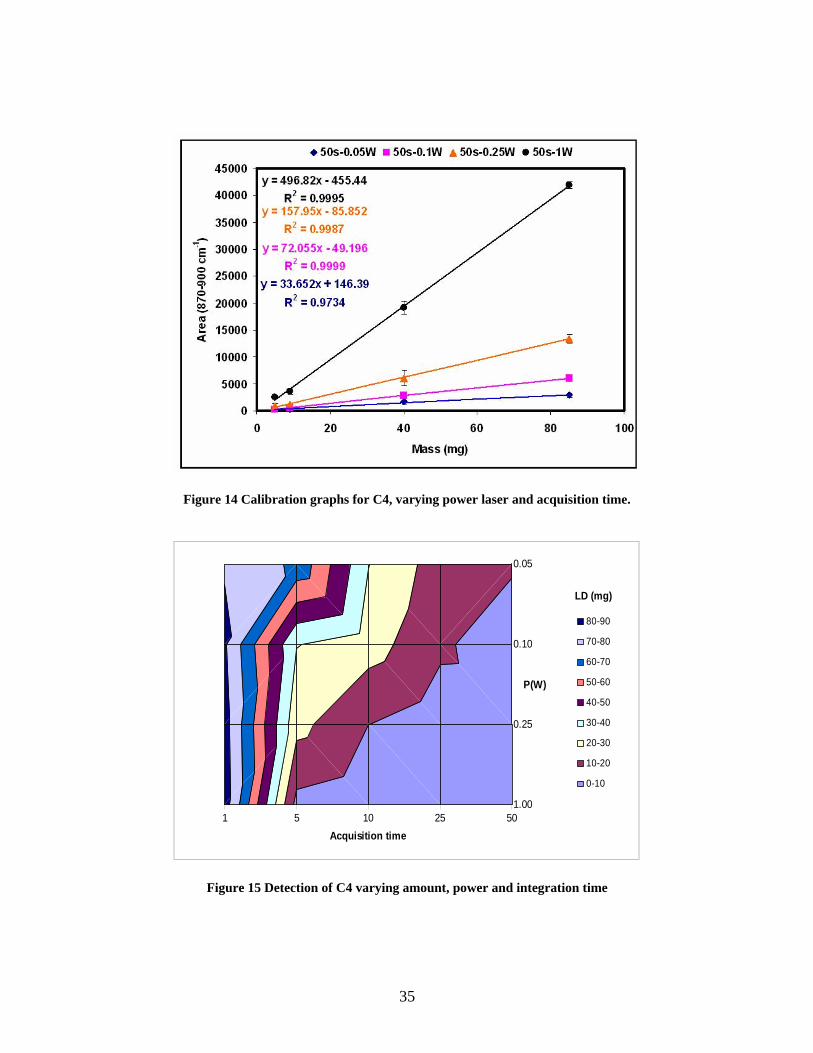
Figure 14 Calibration graphs for C4, varying power laser and acquisition time.
1 5 10 25 50
0.05
0.10
0.25
1.00
LD (mg)
Acquisition time
P(W)
80-90
70-80
60-70
50-60
40-50
30-40
20-30
10-20
0-10
Figure 15 Detection of C4 varying amount, power and integration time
35

Table 4. Detection limits of C4 at different conditions.
Power (W)
Acquisition
time (s) LD (mg)
0.05 1 80
0.1 1 81
0.25 1 84
1 1 85
0.05 5 68
0.1 5 30
0.25 5 23
1 5 7
0.05 10 30
0.1 10 24
0.25 10 10
1 10 3
0.05 25 15
0.1 25 12
0.25 25 5
1 25 3
0.05 50 12
0.1 50 3
0.25 50 4
1 50 2
Detection limits for each explosive have been calculated according to IUPAC by the 3σ
criteria (3 times standard deviation of the peak-to-peak noise related to the slope of the
36
linear regression function) and resulted in LODs below of 10 mg, These values represent
a significant improvement from this work and other relevant spectroscopic approaches to
explosive remote determination are summarized in Table 5.
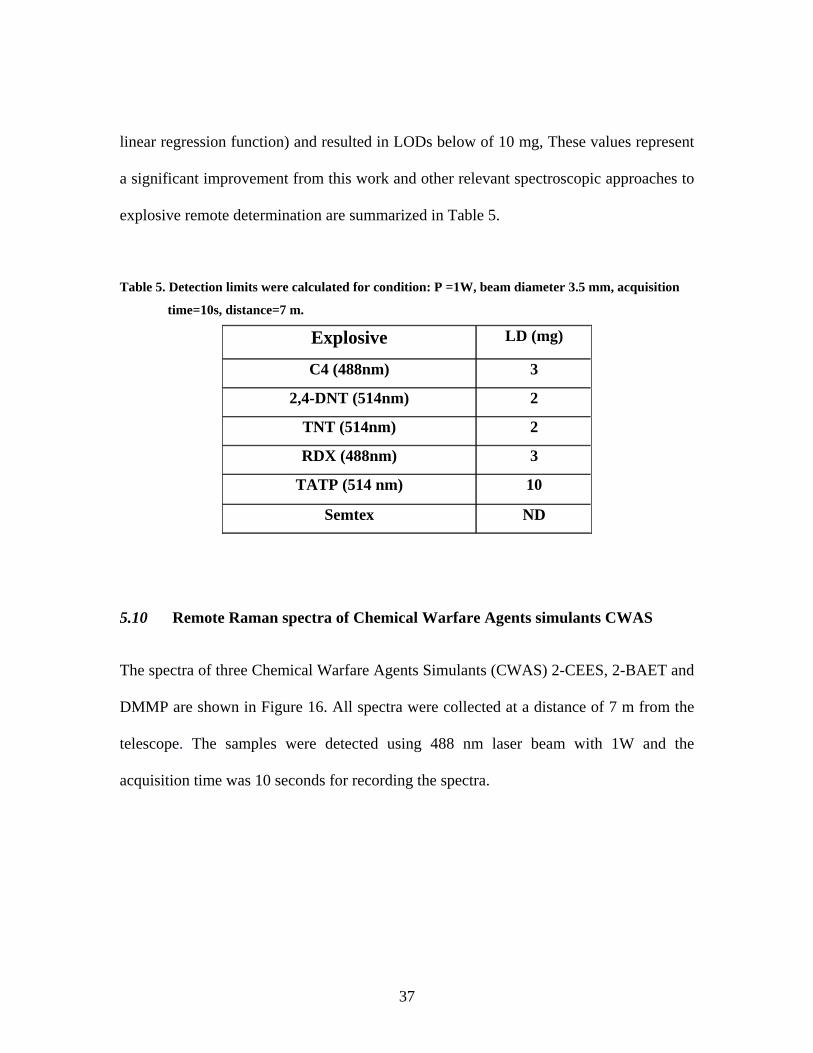
Table 5. Detection limits were calculated for condition: P =1W, beam diameter 3.5 mm, acquisition
time=10s, distance=7 m.
Explosive LD (mg)
C4 (488nm) 3
2,4-DNT (514nm) 2
TNT (514nm) 2
RDX (488nm) 3
TATP (514 nm) 10
Semtex ND
5.10 Remote Raman spectra of Chemical Warfare Agents simulants CWAS
The spectra of three Chemical Warfare Agents Simulants (CWAS) 2-CEES, 2-BAET and
DMMP are shown in Figure 16. All spectra were collected at a distance of 7 m from the
telescope. The samples were detected using 488 nm laser beam with 1W and the
acquisition time was 10 seconds for recording the spectra.
37
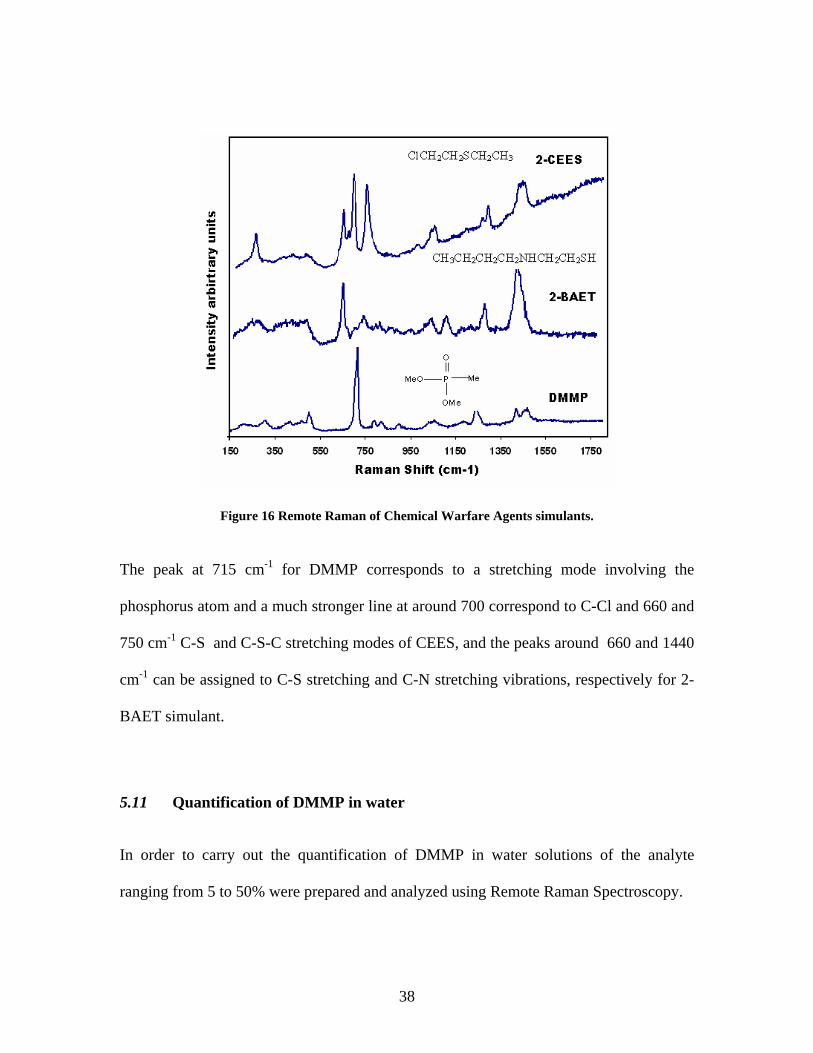
Figure 16 Remote Raman of Chemical Warfare Agents simulants.
The peak at 715 cm-1 for DMMP corresponds to a stretching mode involving the
phosphorus atom and a much stronger line at around 700 correspond to C-Cl and 660 and
750 cm-1 C-S and C-S-C stretching modes of CEES, and the peaks around 660 and 1440
cm-1 can be assigned to C-S stretching and C-N stretching vibrations, respectively for 2-
BAET simulant.
5.11 Quantification of DMMP in water
In order to carry out the quantification of DMMP in water solutions of the analyte
ranging from 5 to 50% were prepared and analyzed using Remote Raman Spectroscopy.
38

For DMMP quantification, the peak area of the strongest Raman signal located about 715
cm-1 was used (Fig. 17).
Figure 17 DMMP’s area used to quantification in water.
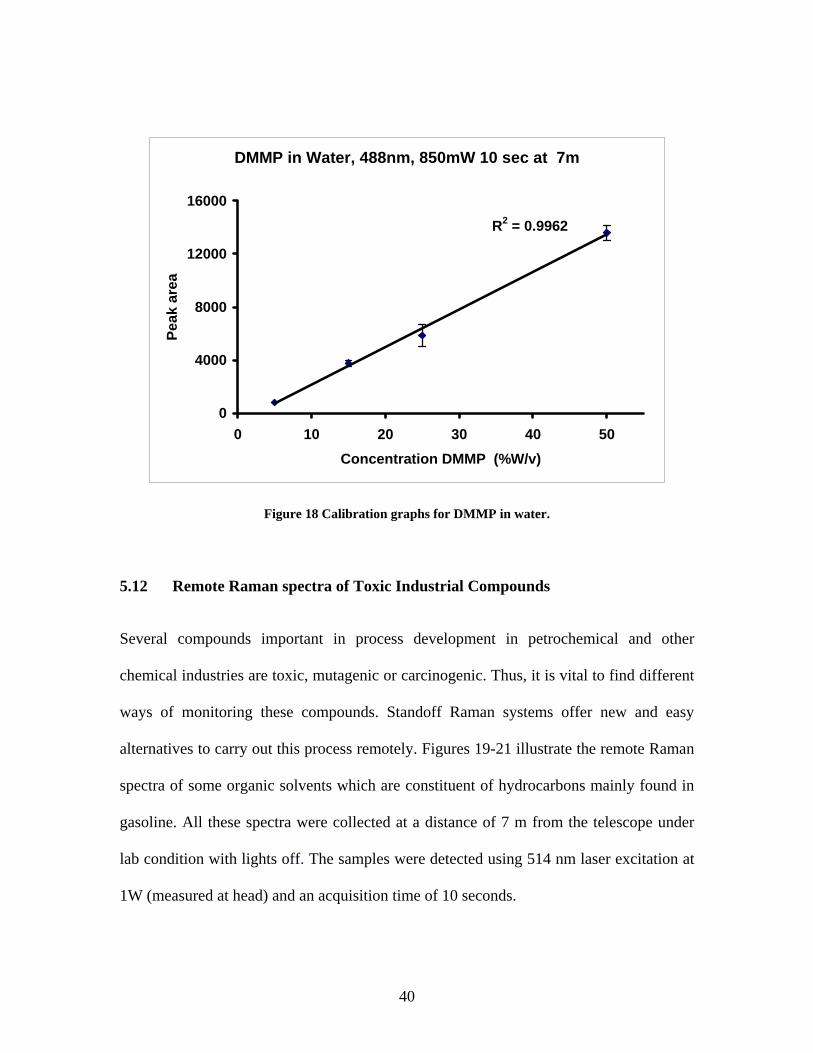
Figure 18 shows the obtained calibration graphs for the investigated analytes in aqueous
solution. Calibration was performed by three repetitive measurements of a concentration
series ranging from 50% (v/v) to 1% ppm (v/v) for DMMP, using 850 mW power and
integration time of 10 seconds. Error bars for each data point represent the calculated
standard deviation derived from all repetitive measurements each. Detection limits for
this analyte has been calculated according to IUPAC by the 3σ criteria (3 times standard
deviation of the peak-to-peak noise related to the slope of the linear regression function)
and resulted in LODs of 4 (%w/v).
39
DMMP in Water, 488nm, 850mW 10 sec at 7m
R2 = 0.9962
0
4000
8000
12000
16000
0 10 20 30 40 50Concentration DMMP (%W/v)
Peak
are
a
Figure 18 Calibration graphs for DMMP in water.
5.12 Remote Raman spectra of Toxic Industrial Compounds
Several compounds important in process development in petrochemical and other
chemical industries are toxic, mutagenic or carcinogenic. Thus, it is vital to find different
ways of monitoring these compounds. Standoff Raman systems offer new and easy
alternatives to carry out this process remotely. Figures 19-21 illustrate the remote Raman
spectra of some organic solvents which are constituent of hydrocarbons mainly found in
gasoline. All these spectra were collected at a distance of 7 m from the telescope under
lab condition with lights off. The samples were detected using 514 nm laser excitation at
1W (measured at head) and an acquisition time of 10 seconds.
40
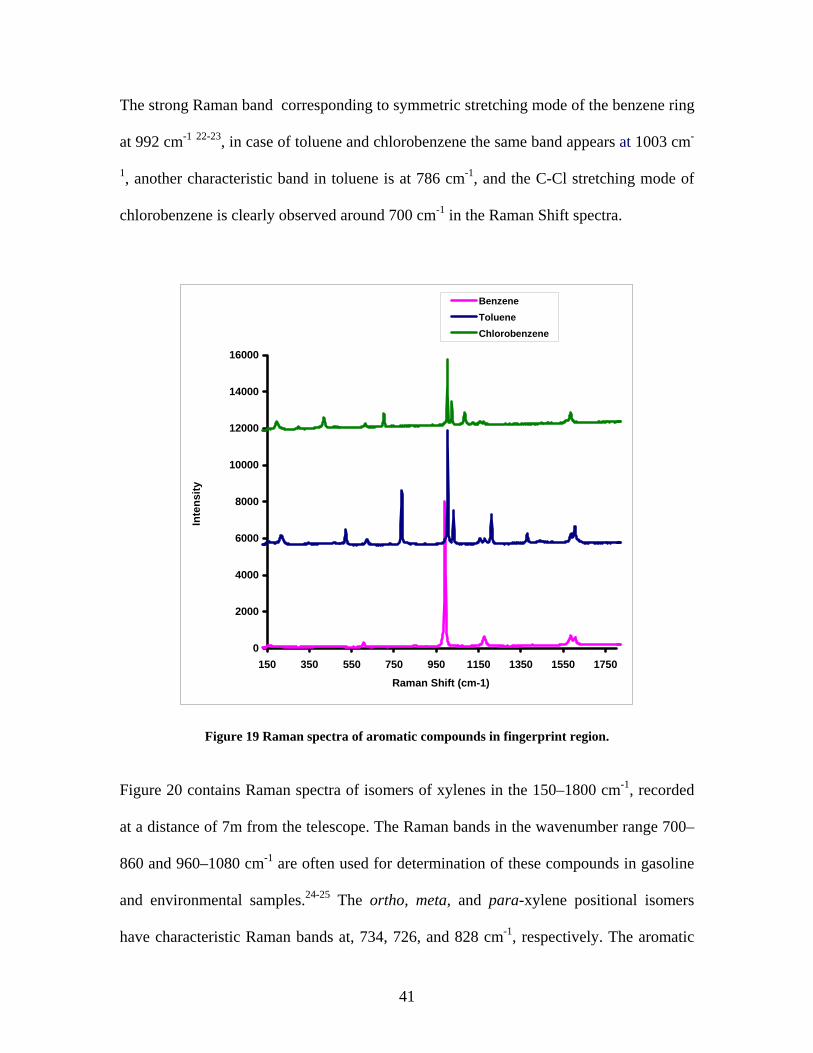
The strong Raman band corresponding to symmetric stretching mode of the benzene ring
at 992 cm-1 22-23, in case of toluene and chlorobenzene the same band appears at 1003 cm-
1, another characteristic band in toluene is at 786 cm-1, and the C-Cl stretching mode of
chlorobenzene is clearly observed around 700 cm-1 in the Raman Shift spectra.
0
2000
4000
6000
8000
10000
12000
14000
16000
150 350 550 750 950 1150 1350 1550 1750Raman Shift (cm-1)
Inte
nsity
BenzeneTolueneChlorobenzene
Figure 19 Raman spectra of aromatic compounds in fingerprint region.
Figure 20 contains Raman spectra of isomers of xylenes in the 150–1800 cm-1, recorded
at a distance of 7m from the telescope. The Raman bands in the wavenumber range 700–
860 and 960–1080 cm-1 are often used for determination of these compounds in gasoline
and environmental samples.24-25 The ortho, meta, and para-xylene positional isomers
have characteristic Raman bands at, 734, 726, and 828 cm-1, respectively. The aromatic
41

ring stretch gives rise to a strong Raman band at 992 cm-1 in the spectrum of benzene, in
the spectra of xylenes these aromatic ring stretching modes can be used as sensitive
indicators of aromatic compounds in mixtures.
0
2000
4000
6000
8000
150 350 550 750 950 1150 1350 1550 1750Raman Shif (cm-1)
Inte
nsity
ortho xylenepara xylenemeta xylene
Figure 20 Raman spectra of isomers of xylenes in the 150–1800 cm-1
Several organic solvents are widely used in the industry and also at lab scale, such as
carbon disulfide, carbon tetrachloride and cyclohexane. All these compounds have
particular characteristics mainly the cyclohexane, this one is used as one of the standards
for calibrating Raman spectra. In this work, we also have measured the Raman spectra of
these compounds contained into 5 mL clear glass vial in the 150–1800 cm-1 region at
stand-off distance of 7 m (Fig. 21).
It possible to identify carbon disulfide by its very strong peak around at 655 cm-1
corresponding C-S symmetric stretching mode, the same for the carbon tetrachloride that
has three mainly peaks. The most important band for CCl4 appears at 461 cm-1; this band
42
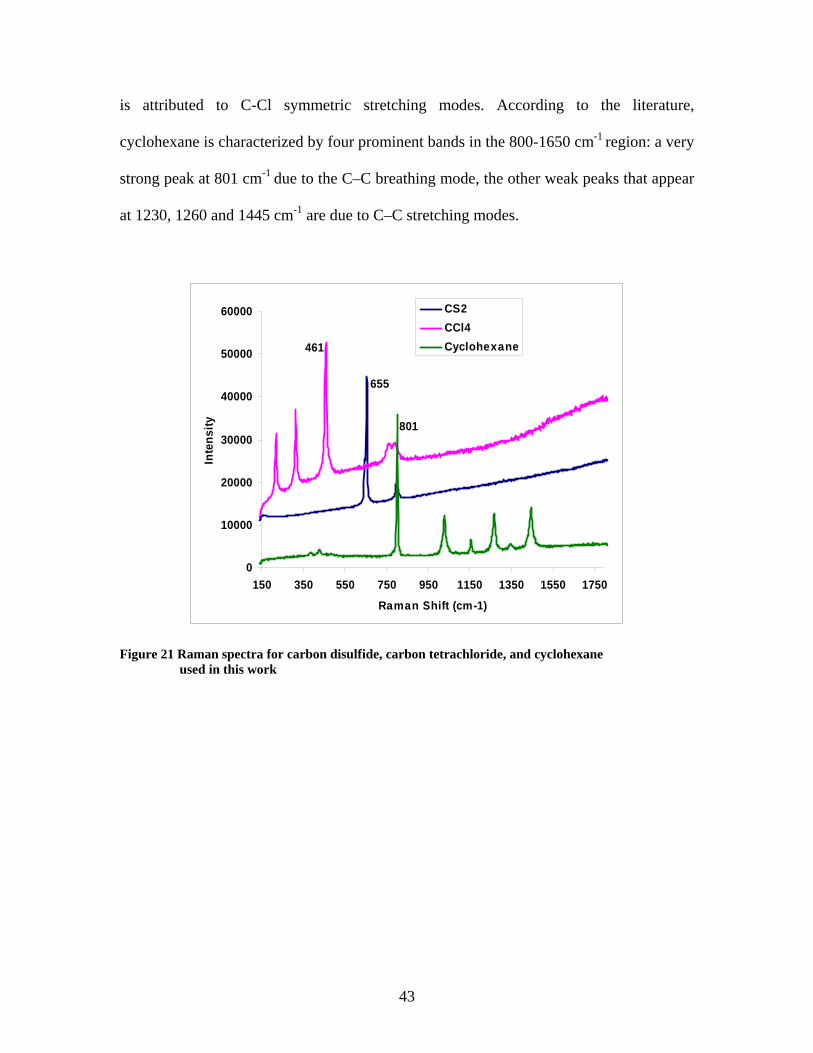
is attributed to C-Cl symmetric stretching modes. According to the literature,
cyclohexane is characterized by four prominent bands in the 800-1650 cm-1 region: a very
strong peak at 801 cm-1 due to the C–C breathing mode, the other weak peaks that appear
at 1230, 1260 and 1445 cm-1 are due to C–C stretching modes.
0
10000
20000
30000
40000
50000
60000
150 350 550 750 950 1150 1350 1550 1750
Raman Shift (cm-1)
Inte
nsity
CS2CCl4Cyclohexane
801
655
461
Figure 21 Raman spectra for carbon disulfide, carbon tetrachloride, and cyclohexane used in this work
43
6 CONCLUSION
A Standoff Raman system has been constructed by coupling a Raman Spectrometer with
a reflective telescope by fiber optics employing 488 and 514 nm lasers as excitation lines.
This prototype was tested in the detection of high explosives (HE): TNT, DNT, TATP,
RDX and plastic explosive C4; chemical warfare agents simulants (CWAS): DMMP, 2-
CEES and 2-TAEB and hazardous liquids.
The operational range of the Standoff system was tested to 7 m at laboratory scale, under
dark conditions. Quantification of explosives was accomplished with detection limits
below 10 mg. In addition, quantification of DMMP in water accomplished with a low
limit of detection of 4%w/v.
The designed and tested remote Raman system allowed the detection organic solvents
and mixtures of RDX and aspirin. It is important to mention that all chemical substances
employed in this work were detected with a 514 nm excitation line except for C4 (RDX)
which required 488 nm. Semtex, another plastic explosive of wide military application,
could not be detected employing this system. The remote Raman system designed in this
work will be useful for defense and security applications and monitoring environmental
pollution, and for identifying unknown materials.
44
7 FUTURE WORK
Future work in this area can be basically focused to the detection of compounds
previously studied at different distances and, particularly in volatile explosive in gas
phases such as TATP and TNT, it is possible to contribute to the study of mixture of
explosives implementing a Chemometrics analysis for quantifying analytes in more
complex mixtures.
45

8 BIBLIOGRAPHY
1. Sun, Y.; and Ong, K. Y.; Detection Technologies for Chemical Warfare Agents and
Toxic Vapors (CRC Press, Boca Raton, FL, 2005). 2. Farquharson, S.; Gift, A.; Maksymiuk, P.; Inscore F. Surface-enhanced Raman
spectra of VX and its hydrolysis products, Appl. Spec. 2005, 59, 654-659. 3. Smentkowski, V. S.; Hagans, P.; Yates, J. T. Study of the Catalytic Destruction of
Dimethyl Methylphosphonate: Oxidation over Mo(ll0), Phys. Chem.1988, 92, 6351-6357.
4. Marrs, T. C.; Maynard, R. L.; Sidell, F. R. Chemical Warfare Agents: Toxicology and
Treatment, (John Wiley & Sons Ltd., London, UK, 1996). 5. Steinfeld, J.I.; Wormhoudt, Annu. Rev. Phys. Chem. 1998, 49, 203. 6. Hirschfeld, T. Range Independence of Signal in Variable FocusRemote Raman
Spectrometry. Appl. Opt. 1974, 13, 1435. 7. Angel, S.M.; Kulp, T.J.; Vess, T.M. Appl. Spec. 1992, 46, 1085. 8. Wu, M.; Ray, M.; Fung, K.H.; Ruckman, M.W.; Harder, D.; Sedlacek III, A.J. Stand-
off detection of chemicals by UV Raman spectroscopy. Appl. Spectrosc. 2000, 54, 800-806.
9. Sedlacek III, A.J.; Ray, M.D.; Higdon, N.S.; Richter, D.A. Short-range noncontact
detection of surface contamination using Raman lidar Proc. SPIE. 2001, 95, 4577. 10. Sharma, S.K.; Angel, S.M.; Ghosh, M.; Hubble, H.W.; Lucey, P.G. A remote pulsed-
laser Raman spectroscopy system for mineral analysis on planetary surfaces to 66 meters. Appl. Spectrosc 2002, 56, 699-705.
11. Thomson, G.; Batchelder, D. Rev. Sci. Instrum. 2002, 73, 4326. 12. Sharma, S.K.; Lucey, P.G.; Ghosh, M.; Hubble, H.W.; Horton, K.A. Stand-off Raman
Spectroscopic Detection of Minerals on Planetary Surfaces. Spectrochim. Acta A 2003, 59, 2391-2407.
13. Sharma, S.K; Anupam, K.M; Bhavna S. Portable remote Raman system for
monitoring hydrocarbon, gas hydrates and explosives in the environment Spectrochimica Acta Part A: Molecular and Biomolecular Spectroscopy August 2005, 61, 2404-2412.
46
14. Misra, A.; Sharma S. K.; Lucey, P. G. Remote Raman Spectroscopy detection of minerals and or organics under illuminated conditions from a distance of 10 m using a single 532 nm laser pulse. Appl. Spectrosc. 2006, 60, 223-228.
15. Carter, J. C.; Angel, S. M.; Lawrence-Snyder, M.; Scaffidi, J.; Whipple, R. E.;
Reynolds, J. G. Standoff detection of high explosive materials at 50 meters in ambient light conditions using a small Raman instrument. Appl. Spectrosc. 2005, 59, 769–775.
16. Sharma, S.K.; Lucey, P.G.; Ghosh, M.; Hubble, H.W.; Horton, K.A. Stand-off Raman
Spectroscopic Detection of Minerals on Planetary Surfaces,. Spectrochim. Acta A 2003, 59, 2391-2407.
17. Birke, R. L.; Lombardi, J. R.; Gale, in R. J. ed. Spectroelectrochemistry theory and
practice, Plenun, New York, 1998 263-328 18. Torres, P.; Mercado, L.; Cotte, I.; Hernandez, S. P.; Mina, N.; Santana, A.,
Chamberlain, R. T.; Lareau, R.; Castro, M. E. Vibrational Spectroscopy Study of β and α RDX Deposits. J. Phys. Chem. B, 2004, 108, 8799 -8805.
19. Rice, B. M.; Chabalowski, C. F. Ab Initio and Nonlocal Density Functional Study of
1,3,5-Trinitro-s-triazine (RDX) Conformers. J. Phys Chem. A 1997, 101, 8720-8726. 20. Lin-Vien, D.; Colthup, N. B.; Fateley, W. G.; Grasselli, J. G. The Handbook of
Infrared and Raman Characteristic Frequencies of Organic Molecules Academic Press: San Diego, CA, 1991.
21. Dubnikova, F.; Kosloff, R.; Almog, J.; Zeiri, Y.; Boese, R.; Itzhaky, H.; Alt, A.;
Keinan, E. Decomposition of Triacetone Triperoxide Is an Entropic Explosion. J. Am. Chem. Soc.; 2005, 127, 1146-1159.
22. Karpowicz, R. J.; Brill, T. B. Comparison of the molecular structure of hexahydro-1,3,5-
trinitro-s-triazine in the vapor, solution and solid phases. J. Phys. Chem. 1984, 88, 348-352.
23. Shimanouchi, T.; Tables of Molecular Vibrational Frequencies Consolidated, vol. 1,
National Bureau of Standards, 1972. 24. Sverdlov, L.M.; Kovner, M.A.; Krainov, E.P.; Vibrational Spectra of Polyatomic
Molecules. Moscow: Nauka, 1970. 25. Stellman, C.M.; Ewing, K.J.; Bucholtz, F.; Aggarwal, I.D.; Sens. Actuators B 53
1998,173. 26. Skinner, H.T.; Cooney, T.F.; Angel, S.M. Appl. Spectrosc. 1996, 50, 836
47