Embed Size (px)
Citation preview
IOTC-2019-WPEB15-18
STANDARDIZED CPUE OF BLUE SHARK (Prionace glauca) CAUGHT BY
INDONESIAN LONGLINE FLEET IN THE EASTERN INDIAN OCEAN
Irwan Jatmiko*, Bram Setyadji & Zulkarnaen Fahmi
1Research Institute for Tuna Fisheries, Bali, Indonesia *Email: [email protected]
ABSTRACT
Standardized catch per unit effort (CPUE) as calculated based on commercial catches
are the input data to run stock assessment models to gather useful information for decision
making in fishery management. In this paper a Generalized Linear Model (GLM) was used
to calculate relative abundance indices and effect of longline fishing gear configuration. The
parameters used for standardization of CPUE were quarter, year, number of hooks between
floats, latitude and longitude. Data were collected by a scientific observer program from
August 2005 to December 2018. Most of the boats monitored were based in Benoa Port,
Bali. Catches are often equal to zero because blue shark is a bycatch for Indonesian longline
fleets. A tweedie model was selected because it has flexibility to the sample distributions.
The results showed that the average scaled CPUE was 1.19. The CPUE pattern showed
fluctuated during periods and reached the peak on 2006 with 2.09 and the lowest on 0.33 in
2011. The results from this study can demonstrate the catch variation of blue shark by
Indonesian tuna longline fleets.
Key Words: Blue shark, standardized CPUE, GLM.
INTRODUCTION
Blue shark (Prionace glauca) is one of the shark species that commonly caught by
Indonesian longline fishery. As a highly migratory species, this fish stocks and their
utilization are carried out by various countries. In the Indian Ocean, managing fish is carried
out in countries that are members of the Indian Ocean Tuna Commission on these fish (IOTC,
2018). One of the method used is to calculate the catch per unit effort (CPUE)
standardization. Assuming that the fishing effort per unit (CPUE) is calculated based on
commercial data it is assumed to be proportional to abundance but also follows the capture
power (Quinn & Deriso, 1999).
Nominal changes in CPUE over several years can reflect changes in abundance and
capture rate. This happens because of several factors, namely changes in fishing technology
and fishing grounds. If there is information about the factors that affect the catch, a statistical
model can be used to calculate a standard CPUE value that reflects changes in abundance.

IOTC-2019-WPEB15-18
This CPUE standard can be used to evaluate fish supply status, or as input data in estimating
fish stocks (Squires & Vestergaard, 2015). CPUE standardization had been applied to assess
the stock status for swordfish (Xiphias gladius) and tuna (Thunnus sp.) on Indonesian
longline fishery (Jatmiko et al., 2017; Setyadji et al., 2017; Sadiyah et al., 2012).
In GLM, the response variable is assumed to follow the probability distribution of
the exponential family. In this paper the GLM are used to calculate the standard CPUE of
the blue shark captured by the Indonesian longline fleet in the East Indian Ocean (McCullagh
& Nelder, 1989). There are four alternative factors that need to be examined: quarter, year,
hook between float (HBF) and lattitude-longitude. The results are useful for assessing the
stock status of blue sharks, which are important fisheries resources in the Indian Ocean.
MATERIAL AND METHODS
Data and Exploratory Analysis
Tuna long line in Indonesia have gross tonnage between 14 - 149 GT with
specifications consisting of main line, branch line, float line, hook, float, radio buoy and
others. The material used for the main strap and branch rope is generally monofilament with
a diameter of 3 mm and 2 mm. In addition to monofilament, some of the materials used for
main and branch ropes are nylon, kuralon, polyamide, polyethylene, kuralon, skyama and
longyarn and a combination of these materials. The fishing line used in general is No. 4
In general, longline tuna fishing operations consist of setting and hauling. Between
the stocking and drawing of the fishing line there is a time lag usually called the soaking
time. The activities of tuna longline fishing based in Benoa Port are generally carried out in
the morning at 5:00 a.m. - 10:00 p.m. with a soaking time of about 3-7 hours and fishing
hauling activities for 7-13 hours.
The data collection includes the number of captured blue sharks, the number of hooks
and the location of the fishing collection, obtained by the Global Positioning System (GPS)

IOTC-2019-WPEB15-18
device. In addition, scientific observers also noted long line characteristics such as the
number of hooks between buoys, the length of the buoy line, the length of the branch line,
and the length between the branch lines. Catches per unit of effort are calculated as U = (C /
f) × 1,000, where C is the number of fish captured in the fishing set, f is the number of hooks,
and U is CPUE in the number of fish caught per 1,000 hooks (Klawe, 1980).
A summary of basic statistics regarding central trends and dispersion is calculated
for all variables. Contingency tables and mosaic plots are used to evaluate the balance of
database entries at the level of intersection of factors (eg year x quarter). Histograms and
dispersion diagrams are used to assess the relationship between variables. Correlation
coefficients between continuous variables are also calculated to identify redundant variables.
Models
Generalized linear models (GLM) can be written in matrix notation as the realization
vector of the response variable; E is hope, g is a link function, is a parameter vector and is a
design matrix of explanatory variables. The probability distribution for, and link functions
must be pre-selected to calculate parameter estimates, which represent the effects of
explanatory variables (e.g. years) (McCullagh & Nelder, 1989). The model used for the
analysis is:
glm(formula = CPUE ~ Year + Quarter + Cat_HBF + LatLon, family = tweedie(var.
power = p, link.power = 0), data = bsh)
The explanatory variables considered in the model for standardizing CPUE are year,
quarter, hooks between floats (HBF) and location (latitude and longitude). HBF was
categorize into deep (> 10 hooks) and shallow (<= 10 hooks). Latitude and longitude were
combined into LatLon. These variables are chosen as factors that influence the catchability
level in the longline fleet. There is no separation between the Exclusive Economic Zone
(EEZ) inside and outside Indonesia because fishing areas are still in the same area in the

IOTC-2019-WPEB15-18
Eastern Indian Ocean. The standard diagnostic plot is used to assess the installation of the
selected model. All analyzes are carried out using the R software function.
RESULTS AND DISCUSSION
The fishing ground of tuna longline fishing were spread from coordinates 09°-18° S
and 98°-117° E. The average number of hooks between floats tends to be stagnant from year
to year with an average of 14 hooks and range from 11-19 hooks. The highest average
occurred in 2005 with 19 hooks and the lowest was in 2006 with 11 hooks. The average
number of total hooks used in one fishing operation was 1,300 hooks/set with ranges from
1,000-1,500 hooks/set. The highest number occurred in 2007 with more than 1,500 hooks/set
and the lowest number occurred in 2011 with only 1,000 hooks/set (Table 1).
Nominal CPUE (N/1,000 hooks) showed very low number with the average of
0.6/1,000 hooks. The highest value occurred in 2018 with 1.2/1,000 hooks and the lowest
value occurred in 2011 with less than 0.1/1,000 hooks. The pattern showed fluctuated from
2005-2013 then rose significantly from 2014 and reached the peak on 2018 with around
1.2/1,000 hooks (Figure 1). For the standardized CPUE (N/1,000 hooks) showed the higher
average of 1.3/1,000 hooks. The highest value occurred in 2006 with 2.1/1,000 hooks and
the lowest value occurred in 2011 with less than 0.3/1,000 hooks. The pattern also showed
fluctuated throughout the years and appeared increased in 2018 with around 1.5/1,000 hooks
(Figure 4).
Moreover, the proportion of zero catch showed high value from around 0.4 to almost
1.0. The highest value was occurred in 2011 with almost 1.0 and the lowest was around 0.4
occurred in 2018 (Figure 2). Overall, there was around 65% fishing operations did not caught
blue shark. The relatively low number of blue shark caught by Indonesian tuna longline
vessels showed that this species is bycatch from targeted tuna (Jatmiko et al., 2015).
The summary indicators showed that all variables (Year, Quarter, Cat_HBF and
IOTC-2019-WPEB15-18
Latlon) were significantly affect the catch of blue shark (p<0.05) (Table 2). The fishing
ground (LatLon) had important roles of the fishing operation due to the reducing the residual
deviance in substantial value.
Indonesian longline fleets were mainly operated in south and west of Indonesian
waters. This area was included in the eastern Indian Ocean. Therefore, the analyzed datasets
cover a portion of the Indian Ocean stock and the standardize CPUE can be interpreted as a
local alternate. However, the data and information from other spots which covering whole
Indian Ocean will provide better assessment for stock status of blue sharks.
It is important to notice that the results of the model indicate that more information
is needed to increase the information from the variation of blue shark fishing by Indonesian
longline fisheries. The model did not met every time we attempt to adjust it using more
parameters regarding the interaction between years and other variables. The lack of
convergence often arises when the model is more than a parameter, when the data does not
convey sufficient information to allow estimation of all parameters (McCullagh & Nelder,
1989).
The low decrease in proportional deviation shows that fishing ground (LatLon) was
the most influence variable that affecting the catch of blue shark in longline fishery.
However, other variables and information such as during the day when a longline is deployed
in water (day or night), type of bait, size and type of hook, and if fishermen use light sticks
to attract fish, it is necessary to better understand catch levels, and increase relative
abundance index estimates . Therefore, Indonesian onboard observers are encouraged to
collect more detailed data, which is very important for assessing the status of fisheries in the
southeast, and the stock of Indian blue sharks.
ACKNOWLEDGEMENT
This research is funded in cooperation between Research Centre for Fisheries

IOTC-2019-WPEB15-18
Management and Conservation and Australian Centre for International Agricultural
Research (2005-2009). Research fund was from Research Institute for Marine Fisheries
(2010-2011), continued by a research fund from Research Institute for Tuna Fisheries (2012-
2018). Authors would like to thank Dr. Rui Coelho (IPMA) for the several R-code script.
The authors also thanks the scientific observer from Research Institute for Tuna Fisheries
for their contribution on data collection.
REFERENCES
IOTC. (2018). Report of the 14th Session of the IOTC Working Party on Ecosystem and
Bycatch (p. 124). Cape Town, South Africa, 10-14 September 2018.
Jatmiko, I., Andrade, H. & Nugraha, B. (2017). Delta model approach for CPUE
standardization of swordfish (Xiphias gladius Linnaeus, 1978) caught by Indonesian
longline fleet in the Eastern Indian Ocean. Indonesian Fisheries Research Journal.
23(1), 7-16.
Jatmiko, I., Nugraha, B. & Satria, F. (2015). Achievement of the development of observer
program on tuna longline fishery in Indonesia. Marine Fisheries. 6(1), 23-31.
Klawe, W.L. (1980). Long lines catches of tunas within the 200 miles Economic zones of the
Indian and Western Pacific Ocean (p. 83). Dev. Rep. Indian Ocean Programme 48.
McCullagh, P & Nelder, J.A. (1989). Generalized Linear Models (p. 513). London, UK:
Chapman and Hall.
Quinn, T.J. & Deriso, R.B. (1999). Quantitative Fish Dynamics (p. 542). New York, USA:
Oxford University Press.
Sadiyah, L., Dowling, N. and B.I. Prisantoso. 2012. Develoving recommendations for
undertaking CPUE standardisation using observer program data. Indonesian
Fisheries Research Journal. 18(1), 19-33.
IOTC-2019-WPEB15-18
Setyadji, B., Fahmi, Z. & Andrade, H. (2017). Standardized CPUE indices for swordfish
(Xiphias gladius) from the Indonesian tuna longline fishery. IOTC-2017-WPB15-15.
Squires, D. & Vestergaard, N. (2015). Productivity growth, catchability, stock assessments,
and optimum renewable resource use. Marine Policy. 62, 309-317.
White, W. T., P. R. Last, J. D. Stevens, G. K. Yearsley, Fahmi & Dharmadi. (2006).
Economicaly important sharks and rays of Indonesia. National Library of Australia
Cataloging-in-Publicationentry.Australia. 329p.

IOTC-2019-WPEB15-18
Table 1. Summary of observed fishing effort from Indonesian tuna longline fishery
during 2005–2018. Results are pooled and also presented by year of observation.
Table 2. Summary of indicators as calculated using Tweedie model. Number of
predicted zero catches (zero), and p values as calculated using a Kolmogorov-Smirnov test.
Df Deviance Resid. Df Resid. Dev F Pr(>F) NULL 2898 5727.0 Year 13 807.36 2885 4919.7 35.7542 < 2.2e-16 *** Quarter 3 31.05 2882 4888.6 5.9589 0.0004782 *** Cat_HBF 1 137.94 2881 4750.7 79.4150 < 2.2e-16 *** LatLon 40 1629.58 2841 3121.1 23.4541 < 2.2e-16 *** --- Signif. codes: 0 ‘***’ 0.001 ‘**’ 0.01 ‘*’ 0.05 ‘.’ 0.1 ‘ ’ 1
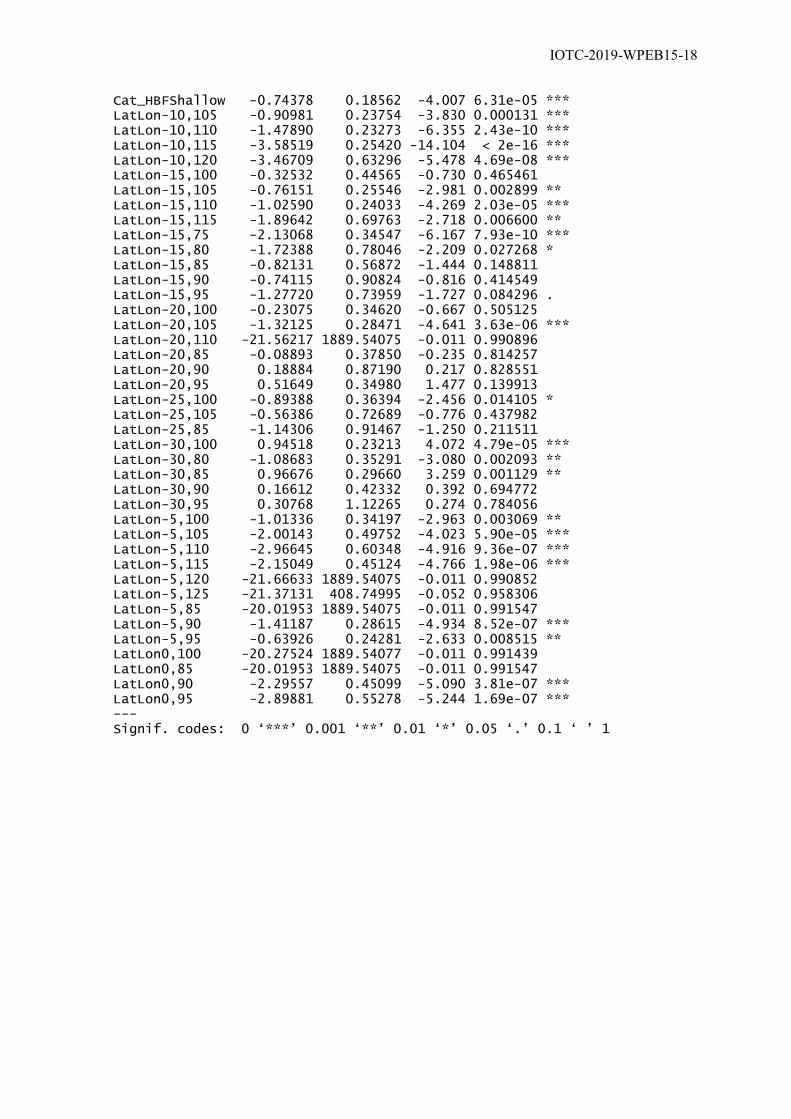
Table 3. Summary of parameter estimations of Tweedie model. Terms: SE – standard
error, p – p values as calculated using Z test to assess difference from zero.
Estimate Std. Error t value Pr(>|t|) (Intercept) 0.09364 0.31963 0.293 0.769569 Year2006 0.75450 0.22340 3.377 0.000742 *** Year2007 0.68697 0.22065 3.113 0.001868 ** Year2008 0.51004 0.21792 2.341 0.019326 * Year2009 -0.12099 0.26484 -0.457 0.647824 Year2010 0.55813 0.25654 2.176 0.029666 * Year2011 -1.20562 0.66269 -1.819 0.068973 . Year2012 -0.30194 0.26970 -1.120 0.262995 Year2013 -0.69414 0.32681 -2.124 0.033758 * Year2014 -1.04238 0.30762 -3.389 0.000712 *** Year2015 -0.36576 0.32005 -1.143 0.253213 Year2016 0.70284 0.27329 2.572 0.010168 * Year2017 -0.24048 0.25792 -0.932 0.351219 Year2018 0.55172 0.22471 2.455 0.014137 * Quarter2 0.51561 0.13546 3.806 0.000144 *** Quarter3 0.41145 0.14554 2.827 0.004732 ** Quarter4 -0.01094 0.14752 -0.074 0.940868
Year Trip Sets Total hooks Hooks per set Mean hooks
per float Mean Lat (S) Mean Lon (E)
2005 9 108 157,065 1,454 19 14.3 111.8
2006 13 401 577,243 1,440 11 16.9 113.4
2007 13 265 406,135 1,533 14 17.0 103.5
2008 15 370 483,662 1,307 13 14.2 107.3
2009 13 283 323,042 1,142 12 11.4 113.2
2010 6 165 220,394 1,336 14 12.0 113.3
2011 3 105 110,384 1,051 12 13.7 117.4
2012 8 198 290,265 1,466 14 18.9 104.5
2013 7 210 231,994 1,105 13 12.3 114.9
2014 6 182 214,665 1,180 15 11.2 106.1
2015 5 148 172,463 1,165 14 10.8 103.8
2016 3 130 175,868 1,353 11 9.2 106.0
2017 4 139 192,188 1,383 15 14.9 98.3
2018 6 195 262,856 1,348 15 14.5 105.3
IOTC-2019-WPEB15-18
Cat_HBFShallow -0.74378 0.18562 -4.007 6.31e-05 *** LatLon-10,105 -0.90981 0.23754 -3.830 0.000131 *** LatLon-10,110 -1.47890 0.23273 -6.355 2.43e-10 *** LatLon-10,115 -3.58519 0.25420 -14.104 < 2e-16 *** LatLon-10,120 -3.46709 0.63296 -5.478 4.69e-08 *** LatLon-15,100 -0.32532 0.44565 -0.730 0.465461 LatLon-15,105 -0.76151 0.25546 -2.981 0.002899 ** LatLon-15,110 -1.02590 0.24033 -4.269 2.03e-05 *** LatLon-15,115 -1.89642 0.69763 -2.718 0.006600 ** LatLon-15,75 -2.13068 0.34547 -6.167 7.93e-10 *** LatLon-15,80 -1.72388 0.78046 -2.209 0.027268 * LatLon-15,85 -0.82131 0.56872 -1.444 0.148811 LatLon-15,90 -0.74115 0.90824 -0.816 0.414549 LatLon-15,95 -1.27720 0.73959 -1.727 0.084296 . LatLon-20,100 -0.23075 0.34620 -0.667 0.505125 LatLon-20,105 -1.32125 0.28471 -4.641 3.63e-06 *** LatLon-20,110 -21.56217 1889.54075 -0.011 0.990896 LatLon-20,85 -0.08893 0.37850 -0.235 0.814257 LatLon-20,90 0.18884 0.87190 0.217 0.828551 LatLon-20,95 0.51649 0.34980 1.477 0.139913 LatLon-25,100 -0.89388 0.36394 -2.456 0.014105 * LatLon-25,105 -0.56386 0.72689 -0.776 0.437982 LatLon-25,85 -1.14306 0.91467 -1.250 0.211511 LatLon-30,100 0.94518 0.23213 4.072 4.79e-05 *** LatLon-30,80 -1.08683 0.35291 -3.080 0.002093 ** LatLon-30,85 0.96676 0.29660 3.259 0.001129 ** LatLon-30,90 0.16612 0.42332 0.392 0.694772 LatLon-30,95 0.30768 1.12265 0.274 0.784056 LatLon-5,100 -1.01336 0.34197 -2.963 0.003069 ** LatLon-5,105 -2.00143 0.49752 -4.023 5.90e-05 *** LatLon-5,110 -2.96645 0.60348 -4.916 9.36e-07 *** LatLon-5,115 -2.15049 0.45124 -4.766 1.98e-06 *** LatLon-5,120 -21.66633 1889.54075 -0.011 0.990852 LatLon-5,125 -21.37131 408.74995 -0.052 0.958306 LatLon-5,85 -20.01953 1889.54075 -0.011 0.991547 LatLon-5,90 -1.41187 0.28615 -4.934 8.52e-07 *** LatLon-5,95 -0.63926 0.24281 -2.633 0.008515 ** LatLon0,100 -20.27524 1889.54077 -0.011 0.991439 LatLon0,85 -20.01953 1889.54075 -0.011 0.991547 LatLon0,90 -2.29557 0.45099 -5.090 3.81e-07 *** LatLon0,95 -2.89881 0.55278 -5.244 1.69e-07 *** --- Signif. codes: 0 ‘***’ 0.001 ‘**’ 0.01 ‘*’ 0.05 ‘.’ 0.1 ‘ ’ 1

IOTC-2019-WPEB15-18
Figure 1. Nominal CPUE series (N/1,000 hooks) for BSH from 2005 to 2018. The error
bars refer to the standard errors.

IOTC-2019-WPEB15-18
Figure 2. Proportion of zero BSH catches from 2005 to 2018. The error bars refer to
the standard errors.

IOTC-2019-WPEB15-18
Figure 3. Standardize catch per unit effort (CPUE) calculated using Tweedie model.
Values were scaled by dividing them by their means.
Figure 4. Residual analysis for the Indonesian longline fishery blue shark CPUE
standardization of the 2005-2018 datasets.