Embed Size (px)
Citation preview

The Home Scientist, LLC
Standard/Honors Home School Chemistry Laboratory Kit
CK01A
Instruction ManualRevision 1.0.7 – 10 January 2013
www.thehomescientist.com/kits/CK01/ck01-main.html
WARNING: THIS CHEMISTRY KIT CONTAINS HAZARDOUS MATERIALS. IT IS INTENDED FOR USE ONLY BY ADULTS, OR, WITH ADULT SUPERVISION, BY STUDENTS WHO ARE AT LEAST 16 YEARS OLD.
Copyright © 2013 by The Home Scientist, LLC. All rights reserved.

The Home Scientist, LLC CK01A Instruction Manual 2
Important Message to Users of This Manual
Your safety is your own responsibility, including proper use of equipment and safety gear, and determining whether you have adequate skill and experience.
Chemicals and other resources used for these procedures are dangerous unless used properly and with adequate precautions, including safety gear. Some illustrative photos do not depict safety precautions or equipment, in order to show the procedures more clearly. The procedures described in this manual are not intended for use by children under age 16, and must be completed under the supervision of a responsible and competent adult.
Use of the instructions and suggestions in this manual is at your own risk. The Home Scientist, LLC and the authors disclaim all responsibility for any resulting damage, injury, or expense. It is your responsibility to make sure that your activities comply with all applicable laws.
Copyright © 2013 by The Home Scientist, LLC Revision 1.0.7 – 10 January 2013

The Home Scientist, LLC CK01A Instruction Manual 3
Table of Contents(core experiments bolded)
1. Introduction
Getting Started
Kit Contents
Materials You Provide
Where to Work
Laboratory Safety
Final Words
2. Keeping a Lab Notebook
Topic I. Separating Mixtures
Session I-1: Recrystallization
Session I-2: Chromatography
Session I-3: Solvent Extraction
Session I-4: Salting Out
Topic II. Solubility and Solutions
Session II-1: Solubility as a Function of Temperature
Session II-2: Conductance of Ionic and Molecular Solutes
Session II-3: Colligative Properties of Solutions: Boiling Point
Elevation and Freezing Point Depression
Topic III. Chemical Reactions and Stoichiometry
Session III-1: Observe a Composition Reaction
Session III-2: Observe a Decomposition Reaction
Session III-3: Observe a Single Replacement Reaction
Session III-4: Observe Double Replacement Reactions
Session III-5: Stoichiometry of Double Displacement Reactions
Topic IV. Reduction-Oxidation (Redox) Reactions
Session IV-1: Observe Oxidation States of Manganese
Topic V. Acid-Base Chemistry
Session V-1: Determine the Effect of Concentration on pHand the pH Range of Indicators
Session V-2: Determine the Molarity of Vinegar by Titration
Topic VI. Chemical Kinetics
Session VI-1: Determining the Effect of Temperature, Concentration,and Surface Area on Reaction Rates
Copyright © 2013 by The Home Scientist, LLC Revision 1.0.7 – 10 January 2013

The Home Scientist, LLC CK01A Instruction Manual 4
Session VI-2: Determining the Effect of a Catalyst on Reaction Rate
Session VI-3: Determining a Reaction Order
Topic VII. Chemical Equilibrium
Session VII-1: Observe Le Châtelier's Principle in Action
Session VII-2: Determine a Solubility Product Constant
Session VII-3: Observe the Characteristics of a Buffer Solution
Topic VIII. Gas Chemistry
Session VIII-1: Observe the Pressure-VolumeRelationship of Gases (Boyle's Law)
Session VIII-2: Observe the Volume-TemperatureRelationship of Gases (Charles' Law)
Session VIII-3: Determine Gas Mass Ratios by Effusion(Graham's Law)
Topic IX. Thermochemistry
Session IX-1: Determine Heat of Solution
Session IX-2: Determine Heat of Fusion of Ice
Session IX-3: Determine the Specific Heat of a Metal
Session IX-4: Determine the Enthalpy Change of a Reaction
Topic X. Electrochemistry
Session X-1: Observe Electrolysis
Session X-2: Observe the Electrochemical Oxidation of Iron
Session X-3: Measure Electrode Potentials
Session X-4: Build a Voltaic Cell
Topic XI. Photochemistry
Session XI-1: Photochemical Reaction of Iodine and Oxalate
Topic XII. Colloids and Suspensions
Session XII-1: Observe Some Properties of Colloidsand Suspensions
Topic XIII. Analytical Chemistry
Session XIII-1. Determine Boron Concentration with Curcumin
Session XIII-2. Determine Salicylate Concentration in Urine
Session XIII-3. Determine Vitamin C Concentration in Urine
Session XIII-4: Detect Lead in Household Materials
Topic XIV. Synthetic Chemistry
Session XIV-1. Synthesize Esters
Copyright © 2013 by The Home Scientist, LLC Revision 1.0.7 – 10 January 2013

The Home Scientist, LLC CK01A Instruction Manual 1
1Introduction
We know you're eager to get started with your new chemistry kit, but before you jump in please take the time to read this chapter. It includes some important information that you need to know before you get started.
Getting StartedBefore you do anything else, verify that you have the most recent version of this manual. The most recent version can be downloaded from:
http://www.thehomescientist.com/manuals/ck01-manual.pdf
More recent versions of the manual may include corrections and additional information, including important updated safety information.
Kit ContentsThe next step is to unpack the kit and check each item against the packing list. If any item is missing or damaged, please email the details to [email protected]. We pack and check these kits with great care—even weighing the final kits to ensure we haven't left anything out—but mistakes can happen.
Chemicals
This kit includes more than 40 chemicals, many of which present only minimal hazards, but some of which are toxic, corrosive, and/or flammable. Using and disposing of these chemicals safely is your responsibility.
Chemicals are supplied in various containers, including 15 mL and 30 mL bottles, 30 mL widemouth bottles, and packets. To comply with hazardous materials shipping regulations, chemicals that are subject to those regulations are contained in a sealed plastic bag that contains absorbent material. Some of the chemicals have their caps further secured with shrink bands or tape.
To unpack the chemicals, take the following steps:
1. Carefully unseal the outer shipping box. Be careful not to penetrate the interior of the box with a knife or other sharp object.
Copyright © 2013 by The Home Scientist, LLC Revision 1.0.7 – 10 January 2013

The Home Scientist, LLC CK01A Instruction Manual 2
2. Remove the items from the top of the outer shipping box.
3. Locate the chemical splash goggles and put them on. Also put on chemical resistant gloves. Household rubber gloves are fine, as are latex or nitrile disposable gloves.
4. Remove the plastic bag that contains the chemicals from the outer shipping box and place it on a chemical-resistant flat surface.
5. Carefully open the plastic bag, remove each of the chemical containers, remove any absorbent material that is adhering to the bottles, and set them upright. Discard the bag and absorbent material with the household trash.
You can also break the cap seals on the individual chemical containers, but we recommend you leave those in place until you need the chemical.
Warning: Store chemicals away from living and food preparation areas, and make sure they're secured from access by children, pets, or others who may not understand the hazards they present.
Warning: Before using any chemical in this kit, read the MSDS (Material Safety Data Sheet) for that chemical. The current MSDS for each chemical in this kit is available at http://www.thehomescientist.com/msds.html.
WARNING: VEGETABLE OIL MAY CONTAIN PEANUT OIL OR MAY HAVE BEEN PROCESSED IN A PLANT THAT PROCESSES PEANUTS AND/OR OTHER NUTS. IF YOU HAVE A PEANUT ALLERGY OR OTHER FOOD ALLERGY, DISPOSE OF THIS TUBE SAFELY AND SUBSTITUTE ANOTHER TYPE OF VEGETABLE OIL THAT YOU KNOW TO BE SAFE.
The MSDS provides full safety information for each chemical, but for convenience and ready reference each bottle label also contains a summary of the main hazards, if any, associated with that chemical. This information is intended only for convenient reference, and does not take the place of the more complete information in the MSDS.
WARNING: All of the chemicals contained in this kit are intended for laboratory use only. They are neither intended nor approved for food, drug, or cosmetic use. Do not ingest them, inhale them, or allow them to contact your eyes or skin.
Note: You can order replacements for each of the chemicals included in the CK01A kit. For more information, email [email protected].
The kit includes the following chemicals:
□ Acetic acid, 6.0 M□ Ammonia, 6.0 M□ Ascorbic acid (500 mg tablets)□ Barium nitrate, 0.1 M□ Bromothymol blue, 0.1%□ n-Butanol□ Calcium nitrate, 0.1 M□ Charcoal, activated□ Copper
□ Phosphoric acid, 1.0 M□ Potassium bromide, 0.1 M□ Potassium dichromate, 0.1 M□ Potassium ferricyanide, 0.1 M□ Potassium iodide, 0.1 M□ Potassium permanganate, 0.1 M□ Salicylic acid□ Sodium bicarbonate (650 mg tablets)□ Sodium bisulfite, 1.0 M
Copyright © 2013 by The Home Scientist, LLC Revision 1.0.7 – 10 January 2013
The Home Scientist, LLC CK01A Instruction Manual 3
□ Copper(II) sulfate, 1.0 M□ Hydrochloric acid, 6.0 M□ Iodine/iodide solution, 0.1 M□ Iron□ Iron(II) sulfate, 0.1 M□ Iron(III) chloride, 0.1 M□ Lead(II) acetate, 0.1 M□ Magnesium□ Magnesium sulfate□ Methyl orange, 0.1%□ Methyl red, 0.02%□ Oxalic acid, 0.5 M□ Phenolphthalein, 0.5%
□ Sodium borate, 0.1% w/r to boron□ Sodium carbonate, 1.0 M□ Sodium ferrocyanide, 0.1 M□ Sodium hydroxide, 6.0 M□ Sodium salicylate, 200 ppm w/r to salicylate□ Sodium sulfide, 0.1 M□ Sodium thiosulfate, 1.0 M (stabilized)□ Starch indicator solution□ Sulfuric acid, 1.0 M□ Thymol blue, 0.04%□ Turmeric reagent□ Vegetable oil
Warning: Some of the chemicals included in this kit produce strong corrosive and/or toxic fumes, particularly acetic acid, ammonia, hydrochloric acid, and (to a lesser extent) sodium sulfide. Use extreme care when handling these chemicals, and use them only outdoors or in a well-ventilated area.
Equipment
The kit contains all of the specialty equipment you'll need to complete the experiments. This section includes descriptions, notes, cautions, and images for several of those items.
Note: Depending on availability, kit components may originate from different vendors, so the actual components may vary from the images.
Alligator clip leads
The kit includes two alligator clip leads, red and black. These are used in various electrochemistry experiments, and may also be used to secure small items. They may also be used, for example, to clip a digital multimeter (DMM) probe to an electrode.
Battery adapter, 9V
The battery adapter has connectors to fit a standard 9V battery, terminating in wire leads, red (positive) and black (negative). Never allow the bare wire tips of this adapter to contact each other if the adapter is connected to a battery. A fire or battery explosion may result.
Beaker, glass
The kit includes one 250 mL borosilicate glass beaker. Borosilicate glass is more resistant to thermal shock than ordinary soda-lime glass, but you should never expose it to direct flame or a hot burner surface. Use the wire gauze included in the kit to protect the beaker.
Beakers, plastic
The kit includes two 50 mL and two 100 mL plastic graduated beakers. These beakers are made of polypropylene (PP), a plastic that is resistant to most chemicals and moderately resistant to heat, but should never be exposed to direct flame or a hot burner surface. These and other polypropylene items in the kit are resistant to most solvents, but can be damaged
Copyright © 2013 by The Home Scientist, LLC Revision 1.0.7 – 10 January 2013

The Home Scientist, LLC CK01A Instruction Manual 4
by strong organic solvents such as acetone, gasoline, or turpentine and by strong oxidizers such as chlorine laundry bleach.
After using them, rinse the plastic beakers in water and then wash them thoroughly with dish detergent. The beakers are generally resistant to staining, but iodine solutions will stain them. You can remove iodine stains using a small amount of sodium thiosulfate solution or a vitamin C tablet dissolved in a few mL of water.
Note: You can label glass or plastic beakers, test tubes, centrifuge tubes, and other items using the Sharpie marker pen included in the kit. Erase these markings from glass surfaces simply by rubbing with a cloth or paper towel. (Marks on white label areas are more difficult to remove; those areas are intended for labeling with a pencil.) Markings on plastic items can be removed by rubbing them with a paper towel soaked in isopropyl alcohol.
Centrifuge tubes
The kit includes six 15 mL polypropylene centrifuge tubes with caps, and six 50 mL self-standing centrifuge tubes for use as chromatography developing jars and for general sample storage.
Cylinders, graduated
The kit includes 10 mL and 100 mL polypropylene graduated cylinders. Because PP does not attract water, these cylinders exhibit no meniscus. Read the volume at the top edge of the liquid rather than, as with a glass cylinder, at the bottom of the meniscus.
Goggle, chemical splash w/ cap vents
The CK01A kit includes one and the CK01AG kit two chemical-splash goggles with cap (indirect) vents, which inhibit liquids that contact the outside of the goggle from running into the interior. NEVER USE IMPACT GOGGLES for lab work. The direct vent holes in impact goggles allow chemicals to run freely into the interior of the goggle. Order spare chemical splash goggles for anyone who will be in the vicinity when you are working with the chemical in this kit.
The goggles supplied with the kit fit most adults and most students aged 15 or higher. Before you use the goggles with any hazardous chemical, check them for fit and for a tight seal. (You can do that by using water to determine if liquid outside the goggles can penetrate to the inside.)
Pipettes, polyethylene
The kit includes a supply of plastic pipettes. These pipettes are calibrated to 1.0 mL by 0.25 mL, can be interpolated to about 0.05 mL, and deliver 0.0290 mL/drop (±0.003 mL/drop), or about 34.5 drops/mL.
You can use pipettes to transfer approximate volumes of liquids quickly. For example, if you need to transfer about 0.75 mL of a solution to each of several wells in a reaction plate, fill a pipette to the 0.75 mL graduation line (the third line up from the tip) and expel that fluid into the well. You can also use pipettes to deliver very accurate volumes of water or dilute aqueous solutions by counting drops.
Pipettes are resistant to the chemicals in the kit, but they can be damaged by organic
Copyright © 2013 by The Home Scientist, LLC Revision 1.0.7 – 10 January 2013

The Home Scientist, LLC CK01A Instruction Manual 5
solvents like gasoline or paint thinner. Otherwise, you can reuse them indefinitely.
Reaction plates
The kit includes two polystyrene reaction plates. The wells in the 96-well model hold about 0.75 mL, and those of the 24-well model about 3 mL. The 24-well model includes a lid.
The 96-well model is used primarily for observing the reactions of very small amounts of chemical solutions, from a drop or two up to 0.5 mL or so. It allows you to run many tests using only tiny amounts of chemicals. The 24-well model is used for similar purposes, but provides larger wells that make it easier to see what's happening.
Always clean a reaction plate immediately after you use it, particularly if a precipitate occurred in any of the wells. Use a cotton swab or paper towel to remove all solid material from the wells before it dries.
Syringe, 10 mL oral, with cap
The kit includes one 10 mL oral syringe with cap, which is used primarily for gas chemistry experiments. You can also use it for quickly measuring and transferring fluid volumes up to 10.0 mL. The syringe is graduated with 0.2 mL markings, and can be interpolated to 0.1 mL or less.
Test tube rack
The kit contains one 12-position test tube rack, which fits the included test tubes and 15 mL centrifuge tubes. Use the rack to hold test tubes and centrifuge tubes during experiments. (Requires snap-together assembly)
Test tubes
The kit includes six 16X100mm borosilicate test tubes, which are packaged for shipping in the 50 mL centrifuge tubes. When you complete a lab session, allow the tubes to cool, if necessary, and then immediately rinse them with tap water. Use dish detergent and the test tube brush to clean the tubes thoroughly, rinse them, and then place them inverted in the rack to dry.
Thermometer
The kit includes a partial-immersion thermometer. The “partial-immersion” part means that this thermometer is designed to read accurately when it is immersed to a depth of 76 mm (3") in the liquid being measured. (Some lab thermometers are designed to read accurately only when they are totally immersed in the liquid.) The thermometer includes a triangular grommet to prevent rolling and a triangular plastic protective sleeve.
Other Equipment
The kit includes several other pieces of equipment, including: one 6"/150mm ruler, one 4"/10cm stainless steel flat/spoon microspatula, one 6"/15cm stirring rod, a supply of stoppers to fit the test tubes, a test tube brush, a test tube clamp, and a wire gauze.
Note: If you damage or lose any of the equipment, you can order replacements by sending us email ([email protected]) to tell us what you need. We will reply to let you know how much the items will cost, including shipping.
Copyright © 2013 by The Home Scientist, LLC Revision 1.0.7 – 10 January 2013

The Home Scientist, LLC CK01A Instruction Manual 6
Consumables
The kit contains the following consumable items, most of which can be replaced locally.
Battery, 9V – the kit contains one standard 9V heavy duty battery, which should suffice for completing the experiments that require it. If necessary, you can replace it with any standard or alkaline 9V battery from the drugstore or supermarket.
Warning: The battery in the kit is supplied with its terminals covered by tape to prevent a metal item from shorting the terminals together, which can cause a fire. If you store the battery where it may come into contact with metal items, retape the terminals.
Chromatography paper strips – the kit contains a supply of chromatography paper, which you can cut into strips for chromatography lab sessions. Wear gloves when handling chromatography paper to prevent your skin oils from contaminating the paper. If you run out, you can substitute strips cut from filter paper or a white coffee filter.
Cotton balls and swabs – the kit contains a small supply of cotton balls and cotton swabs, which are used for various purposes, including cleaning the reaction plates. Purchase additional cotton balls and swabs from the drugstore.
Sharpie marking pen – the kit includes one purple Sharpie marking pen. (We provide a purple marker because the mix of dyes are best suited to chromatography.) If necessary, you can replace it with any other marking pen suitable for marking glass and polypropylene labware.
Test paper strips, cobalt chloride - the kit includes a small supply of these strips, which are used to detect the presence of moisture or water. (They are blue when dry and pink when damp.) You can reuse these strips indefinitely simply by drying them after use.
Test paper strips, wide-range pH – the kit includes a vial of 100 wide-range pH test strips, which are used in numerous experiments. You can economize by using only a quarter of a strip for each test.
Wood splints – the kit includes a small supply of wood splints, which are used to test for the presence of oxygen gas. You can substitute wooden toothpicks or stirrers.
Materials You ProvideIn addition to the materials in the kit, you'll need various household items to complete all of the experiments. These items are listed in Table 1-1 alphabetically by item name and in Table 1-2 by lab session number.
Table 1-1. Materials You Provide (alphabetically by item name)
Description Session #
Aluminum foil X-1; X-3; XI-1;
Aspirin tablets XIII-2;
Balance (optional) II-1; II-3; IX-1;
Blood or “meat juice” (see lab session) VI-2;
Bottles, soda, pint/500 mL (empty and clean) II-1; II-2; VI-1;
Copyright © 2013 by The Home Scientist, LLC Revision 1.0.7 – 10 January 2013

The Home Scientist, LLC CK01A Instruction Manual 7
Bottles, soda, 2 liter (empty and clean) VIII-1; IX-1;
Cloth scrap (colored) X-1;
Coins, US cent IX-3;
Colander, kitchen strainer, or similar IX-3;
Container, storage (wide mouth, with lid) II-1;
Cups, foam, with lids (or similar containers) II-3; IX-1; IX-2; IX-3; IX-4; XI-1; XIII-3;
Digital multimeter (DMM) II-2; X-1; X-3; X-4;
Dishwashing detergent or liquid soap XII-1;
Dish, baking II-1;
Ethyl alcohol, 95% XIV-1;
Food coloring (optional) I-4;
Gloves (latex or nitrile) all sessions
Graphing paper/calculator/software many sessions
Hair dryer (optional) I-2;
Hotplate (or stove burner) I-1; II-1; II-2; II-3; III-2; VII-1; X-2; XIV-1;
Hydrogen peroxide, 3% (drugstore) VI-2;
Ice, crushed or chipped II-3; VIII-2; IX-2;
Isopropyl alcohol (70%, 91%, or 99%) I-2; I-4;
Isopropyl alcohol, 99% XIV-1;
Knife XIII-4;
Lamp, desk (or other strong light source) many sessions
Lamp, fluorescent XI-1
Laser pointer (optional) XII-1;
Lemon X-3;
Lighter, butane (or other flame source) I-4; III-1; III-2; X-1; XII-1;
Milk (whole or 2% homogenized) XII-1;
Newspaper (or other printed matter) VI-3;
Oven, microwave VI-1;
Oven, standard II-1;
Oven mitt IX-3;
Paper, black (construction paper or similar) III-4; VII-1; VII-2; VIII-3;
Paper, white (sheet of copy paper or similar) I-1; III-1; III-4; IV-1; V-2; XI-1;
Copyright © 2013 by The Home Scientist, LLC Revision 1.0.7 – 10 January 2013

The Home Scientist, LLC CK01A Instruction Manual 8
Paper towels many sessions
Pencil I-2;
Pens, felt-tip, assorted (optional) I-2;
Powder (talcum, baby, body, or foot) XII-1;
Refrigerator/freezer I-1; II-1; II-3; VI-1; VII-1; VIII-2;
Scissors I-2; V-1; X-3; X-4;
Smoke source (see lab session) XII-1;
Sodium bicarbonate (baking soda) I-1; II-1; III-2;
Sodium carbonate (from session II-1) II-3; VII-1;
Sodium chloride (table salt) I-1; I-4; II-3; IX-1; X-1; X-2; XII-1;
Soft drinks VII-1; XII-1;
Solvent, non-polar (optional; see session) I-2;
Specimens, paint and household items XIII-4;
Specimens, soil and water (see lab session) XIII-1;
Specimens, urine (see lab session) XIII-2; XIII-3;
Spoons, measuring I-1; II-1; II-3;
Sucrose (table sugar) II-2; II-3;
Tape, transparent I-2;
Toothpicks, plastic IV-1; VI-3;
Vinegar, distilled white V-2; VI-1; XIII-4;
Watch (or clock with second hand) VI-1; VI-2; VI-3; X-1; XI-1;
Water, distilled many sessions
Table 1-2. Materials You Provide (by lab session number)
Session # Description
many sessions Desk lamp (or other strong light source), distilled water, gloves (latex or nitrile), graphing paper/calculator/software, paper towels
I-1 Hotplate (or stove burner); paper, white (copy paper or similar); refrigerator/freezer; sodium bicarbonate (baking soda); sodium chloride (table salt); spoons, measuring;
I-2 Hair dryer (optional); isopropyl alcohol (isopropanol), 70%, 91%, or 99%; pencil; pens, felt-tip assorted (optional); scissors; solvent, non-polar (optional; see session); tape, transparent;
I-3
Copyright © 2013 by The Home Scientist, LLC Revision 1.0.7 – 10 January 2013

The Home Scientist, LLC CK01A Instruction Manual 9
I-4 Food coloring (optional); isopropyl alcohol (isopropanol), 70%, 91%, or 99%; lighter, butane (or other flame source); sodium chloride (table salt);
II-1 Balance (optional); bottles, soda, pint/500 mL (empty and clean); container, storage, (wide mouth, with lid); hotplate (or stove burner); oven, standard; refrigerator/freezer; sodium bicarbonate (baking soda); spoons, measuring;
II-2 Bottles, soda, pint/500 mL (empty and clean); digital multimeter (DMM); dish, baking; hotplate (or stove burner); sucrose (table sugar);
II-3 Balance (optional); cups, foam, with lids (or similar containers); hotplate (or stove burner); ice (crushed or chipped); refrigerator/freezer; sodium carbonate (from session II-1); sodium chloride (table salt); spoons, measuring; sucrose (table sugar);
III-1 Lighter, butane (or other flame source); paper, white (copy paper or similar);
III-2 Hotplate (or stove burner); lighter, butane (or other flame source); sodium bicarbonate (baking soda);
III-3
III-4 Paper, black (construction paper or similar); paper, white (copy paper or similar);
III-5
IV-1 Paper, white (copy paper or similar); toothpicks, plastic;
V-1 Scissors;
V-2 Paper, white (copy paper or similar); vinegar, distilled white;
VI-1 Bottles, soda, pint/500 mL (empty and clean); oven, microwave; refrigerator/freezer; vinegar, distilled white; watch (or clock with second hand);
VI-2 Blood or “meat juice”; hydrogen peroxide, 3% (drugstore); watch (or clock with second hand);
VI-3 Newspaper (or other printed matter); toothpicks, plastic; watch (or clock with second hand);
VII-1 Hotplate (or stove burner); paper, black (construction paper or similar); refrigerator/freezer; sodium carbonate (from session II-1); soft drinks;
VII-2 Paper, black (construction paper or similar);
VII-3
VIII-1 Bottles, soda, 2 liter (empty and clean);
VIII-2 Ice (crushed or chipped); refrigerator/freezer;
VIII-3 Paper, black (construction paper or similar);
IX-1 Balance (optional); bottles, soda, 2 liter (empty and clean); cups, foam, with lids (or similar containers); sodium chloride (table salt);
Copyright © 2013 by The Home Scientist, LLC Revision 1.0.7 – 10 January 2013

The Home Scientist, LLC CK01A Instruction Manual 10
IX-2 Cups, foam, with lids (or similar containers); ice (crushed or chipped);
IX-3 Coins (US cent); colander, kitchen strainer, or similar; cups, foam, with lids (or similar containers); oven mitt;
IX-4 Cups, foam, with lids (or similar containers);
X-1 Aluminum foil; cloth scrap (colored); digital multimeter (DMM); lighter, butane (or other flame source); sodium chloride (table salt); watch (or clock with second hand);
X-2 Digital multimeter (DMM); hotplate (or stove burner); sodium chloride (table salt);
X-3 Aluminum foil; digital multimeter (DMM); lemon; scissors;
X-4 Digital multimeter (DMM); scissors;
XI-1 Aluminum foil; lamp, fluorescent; paper, white (copy paper or similar); watch (or clock with second hand);
XII-1 Dishwashing detergent or liquid soap; laser pointer (optional); lighter, butane (or other flame source); milk (whole or 2% homogenized); powder (talcum, baby, body, or foot); smoke source; sodium chloride (table salt); soft drinks;
XIII-1 Specimens, soil and water (see lab session);
XIII-2 Aspirin tablets; specimens, urine (see lab session);
XIII-3 Specimens, urine (see lab session);
XIII-4 Knife; specimens, paint and household items; vinegar, distilled white;
XIV-1 Ethyl alcohol (ethanol), 95%; hotplate (or stove burner);isopropyl alcohol (isopropanol), 99%;
Where to WorkChoose a well-lit, well-ventilated work area, ideally in a garage, basement, shed, or workshop. Some of the chemicals in this kit can stain or otherwise damage work surfaces. If you care about the surface, protect it using several layers of newspaper on top of a plastic tablecloth, tarp, or similar resistant material.
The kitchen table is a popular choice, but working in an area where food is prepared and consumed is less than ideal. If the kitchen table is your only available choice, be extremely careful to avoid contaminating food, beverages, kitchen containers, work surfaces, and so on with any of the chemicals in this kit. Do not store chemicals or lab equipment in the kitchen.
Lab Safety
Many of the experiments use chemicals that are dangerous if handled improperly. Some experiments use open flame or other heat sources, and many use glassware.
The primary goal of lab safety rules is to prevent injuries. Knowing and following the rules
Copyright © 2013 by The Home Scientist, LLC Revision 1.0.7 – 10 January 2013

The Home Scientist, LLC CK01A Instruction Manual 11
minimizes the likelihood of accidents, and helps ensure that any accidents that do occur will be minor ones.
Here are the lab safety rules we recommend:
Prepare Properly
Exclude young children from the work area
These experiments are intended only for students aged 14 or older. Younger children may be fascinated by the materials and equipment in this kit, and for their own safety must be prevented from exercising their curiosity.
All laboratory activities must be supervised by a responsible adult
Direct adult supervision is mandatory for all of the activities in this book. This adult must review each activity before it is started, understand the potential dangers of that activity and the steps required to minimize or eliminate those dangers, and be present during the activity from start to finish. Although the adult is ultimately responsible for safety, students must also understand the potential dangers and the procedures that should be used to minimize risk.
Familiarize yourself with safety procedures and equipment
Think about how to respond to accidents before they happen. Have a fire extinguisher and a first-aid kit readily available and a telephone nearby in case you need to summon assistance. Know and practice first-aid procedures, particularly those required to deal with burns and cuts. If you have a cell phone, keep it handy while you're doing lab work.
One of the most important safety items is the cold water faucet. If you burn yourself, immediately flood the burned area with cold tap water for several minutes to minimize the damage done by the burn. If you spill a chemical on yourself, immediately rinse the chemical off with cold tap water, and keep rinsing for several minutes. If you get any chemical in your eyes, immediately flood your eyes with cold water until help arrives.
WARNING: Everyone rightly treats strong acids with great respect, but many students handle strong bases casually. That's a very dangerous practice. Strong bases, such as the sodium hydroxide and ammonia included in this kit, can blind you in literally seconds. Treat every chemical as potentially hazardous, and always wear splash goggles.
Keep a container of baking soda on hand to deal with acid spills, and a bottle of vinegar to deal with base spills. If you spill a strong acid—such as the acetic, hydrochloric, oxalic, or sulfuric acids contained in this kit—immediately cover the spill with baking soda, which will foam as it neutralizes the acid. If you spill a strong base—such as the ammonia or sodium hydroxide contained in this kit—immediately pour at least ten times the spill volume of vinegar onto the spill. The reaction products of these neutralization reactions are harmless, and can be blotted up with paper towels and disposed of with household trash.
Always read the MSDS for every chemical you will use in a laboratory session
The MSDS (Material Safety Data Sheet) is a concise document that lists the specific characteristics and hazards of a chemical. The current MSDS for each chemical in this kit
Copyright © 2013 by The Home Scientist, LLC Revision 1.0.7 – 10 January 2013

The Home Scientist, LLC CK01A Instruction Manual 12
is available at http://www.thehomescientist.com/msds.html.
Organize your work area
Keep your work area clean and uncluttered—before, during, and after laboratory sessions. Every laboratory session should begin and end with your glassware, chemicals, and laboratory equipment clean and stored properly.
Dress Properly
Wear approved eye protection at all times
Everyone present in the lab must at all times wear splash goggles that comply with the ANSI Z87.1 standard. Standard eyeglasses or shop goggles do not provide adequate protection, because they are not designed to prevent splashed liquids from getting into your eyes. Eyeglasses may be worn under the goggles, but contact lenses are not safe for use during experiments. (Corrosive chemicals can be trapped between a contact lens and your eye, making it difficult to flush the corrosive chemical away.) Additional splash goggles can be ordered from any laboratory supplies vendor.
Wear protective gloves and clothing
Never allow laboratory chemicals to contact your bare skin. When you handle chemicals, particularly corrosive or toxic chemicals or those that can be absorbed through the skin, wear gloves of a chemical-resistant material. (The disposable latex or nitrile exam gloves sold by drugstores, Costco, and other retailers are excellent.) Wear long pants, a long-sleeve shirt, and leather shoes or boots that fully cover your feet (NO sandals). Avoid loose sleeves. To protect yourself and your clothing, wear a lab coat or a lab apron made of vinyl or another resistant material.
Avoid Laboratory Hazards
Avoid chemical hazards
Never taste any laboratory chemical or sniff it directly. (Use your hand to waft the odor toward your nose.) When you heat a test tube, make sure the mouth points in a safe direction. Never carry open containers of chemicals around the lab. Always dilute strong acids and bases by adding the concentrated solution or solid chemical to water slowly and with stirring. Doing the converse can cause the liquid to boil violently and be ejected from the container. Use the smallest quantities of chemicals that will accomplish your goal. If a reaction is unexpectedly vigorous, it's better if it happens with a few drops of chemicals in a reaction plate than 10 mL in a test tube.
Avoid fire hazards
Never handle flammable liquids or gases in an area where an open flame or sparks might ignite them. Extinguish burners as soon as you finish using them. Do not refuel a burner until it has cooled completely. If you have long hair, tie it back or tuck it up under a cap, particularly if you are working near an open flame.
Avoid glassware hazards
Assume all glassware is hot until you are certain otherwise. Hot glassware looks exactly like cold glassware. Examine all glassware before you use it, and particularly before you heat it. Discard any glassware that is cracked, chipped, or otherwise damaged.
Copyright © 2013 by The Home Scientist, LLC Revision 1.0.7 – 10 January 2013

The Home Scientist, LLC CK01A Instruction Manual 13
Don't Do Stupid Things
Never eat, drink, or smoke in the laboratory
All laboratory chemicals should be considered toxic by ingestion, and the best way to avoid ingesting chemicals is to keep your mouth closed. Eating or drinking (even water) in the lab is very risky behavior. A moment's inattention can have tragic results. Smoking violates two major lab safety rules: putting anything in your mouth is a major no-no, as is carrying an open flame around the lab.
Never work alone in the laboratory
No one, adult or student, should ever work alone in the laboratory. Even if the experimenter is adult, there must at least be another adult within earshot who is able to respond quickly in an emergency.
No horsing around
A lab isn't the place for practical jokes or acting out, nor for that matter for catching up on gossip or talking about last night's football game. When you're in the lab, you should have your mind on lab work, period.
Never combine chemicals arbitrarily
Combining chemicals arbitrarily is among the most frequent causes of serious accidents in home chemistry labs. Some people seem compelled to mix chemicals more or less randomly, just to see what happens. Sometimes they get more than they bargained for.
Laboratory safety is mainly a matter of common sense. Think about what you're about to do before you do it. Work carefully. Deal with minor problems before they become major problems. Keep safety constantly in mind, and chances are any problems you have will be very minor ones.
Lab Scope and SequenceThe lab sessions in this manual are designed to provide the full laboratory component of a first-year standard/honors high-school chemistry course. Completing all of these lab sessions gives a student more exposure to hands-on chemistry lab work than all but the most rigorous and comprehensive public school first-year high-school chemistry courses.
Some of the lab sessions are relatively short, and can be completed in half an hour or less. Others may require two hours or more to complete. If possible, we recommend that you arrange your chemistry teaching schedule around the lab sessions rather than attempt to shoehorn lab sessions into a predefined weekly lab period. For example, rather than schedule a 90-minute chemistry lab session each week, devote as much time as needed for chemistry labs each week, and tie those labs to the lecture topic(s) for that week. If for a particular week that means only one 30-minute lab session or even none at all, that's fine. If another week that means having two two-hour lab sessions in one week, that's also fine.
Completing all of the lab sessions requires a significant time commitment. Depending on the amount of time you can allocate to lab work, you may find it necessary to skip some parts of some lab sessions, or even to skip some lab sessions completely. It is not necessary to complete all lab sessions to gain useful exposure to chemistry lab work, but devoting more time and effort to completing these labs can be expected to produce a better outcome.
Copyright © 2013 by The Home Scientist, LLC Revision 1.0.7 – 10 January 2013

The Home Scientist, LLC CK01A Instruction Manual 14
For students who will go on to major in college in a science, we recommend completing all lab sessions if at all possible. In fact, in our experience, many such students enjoy lab work so much that you may wish to extend lab sessions and supplement the work in this manual with additional experiments from other sources.
For students who will pursue a non-science college major, you may decide that a less intensive high-school chemistry lab experience is appropriate. In that case, we recommend completing at least those lab sessions that are in boldface in the table of contents, along with any others that particularly interest the student.
The lab sessions are divided into 14 topic areas. Although these topics can be completed in any order necessary to match the chemistry textbook you use, we recommend that the sessions within each topic be completed in the order they are presented. If your time for labwork is limited, try to complete at least the first one or two sessions in each topic area.
Note: If you have not purchased a chemistry textbook or curriculum, we recommend CK-12 Chemistry - Second Edition from the CK-12 Foundation (http://www.ck12.org). CK-12 books cost nothing. They are freely downloadable and sharable, and are available in various formats, including PDF and e-books formatted for the Kindle, iPad, and other e-book readers.
Final WordsWe have devoted a great deal of time and effort to designing and producing this kit, with the goal of providing an affordable, comprehensive, rigorous chemistry lab experience. We think we've done a good job, but there's always room for improvement.
You can help us help future users of this kit by sending us your comments and criticisms. Did the kit meet your expectations and suit your needs? If not, why not? What could we do to improve the kit? Please send us your thoughts. Although we obviously can't promise to incorporate each and every suggestion, we will certainly take your comments into consideration for updates to this manual and for future versions of the kit. Please send your comments to:
You can also post your comments and suggestions on The Home Scientist forums, and read what others have to say:
http://forums.thehomescientist.com
Thank you for purchasing the kit. We hope you enjoy using it as much as we did creating it.
Copyright © 2013 by The Home Scientist, LLC Revision 1.0.7 – 10 January 2013
The Home Scientist, LLC CK01A Instruction Manual 15
2Keeping a Lab Notebook
A laboratory notebook is a contemporaneous, permanent primary record of the owner's laboratory work. In real-world corporate and industrial chemistry labs, the lab notebook is often a critically important document, for both scientific and legal reasons. The outcome of zillion-dollar patent lawsuits often hinges on the quality, completeness, and credibility of a lab notebook. Many corporations have detailed procedures that must be followed in maintaining and archiving lab notebooks, and some go so far as to have the individual pages of researchers' lab notebooks notarized and imaged on a daily or weekly basis.
If you're just starting to learn about chemistry lab work, keeping a detailed lab notebook may seem to be overkill, but it's not. The habit of recording observations in an organized manner is crucial for any would-be scientist. If you're using this book to prepare for college chemistry, and particularly if you plan to take the Advanced Placement (AP) Chemistry exam, you should keep a lab notebook. Even if you score a 5 on the AP Chemistry exam, many college and university chemistry departments will not offer you advanced placement unless you can show them a lab notebook that meets their standards.
Laboratory Notebook Guidelines
The notebook must be permanently bound. Looseleaf pages are unacceptable. Never tear a page out of the notebook.
Use permanent ink. Pencil or erasable ink is unacceptable. Erasures are anathema.
Before you use it, print your name and other contact information on the front of the notebook, as well as the volume number (if applicable) and the date you started using the notebook.
Number every page, odd and even, at the top outer corner, before you begin using the notebook.
Reserve the first few pages for a table of contents.
Begin a new page for each experiment.
Use only the right-hand pages for recording information. The left-hand pages can be used
Copyright © 2013 by The Home Scientist, LLC Revision 1.0.7 – 10 January 2013

The Home Scientist, LLC CK01A Instruction Manual 16
for scratch paper. (If you are left-handed, you may use the left-hand pages for recording information, but maintain consistency throughout.)
Record all observations as you make them. Do not trust to memory, even for a minute.
Print all information legibly, preferably in block letters. Do not write longhand.
If you make a mistake, draw one line through the erroneous information, leaving it readable. If it is not otherwise obvious, include a short note explaining the reason for the strikethrough. Date and initial the strikethrough.
Do not leave gaps or whitespace in the notebook. Cross out whitespace if leaving an open place in the notebook is unavoidable. That way, no one can go back in an fill in something that didn’t happen. When you complete an experiment, cross out the white space that remains at the bottom of the final page.
Incorporate computer-generated graphs, charts, printouts, photographs, and similar items by taping or pasting them into the notebook. Date and initial all add-ins.
Include only procedures that you personally perform and data that you personally observe. If you are working with a lab partner and taking shared responsibility for performing procedures and observing data, note that fact as well as describing who did what and when.
Remember that the ultimate goal of a laboratory notebook is to provide a permanent record of all the information necessary for someone else to reproduce your experiment and replicate your results. Leave nothing out. Even the smallest, apparently trivial, detail may make the difference.
Laboratory Notebook Format
Use the following general format for recording an experiment in your lab notebook:
IntroductionThe following information should be entered before you begin the laboratory session:
DateEnter the date at the top of the page. Use an unambiguous date format, for example 2 September 2011 or September 2, 2011 rather than 2/9/11 or 9/2/11. If the experiment runs more than one day, enter the starting date here and the new date in the procedure/data section at the time you actually begin work on that date.
Experiment titleIf the experiment is from this or another laboratory manual, use the name from that manual and credit the manual appropriately. For example, “Determine Boron Concentration with Curcumin (The Home Scientist CK01A Chemistry Kit, Session XIII-1)”. If the experiment is your own, give it a descriptive title.
PurposeOne or two sentences that describe the goal of the experiment. For example, “To determine the concentration of boron in soil and water specimens with visual colorimetry using turmeric reagent.”
Copyright © 2013 by The Home Scientist, LLC Revision 1.0.7 – 10 January 2013

The Home Scientist, LLC CK01A Instruction Manual 17
Introduction (optional)Any preliminary notes, comments, or other information may be entered in a paragraph or two here. For example, if you decided to do this experiment to learn more about something you discovered in another experiment, note that fact here.
Balanced equationsWrite down balanced equations for all of the reactions involved in the experiment, including, if applicable, changes in oxidation state.
Chemical informationImportant information about all chemicals used in the experiment, including, if appropriate, physical properties (melting/boiling points, density, etc.), a list of relevant hazards and safety measures (from the MSDS), and any special disposal methods required. Include approximate quantities, both in grams and in moles, to give an idea of the scale of the experiment.
Planned procedureA paragraph or two to describe the procedures you expect to follow.
Main bodyThe following information should be entered as you actually do the experiment:
ProcedureRecord the procedure you use, step by step, as you actually perform the procedures. Note any departures from your planned procedure and the reasons for them.
DataRecord all data and observations as you gather them, in-line with your running procedural narrative. Pay attention to significant figures, and include information that speaks to accuracy and precision of the equipment and chemicals you use. For example, if one step involves adding hydrochloric acid to a reaction vessel, it makes a difference if you added 5 mL of 0.1 M hydrochloric acid from a 10 mL graduated cylinder or 5.10 mL of 0.100 M hydrochloric acid from a graduated syringe.
SketchesIf your setup is at all unusual, make a sketch of it here. It needn't be fine art, nor does it need to illustrate common equipment or setups such as a beaker or a filtering setup. The goal is not to make an accurate representation of how the apparatus actually appears on your lab bench, but rather to make it clear how the various components relate to each other. Be sure to clearly label any relevant parts of the set up.
CalculationsInclude any calculations you make. If you run the same calculation repeatedly on different data sets, one example calculation suffices.
Table(s)If appropriate, construct a table or tables to organize your data.
Graph(s)If appropriate, construct a graph or graphs to present your data and show relationships between variables. Label the axes appropriately, include error bars if you know the error limits, and make sure that all of the data plotted in the graph are also available to the reader in tabular form. Hand-drawn graphs are preferable. If you use computer-generated graphs, make sure they are labeled properly and tape or paste them into this section.
Copyright © 2013 by The Home Scientist, LLC Revision 1.0.7 – 10 January 2013

The Home Scientist, LLC CK01A Instruction Manual 18
ConclusionThe following information should be entered after you complete the experiment:
ResultsWrite a one or two paragraph summary of the results of the experiment.
DiscussionDiscuss, if possible quantitatively, the results you observed. Do your results confirm or refute the hypothesis? Record any thoughts you have that bear upon this experiment or possible related experiments you might perform to learn more. Suggest possible improvement to the experimental procedures or design.
Answer questionsIf you've just completed a lab exercise from this or another book, answer all of the post-lab questions posed in the exercise. You can incorporate the questions by reference rather than writing them out again yourself.
Copyright © 2013 by The Home Scientist, LLC Revision 1.0.7 – 10 January 2013

The Home Scientist, LLC CK01A Instruction Manual 19
ISeparating Mixtures
A mixture is a substance that comprises two or more elements and/or compounds that are physically intermingled but that have not reacted chemically to form new substances. A mixture may be a solid, liquid, gas, or some combination of those states.
We are surrounded by mixtures, both in the chemistry lab and in everyday life. The air we breathe is a mixture of nitrogen, oxygen, and small amounts of other gases. Our soft drinks are complex mixtures of water, sugar, carbon dioxide, and various organic compounds that provide the color and flavor. The foods we eat are complex mixtures of organic and inorganic compounds.
Mixtures are often created intentionally because a particular mixture possesses special desirable characteristics. For example, stainless steels are mixtures of iron, chromium, carbon, nickel, manganese, and other elements in specific proportions, chosen to optimize such characteristics as resistance to corrosion, hardness, tensile strength, color, and luster. Similarly, concretes are complex mixtures of components chosen to minimize cost while optimizing strength, durability, resistance to road salts, permeability to water, and other factors, depending on the purpose for which the concrete will be used.
Because the components of a mixture have not reacted chemically, it is possible to separate the mixture into its component substances by using purely physical means. Chemists have devised numerous methods for separating compounds based on differential physical characteristics, including differential solubility, distillation, recrystallization, solvent extraction, and chromatography.
For example, petroleum refineries use distillation and other separation methods to process crude oil, a complex mixture of hydrocarbons, into gasoline, diesel fuel, and hundreds of other useful organic compounds. Industrial chemists synthesize hundreds of thousands of valuable compounds, from pharmaceuticals to plastics to dyes, which must be extracted from complex mixtures of by-products. These compounds are often purified using one or more of the separation methods we'll examine.
Separating mixtures is not unique to science labs and factories. For example, one of the most common means of separating mixtures is by differential solubility. You can separate a mixture of sand and salt simply by adding water to the mixture. The salt is soluble in water, and the sand is not. Decanting off the water takes the salt with it, leaving only clean sand.
Copyright © 2013 by The Home Scientist, LLC Revision 1.0.7 – 10 January 2013

The Home Scientist, LLC CK01A Instruction Manual 20
We didn't choose that example arbitrarily. Sand that is heavily contaminated with salt (such as beach sand) cannot be used for making concrete because the salt weakens the concrete and causes it to fracture. So, when construction workers are making concrete with sea sand, the first thing they do is wash the sand with two or three changes of clean water to remove the salt.
In this group of lab sessions, we'll use five common methods for separating mixtures.
Copyright © 2013 by The Home Scientist, LLC Revision 1.0.7 – 10 January 2013

The Home Scientist, LLC CK01A Instruction Manual 21
Topic I. Separating MixturesSession I-1: Recrystallization
Advance Preparation:
Session:
None
60 to 90 minutes (may run concurrently with other group sessions)
Materials from Kit
□ Goggles□ Beaker, glass□ Beaker, small plastic□ Stirring rod
□ Thermometer□ Wire gauze□ Hydrochloric acid
Materials You Provide
□ Gloves□ Hotplate (or stove burner)□ Paper (sheet of copy paper or similar)□ Paper towels□ Refrigerator/freezer
□ Tablespoon (measuring or standard)□ Teaspoon (measuring or standard)□ Sodium bicarbonate (baking soda)□ Sodium chloride (table salt)
Concepts and Vocabulary
□ Solution□ Solvent□ Solute□ Solubility□ Miscibility□ Differential solubility
□ Saturated solutions□ Supersaturation□ Retrograde solubility□ Solubility curve□ Recrystallization
Background
Most people think of a solution as a liquid produced by dissolving a solid material (the solute) in a liquid (the solvent). For example, adding a teaspoon of sugar (the solute) to a cup of coffee (the solvent) produces a solution of sugar in coffee.
Although such solid/liquid solutions are very common, they are not the only possible type of solution. A broader definition of a solution is a homogeneous mixture of two or more components in which the minor component(s) are the solute(s) and the major component is the solvent. Both the solute and the solvent can be solids, liquids, or gases.
For example, our atmosphere is a gas/gas solution in which nitrogen gas is the solvent, oxygen gas is the major solute, and water vapor, argon, carbon dioxide, and several other gases are minor solutes. Similarly, stainless steel is a solid/solid solution in which iron is the solvent and other solids such as chromium, manganese, and other metals are the solutes. A 70% solution of isopropyl alcohol is a liquid/liquid solution in which isopropanol is the solvent and water is the solute. It is also possible for a solution to contain solids, liquids, and gases. For example, soft drinks are mixtures that contain water as the solvent, sugar as the major solute, and carbon dioxide gas as a minor solute.
Copyright © 2013 by The Home Scientist, LLC Revision 1.0.7 – 10 January 2013

The Home Scientist, LLC CK01A Instruction Manual 22
The solubility of a substance specifies the amount of that substance that can be dissolved in a specific amount of a particular solvent. Solubility can range over many orders of magnitude, depending on the particular solute and solvent in question. For example, iodine is relatively insoluble in water (~0.3 grams/liter), but much more soluble in ethanol (~215 grams/liter). Conversely, potassium iodide is freely soluble in water (~1,400 grams/liter) but only moderately soluble in ethanol (~20 grams/liter).
A solution that contains the maximum amount of solute that that amount of solvent is capable of dissolving is said to be saturated with respect to that solute. One sure way to produce a saturated solution is to add excess solute such that some remains undissolved when the solution reaches equilibrium.
Note: Some substances are miscible, which means they can form solutions in any proportions. For example, isopropyl alcohol and water are miscible. That means you can make a solution of these two compounds that contains any percentage of isopropyl alcohol mixed with any percentage of water. For miscible substances, the concepts of solvent, solute, and saturation have no meaning because either or all of the miscible substances may be present in any amount and by definition the saturation point is never reached.
A solution that contains more solute than that amount of solvent can dissolve is called a supersaturated solution. If that concept seems impossible, it's because supersaturated solutions are metastable. In effect, the solvent hasn't “noticed” yet that it's dissolved more of the solute than it should be able to dissolve. If you take some action to “wake up” the solution, such as dropping in a tiny crystal of solid solute (or, sometimes, just tapping the container), the excess solute crashes out of solution as a solid precipitate, leaving a saturated solution.
Temperature also affects solubility, sometimes dramatically. Most substances are more soluble in hot solvent than in cold. A few solids and most gases are more soluble in cold solvent than in hot. These substances are said to exhibit retrograde solubility. A few solids exhibit discontinuous solubility curves. For example, the water solubility of lithium vanadate peaks at about 30 °C. It is less soluble in both warmer and colder water.
You can produce a solubility curve by plotting the amount of solute required to form a saturated solution at different temperatures. That curve may be relatively flat or quite steep, depending on the particular solute and solvent in question.
For example, the solubility curve for sodium chloride (table salt) is almost flat. At 0 °C, the solubility of sodium chloride is about 356 grams/liter (g/L). At 100 °C, solubility increases only to about 391 g/L, an increase of less than 10%. Conversely, the solubility of copper(II) sulfate pentahydrate increases from about 320 g/L at 0 °C to more than 2,000 g/L at 100 °C, an increase of more than 500%.
All of these concepts are important to understanding recrystallization, which is the process of separating and purifying a solid substance from a mixture by dissolving the mixture in a minimum amount of solvent to produce a saturated solution and then taking some action to cause the mixture to become supersaturated with respect to the major solute.
The most common recrystallization procedure is to dissolve as much as possible of the mixture in hot or boiling solvent and then cool the saturated solution to cause it to become supersaturated. At that point, the excess solute comes out of solution as crystals, which may be isolated by filtration.
Copyright © 2013 by The Home Scientist, LLC Revision 1.0.7 – 10 January 2013

The Home Scientist, LLC CK01A Instruction Manual 23
Note: Crystals are inherently the purest form of any substance, because the crystalline structure is a tight matrix that leaves no room for contaminants.
For example, to purify crude copper(II) sulfate pentahydrate, you might bring 100 mL of water to a boil and dissolve as much as possible (about 200 grams) of the crude solid in that boiling water. You might then filter the hot solution to remove undissolved solid contaminants, and then cool the filtrate to room temperature and then to 0 °C in the freezer. Assuming a perfect yield, about 32 grams of copper(II) sulfate would remain in solution—along with any soluble contaminants that were present in the crude solid—and nearly 170 grams of pure copper(II) sulfate crystals would cover the bottom and sides of the container.
You can then recover the pure copper(II) sulfate crystals by filtration, rinse them with a small amount of ice-cold water to remove any remaining contaminated solution, and dry the crystals. At that point, the copper(II) sulfate crystals are nearly pure, but if you need even purer product you can repeat the recrystallization using fresh water.
Of course, about a sixth of your original copper(II) sulfate remains in the contaminated solution, called the mother liquor. In effect, for every 100 grams of impure copper(II) sulfate, you get back only about 84 grams of the pure product.
If that is unacceptably low, you can improve the yield by reusing the mother liquor by bringing it to a boil and again dissolving as much crude copper(II) sulfate as possible. Because the 100 mL of mother liquor already contains about 32 grams of copper(II) sulfate, producing a saturated boiling solution will require only about 168 grams of crude copper(II) sulfate rather than the 200 grams or so required to form a saturated solution in boiling water.
When you recrystallize that solution, you'll get back essentially all of the 168 grams of copper(II) sulfate you added. In effect, you're recycling the mother liquor, turning that 32 grams of copper(II) sulfate into a one-time loss, spread over several recrystallization passes. Of course, that recycling is not 100% efficient. You'll lose some product during filtration, and eventually the level of contaminants in the mother liquor may become too high for effective recrystallization. But using multiple-pass recrystallization may allow you to increase the overall yield to 95% or more. That's particularly important for purifying expensive or difficult to synthesize compounds, such as pharmaceuticals, and is also important in industrial processes for reducing the amount of toxic waste produced.
In most recrystallizations, the substance you want to isolate and purify is the major substance present, with the contaminant or contaminants present in much smaller amounts. For example, you may have synthesized 100 grams of a mixture that contains 95 grams of the desired compound and 5 grams of contaminants. In that case, the goal of the recrystallization is to isolate and recover as much as possible of the 95 grams of product while eliminating the 5 grams of contaminants.
Note: It is important to understand that the contaminant(s) may be more soluble or less soluble in the chosen solvent than the substance you are purifying, but, because those contaminants are ordinarily present in small amounts relative to the target substance, the amount of solvent used is sufficient to keep them in solution regardless of temperature. If that is not the case, the recrystallized product will be impure. In that situation, the best option is usually to use a different solvent.
In some recrystallizations, however, the proportions are reversed. You may have synthesized 100 grams of a mixture that contains only 5 grams of the compound you want, mixed with 95 grams of contaminants. In that case, the procedure is reversed. The recrystallized solid is the
Copyright © 2013 by The Home Scientist, LLC Revision 1.0.7 – 10 January 2013

The Home Scientist, LLC CK01A Instruction Manual 24
waste material, and the mother liquor contains the desired product. By repeated passes, evaporating excess solvent, and extracting the product to a different solvent, the product can be concentrated and eventually recrystallized.
One famous example of such a “reverse recrystallization” occurred just before and during WWII, when penicillin was literally more precious than gold. Because most of the penicillin administered to a patient was excreted unchanged in the urine of the patient, that urine was collected and subjected to several purification processes, recrystallization among them, to reclaim the penicillin for reuse.
Goals
In this lab session, we'll use recrystallization to purify a mixture of sodium bicarbonate (baking soda) and sodium chloride This lab session has the following goals:
□ Understand the basics of solvents, solutes, and solutions
□ Examine the effect of temperature on solubility
□ Produce a two-point solubility “curve” (room temperature and boiling)
□ Produce a saturated solution of a mixture
□ Isolate pure sodium bicarbonate by recrystallization
□ Make the first proper entry in your lab notebook
Procedure
Note: If you have a balance you can modify this procedure to enhance the learning experience. Rather than using a rough volumetric estimate of the mass of salts added, use the balance to determine the mass accurately. Use the thermometer to determine actual solubility of the mixed salts at different temperatures and use those data to plot an accurate solubility curve from several data points.
1. If you have not done so already, put on your goggles and gloves. Review the hazards of each chemical you will use. (None of the materials we work with in this lab session are particularly hazardous, but it is good practice to wear protective gear at all times when working in a lab.)
2. Transfer about a teaspoon of table salt and three heaping tablespoons of baking soda to a sheet of paper and mix them thoroughly by stirring or by lifting alternate corners of the paper.
3. Fill the glass beaker about half full of cold tap water. Record its temperature in your lab notebook.
4. Keeping track of approximately how much you're adding—for example, by eighth or quarter teaspoon increments—gradually transfer small batches of the solid mixture to the beaker, using the stirring rod to mix the solution. Continue adding the solid mixture as long as it continues to dissolve. Record the total amount of solid mixture required to produce a saturated solution in your lab notebook.
Note: The goal is to produce a saturated solution of the salt and baking soda mixture, with at most a few crystals remaining undissolved. If you add too much solid, simply add a few milliliters (mL) of cold tap water to the beaker and stir until the excess solid dissolves.
Copyright © 2013 by The Home Scientist, LLC Revision 1.0.7 – 10 January 2013

The Home Scientist, LLC CK01A Instruction Manual 25
5. Place the beaker on the hotplate and bring the solution to a gentle boil, using the lowest temperature setting. Use the wire gauze between the burner surface and the beaker to protect the beaker from direct contact with the hot metal burner surface.
6. Once the water is boiling, determine its temperature and record that value in your lab notebook. Again keeping track of how much you're adding, transfer small batches of the solid mixture to the beaker, using the stirring rod to mix the solution. Continue adding the solid mixture as long as it continues to dissolve.
Note: Getting the solution exactly saturated is not critical; you're better off using a bit too much water and having all the solids dissolved than having a substantial amount of undissolved solids. If you run out of the solid mixture, simply make up some more.
7. Once the solution is saturated, record the total amount of solid you added in your lab notebook, turn off the heat and allow the beaker to cool. As it cools, crystals will begin to form on the bottom and sides of the beaker. Allow the beaker to cool to room temperature, and then place it in a refrigerator or freezer to cool it further (but don't allow the liquid to freeze). Also place a plastic beaker about half full of tap water in the freezer to chill, but again don't allow the water to freeze.
8. Remove the beaker from the freezer and use the stirring rod to scrape off as many crystals as possible from the sides of the beaker. Carefully decant off as much as possible of the supernatant liquid. Retain about 25 mL in one of the small plastic beakers, and discard the remainder. Try to transfer all of the liquid and none of the crystals.
9. Taste a few crystals of salt, note the taste, and rinse your mouth with water. Repeat with a few crystals of baking soda. Taste one drop of the supernatant liquid to see if you can detect the tastes of salt and/or baking soda. Record your observations in your lab notebook.
10.Transfer as many of the crystals as possible from the beaker onto a pad of several thicknesses of paper towels to absorb as much of the liquid as possible.
11. Rinse the beaker thoroughly, and transfer the crystals from the paper towels back into the beaker. Wash the crystals with about 10 mL of ice-cold water, stirring to make sure that all of the crystals are exposed to the wash water.
12.Decant off as much of the wash water as possible, and discard it. Transfer the crystals to a fresh pad of paper towels to absorb as much of the wash water as possible. Repeat the wash two or three times, using fresh ice-cold water and fresh paper towels each time.
13.Taste a drop of the final wash water to see if you can detect the taste of salt. Record your observations in your lab notebook.
14.Fill a test tube about half full of the supernatant liquid you decanted after the first crystallization step. To determine if this liquid contains only salt or also contains some sodium bicarbonate, add a couple drops of hydrochloric acid to the test tube. Hydrochloric acid reacts with sodium bicarbonate to form sodium chloride and carbon dioxide gas, so if sodium bicarbonate is present in the test tube you will see bubbles of carbon dioxide gas form. Record your observations in your lab notebook.
Copyright © 2013 by The Home Scientist, LLC Revision 1.0.7 – 10 January 2013

The Home Scientist, LLC CK01A Instruction Manual 26
Clean-up and Disposal
Wash and dry the equipment. All the products produced in this lab session are nonhazardous and can be discarded with household garbage or flushed down the drain with water.
Review Questions
1. Is recrystallization an effective method for separating a mixture of sodium bicarbonate and sodium chloride? Is it an efficient method? (Hint: search the Internet for solubility values for sodium bicarbonate—also called sodium hydrogen carbonate—at 0 °C and 100 °C.)
2. Would recrystallization be an effective method for obtaining pure sodium chloride crystals from the rock salt used for deicing roads? Would it be efficient?
3. You have been given a 15 gram sample of a nearly pure material that exhibits retrograde solubility. Looking that material up in a standard reference, you find that its solubility is 10.0 grams per 100 mL at 0 °C and 1.0 grams per 100 mL at 100 °C. Describe, with quantities, how you would recrystallize this material for even higher purity and what the theoretical yield in grams and percent would be for a single-pass recrystallization.
Copyright © 2013 by The Home Scientist, LLC Revision 1.0.7 – 10 January 2013

The Home Scientist, LLC CK01A Instruction Manual 27
Topic I. Separating MixturesSession I-2: Chromatography
Advance Preparation:
Session:
Add solvents to chromatography tubes (see Note)
60 to 90 minutes (may run concurrently with other group sessions); you can significantly reduce the overall time needed to complete this lab session by running all operations in parallel rather than sequentially.
Materials from Kit
□ Goggles□ Centrifuge tubes, 50 mL□ Chromatography paper strips□ Cotton swabs□ Pipettes□ Reaction plate, 96-well□ Ruler□ Sharpie marking pen
□ Copper(II) sulfate□ Iron(II) sulfate□ Iron(III) chloride□ Lead(II) acetate□ Potassium ferricyanide□ Potassium iodide□ Sodium ferrocyanide
Materials You Provide
□ Gloves□ Pencil□ Hair dryer (optional)□ Paper towels□ Scissors
□ Transparent tape□ Additional felt-tip pens (optional)□ Isopropyl alcohol (70%, 91%, or 99%)□ Non-polar solvent (optional; see Note)
Concepts and Vocabulary
□ Chromatography
□ Analyte (sample), mobile phase (solvent or carrier), and stationary phase (substrate)
□ Analytical chromatography and preparative chromatography
□ Polar and non-polar solvents
□ Spotting chromatograms
□ Developing chromatograms
□ Solvent front
□ Retardation factor (Rf)
□ Visualizing chromatograms
Copyright © 2013 by The Home Scientist, LLC Revision 1.0.7 – 10 January 2013
The Home Scientist, LLC CK01A Instruction Manual 28
Background
Chromatography (from the Greek for color-writing) is a method used for separating mixtures. In chromatography, a mixture (called the analyte or sample) dissolved in a mobile phase (sometimes called the solvent or carrier) passes through a stationary phase (sometimes called the substrate). During the passage, various components of the analyte carried by the mobile phase selectively adhere to the stationary phase with greater or less affinity, separating the components physically across the stationary phase.
The Russian botanist Mikhail Semyonovich Tsvet invented chromatography in 1900, and used it to separate chlorophyll and other plant pigments. Tsvet named his new procedure chromatography because his chromatograms were literally colorful. Nowadays, chromatography is often used to separate colorless compounds, so the original rationale for the name no longer applies.
The simplest chromatography method—the one we explore in this lab session—is called paper chromatography. Unlike other chromatography methods, paper chromatography requires no expensive equipment or special materials. In paper chromatography, the mobile phase is water or another solvent, and the stationary phase is paper. The solvent is absorbed by the paper, and dissolves a spot of the analyte. As the solvent is drawn up the paper by capillary action, the various dissolved components of the mixture are deposited on the paper at different distances from the original spot.
An analyte that has relatively higher affinity for the mobile phase and relatively lower affinity for the stationary phase migrates farther than an analyte that has higher affinity for the stationary phase. If the differences in affinity between the two phases are large, the spot is tight, intense, and well-defined, and most of the analyte may migrate from its original location to near the edge of the solvent front. If the differences in affinity are smaller, the spot may “spread out” as the solvent draws it up the paper.
Other chromatography methods—including thin-layer chromatography (TLC), gas chromatography, and liquid chromatography—are often used in laboratories and industrial processes. These other methods have various advantages compared with paper chromatography, including faster throughput, sharper separations, higher sensitivity, and smaller required analyte amounts.
Most chromatography done in laboratories is analytical chromatography, which requires only small amounts of analyte and is used to separate mixtures for subsequent instrumental or wet analyses and to follow reactions to completion or equilibration. Conversely, some industrial processes use preparative chromatography, which uses large (sometimes huge) amounts of analyte, and is used to purify compounds on a commercial scale.
For paper chromatography, it's important to choose an appropriate solvent. Polar solvents are more efficient carriers for polar analytes, such as ionic compounds. Non-polar solvents are more efficient carriers for molecular (covalent) compounds. Some examples of common solvents in decreasing order of polarity are:
□ water
□ amides (e.g., N,N-dimethylformamide)
□ alcohols (e.g., ethanol, isopropanol)
□ ketones (e.g., acetone, methyl ethyl ketone)
Copyright © 2013 by The Home Scientist, LLC Revision 1.0.7 – 10 January 2013

The Home Scientist, LLC CK01A Instruction Manual 29
□ esters (e.g., ethyl acetate, amyl acetate)
□ chlorocarbons (e.g., dichloromethane, carbon tetrachloride, chloroform)
□ ethers (diethyl ether)
□ aromatics (benzene, toluene, phenol)
□ alkanes (hexanes, heptanes, petroleum ether)
Mixed solvents are used in paper chromatography to separate mixtures that contain both polar and non-polar compounds, or to increase separation of mixtures of components that have similar behavior with a single solvent. The rule of thumb for mixed solvents is that a small amount of a polar solvent mixed with a large amount of a non-polar solvent tends to behave as a polar solvent.
The key metric for paper chromatography is called the retardation factor (Rf), which is the ratio of the distance the analyte moves from the initial point to the distance the solvent front moves from the initial point. In other words, Rf = (migration distance of the analyte) / (migration distance of the solvent).
For example, if a spot of analyte migrates 2 cm from the initial point during the time it takes the solvent front to migrate 5 cm from the initial point, the Rf for that compound with that particular solvent and that particular substrate is 0.40 (2 cm / 5 cm). The Rf of a particular compound is a dimensionless number that is fixed for any particular combination of solvent and substrate, but may vary dramatically for other combinations of solvent and substrate.
Note: Some texts refer to the retardation factor, Rf, as the retention factor, k, which is a related but separate concept. Rf is the ratio between the distances traveled by the analyte and the solvent front; k is the ratio between the amounts of analyte in the stationary phase and the mobile phase.
Goals
□ Learn how chromatography is used to separate mixtures
□ Learn to spot, develop, and visualize paper chromatograms
□ Use paper chromatography to separate mixtures of molecular dyes and ionic salts
□ Learn to calculate and use Rf values
□ Use paper chromatography to determine atomic mass ratios
Procedure
This lab session is in two parts. In Part I, we'll use chromatography to separate a mixture of dyes. In Part II, we'll run chromatograms of four ionic compounds (copper(II) sulfate, iron(II) sulfate, iron(III) chloride, and lead(II) acetate) and use the Rf values we obtain to calculate atomic mass ratios for copper, iron, and lead.
Note: We'll use 50 mL self-standing centrifuge tubes as our chromatography jars. Prepare these tubes a few minutes before use by filling one tube to between the 5 and 7.5 mL line with isopropanol and two tubes to between the 5 and 7.5 mL lines with hot tap water and recapping the tubes. Try to keep the solvents off the sides of the tubes. The goal is to make sure the air inside the tubes is saturated with solvent vapor.
Copyright © 2013 by The Home Scientist, LLC Revision 1.0.7 – 10 January 2013

The Home Scientist, LLC CK01A Instruction Manual 30
Part I – Chromatography of Dyes
Chromatography is often used to separate mixtures of dyes. For example, a forensic document examiner may need to determine if two signatures were made with the same type of ink. Visually, the inks may appear identical, but chromatography may reveal that the two signatures were made with inks that contain different dyes. Biologists use chromatography to separate mixtures of plant dyes, industrial chemists use it to separate mixtures of cloth dyes, and so on.
In any case, the first task is to determine an appropriate mobile phase (solvent), one that will dissolve most or all of the dyes present in the mixture. A dye may be readily soluble in one solvent and nearly insoluble in another, so it's quite common to use a mixture of solvents in actual practice.
In this part of the lab session, we'll run a chromatogram of the ink used in a Sharpie marking pen. We'll use ordinary drugstore isopropyl alcohol as our mobile phase, because we determined experimentally that isopropanol is a good solvent for the inks used in Sharpie pens. (If you use other brands of marking pens for additional tests, IPA may or may not be a suitable solvent for them as well.)
Note: You can test the suitability of a solvent with different inks or dyes by putting a tiny spot of the ink or dye on an ordinary sheet of paper, allowing it to dry, and then placing one drop of the solvent on the spot. If the spot runs, that solvent is suitable for use with that dye.
Isopropyl alcohol is a relatively polar solvent. If you have the time and materials, you can run additional chromatograms using a less polar solvent, such as gasoline, mineral spirits (paint thinner), or charcoal lighting fluid. (Be extremely careful; most non-polar solvents are extremely flammable. Use the smallest possible amounts, and make sure to have a suitable fire extinguisher handy.) Some non-polar solvents will damage plastic labware, so use a suitable glass jar or similar container as your chromatography jar for non-polar solvents.
If you run out of chromatography paper, you can substitute strips or rectangles cut from white coffee filters. Note, however, that the Rf value for a particular compound is specific to the fixed and mobile phases used to produce the chromatograph. In other words, you can't compare the Rf values from chromatography strips with those from coffee filters.
1. If you have not done so already, put on your goggles and gloves. Review the hazards of each chemical you will use.
2. Cut a strip of chromatography paper just long enough and wide enough to fit inside a 50 mL centrifuge tube. Trim two corners from one end of the strip at a 45º angle to allow the strip to protrude down into the conical area at the bottom of the tube.
3. Use the ruler and a pencil to draw an index line just above the trimmed corners of the strip, parallel to the short side of the strip. Place a small pencil dot near the center of the line.
4. To spot the strip, briefly touch the tip of the marking pen to the dot on the index line to leave a small spot. Don't allow the tip of the pen to remain in contact with the paper for long, or the paper will wick the ink, producing a large spot. Your goal is to produce a spot no more than 1mm to 2mm in diameter.
Copyright © 2013 by The Home Scientist, LLC Revision 1.0.7 – 10 January 2013

The Home Scientist, LLC CK01A Instruction Manual 31
5. Allow the spot to dry and then repeat the spotting procedure by touching the tip of the marking pen to the existing spot to intensify that spot. Again, your goal is to have a spot of ink no more than 1mm to 2mm in diameter.
6. Repeat the spotting procedure until you have spotted and dried the strip a total of five times.
7. Quickly uncap the centrifuge tube that contains isopropanol, slide the chromatography strip into the jar, pointy end down, and recap the jar. Make sure that the bottom (trimmed) edge of the strip is immersed to a depth of at least 2 or 3 mm in the liquid.
Note: It is important to keep the air inside the chromatography tube saturated with solvent vapor. Otherwise, as the solvent is drawn up the chromatography strip it will vaporize, allowing the strip to dry and ruining your results. The best way to avoid this problem is to keep the tube capped except when you are actually inserting or removing chromatography strips.
8. The strip develops by the capillary action of the paper drawing the alcohol up the strip, with the solvent front visible as it creeps up the strip. Allow the chromatogram to develop until the solvent front nearly reaches the top of the strip, but make sure the solvent front doesn't actually reach the top of the strip. Full development may take 15 minutes or more.
9. When development is complete, carefully remove the strip from the chromatography tube and immediately make a pencil mark at the line of the maximum extent of the solvent front. (That line will become invisible when the strips are dried.) Dry the strip by suspending it and allowing it to air dry, or you can use a hair dryer on its low setting to speed drying.
10.When the developed strip is dry, measure the distance between the index line and the pencil mark you made to record the maximum migration of the solvent front. Record this value in your lab notebook.
11. Make a pencil mark at the point of maximum migration for each of the dyes present in the ink. Measure the distance between the index line and each of these pencil marks and record those values in your lab notebook.
12.Calculate the Rf values for each of the dyes by dividing the migration distance for each dye by the distance from the index line to the solvent front line. Record those values in your lab notebook. Use transparent tape to mount the chromatograms in your lab notebook.
Note: The Rf value for each dye will be in the range from 0.0 (the dye did not migrate at all) to 1.0 (the dye migrated the same distance as the solvent front). For example, you might determine that the distance between the index line and the solvent front line was 8.0 cm; that two dyes were present, aqua and magenta; that the aqua dye migrated 2.0 cm; and that the magenta dye migrated the same distance as the solvent front. The Rf value for the aqua dye is therefore (2.0 cm / 8.0 cm) = 0.25, and the Rf value for the magenta dye is (8.0 cm / 8.0 cm) = 1.0.
Part II – Using Chromatography to Determine Atomic Mass Ratios
In Part I of this lab session, we used chromatography to separate a mixture of dyes. The chromatogram we produced was self-visualizing, because intensely colored dyes are readily
Copyright © 2013 by The Home Scientist, LLC Revision 1.0.7 – 10 January 2013

The Home Scientist, LLC CK01A Instruction Manual 32
visible against a white paper substrate.
But chromatography can also be used to separate mixtures of colorless compounds. For example, a forensic toxicologist may use chromatography to separate and identify the components of a substance that is suspected to contain one or more alkaloids (organic compounds that are produced by some plants and other organisms, are often incredibly toxic, and are usually colorless).
The obvious problem is how to see colorless compounds on white paper. The solution is to treat the developed chromatogram with a reagent that reacts with the colorless compounds to produce colored compounds. (For alkaloids, that's often Dragendorff's Reagent, which reacts with nearly all alkaloids to produce orange stains.) This process is called visualizing a chromatogram.
Note: Some sources refer incorrectly to visualizing a chromatogram as “developing” the chromatogram. Developing a chromatogram is the process of allowing the mobile phase to pass through the stationary phase. Visualizing a chromatogram is the process of treating the developed chromatogram with a reagent or reagents that react with colorless analytes to form colored compounds.
In this part of this lab session, we'll spot, develop, and visualize two chromatography strips, one with copper(II) sulfate and lead(II) acetate and a second with iron(II) sulfate and iron(III) chloride. (Copper(II) sulfate is actually blue, but in the low concentration we'll be using, that blue color may be too pale to see on the developed chromatogram.)
After we develop and dry the chromatograms, we'll visualize the first chromatogram by swabbing it with potassium iodide solution, which reacts with copper(II) ions to form brown copper(II) iodide and with lead(II) ions to form yellow lead(II) iodide. We'll visualize the second chromatogram by swabbing the iron(II) sulfate section with potassium ferricyanide, which reacts with iron(II) ions to form Prussian Blue, and the iron(III) chloride section with sodium ferrocyanide, which reacts with iron(III) ions to form Prussian Blue.
We'll then measure the developed and visualized chromatograms to determine Rf values for copper(II), iron(II), iron(III), and lead(II) ions and, from those values, calculate the mass ratios between copper, iron, and lead.
Note: Why two different iron compounds? The ions in three of our four analytes have a +2 charge. The fourth, iron(III), has a +3 charge. By comparing the Rf values of iron(II) and iron(III) ions, we can determine if the charge on the ion affects the Rf value.
1. If you have not done so already, put on your goggles and gloves. Review the hazards of each chemical you will use.
2. Trim about 1/4" (~ 6mm) from the ends of each of two chromatography strips.
3. Use the ruler and pencil to draw an index line about 1 cm from one end on each of the strips. Place two small pencil dots on each index line, each dot about 1/4" (6.35mm) from the edge of the strip. Use the pencil to label the dots on the first strip “Cu” and “Pb” just below the dots. On the second strip, label the dots “Fe(II)” and “Fe(III)”.
4. Use a clean pipette to transfer a few drops of copper(II) sulfate solution to one well of the reaction plate. Make sure to expel all of the solution from the pipette.
5. Grasping the pipette by the shaft, touch the tip to the copper(II) sulfate solution in the well. A tiny amount of the solution will be draw up into the tip by capillary action. (Do not squeeze the bulb; your goal is to get only the tiny amount draw into the tip by
Copyright © 2013 by The Home Scientist, LLC Revision 1.0.7 – 10 January 2013

The Home Scientist, LLC CK01A Instruction Manual 33
capillary action.) Touch the tip of the pipette to the “Cu” pencil dot on the first strip, and allow the paper to draw the copper(II) sulfate solution out of the tip. Your goal is to produce a spot that is as small as possible, ideally only a couple mm in diameter.
6. Allow the spot to dry—you can speed up this process by carefully using a hair dryer on its low setting to dry the strip—and then repeat the spotting procedure to transfer additional copper(II) sulfate to the strip, on top of the initial spot. Repeat this procedure until you have spotted the copper(II) sulfate solution a total of five times.
7. Repeat the spotting procedure to spot the first strip with lead(II) acetate and the second strip with iron(II) sulfate and iron(III) chloride, each a total of five times.
Note: You can greatly reduce the time needed to spot the strips by spotting all four spots on both strips before each drying and respotting pass. If you do this, use a separate clean pipette for each solution.
8. Repeat the spotting procedure until you have spotted each strip a total of five times with the corresponding solution, allowing it to dry completely between each spotting.
9. Quickly uncap one of the centrifuge tubes that contains water, slide one of the strips into the jar, spotted end down, and recap the jar. Make sure that the bottom edge of the strip is immersed to a depth of at least 2 or 3 mm in the water. Repeat this procedure with the second strip in the second tube.
10.The strips develop by the capillary action of the paper drawing the water up the strips, with the solvent front visible as it creeps up the strips. Allow the chromatograms to develop until the solvent front nearly reaches the top of the strip, but make sure the solvent front doesn't actually reach the top of the strip. Full development may take 15 minutes or more.
11. After development finishes, carefully remove the strips from the chromatography tubes and immediately make a pencil mark at the line of the maximum extent of the solvent front. (That line will become invisible when the strips are dried.) Dry the strips by suspending them and allowing them to air dry, or you can use a hair dryer on its low setting to speed drying.
12.Measure the distance between the index line and the solvent front line on each strip, and record those values in your lab notebook.
13.To visualize the Cu/Pb strip, place it on a flat surface. Transfer a drop or two of potassium iodide solution to a cotton swab. Brush the swab lightly along the length of the strip on the “Cu” side to wet its surface. The iodide ions react with copper(II) ions to form brown copper(II) iodide. Repeat this procedure, using a fresh swab, on the Pb side of the strip. The iodide ions react with the lead(II) ions to produce bright yellow lead(II) iodide. Air-dry that strip or use a hair dryer to dry it faster.
14.To visualize the Fe(II)/Fe(III) strip, place it on a flat surface. Transfer a drop or two of potassium ferricyanide solution to a cotton swab. Brush the swab lightly along the length of the strip on the “Fe(II)” side to wet its surface. The ferricyanide ions react with iron(II) ions to form the intense blue pigment Prussian Blue. Repeat this procedure, using a fresh swab, with sodium ferrocyanide on the Fe(III) side of the strip. The ferrocyanide ions react with the iron(III) ions, again to produce Prussian Blue. Air-dry that strip or use a hair dryer to dry it faster.
15.Measure the distance between the index line and the maximum migration of the
Copyright © 2013 by The Home Scientist, LLC Revision 1.0.7 – 10 January 2013

The Home Scientist, LLC CK01A Instruction Manual 34
visualized Cu(II), Pb(II), Fe(II), and Fe(III) spots on both chromatograms, and record those values in your lab notebook.
16.Using the values you've determined experimentally, calculate the Rf values for all four ions, and record those values in your lab notebook. Use transparent tape to mount the chromatograms in your lab notebook
Clean-up and Disposal
Absorb the tiny amount of lead(II) acetate solution remaining in the reaction plate on a piece of paper towel or a cotton swap, followed by the remaining copper(II) sulfate solution. The sulfate ions react with the lead ions to form insoluble lead(II) sulfate. You can discard the paper towel or cotton swab with the household trash. The isopropyl alcohol remaining in the chromatography jar can be flushed down the drain with water. Wash and dry the equipment.
Review Questions
1. What Rf value(s) did you determine for the dye(s) present in the purple Sharpie marker? What general conclusions can you draw regarding the relative affinity of the dye(s) present in that marker for the mobile phase versus the stationary phase?
2. Based on the known atomic masses of iron (55.847 g/mol), copper (63.546 g/mol), and lead (207.2 g/mol), how do the Rf values you determined for iron(II), iron(III), copper(II), and lead(II) ions correlate to their masses? Within experimental error, does the charge on the iron ion have any effect on its Rf value?
3. Based on the known atomic mass of tin (118.69 g/mol), if you repeated this experiment using tin(II) chloride approximately what Rf value would you expect for the tin(II) ion?
4. You run a paper chromatogram of an ink known to contain at least three different dyes. The developed chromatogram shows only two distinct dye spots. What action might you take to achieve separation of all three dyes?
5. You are presented with an analyte that comprises a complex mixture of several dyes. Experimentally, you determine that one solvent provides good separations for one group of the dyes present in the mixture, but poor separation for another group of dyes present, while a second solvent provides poor separation of the first group of dyes but good separation for the second group of dyes. How might you separate all of the dyes on one piece of chromatography paper? (Hint: assume that you have available squares of chromatography paper rather than just strips.)
Copyright © 2013 by The Home Scientist, LLC Revision 1.0.7 – 10 January 2013

The Home Scientist, LLC CK01A Instruction Manual 35
Topic I. Separating MixturesSession I-3: Solvent Extraction
Advance Preparation:
Session:
None
30 to 45 minutes (may run concurrently with other group sessions)
Materials from Kit
□ Goggles□ Pipettes□ Test tubes with stoppers□ Test tube rack
□ Iodine/potassium iodide solution□ Lead(II) acetate□ Vegetable oil□ Sharpie marker
Materials You Provide
□ Gloves □ Distilled water
Concepts and Vocabulary
□ Solvent extraction
□ Polar and non-polar solvents
□ Organic and inorganic solvents
□ Differential solubility
□ Boundary layer, product layer, and waste layer
□ Separation (partitioning)
Background
Solvent extraction, also called liquid-liquid extraction or partitioning, is a procedure used to separate compounds based on their differential solubility in two immiscible liquids, often water and an organic solvent. During solvent extraction, one or more of the solutes in one of the liquid phases migrates to the other liquid phase. The two liquid phases are then physically separated (partitioned) and the desired product is isolated from the phase that contains it.
Solvent extraction is one of the most commonly used laboratory purification methods, particularly in organic chemistry labs. Solvent extractions done in chemistry labs are usually small-scale, batch-mode operations using a separatory funnel.
Solvent extraction is also widely used in industrial operations. Some industrial applications use batch-mode extraction, albeit usually on a much larger scale than laboratory solvent extractions. Other industrial applications use continuous-mode solvent extractions, often on a gigantic scale, where the two solvents are continuously added to and removed from a large reaction vessel.
In some solvent extractions, the desired product migrates from the original liquid phase to the second liquid phase. In other solvent extractions, impurities migrate from the original liquid phase to the second liquid phase, leaving the product in the original liquid phase. The phase that contains the desired product is called the product layer. The phase that contains impurities, excess reactants, and other undesirable compounds is called the waste layer.
Copyright © 2013 by The Home Scientist, LLC Revision 1.0.7 – 10 January 2013

The Home Scientist, LLC CK01A Instruction Manual 36
Many first-year organic chemistry students come to grief by discarding what they think is the waste layer, only to learn later that they actually discarded the product layer.
In this lab session, the mixture we'll separate is the iodine solution provided with the kit, which is actually an aqueous mixture of iodine and potassium iodide. As a molecular compound, iodine is freely soluble in many non-polar organic solvents, but nearly insoluble in water—about one gram per gallon. (Iodine is, of course, an element rather than a compound, but it forms I2 molecules and so can be considered a molecular compound for our purposes.) Conversely, potassium iodide is an ionic compound—one that easily dissociates into its component ions—and so is freely soluble in many polar solvents, including water, but relatively insoluble in most non-polar organic solvents.
We'll take advantage of the differential solubility of iodine and potassium iodide in different solvents to separate those two substances, using vegetable oil as our non-polar organic solvent. We'll then partition the layers and test the effectiveness of the separation by using lead(II) acetate to test the organic layers for the presence of potassium iodide. (Even at very small concentrations, lead(II) ions react with iodide ions to form an insoluble precipitate of bright yellow lead(II) iodide.)
Note: Iodine stains everything it touches, including skin, clothing, plastic pipettes, and so on. These stains are harmless but unsightly. You can remove iodine stains by dissolving a vitamin C tablet in a few mL of water and using this solution to bleach the iodine stain. The vitamin C oxidizes the elemental iodine to colorless, water-soluble iodide ions. For small stain, you can use a drop of sodium thiosulfate solution.
Goals
□ Observe the solvent extraction process
□ Determine if multi-pass extraction is more effective than single-pass extraction
Procedure
1. If you have not done so already, put on your goggles and gloves. Review the hazards of each chemical you will use.
2. Use the Sharpie marker to label four test tubes, #1 through #4. Place the tubes in the test tube rack.
Note: Labels made on laboratory glassware or plasticware with the Sharpie marker are reasonably permanent. You can remove them using a paper towel dampened with isopropyl alcohol. Marks on the label area of the centrifuge tubes are more difficult to remove, but will come off if you persist.
3. Use a graduated pipette to transfer 2 mL of distilled water to test tube #1 and another 2 mL of distilled water to test tube #2.
4. Use a clean pipette to transfer 10 drops of iodine solution to test tube #1 and 10 drops of iodine solution to test tube #2. Swirl both tubes gently to mix the solutions.
5. Use a clean pipette to transfer 1.5 mL of vegetable oil to test tube #1. Stopper the tube, agitate it for 15 seconds, replace it in the rack, and allow the contents to settle until two distinct and separate layers form. Note the appearance of the two layers, and record your observations in your lab notebook.
6. Use the same pipette to transfer 0.5 mL of vegetable oil to test tube #2. Stopper the
Copyright © 2013 by The Home Scientist, LLC Revision 1.0.7 – 10 January 2013

The Home Scientist, LLC CK01A Instruction Manual 37
tube, agitate it for 15 seconds, replace it in the rack, and allow it to settle. Note the appearance of the two layers, compare that appearance with the layers in test tube #1, and record your observations in your lab notebook.
7. Use the same pipette to withdraw as much as possible of the top layer in test tube #2 and transfer that liquid to test tube #3. Try to get all of the top layer transferred, but avoid transferring any of the bottom layer. It's better to miss a bit of the top layer than to transfer any of the bottom layer.
8. Use a clean pipette to transfer a second 0.5 mL of vegetable oil to test tube #2. Stopper the tube, agitate it for 15 seconds, replace it in the rack, and allow it to settle. Note the appearance of the two layers, compare that appearance with the layers in test tube #1, and record your observations in your lab notebook.
9. Use the same pipette you used in step 7 to withdraw as much as possible of the top layer in test tube #2 and transfer that liquid to test tube #3. Once again, avoid transferring any of the bottom layer.
10.Use the same pipette you used in step 8 to transfer a third 0.5 mL of vegetable oil to test tube #2. Stopper the tube, agitate it for 15 seconds, replace it in the rack, and allow it to settle. Note the appearance of the two layers, compare that appearance with the layers in test tube #1, and record your observations in your lab notebook.
11. Use the same pipette you used in step 9 to withdraw as much as possible of the top layer in test tube #2 and transfer that liquid to test tube #3. As usual, avoid transferring any of the bottom layer.
12.Use the same pipette you used in step 11 to withdraw as much as possible of the top layer in test tube #1 and transfer that liquid to test tube #4. You're probably getting sick of reading this, but make sure not to transfer any of the bottom layer.
At this point, test tube #1 contains the aqueous layer from a single extraction with 1.5 mL of the organic solvent, and test tube #2 contains the aqueous layer from a three-step extraction with 0.5 mL of vegetable oil each time, for a total of 1.5 mL of vegetable oil. Test tube #3 contains the organic layers from test tube #2, and test tube #4 contains the organic layer from test tube #1.
Because iodine is strongly colored, we can roughly judge the efficiency and effectiveness of solvent extraction of iodine just by eyeballing the test tubes. (Hold the tubes up to a bright light or a brightly lit sheet of white paper to judge the intensity of the iodine color remaining in each tube.) However, potassium iodide is colorless, so we'll need to use a reagent to determine whether or not it is present. That reagent is lead(II) acetate, which forms a yellow precipitate of lead(II) iodide in the presence of iodide ions even at very low concentrations.
13.To see what a lead(II) iodide precipitate looks like, transfer ten drops of lead(II) acetate solution to each of test tubes #1 and #2. The immediate formation of a strong precipitate indicates that iodide ions are present in relatively high concentration.
14.Use a clean pipette to transfer 2 mL of water to each of test tubes #3 and #4. Stopper the tubes with clean stoppers, agitate both tubes, and allow the layers to separate completely. If there is any potassium iodide present in the oil layer of either or both tubes, it should be extracted into the water layer.
15.Use the same pipette to draw off the top (oil) layer from both tubes. This time, it doesn't hurt to get some of the water layer as well. Discard the oil layer.
Copyright © 2013 by The Home Scientist, LLC Revision 1.0.7 – 10 January 2013

The Home Scientist, LLC CK01A Instruction Manual 38
16.Transfer ten drops of lead(II) acetate solution to each of test tubes #3 and #4. The formation of any precipitate indicates that at least some iodide ions remained in the oil layer. The absence of a precipitate indicates that iodide ions were absent or present in such tiny concentration that they could be considered absent for all practical purposes. If any precipitate occurs in test tubes #3 or #4, allow it to settle and compare the amount with the amounts you observed in test tubes #1 and #2.
Clean-up and Disposal
There are such tiny amounts of lead(II) acetate and iodine present in the waste products from this lab session that you can simply flush the waste solutions down the drain with plenty of water. Wash the equipment thoroughly with soapy water, rinse it, and dry it.
Review Questions
1. Did the single-phase extraction extract more, less, or about the same amount of iodine from the original iodine/iodide solution as the multi-phase extraction? How do you know?
2. Iodine is much more soluble in isopropanol than in water. Conversely, potassium iodide is much more soluble in water than in isopropanol. Would isopropanol and water be a good pair of solvents for partitioning iodine and potassium iodide? Why or why not?
3. How effective was partitioning in extracting potassium iodide into the aqueous layers? How can you tell?
4. Consider two immiscible solvent pairs, A/B and C/D, that you are considering using for partitioning a mixture of compounds, X and Y. Based on the following solubility data, which solvent pair, if either, would you use, and why?
Solubility of X and Y
Compound A B C D
X 0.8 g/L 0.001 g/L 117 g/L 83 g/L
Y 0.001 g/L 1.3 g/L 54 g/L 122 g/L
Copyright © 2013 by The Home Scientist, LLC Revision 1.0.7 – 10 January 2013

The Home Scientist, LLC CK01A Instruction Manual 39
Topic I. Separating MixturesSession I-4: Salting Out
Advance Preparation:
Session:
None
10 minutes (may run concurrently with other group sessions)
Materials from Kit
□ Goggles□ Cotton swabs□ Pipette
□ Ruler□ Test tube with stopper□ Test tube rack
Materials You Provide
□ Gloves□ Matches or butane lighter□ Food coloring (optional)
□ Isopropyl alcohol (70%, 91%, or 99%)□ Sodium chloride (table salt)
Concepts and Vocabulary
□ Salting out
□ Differential solubility
□ Boundary layer
□ Separation
Background
Salting out is a special application of differential solubility. Salting out is used to separate two liquids that are ordinarily miscible or extremely soluble in each other. This process was first used thousands of years ago to separate soap from the waste glycerin produced when oils or fats are treated with a strong base such as sodium hydroxide (lye). It is now widely used in chemistry labs and industrial processes to separate mixed liquids.
Conceptually, the salting-out process is straightforward. A solid salt is added to a mixture of two (or more) liquids and the mixture is agitated and allowed to settle. The added salt dissolves preferentially in one of the liquids, and the liquids separate into two physical layers.
The ideal situation is when the solid salt chosen is extremely soluble in one of the liquids and nearly insoluble in the other. For example, a mixture of isopropyl alcohol and water can be separated by adding sodium chloride (common table salt). Sodium chloride is very soluble in water (~360 grams/liter) but almost insoluble in isopropyl alcohol (~0.03 grams/liter).
As salt is added to the mixture, it dissolves in the water, eventually forming a saturated solution. As the salt dissolves, it dissociates into sodium ions and chloride ions, which are solvated by (bonded to) water molecules. Those water molecules become unavailable for solvating isopropyl alcohol molecules, thereby greatly reducing the solubility of the isopropyl alcohol and causing it to form a separate physical layer.
Copyright © 2013 by The Home Scientist, LLC Revision 1.0.7 – 10 January 2013

The Home Scientist, LLC CK01A Instruction Manual 40
Note: The goal of salting out is not always or even usually merely to separate two miscible liquids. In many reactions, products are formed that have different solubilities in the two or more solvents present in the reaction mixture. Separating those solvents also separates the reaction products, which can then be isolated individually from one or both of the physical layers.
Goals
□ Observe the salting-out process
□ Determine the effectiveness of salting out for separating water and isopropanol.
Procedure
1. If you have not done so already, put on your goggles and gloves. Review the hazards of each chemical you will use.
2. Use the pipette to transfer 1.5 mL of isopropyl alcohol to a test tube. If you have food coloring dye, add one drop to the test tube. Measure the height of the column in the test tube and record that value in your lab notebook.
3. Add tap water until the test tube is about two-thirds full. Stopper the tube and invert it several times to mix the contents thoroughly. Record the appearance of the mixture in your lab notebook.
4. Use the pipette to withdraw a few drops of the mixture and wet the tip of a cotton swab with the mixture.
5. Use a match or butane lighter to determine if the mixture is flammable. Record your observations in your lab notebook.
6. Transfer enough sodium chloride (table salt) to the test tube to form a layer about 1.5 cm thick at the bottom of the test tube.
7. Stopper the test tube and agitate it vigorously for 30 seconds or so.
8. Place the test tube in the rack and allow it to settle. Watch the tube and record your observations in your lab notebook. Measure the height of the top layer and record that value in your lab notebook.
9. Use the pipette to withdraw a few drops of the top layer and wet the tip of a cotton swab with it.
10.Use a match or butane lighter to determine if the mixture is flammable. Record your observations in your lab notebook.
Clean-up and Disposal
You can simply flush the waste products from this lab session down the drain. Wash the equipment thoroughly with soapy water, rinse it, and dry it.
Copyright © 2013 by The Home Scientist, LLC Revision 1.0.7 – 10 January 2013

The Home Scientist, LLC CK01A Instruction Manual 41
Review Questions
1. Was the original isopropanol/water mixture flammable? What conclusion do you draw?
2. After salting out, was the top layer flammable? What conclusion do you draw?
3. Given the relative amounts of isopropanol and water in the original mixture and the relative heights of the layers in the salted-out mixture, what do you conclude is the makeup of the two layers and the relative distribution of isopropanol and water in the layers?
Copyright © 2013 by The Home Scientist, LLC Revision 1.0.7 – 10 January 2013
The Home Scientist, LLC CK01A Instruction Manual 42
IISolubility and Solutions
In the preceding group of experiments, we looked at separating mixtures, of which solutions are one type. In this group, we'll take a closer look at solubility and the characteristics of solutions.
A solution is a homogeneous mixture of two or more substances. In a solution, the solute is dissolved in another substance called the solvent. For example, if you add a teaspoon of sugar to a cup of coffee, sugar is the solute and coffee is the solvent.
The solute and solvent may be in any phase. One common form of solution is a solid solute (such as salt or sugar) dissolved in a liquid solvent (such as water). A solution in which water is the solvent is called an aqueous solution. Many other solvents are commonly used in chemistry labs, including ethanol and other alcohols, acetone, benzene, and other organic liquids. Some solutions are mixtures of one liquid dissolved in another liquid. For example, the isopropyl rubbing alcohol found in drugstores contains about 30% water (the solute, in this case) dissolved in about 70% isopropanol (the solvent). A solution may also be made by dissolving a gas in a liquid. For example, aqueous ammonia (often incorrectly called ammonium hydroxide) is a solution of ammonia gas dissolved in water, and hydrochloric acid is a solution of gaseous hydrogen chloride dissolved in water.
Although the most common types of solutions used in chemistry labs are solid-liquid, liquid-liquid, and gas-liquid solutions, there are other types of solutions. Mixtures of gases can also be thought of as solutions. Our atmosphere can accurately be described as a solution of about 21% oxygen gas in about 79% nitrogen gas, with minor amounts of other gases present. Similarly, two or more solids can form a solution. For example, stainless steel is a solution in which iron is the solvent and small amounts of chromium and other metals are the solutes.
Note: Conventionally, in a solid-liquid mixture, the liquid is always considered to be the solvent and the solid the solute. Some solids, however, are so soluble in a given solvent that a very concentrated solution may contain more of the solid by mass and by volume than it contains of the liquid. In such cases, it's not unreasonable to consider the solid as the solvent and the liquid as the solute. In a liquid-liquid solution, the liquid present in the greater amount is considered the solvent.
The most important characteristic of a solution is its concentration. Concentration is
Copyright © 2013 by The Home Scientist, LLC Revision 1.0.7 – 10 January 2013

The Home Scientist, LLC CK01A Instruction Manual 43
sometimes referred to in general terms. A dilute solution is one that contains a relatively small amount of solute per volume of solvent. A concentrated solution is one that contains a relatively large amount of solute per volume of solvent. A saturated solution is one that contains the maximum amount of solute that the volume of solvent is capable of dissolving at a specified temperature. (A supersaturated solution contains more solute than the solvent is capable of dissolving.)
Note: It's a mistake to refer to a dilute solution as “weak” or a concentrated solution as “strong”. The words weak and strong have different meanings to a chemist. For example, a concentrated solution of acetic acid (a weak acid) is still a weak acid solution, while a dilute solution of hydrochloric acid (a strong acid) is still a strong acid solution.
For many applications, it's important to have a specific value for concentration. Chemists specify concentration in numerous ways, using the mass, volume, and/or number of moles of solute and solvent. Here are the primary methods chemists use to specify concentrations:
Note: A mole is a specific number of objects, much like a dozen or a gross, but with a much larger numeric value. While it's convenient to group eggs by the dozen or small parts by the gross, atoms and molecules are so unimaginably tiny that we group them in much larger numbers. Rather than 12 or 144 objects, one mole (abbreviated mol) of a substance contains 6.0223 · 1023 (Avogadro's Number) of the elementary entities (atoms or molecules) that make up that substance.
One mole of an element or compound is, for all practical purposes, that quantity whose mass in grams has the same numeric value as the atomic mass or molecular mass of the substance. For example, because the atomic mass of iron is 55.847 unified atomic mass units (u, also called Daltons, Da), one mole of elemental iron has a mass of 55.847 grams. Similarly, because the molecular mass of molecular oxygen is 31.9988, one mole of oxygen molecules has a mass of 31.9988 grams. (Conversely, one mole of atomic oxygen, whose atomic mass is 15.9994, has a mass of 15.9994 grams.)
Moles are often more convenient for chemists to use than masses, because moles represent specific numbers of atoms or molecules. For example, one atom of sodium (Na) reacts with one atom of chlorine (Cl) to form one molecule of sodium chloride (NaCl). Because one mole of sodium contains the same number of atoms as one mole of chlorine, one mole of sodium reacts with one mole of chlorine to form one mole of sodium chloride. Or, stated differently, 22.989768 grams (one mole) of sodium reacts with 35.4527 grams (one mole) of chlorine to form 58.442468 grams (one mole) of sodium chloride. Using moles rather than masses makes the proportions of reactants and products clear..
Molarity
Molarity, abbreviated mol/L or M, specifies the number of moles of solute per liter of solution (not per liter of solvent). Molarity is the most commonly-used way to specify concentration. Technically, the word molarity and the unit symbol M are obsolete. The official replacements are amount-of-substance concentration and mol/dm3, neither of which anyone actually uses. The advantage of using molarity to specify concentration is that it makes it very easy to work with mole relationships. The disadvantages are that it is much more difficult to measure volumes accurately than it is to measure masses accurately, which makes it difficult to prepare solutions of exact molarities, and that the
Copyright © 2013 by The Home Scientist, LLC Revision 1.0.7 – 10 January 2013

The Home Scientist, LLC CK01A Instruction Manual 44
molarity of a solution changes with temperature because the mass of solute remains the same while the volume of the solution changes with temperature.
Molality
Molality, abbreviated mol/kg or m, specifies the number of moles of solute per kilogram of solvent (not per kilogram of solution). The primary advantage of using molality to specify concentration is that, unlike its volume, the mass of the solvent does not change with changes of temperature or pressure, so molality remains constant under changing environment conditions. Molality is used primarily in tasks that involve the colligative properties of solutions, which are covered in the following chapter. For the dilute aqueous solutions typically used in laboratories, molarity and molality are nearly the same because nearly all of the mass of these solutions is accounted for by the solvent (water) and the mass of water at room temperature is almost exactly one kilogram per liter.
Normality
Normality, abbreviated N, specifies the number of gram equivalents of solute per liter of solution (not per liter of solvent). The concept of gram equivalents takes into account the dissolution of ionic salts in solution. For example, a 1.0 M solution of calcium chloride (CaCl2) can be made by dissolving one mole (111.0 g) of anhydrous calcium chloride in water and bringing the volume up to 1.0 liter. The calcium chloride dissociates in solution into one mole of calcium ions and two moles of chloride ions. That solution is 1.0 N with respect to calcium ions, but 2.0 N with respect to chloride ions. Accordingly, it is nonsensical to label such a solution of calcium chloride as 1.0 N or 2.0 N, unless you specify the ion species to which the normality refers.
Acids and bases are often labeled with their normalities, the assumption being that normality for an acid always refers to the hydronium (H3O+) ion concentration and the normality for a base to the hydroxide (OH-) ion concentration. For monoprotic acids such as hydrochloric acid (HCl) and nitric acid (HNO3), normality and molarity are the same, because these acids dissociate in solution to yield only one mole of hydronium ions per mole of acid. For diprotic acids such as sulfuric acid (H2SO4), the normality is twice the molarity, because one mole of these acids dissociates in solution to form two moles of hydronium ions. For triprotic acids such as phosphoric acid (H3PO4), normality is three times molarity, because in solution these acids yield three hydronium ions per acid molecule. Similarly, dibasic molecules such as barium hydroxide, Ba(OH)2, dissociate in solution to yield two moles of hydroxide per mole of compound, so for solutions of these compounds the normality is twice the molarity.
Mass percentage
Mass percentage, also called weight-weight percentage or w/w, specifies the mass of the solute as a percentage of the total mass of the solution. For example, dissolving 20.0 g of sucrose in 80.0 g of water yields 100 g of a 20% w/w sucrose solution. Mass percentage is often used to specify concentration for concentrated acids. For example, a bottle of reagent-grade hydrochloric acid may specify the contents as 37% HCl, which means that 100 g of that solution contains 37 g of dissolved HCl. (Such solutions are often also labeled with the density of the solution, which allows them to be measured volumetrically rather than requiring weighing to transfer an accurate amount of solute.)
Copyright © 2013 by The Home Scientist, LLC Revision 1.0.7 – 10 January 2013

The Home Scientist, LLC CK01A Instruction Manual 45
Mass-volume percentage
Mass-volume percentage, also called weight-volume percentage or w/v, specifies the mass of the solute as a percentage of the total volume of the solution. For example, dissolving 5.0 g of iodine in ethanol and making up the final volume to 100.0 mL yields 100 mL of a 5% w/v iodine solution. Mass-volume percentage is often used to specify concentration for indicators such as phenolphthalein and other reagents that are typically used dropwise.
Volume-volume percentage
Volume-volume percentage, abbreviated v/v, specifies the volume of the solute as a percentage of the total volume of the solution, and is often used when mixing two liquids. For example, a 40% v/v solution of ethanol in water can be made by measuring 40 mL of 100% ethanol and adding water until the final volume is 100 mL. That last sentence was phrased very carefully, because volumes are not necessarily additive. For example, adding 60.0 mL of water to 40.0 mL of ethanol yields something less than 100.0 mL of solution.
In this group of lab sessions, we'll examine various aspects of solutions.
Copyright © 2013 by The Home Scientist, LLC Revision 1.0.7 – 10 January 2013

The Home Scientist, LLC CK01A Instruction Manual 46
Topic II. Solubility and SolutionsSession II-1: Solubility as a Function of Temperature
Advance Preparation:
Session:
The procedure described in Part I for preparing sodium carbonate can be done ahead of time to save lab time. You will also need a supply of ice-cold water for the later parts of this experiment.
90 to 120 minutes
Materials from Kit
□ Goggles□ Beaker, 250 mL glass□ Thermometer□ Graduated cylinder, 10 mL
□ Graduated cylinder, 100 mL□ Stirring rod□ Wire gauze
Materials You Provide
□ Gloves□ Hotplate (or stove burner)□ Balance (optional)□ Oven, baking dish, and tablespoon□ Refrigerator/freezer
□ Measuring spoons (optional)□ Soda bottle, pint/500 mL (empty and clean)□ Storage container (wide mouth, with lid)□ Sodium bicarbonate (baking soda)□ Distilled water
Concepts and Vocabulary
□ Solubility curve
□ Water of crystallization and hydration states
□ Balanced equation
□ Decomposition reaction
□ Molar mass
□ Calibrating an instrument
Background
As we learned in the recrystallization session, the temperature of the solvent often affects the solubility of a compound in that solvent. For some compounds, the effect is small. For example, water at 80 °C dissolves only about 5% more sodium chloride than water at 0 °C. For other compounds, the effect may be much larger. For example, water at 80 °C dissolves more than 60 times as much barium hydroxide as water at 0 °C.
Chemists produce solubility curves to quantify the solubility of a particular compound in a particular solvent at different temperatures. In a real lab setting, this may be done by producing a saturated solution at a particular accurately-known temperature, transferring an accurately-known volume of that solution to a container of known mass, evaporating the solvent, and determining the mass of the dry solid remaining by subtracting the mass of the container from the mass of the container plus solid. This process is then repeated at several (or many) other temperatures to produce a solubility curve. (The process is actually far more complicated, but this description conveys the essence of it.)
Copyright © 2013 by The Home Scientist, LLC Revision 1.0.7 – 10 January 2013

The Home Scientist, LLC CK01A Instruction Manual 47
We have neither the equipment nor the time to reproduce this process, so we'll go at it from the other direction. Instead of trying to determine how much solute a solution contains at a known temperature, we'll determine what temperature is required to dissolve a known amount of solute in a known volume of solvent. (We'll ignore such minor variables as the effect of temperature on the volume of the solvent, which are down in the noise for the accuracy we're capable of maintaining.)
We'd like to test a substance that exhibits a wide variation in solubility with changes in temperature. Ideally, we want that solute to be cheap, pure, and readily available. Sodium chloride (table salt) would be ideal, except that it has a very flat solubility curve. Sodium hydrogen carbonate (sodium bicarbonate or baking soda) is better, but its solubility curve is still too flat to suit us.
Sodium carbonate (washing soda) would be ideal for our purposes, but unfortunately the washing soda you can buy in the supermarket contains an unknown amount of water of hydration. We could dry washing soda in an oven to eliminate the water, but there's a better solution. Fortunately, it's very easy to synthesize pure, dry sodium carbonate starting with only baking soda and a hot oven.
That leaves us with two problems:
1. Thermometers are often inaccurate by one degree Celsius or more. Fortunately, the error is usually linear. For example, a particular thermometer may read 1.3 °C high (or low), but that error is usually reasonably consistent across its range.
Fortunately, it's easy to do a two-point calibration on a thermometer by using the known freezing and boiling points of water. Using the freezing point is straight-forward, because the freezing point of water is (for our purposes) essentially independent of atmospheric pressure. Using the boiling point of water is more involved, because it varies with changing atmospheric pressure.
2. We need to know the mass of sodium carbonate. If you have a balance, you can simply weigh the sodium carbonate before you add it to the solution. If you do not have a balance, you can substitute volumetric measurement with the 10 mL graduated cylinder (or a set of measuring spoons) and use the volume-to-mass conversions we provide.
Goals
In this lab session, we'll take two brief detours before getting down to business. That business is to determine experimentally a full solubility curve for sodium carbonate in water, but before we do that we need to calibrate our thermometer and make the sodium carbonate. This lab session has the following goals:
□ Synthesize a chemical compound via a decomposition reaction
□ Calibrate your thermometer
□ Gather data concerning the effect of temperature on solubility
□ Produce a solubility curve for sodium carbonate in water
Procedure
This lab session has three parts. In Part I, we'll produce sodium carbonate, which can be done ahead of time. In Part II, we'll calibrate our thermometer. In Part III, we'll determine the
Copyright © 2013 by The Home Scientist, LLC Revision 1.0.7 – 10 January 2013
The Home Scientist, LLC CK01A Instruction Manual 48
solubility of sodium carbonate at various temperatures and use those data to construct a solubility curve.
We'll need a supply of ice-cold water for Parts II and III of this experiment. To prepare it, fill the soda bottle about 90% full of tap water, place it in the freezer, and keep an eye on it. You want ice to form in the bottle, but you don't want it frozen solid. Once a significant amount of ice has formed in the bottle, remove it from the freezer and place it in the refrigerator until you need it. As long as some ice remains in the bottle, the water is usable for Parts II and III.
Part I – Synthesize sodium carbonate
It is a time-honored custom among chemists to make our own equipment and chemicals. For this lab session, we need sodium carbonate, Na2CO3, ideally as pure and as dry as possible. Although we could buy sodium carbonate, it's easy enough to synthesize it from a cheap and readily-available material.
That material is sodium hydrogen carbonate, NaHCO3, also known as sodium bicarbonate or baking soda. Baking soda is an extremely pure form of sodium hydrogen carbonate. When heated, sodium hydrogen carbonate undergoes a decomposition reaction to form sodium carbonate, carbon dioxide, and water by the following balanced equation:
2 NaHCO3 → Na2CO3 + CO2 + H2O
When heated, two molecules of sodium hydrogen carbonate (NaHCO3) react to form one molecule of sodium carbonate (Na2CO3), one molecule of carbon dioxide (CO2), and one molecule of water (H2O). The carbon dioxide and water are driven off as gases, leaving only pure anhydrous sodium carbonate.
Note: Some chemical compounds exist in two or more forms. The anhydrous or dry form contains only the compound itself. Hydrated forms contain one or more molecules of water, either as a part of the crystalline matrix or coordinated with (bound to) each molecule of the compound, or both. These water molecules are called water of crystallization. Many compounds are known in only zero or one hydration state. Some exist in multiple hydration states. For example, besides the anhydrous form, sodium carbonate may be found as the monohydrate (one water molecule per molecule of compound) and the decahydrate (10 water molecules).
We can substitute the known molar mass of each compound in the balanced equation to determine what mass of sodium carbonate will be produced from a particular mass of sodium hydrogen carbonate. Substituting the molar masses for the molecular formulas gives us:
2 NaHCO3 → Na2CO3 + CO2 + H2O
2 (84.007) → (105.989) + (44.010) + (18.015)
Two moles (168.014 grams) of sodium hydrogen carbonate react to form one mole (105.989 grams) of sodium carbonate. Therefore, on a mass basis, we expect the sodium carbonate product to mass (105.989 / 168.014) = 0.631 times the mass of sodium hydrogen carbonate we started with. In other words, if we react 1,000 grams of sodium hydrogen carbonate, we expect to produce about 631 grams of sodium carbonate. The remaining 369 grams is driven off as carbon dioxide gas and water vapor.
We'll produce much more sodium carbonate than we need for this lab session, because we'll also use it in future lab sessions.
Copyright © 2013 by The Home Scientist, LLC Revision 1.0.7 – 10 January 2013

The Home Scientist, LLC CK01A Instruction Manual 49
Note: If you have a balance you can weigh both the sodium hydrogen carbonate and the sodium carbonate.
1. If you have not done so already, put on your goggles and gloves. Review the hazards of each chemical you will use. (None of the materials we work with in this lab session are particularly hazardous, but it is good practice to wear protective gear at all times when doing lab work.)
2. Preheat the oven to 450 °F. While the oven is heating, distribute about one pound (~ 500 g) of sodium bicarbonate evenly in a thin layer on a clean baking dish, pizza pan, or similar oven-safe container.
3. Place the sodium bicarbonate in the oven and heat it for 15 minutes.
4. Slide out the oven rack. Carefully stir the solid material and break up any large lumps present. (Opening the oven door also allows excess water vapor to escape.)
5. Return the container to the oven and heat at 450 °F for another 15 minutes. Again stir the solid material, break up any lumps, and heat it at 450 °F for a final 15 minutes.
6. Turn off the heat, remove the baking dish from the oven, and allow the sodium carbonate to cool to room temperature. Once it is cool, use the tablespoon to crush any lumps into powder and transfer the sodium carbonate powder to the storage container. Cap the container and label it as follows:
Sodium Carbonate(USP, anhydrous)
Na2CO3105.9884 g/mol
<date>
Note: The sodium carbonate product is a fine white powder that looks exactly like the sodium bicarbonate you started with. Don't worry. As long as you followed directions, all of the sodium bicarbonate has decomposed to form sodium carbonate.
Part II – Calibrate your thermometer
1. If you have not done so already, put on your goggles and gloves. Review the hazards of each chemical you will use.
2. Immerse the tip of your thermometer about 76 mm (3") into the ice water you made up earlier and stir gently for about 30 seconds. Note the temperature reading, and record it in your lab notebook. Return the ice water to the refrigerator.
3. The actual temperature of the ice water is 0.0 °C. Based on the thermometer reading, calculate the offset between indicated and actual temperature and record this value in your lab notebook. For example, if the thermometer reads +0.4 °C, record the offset as +0.4 °C; if the thermometer reads -0.8 °C, record the offset as -0.8 °C.
4. Fill the 250 mL glass beaker about three-quarters full of tap water. Place it on your hotplate or stove burner, using the wire gauze to protect the glass from contacting the hot surface directly. Heat the beaker until the water reaches a full boil.
5. Immerse the thermometer to a depth of about 76 mm (3") in the boiling water and stir gently for about 30 seconds. Note the temperature reading, and record it in your lab notebook.
Copyright © 2013 by The Home Scientist, LLC Revision 1.0.7 – 10 January 2013

The Home Scientist, LLC CK01A Instruction Manual 50
Note: To determine the offset between indicated and actual temperature at the boiling point, you'll need to determine your local atmospheric pressure.
Atmospheric pressure is the actual (raw and uncorrected) pressure of the atmosphere. Atmospheric pressure varies with altitude and with atmospheric conditions. Barometric pressure is a corrected value. For example, the barometric pressure reported in weather forecasts is corrected for elevation, which is to say that the barometric pressure given is what the atmospheric pressure would be if the reporting station were located at sea level. You can obtain an accurate value for atmospheric pressure by contacting your local airport, which reports both atmospheric and barometric pressures.
Once you have an accurate value for atmospheric pressure, you can use the on-line calculator at http://www.csgnetwork.com/prescorh2oboilcalc.html to determine the actual boiling point of water for your current local conditions.
6. Based on the thermometer reading and the actual boiling point of water at your current local conditions, calculate the offset between indicated and actual temperature and record this value in your lab notebook. For example, if the actual boiling point of water at local conditions is 98.7 °C but the thermometer reads +99.1 °C, record the offset as +0.4 °C; if the actual boiling point is 100.2 °C but the thermometer reads 99.8 °C, record the offset as -0.4 °C. Record the values you determine on the thermometer storage tube for future reference.
7. If the offsets for freezing and boiling were the same or very similar, you can simply assume that your thermometer consistently reads high or low by the offset amount across its range. If the offsets differed significantly, graph the two measured offsets on the y-axis against actual temperature on the x-axis and connect those points with a straight line. (For readability, scale your axes appropriately; for example, use one graph unit per 1.0 °C on the x-axis and one unit per 0.01 °C on the y-axis.)
Part III – Determine solubility of sodium carbonate
Note: If you have a balance you can use actual masses rather than using volumetric estimates of the masses. If you do not have a balance, you can use the following data to convert volumetric measurements to approximate masses of sodium carbonate:
1.25 mL = 1/4 teaspoon = 0.97 grams
2.50 mL = 1/2 teaspoon = 1.85 grams
5.00 mL = 1 teaspoon = 3.70 grams
For sodium carbonate produced by the procedure described in Part I, we determined these values using three different sets of measuring spoons, weighing 20 separate trials with each of the nine spoons. For each measurement, we dipped the spoon into the container, withdrew it heaping full, and then tapped it gently to level the powder surface to the edge of the spoon.
The maximum variation in all cases was less than 10%, and typical variation was 3% to 4%. Because we'll use many spoons in each trial, the positive and negative variations tend to even out, giving absolute values very close to those listed. You can minimize error at the expense of time required by using multiple smaller spoonsful rather than one larger.
If you do not have a set of measuring spoons, you can substitute the 10 mL graduated
Copyright © 2013 by The Home Scientist, LLC Revision 1.0.7 – 10 January 2013

The Home Scientist, LLC CK01A Instruction Manual 51
cylinder, although this takes longer and is less precise.
1. If you have not done so already, put on your goggles and gloves. Review the hazards of each chemical you will use.
2. Use the 100 mL graduated cylinder to measure as accurately as possible 200 mL of ice water, and transfer it to the glass beaker.
3. Stir in sodium carbonate, carefully using the thermometer as a stirring rod. You can assume that at least 10 g of sodium carbonate will dissolve, and so add that amount quickly. Once you've added 10 g, continue adding sodium carbonate in small increments just until a few crystals remain undissolved. Record the temperature (which will probably have increased from 0 °C during the addition) and the amount of sodium carbonate added in your lab notebook.
Note: As you add each portion of sodium carbonate and stir, the solution initially has a cloudy appearance, caused by undissolved sodium carbonate powder suspended in the solution. As you continue stirring, the solution clarifies as that suspended sodium carbonate dissolves. With adequate stirring, the sodium carbonate should go into solution within one to two minutes of each addition.
Concentrated sodium carbonate solutions appear subtly different from water. They are clear and colorless, but appear slightly “thicker” than water and somewhat more viscous. When solution is complete, any undissolved sodium carbonate will be obvious as small crystals on the bottom of the beaker.
4. Place the beaker on your hotplate or stove burner, set to low heat, using the wire gauze to protect the beaker from direct contact with the hot surface. Stir gently with the thermometer until it reads about 10 °C. Remove the beaker from the heat source and repeat step 3, stirring in sodium carbonate just until a few crystals remain undissolved. Counting the sodium carbonate you added in the first pass, you can assume that at least 20 g of sodium carbonate will dissolve, so add sufficient sodium carbonate to reach that mass and then continue adding sodium carbonate in small increments until just a few crystals remain undissolved. Record the temperature (which will probably have increased from 10 °C during the addition) and the amount of sodium carbonate added in your lab notebook.
5. Repeat step 4 to obtain values for solubility at about 20 °C (solubility at least 40 g total), 30 °C (solubility at least 75 g total), and 35 °C (solubility at least 90 g total).
6. Continue heating the beaker in 10 °C increments until either no more sodium carbonate will dissolve or until you reach 100 °C, whichever comes first. Record your observations in your lab notebook.
7. Graph your results, with solubility in g/dL on the y-axis and temperature on the x-axis, and attach that graph to your lab notebook.
Clean-up and Disposal
Allow the saturated sodium carbonate solution you produced in the last step to cool to 20 °C. If necessary, place the beaker in the refrigerator briefly to cool it to that temperature. Some solid sodium carbonate will precipitate as the solution cools. Allow the precipitate to settle and then carefully decant off at least 100 mL of the clear supernatant liquid and store it in a labeled sealed container for use in a later experiment. Wash and dry the equipment. All the
Copyright © 2013 by The Home Scientist, LLC Revision 1.0.7 – 10 January 2013

The Home Scientist, LLC CK01A Instruction Manual 52
products produced in this lab session are nonhazardous and can be discarded with household garbage or flushed down the drain with water.
Review Questions
1. In calibrating the thermometer and graphing the expected offsets for temperatures between the measured data points, what assumption are we making? What defect in the instrument would invalidate that assumption?
2. Most ionic compounds exhibit a positive solubility curve, with solubility increasing with increasing temperature. Does sodium carbonate exhibit such a curve? If not, how does the solubility curve of sodium carbonate differ and what evidence would indicate this difference?
3. In g/dL, what values did you obtain for the solubility of sodium carbonate in water across the range of temperatures you tested?
Copyright © 2013 by The Home Scientist, LLC Revision 1.0.7 – 10 January 2013

The Home Scientist, LLC CK01A Instruction Manual 53
Topic II. Solubility and SolutionsSession II-2: Conductance of Ionic and Molecular Solutes
Advance Preparation:
Session:
Prepare boiled distilled water (See Procedure Part I)
90 to 120 minutes
Materials from Kit
□ Goggles□ Beaker, 250 mL glass□ Beaker, 100 mL plastic□ Centrifuge tube, 50 mL□ Pipettes□ Reaction plate, 24-well
□ Spatula□ Acetic acid, 6M□ Ammonia, 6M□ Hydrochloric acid, 6M□ Magnesium sulfate□ Sodium hydroxide, 6M
Materials You Provide
□ Gloves□ DMM (if your kit does not include one)□ Hotplate or stove burner□ Paper towels
□ Soda bottle (clean and dry)□ Sucrose (table sugar)□ Distilled water
Concepts and Vocabulary
□ Conductivity and conductance
□ Cations and anions
□ Resistivity and resistance
□ Ionic and molecular solutes
□ Dissociation (ionization)
□ Electrolytes
Background
Electrical conductivity specifies how well a particular material transmits an electrical current. An electrical current is a movement of charged particles. In solids, including metals, the moving charged particles that constitute an electrical current are electrons. In solutions, the moving charged particles that constitute an electrical current are positively-charged ions, called cations, and negatively-charged ions, called anions.
A material—such as copper metal or seawater—that contains many free or loosely-bound charged particles and does not impede the movement of those particles conducts electrical current well, and is said to exhibit high conductivity. Conversely, a material—such as glass, rubber, or distilled water—that has few free or loosely-bound charged particles or that impedes the movement of those particles conducts electrical current poorly, and is said to exhibit low conductivity.
The reciprocal of conductivity is resistivity. A material that exhibits high conductivity has low resistivity, and vice versa. For example, a material whose conductivity is 100 units (we'll worry
Copyright © 2013 by The Home Scientist, LLC Revision 1.0.7 – 10 January 2013

The Home Scientist, LLC CK01A Instruction Manual 54
about the units later) has a resistivity of 1/100 units = 0.01 units-1.
A solution is a mixture in which the solute is uniformly distributed as separate particles (molecules or ions) throughout the solvent. For our purposes, we can consider solutes as being in one of two classes. Molecular solutes do not dissociate into ions and are therefore present as uncharged particles in the solution. Ionic solutes dissociate in solution to form charged particles, cations and anions.
The degree of dissociation varies from one ionic solute to another. Strong acids, strong bases, and some salts dissociate completely into charged ions. This complete dissociation means that these compounds form a very large number of ions, and therefore exhibit high conductivity (are strong electrolytes). Weak acids, weak bases, and some salts dissociate only partially into ions, with the remainder being present as uncharged molecules. The relative paucity of ions formed by these compounds means they exhibit relatively low conductivity (are weak electrolytes).
For example, hydrochloric acid, HCl, is a strong acid. It dissociates completely and irreversibly in solution to form hydrogen ions, H+ (which are then immediately solvated by water molecules to form hydronium ions, H3O+) and chloride ions, Cl-, by the following balanced equation:
HCl + H2O → H3O+ + Cl-
Conversely, ammonia, NH3, is a weak base. It dissociates partially and reversibly in solution to form ammonium ions, NH4+ and hydroxide ions, OH-, by the following balanced equation:
NH3 + H2O ⇌ NH4+ + OH-
Note the different arrows used in these balanced equations:
The single arrow (→) for hydrochloric acid indicates that this reaction goes to completion. When hydrogen chloride gas (HCl) dissolves in water (H2O), essentially no hydrogen chloride molecules remain in the solution. All of them react with water to form hydronium ions (H3O+) and chloride ions (Cl-).
The equilibrium arrow ( ) for ammonia indicates that this reaction is in equilibrium,⇌ with reactants (the molecules on the left side of the equation) constantly being converted to products (the ions on the right side of the equation) and products being converted back into reactants. In an aqueous ammonia solution, some of the ammonia is always present as molecular ammonia (NH3), and some as ammonium ions (NH4+).
Because hydrogen chloride dissociates completely in solution, it exhibits high conductivity. Because ammonia dissociates only partially, ammonia in solution exhibits lower conductivity than a hydrochloric acid solution of the same concentration.
Some water-soluble compounds, most of which are organic compounds, form no ions in solution. These compounds—sucrose (table sugar) is a good example—remain in molecular form in solution, producing no ions. Accordingly, solutions of these compounds exhibit extremely low conductivity.
Note: Conductivity and conductance are related concepts, as are resistivity and resistance. Conductivity and resistivity are reciprocal values that refer to inherent characteristics of a particular material. Conductance and resistance are also reciprocal values, but refer to a particular real-world electrical circuit.
For example, the resistivity of copper at 20 °C is 1.68 X 10⁻⁸ Ω·m (ohm meter), a fixed
Copyright © 2013 by The Home Scientist, LLC Revision 1.0.7 – 10 January 2013

The Home Scientist, LLC CK01A Instruction Manual 55
physical constant. The resistance of a piece of copper wire depends on the diameter and length of that wire. If a particular length of copper wire has a resistance of 1 Ω (ohm), twice that length of the same wire has a resistance of 2 Ω. The resistivity of copper remains unchanged, but the resistance of the copper wire changes with its length.
For simple resistive circuits, conductivity and conductance are inversely related to resistivity and resistance. For example, if a particular wire has a resistance of 10 Ω, it has a conductance of (1 / 10 Ω) = 0.1 Ω-1 = 0.1 mho = 0.1 siemens. The mho is deprecated although still widely used. The SI unit is the siemen, abbreviated s.
In this lab session, we'll make up various concentrations of various compounds in aqueous solution. We'll then test the resistance of those solutions. Remember that conductance is the reciprocal of resistance, so by determining resistance we're also determining conductance.
Goals
This lab session has the following goals:
□ Understand conductivity in liquids
□ Observe the conductivity of distilled water and tap water
□ Observe the conductivity of a strong acid, a strong base, and an ionic salt
□ Observe the conductivity of a weak acid, a weak base, and a molecular compound
Procedure
This lab session has three parts. In Part I, we'll prepare a supply of boiled distilled water. Boiling ensures that the water is free of dissolved carbon dioxide gas, which might interfere with our tests. In Part II, we'll populate our reaction plate with a set of various concentrations of various solutions. In Part III, we'll determine the resistance (and, therefore, the conductance) of these solutions.
Part I – Prepare a supply of boiled distilled water
Distilled water is usually considered to be very pure. It has very low electrical conductivity because it is almost entirely molecular, with very few ions available to carry an electrical current. (In fact, conductivity tests are used to determine the actual purity of the ultra-pure water used in some laboratory procedures.)
But there is a problem. Distilled water left exposed to the atmosphere absorbs and dissolves carbon dioxide gas from the air. One molecule of water reacts with one molecule of carbon dioxide to form carbonic acid, H2CO3, by the following balanced equation:
CO2 + H2O H⇌ 2CO3
A carbonic acid molecule in turn dissociates in solution to form two hydronium ions, H3O+, and a carbonate ion, CO3-.
H2CO3 + 2 H2O 2 H⇌ 3O+ + CO3-
The presence of these ions is sufficient to allow distilled water to conduct a measurable, albeit small, amount of electric current. Fortunately, it's easy to eliminate this problem, simply by boiling the distilled water before use. Carbon dioxide gas is much less soluble in hot water
Copyright © 2013 by The Home Scientist, LLC Revision 1.0.7 – 10 January 2013

The Home Scientist, LLC CK01A Instruction Manual 56
than in cold. Boiling the water drives off the majority of the carbon dioxide gas, leaving distilled water with extremely low conductivity.
1. If you have not done so already, put on your goggles and gloves. Review the hazards of each chemical you will use.
2. Transfer about 200 mL of distilled water to the 250 mL beaker.
3. Place the beaker on the hotplate, using the wire gauze to protect the beaker from direct contact with the hot surface, and bring the water to a full boil.
4. Allow the water to boil for at least two or three minutes, turn off the heat, and allow the water to cool.
5. Fill a 50 mL centrifuge tube with the boiled distilled water, and cap it. This is the water you'll use for making up test solutions. You'll use the remainder, which can remain in the beaker, for rinsing.
Part II – Populate the reaction plate
The next step is to populate the reaction plate with the various solutions whose conductivity we intend to test.
1. If you have not done so already, put on your goggles and gloves. Review the hazards of each chemical you will use.
2. Use a clean, dry pipette to transfer 1.5 mL of boiled distilled water to each of the 24 wells of the reaction plate. Keep track of this pipette; you'll use it exclusively for transferring boiled distilled water throughout this procedure.
3. Use the same pipette to transfer 1.0 mL of boiled distilled water to wells A1, A2, A3, and A4, for a total of 2.5 mL of distilled water in each of those wells.
4. Use a clean, dry pipette to transfer 0.5 mL of 6M hydrochloric acid to well A1, which nearly fills the well. Use the tip of the pipette to stir the contents of the well gently. Draw up and expel solution with the pipette several times to mix the contents of the well thoroughly. At this point, well A1 contains 3.0 mL of 1.0M hydrochloric acid.
5. Use the same pipette to withdraw 1.5 mL of the solution in well A1 and transfer it to well B1. Again, mix the solution thoroughly. At this point, well B1 contains 3.0 mL of 0.5M hydrochloric acid.
6. Use the same pipette to withdraw 1.5 mL of the solution in well B1 and transfer it to well C1. Again, mix the solution thoroughly. At this point, well C1 contains 3.0 mL of 0.25M hydrochloric acid.
7. Use the same pipette to withdraw 1.5 mL of the solution in well C1 and transfer it to well D1. Again, mix the solution thoroughly. At this point, well D1 contains 3.0 mL of 0.125M hydrochloric acid.
8. Use the same pipette to withdraw 1.5 mL of the solution in well D1 and transfer it to your waste container. At this point, well A1, B1, C1, and D1 contain 1.5 mL each of hydrochloric acid at 1.0M, 0.5M, 0.25M, and 0.125M, respectively.
9. Wash the pipette by filling it with tap water several times and emptying it completely. Use a final rinse of distilled water.
10.Repeat steps 4 through 9, starting with 6M acetic acid, to populate wells A2, B2, C2,
Copyright © 2013 by The Home Scientist, LLC Revision 1.0.7 – 10 January 2013

The Home Scientist, LLC CK01A Instruction Manual 57
and D2 with 1.5 mL each of 1.0M, 0.5M, 0.25M, and 0.125M acetic acid, respectively.
11. Repeat steps 4 through 9, starting with 6M ammonia, to populate wells A3, B3, C3, and D3 with 1.5 mL each of 1.0M, 0.5M, 0.25M, and 0.125M ammonia, respectively.
12.Repeat steps 4 through 9, starting with 6M sodium hydroxide, to populate wells A4, B4, C4, and D4 with 1.5 mL each of 1.0M, 0.5M, 0.25M, and 0.125M sodium hydroxide, respectively.
13.Transfer three level spatula spoons (about 1.0 g) of sucrose (table sugar) to well A5, and use the distilled water pipette to fill the well nearly full with distilled water. This produces about 3 mL of about 1M sucrose solution in well A5.
14.Transfer two level spatula spoons (about 0.7 g) of magnesium sulfate heptahydrate to well A6, and use the distilled water pipette to fill the well nearly full with distilled water. This produces about 3 mL of about 1M magnesium sulfate solution in well A5.
15.Repeat the serial dilution procedure described above to populate wells A5, B5, C5, and D5 with 1.5 mL each of sucrose solutions of about 1M, 0.5M, 0.25M, and 0.125M, respectively.
16.Repeat the serial dilution procedure to populate wells A6, B6, C6, and D6 with 1.5 mL each of magnesium sulfate solutions of about 1M, 0.5M, 0.25M, and 0.125M, respectively.
At this point, your reaction plate is completely populated with test solutions, and we're ready to begin measuring the resistance of each well.
Part III – Determine the resistance of the test solutions
In this part of the lab session, we'll measure the resistance of each of our test solutions. You will find this procedure much easier and faster if you have an assistant. (Both participants should wear approved laboratory goggles.)
One person should be responsible for holding the probe tips in the wells. It's important to be consistent. Immerse the probe tips to the same depth each time. The plastic portion of the probe is a convenient stop to assure consistent immersion depth. Try to place the probes exactly opposite each other in the wells—a 180° separation—and try to hold the probes as steady as possible.
The second person is responsible for adjusting the meter range as needed, observing meter readings, and recording these readings. Always set the meter to the lowest resistance range that produces a valid reading. In other words, start with the range set to 200 Ω. If the meter does not return a valid reading, turn the resistance switch to 2,000 Ω. If that setting does not return a valid reading, turn the resistance switch to 20K Ω (20,000 Ω). And so on.
It's normal for the meter reading to jump around wildly before it settles down. Any movement of the probes, including minor shakiness, can cause wide swings. Observe the meter reading until it settles and then record that value.
Before we begin testing the solutions in the reaction plate, we'll test samples of ordinary tap water and boiled distilled water to give us some points of comparison.
Note: For an interesting side experiment, you can use the procedure described later in this lab session to test the conductivity of boiled distilled water, ordinary distilled water, and tap water. Boiled distilled water should show essentially no conductivity.
Copyright © 2013 by The Home Scientist, LLC Revision 1.0.7 – 10 January 2013

The Home Scientist, LLC CK01A Instruction Manual 58
Depending on the sensitivity of your meter and the amount of dissolved carbon dioxide, ordinary distilled water may show measurable conductivity with the meter set to its highest resistance range. All but the softest tap water will show significant conductivity, which is why it's a bad idea to use a hair dryer while standing in the bathtub.
1. If you have not done so already, put on your goggles and gloves. Review the hazards of each chemical you will use.
2. Fill the 100 mL plastic beaker nearly full with tap water.
3. Plug the black test lead into the meter jack labeled “COM”. Plug the red test lead into the jack labeled “VΩmA”. Turn the meter control to the 200 Ω position. To ensure the meter is working, press the tips of the test leads tightly together. The meter should read 00.0, indicating no resistance between the lead tips, or very close to 00.0.
Note: Depending on how you position the tips, how tightly you press them together, and other factors, you may get a small positive reading—something in the 00.1 (0.1 Ω) to 01.0 (1.0 Ω) range. This is perfectly normal and no cause for concern.
4. With the meter set to the 200 Ω position, hold the test lead tips about 1.5 cm apart and immerse them in the beaker of tap water. Increase the resistance range until you get a valid reading or until you have reached the top resistance range (2000k Ω on our meter; yours may differ). Record your observations in your lab notebook.
5. Repeat step 4 with boiled distilled water.
6. Dry the test lead tips and then immerse them in well D1 (the 0.125M hydrochloric acid). Allow the reading to stabilize and then record it in your lab notebook.
7. Swirl the lead tips in the plastic beaker of tap water, pat them dry with a paper towel, swirl them in the beaker of distilled water, and then pat them dry again with a fresh piece of paper towel.
Note: Our goal here is to prevent any change in the concentrations of the wells caused by the lead tips transferring anything from one well to another. We start with the least concentrated well as a matter of good lab practice. If there is accidental contamination, it's better to contaminate from a less concentrated well into a more concentrated well than vice versa. We rinse the lead tips with tap water and then distilled water to make sure none of the chemical remains on the lead tips. We dry the tips to prevent water from being transferred into a well, thereby changing the concentration.
8. Repeat steps 6 and 7 for wells C1, B1, and A1. After you record the reading for well A1 and rinse the probe tips, discard the tap water in the plastic beaker and replace it with fresh tap water. You can continue to use the distilled water in the glass beaker until you complete your tests.
9. Repeat steps 6 through 8 for each of the other five solutions.
After you complete your tests, take the reciprocal of each of your resistance measurements to obtain conductance values for each of the solutions. (Mathematically, it makes no difference whether we use resistance or conductance, but we're interested in how well each solution conducts electrical current rather than how well it resists current, so it makes sense to use the conductance value.)
Graph your results for each of the six solutions, with concentration on the x-axis and conductance on the y-axis.
Copyright © 2013 by The Home Scientist, LLC Revision 1.0.7 – 10 January 2013

The Home Scientist, LLC CK01A Instruction Manual 59
Clean-up and Disposal
Carefully dump the contents of the reaction plate into the sink, flushing the sink and the reaction plate with copious water. Wash and dry the equipment.
Review Questions
1. What did you observe when you tested the tap water and the boiled distilled water? What do you conclude from your tests?
2. What differences did you observe between the conductance values for hydrochloric acid (a strong acid) and sodium hydroxide (a strong base) versus conductance values for acetic acid (a weak acid) and ammonia (a weak base)? What conclusions can you draw?
3. What did you observe while testing the sucrose solutions? What conclusions can you draw from your observations?
4. What did you observe while testing the magnesium sulfate solutions? What conclusions can you draw from your observations?
Copyright © 2013 by The Home Scientist, LLC Revision 1.0.7 – 10 January 2013

The Home Scientist, LLC CK01A Instruction Manual 60
Topic II. Solubility and SolutionsSession II-3: Colligative Properties of Solutions: Boiling Point Elevation and Freezing Point Depression
Advance Preparation:
Session:
None
60 to 90 minutes
Materials from Kit
□ Goggles□ Beaker, 250 mL glass□ Graduated cylinder, 100 mL□ Sharpie marking pen
□ Stirring rod□ Test tubes□ Thermometer□ Wire gauze
Materials You Provide
□ Gloves□ Balance (optional)□ Foam cups (or similar containers)□ Freezer□ Hotplate or stove burner□ Measuring spoons (if no balance)
□ Sodium carbonate (from session II-1)□ Sodium chloride (table salt)□ Sucrose (table sugar)□ Distilled water□ Ice (crushed or chipped)
Concepts and Vocabulary
□ Colligative properties of solutions
□ Vapor pressure reduction
□ Boiling point elevation
□ van't Hoff factor
□ Molar and molal solutions
□ Freezing point depression
□ Osmotic pressure
Background
Colligative properties of solutions are those affected by the number of solute particles (ions, atoms, molecules, or accretions of multiple molecules) in a solution rather than by the type of solute particles present. There are three colligative properties: vapor pressure reduction, freezing point depression, and osmotic pressure.
Vapor pressure reduction occurs as the number of solute particles in a solution increases. In effect, some solute particles displace solvent particles at the surface of the solution (the liquid-gas boundary), making fewer solvent particles available for vaporization and thereby reducing the vapor pressure.
Boiling point elevation is sometimes considered a separate colligative property, but is in fact a special case of vapor pressure reduction. The boiling point is reached at the temperature
Copyright © 2013 by The Home Scientist, LLC Revision 1.0.7 – 10 January 2013
The Home Scientist, LLC CK01A Instruction Manual 61
where the vapor pressure of the liquid matches the pressure of the gas at the liquid-gas boundary. Because the presence of solute particles reduces the vapor pressure of the solution, it also increases the boiling point of the solution. Boiling point elevation (ΔTb or ΔTbp) is the product of the van't Hoff factor (i) of the solute, the boiling point elevation constant (also called the ebullioscopic constant) of the solvent (Kb or Kbp), and the molality (m) of the solution, and can be expressed as the formula ΔT = iKbm.
Note: The van't Hoff factor depends on the nature of the solute, and takes into account the fact that different solutes behave differently in solution. Ionic solutes dissociate in solution, and therefore have van't Hoff factors greater than 1. (For example, one molecule of sodium chloride in aqueous solution dissociates fully into two particles, one Na+ ion and one Cl- ion, so sodium chloride has a van't Hoff factor of 2.) Some solutes, such as sucrose in water, do not dissociate, and therefore have van't Hoff factors of exactly 1. A few solutes associate in solution, yielding fewer individual particles than the molality of the solution suggests. These solutes have van't Hoff factors of less than 1. Some solutes, such as weak acids and bases in aqueous solution, dissociate partially, giving fractional van't Hoff factors, typically greater than 1 but less than 2.
The van't Hoff factor depends on both solvent and solute. For example, when hydrogen chloride (HCl) gas dissolves in water it dissociates completely into H+ and Cl- ions, giving a van't Hoff factor of 2. Conversely, when HCl gas dissolves in benzene it remains in molecular form, giving a van't Hoff factor of 1 for that combination of solvent and solute.
One familiar application of vapor pressure reduction is the use of anti-freeze (which could just as easily be called anti-boil) in automobile radiators. The addition of high-boiling ethylene glycol and similar chemicals to the water in the radiator raises the boiling point of the solution above that of pure water, reducing the likelihood of the radiator boiling over.
Freezing point depression occurs as the number of solute particles in a solution increases. One familiar application of freezing point depression is the application of road salt (usually sodium chloride or calcium chloride) to melt ice on streets and sidewalks. As the ice dissolves the salt (yes, one solid can dissolve another solid) the solid ice is converted to a liquid solution of the salt, because the solution has a lower freezing point than the essentially pure water that makes up the ice. Freezing point depression is calculated in the same way as boiling point elevation, but substituting the freezing point depression constant (Kf or Kfp) for the boiling point elevation constant. Because the freezing point depression constant is conventionally expressed as an unsigned value, the formula for calculating freezing point depression, ΔT = -(iKfm), adds a negative sign to indicate the reduction in freezing point.
Osmotic pressure occurs when a differential concentration of solute particles causes pressure to be exerted across a semipermeable membrane. The phenomenon of osmotic pressure is exploited in many chemical and industrial processes as well as in medical procedures such as kidney dialysis, not to mention such routine bodily functions as your kidneys extracting waste products from your bloodstream. The behavior of solutions under osmotic pressure resembles the behavior of gases. In fact, the formula for calculating osmotic pressure uses the ideal gas constant: π = (niRT)/V, where π is the osmotic pressure, n the moles of solute, i the van't Hoff constant, R the ideal gas constant, T the absolute temperate in kelvins, and V the volume.
Colligative properties change with changing concentration of a solution. For most procedures, chemists use molarity (moles per liter of solution or mol/L) to specify concentration, but when
Copyright © 2013 by The Home Scientist, LLC Revision 1.0.7 – 10 January 2013

The Home Scientist, LLC CK01A Instruction Manual 62
working with colligative properties molality (moles per kilogram of solvent or mol/kg) is a more useful metric because molality can be determined with extreme accuracy using only an analytical balance and because molality does not change with increasing or decreasing volume as the solution is heated or cooled.
In this laboratory, we'll examine two of the three colligative properties of solutions: freezing point depression and the special case of vapor pressure reduction known as boiling point elevation.
A dissolved solute increases the boiling point of a solvent by an amount proportional to the quantity of the solute, and decreases the freezing point of that solvent, also by a (different) amount proportional to the quantity of solute. The same formula is used to calculate either value, except that a negative sign is added for freezing point depression to account for the fact that the freezing point is lowered rather than raised.
Boiling point elevation = ΔTb = iKbm
Freezing point depression = ΔTf = -(iKfm)
In fact, freezing point depression constants, Kf or Kfp, are sometimes specified as negative signed values, eliminating the need to reverse the sign in the formula. In either case, the calculations are done the same way for boiling point elevation and freezing point depression. Only the values of the constants differ.
We'll use water as our solvent. The Kb for water is 0.512 °C/molal and the Kf for water is 1.858 °C/molal. In other words, assuming a van't Hoff factor of 1 for the solute, a 1 molal solution has a boiling point 0.512 °C higher than pure water, and a freezing point 1.858 °C lower. A 2 molal solution has a boiling point 1.024 °C higher than pure water, and a freezing point 3.716 °C lower. And so on.
Goals
This lab session has the following goals:
□ Quantify the effect on freezing points of adding various solutes to water
□ Quantify the effect on boiling points of adding various solutes to water
□ Determine van't Hoff factors experimentally
Procedure
This lab session has three parts. In Part I, we'll determine the actual boiling point of pure water under current conditions. In Part II, we'll make up solutions of various solutes at various molalities. In Part III, we'll measure the actual freezing points and boiling points of those solutions and use determine how closely our experimental data corresponds to known values.
Note: If you have not completed lab session II-1, you will need to calibrate your thermometer as described in Part II of that lab session.
Copyright © 2013 by The Home Scientist, LLC Revision 1.0.7 – 10 January 2013

The Home Scientist, LLC CK01A Instruction Manual 63
Part I – Determine the actual boiling point of pure water
The nominal boiling point of pure water at standard pressure is 100.00 °C, but the actual boiling point varies significantly with changes in atmospheric pressure. For this experiment it's important to know the actual boiling point under current conditions, so our first step is to determine that actual boiling point.
Note: If you are doing this lab session within an hour or two of when you did lab session II-1, you can skip this part of the lab session and use the actual boiling point you determined in the earlier lab session.
1. If you have not done so already, put on your goggles and gloves. Review the hazards of each chemical you will use.
2. Use the graduated cylinder to transfer 100 mL of distilled water to the 250 mL beaker.
3. Place the beaker on the hotplate, using the wire gauze to protect the beaker from direct contact with the hot surface, and bring the water to a full boil.
4. With the water at a full boil, immerse the thermometer to a depth of about 76mm (3") and stir gently for a few seconds. Note the temperature reading, apply any offset you determined when calibrating the thermometer, and record the actual boiling point of water in your lab notebook. Turn off the heat and allow the beaker to begin cooling.
Part II – Make up molal solutions
The next step is to make up solutions of various solutes at various molalities.
Note: If you have a balance, you can increase the accuracy of your results by weighing out both the water (use 100.00 g for each solution) and the solutes.
1. If you have not done so already, put on your goggles and gloves. Review the hazards of each chemical you will use.
2. Label six foam cups as follows:
A. Sodium carbonate, 1 molal
B. Sodium carbonate, 2 molal
C. Sodium chloride, 1 molal
D. Sodium chloride, 2 molal
E. Sucrose, 1 molal
F. Sucrose, 2 molal
3. Using the graduated cylinder, transfer 100 mL of distilled water to each of the cups. You can use the water from Part I in one of the cups. If you have a balance, transfer 100.00 grams of water rather than 100 mL.
4. Carefully weigh (or measure) the following amounts of chemicals and transfer them to the corresponding cups:
A. 10.60 grams (3 level teaspoons) sodium carbonate
B. 21.20 grams (6 level teaspoons) sodium carbonate
C. 5.84 grams (about 7/8 or 13/16 level teaspoons) sodium chloride
Copyright © 2013 by The Home Scientist, LLC Revision 1.0.7 – 10 January 2013

The Home Scientist, LLC CK01A Instruction Manual 64
D. 11.69 grams (about 1-5/8 or 1-11/16 level teaspoons) sodium chloride
E. 34.23 grams (about 7-1/8 level teaspoons) sucrose
F. 68.46 grams (about 14-1/4 or level teaspoons) sucrose
5. Swirl or stir each cup to dissolve the solid matter, and place all of the cups in the refrigerator to cool down.
6. Prepare an ice-salt bath by filling a foam cup about half full of crushed or chipped ice. Cover the ice surface with a layer of salt about 10mm to 15mm (1/2") thick, and stir the salt into the ice.
Note: This is an interesting and elegant application of the phenomenon of freezing point depression to investigate itself. A standard ice bath stabilizes at 0° C. The salt we add dissolves in the ice, lowering its freezing point to below 0° C.
If you work quickly to test the freezing points of the various solutions, you can simply leave your ice-salt bath on the work surface. If there will be a delay, place the ice-salt bath in the freezer. Standard freezers reach a temperature of -10° C to -20° C, which is sufficiently cold for our purposes.
7. Half-fill a clean, dry test tube with the chilled solution from cup C. Immerse the test tube deeply into the ice-salt bath, and stir the contents of the tube with the thermometer. Periodically examine the tube for evidence of ice crystal formation. When ice crystals just begin to form in the tube, note the temperature and record it in your lab notebook as the freezing point of that solution. Empty the solution from the test tube back into cup A. Leave the cup outside the refrigerator so it can begin to warm up.
8. Repeat step 7 to determine the freezing points of solutions D, E, and F.
9. Transfer the contents of cup A to the 250 mL beaker. Place the beaker on the hotplate, using the wire gauze to protect the beaker from direct contact with the hot surface, and bring the solution to a full boil. When the solution reaches a full boil, use the thermometer to determine its temperature. Record that value in your lab notebook.
10.Repeat step 9 to determine the boiling points of solutions B, C, D, E, and F.
Clean-up and Disposal
None of the solutions used in this experiment are particularly hazardous. You can dump the contents of the cups and beaker into the sink, flushing with copious water. Wash and dry the equipment.
Review Questions
1. Why did we obtain boiling point elevation data for the solutions in cups A, B, C, D, E, and F, but freezing point depression data for only the solutions in cups C, D, E, and F?
2. Name and define the unit of concentration used in calculating values for colligative properties of solutions. Why is this unit of concentration used rather than molarity?
3. The Kbp for H2O is 0.512 °C/molal. Applying this value and the van't Hoff factors for sodium carbonate (3), sodium chloride (2), and sucrose (1) to the boiling point elevation values you obtained, calculate the formula weights of sodium carbonate, sodium chloride, and sucrose.
Copyright © 2013 by The Home Scientist, LLC Revision 1.0.7 – 10 January 2013

The Home Scientist, LLC CK01A Instruction Manual 65
4. The Kfp for H2O is 1.858 °C/molal. Applying this value and the van't Hoff factors for sodium chloride (2) and sucrose (1) to the freezing point depression values you obtained, calculate the formula weights of sodium chloride and sucrose.
5. What effect on boiling point would you expect if you dissolved sufficient ethanol in water to produce a 1 molal solution? (Hint: examine a properties table for ethanol on Wikipedia or elsewhere)
6. What effect on freezing point would you expect if you dissolved sufficient ethanol in water to produce a 1 molal solution?
7. In the early days of automobiles, methanol was used universally as an antifreeze. In 1937, antifreeze solutions based on ethylene glycol were introduced, and quickly gained almost 100% market share, despite the fact that they cost much more than methanol. Propose an explanation for this rapid adoption of ethylene glycol antifreeze solutions. (Hint: look up the physical properties of methanol and ethylene glycol.)
Copyright © 2013 by The Home Scientist, LLC Revision 1.0.7 – 10 January 2013

The Home Scientist, LLC CK01A Instruction Manual 66
IIIChemical Reactions and Stoichiometry
A chemical reaction is a process during which one or more original substances (called reactants) are converted to one or more different substances (called products). A chemical reaction may occur quickly (such as a firecracker exploding) or slowly (such as iron rusting). Some chemical reactions occur spontaneously at normal temperatures and pressures, as soon as the reactants are brought into contact with each other. Other chemical reactions occur only if external energy is supplied in the form of heat, light, or an electrical spark.
Chemical reactions are categorized by reaction type.
Composition reaction
A composition reaction, also called a combination reaction or a synthesis reaction, occurs when two or more reactants combine to yield one or more products. Composition reactions take the general form A + B → AB, where the reactants A and B may be elements or compounds and the compound AB is the resulting product. For example, if you heat a mixture of iron filings (A) and sulfur (B), those two elements react to form iron sulfide (AB).
Note: Although it is sometimes considered a separate type of reaction, a combustion reaction is really just a type of composition reaction. In a combustion reaction, a substance combines vigorously with oxygen, releasing energy in the process. For example, when you light a candle, you initiate a combustion reaction, and the energy manifests as heat and light, making the flame you see. A combustion reaction can be thought of as a fast oxidation reaction, in the sense that a substance is combining rapidly with oxygen. (Iron rusting or bread growing stale are examples of slower oxidation reactions.)
However, chemists no longer use the term oxidation to refer exclusively to reactions in which a substance combines with oxygen. Instead, oxidation is used in a more general sense to refer to a class of reactions which may not involve oxygen at all.
Decomposition reaction
A decomposition reaction occurs when one reactant is broken down into two or more products, usually by the application of heat. Decomposition reactions take the general
Copyright © 2013 by The Home Scientist, LLC Revision 1.0.7 – 10 January 2013

The Home Scientist, LLC CK01A Instruction Manual 67
form AB → A + B, where the compound AB is the reactant and the products A and B may be elements or compounds. For example, if you heat sodium hydrogen carbonate (sodium bicarbonate or baking soda, NaHCO3), it breaks down into sodium carbonate (Na2CO3), carbon dioxide (CO2), and water (H2O). In this example, the general form AB → A + B is expanded to ABC → A + B + C or, more precisely, 2 ABC → A + B + C, where ABC is sodium bicarbonate, A is sodium carbonate, B is carbon dioxide, and C is water. The balanced equation for this reaction is:
2 NaHCO3 → Na2CO3 + CO2 + H2O
Note: In practice, the actual products from the decomposition of sodium hydrogen carbonate depend on the temperature and duration of heating. At higher temperatures and longer durations, the products are indeed anhydrous sodium carbonate, carbon dioxide gas and water vapor. At lower temperatures and durations, some or all of the water may be retained by the sodium carbonate as water of hydration.
This variation in products is common to decomposition reactions, particularly if the reactant is a complex organic compound. For example, the products of the decomposition of sucrose (table sugar) by heating depend on the temperature and duration. Heat sucrose gently and you get caramel. Heat sucrose intensely (or decompose it with concentrated sulfuric acid), and you end up with nothing more than carbon, carbon dioxide, and water.
A displacement reaction, also called a replacement reaction, occurs when two or more reactant substances recombine to form two or more different products.
Single displacement reaction
In a single displacement reaction, a more active element displaces a less active element in a compound, forming a new compound that incorporates the more active element and releasing the less active element in elemental form. Single displacement reactions take the general form A + BX → AX + B, where A is the more active element, B is the less active element, and X is an anion (such as chloride, sulfate, or nitrate). For example, if you react sodium metal (Na) with hydrochloric acid (HCl), the more active sodium displaces the less active hydrogen, according to the following balanced equation:
2 Na + 2 HCl → 2 NaCl + H2
Double displacement reaction
In a double displacement reaction, also called a metathesis reaction, two compounds exchange elements or ionic species with each other. Double displacement reactions take the general form AX + BY → AY + BX, where A and B are cations and X and Y are anions. If AX and BY are both freely soluble and (for example) AY is insoluble, combining solutions of AX and BY results in a precipitate. For example, if you react lead(II) acetate (CH3COOPb) with potassium iodide (KI), the lead ions react with the iodide ions to form a precipitate of lead(II) iodide (PbI2), while the potassium ions and acetate ions remain in solution. Evaporating the water from that solution yields solid potassium acetate (CH3COOK).
Copyright © 2013 by The Home Scientist, LLC Revision 1.0.7 – 10 January 2013
The Home Scientist, LLC CK01A Instruction Manual 68
CH3COOPb + 2 KI → PbI2 + CH3COOK
Stoichiometry
Stoichiometry (pronounced STOY-kee-AHM-uh-tree) deals with the quantitative relationships that exist among reactants and products in chemical reactions. A balanced chemical equation represents the number of molecules (or moles) of each reactant that react to form the number of molecules (or moles) of each product.
Any of the reaction types we've mentioned can be represented by stoichiometrically balanced equations. For example, the decomposition reaction of sodium hydrogen carbonate into sodium carbonate, carbon dioxide, and water can be represented as:
NaHCO3(s) → Na2CO3(s) + CO2(g) + H2O(g)
But notice that the left (reactant) side of this equation has one atom each of sodium (Na), hydrogen (H), and carbon (C), and three atoms of oxygen (O), while the right (product) side has twice as many of each type of atom. This equation violates the conservation of matter principle, because these additional atoms on the right side of the equation cannot have been created from nothing.
To fix the problem, we must balance the equation. A balanced equation has the same number of atoms of each type on each side of the equation. Since our unbalanced equation had twice the number of each type of atom on the right side as on the left, we can balance this equation simply by doubling the left side, to yield the balanced equation:
2 NaHCO3(s) → Na2CO3(s) + CO2(g) + H2O(g)
This balanced equation tells us that two molecules (or two moles) of sodium bicarbonate (NaHCO3) react to form one molecule (or one mole) each of sodium carbonate (Na2CO3), carbon dioxide (CO2), and water (H2O).
Stoichiometry can be used to calculate the mass of the product or products that result from reacting a specific mass of reactant or reactants. Such calculations give us the theoretical yield of the product(s), which assumes that the reaction proceeds to completion, with all reactants converted to products. By substituting the gram-molecular masses of the reactants and products, we can convert our balanced equation to uses masses rather than moles. The gram-molecular masses for our reactants and products are as follows:
Sodium bicarbonate: 84.007 g/mol
Sodium carbonate: 105.989 g/mol
Carbon dioxide: 44.010 g/mol
Water: 18.015 g/mol
So, if we react two moles of sodium bicarbonate to form one mole of sodium carbonate, one mole of carbon dioxide, and one mole of water, we can rewrite our balanced equation as follows:
2 (84.007 g) → (105.989 g) + (44.010 g) + (18.015 g)
The total mass on both sides of the equation is 168.014 grams. So, if we react 168.014 g of sodium bicarbonate, we can expect to produce 105.989 g of sodium carbonate, 44.010 g of carbon dioxide, and 18.015 g of water.
Copyright © 2013 by The Home Scientist, LLC Revision 1.0.7 – 10 January 2013

The Home Scientist, LLC CK01A Instruction Manual 69
In the real world, things aren't quite that simple. Rather than the theoretical (100%) yield, a real-world reaction always has an actual yield lower than theoretical. Reactants are never 100% pure. No actual reaction proceeds to completion with 100% of the reactants being converted to products. And so on.
The actual yield of some reactions closely approaches theoretical yield. Such reactions are said to proceed quantitatively. Our thermal decomposition of sodium bicarbonate is one example of such a reaction. Other reactions have actual yields much lower than theoretical, but may still be useful, particularly for synthesizing very high value products. For example, a process for synthesizing a pharmaceutical may involve a reaction that has an actual yield of only 10%. Despite that low percentage yield the reaction is still useful because the reactants are inexpensive and the product may be literally worth its weight in gold.
To further complicate matters, although most reactions are stoichiometric, not all are. In a non-stoichiometric reaction, the proportions of reactants and products are not fixed. For example, in the stoichiometric reaction between sodium and chlorine, one mole of sodium always reacts with exactly one mole of chlorine to form exactly one mole of sodium chloride. But in the non-stoichiometric reaction between iron and sulfur a variable number of moles of iron may react with a variable number of moles of sulfur to yield a variable number of moles of an iron sulfide compound whose chemical formula varies with the starting amounts of each reactant and the reaction conditions.
The laboratory sessions in this group explore various aspects of these types of chemical reactions.
Copyright © 2013 by The Home Scientist, LLC Revision 1.0.7 – 10 January 2013

The Home Scientist, LLC CK01A Instruction Manual 70
Topic III. Chemical Reactions and StoichiometrySession III-1: Observe a Composition Reaction
Advance Preparation:
Session:
None
10 minutes
Materials from Kit
□ Goggles□ Test tube clamp
□ Iron wool
Materials You Provide
□ Gloves□ Butane lighter (or other flame source)
□ Sheet of white paper
Concepts and Vocabulary
□ Composition reaction
□ Oxidation
Background
A composition reaction occurs when two or more reactants combine to yield one or more products. For example, one atom of sodium can react with one atom of chlorine to produce one molecule of sodium chloride, NaCl. Two atoms of hydrogen can react with one atom of oxygen to produce one molecule of water, H2O.
In this lab session, we'll run a composition reaction using iron and oxygen (from the atmosphere) as the reactants to produce iron oxides.
Goals
This lab session has the following goal:
□ To observe a composition reaction
Procedure
Warning: We ran this experiment without mishaps, but burning iron wool is hot enough to ignite paper. Keep a fire extinguisher or a container of water handy.
1. If you have not done so already, put on your goggles and gloves. Review the hazards of each chemical you will use.
2. Using the test tube clamp to hold a small tuft of iron wool over a sheet of white paper. Spread the iron wool to separate and expose the strands.
3. Ignite the butane lighter or other flame source and heat the iron wool with the tip of the flame. Hold the burning iron wool over the paper to collect the reaction product(s). Record your observations in your lab notebook.
Note: If the iron wool doesn't burn, you need a hotter flame. We were successful with a
Copyright © 2013 by The Home Scientist, LLC Revision 1.0.7 – 10 January 2013

The Home Scientist, LLC CK01A Instruction Manual 71
standard butane lighter. If that doesn't work for you, try using a torch butane lighter, a gas stove burner, or a propane torch.
Clean-up and Disposal
All the products produced in this lab session are nonhazardous and can be discarded with household garbage.
Review Questions
1. What did you observe?
2. Using Wikipedia or another reference as needed, write a balanced equation or equations for the combination reaction of iron and oxygen that you observed.
3. Is the reaction you observed similar to iron rusting? Why or why not?
4. Why aren't iron fires more common?
Copyright © 2013 by The Home Scientist, LLC Revision 1.0.7 – 10 January 2013

The Home Scientist, LLC CK01A Instruction Manual 72
Topic III. Chemical Reactions and StoichiometrySession III-2: Observe a Decomposition Reaction
Advance Preparation:
Session:
None
15 to 30 minutes
Materials from Kit
□ Goggles□ Beaker, 250 mL glass□ Stirring rod□ Wire gauze
□ Barium nitrate solution□ Cobalt chloride test paper□ Wood splints
Materials You Provide
□ Gloves□ Hotplate (or stove burner)
□ Butane lighter (or other flame source)□ Sodium bicarbonate (baking soda)
Concepts and Vocabulary
□ Decomposition reaction
□ Burning splint test for carbon dioxide
□ Barium nitrate test for carbon dioxide
□ Cobalt chloride test for water
Background
In Topic II, we heated sodium bicarbonate in the oven to produce sodium carbonate, carbon dioxide gas and water vapor, according to the following balanced equation:
2 NaHCO3 → Na2CO3 + CO2 + H2O
Of the three products that resulted from the decomposition reaction, only one was obvious. The sodium carbonate powder remained after heating, but the carbon dioxide and water were driven off as invisible gases.
In this lab session, we'll repeat the decomposition reaction of sodium bicarbonate, but this time we'll test for the presence of the “invisible” reaction products, as follows:
We'll test for the presence of carbon dioxide gas by immersing a burning splint into the reaction vessel. Carbon dioxide gas is denser than air, and so tends to remain in the vessel. Carbon dioxide gas does not support combustion, so a burning splint introduced into a vessel whose atmosphere is all or mostly carbon dioxide gas is extinguished immediately.
Note: Carbon dioxide is not the only gas that does not support combustion; in fact, many gases do not. However, carbon dioxide is the only common gas produced by simple chemical reactions that extinguishes a burning splint.
If the splint test indicates the presence of carbon dioxide, we'll run a confirmatory test. Barium ions react with carbon dioxide to form extremely insoluble barium carbonate, which is white. By introducing a stirring rod that has one drop of clear barium nitrate solution on its tip into the
Copyright © 2013 by The Home Scientist, LLC Revision 1.0.7 – 10 January 2013

The Home Scientist, LLC CK01A Instruction Manual 73
reaction vessel, we can confirm the presence of carbon dioxide. If carbon dioxide is absent, the barium nitrate drop remains clear. If carbon dioxide is present, it dissolves in the droplet to form carbonate ions, which react immediately to form barium carbonate, giving the drop a cloudy appearance.
To test for water, we'll use cobalt chloride test paper. In anhydrous (water-free) form, cobalt chloride is bright blue. In the presence of water, cobalt chloride forms a pinkish complex. (This is the basis of desiccant packs that are blue when dry and turn pink when they need to be heated to be refreshed.) Touching a dry (blue) strip of cobalt chloride paper to liquid water immediately causes the strip to turn pink.
Note: The cobalt chloride strips supplied with the kit were in their dry (blue) form when shipped. However, they can absorb water from the atmosphere and turn pink. If your strips are pink, you can heat them in the oven or with a hair dryer briefly to return them to their blue, anhydrous form. In fact, if you wish, you can recycle the strip you use in this lab session by heating it until it turns back to blue.
Goals
This lab session has the following goals:
□ Observe a decomposition reaction
□ Use the burning splint test to identify the presence of carbon dioxide
□ Use the barium nitrate test to confirm the presence of carbon dioxide
□ Use the cobalt chloride test to identify the presence of water
Procedure
1. If you have not done so already, put on your goggles and gloves. Review the hazards of each chemical you will use.
2. Transfer a tablespoon or two of sodium bicarbonate to the clean, dry glass beaker.
3. Ignite a wood splint, dip it well into the beaker, and hold it there for a few seconds. (If you're uncomfortable holding the burning splint directly, use the test tube holder.) Remove the splint and, if necessary, blow it out. Retain the splint for future use. Record your observations in your lab notebook.
4. Place the beaker on the hotplate, using the wire gauze to protect the beaker from direct contact with the heating surface.
5. Set the hotplate to medium heat and observe the beaker. Record your observations in your lab notebook.
6. When you see a mist/droplets beginning to appear around the inner top edge of the beaker, touch a piece of dry (blue) cobalt chloride test paper to that area of the beaker. Record your observations in your lab notebook.
7. Reignite the wood splint and dip it into the beaker. Record your observations in your lab notebook.
8. Dip the clean, dry stirring rod into the barium nitrate solution to capture a drop of solution on the tip of the stirring rod. Hold the stirring rod with the tip well into the beaker and observe the droplet on its tip. Record your observations in your lab
Copyright © 2013 by The Home Scientist, LLC Revision 1.0.7 – 10 January 2013

The Home Scientist, LLC CK01A Instruction Manual 74
notebook.
Clean-up and Disposal
Wash and dry the equipment. All the products produced in this lab session are nonhazardous and can be discarded with household garbage or flushed down the drain with water. (Barium is toxic, but the tiny amount of barium carbonate produced by the carbon dioxide test is safe to dispose of with household waste.)
Review Questions
1. What did you observe when you dipped the burning splint into the beaker before you began heating the sodium bicarbonate? What do you conclude about the atmosphere in the beaker at that point?
2. What did you observe when you touched the blue cobalt chloride paper to the mist/droplets that formed at the top of the beaker. What do you conclude?
3. What did you observe when you dipped the burning splint into the beaker after you heated the sodium bicarbonate? What do you conclude about the atmosphere in the beaker at that point?
4. What did you observe when you inserted the stirring rod with the droplet of barium nitrate into the beaker. What do you conclude?
Copyright © 2013 by The Home Scientist, LLC Revision 1.0.7 – 10 January 2013

The Home Scientist, LLC CK01A Instruction Manual 75
Topic III. Chemical Reactions and StoichiometrySession III-3: Observe a Single Replacement Reaction
Advance Preparation:
Session:
None
30 minutes
Materials from Kit
□ Goggles□ Pipettes□ Reaction plate, 96-well□ Test tube
□ Copper(II) sulfate solution□ Iron wool□ Potassium ferricyanide solution
Materials You Provide
□ Gloves
Concepts and Vocabulary
□ Single replacement (displacement) reaction
□ Ferricyanide test for iron(II) ions
Background
In a single replacement reaction, a more active element displaces a less active element in a compound, forming a new compound that incorporates the more active element and releasing the less active element in elemental form.
In this lab session, we'll perform a single-replacement reaction using iron and copper(II) sulfate solution. Iron is more reactive than copper, so we expect the iron to go into solution to form iron(II) sulfate, displacing the copper in the solution as free elemental copper. The free copper will deposit as a coating of copper metal on the iron wool.
To verify that iron metal has been oxidized to iron(II) ions, we'll use the ferricyanide test. In aqueous solutions, iron(II) ions react with the ferricyanide ions in potassium ferricyanide to produce an insoluble deep blue compound called Prussian Blue. A blue precipitate upon adding potassium ferricyanide confirms the presence of iron(II) ions in the solution.
Goals
This lab session has the following goals:
□ Observe a single replacement reaction
□ Use the ferricyanide test to detect the presence of iron(II) ions in the reaction vessel
□ Observe the progress of the reaction by periodic testing
Procedure
1. If you have not done so already, put on your goggles and gloves. Review the hazards of each chemical you will use.
Copyright © 2013 by The Home Scientist, LLC Revision 1.0.7 – 10 January 2013

The Home Scientist, LLC CK01A Instruction Manual 76
2. Transfer about 1 mL of copper(II) sulfate solution to a test tube, and one drop of copper(II) sulfate solution to well A1 of the 96-well reaction plate.
3. Transfer a small tuft of iron wool to the test tube. Use the pipette tip to press the cotton wool down in the tube until it is immersed in the copper sulfate solution. Observe the reaction, noting any change of appearance in the iron wool and/or copper(II) sulfate solution.
4. After one minute or so, use the pipette to withdraw one drop of solution from the test tube and transfer it to well A2 of the reaction plate. Note any visible changes in the reaction vessel in your lab notebook.
5. Continue to observe the reaction. After about five minutes, withdraw one drop of the solution from the test tube and transfer it to well A3 of the reaction plate. Note any visible changes in the reaction vessel in your lab notebook.
6. Repeat step 5 every five minutes until you have reached a total reaction time of 30 minutes or until the blue color of the solution disappears, whichever comes first. Record your final observations of the reaction in your lab notebook.
7. Transfer one drop of potassium ferricyanide solution to well A1. Record your observations in your lab notebook.
8. Repeat step 7 for the other occupied wells in the reaction plate.
Clean-up and Disposal
Wash and dry the equipment, using a cotton swab to clean the wells in the reaction plate. All the products produced in this lab session are nonhazardous and can be flushed down the drain with water.
Review Questions
1. What changes did you observe in the reaction vessel as the reaction progressed? How do you explain any observed changes?
2. What conclusions do you draw from the results of the ferricyanide test on the various wells of the reaction plate?
3. What result would you expect if you immersed copper metal in a solution of iron(II) sulfate? Why?
4. What result would you expect if you immersed magnesium metal in a solution of iron(II) sulfate? Why? (Hint: check Wikipedia or another source for the reactivity series of metals.)
5. What result would you expect if you immersed aluminum metal in hydrochloric acid? Why? (Hint: check Wikipedia or another source for the reactivity series of metals, including hydrogen.)
Copyright © 2013 by The Home Scientist, LLC Revision 1.0.7 – 10 January 2013

The Home Scientist, LLC CK01A Instruction Manual 77
Topic III. Chemical Reactions and StoichiometrySession III-4: Observe Double Replacement Reactions
Advance Preparation:
Session:
None
90 to 120 minutes
Materials from Kit
□ Goggles□ Beakers, plastic□ Pipettes□ Reaction plates, 24-well and 96-well□ Spatula□ Barium nitrate, 0.1M□ Calcium nitrate, 0.1M□ Copper(II) sulfate, 1M□ Iron(II) sulfate, 0.1M□ Iron(III) chloride, 0.1M□ Lead(II) acetate, 0.1M□ Hydrochloric acid, 6.0M
□ Magnesium sulfate□ Oxalic acid, 0.5M□ Phosphoric acid, 1.0M□ Potassium bromide, 0.1M□ Potassium dichromate, 0.1M□ Potassium ferricyanide, 0.1M□ Potassium iodide, 0.1M□ Sodium carbonate, 1.0M□ Sodium ferrocyanide, 0.1M□ Sodium hydroxide, 6.0M□ Sodium sulfide, 0.1M
Materials You Provide
□ Gloves□ Desk lamp or other strong light source
□ Sheets of white and black paper□ Distilled water
Concepts and Vocabulary
□ Double replacement (displacement) reaction
□ Ions
□ State change
□ Solvation
Background
In an aqueous double replacement reaction (or metathesis reaction) two compounds dissociate in solution to form ions. Depending on the particular ions present and their concentrations, a reaction may or may not occur.
For example, if you combine dilute solutions of barium chloride (BaCl2) and ammonium nitrate (NH4NO3), no obvious change occurs. The solution simply contains a mixture of both cations (Ba2+ and NH4+) and both anions (Cl- and NO3-). But if you mix concentrated solutions of these two compounds, a reaction does occur. Barium nitrate, Ba(NO3)2, which is much less soluble than the other possible ionic combinations—BaCl2, NH4NO3, and NH4Cl—precipitates out as solid crystals, leaving the ammonium and chloride ions in solution.
So, how do you know if a reaction has occurred? Formation of a precipitate is one sure sign, as is evolution of a gas. In both of these cases, a state change has occurred and a new substance can be isolated (by filtering the precipitate or capturing the gas, respectively).
Copyright © 2013 by The Home Scientist, LLC Revision 1.0.7 – 10 January 2013

The Home Scientist, LLC CK01A Instruction Manual 78
Surprisingly, a color change is not necessarily evidence of a reaction, or at least of a reaction that will provide isolatable products. For example, copper(II) sulfate in solution is a pure blue color, which results from the copper(II) ions being solvated by (loosely bound to) water molecules. Adding a solution that contains chloride ions to the copper(II) sulfate solution causes the blue color to shift to a greenish color, which is caused by the copper(II) ions forming a transient complex with chloride ions.
In this lab session, we will test dilute solutions of the following eight cations:
□ Barium(II) or Ba2+ (from barium nitrate solution)
□ Calcium(II) or Ca2+ (from calcium nitrate solution)
□ Copper(II) or Cu2+ (from copper(II) sulfate solution)
□ Hydrogen or H+ (from hydrochloric solution)
□ Iron(II) or Fe2+ (from iron(II) sulfate solution)
□ Iron(III) or Fe3+ (from iron(III) chloride solution)
□ Lead(II) or Pb2+ (from lead(II) acetate solution)
□ Magnesium or Mg2+ (from magnesium sulfate solution)
against the following twelve anions:
□ Bromide or Br- (from potassium bromide solution)
□ Carbonate or CO32- (from sodium carbonate solution)
□ Chloride or Cl- (from hydrochloric acid solution)
□ Dichromate or Cr2O72- (from potassium dichromate solution)
□ Ferricyanide or [Fe(CN)6]3- (from potassium ferricyanide solution)
□ Ferrocyanide or [Fe(CN)6]4- (from sodium ferrocyanide solution)
□ Hydroxide or OH- (from sodium hydroxide solution)
□ Iodide or I- (from potassium iodide solution)
□ Oxalate or C2O42- (from oxalic acid solution)
□ Phosphate or PO43- (from phosphoric acid solution)
□ Sulfate or SO42- (from magnesium sulfate solution)
□ Sulfide or S2- (from sodium sulfide solution)
to determine if a reaction occurs.
Goals
This lab session has the following goal:
□ Observe double-replacement reactions
Procedure
This lab session has two parts. In Part I, we'll prepare some solutions and populate the 96-well reaction plate. In Part II, we'll react our eight cation solutions with our twelve anion solutions.
Copyright © 2013 by The Home Scientist, LLC Revision 1.0.7 – 10 January 2013
The Home Scientist, LLC CK01A Instruction Manual 79
Part I – Prepare solutions
Most of the solutions we'll use are provided in 0.1M concentrations, but several are provided as higher concentrations, and one (magnesium sulfate) is provided as a solid. For consistency, we want to use all 0.1M solutions, so as the first step, we'll prepare ~ 0.1M dilutions of each of these chemicals, storing them temporarily in wells of the 24-well reaction plate. As a matter of good practice, we'll keep the acids, bases, and salts segregated from each other.
Note: This lab session provides many opportunities for contaminating one solution with another. To avoid doing so, rinse pipettes thoroughly before using them with a different solution.
Set up three beakers, two filled with tap water and one with distilled water. When you finish using a pipette with one solution, expel all of that solution back into the original container. Then rinse the pipette in the first tap water beaker by immersing the tip fully in the tap water and drawing up and expelling the tap water several times. Repeat this procedure with the second tap water beaker, and finally with the distilled water beaker. When you finish the distilled water rinse, expel all liquid from the pipette and set it aside for reuse.
1. If you have not done so already, put on your goggles and gloves. Review the hazards of each chemical you will use.
2. The kit provides 6M hydrochloric acid, which we want to dilute to ~ 0.1M (a factor of 60:1). For higher accuracy, we'll do this dilution in two steps: first, use a pipette to transfer 1.25 mL of distilled water to well A1 of the 24-well reaction plate. (Retain this pipette for use only with distilled water.) Use a clean pipette to transfer 0.25 mL of 6M hydrochloric acid to well A1. Stir the solution with the pipette tip and draw it up and expel it several times with the pipette to mix the solution thoroughly. Record the contents of well A1 in your lab notebook as 1M hydrochloric acid.
3. Fill well B1 of the 24-well reaction plate with 2.25 mL of distilled water and 0.25 mL of 1M hydrochloric acid (from well A1). Stir the solution with the pipette tip and draw it up and expel it several times with the pipette to mix the solution thoroughly. Record the contents of well B1 in your lab notebook as 0.1M hydrochloric acid.
4. Repeat step 3, filling well C1 with 1.0 mL of distilled water and 0.25 mL of 0.5M oxalic acid to produce 0.1M oxalic acid.
5. Repeat step 3, filling well D1 with 2.25 mL of distilled water and 0.25 mL of 1.0M phosphoric acid to produce 0.1M phosphoric acid.
6. Repeat step 3, filling well A4 with 2.25 mL of distilled water and 0.25 mL of 1.0M copper(II) sulfate to produce 0.1M copper(II) sulfate.
7. Transfer 2.5 mL of distilled water to well D4 and add about a quarter of a spatula spoon of magnesium sulfate. Stir with tip of a pipette until the solid dissolves. Record the contents of well D4 in your lab notebook as ~0.1M magnesium sulfate.
8. The kit provides 6M sodium hydroxide, which we want to dilute to ~ 0.1M. For higher accuracy, we'll use the same two-step procedure we used for the hydrochloric acid. first, use a pipette to transfer 1.25 mL of distilled water to well A6 of the 24-well reaction plate. Use a clean pipette to transfer 0.25 mL of 6M sodium hydroxide to well A6. Stir the solution with the pipette tip and draw it up and expel it several times with
Copyright © 2013 by The Home Scientist, LLC Revision 1.0.7 – 10 January 2013

The Home Scientist, LLC CK01A Instruction Manual 80
the pipette to mix the solution thoroughly. Record the contents of well A6 in your lab notebook as 1M sodium hydroxide.
9. Fill well B6 of the 24-well reaction plate with 2.25 mL of distilled water and 0.25 mL of 1M sodium hydroxide (from well A6). Stir the solution with the pipette tip and draw it up and expel it several times with the pipette to mix the solution thoroughly. Record the contents of well B6 in your lab notebook as 0.1M sodium hydroxide.
10.Repeat step 3, filling well D6 with 2.25 mL of distilled water and 0.25 mL of 1.0M sodium carbonate to produce 0.1M sodium carbonate.
Part II – Populate the reaction plate
The next step is to populate all 12 columns of the 96-well reaction plate with our 12 anion solutions, one per column.
1. If you have not done so already, put on your goggles and gloves. Review the hazards of each chemical you will use.
2. Use a clean, dry pipette to transfer two drops of 0.1M potassium bromide solution to each of the 8 wells (A through H) in column 1 of the reaction plate.
3. Repeat step 2 to populate all 11 of the remaining columns in the reaction plate, as follows:
2: 0.1M sodium carbonate solution (from well D6 of the 24-well plate)
3: 0.1M hydrochloric acid (from well B1 of the 24-well plate)
4: 0.1M potassium dichromate
5: 0.1M potassium ferricyanide
6: 0.1M sodium ferrocyanide
7: 0.1M sodium hydroxide (from well B6 of the 24-well plate)
8: 0.1M potassium iodide
9: 0.1M oxalic acid (from well C1 of the 24-well plate)
10: 0.1M phosphoric acid (from well D1 of the 24-well plate)
11: 0.1M magnesium sulfate (from well D4 of the 24-well plate)
12: 0.1M sodium sulfide
Part III – Run the reactions
The next step is to react each of the eight cation solutions with each of the 12 anion solutions. As we add each of the cation solutions to each of the anion solutions, we'll look for evidence of a reaction in the well, which may be a precipitate, color change, or the evolution of a gas.
We'll examine the wells under a strong light to make sure we don't miss any subtle evidence of reactions. Because we expect some of the precipitates to be light colored and others dark, we'll examine the wells using both white and black paper as backgrounds.
1. If you have not done so already, put on your goggles and gloves. Review the hazards of each chemical you will use.
Copyright © 2013 by The Home Scientist, LLC Revision 1.0.7 – 10 January 2013

The Home Scientist, LLC CK01A Instruction Manual 81
2. In your lab notebook, draw a matrix similar to the following:
A B C D E F G H
Ba2+ Ca2+ Cu2+ H+ Fe2+ Fe3+ Pb2+ Mg2+
1 Br-
2 CO32-
3 Cl-
4 Cr2O72-
5 [Fe(CN)6]3-
6 [Fe(CN)6]4-
7 OH-
8 I-
9 C2O42-
10 PO43-
11 SO42-
12 S2-
3. Place the populated 96-well reaction plate on a sheet of white paper under the desk lamp, positioned to brightly illuminate the wells.
4. Use a clean, dry pipette to transfer two drops of 0.1M barium nitrate solution to each of the 12 wells in row A.
5. For each well in which a precipitate occurs, use the following abbreviations to describe it: bk (black), bl (blue), br (brown), g (green), o (orange), p (pink), r (red), w (white), v (violet), and y (yellow). You may combine colors, for example y-g for yellow-green or bl-bl-g for a bluish blue-green. If necessary, use l (light), m (medium), or d (dark) as modifiers. Use gas to indicate that a gas is evolved. Use a dash or n/r to indicate no reaction.
6. Slide the sheet of black paper under the reaction plate and note any precipitates that were not visible with the white paper background.
7. Repeat steps 4 through 6 for rows B (calcium nitrate), C (copper(II) sulfate), D (hydrochloric acid), E (iron(II) sulfate), F (iron(III) chloride), G (lead acetate), and H (magnesium sulfate).
Clean-up and Disposal
Although barium, lead, and dichromate ions are quite toxic (and some of the other ions less
Copyright © 2013 by The Home Scientist, LLC Revision 1.0.7 – 10 January 2013

The Home Scientist, LLC CK01A Instruction Manual 82
so), the amounts and concentrations used in the reaction plate are so small that there is no real danger in flushing them down the drain with plenty of water. However, depending on your local laws and regulations, you may be required to dispose of them properly by transferring them to a hazardous waste container (an empty soda bottle is fine) and taking them to a hazardous waste center.
Wash and dry the equipment. Pay particular attention to the reaction plate. Precipitates may be difficult to remove, particularly if you allow them to dry. Use a cotton swab to clean each well with soapy water.
Review Questions
1. Which of the wells showed evidence of a reaction? Describe the precipitate or other evidence.
2. Write a balanced equation for each well where a reaction occurred. (Note: you needn't show ionic forms; molecular forms suffice.) If you can identify the precipitate, use a down-arrow to indicate it.
3. Before we ran the reactions, we knew that two of the wells would not show any evidence of reaction. Which two wells were they? Why?
Copyright © 2013 by The Home Scientist, LLC Revision 1.0.7 – 10 January 2013

The Home Scientist, LLC CK01A Instruction Manual 83
Topic III. Chemical Reactions and StoichiometrySession III-5: Stoichiometry of Double Displacement Reactions
Advance Preparation:
Session:
None
15 minutes
Materials from Kit
□ Goggles□ Pipettes□ Test tubes
□ Lead(II) acetate, 0.1M□ Potassium dichromate, 0.1M□ Potassium iodide, 0.1M
Materials You Provide
□ Gloves □ Distilled water
Concepts and Vocabulary
□ Double-replacement reaction
□ Stoichiometry
Background
In the preceding lab sessions, we've looked in some detail at various types of reactions but we haven't examined the stoichiometry of those reactions. In this lab session, we'll take a quick look at the stoichiometry of two double-replacement reactions.
With the exceptions of lead(II) acetate and lead(II) nitrate, most common lead compounds are insoluble in water, many extremely so. The “lead(II)” in the names of these compounds indicates that lead is present in the +2 oxidation state, in other words as ions with a +2 charge. In solution, these lead(II) ions can react with various anions. We'll react lead(II) acetate, Pb(CH3COO)2, with potassium dichromate, K2Cr2O7, and potassium iodide, KI, to form lead(II) dichromate and lead(II) iodide, both of which are extremely insoluble, along with soluble potassium acetate. The balanced equations for these reactions are as follows:
Pb2+ + 2 CH3COO- + 2 K+ + Cr2O72- → PbCr2O7↓ + 2 K+ + 2 CH3COO-
Pb2+ + 2 CH3COO- + 2 K+ + 2 I- → PbI2↓ + 2 K+ + 2 CH3COO-
These balanced equations tell us that one molecule of lead(II) acetate in solution reacts with one molecule of potassium dichromate to form one molecule of lead(II) dichromate, and that one molecule of lead(II) acetate in solution reacts with two molecules of potassium iodide to form one molecule of lead(II) iodide. But how did we know these stoichiometric ratios? We know the stoichiometric ratios for those reactions because others in the past have established them experimentally, a process that we'll repeat here.
Goals
This lab session has the following goal:
Copyright © 2013 by The Home Scientist, LLC Revision 1.0.7 – 10 January 2013

The Home Scientist, LLC CK01A Instruction Manual 84
□ Examine the stoichiometry of two double-replacement reactions
Procedure
1. If you have not done so already, put on your goggles and gloves. Review the hazards of each chemical you will use.
2. Use a pipette to transfer 1 mL of distilled water to each of two test tubes.
3. Transfer 10 drops of 0.1M lead(II) acetate solution to each of the two test tubes. Swirl the tubes gently to mix the solutions, and record the makeup of the solutions in your lab notebook.
4. Add 10 drops of 0.1M potassium iodide to the first test tube and swirl it gently to mix the solutions. Record your observations in your lab notebook.
5. Add 10 drops of 0.1M potassium dichromate to the second test tube and swirl it gently to mix the solutions. Record your observations in your lab notebook.
6. Allow the precipitates to settle in both tubes.
7. Add one more drop of 0.1M potassium iodide to the first test tube and look for the presence of additional precipitate. Continue adding 0.1M potassium iodide dropwise until no further precipitate occurs. Note the total number of drops of potassium iodide needed to completely precipitate the lead(II) ions in the first test tube and record that value in your lab notebook.
8. Add one more drop of 0.1M potassium dichromate to the second test tube and look for the presence of additional precipitate. Continue adding 0.1M potassium dichromate dropwise until no further precipitate occurs. Note the total number of drops of potassium dichromate needed to completely precipitate the lead(II) ions in the second test tube and record that value in your lab notebook.
Clean-up and Disposal
Although soluble lead and dichromate compounds are quite toxic, the highly insoluble lead(II) iodide and lead(II) dichromate salts present a much smaller hazard. In practical terms, the tiny amounts of these compounds can be safely disposed of by capturing them on a paper towel and discarding the securely-wrapped towel with household garbage. However, depending on your local laws and regulations, you may be required to dispose of them properly by transferring them to a hazardous waste container and taking them to a hazardous waste center.
Wash the test tubes and pipettes with soapy water, rinse them thoroughly, and dry them.
Review Questions
1. How many drops of potassium dichromate were required to react completely with the 10 drops of lead(II) acetate?
2. How many drops of potassium iodide were required to react completely with the 10 drops of lead(II) acetate?
3. If we reacted 1M sodium carbonate (Na2CO3) solution with 10 drops of 0.1M lead(II) acetate, how many drops of the carbonate solution should be required to precipitate the lead(II) ions present? (Hint: lead(II) carbonate is extremely insoluble in water.)
Copyright © 2013 by The Home Scientist, LLC Revision 1.0.7 – 10 January 2013

The Home Scientist, LLC CK01A Instruction Manual 85
4. Assume that you have prepared a test tube containing 10 drops of 0.1M lead(II) acetate solution and added 10 drops of 0.1M sodium nitrate (NaNO3) solution. What reaction would you expect to occur? What would you expect if you added another 10 drops of 0.1M sodium nitrate solution?
Copyright © 2013 by The Home Scientist, LLC Revision 1.0.7 – 10 January 2013

The Home Scientist, LLC CK01A Instruction Manual 86
IVReduction-Oxidation (Redox) Reactions
A reduction-oxidation reaction or redox reaction is a chemical reaction during which the oxidation state of two or more of the reactants change. Note that the word oxidation in this context has nothing to do with oxidation in the sense of combining with oxygen. Most redox reactions do not involve oxygen at all.
The oxidation state of an atom or ion can be thought of as its electrical charge. In simple terms, a neutral atom is in oxidation state zero. An ion with a positive charge has a positive oxidization state overall (although one or more of the component atoms in that ion may have non-positive oxidation states. For example, if a neutral sodium atom (oxidation state zero, Na0) loses an electron, it has been oxidized to oxidation state 1+, and becomes an Na+ ion. Conversely, a carbonate ion, CO32-, is made up of one carbon atom in oxidation state 4+ and three oxygen atoms, each in oxidation state 2-, for a net charge (oxidation state) of 2-.
Oxidation in the context of a redox reaction refers to the oxidation state of an atom being increased (one or more electrons being lost). Conversely, reduction refers to the oxidation state of an atom being reduced (one or more electrons being gained). We saw an example of a redox reaction in the preceding group of lab sessions, when we reacted iron metal with copper(II) sulfate solution to produce copper metal and and iron(II) sulfate. The balanced equation for that reaction is:
Fe(s) + CuSO4(aq) → Cu(s) + FeSO4(aq)
or, with the oxidation states of each species as a superscript:
Fe0(s) + Cu2+(aq) + SO42-(aq) → Cu0(s) + Fe2+(aq) + SO42-(aq)
In this reaction, an atom of iron metal (oxidation state 0) loses two electrons and is oxidized to an iron(II) ion (oxidation state +2). The two electrons lost by the iron atom combine with a copper(II) ion (oxidation state +2), reducing the copper(II) ion to form an atom of copper metal (oxidation state 0). The sulfate ion (oxidation state -2) does not change oxidation state, and so is the same on both sides of the equation.
Many chemical reactions do not involve any change in oxidation state. For example, if we react aqueous solutions of copper(II) sulfate and sodium hydroxide to form a precipitate of copper(II) hydroxide and a solution of sodium sulfate, no changes in oxidation state occur:
CuSO4(aq) + 2 NaOH(aq) → Cu(OH)2(s) + Na2SO4(aq)
Copyright © 2013 by The Home Scientist, LLC Revision 1.0.7 – 10 January 2013

The Home Scientist, LLC CK01A Instruction Manual 87
or, showing the oxidation states:
Cu2+ + SO42- + 2 Na+ + 2 OH- → [Cu2+(OH-)2] + 2 Na+ + SO42-
On both sides of the equation, copper is in the +2 oxidation state, sulfate -2, sodium +1, and hydroxide -1.
Oxidation state 0 is the neutral form of any element, such as (at standard conditions) aluminum in its metallic form or chlorine in its gaseous form. An atom in oxidation state 0 possesses the same number of negatively-charged electrons in its shell as the number of positively-charged protons in its nucleus, leaving a net charge of 0.
If a chlorine atom at oxidation state 0 gains an electron, that chlorine atom becomes a chlorine ion with a charge of -1, and an oxidation state of -1. Conversely, if a chlorine atom at oxidation state 0 loses an electron, that chlorine atom becomes a chlorine ion with a charge of +1, and an oxidation state of +1. With the exception of the noble gases—helium, neon, argon, krypton, xenon, and radon, all in column 18 of the periodic table—all elements are commonly found in at least one oxidation state other than 0. Some elements have only one or two known non-zero oxidation states. Other elements are commonly found in many oxidation states. For example, in its natural forms and in its many compounds, carbon can be found in oxidation states -4, -3, -2, -1, 0, +1, +2, +3, and +4.
Keeping Oxidation and Reduction Straight
Many beginning chemists have trouble remembering whether oxidation means gaining or losing an electron. Generations of chemists have kept this straight using the mnemonic LEO the lion says GER, which you can expand to Lose Electron = Oxidation and Gain Electron = Reduction.
Oxidation and reduction also apply to atoms that are in oxidation states other than 0. For example, iron is found in three oxidation states. Metallic iron is in oxidation state 0. Metallic iron can be oxidized to the Fe2+ ion, also called the ferrous ion or the iron(II) ion. The Fe2+ ion can be further oxidized to the Fe3+ ion—also called the ferric ion or the iron(III) ion—or it can be reduced to metallic iron. The Fe3+ ion can be reduced to the Fe2+ ion by gaining one electron, or all the way to Fe0 (iron metal) by gaining three electrons.
What about Fe4+ and Fe+?
It might seem that an Fe3+ ion could lose one more electron to produce an Fe4+ ion. That doesn't happen because of the configuration of iron's electron shell. Only tightly-bound electrons remain when iron is in the +3 state. Similarly, it might seem that Fe0
could lose one electron (or Fe2+ gain one electron) to form Fe+. That doesn't happen because the electron shell configuration of Fe+ is unstable. Any Fe+ ions that fleetingly form during an oxidation-reduction reaction immediately shed an electron to form Fe2+
ions or grab an electron to form Fe0.
Iron is known in higher oxidation states—iron(IV), iron(V), and iron(VI)—but not as free ions. The most common example is the ferrate ion, FeO42-, in which iron is in oxidation state +6.
Ions of a particular element in different oxidation states can have very different chemical and physical properties. For example, solutions that contain vanadium ions in different oxidation states show a rainbow of colors. Solutions of V5+ ions are yellow; those of V4+ are blue; V3+, green; and V2+, violet. Solutions of ions in different oxidations states of chromium,
Copyright © 2013 by The Home Scientist, LLC Revision 1.0.7 – 10 January 2013
The Home Scientist, LLC CK01A Instruction Manual 88
manganese, and other elements show similar color differences.
It's important to understand that in a redox reaction oxidation and reduction are two sides of the same coin. If one atom is oxidized during the reaction, another must be reduced, and vice versa. Furthermore, the total number of electrons lost by the atom or atoms being oxidized must equal the total number of electrons gained by the atom or atoms that are being reduced. Charge must be conserved. For example, when aluminum reacts with the H+ ions from hydrochloric acid to form Al3+ ions, the three electrons lost when one aluminum atom is oxidized reduce three H+ ions to H0 atoms.
In this lab session, we'll explore various aspects of redox reactions.
Copyright © 2013 by The Home Scientist, LLC Revision 1.0.7 – 10 January 2013

The Home Scientist, LLC CK01A Instruction Manual 89
Topic IV. Reduction-Oxidation (Redox) ReactionsSession IV-1: Observe Oxidation States of Manganese
Advance Preparation:
Session:
None
30 minutes
Materials from Kit
□ Goggles□ Graduated cylinder, 10 mL□ Pipettes□ Reaction plate, 24-well
□ Potassium permanganate, 0.1M□ Sodium bisulfite, 1.0M□ Sodium hydroxide, 6.0M□ Sulfuric acid, 1.0M
Materials You Provide
□ Gloves□ Desk lamp or other strong light source□ Sheet of white paper
□ Toothpicks□ Distilled water
Concepts and Vocabulary
□ Oxidation states
□ Reduction and oxidation (Redox)
Background
Many elements can exist in several oxidation states, which may differ noticeably in color. In the introduction, we mentioned vanadium as one such element. Manganese is another element whose various oxidation states have different colors, including MnO4
- (+7, violet),
MnO42- (+6, green), MnO2 (+4, orange), Mn2O3 (+3, violet), and Mn
2+ (+2, pale pink).
In this laboratory, we'll begin with a solution of potassium permanganate, KMnO4, in which manganese is in the +7 oxidation state, and reduce the oxidation state to observe the color changes associated with various oxidation states of manganese. To achieve these changes in oxidation state, we'll react potassium permanganate with sodium bisulfite in neutral, basic (sodium hydroxide), and acid (sulfuric acid) solutions.
In neutral solution, permanganate ions (oxidation state +7) are reduced by bisulfite ions to form orange MnO2 (oxidation state +4), which precipitates as a solid.
2 MnO4-(aq) + 3 HSO3
-(aq) + OH
-(aq) → 2 MnO2(s) + 3 SO4
2-(aq) + 2 H2O(l)
In basic solution, permanganate ions (oxidation state +7) are reduced by bisulfite ions to form green MnO4
2- ions (oxidation state +6).
2 MnO4-(aq) + HSO3
-(aq) + 3 OH
-(aq) → 2 MnO4
2-(aq) + SO4
2-(aq) + 2 H2O(l)
In acidic solution, permanganate ions (oxidation state +7) are reduced by bisulfite ions to form pink Mn
2+ ions (oxidation state +2).
2 MnO4-(aq) + 5 HSO3
-(aq) + H
+(aq) → 2 Mn
2+(aq) + 5 SO4
2-(aq) + 3 H2O(l)
Copyright © 2013 by The Home Scientist, LLC Revision 1.0.7 – 10 January 2013

The Home Scientist, LLC CK01A Instruction Manual 90
Goals
This lab session has the following goals:
□ Understand the concepts of oxidation and reduction of chemical species
□ Observe one element in several oxidation states
Procedure
1. If you have not done so already, put on your goggles and gloves. Review the hazards of each chemical you will use.
2. Use a clean pipette to transfer 0.5 mL of 1.0M sodium bisulfite solution to the 10 mL graduated cylinder. Fill the cylinder to the 5.0 mL line with distilled water. Draw up and expel solution with the pipette to mix the solution thoroughly.
3. Place the 24-well reaction plate on a sheet of white paper under a desk lamp or other strong light source.
4. Use a clean pipette to transfer 1.0 mL of distilled water to each of wells A1, B1, C1, and D1 in the 24-well reaction plate.
5. Use a clean pipette to transfer 5 drops of 0.1M potassium permanganate solution to each of wells A1, B1, C1, and D1 in the 24-well reaction plate. Return any unused potassium permanganate solution to its container.
6. Stir the wells with tip of the pipette and draw up and then expel solution several times with the pipette to mix the contents of the wells thoroughly.
7. Well A1 contains only potassium permanganate solution, and serves as the control well. Note its color and record your observation in your lab notebook.
8. While stirring with a toothpick, add dilute sodium bisulfite solution dropwise to well B1 until no further change occurs. Record the color transition(s) and the presence or absence of any precipitate in your lab notebook.
9. Add two drops of 6.0M sodium hydroxide to well C1 and stir to mix the solutions.
10.While stirring with a toothpick, add dilute sodium bisulfite solution dropwise to well C1 until no further change occurs. Record the color transition(s) and the presence or absence of any precipitate in your lab notebook.
11. Add ten drops of 1.0M sulfuric acid to well D1 and stir to mix the solutions.
12.While stirring with a toothpick, add dilute sodium bisulfite solution dropwise to well D1 until no further change occurs. Record the color transition(s) and the presence or absence of any precipitate in your lab notebook.
13.Comparing the appearances of the contents of the four wells, decide which oxidation state of manganese is represented by the contents of each well and record your observations in your lab notebook.
Potassium permanganate is widely used as a strong oxidizer. You can observe its oxidation power by placing a white paper towel on a plate or other impervious surface and transferring the dilute potassium permanganate solution from well A1 onto the paper towel. Initially, the paper assumes the intense violet color of the permanganate ion (+7). As the permanganate ion oxidizes the cellulose in the paper, it is reduced from the violet +7 oxidation state to the
Copyright © 2013 by The Home Scientist, LLC Revision 1.0.7 – 10 January 2013

The Home Scientist, LLC CK01A Instruction Manual 91
green +6 oxidation state. If you allow the reaction to continue, Mn+7 permanganate ions are eventually reduced to the Mn+4 oxidation state as orange/brown manganese dioxide (MnO2).
Clean-up and Disposal
Wash and dry the equipment. All the products produced in this lab session may be discarded with household garbage or flushed down the drain with plenty of water.
Review Questions
1. What are the final oxidation states of manganese in wells A1, B1, C1, and D1?
2. What are the oxidation states of each atom in the following molecules: NH3, H2O, H2O2, K2Cr2O7, NaNO3, FeCl2, NO, NO2, N2O, N2O5, and AgNO3?
3. In wells B1, C1, and D1, we reduced Mn(VII) ions to manganese in lower oxidation states. Which species was oxidized in each of these reactions, and what species was it oxidized to?
4. Knowing that permanganate ion is a very strong oxidizing agent, would you expect permanganate ion to be a weak or strong reducing agent? Is permanganate ion easy or difficult to reduce? Why?
Copyright © 2013 by The Home Scientist, LLC Revision 1.0.7 – 10 January 2013

The Home Scientist, LLC CK01A Instruction Manual 92
VAcid-Base Chemistry
Acids and bases are two of the most important classes of compounds in chemistry. Surprisingly, it took chemists many years to agree on just what made an acid an acid and a base a base.
From experience, we understand that acids and bases have certain characteristics. For example, acid solutions taste sour and base solutions bitter. (Obviously, you should never taste any laboratory chemical, but the sour taste of edible acids such as lemon juice and vinegar is familiar to most people, as is the bitter taste of edible bases such as baking soda and quinine water). Acid solutions generally have an astringent feel on the skin, while base solutions feel slimy. Acid solutions turn blue litmus paper red, while base solutions turn red litmus paper blue. Acids and bases combine to form salts. And so on.
But these characteristics are insufficient to define acids and bases. Around the turn of the 19th century, French and European chemists believed that all acids must contain oxygen. (They were wrong, but echoes of that error persist; for example, the German word for oxygen is Sauerstoff, which translates literally as “sour material.”) Davy and other English chemists were much closer to the mark. They believed that all acids must contain hydrogen. And, although that statement is not absolutely true for all substances considered to be acids by modern definitions, it is true that all acids known to be acids at that time do contain hydrogen.
The first good working definition of acids and bases was proposed in the late 19th century by the Swedish chemist Svante August Arrhenius, who defined an acid as a substance that when dissolved in water increases the concentration of the hydronium (H3O+) ion and a base as a substance that when dissolved in water increases the concentration of the hydroxide (OH-) ion. Although that definition limits acids and bases to compounds that are water soluble, it was a pretty good definition for the time and remains a useful definition even today.
But not all compounds that behave chemically as acids can dissociate to produce hydrogen ions, and not all compounds that behave chemically as bases can dissociate to produce hydroxide ions. In 1923, the Danish chemist Johannes Nicolaus Brønsted and the English chemist Thomas Martin Lowry redefined an acid as a proton (hydrogen nucleus) donor, and a base as a proton acceptor. Under the Brønsted-Lowry definition of acids and bases, an acid and its corresponding base are referred to as a conjugate acid-base pair. The conjugate acid is the member of the pair that donates a proton, and the conjugate base the member of the pair that accepts a proton. For example, hydrochloric acid dissociates in water to form
Copyright © 2013 by The Home Scientist, LLC Revision 1.0.7 – 10 January 2013

The Home Scientist, LLC CK01A Instruction Manual 93
chloride ions and hydronium ions:
HCl + H2O ⇌ H3O+ + Cl-
In the forward reaction, the acid reactant (HCl) and the base reactant (H2O) form the acid product (H3O+) and the base product (Cl-). In the reverse reaction, the acid reactant (H3O+) and the base reactant (Cl-) form the acid product (HCl) and the base product (H2O). If the conjugate acid (HCl on the left side of the equation and H3O+ on the right side) is strong, the conjugate base (H2O on the left side of the equation and Cl- on the right side) is weak, and vice versa. At equilibrium, the weaker acid is favored.
For aqueous solutions, the Arrhenius definition and the Brønsted-Lowry definition are essentially the same. The value of the Brønsted-Lowry definition is that it extends the concept of acids and bases to compounds that are not soluble in water.
The same year that Brønsted and Lowry defined acids and bases as proton donors and proton acceptors, respectively, the American chemist Gilbert N. Lewis extended the definition of acids and bases to include compounds that behaved chemically as acids and bases without donating or accepting a proton. Under the Lewis definition of acids and bases, a Lewis acid (also called an electrophile) is a substance that accepts an electron pair, and a Lewis base (also called a nucleophile) is a substance that donates an electron pair. (For example, the compound ferric chloride, FeCl3, behaves as an acid, although it has no proton to donate, and so is classified as a Lewis acid.) Lewis acids and bases are particularly important to organic chemists, who make use of them in many syntheses.
In this group of lab sessions, we'll examine the properties of acids and bases.
Copyright © 2013 by The Home Scientist, LLC Revision 1.0.7 – 10 January 2013

The Home Scientist, LLC CK01A Instruction Manual 94
Topic V. Acid-Base ChemistrySession V-1: Determine the Effect of Concentration on pH and the pH Range of Indicators
Advance Preparation:
Session:
None
90 to 120 minutes
Materials from Kit
□ Goggles□ Beaker, 100 mL polypropylene□ Centrifuge tubes, 50 mL (4)□ Graduated cylinder, 10 mL□ Pipettes□ Reaction plate (24-well)□ Reaction plate (96-well)□ Stirring rod□ pH test paper, wide-range
□ Acetic acid, 6M□ Ammonia, 6M□ Hydrochloric acid, 6M□ Methyl orange indicator solution□ Methyl red indicator solution□ Phenolphthalein indicator solution□ Sodium hydroxide, 6M□ Thymol blue indicator solution
Materials You Provide
□ Gloves□ Scissors
□ Distilled water
Concepts and Vocabulary
□ Acidity and basicity (alkalinity)
□ pH
□ Strong and weak acids and bases
□ Complete dissociation versus partial dissociation
□ Reaction arrow and equilibrium arrow
□ pH indicators and transition ranges
□ Serial dilution
Background
pH is a metric used to specify the acidity (or basicity, also called alkalinity) of an aqueous solution. The pH of a solution is determined by the relative activities of the hydronium (H3O+) ions and the hydroxide (OH-) ions in the solution. The pH of a solution in which the activities of these two ions are equal—such as pure water at 25 °C—is 7.00. A solution in which the activity of the hydronium ions is higher than the activity of the hydroxide ions has a pH lower than 7 and is acidic. A solution in which the activity of the hydroxide ions is higher than the activity of the hydronium ions has a pH greater than 7, and is basic.
Activity versus Concentration
Technically, the pH of a solution depends on the activity of the hydronium ions rather
Copyright © 2013 by The Home Scientist, LLC Revision 1.0.7 – 10 January 2013

The Home Scientist, LLC CK01A Instruction Manual 95
than their concentration, but it's easy to measure concentration accurately and very difficult to measure activity accurately. (Activity can be thought of as the effective concentration of hydronium ions, which is lower than the actual concentration because in solution some of the hydronium ions are “screened” by other ions present in the solution and therefore unable to participate in reactions.) In very concentrated solutions, activity may be considerably lower than the actual concentration. In dilute solutions, concentration and activity correlate very closely, so the concentration is typically used for calculations.
pH is specified on a log10 scale, which allows a very wide range of activities (concentrations) to be specified using a small range of numbers. A difference of one pH number corresponds to a factor of ten difference in acidity or basicity. For example, a solution with a pH of 5 is ten times (101) more acidic than a solution with a pH of 6, and a solution with a pH of 9 is ten times (101) more basic than a solution with a pH of 8. Similarly, a solution with a pH of 2 is 10,000 (104) times more acidic than a solution with a pH of 6, and a solution with a pH of 12 is 10,000 (104) times more basic than a solution with a pH of 8. Although the range of pH values is usually considered to be 0 through 14, an extremely acidic solution (such as a concentrated solution of hydrochloric acid) can have a pH lower than 0, and an extremely basic solution (such as a concentrated solution of sodium hydroxide) can have a pH greater than 14.
For relatively dilute solutions of strong acids and bases, you can estimate pH using the formula:
pH = -log10[H3O+]
where [H3O+] is the concentration of the hydronium ion in mol/L. For example, hydrochloric acid dissolves in water according to the following equation:
HCl + H2O → H3O+ + Cl-
Because HCl is a strong acid, the reaction proceeds to completion, which is to say that essentially all of the HCl reacts to form hydronium ions and chloride ions. The approximate pH of a 0.01 M solution of hydrochloric acid is:
pH = -log10[0.01] = 2
In calculating that approximate pH, we assume that the hydrochloric acid fully dissociates in solution into H3O+ ions and Cl- ions. For strong acids like hydrochloric acid, that's a reasonable assumption. For weak acids, such as acetic acid, that assumption is not valid, because weak acids dissociate only partially in solution. The concentration of hydronium ions in a solution of a weak acid is lower (perhaps much lower) than the concentration of the acid itself.
When acetic acid dissolves in water, the dissociation reaction looks like this:
CH3COOH + H2O ⇌ H3O+ + CH3COO-
Notice the difference in arrows between this dissociation reaction and one listed above for hydrochloric acid. Hydrochloric acid dissociates completely in solution, so we use a reaction arrow (single-headed arrow pointing right) to represent that complete dissociation of reactants to products.
The dissociation of acetic acid in solution is not complete, so both molecular acetic acid and acetate ions are always present in the solution. This reaction reaches an equilibrium state, represented by the double-headed equilibrium arrow, with reactants being converted to
Copyright © 2013 by The Home Scientist, LLC Revision 1.0.7 – 10 January 2013

The Home Scientist, LLC CK01A Instruction Manual 96
products and vice versa at the same rate. Therefore, in a 1.0 M solution of acetic acid (about the concentration of household vinegar), the actual concentration of the hydronium ion is something less than 1.0 M, because some of the acetic acid remains undissociated. Based on the previous calculation, we know that the pH of a 1.0 M solution would be about 0 if the acid had fully dissociated, so we know that the actual pH of the 1.0 M acetic acid will have some value higher than 0.
If we assume for a moment that at equilibrium only 10% of the acetic acid has dissociated, we can calculate the approximate pH of the solution. If only 10% of the acid has dissociated in a 1.0 M solution of acetic acid, the hydronium ion concentration is 0.1 M. Filling in the formula, we get:
pH = -log10[0.1] = 1
But to estimate the pH of this solution accurately, we need a better value than our guesstimate of 10% dissociation. We get that value by looking up the equilibrium constant for the dissociation reaction shown above. In the context of pH, the equilibrium constant is referred to as the acidity constant, acid dissociation constant, or acid ionization constant, and is abbreviated Ka.
Ka versus pKa
The acidity constant may be specified directly as Ka or as the negative logarithm of Ka, which is abbreviated as pKa. For example, at 25 °C, the Ka of acetic acid is 1.74·10-5
and the pKa is 4.76. Either value can be used by adjusting calculations accordingly.
With the acid dissociation constant for acetic acid known to be 1.74·10-5, and ignoring the tiny contribution to [H3O+] made by the water, we can calculate the pH of a 1.0 M solution of acetic acid as follows:
Ka = 1.74·10-5 = ([H3O+]·[CH3COO-]/[CH3COOH])
An unknown amount of the acetic acid has dissociated, which we'll call x. That means that the concentration of the acetic acid, or [CH3COOH] is (1.0 – x), while the concentrations of the dissociated ions, [H3O+] and [CH3COO-], are both x. Filling in the formula gives us:
1.74·10-5 = ([x]·[x]/[1.0 – x]) = x2/(1.0 – x)
Multiplying both sides by (1.0 – x) gives us
(1.74·10-5)·(1.0 – x) = x2
or
1.74·10-5 - (1.74·10-5·x) = x2
Solving for x gives us a value of about 4.17·10-3 or about 0.00417. Our original guesstimate that 10% of the acetic acid would dissociate was wildly high. In fact, only about 0.417% of the acetic acid dissociates. Knowing that value tells us that the concentration of the hydronium ion in a 1 M acetic acid solution is 0.00417 M. Plugging that value into the formula allows us to calculate the approximate pH of the 1.0 M acetic acid solution:
pH = -log10[0.00417] = 2.38
Although we've focused until now on acids rather than bases, remember that the concentrations of the hydronium ion and the hydroxide ion are related. We know that pure water at 25 °C has a pH of 7.00 and that the concentrations of hydronium ions and hydroxide
Copyright © 2013 by The Home Scientist, LLC Revision 1.0.7 – 10 January 2013

The Home Scientist, LLC CK01A Instruction Manual 97
ions are equal. A pH of 7.00 tells us that the concentration of hydronium ions, [H3O+], is 1.00·10-7, which means that the concentration of hydroxide ions, [OH-], must also be 1.00·10-
7. We know that hydronium ions and hydroxide ions react to form water:
H3O+ + OH- ⇌ H2O
According to Le Chatelier's Principle (see Topic VII), in a system at equilibrium, increasing the concentration of one reactant forces the reaction to the right, producing more product. Increasing [H3O+] reduces [OH-] proportionately, and vice versa. Expressed as a formula, the equilibrium constant is:
K = [H3O+]·[OH-]
or
K = (1.00·10-7)·(1.00·10-7) = 1.00·10-14
In other words, the product of the concentrations of the hydronium ions and the hydroxide ions always equals 1.00·10-14. If you increase the concentration of hydronium ions by a factor of 10 (or 10,000), the concentration of hydroxide ions decreases by a factor of 10 (or 10,000), and vice versa.
In this laboratory, we'll determine the pH of solutions of a strong acid, a weak acid, a strong base, and a weak base at various concentrations.
Goals
This lab session has the following goals:
□ Understand the concept of acids and bases
□ Understand how pH relates to acidity and basicity (alkalinity)
□ Know what characterizes strong and weak acids and bases
□ Understand how dissociation relates to pH
□ Perform serial dilutions to produce various concentrations of reagents
□ Understand pH indicators and transition ranges
Procedure
This lab session has two parts. In Part I, we'll produce six concentrations each—0.1, 0.01, 0.001, 0.0001, 0.00001, and 0.000001 molar—of a weak acid (acetic), a strong acid (hydrochloric), a weak base (ammonia), and a strong base (sodium hydroxide), and determine the pH of each of those 24 solutions. In Part II, we'll test four acid-base indicators—thymol blue, methyl orange, methyl red, and phenolphthalein—against these 24 solutions to view the color transitions that occur and determine the pH range over which each indicator transitions between (or among) forms.
Part I – Preparing the Acid and Base Solutions and Testing Their pH
1. If you have not done so already, put on your goggles and gloves. Review the hazards of each chemical you will use.
2. Label four centrifuge tubes, “0.1 M acetic acid”, “0.1 M ammonia”, “0.1 M hydrochloric acid”, and “0.1 M sodium hydroxide”.
Copyright © 2013 by The Home Scientist, LLC Revision 1.0.7 – 10 January 2013

The Home Scientist, LLC CK01A Instruction Manual 98
3. Transfer about 10 mL of distilled water to each of the four centrifuge tubes and cap them.
4. Using a clean, dry graduated pipette, transfer 0.25 mL of 6 M acetic acid to the corresponding centrifuge tube. Add additional distilled water to bring the total volume in the tube to 15 mL. Recap the tube and swirl it gently to mix the contents.
5. Repeat that procedure for each of the remaining centrifuge tubes, transferring 0.25 mL each of the 6 M ammonia, hydrochloric acid, and sodium hydroxide solutions.
At this point, you have four centrifuge tubes with 15 mL each of 0.1 M solutions of acetic acid, ammonia, hydrochloric acid, and sodium hydroxide. We'll next use a procedure called serial dilution to produce repeated ten-fold dilutions of each solution, yielding concentrations of 0.01, 0.001, 0.0001, and 0.00001 M.
6. Transfer about 2.5 mL of the 0.1 M acetic acid to well A1 of the 24-well reaction plate, which nearly fills the well. The exact amount is not critical; simply fill the well almost full.
7. Transfer 1.0 mL of 0.1 M acetic acid to the 10 mL graduated cylinder. (Accuracy is important for this step; stay as close as possible to 1.0 mL.) Recap the centrifuge tube and place it aside for later use.
Note: You can simply rinse the graduated cylinder with a small amount of distilled water and shake it dry between each use. Any remaining tiny water droplets are too small to have much effect on your results.
8. Add distilled water to the 10 mL graduated cylinder until it reaches the 10.0 mL line. The cylinder now contains 10.0 mL of 0.01 M acetic acid. Mix the solution thoroughly by stirring it with the pipette tip and by drawing up and expelling the solution with the pipette.
Note: The general rule is to add concentrated acids to water, and never the converse. Adding water to a concentrated acid can cause the acid to boil and spatter. We're working here with dilute acid, with which there is no such danger.
9. Transfer about 2.5 mL of the 0.01 M acetic acid from the graduated cylinder to well A2 of the reaction plate.
10.Use the pipette to withdraw all but 1.0 mL of the 0.01 M acetic acid from the graduated cylinder. You can discard the excess solution into the plastic beaker, which serves as your waste container.
11. Add distilled water to the 10 mL graduated cylinder until it reaches the 10.0 mL line. The cylinder now contains 10.0 mL of 0.001 M acetic acid. Mix the solution thoroughly by stirring it with the pipette tip and by drawing up and expelling the solution with the pipette.
12.Transfer about 2.5 mL of the 0.001 M acetic acid from the graduated cylinder to well A3 of the reaction plate.
13.Repeat the serial dilutions until wells A1 through A6 contain acetic acid at 0.1, 0.01, 0.001, 0.0001, 0.00001, and 0.000001 M, respectively.
14.Make serial dilutions to produce 0.1, 0.01, 0.001, 0.0001, 0.00001, and 0.000001 M solutions of hydrochloric acid in row B of the reaction plate, ammonia in row C, and sodium hydroxide in row D.
Copyright © 2013 by The Home Scientist, LLC Revision 1.0.7 – 10 January 2013

The Home Scientist, LLC CK01A Instruction Manual 99
At this point, the 24 wells of the reaction plate are populated with six dilutions each of four acids and bases. Draw and label a matrix in your lab notebook to record the contents and molarity of each well, as shown in Figure V-1.
10-1 M 10-2 M 10-3 M 10-4 M 10-5 M 10-6 M
AcOH A
HCl B
NH3 C
NaOH D
1 2 3 4 5 6
Figure V-1. Reaction plate well contents and molarities
15.Cut a strip of wide-range pH test paper into six pieces and place those pieces on the lid of the reaction plate. Keep the strips well separated and arrayed to match the six wells in row A.
16.Use use the stirring rod to capture a drop of the solution in well A6, and transfer that drop to the corresponding piece of test paper.
Note: Always work from most dilute to most concentrated. If a tiny amount of the solution from well A6 remains on the stirring rod when you use dip it into well A5, it will have little effect on the pH of well A5. Conversely, even a tiny amount of the ten times more concentrated solution of well A5 could significantly affect the pH of well A6.
17.Repeat the preceding step to transfer one drop of the solutions from wells A5, A4, A3, A2, and A1 to the corresponding pieces of test paper.
18.Allow the solutions to react with the test paper for at least several seconds, or until the color remains constant.
19.Compare each of the six test paper pieces against the color key supplied with the test paper, and estimate the pH of each of the six solutions as closely as possible. Record each of those values in your lab notebook.
20.Rinse and dry the reaction plate lid before continuing.
21.Repeat this group of steps to determine the pH values for the solutions in wells B6 through B1, C6 through C1, and D6 through D1.
Retain the solutions in the 24-well reaction plate for use in Part II of this lab session.
Part II – Determining the Transition Ranges of pH Indicators
1. If you have not done so already, put on your goggles and gloves. Review the hazards of each chemical you will use.
2. Place the 96-well reaction plate on a sheet of white paper or other white surface where it can be strongly illuminated by a desk lamp or similar light source.
3. Transfer one drop of thymol blue to each of the 24 wells in rows A and B of the 96-well
Copyright © 2013 by The Home Scientist, LLC Revision 1.0.7 – 10 January 2013

The Home Scientist, LLC CK01A Instruction Manual 100
reaction plate. Repeat this procedure to transfer one drop of methyl orange to each of the 24 wells in rows C and D, one drop of methyl red to each of the 24 wells in rows E and F, and one drop of phenolphthalein to each of the 24 wells in rows G and H.
4. Use a pipette to draw up solution from well A6 in the 24-well reaction plate (the 0.000001 M acetic acid). Carefully expel enough of this solution into well A6 in the 96-well reaction plate to nearly fill the well.
5. Transfer more of the 0.000001 M acetic acid solution to wells C6, E6, and G6. (The exact amount is not critical, but try to be consistent; fill each small well to just below the top.) Expel any solution remaining in the pipette back into well A6 of the 24-well plate.
6. Use the pipette to draw up solution from well A5 in the 24-well reaction plate (the 0.00001 M acetic acid). Carefully expel enough of this solution into well A5 in the 96-well reaction plate to nearly fill the well.
7. Transfer more of the 0.00001 M acetic acid solution to wells C5, E5, and G5. Again try to be consistent from well to well. Expel any solution remaining in the pipette back into well A5 of the 24-well plate.
8. Continue filling the wells in the 96-well plate with solutions from the 24-well plate. Use the 0.0001 M acetic acid from well A4 in the 24-well plate for wells A4, C4, E4, and G4, 0.001 M acetic acid from A3 for wells A3, C3, E3, and G3, 0.01 M acetic acid from well A2 for wells A2, C2, E2 and G2, and 0.1 M acetic acid from well A1 for wells A1, C1, E1, and G1.
9. Repeat the preceding steps using the various concentrations of hydrochloric acid in row B of the 24-well reaction plate to fill rows B6 – B1, D6 – D1, F6 – F1, and H6 – H1 in the 96-well plate with the corresponding increasing molarities of hydrochloric acid.
10.Repeat the preceding steps using the various concentrations of ammonia in row C of the 24-well reaction plate to fill rows A7 – A12, C7 – C12, E7 – E12, and G7 – G12 in the 96-well plate with the corresponding increasing molarities of ammonia.
11. Repeat the preceding steps using the various concentrations of sodium hydroxide in row D of the 24-well reaction plate to fill rows B7 – B12, D7 – D12, F7 – F12, and H7 – H12 in the 96-well plate with the corresponding increasing molarities of sodium hydroxide.
12.Observe the wells in which transitions in color occur for each of the indicators. Using the calculated pH values for those transitional wells, determine the approximate transition range (or ranges) for each of the four indicators.
Clean-up and Disposal
Retain the solutions in the four centrifuge tubes for later use. You can rinse the solutions in the reaction plate into a larger vessel, mix them, and flush them down the drain with plenty of water. (The acids and bases react with each other to form harmless salts.) Wash and dry the equipment.
Review Questions
1. In diluting the 6 M stock solutions to produce 0.1 M solutions, how did we determine that 0.25 mL of a 6 M stock solution had to be diluted to 15 mL total volume to produce a 0.1 M solution? Explain your reasoning.
Copyright © 2013 by The Home Scientist, LLC Revision 1.0.7 – 10 January 2013

The Home Scientist, LLC CK01A Instruction Manual 101
2. What pH values did you observe for each of the 24 wells in the reaction plate?
3. What pH values would you expect for 1 molar solutions of hydrochloric acid and sodium hydroxide? Show your calculations. What key assumption do you make?
4. If acids A and B have pKa values of -9.32 and 2.74, respectively, which is the stronger acid? Why?
5. The [H3O+] of a solution is known to be 0.000413 mol/L. What is the pH of the solution?
6. The [OH-] of a solution is known to be 0.000413 mol/L. What is the pH of the solution?
7. A 0.1 M solution of an acid is found to have a pH of 2.37. What is the pKa of that acid? The acid, which we can designate HA, dissociates into H+ ions and A- ions. With the pH known to be 2.37, we can calculate the concentration of hydrogen ions as follows:
8. Knowing only the molarity and pH of an unknown acid solution, how might you identify the acid?
9. What are the approximate pH transition ranges for each of the four indicators?
Copyright © 2013 by The Home Scientist, LLC Revision 1.0.7 – 10 January 2013

The Home Scientist, LLC CK01A Instruction Manual 102
Topic V. Acid-Base ChemistrySession V-2: Determine the Molarity of Vinegar by Titration
Advance Preparation:
Session:
None
30 to 45 minutes
Materials from Kit
□ Goggles□ Bromothymol blue□ Centrifuge tube, 15 mL□ Phenolphthalein
□ Reaction plate, 24-well□ Thymol blue□ Sodium bicarbonate tablet
Materials You Provide
□ Gloves□ Desk lamp (or other strong light source)□ Distilled water
□ Paper, white□ Vinegar, distilled white
Concepts and Vocabulary
□ Titration
□ Titrant
□ Equivalence point
□ Standardized solutions
□ Primary reference standards
□ Choice of indicators
Background
Chemists frequently use titration to determine the concentration of an unknown solution. Titration consists of reacting a known volume (called an aliquot) of a solution of unknown concentration with another solution of known concentration (the titrant) until the equivalence point is reached. The equivalence point is usually determined by a change in color of a chemical indicator, such as phenolphthalein.
For example, you might have a solution of hydrochloric acid of unknown concentration and a solution of sodium hydroxide known to be 1.0 M. These two solutions react according to the following balanced equation:
HCl(aq) + NaOH(aq) → NaCl(aq) + H2O(l)
The balanced equation tells us that hydrochloric acid reacts in a 1:1 mole ratio with sodium hydroxide. Because we know the concentration of the sodium hydroxide solution and the volume of it needed to reach the equivalence point for a known volume of the hydrochloric acid solution, we can calculate the concentration of the hydrochloric acid.
For example, if we started with a 20-drop aliquot of the hydrochloric acid unknown and found that it required 20 drops of 1.00 M sodium hydroxide solution to reach the equivalence point,
Copyright © 2013 by The Home Scientist, LLC Revision 1.0.7 – 10 January 2013

The Home Scientist, LLC CK01A Instruction Manual 103
we know that the concentration of the HCl must also be 1.00 M.
Conversely, if it required only 10 drops of 1.00 M sodium hydroxide solution, we know that the concentration of the HCl must be less than 1.00 M, and we can easily calculate it to be 0.50 M. But what if it required 17 drops of 1.00 M sodium hydroxide solution to reach equivalence with 20 drops of hydrochloric acid? We can use the following general formula to calculate the unknown molarity:
V1 · M1 = V2 · M2
17 · 1.00 = 20 · x
x = (17/20) = 0.85 M
For accurate results, it's important to know the concentration of your known solution as closely as possible. In this example, we used a known concentration of 1.00 M, but it's common in real titrations to know the concentration much more accurately. For example, rather than use 1.00 M sodium hydroxide, we might have used 1.0004 M sodium hydroxide. The process of determining accurate concentrations for such solutions is called standardizing the solution.
There are several methods for standardizing a solution, including titrating it against a solution whose concentration is already known very accurately. That, of course, raises the question of how that known solution was standardized. Ultimately, standardized solutions are based on a primary reference standard, which is normally a solid chemical that is stable, does not readily absorb water from or give up water to the surrounding air, and is easy to weigh accurately. For acid-base titrations, the primary standard is potassium hydrogen phthalate, fondly known to generations of chemistry students as KHP.
We won't use KHP in this lab session, because using it requires an accurate balance. Instead, we'll use our own field-expedient “primary standard”, sodium bicarbonate. As it happens, the kit includes sodium bicarbonate tablets, each of which contains 650 mg (0.650 grams) of sodium bicarbonate, NaHCO3. We'll use one of these tablets to make up a sodium bicarbonate solution of accurately-known molarity, and then use that solution to titrate an aliquot of ordinary distilled white vinegar (dilute acetic acid, CH3COOH) to determine its molarity. One mole of sodium bicarbonate reacts with one mole of acetic acid to produce one mole each of sodium acetate, carbon dioxide, and water, according to this balanced equation:
NaHCO3(aq) + CH3COOH(aq) → CH3COONa(aq) + CO2(g) + H2O(l)
The molar mass of sodium bicarbonate is 84.01 g/mol, so 650 mg of sodium bicarbonate is (0.650 g) / (84.01 g/mol) = 0.007737+ mol. The solubility of sodium bicarbonate is about 100 g/L, so we'll need 7 mL or so of water to dissolve the 650 mg tablet. We could make a 1.0 M solution by dissolving the tablet in sufficient water to make 7.7+ mL of solution. Alternatively, we could dissolve the tablet in sufficient water to make 10.0 mL of solution and produce a 0.77+ M solution. (We'll actually use the latter method in this session.) Making up the titrant solution to a specific molarity is unimportant; what's important is that you know the molarity of the titrant as closely as possible.
The indicator you use can affect the outcome of a titration, so we'll run our titrations with three different indicators: bromothymol blue (which transitions from yellow to blue over a pH range of 6.0 to 7.6), thymol blue (yellow to blue from pH 8.0 to 9.6), and phenolphthalein (colorless to pink from pH 8.3 to 10.0).
Copyright © 2013 by The Home Scientist, LLC Revision 1.0.7 – 10 January 2013

The Home Scientist, LLC CK01A Instruction Manual 104
Goals
This lab session has the following goals:
□ Perform a titration
□ Learn to make titration calculations
□ Observe the affect of using different indicators to determine equivalence point
□ Determine the molarity of distilled white vinegar
Procedure
1. If you have not done so already, put on your goggles and gloves. Review the hazards of each chemical you will use.
2. Transfer about 8 mL of distilled water to a 15 mL centrifuge tube and add one 600 mg sodium bicarbonate tablet. Swirl to dissolve the tablet and then add distilled water to make up the total volume of solution to 10.0 mL. (Don't worry if some of the tablet remains as undissolved white powder; the tablet contains insoluble binders that will not affect the outcome of the tests.)
3. Place the 24-well reaction plate on a sheet of white paper under a desk lamp or other strong light source.
4. Transfer 20 drops of distilled white vinegar to each of wells A1, A3, A5, B1, B3, B5, C1, C3, and C5 of the reaction plate.
5. Using clean pipettes for each solution, add one drop of bromothymol blue to each of wells A1, A3, and A5; one drop of thymol blue to each of wells B1, B3, and B5; and one drop of phenolphthalein to each of wells C1, C3, and C5. Note the appearance of each of the wells and record your observations in your lab notebook.
6. Use a clean pipette to draw up a mL or so of the sodium bicarbonate solution, and begin adding that solution drop-wise to well A1. Note any change in appearance in the contents of the well. Continue adding the sodium bicarbonate solution until no further color change occurs. Record your observations in your lab notebook.
Note: As you near the equivalence point, you can use the tip of a clean pipette to stir the solution between drops to make sure it's mixed thoroughly. Depending on the indicator you're using, you may have to overrun the equivalence point to make sure the titration is complete. For example, as you add titrant, the color of the solution in the well may gradually change from yellow through yellowish-green through bluish-green to blue. After you've added (for example) 15 drops of titrant, the color may appear blue to you. Add the 16th drop to see if the color becomes even bluer. If not, record the volume required to reach the equivalence point as 15 drops. If the 16th drop causes a color change, try adding a 17th drop. And so on.
7. Repeat step 6 for wells A3 and A5.
8. Repeat the titration for wells B1/B3/B5 and C1/C3/C5.
9. Using the known molarity and volume of titrant required to reach the equivalence point, calculate the molarity of the vinegar.
Copyright © 2013 by The Home Scientist, LLC Revision 1.0.7 – 10 January 2013

The Home Scientist, LLC CK01A Instruction Manual 105
Clean-up and Disposal
Wash and dry the equipment. All the products produced in this lab session are nonhazardous and can be discarded with household garbage or flushed down the drain with water.
Review Questions
1. Why did we do three runs of the titration with each indicator?
2. Which of the three indicators showed the sharpest change at the equivalence point?
3. What value did you obtain for the molarity of vinegar using bromothymol blue indicator?
4. Did the pH values you determined experimentally for vinegar differ according to the indicator you used?
5. We used about 0.7 M sodium bicarbonate as a titrant. The pH of 0.1 M sodium bicarbonate is about 8.3. If we had used that 0.1 M solution as a titrant, what implications would that have for choice of indicator?
6. Scientists use the term “personal equation” to refer to differences in outcomes of experiments based on individual differences in how individuals perform the experiment. What are some examples of the personal equation that may bear on the results of this experiment?
Copyright © 2013 by The Home Scientist, LLC Revision 1.0.7 – 10 January 2013

The Home Scientist, LLC CK01A Instruction Manual 106
VIChemical Kinetics
Chemical kinetics, also called reaction kinetics, is the study of reaction rates in chemical reactions. In simple terms, if two reactant molecules are to interact with each other, they must collide with sufficient energy to initiate the reaction. Two molecules that do not collide cannot react, regardless of how high their energies might be. Conversely, two molecules that do collide but with insufficient energy cannot react.
Intuitively, it's easy to understand that several factors affect reaction rates.
Temperature affects reaction rates because molecules at a higher temperature have higher energies, and therefore any particular collision between reactant molecules is more likely to have the energy needed to initiate the reaction.
Concentration affects reaction rates, because the number of reactant molecules is higher in more concentrated solutions, and therefore collisions between reactant molecules are more likely to occur.
Pressure affects reaction rates, when one or more of the reactants is a gas, because gases at higher pressures contain more molecules in a given volume (in effect, their concentration is higher).
Surface area affects reaction rates, when one or more of the reactants is a solid, because a larger surface area exposes more of the reactant molecules to collisions with the other reactant or reactants.
Catalysts affect reaction rates by altering the energy required to initiate the reaction, which they accomplish by altering the mechanism by which the reaction occurs.
The manner in which concentration affects reaction rate is called the reaction order or the order of reaction. The reaction order with respect to a particular reaction is the power to which its concentration term in the rate equation is raised. For example, the chemical reaction:
2A + B → C
may have the rate equation:
r = k[A]2[B]1
where r is the reaction rate, k is the reaction rate constant, [A] and [B] are the concentrations in moles/liter of reactants A and B, and the exponents are the reaction orders. In this reaction,
Copyright © 2013 by The Home Scientist, LLC Revision 1.0.7 – 10 January 2013

The Home Scientist, LLC CK01A Instruction Manual 107
the reaction orders are 2 with respect to reactant A and 1 with respect to reactant B. The total reaction order for any reaction is the sum of the reaction orders of all reactants, in this case 2 + 1 = 3. In most reactions, reaction orders are positive integers, but reaction orders may also be zero, fractional, or negative.
Reaction order is not necessarily related to the stoichiometry of the reaction. In the example, it may appear that we have used the number of moles of each reactant in the balanced equation as that reactant's exponent in the rate equation. That turns out to be true for many simple reactions, but in fact reaction orders must be determined experimentally for each particular reaction. Complex reactions may or may not have reaction orders equal to their stoichiometric coefficients.
Determining reaction orders provides information that is useful in determining actual reaction mechanism. Known reaction mechanisms provide a deeper theoretical understanding of the actual interactions that occur at the molecular level during reactions and also have practical applications in synthetic chemistry.
In this group of lab sessions, we'll determine the effect of temperature, concentration, and surface area on reaction rates, and determine a reaction order experimentally.
Copyright © 2013 by The Home Scientist, LLC Revision 1.0.7 – 10 January 2013

The Home Scientist, LLC CK01A Instruction Manual 108
Topic VI. KineticsSession VI-1: Determining the Effect of Temperature, Concentration, and Surface Area on Reaction Rates
Advance Preparation:
Session:
Chill the thermometer, glass beaker, and bottles of vinegar and water in the refrigerator. Allow about 150 mL of vinegar and a liter of tap water to stabilize at room temperature.
90 to 120 minutes
Materials from Kit
□ Goggles□ Beaker, 250 mL glass□ Graduated cylinder, 100 mL
□ Thermometer□ Sodium bicarbonate tablets
Materials You Provide
□ Gloves□ Microwave oven□ Refrigerator□ Soda bottles (empty)
□ Watch or clock with second hand□ Distilled white vinegar (supermarket)□ Graphing paper/calculator/software
Concepts and Vocabulary
□ Reaction rates
□ Limiting reagent and excess reagent
Background
Intuitively, it appears that temperature, concentration, and surface area should affect reaction rates for at least some reactions. We can verify our hypotheses experimentally by running one reaction under differing conditions of temperature, concentration, and surface area. In each case, we'll alter only one of those variables with respect to one reactant while keeping the other two constant.
Our reactants are sodium bicarbonate (baking soda, NaHCO3) tablets and acetic acid (vinegar, CH3COOH). One mole of sodium bicarbonate reacts with one mole of acetic acid to form one mole of sodium acetate (CH3COONa), one mole of carbon dioxide (CO2), and one mole of water (H2O), according to the following balanced equation:
NaHCO3 + CH3COOH → CH3COONa + CO2 + H2O
The molecular mass of NaHCO3 is 84.01 grams/mole. Each of our sodium bicarbonate tablets contains 650 mg (0.65 g) of sodium bicarbonate, so we can calculate the number of moles of sodium bicarbonate per tablet as follows:
(0.65 g/tablet) / (84.01 g/mol) = 0.0077+ mol/tablet
Because one mole of sodium bicarbonate reacts with one mole of acetic acid, we'll need 0.0077+ moles of acetic acid to react completely with the sodium bicarbonate in one tablet. Distilled white vinegar contains 5% ±0.5% acetic acid by mass, which is about 0.83 moles/liter
Copyright © 2013 by The Home Scientist, LLC Revision 1.0.7 – 10 January 2013

The Home Scientist, LLC CK01A Instruction Manual 109
or 0.00083 moles/mL. We can therefore calculate the volume of distilled white vinegar required to react completely with one sodium bicarbonate tablet as follows:
(0.0077 mol) / (0.00083 mol/mL) = 9.2+ mL
To make sure the reaction runs to completion, we want a large excess of acetic acid—sodium bicarbonate will be the limiting reagent—so instead of using the stoichiometric equivalent of 9.2+ mL of vinegar per sodium bicarbonate tablet, we'll use 25 mL for each test run.
Goals
This lab session has the following goals:
□ Determine the effect of temperature, concentration, and surface area on reaction rate
□ Confirm or disprove the rule of thumb that a 10 °C increase doubles reaction rates
Procedure
This lab session has three parts. In Part I, we'll determine the effect of temperature on reaction rates. In Part II, we'll determine the effect of concentration on reaction rates. In Part III, we'll determine the effect of surface area on reaction rates.
Part I – Determine the effect of temperature on reaction rates
Reactions proceed faster at higher temperatures because increasing the temperature also increases the average kinetic energy of the reactant molecules, making it more likely that a collision between two reactant molecules will have sufficient energy to initiate the reaction. An old rule of thumb states that increasing the temperature by 10 °C doubles the rate of reaction. (So, of course, reducing the temperature by 10 °C halves the reaction rate.)
We'll test that rule of thumb in this part of the lab session by reacting sodium bicarbonate tablets with vinegar at different temperatures. When a sodium bicarbonate tablet is dropped into vinegar, it fizzes because the reaction produces carbon dioxide gas. We'll time how long it takes for the reaction to complete at various temperatures to determine the effect of temperature on reaction rates.
Note: Before beginning this part of the experiment, place a bottle of vinegar, a soda bottle filled with tap water, the glass beaker, and the thermometer in the refrigerator and allow them to remain until they are completely chilled. (Most refrigerators are set to maintain a temperature of 3 °C to 5 °C.)
1. If you have not done so already, put on your goggles and gloves. Review the hazards of each chemical you will use.
2. Note the temperature reading on the thermometer and record it in your lab notebook.
3. Transfer about 25 mL of chilled vinegar to the chilled glass beaker. Leave the bottle of vinegar in the refrigerator.
4. Note the time (in seconds) displayed by your clock or watch and drop one sodium bicarbonate tablet into the beaker. The tablet immediately begins fizzing as it reacts with the acetic acid.
Note: Do not stir or swirl the contents of the beaker after you add the sodium bicarbonate tablet. The tablet begins to break down into powder as soon as it contacts
Copyright © 2013 by The Home Scientist, LLC Revision 1.0.7 – 10 January 2013

The Home Scientist, LLC CK01A Instruction Manual 110
the acetic acid. Disturbing it by stirring or swirling will increase the surface area of the sodium bicarbonate dramatically, affecting your results.
5. When the reaction completes, note the time and record the elapsed time in seconds in your lab notebook. Flush the waste solution down the drain.
Note: It's easier to judge completion audibly than visually. When the tablet contacts the acetic acid, the solution quickly turns a milky white color, obscuring the tablet. However, the carbon dioxide evolved by the reaction is audible as a fizzing sound. Place your ear close to the beaker and mark the reaction complete when you can no longer hear carbon dioxide being evolved.
6. Rinse and dry the beaker and transfer about 25 mL of vinegar to it.
7. Place the beaker in your microwave oven and heat it for a few seconds on high.
Note: Microwave ovens vary greatly in how long they take to heat a given volume of liquid to a particular temperature. Our goal is to increase the temperature of the vinegar in about 10 °C steps, although the exact spacing between steps is not critical. Try 10 seconds to start. You can adjust that time upwards or downwards according to the characteristics of your particular microwave oven. If you overheat the first batch of vinegar, you can either allow it to cool into the desired range or simply use it as is and then make a new batch of vinegar with less heating to get the intermediate data point.
Always use the high setting, because when set to lower power many ovens pulse high power on and off rather than actually reducing the radiated power level. The constant output at the high setting allows you to use time as the only variable in heating the vinegar.
8. Swirl the beaker gently to make sure the entire solution is at the same temperature. Record that temperature in your lab notebook.
9. Note the start time on your watch or clock as you drop in a sodium bicarbonate tablet.
10.When the reaction completes, note the time and record the elapsed time in seconds in your lab notebook. Flush the waste solution down the drain.
11. Repeat steps 6 through 10 to obtain data for a range of temperatures, spaced in about 10 °C steps.
Note: You can obtain data for as many temperatures as you wish, but make sure to keep enough sodium bicarbonate tablets to complete the other parts of this lab session. We suggest obtaining values for (about) 5 °C, 15 °C, 25 °C, 35 °C, and 45 °C. If you use higher temperatures, be careful not to burn yourself.
12.Use graph paper, a graphing calculator, or computer graphing software to produce a graph of temperature versus reaction time and versus the inverse of reaction time. Tape or paste the graph into your lab notebook.
Part II – Determine the effect of concentration on reaction rates
Concentration is the second variable we'll test for its effect on reaction rates. We expect the reaction to proceed faster at higher concentrations because the reactant molecules are more likely to encounter each other if one of the reactants is present in higher concentration. More frequent encounters mean more opportunities for the reactants to react, which should translate into higher reaction rates.
Copyright © 2013 by The Home Scientist, LLC Revision 1.0.7 – 10 January 2013

The Home Scientist, LLC CK01A Instruction Manual 111
We'll test that hypothesis in this part of the lab session by reacting sodium bicarbonate tablets with vinegar at different concentrations, with the temperature constant at room temperature. We'll use the same amount of vinegar for each trial—sufficient to be in excess relative to the amount of sodium bicarbonate—but dilute that vinegar with different amounts of tap water.
Note: Before beginning this part of the experiment, allow 150 mL or more of vinegar and a liter of water to stabilize at room temperature.
1. If you have not done so already, put on your goggles and gloves. Review the hazards of each chemical you will use.
2. Use the graduated cylinder to measure 25 mL of vinegar and transfer it to the beaker.
3. Note the time (in seconds) displayed by your clock or watch and drop one sodium bicarbonate tablet into the beaker.
4. When the reaction completes, note the time and record the elapsed time in seconds in your lab notebook. Flush the waste solution down the drain.
5. Rinse and dry the beaker and transfer 25 mL of vinegar and 25 mL of tap water to it. The concentration of the vinegar is now half its original concentration.
6. Note the time displayed by your clock or watch and drop one sodium bicarbonate tablet into the beaker.
7. When the reaction completes, note the time and record the elapsed time in seconds in your lab notebook. Flush the waste solution down the drain.
8. Rinse and dry the beaker and transfer 25 mL of vinegar and 75 mL of tap water to it. The concentration of the vinegar is now one quarter its original concentration.
9. Note the time displayed by your clock or watch and drop one sodium bicarbonate tablet into the beaker.
10.When the reaction completes, note the time and record the elapsed time in seconds in your lab notebook. Flush the waste solution down the drain.
11. Rinse and dry the beaker and transfer 25 mL of vinegar and 175 mL of tap water to it. The concentration of the vinegar is now one eighth its original concentration.
12.Note the time displayed by your clock or watch and drop one sodium bicarbonate tablet into the beaker.
13.When the reaction completes, note the time and record the elapsed time in seconds in your lab notebook. Flush the waste solution down the drain.
14.Use graph paper, a graphing calculator, or computer graphing software to produce a graph of concentration versus reaction time and versus the inverse of reaction time. Tape or paste the graph into your lab notebook.
Part III – Determine the effect of surface area on reaction rates
If at least one of the reactants is a solid, the reaction proceeds faster if the solid is finely divided because the surface area is larger in a finely-divided solid, exposing more of that reactant to the other reactant or reactants. For example, a 50-pound bag of flour is essentially inert because the flour, although finely ground, exposes little of its surface area to the air. But that same amount of flour dispersed as airborne dust, if ignited by a spark, explodes with force sufficient to flatten a large building.
Copyright © 2013 by The Home Scientist, LLC Revision 1.0.7 – 10 January 2013

The Home Scientist, LLC CK01A Instruction Manual 112
In this part of this lab session, we'll explore the effect on reaction rates of varying the surface area at constant temperature and concentration.
Note: We could choose any temperature and concentration for this part of the experiment. Because chunks and powder tablet react faster than a whole tablet, we'll use a low temperature and concentration to make the reaction take longer, minimizing experimental error in measuring reaction times.
1. If you have not done so already, put on your goggles and gloves. Review the hazards of each chemical you will use.
2. Transfer 25 mL of the chilled vinegar and 175 mL of the chilled water to the beaker.
3. Note the time displayed by your clock or watch and drop one sodium bicarbonate tablet into the beaker.
4. When the reaction completes, note the time and record the elapsed time in seconds in your lab notebook. Flush the waste solution down the drain.
5. Rinse and dry the beaker, and transfer 25 mL of the chilled vinegar and 175 mL of the chilled water to the beaker.
6. Use a sharp knife to cut a sodium bicarbonate tablet into four chunks of about equal size. Try to avoid powdering the tablet. Note the time displayed by your clock or watch and drop the chunks of sodium bicarbonate into the beaker. (The chunks will react considerably faster than the whole tablet, so stay alert.)
7. When the reaction completes, note the time and record the elapsed time in seconds in your lab notebook. Flush the waste solution down the drain.
8. Rinse and dry the beaker, and transfer 25 mL of the chilled vinegar and 175 mL of the chilled water to the beaker.
9. Crush a sodium bicarbonate tablet into powder. Note the time displayed by your clock or watch and drop the sodium bicarbonate powder into the beaker. (The powder will react extremely quickly, so just get the best time estimate you can.)
10.When the reaction completes, note the time and record the elapsed time in seconds in your lab notebook. Flush the waste solution down the drain.
11. Use graph paper, a graphing calculator, or computer graphing software to produce a graph for the named surface areas you tested (tablets, chunks, powder) versus reaction time and versus the inverse of reaction time. Based on the reaction times and using the surface area of the tablet as 1.0, calculate the approximate surface areas of the chunks and powder relative to the surface area of the tablet. For example, if the chunks finish reacting in one fifth the time of the whole tablet, record the surface area estimate for the chunks as 5X.) Tape or paste the graph into your lab notebook.
Clean-up and Disposal
Wash and dry the equipment. All the products produced in this lab session are nonhazardous and can be discarded with household garbage or flushed down the drain with water.
Review Questions
1. What general effect did you observe temperature to have on reaction rate?
Copyright © 2013 by The Home Scientist, LLC Revision 1.0.7 – 10 January 2013
The Home Scientist, LLC CK01A Instruction Manual 113
2. Based on your experimental results, does the 10 °C rule of thumb provide a reasonably close approximation of the observed reaction rates in this laboratory? How far do your data depart from the expected values based on the rule of thumb?
3. What general effect did you observe concentration to have on reaction rate?
4. What general effect did you observe surface area to have on reaction rate?
5. In each of these experiments, we alter one variable (temperature, concentration, or surface area) and attempt to hold the other two variables at constant values. Any change in those “fixed” variables will obviously affect our results. What changes may occur in those three “fixed” values, and why?
6. In each of these experiments, we measured only the overall average reaction rate, the time required from initiation to completion of the reaction. Assuming that you have access to an accurate balance, propose an experimental setup that would allow you to determine changes in reaction rate over time as the reaction progresses.
Copyright © 2013 by The Home Scientist, LLC Revision 1.0.7 – 10 January 2013

The Home Scientist, LLC CK01A Instruction Manual 114
Topic VI. KineticsSession VI-2: Determining the Effect of a Catalyst on Reaction Rate
Advance Preparation:
Session:
Obtain blood or “meat juice”. (See text)
90 to 120 minutes
Materials from Kit
□ Goggles□ Beaker, 50 mL□ Graduated cylinder, 10 mL□ Pipettes□ Potassium permanganate, 0.1 M
□ Sharpie marking pen□ Sulfuric acid, 1.0 M□ Test tubes□ Test tube rack
Materials You Provide
□ Gloves□ Hydrogen peroxide, 3% (drugstore)□ Blood or “meat juice” (see text)
□ Water, distilled□ Watch or clock with second hand□ Graph paper (graphing calculator/software)
Concepts and Vocabulary
□ Catalyst
□ Activation energy
Background
A catalyst is a substance that increases the rate of a chemical reaction, but is not consumed or changed by the reaction. A catalyst works by reducing the activation energy needed to initiate and sustain the reaction. For example, two molecules of hydrogen peroxide can react to form two molecules of water and one molecule of molecular oxygen gas by the following reaction:
2 H2O2(aq) → 2 H2O(l) + O2(g)
At room temperature, this reaction occurs very slowly because few of the collisions between hydrogen peroxide molecules have sufficient energy to activate the reaction. Furthermore, commercial hydrogen peroxide solutions, such as the 3% hydrogen peroxide solution sold in drugstores and the 6% solution sold by beautician supply stores, are treated with stabilizers (sometimes called negative catalysts) that increase the activation energy for the reaction, further inhibiting it from occurring.
If you add a catalyst to a solution of hydrogen peroxide, the effect is immediately evident. The solution begins bubbling, as oxygen gas is evolved. Numerous substances can catalyze the reaction of hydrogen peroxide to water and oxygen gas, including many metal oxides such as manganese dioxide, but the efficiency of catalysts varies. One of the most efficient catalysts for hydrogen peroxide is the enzyme catalase, which is contained in blood. (Catalase functions in the body as a peroxide scavenger, destroying peroxide molecules that would otherwise damage cells.)
Copyright © 2013 by The Home Scientist, LLC Revision 1.0.7 – 10 January 2013

The Home Scientist, LLC CK01A Instruction Manual 115
One catalase molecule can catalyze the reaction of millions of hydrogen peroxide molecules per second. Immediately after each pair of hydrogen peroxide molecules reacts, catalyzed by the catalase molecule, that catalase molecule is released unchanged and becomes available to catalyze the reaction of another pair of hydrogen peroxide molecules. When all of the hydrogen peroxide has reacted to form water and oxygen gas, you end up with as many catalase molecules remaining as you started with.
Note: We couldn't include catalase in the kit because it is unstable and must be shipped refrigerated. Fortunately, there's an convenient local source of catalase. Take a centrifuge tube to the meat counter at your supermarket and ask them to fill it with animal blood or “meat juice”. If you explain that it's for a school science project they'll almost certainly be happy to help. For the purpose of this lab session, dilute the liquid they give you, if necessary, with water until it is a very pale pink color.
In this lab session, we'll measure the reaction rate of the catalyzed reaction of hydrogen peroxide by adding a fixed amount of catalase enzyme to measured samples of hydrogen peroxide. After allowing the reaction to continue for measured periods of time, we'll stop the reaction by adding sulfuric acid to denature (deactivate) the catalase and then titrate the resulting solutions with a dilute solution of potassium permanganate to determine how much unreacted hydrogen peroxide remains in each sample. In acidic solution, the intensely purple permanganate (MnO4-) ion reacts with hydrogen peroxide to form the light brown Mn2+ ion according to the following equation:
5 H2O2(aq) + 2 MnO4-(aq) + 6 H+(aq) → 2 Mn2+(aq) + 8 H2O(l) + 5 O2(g)
Because the purple color of the permanganate ion is so intense, the titrant can serve as its own indicator for this titration. As long as hydrogen peroxide remains in excess, MnO4- ions are quickly reduced to Mn2+ ions, and the solution remains a light brown color. As soon as permanganate ions are slightly in excess, the solution assumes a purple color. By determining the amount of permanganate titrant required, we can calculate the amount of hydrogen peroxide that remained in the original samples.
Goals
This lab session has the following goals:
□ Determine experimentally the effect of a catalyst on reaction rate
Procedure
1. If you have not done so already, put on your goggles and gloves. Review the hazards of each chemical you will use.
2. Transfer about 8 mL of distilled water to the 10 mL graduated cylinder. Add 2.0 mL of 1 M sulfuric acid and stir with the pipette tip to mix the solution. Draw up about 1 mL of the sulfuric acid solution into that pipette, and leave that pipette in the graduated cylinder for later use.
3. Label six test tubes A through F and place them in the test tube rack. Test tube A is the control tube; we will not add catalase solution to it. We'll add equal amounts of catalase to each of the other tubes and allow the reaction to proceed for measured times before dousing the solutions with sulfuric acid to deactivate the catalase and then determining by titration how much hydrogen peroxide remains in each tube.
Copyright © 2013 by The Home Scientist, LLC Revision 1.0.7 – 10 January 2013

The Home Scientist, LLC CK01A Instruction Manual 116
4. Use clean pipettes to transfer as accurately as possible 0.5 mL of hydrogen peroxide and about 2.0 mL of distilled water to each test tube.
5. Use a clean pipette to draw up 0.25 mL of the catalase solution. Note the position of the second hand on the watch or clock as you squirt the catalase solution directly into the solution in test tube F. Swirl the solution in the tube to mix it.
Note: Observe the speed of the reaction in test tube F. If the reaction is very vigorous, refill the tube with the water/hydrogen peroxide solution and repeat the test using more dilute catalase solution or less of the current catalase solution. (One drop may suffice, depending on the strength of the solution.) The goal is to have a catalase concentration high enough to provide visible bubbling, but not so high that the reaction completes too quickly. If the concentration of catalase is correct, bubbles should still be forming gradually after four minutes. Once you determine an appropriate concentration/amount of catalase, use the same for each of the other tubes.
6. As the second hand passes the four-minute (240 seconds) mark, squirt the contents of the sulfuric acid pipette into test tube F and swirl the tube to mix the contents. Record the time of the reaction in your lab notebook. Replace the test tube in the rack and refill the pipette with about 1 mL of the dilute sulfuric acid solution.
7. Repeat steps 5 and 6 for test tubes E, D, C, and B, using times of 120, 60, 30, and 15 seconds respectively.
8. Fill a clean pipette with 0.1 M potassium permanganate solution, and begin adding the potassium permanganate solution dropwise to test tube A with swirling, counting each drop as you add it.
Note: As violet Mn(VII) ions react with hydrogen peroxide, they are reduced to brown Mn(II) ions. When all of the hydrogen peroxide has been consumed, the next drop of permanganate solution has no peroxide left to react with, and so tints the contents of the test tube violet.
Depending on the exact concentration of your hydrogen peroxide solution, test tube A should require approximately 60 drops (~ 1.75 mL) of 0.1 M potassium permanganate to reach the end point. The other tubes—in which some of the hydrogen peroxide has been consumed by the reaction catalyzed by the catalase solution—will require correspondingly less potassium permanganate to reach their end points.
9. Repeat step 8 for test tubes B, C, D, E, and F.
The number of drops of potassium permanganate required to reach the end point in each tube is proportional to the amount of hydrogen peroxide remaining in each tube. Graph the amount of hydrogen peroxide against the reaction time.
Clean-up and Disposal
Wash and dry the equipment. All the products produced in this lab session are nonhazardous and can be discarded with household garbage or flushed down the drain with water.
Review Questions
1. What effect did you observe the catalase catalyst to have on reaction rate?
2. Based on the data you recorded in Table 12-4, is the effect of the catalyst on reaction rate linear? If not, propose an explanation.
Copyright © 2013 by The Home Scientist, LLC Revision 1.0.7 – 10 January 2013

The Home Scientist, LLC CK01A Instruction Manual 117
3. Would you expect the reaction rate to increase, decrease, or remain the same if you increased the amount of catalyst? Why?
4. When you begin a titration of a reacted hydrogen peroxide solution, you find that the first drop of potassium permanganate titrant causes the solution to assume a purple color. What has happened?
Copyright © 2013 by The Home Scientist, LLC Revision 1.0.7 – 10 January 2013

The Home Scientist, LLC CK01A Instruction Manual 118
Topic VI. KineticsSession VI-3: Determining a Reaction Order
Advance Preparation:
Session:
None
90 to 120 minutes
Materials from Kit
□ Goggles□ Reaction plate, 24-well□ Pipettes
□ Thermometer□ Hydrochloric acid, 6 M□ Sodium thiosulfate, 1 M
Materials You Provide
□ Gloves□ Desk lamp or other bright light source□ Clock or watch with second hand□ Toothpicks
□ Newspaper or other printed matter□ Distilled water□ Graphing paper/calculator/software
Concepts and Vocabulary
□ Disproportionation reaction
□ Catalysis
□ Reaction order
□ Colloidal solids
Background
Back in 1965, aged 12, the author was working in his new darkroom, mixing up his first batch of fixer from individual chemicals. He'd dissolved some sodium thiosulfate (“hypo”) in a pint of water and added some glacial acetic acid. His mother yelled down the stairs that it was time for lunch before he could weigh out the sodium sulfite and add it to the solution.
When he returned an hour or so later, he found that his nice clear solution of fixer had turned a milky white color. He didn't appreciate it at the time, but he'd just gotten a demonstration of Le Chatelier's Principle (see the following chapter) and the acid-catalyzed disproportionation of thiosulfate ions to sulfite ions and elemental sulfur.
S2O32- → S + SO32-
The white turbidity in his fixer solution was colloidal elemental sulfur produced by the above reaction. Had he added the sodium sulfite to the solution before leaving for lunch, the sulfite ions from the sodium sulfite would have forced the equilibrium far to the left, preventing the formation of colloidal sulfur. (Not knowing that colloidal solids are fine enough to pass through filter paper unhindered, he filtered the solution to no effect; he ended up using it anyway, because as a 12-year-old kid he didn't have the money to replace the chemicals. Surprisingly, the turbid solution worked just fine to fix the prints he processed that day.)
In this lab session, we'll reproduce that reaction intentionally, varying the thiosulfate ion concentration to determine the effect of concentration on reaction rate. We'll run the reactions
Copyright © 2013 by The Home Scientist, LLC Revision 1.0.7 – 10 January 2013

The Home Scientist, LLC CK01A Instruction Manual 119
in a transparent reaction plate, keeping the total volume of liquid in each well constant, and determine the endpoint visually by noting for each thiosulfate concentration the time required for the colloidal sulfur formed by the reaction to cause the solution in the well to become opaque. By obtaining many data points and graphing concentration against time, we'll determine if this disproportionation reaction is zeroth, first, or second order with respect to thiosulfate ion.
Goals
This lab session has the following goal:
□ Determine the reaction order with respect to sodium thiosulfate of the acid-catalyzed disproportionation of thiosulfate ions to sulfite ions and elemental sulfur.
Procedure
This lab session has three parts. In Part I, we'll prepare solutions and test and populate the reaction plate with thiosulfate solutions of varying concentrations. In Part II, we'll run the reactions and determine the time required to reach a standard endpoint with each of the solutions. In Part III, we'll analyze our data to determine reaction order with respect to thiosulfate.
Part I – Prepare solutions and test and populate the reaction plate
In this part of the lab session, we'll set up the 24-well reaction plate by filling a dozen of its wells with different concentrations of sodium thiosulfate solution. Because temperature, lighting, and other experimental conditions vary, we must first determine what total solution volume is needed in each well to make sure sufficient colloidal sulfur is formed in a reasonable time to obscure the printing beneath the reaction plate. We'll do that by running one well with the most concentrated thiosulfate solution and determining how long is needed for the reaction to complete.
1. If you have not already done so, put on your goggles, gloves, and protective clothing.
2. Transfer about 1.5 mL of 1 M sodium thiosulfate solution and 7.5 mL of distilled water to a test tube. Stir the solution with the tip of the pipette and draw up and expel solution from the pipette several times to mix the solution thoroughly. Retain this pipette for later use, making sure you remember it is to be used with the sodium thiosulfate solution.
Note: Approximate volumes are acceptable here. Our goal is to produce a solution of about 1/6 molar sodium thiosulfate. The exact molarity is not critical for either solution.
3. Place the reaction plate on the graph paper (or a newspaper or other patterned background) and turn on the desk lamp or other light source. Adjust the lamp to illuminate the reaction plate strongly without glare.
4. Transfer 24 drops of the thiosulfate solution to one of the wells in the reaction plate.
5. Mark the time as you transfer 2 drops of hydrochloric acid to the same well in the reaction plate and stir the contents of the well with a plastic toothpick to mix the solutions.
6. Observe the well as colloidal sulfur forms. The sulfur is first visible as a faint milky haze in the well. As time passes, more colloidal sulfur forms and the liquid in the well
Copyright © 2013 by The Home Scientist, LLC Revision 1.0.7 – 10 January 2013

The Home Scientist, LLC CK01A Instruction Manual 120
becomes increasingly opaque.
Note: If after 30 seconds the colloidal sulfur has not obscured the graph paper or other patterned background under that well of the reaction plate, you'll need to increase the concentration of the thiosulfate solution. Add another 1 mL or so of the 1 M thiosulfate solution to the test tube, mix thoroughly, and retest.
If the colloidal sulfur obscures your patterned background in 15 seconds or less, dilute the thiosulfate solution by adding water. Judge the amount of water to add based on how quickly the reaction occurred. Mix the solution thoroughly and retest.
The goal is to have the thiosulfate solution in its original dilution take 15 to 30 seconds to obscure the background. Anything less than 15 seconds risks introducing timing and other experimental errors; anything more than 30 seconds unnecessarily extends the time needed to complete the experiment.
7. Wash the reaction plate, using a cotton swab to scrub out any colloidal sulfur adhering to the well, and dry the plate.
8. Fill 12 wells of the 24-well reaction plate with thiosulfate solution and water, as shown in Table 1.
Table 1 – reaction plate setup (drops/well)
Well # Thiosulfate Water Well # Thiosulfate Water
A1 2 22 B1 14 10
A2 4 20 B2 16 8
A3 6 18 B3 18 6
A4 8 16 B4 20 4
A5 10 14 B5 22 2
A6 12 12 B6 24 0
Part II – Determine reaction rates
In this part of the lab session, we'll measure reaction rates for the various concentrations of thiosulfate ions. To save time, we want to run the reaction simultaneously in as many wells as possible, but we also want to avoid having the reactions in different wells reach their end points too closely together. To get a preliminary estimate of how many and which wells to run at the same time, we consider the following:
If the reaction is zeroth order with respect to thiosulfate ion concentration, the time required to reach the endpoint will be the same for each well, within experimental error.
If the reaction is first order with respect to thiosulfate ion concentration, the time required to reach the endpoint will be proportional to concentration. For example, halving the concentration will double the time required to reach the endpoint.
If the reaction is second order with respect to thiosulfate ion concentration, the time required to reach the endpoint will be proportional to the square of the concentration.
Copyright © 2013 by The Home Scientist, LLC Revision 1.0.7 – 10 January 2013

The Home Scientist, LLC CK01A Instruction Manual 121
For example, halving the concentration will quadruple the time required to reach the endpoint.
Because our most concentrated thiosulfate solution is 12 times more concentrated than our least concentrated thiosulfate solution, the reaction time in the least concentrated well will be 12 times longer than the reaction time in the most concentrated well, if the reaction is first order. For example, if the reaction time in the most concentrated well is 30 seconds, the reaction time in the least concentrated well will be (30 sec * 12) = 360 sec = 6 min.
But if the reaction is second order, the reaction time in the least concentrated well will be 122
= 144 times longer than the reaction time in the most concentrated well. For example, if the reaction time in the most concentrated well is 30 seconds, the reaction time in the least concentrated well will be (30 sec * 122) = 4,320 sec = 72 min.
Because we don't yet know if the reaction is zeroth, first, or second order with respect to thiosulfate ion concentration, we could waste a lot of time if we simply react the wells sequentially and the reaction turns out to be second order. On the other hand, we don't want to have too many wells reacting simultaneously if the reaction is first (or, worse, zeroth) order, because things would be happening too fast to time accurately. Accordingly, we'll react the wells out of sequence to make an early estimation of reaction order. With that information in hand, we can make an informed decision about how many and which wells to react simultaneously.
1. If you have not already done so, put on your goggles, gloves, and protective clothing.
2. Place the populated reaction plate on the graph paper (or other patterned background) and turn on the desk lamp or other light source. Adjust the lamp to illuminate the reaction plate strongly without glare.
3. Mark the time as you transfer 2 drops of hydrochloric acid to well B6 (the most concentrated thiosulfate solution) and stir the contents of the well with a plastic toothpick to mix the solutions.
4. Observe the well as colloidal sulfur forms. The sulfur is first visible as a faint milky haze in the well. As time passes, more colloidal sulfur forms and the liquid in the well becomes increasingly opaque.
5. Just as the colloidal sulfur first completely obscures the graph paper, mark that time as the endpoint. Record the actual elapsed time (tact) in Table 2 and in your lab notebook.
6. Repeat steps 3 through 5 for well A6, which has a thiosulfate ion concentration half that of well B6.
7. Repeat steps 3 through 5 for well A3, which has a thiosulfate ion concentration half that of well A6 and a quarter that of well B6.
The times required to reach the endpoint in wells B6 and A6 will probably be sufficient to make a good estimate of reaction order. If the reaction times of wells B6 and A6 are very similar, it's likely the reaction order with respect to thiosulfate ion concentration is zeroth; if well A6 takes about twice as long to reach the endpoint as did well B6, it's likely the reaction order is first; if well A6 takes about four times as long to reach the endpoint as did well B6, it's likely the reaction order is second. Just to make sure, we run the reaction in well A3, which has half the thiosulfate ion concentration of well A6 and quarter that of well B6. From those three data points, we can make a confident determination of reaction order.
8. Based on the actual elapsed times for wells B6, A6, and A3, estimate the reaction
Copyright © 2013 by The Home Scientist, LLC Revision 1.0.7 – 10 January 2013

The Home Scientist, LLC CK01A Instruction Manual 122
order. Use that reaction order value to calculate and fill in estimated reaction times (test) for the remaining wells. Tables 3 through 5 show examples (with made-up data) of the results you might expect if the reaction is zeroth, first, or second order, respectively.
9. Repeat steps 3 through 5 for the remaining wells, using the estimated times you determined in the preceding step to decide how many and which wells to run simultaneously. (If your estimated time for the one or two most dilute wells is excessive, just don't run that well or wells.)
Note: If running just two or three wells gives us a good idea of the actual reaction order, why run the other nine wells? Two reasons:
First, we want many data points to provide a smooth graph and minimize the effect of experimental error for any one data point.
Second, reaction orders are not always integers. It's quite possible to have a reaction order of, say, 1.5. With only two or three data points, particularly given experimental uncertainty, we might mistake that fractional reaction order for a first or second order reaction. If our actual reaction order is fractional, we may need these additional data points to determine it accurately.
Table 2 – observed data
Well # tact test Well # tact test
A1 _____ s _____ s B1 _____ s _____ s
A2 _____ s _____ s B2 _____ s _____ s
A3 _____ s n/a B3 _____ s _____ s
A4 _____ s _____ s B4 _____ s _____ s
A5 _____ s _____ s B5 _____ s _____ s
A6 _____ s n/a B6 _____ s n/a
Table 3 – example data (zeroth order)
Well # tact test Well # tact test
A1 _____ s 30 s B1 _____ s 30 s
A2 _____ s 30 s B2 _____ s 30 s
A3 30 s n/a B3 _____ s 30 s
A4 _____ s 30 s B4 _____ s 30 s
A5 _____ s 30 s B5 _____ s 30 s
A6 30 s n/a B6 30 s n/a
Copyright © 2013 by The Home Scientist, LLC Revision 1.0.7 – 10 January 2013

The Home Scientist, LLC CK01A Instruction Manual 123
Table 4 – example data (first order)
Well # tact test Well # tact test
A1 _____ s 360 s B1 _____ s 51 s
A2 _____ s 180 s B2 _____ s 45 s
A3 120 s n/a B3 _____ s 40 s
A4 _____ s 90 s B4 _____ s 36 s
A5 _____ s 72 s B5 _____ s 33 s
A6 60 s n/a B6 30 s n/a
Table 5 – example data (second order)
Well # tact test Well # tact test
A1 _____ s 4320 s B1 _____ s 88 s
A2 _____ s 1080 s B2 _____ s 68 s
A3 480 s n/a B3 _____ s 53 s
A4 _____ s 270 s B4 _____ s 43 s
A5 _____ s 173 s B5 _____ s 36 s
A6 120 s n/a B6 30 s n/a
Part III – Analyze data to determine reaction order
Once you have experimental values for all (or most) of the wells, you can determine reaction order mathematically or graphically. Recall that the general rate law for a chemical reaction is:
rate = k·[A]a·[B]b·[C]c
where k is the reaction rate constant for the reaction in question; [A], [B], and [C] are the concentrations in moles/liter of the reactants and catalyst(s); and the exponents a, b, and c are values that must be determined experimentally, and which may or may not be the same as the coefficients for A, B, and C in the balanced chemical equation. The reaction order is the sum of those exponents. For our reaction, the rate law can be written as:
rate = k·[S2O32-]a·[H3O+]b
But because we're using a large excess of hydrochloric acid, we can assume that [H3O+], the concentration of the hydronium ion, remains constant, and simplify the rate law to:
rate = k'·[S2O32-]a
where k' represents a pseudo rate constant that incorporates the unchanging H3O+
Copyright © 2013 by The Home Scientist, LLC Revision 1.0.7 – 10 January 2013

The Home Scientist, LLC CK01A Instruction Manual 124
concentration. Thus simplified, the overall reaction order equals a, the exponent of the thiosulfate ion concentration.
Furthermore, because only a tiny percentage of the thiosulfate reactant in each well must react to produce sufficient colloidal sulfur to obscure the graph paper beneath the well, the concentration of thiosulfate ion in each well remains effectively constant. Therefore, we can simplify the rate expression:
Δ[S2O32-]/Δt
by substituting a constant for Δ[S2O32-] to:
1/Δt
In other words, graphing 1/Δt is the same as graphing a constant times the reaction rate. Because the reaction rate equals k'·[S2O32-]a, graphing the inverse of the rate against [S2O32-] provides a visual indication of reaction order.
Graph your results, placing the number of drops of thiosulfate solution on the y-axis and the inverse of the time required for the colloidal sulfur to obscure the underlying graph paper on the x-axis. If the overall reaction order, a, is zeroth, the graph will be a straight line parallel to the y-axis; if the overall reaction order is first, the graph will be a sloped straight line that passes through the origin; if the overall reaction order is second, the graph will be a parabola.
Clean-up and Disposal
Wash and dry the equipment. In particular, use a cotton swab to clean the wells in the reaction plate. Colloidal sulfur can cling tenaciously to the plastic, particularly if you allow it to dry. The small amounts of hydrochloric acid and sodium thiosulfate solution left can be flushed down the drain with water.
Review Questions
1. Is the reaction curve you graphed linear, or nearly so? If so, how do you explain any small departures from absolute linearity?
2. Is the reaction rate directly proportional to concentration?
3. What is the reaction order with respect to thiosulfate ion? How did you determine this?
Copyright © 2013 by The Home Scientist, LLC Revision 1.0.7 – 10 January 2013

The Home Scientist, LLC CK01A Instruction Manual 125
VIIChemical Equilibrium
In a chemical reaction, chemical equilibrium is the state in which the concentrations of the reactants and products exhibit no net change over time. This state occurs when the forward reaction rate (conversion of reactants to products) is equal to the reverse reaction rate (conversion of products to reactants). These reaction rates are generally greater than zero, but, because the rates are equal, reactants are converted to products at the same rate products are converted to reactants, yielding zero net change in the concentrations of reactants and products. A system in this state is said to have achieved dynamic chemical equilibrium.
The equilibrium is referred to as dynamic because any change to the reaction environment in concentrations, temperature, volume, or pressure forces a corresponding change in the equilibrium state. For example, if a chemical reaction has achieved dynamic equilibrium and you add reactants, the state of the system changes to achieve a new dynamic equilibrium. Some (but not all) of the additional reactants react to form additional products, changing the concentrations of both the reactants and the products. Similarly, if you remove products from the reaction vessel, the dynamic equilibrium changes because additional reactants are converted to products.
The 19th century French chemist Henry Louis Le Chatelier the effect of environmental changes on dynamic chemical equilibrium in a short statement that is known to every chemist as Le Chatelier's Principle.
“If a chemical system that has achieved dynamic chemical equilibrium experiences an imposed change in concentration, temperature, volume, or pressure, the equilibrium state shifts to counteract, insofar as is possible, that imposed change.”
It's important to understand two things about Le Chatelier's Principle. First, the equilibrium change can (almost) never return the system to its original equilibrium state. For example, if you add reactants to a system that has achieved dynamic chemical equilibrium, the concentration of reactants at the new equilibrium state will be higher than it was at the original equilibrium state (although lower than it would have been without the change in equilibrium state). Second, Le Chatelier's Principle is qualitative rather than quantitative. That is, applying Le Chatelier's Principle tells you whether the reaction will be forced to the left (more reactants) or to the right (more products), but it cannot tell you how far the reaction will be forced or what the eventual concentrations of reactants and products will be.
Copyright © 2013 by The Home Scientist, LLC Revision 1.0.7 – 10 January 2013

The Home Scientist, LLC CK01A Instruction Manual 126
Topic VII. EquilibriumSession VII-1: Observe Le Châtelier's Principle in Action
Advance Preparation:
Session:
Chill one of the soft drinks; you can also prepare the saturated solutions needed in Part I ahead of time.
90 to 120 minutes
Materials from Kit
□ Goggles□ Beaker, 250 mL□ Hydrochloric acid□ Magnesium sulfate□ Pipettes□ Reaction plate, 24-well
□ Stirring rod□ Spatula□ Test tubes□ Test tube rack□ Wire gauze
Materials You Provide
□ Gloves□ Desk lamp or other strong light source□ Hotplate or stove burner□ paper, black
□ Refrigerator□ Sodium carbonate (from Session II-1)□ Soft drinks (2 fresh bottles)
Concepts and Vocabulary
□ Le Châtelier's Principle
□ Dynamic equilibrium state
□ Common ion effect
Background
Le Châtelier's Principle tells us that forcing a change in concentration, temperature, volume, or pressure changes the dynamic equilibrium state. In this lab, we'll examine various reactions that are in a state of dynamic chemical equilibrium, force changes to each of these characteristics, and observe the results.
Goals
This lab session has the following goals:
□ Observe the effect of concentration, temperature, volume, and pressure on dynamic equilibrium
□ Observe the common ion effect
Procedure
This lab has four parts, one each to examine the effect of concentration, temperature, volume, and pressure on dynamic equilibrium states.
Copyright © 2013 by The Home Scientist, LLC Revision 1.0.7 – 10 January 2013

The Home Scientist, LLC CK01A Instruction Manual 127
Part I – Examine the effect of concentration on equilibrium
In Part I, we'll observe the effect of changing the concentration of the reactant ions on a saturated solution of sodium chloride (NaCl). That solution contains sodium ions (Na+) and chloride ions (Cl-). To saturated sodium chloride solution samples, we'll add concentrated hydrochloric acid (which contains Cl- ions but not Na+ ions), saturated sodium carbonate solution (which contains Na+ ions but not Cl- ions), and saturated magnesium sulfate solution (which contains neither), and observe the effects on the saturated sodium chloride solution.
1. If you have not done so already, put on your goggles and gloves. Review the hazards of each chemical you will use.
2. Prepare saturated solutions of sodium carbonate and magnesium sulfate by adding the solid salts to about 2 mL of water in two labeled test tubes. Swirl the solutions to ensure that the solids dissolve, and continue adding the solid salts until some of them remain undissolved at the bottom of each test tube.
3. Prepare a saturated solution of sodium chloride by adding solid sodium chloride (table salt) to about 100 mL of water in the 250 mL beaker. Stir the solution to ensure that the sodium chloride dissolves completely, and continue adding sodium chloride until some of it remains undissolved at the bottom of the beaker.
4. Place the reaction plate on a sheet of black paper under a strong light.
5. Use a pipette to transfer 1.0 mL of the saturated sodium chloride solution to each of wells A1, B1, C1, and D1.
6. Add hydrochloric acid dropwise to well A1, observing any change that occurs as each drop is added. Continue adding drops until a change is evident or you have added 20 drops. Record your observations in your lab notebook.
7. Add saturated sodium carbonate solution dropwise to well B1, observing any change that occurs as each drop is added. Continue adding drops until a change is evident or you have added 20 drops. Record your observations in your lab notebook.
8. Add saturated magnesium sulfate solution dropwise to well C1, observing any change that occurs as each drop is added. Continue adding drops until a change is evident or you have added 20 drops. Record your observations in your lab notebook.
9. Add water dropwise to well D1, observing any change that occurs as each drop is added. Continue adding drops until a change is evident or you have added 20 drops. Record your observations in your lab notebook.
Part II – Examine the effect of temperature on equilibrium
In a saturated solution of sodium chloride, solid sodium chloride exists in equilibrium with aqueous sodium ions and chloride ions. Le Châtelier's Principle tells us that changing the temperature of the reaction environment will cause a change in that dynamic chemical equilibrium, but we have no way of knowing the direction of that change. Intuitively, we expect that more sodium chloride will dissolve in a given volume of water at a higher temperature, so we'll test that hypothesis.
1. If you have not done so already, put on your goggles and gloves. Review the hazards of each chemical you will use.
Copyright © 2013 by The Home Scientist, LLC Revision 1.0.7 – 10 January 2013

The Home Scientist, LLC CK01A Instruction Manual 128
2. Make sure that at least a light scattering of crystals of solid sodium chloride are visible on the bottom of the 250 mL beaker. If not, add a tiny amount of salt until the bottom of the beaker is lightly covered with scattered salt crystals. Stir the contents to make sure that the solution is in fact saturated and that some crystals remain.
3. Place the 250 mL beaker on the hotplate, using the wire gauze to protect the beaker from direct contact with the hot burner surface.
4. Turn the hotplate to low heat and observe the crystals on the bottom of the beaker. Record your observations in your lab notebook.
Part III – Examine the effect of volume on equilibrium
In a saturated solution of sodium chloride, solid sodium chloride exists in equilibrium with aqueous sodium ions and chloride ions. Le Chatelier's Principle tells us that changing the volume of the solvent will cause a change in that dynamic chemical equilibrium. Intuitively, we expect that if X g of sodium chloride dissolves in Y mL of water, increasing the amount of water will increase the amount of sodium chloride that dissolves, so let's test that hypothesis.
1. If you have not done so already, put on your goggles and gloves. Review the hazards of each chemical you will use.
2. Transfer about 3 mL of the saturated sodium chloride solution from the beaker to a test tube.
3. Add a tiny amount of solid sodium chloride to the tube, just enough so that a light scattering of salt crystals is visible at the bottom of the tube.
4. Use a pipette to add 1 mL of water to the tube. Swirl the tube and observe the results. Record your observations in your lab notebook.
Part IV – Examine the effect of pressure (and temperature) on equilibrium
Le Châtelier's Principle says that changing the pressure of the reaction environment will change the dynamic chemical equilibrium. Carbonated soft drinks contain dissolved carbon dioxide gas, which is more soluble at higher pressures. If we reduce the pressure, we expect the soft drink solution to reduce the concentration of dissolved carbon dioxide by liberating carbon dioxide gas. (You may want to do this experiment outdoors to avoid making a mess indoors.) Let's test that hypothesis.
1. If you have not done so already, put on your goggles and gloves. Review the hazards of each chemical you will use.
2. Leaving it capped, shake the chilled sealed bottle of carbonated soft drink. (Agitating the sealed bottle mixes small bubbles of the carbon dioxide gas in the “empty” part of the bottle into the liquid, providing loci for the dissolved carbon dioxide to come out of solution.)
3. Immediately after you give the carbonated soft drink bottle a thorough shaking, point the mouth in a safe direction and remove the cap.
4. Repeat steps 2 and 3 with the room temperature bottle of carbonated soft drink.
5. Clean up.
Copyright © 2013 by The Home Scientist, LLC Revision 1.0.7 – 10 January 2013

The Home Scientist, LLC CK01A Instruction Manual 129
Clean-up and Disposal
Wash and dry the equipment. All the products produced in this lab session are nonhazardous and can be discarded with household garbage or flushed down the drain with water.
Review Questions
1. In Part I, what was the purpose of well D1? Why did we add water to that well?
2. In Part I, what substance was formed as you added concentrated hydrochloric acid to the saturated solution of sodium chloride? Why?
3. In Part I, what substance was formed as you added saturated sodium carbonate solution to the saturated solution of sodium chloride? Why?
4. In Part I, explain what occurred when you added the saturated magnesium sulfate solution.
5. If you repeated Part I in a pressure chamber at 10 atmospheres, would you expect different results? Why or why not?
6. In Part II, we observed the qualitative effect of temperature on the dynamic equilibrium of a saturated sodium chloride solution. If you were charged with designing an experiment to obtain quantitative data, how would you proceed?
7. In Part III, we observed the effect of increasing the volume of solvent on the dynamic equilibrium of a saturated sodium chloride solution. Is it possible that, for some compounds, increasing the volume of solvent would reduce the amount of solute that dissolved? Why or why not?
8. In Part IV, we observed the effect of pressure on the dynamic equilibrium of a carbonated soft drink at two different temperatures. The differing results at the two temperatures illustrate the concept of retrograde solubility, which is the chemist's way of referring to a compound that is less soluble at higher temperature. What mechanism explains the lower solubility of carbon dioxide gas in water at higher temperatures?
Copyright © 2013 by The Home Scientist, LLC Revision 1.0.7 – 10 January 2013

The Home Scientist, LLC CK01A Instruction Manual 130
Topic VII. EquilibriumSession VII-2: Determine a Solubility Product Constant
Advance Preparation:
Session:
None
90 to 120 minutes
Materials from Kit
□ Goggles□ Calcium nitrate□ Centrifuge tube, 15 mL□ Pipettes
□ Reaction plate, 24-well□ Oxalic acid□ Phenolphthalein□ Sodium hydroxide
Materials You Provide
□ Gloves□ Desk lamp or other strong light source
□ Paper or cloth (black)□ water (distilled)
Concepts and Vocabulary
□ Solubility product constant
Background
The coexistence of an ionic solid and its component ions in solution is one example of a chemical equilibrium. This equilibrium can be quantified using the solubility product principle, which states that in a saturated solution of an ionic compound the product of the molar activities, called the solubility product constant or Ksp, has a constant value at any particular temperature and pressure.
Because ionic activities are very difficult to determine accurately and molarities are easy to determine, solubility product calculations are normally performed using molarity values. For dilute solutions, using molarities rather than activities introduces only tiny errors, because molarity and activity are nearly identical in dilute solutions. For concentrated solutions, molarity and activity may differ significantly, so solubility product calculations, although useful for sparingly soluble ionic compounds, are of limited use for very soluble ionic compounds.
Consider the sparingly soluble salt silver chloride. In a saturated aqueous solution of silver chloride, the silver and chlorine are present primarily as solvated silver ions and chlorine ions. (Solvated ions are ions that have bound to solvent molecules.) Undissociated molecular silver chloride exists in the solution, but it is present in such a tiny amount that it can be ignored. The following equilibrium equation describes the saturated silver chloride solution:
AgCl(s) Ag⇌ +(aq) + Cl-(aq)
The solubility product constant for this equilibrium is:
Ksp = [Ag+]·[Cl-]
Copyright © 2013 by The Home Scientist, LLC Revision 1.0.7 – 10 January 2013
The Home Scientist, LLC CK01A Instruction Manual 131
Square brackets in equilibrium expressions indicate molar concentration, so this expression is a short way to say that the solubility product constant is equal to the molar concentration of the silver ions multiplied by the molar concentration of the chloride ions. Because one molecule of silver chloride dissociates into one silver ion and one chloride ion, the concentrations of the silver ions and chloride ions are identical. Assigning that concentration the value x simplifies the expression to:
Ksp = x·x = x2
which means that the concentration of either ion is the square root of the Ksp. That means that if we know the Ksp we can determine the molar concentration, and vice versa. For example, if we know that the Ksp of silver chloride at a particular temperature and pressure is 1.8·10-10, we can rewrite the equilibrium expression as:
1.8·10-10 = x2
Solving for x (taking the square root of the Ksp) tells us that the molar concentrations of the silver ions and chloride ions are both 1.3·10-5, so a saturated solution of silver chloride at this temperature and pressure is 0.000013 M. The gram molecular mass of silver chloride is 143.32 g/mol, so a saturated silver chloride solution contains about 0.0019 g/L.
Conversely, if we know the molar solubility, we can calculate the Ksp. For example, if we know that a saturated solution of silver bromide at a particular temperature and pressure is 7.2·10-7
M, we can calculate the Ksp of silver bromide as follows:
Ksp = (7.2·10-7)2 = 5.2 x 10⁻¹³
Until now, we've considered only the simplest case, compounds in which a molecule dissociates into two ions. For ionic compounds that dissociate into three or more ions, the calculations are a bit more involved. Consider silver chromate, which dissociates as follows:
Ag2CrO4(s) 2 Ag⇌ +(aq) + CrO42-(aq)
We can no longer use simple squares and square roots, because each molecule of silver chromate dissociates into three ions—two silver ions and one chromate ion. We can generalize the solubility product constants for a salt AxBy that dissociates into the ions Ay+
and Bx- in the form:
Ksp = [Ay+]x·[Bx-]y
so, for silver chromate, Ag2(CrO4)1, the solubility product constant can be expressed as:
Ksp = [Ag+]2·[Cr2O42-]1
If we assign the molar concentration of the chromate ion as x, and knowing that the concentration of the silver ion is twice that of the chromate ion, the expression becomes:
Ksp = [2x]2·[x]1 = 4x3
Copyright © 2013 by The Home Scientist, LLC Revision 1.0.7 – 10 January 2013

The Home Scientist, LLC CK01A Instruction Manual 132
If we make up a saturated solution of silver chromate, we might determine by titration that the concentration of silver ion is 1.3·10-4 M, from which it follows that the concentration of the chromate ion must be 0.65·10-4 M, which can also be expressed as 6.5·10-5 M. Plugging these values into the equation yields:
Ksp = (1.3·10-4)2·(6.5·10-5)1 = 1.1·10-12
If the Ksp is known, we can determine the molar solubility of silver chromate as follows:
Ksp = 1.1·10-12 = 4x3
x3 = (1.1·10-12/4) = 2.8·10-13
x = 6.5·10-5
In principle, you can use solubility product constants to calculate molar solubilities of ionic salts. In practice, observed solubilities often differ significantly from such calculated values. Electrostatic interaction between ions can affect the results, particularly in any but very dilute solutions, and other equilibria occurring simultaneously in the solution can have a major impact. For example, the solubility of magnesium hydroxide varies greatly with the pH of the solution because of the common ion effect. Magnesium hydroxide is much more soluble in acid solutions, which have a very low [OH-] and correspondingly less soluble in basic solutions, which have a high [OH-]. Finally, the assumption that ionic substances fully dissociate in solution into simple solvated ions is not always true. For example, magnesium fluoride (MgF2) does not dissociate completely into Mg2+ and F- ions. Instead, some partially-dissociated magnesium fluoride is present as MgF+ ions.
In this lab session we'll experimentally determine the solubility product constant for calcium oxalate, CaC2O4.
Goals
This lab session has the following goals:
□ Understand the concept of solubility product constants
□ Experimentally determine the solubility product constant of calcium oxalate
Procedure
This lab session has three parts. In Part I, we'll prepare a 0.1 M solution of sodium oxalate. In Part II, we'll populate the reaction plate with various dilutions of calcium nitrate. In Part III, we'll react the calcium nitrate with sodium oxalate to form calcium oxalate. Finally, we'll use our experimental data to determine the solubility product constant of calcium oxalate.
Copyright © 2013 by The Home Scientist, LLC Revision 1.0.7 – 10 January 2013

The Home Scientist, LLC CK01A Instruction Manual 133
Part I – Prepare a 0.1 M sodium oxalate solution
We need a source of oxalate ions to react with the calcium nitrate. We could use oxalic acid directly as a source of oxalate ions, but oxalic acid does not dissociate completely in solution, which may complicate determining a solubility product constant for calcium oxalate. To eliminate this potential problem, we'll react the oxalic acid with sodium hydroxide to produce a solution of sodium oxalate, which dissociates fully in solution to sodium ions and oxalate ions.
1. If you have not done so already, put on your goggles and gloves. Review the hazards of each chemical you will use.
2. Transfer 3.0 mL of distilled water, 1.0 mL of 0.5 M oxalic acid, and one drop of phenolphthalein solution to a clean test tube, and swirl to mix the contents.
3. With swirling, add sodium hydroxide dropwise to the test tube just until the solution assumes a light pink color. The sodium hydroxide reacts with the oxalic acid to produce sodium oxalate in solution.
4. Add one or two drops of oxalic acid solution to the tube and then fill the tube to the 5.0 mL line with distilled water. Cap the tube and place it aside.
Part I – Populate the reaction plate
1. If you have not done so already, put on your goggles and gloves. Review the hazards of each chemical you will use.
2. Place the reaction plate on a sheet of black paper or cloth under a strong light.
3. Using a clean pipette, transfer 0.75 mL of distilled water to each of wells A2 through A6 and B1 through B6.
4. Using a clean, dry pipette, transfer 0.75 mL of 0.1 M calcium nitrate to well A1 of the reaction plate and 0.25 mL of 0.1 M calcium nitrate to well A2 of the reaction plate. At this point, you have 0.75 mL of 0.1 M calcium nitrate in well A1, 1.0 mL of 0.025 M calcium nitrate solution in well A2, and 0.75 mL of distilled water in each of the 10 remaining wells.
5. Draw up and expel the contents of well A2 several times to mix the solution. Withdraw 0.25 mL of the 0.025 M calcium nitrate solution from well A2 and transfer it to well A3. Return any unused calcium nitrate solution to well A2, and then use the pipette to draw up and expel the contents of well A3 several times to mix the solution.
6. Repeat the serial dilution procedure for wells A4 through A6 and then B1 through B6. When you finish the serial dilution, well A1 contains 0.75 mL of 0.1 M calcium nitrate, well A2 contains 0.75 mL of 0.025 M calcium nitrate, well A3 contains 0.75 mL of 0.00625 M calcium nitrate, and so on, down to well B5, which contains 0.75 mL of 9.54E-08 M calcium nitrate. The final well, B6, contains 1.0 mL of 2.38E-08 M calcium nitrate. Record the concentration of the calcium nitrate in each of the wells in your lab notebook.
7. To keep the amount of solution in all of the wells the same, draw up 0.25 mL of the solution in well B6 and discard it.
Copyright © 2013 by The Home Scientist, LLC Revision 1.0.7 – 10 January 2013

The Home Scientist, LLC CK01A Instruction Manual 134
Part III – Run the reaction
1. If you have not done so already, put on your goggles and gloves. Review the hazards of each chemical you will use.
2. Use a clean, dry pipette to withdraw 0.25 mL of 0.1 M sodium oxalate solution from the test tube and transfer it to well A1 of the reaction plate, but do not allow the tip of the pipette to contact the liquid in the well. Repeat this procedure to transfer 0.25 mL of sodium oxalate solution to each of the 11 remaining A and B wells. After you have transferred the sodium oxalate solution to all 12 wells, use the tip of the pipette to stir the contents of well B6 to mix it thoroughly. Do not draw the liquid up into the pipette; just use the tip to stir the contents of the well. Repeat for wells B5, B4, and so on, all the way to well A1.
3. Allow the calcium nitrate and sodium oxalate solutions to react for five minutes or so, and then examine the reaction plate under a strong light. Note the appearance of the A and B wells. A1, the well that contained the highest concentration of calcium nitrate, appears cloudy white due to a precipitate of calcium oxalate. B6, the well that contained the lowest concentration of calcium nitrate, shows no cloudiness. Determine which is the first (e.g, highest-concentration) well that contains no apparent cloudiness, and note that fact in your lab notebook.
4. Based on the calcium nitrate concentration in that well and the known concentration of oxalate ion in each well, calculate the solubility product constant for calcium oxalate.
Clean-up and Disposal
Wash and dry the equipment. All the products produced in this lab session are nonhazardous and can be discarded with household garbage or flushed down the drain with water.
Review Questions
1. What value did you obtain for the solubility product constant of calcium oxalate? How did you determine it?
2. The Ksp of lead chloride (PbCl2) is 1.6·10-5. What is solubility of lead chloride in g/L?
3. What is solubility of lead chloride in mol/L in 0.1 M hydrochloric acid? (Assume the HCL is fully dissociated.)
Copyright © 2013 by The Home Scientist, LLC Revision 1.0.7 – 10 January 2013

The Home Scientist, LLC CK01A Instruction Manual 135
Topic VII. EquilibriumSession VII-3: Observe the Characteristics of a Buffer Solution
Advance Preparation:
Session:
None
90 to 120 minutes
Materials from Kit
□ Goggles□ Acetic acid, 1 M (from session V-1)□ Centrifuge tubes, 15 mL□ Hydrochloric acid, 1 M (from session V-1)□ pH test paper
□ Pipettes□ Sodium hydroxide, 1 M (from session V-1)□ Test tubes□ Test tube rack□ Thymol blue
Materials You Provide
□ Gloves □ water (distilled)
Concepts and Vocabulary
□ Buffer solution
□ Conjugate acids and bases
□ Henderson-Hasselbalch equation
Background
A buffer solution is a solution of, usually, a weak acid and its conjugate base or, less commonly, a weak base and its conjugate acid. A buffer solution resists changes in the concentrations of the hydronium ion and hydroxide ion (and therefore pH) when the solution is diluted or when small amounts of an acid or base are added to it. The resistance of a buffer solution to pH change is based upon Le Châtelier's Principle and the common ion effect.
One common example of a buffer solution is a solution of acetic acid (the weak acid) and sodium acetate (its conjugate base). In solution, acetic acid reaches an equilibrium illustrated by the following equation.
CH3COOH(aq) + H2O(l) ⇌ CH3COO- + H3O+
As we've already learned, acetic acid does not dissociate completely in solution. For example, in a 1 M solution of acetic acid, only about 0.4% of the acetic acid molecules dissociate into hydronium and acetate ions, leaving most of the acetic acid in molecular form. Dissolving sodium acetate in the acetic acid solution forces the equilibrium to the left, reducing the hydronium ion concentration and therefore increasing the pH of the solution.
Consider what happens if you add a small amount of a strong acid or strong base to this buffer solution. Ordinarily, you would expect adding a small amount of a strong acid or base to cause a large change in the pH of a solution. But if you add hydrochloric acid (a strong acid) to the acetate/acetic acid buffer solution, the hydronium ions produced by the nearly complete dissociation of the hydrochloric acid react with the acetate ions to form molecular (non-
Copyright © 2013 by The Home Scientist, LLC Revision 1.0.7 – 10 January 2013

The Home Scientist, LLC CK01A Instruction Manual 136
dissociated) acetic acid. According to Le Châtelier's Principle, the equilibrium is forced to the left, reducing the concentration of hydronium and acetate ions, and increasing the concentration of the molecular acetic acid in the solution.
The acid dissociation constant for this buffer is:
Ka = [H3O+]·[CH3COO-]/[CH3COOH]
If the buffer solution contains equal amounts of acetic acid and sodium acetate, we can assume that the sodium acetate is fully dissociated and that dissociation of the acetic acid is negligible (because the high concentration of acetate ions from the sodium acetate drives the dissociation equilibrium for acetic acid far to the left). We can therefore assume that the concentrations of CH3COO- and CH3COOH are essentially identical, and simplify the equilibrium equation to:
Ka = [H3O+]
which means that the pH of this buffer solution is equal to the pKa.
If we add hydrochloric acid to the buffer solution, the HCl ionizes completely in solution, yielding hydronium ions and chloride ions. According to Le Châtelier's Principle, the increase in hydronium ions forces the acetic acid equilibrium to the left, decreasing the concentration of hydronium ions and increasing the concentration of molecular acetic acid. This equilibrium shift changes the effective number of moles of acetic acid and acetate ions, which can be calculated as follows:
final CH3COO- moles = initial CH3COOH moles - initial HCl moles
final CH3COOH moles = initial CH3COO- moles + initial HCl moles
Conversely, if we add sodium hydroxide to the buffer solution, the NaOH ionizes completely in solution, yielding hydroxide ions and sodium ions. According to Le Chatelier's Principle, the increase in hydroxide ions forces the acetic acid equilibrium to the right, decreasing the concentration of hydroxide ions and increasing the concentration of acetate ions. This equilibrium shift changes the effective number of moles of acetic acid and acetate ions, which can be calculated as follows:
final CH3COO- moles = initial CH3COOH moles + initial NaOH moles
final CH3COOH moles = initial CH3COO- moles - initial NaOH moles
In either case, after you calculate the number of moles of acetic acid and acetate ions, you can use the final volume of the solution to determine the concentration of the acetic acid and acetate ions and plug those values into the Henderson-Hasselbalch equation to determine the new pH.
pH = pKa + log10([CH3COO-]/[CH3COOH])
In this lab, we'll make up an equimolar 0.1 M acetate buffer solution using the 1 M solutions of acetic acid and sodium hydroxide we made up in session V-1. An equimolar acetate buffer contains the same number of moles of acetic acid and sodium acetate. We don't have sodium acetate, so we'll make it up on the fly by combining sodium hydroxide and acetic acid.
To make the buffer solution 0.1 M with respect to acetic acid, we'll dilute one volume of the 1 M acetic acid to a total of 10 volumes. But we can't simply add water to do that, because the buffer solution also needs to be 0.1 M with respect to sodium acetate. For that, we'll combine
Copyright © 2013 by The Home Scientist, LLC Revision 1.0.7 – 10 January 2013

The Home Scientist, LLC CK01A Instruction Manual 137
equal volumes of acetic acid and sodium hydroxide, which react to form sodium acetate. Combining one volume of acetic acid with one volume of sodium hydroxide and then making up the final volume to 10 would give us a 0.1 M solution of sodium acetate. That tells us we can make up the 0.1 M acetate buffer solution by combining two volumes of acetic acid with one volume of sodium hydroxide and seven volumes of water.
We'll add an indicator to our buffer solution to give us a quick visual indication of any major changes in pH as we add a strong acid or strong base to the buffer solution. We'll use thymol blue, which is red at pH 1.2 or lower (strongly acidic), blue at pH 9.6 or higher (moderately basic), and yellow in between. We'll then test both the buffer solution and distilled water by adding a strong acid or a strong base dropwise to the two solutions and observing the pH changes that occur.
Recall that the pH of 0.1 M hydrochloric acid is 1.0 and the pH of 0.1 M sodium hydroxide is 13.0. That means that if we start with 1.0 mL of distilled water and add 1 M hydrochloric acid dropwise, it should require only 2 or 3 drops to reduce the pH of the water to 1.0, which is sufficient to turn the indicator red. Conversely, if we start with 1.0 mL of distilled water and add 1 M sodium hydroxide, it should require only 1 or 2 drops to raise the pH to 9.6 or higher and thus turn the indicator blue. By counting the number of drops of 1 M hydrochloric acid or 1 M sodium hydroxide needed to effect similar changes in the buffer solution, we can get a good idea of how effective that buffer is at moderating changes in pH.
Goals
This lab session has the following goal:
□ Make up a buffer solution and observe its characteristics in comparison to water
Procedure
1. If you have not done so already, put on your goggles and gloves. Review the hazards of each chemical you will use.
2. Add 5 drops of thymol blue to 10 mL of distilled water in a centrifuge tube labeled “water”. Swirl the tube to mix the contents, cap it, and put it aside.
3. Add 5 drops of thymol blue to 5 mL of distilled water in a centrifuge tube labeled “acetate buffer”.
4. Using a clean pipette, transfer 1.0 mL of 1 M sodium hydroxide solution to the acetate buffer tube. Swirl to mix the contents, and cap the tube.
5. Using a clean pipette, transfer 2.0 mL of 1 M acetic acid solution to the acetate buffer tube. Fill the tube to the 10 mL line with distilled water, swirl to mix the contents, and cap the tube.
Note: The contents of both tubes should be distinctly yellow. If they are not add a few more drops of thymol blue.
6. Transfer 1 drop of each of the solutions to pieces of pH test paper. Wait 30 seconds and then compare the color of the test paper strip to the key on the vial. Record the approximate pH values for both solutions in your lab notebook.
7. Label three test tubes “water” and three test tubes “buffer”. Transfer about 3 mL of the corresponding solutions to each of the test tubes, and place the tubes in the rack.
Copyright © 2013 by The Home Scientist, LLC Revision 1.0.7 – 10 January 2013

The Home Scientist, LLC CK01A Instruction Manual 138
8. Fill a pipette with 1 M hydrochloric acid solution and begin adding the acid dropwise to the first of the “water” test tubes, counting drops. Swirl the tube gently after adding each drop, and note the number of drops necessary to cause the contents of the tube to turn red. Record this value in your lab notebook.
9. Repeat step 8, adding 1 M hydrochloric acid dropwise to the first of the “buffer” test tubes.
10.Repeat step 8, adding 1 M sodium hydroxide solution to the second of the “water” test tubes. (Use the third “water” tube for comparison.)
11. Repeat step 8, adding 1 M sodium hydroxide solution to the second of the “buffer” test tubes. (Use the third “buffer” tube for comparison.)
Clean-up and Disposal
Wash and dry the equipment. All the products produced in this lab session are nonhazardous and can be discarded with household garbage or flushed down the drain with water.
Review Questions
1. Based on the number of drops of a strong acid or strong base needed to cause the indicator to change color in the buffer solution compared to water, what do you conclude?How did the pH change compare in the buffer solution versus water?
2. Calculate the expected pH of the equimolar acetate buffer solution. How does the calculated value correspond to the observed value?
3. Assume you have on hand 0.5 M solutions of acetic acid and sodium acetate. You want to make up 100 mL of a pH 5.0 buffer solution to calibrate your pH meter. Calculate the amounts of acetic acid solution and sodium acetate solution required to make up this buffer solution.
Copyright © 2013 by The Home Scientist, LLC Revision 1.0.7 – 10 January 2013

The Home Scientist, LLC CK01A Instruction Manual 139
VIIIGas Chemistry
The study of gases and their chemistry, composition, properties, and interactions is an important part of general chemistry. By their nature, gases are more difficult to study than solids and liquids. Unlike solids and liquids, which tend to stay put in their containers, gases dissipate rapidly into the surrounding atmosphere. (Imagine studying liquids if you had to work under water.) Their low density relative to solids and liquids makes it difficult to weigh small volumes of gases accurately. Many gases are colorless and impossible to discriminate visually or by odor.
Despite these difficulties, gases have been studied intensively since chemistry evolved as a separate science in the late 18th century. Pioneers like Antoine-Laurent de Lavoisier, Carl Wilhelm Scheele, Joseph Priestley, and Joseph Louis Gay-Lussac built on the earlier work of the 17th century natural philosopher Robert Boyle to discover and explore the basic principles that govern the behavior of gases.
Naturally enough, early chemists thought of all gases as forms of air. As they isolated various gases experimentally—such as hydrogen, oxygen, carbon dioxide, chlorine, and others—in relatively pure forms, it soon became obvious that these new forms of “air” had properties much different from plain old air-air. Immersing a candle in oxygen, for example, caused it to burn fiercely, while carbon dioxide snuffed it out instantly. Accordingly, the early chemists named gases as airs with particular properties, not recognizing that each of these special “airs” was in fact a discrete chemical element or compound. It was not until the seminal works of Scheele, Lavoisier, and Priestley were published that scientists recognized these newfangled gases were in fact discrete chemical elements and compounds.
In addition to studying their chemical properties, these early gas chemists also studied the physical properties of gases, in particular the relationships between volume, pressure, and temperature. Anyone who has used a manual pump to inflate a tire or a basketball intuitively understands the relationship of these three characteristics of gases. As the plunger is depressed, the pressure increases, the volume decreases, and the pump gets noticeably warmer. When you used canned air, the opposite occurs. When you press the trigger, gas is released, increasing its volume and reducing its pressure, and the can gets noticeably colder, a phenomenon known as the Joule-Thompson effect.
In 1662, Boyle quantified the relationship between the volume of a gas and its pressure, a discovery that became known as Boyle's Law. In 1802, Gay-Lussac quantified the
Copyright © 2013 by The Home Scientist, LLC Revision 1.0.7 – 10 January 2013

The Home Scientist, LLC CK01A Instruction Manual 140
relationship between the volume of a gas and its temperature. That relationship became known as Charles' Law, chiefly because Gay-Lussac was kind enough to credit some preliminary unpublished work done about 15 years previously by the French chemist Jacques Charles. In 1809, Gay-Lussac set in place the third of the fundamental gas laws by quantifying the relationship between the pressure of a gas and its temperature, a relationship known as Gay-Lussac's Law. These three gas laws are inextricably related. All of them specify the relationship between volume, pressure, and temperature, with one of those held constant.
Boyle's Law states that, at constant temperature, the volume of a gas is inversely proportional to its pressure. For example, if you double the pressure of the gas you halve its volume and vice versa. Boyle's Law can be expressed as the equation:
V1 · P1 = V2 · P2
where the variables on the left side refer to the values before a change in volume or pressure and those on the right refer to the new values after the volume or pressure is changed. If any three of those values are known, the fourth can be determined algebraically.
Charles' Law states that, at constant pressure, the volume of a gas is proportional to its absolute temperature, specified in kelvins. For example, if you double the temperature of a gas you double its volume, and vice versa. Charles' Law can be expressed as the equation:
V1 · T2 = V2 · T1
where the variables subscripted one refer to the values before a change in volume or temperature and those subscripted two refer to the new values after the volume or temperature is changed. Again, if any three of those values are known, the fourth can be determined algebraically.
Knowing Boyle's Law and Charles' Law, you can derive Gay-Lussac's Law mathematically by substitution (as indeed you can derive any of these three laws if the other two are known). Gay-Lussac's Law states that, at constant volume, the pressure of a gas is proportional to its absolute temperature, specified in kelvins. For example, if you double the temperature of a gas you double its pressure, and vice versa. Gay-Lussac's Law can be expressed as the equation:
P1 · T2 = P2 · T1
again, where the variables subscripted one refer to the values before a change in volume or temperature and those subscripted two refer to the new values after the pressure or temperature is changed. As before, if any three of those values are known, the fourth can be determined algebraically.
These three related gas laws are sometimes referred to as the Combined Gas Law, and although true individually and in combination, they are insufficient to define a generalized law of gases. In 1811, the Italian scientist Amedeo Avogadro postulated the fourth and final fundamental law of gases, referred to as Avogadro's Principle, which states that equal volumes of gases at the same temperature and pressure contain the same number of particles.
Avogadro's Principle was the final piece in the puzzle. With the Combined Gas Law and Avogadro's Principle, it's possible to define a generalized law of gases, called the Ideal Gas Law. First stated in 1834 by the French scientist Benoît Paul Émile Clapeyron, the Ideal Gas Law can be expressed as the equation:
Copyright © 2013 by The Home Scientist, LLC Revision 1.0.7 – 10 January 2013

The Home Scientist, LLC CK01A Instruction Manual 141
PV = nRT
where
P = the absolute pressure of the gas
V = the volume of the gas
n = the number of moles of the gas
R = the ideal gas constant
T = the temperature of the gas in kelvins (K)
The value for R, the ideal gas constant, depends on the units used for volume and pressure. In SI units, the value of R is 8.314472 joules per mole per kelvin (J·mol-1·K-1)
The name of this law reflects the fact that it is completely accurate only for an “ideal” gas, which is to say one that comprises monoatomic particles of infinitely small volume, at very high temperature and very low pressure, and in which no attractions or repulsions exist between particles. Real gases depart from values calculated using the Ideal Gas Law because their atoms or molecules have finite volumes and do interact.
The great 19th century Scottish chemist Thomas Graham devoted considerable research effort to the physical chemistry of gases. In doing so, he formulated an empirical law which states that the rate of effusion of a gas is inversely proportional to the square root of its molar mass. Mathematically, Graham's Law can be expressed as:
(Rate1/Rate2) = (M2/M1)0.5
where
Rate1 = effusion rate of the first gas
Rate2 = effusion rate of the second gas
M1 = molar mass of the first gas
M2 = molar of the second gas
Effusion rates may be specified as volume per unit time (e.g. mL/s) or moles per unit time (e.g. mol/min). Molar masses are specified as the gram molecular mass of the actual gas particles present. For example, monatomic neon, Ne, has a molar mass of 20.179, the same as its atomic weight; diatomic molecular hydrogen, H2, has a molar mass of 2.01588 g/mol, twice its atomic weight; and triatomic ozone, O3, has a molar mass of 47.9982 g/mol, three times its atomic weight.
Like all such empirical gas laws, Graham's Law is accurate only for pure ideal gases at low pressure. As we depart from those conditions, for example by testing in the presence of air rather than in vacuum, values calculated using Graham's Law depart further and further from observed data.
In this group of lab sessions, we'll examine the characteristics of gases and experimentally verify three of these fundamental laws of gases.
Copyright © 2013 by The Home Scientist, LLC Revision 1.0.7 – 10 January 2013

The Home Scientist, LLC CK01A Instruction Manual 142
Topic VIII. Gas ChemistrySession VIII-1: Observe the Pressure-Volume Relationship of Gases (Boyle's Law)
Advance Preparation:
Session:
None
90 to 120 minutes
Materials from Kit
□ Goggles□ Graduated cylinder, 100 mL
□ Syringe, 10 mL□ Vegetable oil
Materials You Provide
□ Gloves □ soda bottle (2-liter, clean and empty)
Concepts and Vocabulary
□ Boyle's Law
□ The pressure-volume relationship of gases
Background
Boyle's Law states that, at constant temperature, the volume of a gas is inversely proportional to its pressure. In this laboratory session, we'll verify Boyle's Law experimentally, using a very simple setup. We'll use a 10 mL oral syringe and cap as our volumetric device. For our adjustable mass device, we'll use a 2-liter soda bottle with varying amounts of water.
We'll begin with the syringe containing a known volume of gas under normal atmospheric pressure. We'll then add mass incrementally to the soda bottle, with it resting on the plunger of the syringe, to increase the pressure on the gas contained in the syringe and record the gas volume under differing amounts of pressure.
Gas pressure is specified in units of mass, weight, or force per unit area. For example, in traditional units, standard atmospheric pressure is about 14.7 pounds per square inch. Chemists use the SI unit of pressure, the pascal (Pa), which equals one newton per square metre (N·m-2 or kg·m-1·s-2). In SI units, standard atmospheric pressure is about 101,325 Pa, which may also be stated as 101.325 kilopascal.
The total pressure exerted on the gas in the syringe is the sum of the atmospheric pressure, the pressure exerted by the mass of the syringe plunger and the container above it, and the pressure exerted by the mass added to the container. But there's one more piece of the puzzle. Because pressure is specified per unit area, we need to know the area of the syringe bore. With all of those data known, we can calculate the pressure of the gas contained within the syringe and correlate that pressure with the observed volume of the gas.
We weighed 10 plungers from the syringes included with the kit and determined their mass to be 3.40 grams ± 0.03 gram, and 10 Coke bottles (with cap and label) and determined their mass to be 51.10 grams ± 0.51 gram.
Note: If you have a balance, you can get more accurate results by weighing the actual
Copyright © 2013 by The Home Scientist, LLC Revision 1.0.7 – 10 January 2013

The Home Scientist, LLC CK01A Instruction Manual 143
plunger and soda bottle you use and using those more accurate masses.
You can use a different brand of soda bottle. The mass may differ slightly, but the error will be very small on a percentage basis. The density of tap water varies very slightly with temperature and dissolved solids, but we'll assume a value of 1.00 grams/mL. The syringe bore is about 1.45 cm in diameter.
Note: This and the following lab session are subject to more “slop” (a term scientists use for experimental error) than most of the other lab sessions in this manual. There are two primary reasons for this:
First, ideally the plunger should move freely within the syringe, with zero friction or as close to that as possible. Although we'll use vegetable oil to lubricate it, there is still some resistance to movement of the plunger, which will affect the experimental data.
Second, we'll have to live with adiabatic rather than isothermal expansion and contraction of volume. There are three variables to consider—pressure, volume, and temperature—and ideally we'd like to vary only two of those with the third held constant. Unfortunately, it's not practical to do so with affordable equipment. In this lab session, we'll assume that we're varying only pressure and volume, with temperature held constant. In fact, the temperature also changes, albeit slightly, as we change those other two variables, which again affects the experimental data.
Goals
This lab session has the following goal:
□ To verify Boyle's Law experimentally
Procedure
You will need an assistant for this lab session.
1. If you have not done so already, put on your goggles and gloves. Review the hazards of each chemical you will use.
2. Remove the cap and the plunger from the barrel of the syringe. (It requires significant force to remove and replace the plunger.) Lubricate the flexible wipe at the tip of the plunger with a few drops of vegetable oil. Replace the plunger, pressing firmly to seat it in the barrel. Slide the plunger completely in and out several times to distribute a thin layer of oil on the inside of the barrel. If you've used enough oil, the plunger should move freely in both directions, with very little pressure required.
3. Adjust the plunger until the bottom edge (nearest the conical tip) of the wipe just touches the 10.0 mL line on the barrel. Replace the syringe tip.
We want to determine the volume of the gas in the syringe at different pressures that correspond to varying the mass pressing on the plunger in 200 g increments. For convenience in plotting the data, we'll make our first measurement at 200 grams total—including the mass of the plunger and soda bottle—and then increment the mass by 200 grams for each trial. Since the bottle and plunger together mass 54.50 grams, we'll use 145.5 mL of water (a total mass of 200.0 grams) for the first trial.
4. Use the 100 mL graduated cylinder to transfer 145.5 mL of tap water to the Coke bottle. Replace the cap on the bottle.
Copyright © 2013 by The Home Scientist, LLC Revision 1.0.7 – 10 January 2013

The Home Scientist, LLC CK01A Instruction Manual 144
5. Hold the syringe vertically, with the cap in contact with your work table or another firm surface. Have your assistant invert the bottle and place the cap centered on the top surface of the syringe plunger, supporting the bottle to prevent it from tipping, but not bearing any of the mass of the bottle. (The full mass of the bottle should bear on the plunger.) With your eye level with the gradations on the barrel, note the indicated volume and record it and the mass (200 grams) in your lab notebook.
6. Transfer another 200 mL of tap water to the bottle, for a total mass of 400 grams, and re-cap the bottle. Verify that the volume of the syringe still reads 10.0 mL. Again, have your assistant invert the bottle and place the cap centered on the top surface of the syringe plunger, keeping the bottle from tipping but not supporting any of the weight of the bottle. With your eye level with the gradations on the barrel, note the indicated volume and record it and the mass (400 grams) in your lab notebook. Repeat this procedure, adding 200 mL of water each time, until the bottle and water reach a total of 2,000 grams.
7. Determine the atmospheric pressure (NOT the barometric pressure). Using that value and the area of the syringe bore (which is 1.45 cm internal diameter), calculate the additional pressure contributed by the atmosphere. (Don't forget to add the 3.40 grams contributed by the plunger.) Use your graphing calculator or computer graphing program to produce a graph of pressure versus volume.
Note: Although most people assume that atmospheric pressure and barometric pressure are the same thing, they aren't. Atmospheric pressure is the actual pressure of the atmosphere. Barometric pressure, the value given by TV and radio stations (and indicated by your barometer if you adjusted it to the pressure given in a local weather report), is an adjusted value that reflects the elevation of the reporting station.
Barometric pressure is what the atmospheric pressure would be if the reporting station were located at sea level. For a reporting station located at sea level, barometric pressure is equal to atmospheric pressure. But for a reporting station located above sea level, the actual atmospheric pressure is lower—sometimes significantly lower—than the barometric pressure reported by the station.
To obtain an accurate atmospheric pressure, you can adjust the barometric pressure reported by a station for that station's altitude. Alternatively, you can check with your local airport, which reports both barometric pressure and atmospheric pressure.
Clean-up and Disposal
Wash and dry the equipment. All the products produced in this lab session are nonhazardous and can be discarded with household garbage or flushed down the drain with water.
Review Questions
1. Graph pressure (x-axis) versus volume (y-axis) using your observed and calculated (predicted) volumes? What general form do the graphs take (linear, exponential, etc.)? How closely do your observed values correspond to your calculated values?
2. Calculate percent error for your observed data. What experimental errors might explain the differences between the observed and calculated values?
3. Could you use this apparatus to determine the mass of an unknown sample? If so, how would you go about determining the mass?
Copyright © 2013 by The Home Scientist, LLC Revision 1.0.7 – 10 January 2013

The Home Scientist, LLC CK01A Instruction Manual 145
4. The initial pressure in a Boyle's Law apparatus is known to be 29,084 Pa and the initial volume 10.0 mL. Assuming a perfect apparatus (no friction, etc.) how much total pressure must be applied to reduce the volume to 5.0 mL?
Copyright © 2013 by The Home Scientist, LLC Revision 1.0.7 – 10 January 2013

The Home Scientist, LLC CK01A Instruction Manual 146
Topic VIII. Gas ChemistrySession VIII-2: Observe the Volume-Temperature Relationship of Gases (Charles' Law)
Advance Preparation:
Session:
None
90 to 120 minutes
Materials from Kit
□ Goggles□ Beaker, 250 mL□ Syringe, 10 mL
□ Thermometer□ Vegetable oil□ Wire gauze
Materials You Provide
□ Gloves□ Freezer
□ Ice
Concepts and Vocabulary
□ Charles' Law
□ The volume-temperature relationship of gases
Background
Charles' Law states that, at constant pressure, the volume of a gas is proportional to its absolute temperature, specified in kelvins. According to Charles' Law, then, doubling the temperature of a gas, say from 200 K to 400 K, doubles its volume, while halving the temperature halves the volume. This proportionality holds true regardless of the percentage change. For example, if we increase the temperature of a 7.5 mL gas sample from 293.15 K (20.00 °C) to 373.15 K (100.00 °C), we can calculate the volume at the higher temperature by substituting the known values in the Charles' Law equation:
V1 · T2 = V2 · T1
or
(7.5 mL) · (373.15 K) = (x mL) · (293.15 K)
Solving for x, we find that the gas volume at the higher temperature is about 9.5 mL.
Note: The SI unit of temperature is not “degrees kelvin” or “kelvin degrees” but just “kelvins” all by itself. The kelvin temperature scale uses the same incremental units of temperature as the familiar Celsius scale. In other words, increasing or decreasing the temperature by one degree Celsius (1 °C) also increases or reduces the temperature by one kelvin (1 K).
The difference between the kelvin scale and the Celsius scale is the baselines. The kelvin scale assigns a temperature of 0 K to absolute zero, which is the coldest possible temperature, where even atomic vibrations cease. The Celsius scale assigns a temperature of 0 °C to the melting point of pure water, which can also be specified as 273.15 K. It follows, therefore, that on the Celsius scale absolute zero is -273.15 °C.
Copyright © 2013 by The Home Scientist, LLC Revision 1.0.7 – 10 January 2013

The Home Scientist, LLC CK01A Instruction Manual 147
Similarly, if we decrease the temperature of a 7.5 mL gas sample from 293.15 K (20.00 °C) to 253.15 K (-20.00 °C), we can calculate the volume at the lower temperature, again by substituting the known values in the Charles' Law equation:
(7.5 mL) · (253.15 K) = (x mL) · (293.15 K)
Again solving for x, we find that the gas volume at the lower temperature is about 6.5 mL.
We didn't choose that volume and those temperatures arbitrarily. The syringe we provided with the kit has a full-scale reading of 10.0 mL, so an initial volume of 7.5 mL at 20 °C (about room temperature) allows us to get near (but not exceed) the full-scale 10.0 mL graduation when heating the syringe to 100 °C. A standard freezer typically operates at about -20 °C, which is the lowest temperature we can reach without resorting to dry ice or similar measures.
In this laboratory session, we'll use same volumetric container (AKA syringe) we used in the preceding session. The difference is that in that session we held temperature constant and changed the pressure, while in this session we'll hold pressure constant and change the temperature. That means we won't need the container and the masses we used in the preceding session. Instead, we'll record the volume contained by the syringe at room temperature, and then immerse the syringe in liquids at various temperatures and record the changes in volume.
Goals
This lab session has the following goal:
□ To verify Charles' Law experimentally
Procedure
1. If you have not done so already, put on your goggles and gloves. Review the hazards of each chemical you will use.
2. Remove the cap and the plunger from the barrel of the syringe. (It requires significant force to remove and replace the plunger.) Lubricate the flexible wipe at the tip of the plunger with a few drops of vegetable oil. Replace the plunger, pressing firmly to seat it in the barrel. Slide the plunger completely in and out several times to distribute a thin layer of oil on the inside of the barrel. If you've used enough oil, the plunger should move freely in both directions, with very little pressure required.
3. Use the thermometer to determine the room temperature, and record it in your lab notebook.
4. Adjust the plunger in the syringe to put the lower wipe (nearest the cone tip) at 7.5 mL and replace the cap on the syringe tip.
5. Place the syringe and thermometer in the freezer, and allow them to cool for several minutes. While you wait, fill the 250 mL glass beaker about 3/4 full of a mixture of tap water and ice and allow the temperature of the water in the beaker to equilibrate. Remove the syringe and thermometer from the freezer and immediately note the temperature (probably about -15 °C to -20 °C) and the volume indicated on the syringe. Record these values in your lab notebook.
6. Remove the syringe cap, reset the plunger to a volume of 7.5 mL (making sure the plunger still moves freely), and replace the syringe cap. Immerse the syringe in the ice/water bath. (Part of the syringe floats above the surface of the water. That's
Copyright © 2013 by The Home Scientist, LLC Revision 1.0.7 – 10 January 2013

The Home Scientist, LLC CK01A Instruction Manual 148
acceptable as long as the body of the syringe is in good contact with the water. ) After several minutes, note the temperature of the ice/water bath and the volume of the syringe, and record them in your lab notebook.
7. Empty the contents of the beaker, and refill the beaker about 3/4 full of hot tap water. Place the beaker on your hotplate (using the wire gauze to protect the beaker from direct contact with the hotplate surface) and bring the water to a gentle boil.
8. Remove the syringe cap, reset the plunger to a volume of 7.5 mL (making sure the plunger still moves freely), and replace the syringe cap. Immerse the syringe in the boiling water bath. After a couple minutes, note the temperature of the boiling water bath and the volume of the syringe, and record them in your lab notebook.
9. Turn off the hot plate and allow the water bath to cool gradually. For each reading, remove the syringe cap, reset the plunger to a volume of 7.5 mL (making sure the plunger still moves freely), replace the syringe cap, and immerse the syringe in the water bath. Keep a close eye on the thermometer, and obtain readings for 90, 80, 70, 60, 50, 40, and 30 °C (or as close as possible to these values; if you read the syringe volume at other than a round temperature number, record the actual temperature for the reading.) Be careful to avoid burns until the temperature of the water bath reaches 45 °C or lower. You can save waiting time by carefully adding cold water or small pieces of ice to the bath and stirring to mix it.
10.Once you have obtained values at the various temperatures, graph temperature versus volume and use the curve-fitting function of your graphing calculator or computer graphing software to plot the temperature versus volume relationship.
Clean-up and Disposal
Wash and dry the equipment. All the products produced in this lab session are nonhazardous and can be discarded with household garbage or flushed down the drain with water.
Review Questions
1. Graph kelvin temperature (x-axis) versus volume (y-axis) using your observed and calculated (predicted) volumes? What general form do the graphs take (linear, exponential, etc.)? How closely do your observed values correspond to your calculated values?
2. What volume would your gas sample have if you were able to cool it to absolute zero? Extrapolate your experimental data to estimate the kelvin temperature of absolute zero? How closely does your extrapolation correspond to the actual temperature of absolute zero (0 K)?
3. A sample of gas has a volume of 10.00 mL at 26.85 °C. With pressure held constant, what volume would that sample occupy at -173.15 °C? At 126.85 °C?
4. A sample of gas has a volume of 10.00 mL at 26.85 °C. With pressure held constant, at what temperature would that sample occupy 15.00 mL?
Copyright © 2013 by The Home Scientist, LLC Revision 1.0.7 – 10 January 2013

The Home Scientist, LLC CK01A Instruction Manual 149
Topic VIII. Gas ChemistrySession VIII-3: Determine Gas Mass Ratios by Effusion (Graham's Law)
Advance Preparation:
Session:
None
90 to 120 minutes
Materials from Kit
□ Goggles□ Ammonia, 6 M□ Hydrochloric acid, 6 M□ Pipettes
□ Reaction plate, 24-well (with lid)□ Ruler□ Sharpie marking pen
Materials You Provide
□ Gloves□ Desk lamp or other strong light source
□ black paper or cloth
Concepts and Vocabulary
□ Graham's Law
□ Effusion of gases
Background
In this lab session we'll use two gases, ammonia and hydrogen chloride, to verify Graham's Law. In addition to being readily available, these two gases have a major advantage for our purposes. When they come into contact with each other, they immediately react to form solid ammonium chloride, which is visible as a white cloud at the interface between the two gases.
We know that the molar mass of ammonia, NH3, is 17.0305 g/mol and that of hydrogen chloride, HCl, is 36.461 g/mol. Plugging these values into the Graham's Law equation gives us:
(Rateammonia/Ratehydrogen chloride) = (36.461/17.0305)0.5 = 1.46+
In other words, the effusion rate of ammonia should be nearly 1.5 times the effusion rate of hydrogen chloride. Or, looking at it another way, if we start some ammonia gas effusing toward some hydrogen chloride gas and vice versa, the fronts of those two gases should meet, not at the halfway point, but somewhat nearer the slower-effusing hydrogen chloride source. Specifically, we expect the two gases to meet at
[1.46 / (1.46 + 1.0)] = [1.46 / 2.46] = 0.59+
or at about 59% of the distance from the ammonia source to the hydrogen chloride source.
We'll test this assumption simply by placing a few drops each of aqueous ammonia and hydrochloric acid at measured distance from each other, determining where the ammonium
chloride cloud forms, and using this distance to calculate the ratio of molar masses of these two gases.
Copyright © 2013 by The Home Scientist, LLC Revision 1.0.7 – 10 January 2013

The Home Scientist, LLC CK01A Instruction Manual 150
Goals
This lab session has the following goal:
□ To verify Charles' Law experimentally
Procedure
1. If you have not done so already, put on your goggles and gloves. Review the hazards of each chemical you will use.
2. Place the cover on the reaction plate. Looking straight down on the reaction plate (to avoid parallax), use the marking pen to make a small dot at the exact center of one corner well and a second dot in the center of the well at the diagonally opposite corner of the plate. (For example, wells A1 and D6.) Label the dots “A” (for ammonia) and “H” (for hydrogen chloride) and draw a light line to connect the two dots. Remove the cover and place it aside but within easy reach.
3. Place the reaction plate on the black paper (or other dark background) and turn on the desk lamp or other light source. Adjust the lamp to illuminate the reaction plate strongly without glare.
4. Working as quickly as possible, transfer a few drops of 6 M ammonia to the first corner well (“A”) and a few drops of 6 M hydrochloric acid to the second corner well (“H”), and replace the cover on the reaction plate.
5. With the marking pen in hand, watch carefully for the first appearance of a white haze near the midpoint of the line linking the two wells. When the solid ammonium chloride haze first appears, immediately use the marking pen to mark that spot on the connecting line. Make the dot as small as possible.
6. Remove the cover from the reaction plate and drench the plate in water to dilute the remaining ammonia and hydrochloric acid.
7. Using the ruler, carefully measure the distance between the “A” dot and the dot near the center of the line connecting the two corner well dots. Repeat to determine the distance between the “H” dot and the center dot. Record these values in your lab notebook.
8. Calculate the molar mass ratio of hydrogen chloride to ammonia, as follows:
(DistanceA/DistanceH) = (MassH/MassA)0.5
or, by squaring both sides:
(DistanceA/DistanceH)2 = (MassH/MassA)
Clean-up and Disposal
Wash and dry the equipment. All the products produced in this lab session are nonhazardous and can be discarded with household garbage or flushed down the drain with water.
Review Questions
1. What values did you obtain for calculated molar mass ratio and experimental molar mass ratio? How well did your experimental value correspond to the actual value?
2. What factors might cause your experimental results to differ from the theoretical value?
Copyright © 2013 by The Home Scientist, LLC Revision 1.0.7 – 10 January 2013

The Home Scientist, LLC CK01A Instruction Manual 151
IX
Thermochemistry
Thermochemistry is the study of the heat evolved or absorbed during chemical reactions, physical transformations (such as mixing), and phase changes (such as melting). Calorimetry, from the Latin words calor for heat and metrum for measure, is a technique used to measure the heat changes that occur in such processes.
All of the lab sessions in this group require a calorimeter, a device that thermally isolates the process being investigated, preventing gain or loss of heat from the external environment. Make your own calorimeter from two 8-ounce (250 mL) foam cups and a lid cross-punched to accept a straw. Place one cup inside the other to provide better insulation. Insert the thermometer through the center hole in the lid, and use it both for measuring temperatures and as a stirring rod.
You can improve accuracy by replacing the snap-on plastic lid with a foam lid. Using the top of the plastic lid as a template, mark and cut a circular piece of flat foam just large enough to fit inside the mouth of the cup. Using the top of the cup as a template, mark and cut a second circle of foam just a bit too large to fit inside the mouth of the cup. Center the smaller circle of foam on the larger one, and glue the two pieces together. Poke a small hole through the center of the new lid assembly to accept a thermometer.
Note: Heat and temperature are related but not identical concepts. A sample may contain a small amount of heat, but the temperature may be relatively high, or vice versa. For example, the sparks coming off a grinding wheel are tiny particles of burning metal. Their temperature is very high—perhaps 1,000°C or higher—but the particles contain little heat because the mass of each is a fraction of a milligram. If one of those particles contacts your skin, you may not even notice it. Conversely, a liter of boiling water is at a relatively low temperature, only 100°C, but the kilogram mass of water stores a considerable amount of heat. If that water comes into contact with your skin, you will be burned badly.
Copyright © 2013 by The Home Scientist, LLC Revision 1.0.7 – 10 January 2013

The Home Scientist, LLC CK01A Instruction Manual 152
Topic IX. ThermochemistrySession IX-1: Determine Heat of Solution
Advance Preparation:
Session:
Fill a clean 2-liter soda bottle with cold tap water and allow it to come to room temperature (at least one hour)
90 to 120 minutes
Materials from Kit
□ Goggles□ Graduated cylinder, 10 mL
□ Graduated cylinder, 100 mL □ Thermometer
Materials You Provide
□ Gloves□ Balance (optional)□ Foam cup (with lid)
□ Soda bottle, 2-liter (empty)□ Sodium chloride (table salt)
Concepts and Vocabulary
□ Heat of solution (enthalpy change of solution)
□ Dissolution
□ Endothermic energy and exothermic energy
□ Positive and negative heats of solution
□ Calories (c), kilocalories (C), Joules (J), and kiloJoules (kJ)
Background
Heat of solution, also called enthalpy change of solution, is heat that is absorbed or released when a solute is dissolved in a solvent. Dissolution is a complex process that involves both absorption and release of energy. Energy is absorbed (endothermic energy) to break the attractions between the solute molecules and the attractions between the solvent molecules. Conversely, energy is released (exothermic energy) as new attractions form between solute molecules and solvent molecules. The net difference between the energy absorbed and the energy released per mole of solute is defined as the heat of solution for that solute.
For a particular solvent, some solutes have a positive heat of solution because the energy that must be absorbed to break the solute-solute bonds and the solvent-solvent bonds is greater than the energy that is released by the formation of solute-solvent bonds. Dissolving such a solute reduces the temperature of the solution relative to the original temperature of the solvent. Other solutes have a negative heat of solution, because less energy is needed to break the solute-solute and solvent-solvent attractions than is released by the forming of solute-solvent bonds. (Remember, heat of solution is defined as endothermic energy minus exothermic energy, so dissolving a compound with negative heat of solution causes the temperature of the solution to increase.)
Heat of solution (represented as ΔHsolution) is properly quantified using SI units of kJ/mol
Copyright © 2013 by The Home Scientist, LLC Revision 1.0.7 – 10 January 2013

The Home Scientist, LLC CK01A Instruction Manual 153
(kiloJoules/mole), but many older sources continue to use the old-style C/mol (kilocalories/mole), where one kJoule equals 2.390 x 10⁻¹ kilocalories (0.2390 C) and one kilocalorie (kcal or C) equals 4.1841 kJ. For any particular solute/solvent combination, a value for heat of solution can be determined experimentally from data derived by dissolving a known mass of the solute in a known mass of the solvent and measuring the temperature change. That's what we do in this lab session.
Goals
This lab session has the following goal:
□ To determine experimentally the heat of solution of sodium chloride
Procedure
1. If you have not done so already, put on your goggles and gloves. Review the hazards of each chemical you will use.
2. Use the 10 mL graduated cylinder to measure 27.9 mL of sodium chloride (table salt), which corresponds to about 29.2 grams of sodium chloride, or 0.5 moles. Transfer it to the foam cup calorimeter. (If you have a balance, weigh out 29.22 g of sodium chloride rather than measure it volumetrically.)
3. Verify the temperature of the tap water in the 2 liter soda bottle, and record it in your lab notebook.
4. Use the 100 mL graduated cylinder to measure 100.0 mL of the room-temperature tap water. (If you have a balance, weigh out 100.00 grams of water.)
5. Transfer the water to the foam cup, place the lid on the cup, and insert the thermometer through the hole in the lid.
6. Swirl the cup or use the thermometer to stir the contents to dissolve the sodium chloride. Keep a close watch on the temperature. Record the lowest temperature reached in your lab notebook.
7. Using the known starting temperature, the known mass and molar mass of sodium chloride (29.22 grams @ 58.443 grams/mole), and the known mass of water (although the density of water varies slightly with temperature, you can assume that 100.00 mL = 100.00 grams), calculate the heat of solution (enthalpy of solution) of sodium chloride in kJ/mol. Remember that enthalpy of solution is a negative value for exothermic dissolution and positive for endothermic dissolution.)
Calculate heat of solution as follows:
Q = mcΔT
where Q is Joules of heat, m is the mass of the sample (solvent plus solute), c is the specific heat of the solvent, and ΔT is the change in temperature. For example, if we made up our solution by dissolving 29.22 g of sodium is 100.00 mL of water, the total mass is 129.22 g. The specific heat of water is 4.1855 [J/(g·K)], where one kelvin (K) equals one °C.
If you observed a temperature change of (for example) 3.5 °C, plugging in those values gives you:
Copyright © 2013 by The Home Scientist, LLC Revision 1.0.7 – 10 January 2013

The Home Scientist, LLC CK01A Instruction Manual 154
Q = (129.22 g) * 4.1855 [J/(g·K)] * 3.5 °C = 1,893 J
From the total amount of heat, we can calculate a value for heat of solution. We used 29.22 g of sodium chloride. The gram molecular mass of sodium chloride is 58.44 g/mol, so our 29.22 grams is [29.22 g / (58.44 g/mol)] = 0.5 mol. The heat produced by 0.5 mol was 1,893 J, so the heat produced by 1.0 mol is (1893 J * 2) = 3,786 J and the heat of solution of sodium cloride is 3,786 J/mol or 3.79 kJ/mol.
8. If you have the time and materials, repeat steps 2 through 7 at least once to obtain additional data points.
Clean-up and Disposal
Wash and dry the equipment. All the materials in this lab session can be flushed down the drain. Retain the room-temperature water for a later session.
Review Questions
1. Using your experimental data, what is the heat of solution for sodium chloride?
2. Look up the published value for the heat of solution of sodium chloride on the Internet or in a printed reference. How closely does the value you obtained experimentally correspond to the published value? If your value is significantly different, propose possible explanations.
Copyright © 2013 by The Home Scientist, LLC Revision 1.0.7 – 10 January 2013

The Home Scientist, LLC CK01A Instruction Manual 155
Topic IX. ThermochemistrySession IX-2: Determine Heat of Fusion of Ice
Advance Preparation:
Session:
Fill a foam cup with ice and allow it to melt for 30 minutes
90 to 120 minutes
Materials from Kit
□ Goggles□ Graduated cylinder, 100 mL
□ Thermometer
Materials You Provide
□ Gloves□ Foam cups (with lid)
□ Ice
Concepts and Vocabulary
□ Heat of fusion, enthalpy of fusion, and specific melting heat
Background
If you add heat to a mixed-phase system that comprises a substance in its solid and liquid phases, both at the melting point of the solid, the temperature of the system does not increase until all of the solid is converted to liquid. The additional heat energy that is absorbed without causing a temperature increase is required to give the atoms or molecules that make up the solid sufficient energy to break the attraction that holds them in solid form. The additional heat energy that is required to change a solid to a liquid at its melting point is called heat of fusion, enthalpy of fusion, or specific melting heat.
In this laboratory, we'll measure the heat of fusion of ice, which has a high heat of fusion because of the strong intermolecular attraction of hydrogen atoms. Heat of fusion is (officially) expressed as Joules per mole (J/mol) in the SI system, but many older and alternate forms are still used. Among the most common of those are calories per gram (cal/g), kiloJoules per kilogram (kJ/kg), and even British Thermal Units per pound (BTU/lb). In particular, cal/g is still very widely used, and is the format we use in this laboratory session.
Goals
This lab session has the following goal:
□ To determine experimentally the heat of fusion of water ice
Procedure
1. If you have not done so already, put on your goggles and gloves. Review the hazards of each chemical you will use.
2. Run the tap water until it is hot. Fill and empty the 100 mL graduated cylinder with hot tap water several times to warm it. After the last fill, empty the cylinder until about 50 mL of the hot tap water remains. Record the actual volume of the water remaining in the cylinder as accurately as possible (you should be able to interpolate to within 0.1 to
Copyright © 2013 by The Home Scientist, LLC Revision 1.0.7 – 10 January 2013

The Home Scientist, LLC CK01A Instruction Manual 156
0.2 mL).
3. Remove the lid from your foam-cup calorimeter, transfer the water from the cylinder to the cup, and snap the lid into place. Insert the thermometer into the hole in the lid graduated cylinder, swirl the water for 30 seconds or so, and then record the temperature of the water as accurately as possible.
4. Pour off and discard as much as possible of the water from the cup of ice cubes, and distribute the partially melted ice cubes on two or three thicknesses of paper towels to absorb any remaining water. After using a dry paper towel to blot any remaining water from their surface, quickly lift the lid of the calorimeter, transfer two or three ice cubes to the calorimeter, and replace the lid.
5. Swirl the calorimeter and observe the thermometer reading. When the system reaches equilibrium, the temperature of the water should be at or near 0 °C and some ice should remain in the calorimeter. (If all of the ice melts, add more ice. It's important that at least some ice remain.)
6. Once equilibrium is reached, remove the lid from the calorimeter and transfer the water in the calorimeter to the 100 mL graduated cylinder, making sure to get as much of the water as possible and none of the remaining ice.
7. Record the volume of the water in the cylinder as accurately as possible. Subtract the initial volume of water to determine how much of the ice melted to form additional water. Using the original volume and temperature of the water you transferred to the calorimeter and the increase in water volume, calculate the heat of fusion of ice.
Clean-up and Disposal
Wash and dry the equipment. All the products produced in this lab session are nonhazardous and can be discarded with household garbage or flushed down the drain with water.
Review Questions
1. Using your experimental data, what is the heat of fusion of ice in cal/g?.
2. Look up the actual value for the heat of fusion of ice on the Internet or in a reference book. How closely did your experimental value match the actual value? Propose possible reasons for any variation.
Copyright © 2013 by The Home Scientist, LLC Revision 1.0.7 – 10 January 2013

The Home Scientist, LLC CK01A Instruction Manual 157
Topic IX. ThermochemistrySession IX-3: Determine the Specific Heat of a Metal
Advance Preparation:
Session:
None
90 to 120 minutes
Materials from Kit
□ Goggles □ Thermometer
Materials You Provide
□ Gloves□ Colander, kitchen strainer, or similar□ Foam cup (with lid)
□ Oven mitt□ US cent coins
Concepts and Vocabulary
□ Specific heat
□ Heat transfer equation
□ Mass-basis and mole-basis specific heat values
Background
When material at one temperature comes into contact with material at another temperature, heat flows from the warmer material to the cooler material until thermal equilibrium is attained when both materials are at the same temperature. In a controlled environment, such as our calorimeter, no heat is gained from or lost to the environment, so the heat gained by the (originally) cooler material equals the heat lost by the hotter material. (In practice, of course, there are minor heat gains or losses, even with the calorimeter, but these gains or losses are quite minor relative to the large changes we'll measure in this lab session.)
In this lab session, we'll determine the specific heat a metal by heating a known mass of the metal to a known temperature, and then adding the hot metal to a known mass of cooler water at a known temperature and allowing the system to come to thermal equilibrium. Heat flows from the hot metal, warming the cooler water. Because the amount of heat lost by the metal is equal to the amount of heat gained by the water, we can calculate the specific heat of the metal by measuring the temperature increase of the water.
When the unit quantity is specified in mass, the heat transfer equation is:
Q = mcΔT
where Q is the amount of heat transferred, m is the mass of the sample, c is the specific heat of the substance, and ΔT is the change in temperature. Because the heat transfer for the metal and the water is equal—although with different signs because heat is lost by the metal and gained by the water—we can express this equivalence as:
Qwater = -Qmetal
or
Copyright © 2013 by The Home Scientist, LLC Revision 1.0.7 – 10 January 2013

The Home Scientist, LLC CK01A Instruction Manual 158
(mcΔT)water = -(mcΔT)metal
The specific heat of water is known to be 4.181 Joules per gram per Kelvin, which is expressed as 4.181 J/(g·K) or 4.181 J·g-1·K-1. Because the masses and temperatures of the metal and water will be measured and are therefore known, the only unknown is the value for the specific heat of the metal sample. We can calculate that value by rearranging the preceding formula to:
[(mcΔT)water ÷ -(mΔT)metal] = cmetal
Plugging in the known and experimentally-determined values on the left side of the equation gives us the unknown value for the specific heat of the metal on the right side. This works both ways. If we happened to have a known value for the metal but not a known value for the specific heat of water, we could rearrange the equation slightly and solve for the specific heat of water.
If you look up published values for specific heat, keep in mind that specific heat can be specified on a mass basis, as we are using in this lab session, or on a mole basis. Mass-based specific heat values are represented by a lower-case c; mole-based specific heat values are represented by an upper-case C. These values can differ greatly. For example the C (mole-based) specific heats of lead and iron are quite similar, at 26.4 and 25.1 J·g-1·K-1, respectively, while the mass-based specific heat of lead, at 0.127 J·g-1·K-1, is less than one third the mass-based specific heat of iron, at 0.450 J·g-1·K-1.
You may also see specific heat values represented as cp, cv, Cp, or Cv. The subscript indicates whether the specific heat value is specified at constant pressure or constant volume, which is particularly important if you are measuring the specific heat of a gas. The difference between specific heat values at constant pressure versus constant volume is small for solids and liquids, and can be ignored for our purposes.
For this lab session, we need a known mass of metal of a known composition. Fortunately, there's an easy source for this, even if you don't have a balance. US cents coined from 1962 to 1981 are 95% copper and 5% zinc. US cents coined in 1983 or later are 97.5% zinc with 2.5% copper as plating. US cents coined in 1982 may have either composition.
To determine average mass of circulated but clean coins, we weighed 100 of each type. The average mass of the 1962 – 1981 coins was 3.10 grams; the average mass of the 1983 and later coins was 2.50 grams. The variation between coins was small and evenly distributed on both sides of the mean, so if you use at least 20 or 30 coins your known mass of metal should be accurate to within a few centigrams, as long as all coins are of the same type.
But what about the mixed composition of the coins, copper and zinc? As it turns out, that won't matter experimentally. Although copper and zinc have very different densities, their specific heat values are very similar on both a mass basis and molar basis, as shown in Table IX-1.
Copyright © 2013 by The Home Scientist, LLC Revision 1.0.7 – 10 January 2013

The Home Scientist, LLC CK01A Instruction Manual 159
Table IX-1. Molar mass, density and specific heats of copper and zinc
Molar Mass Density cp (J·g-1·K-
1)Cp,m (J·mol-1·K-
1)
Copper 63.546 g·mol-1 8.94 g·cm-3 0.385 24.5
Zinc 65.38 g·mol-1 7.14 g·cm-3 0.387 25.2
Goals
This lab session has the following goal:
□ To determine experimentally the specific heat of a metal
Procedure
1. If you have not done so already, put on your goggles and gloves. Review the hazards of each chemical you will use.
2. Count out 25 to 50 cent coins (all of the same date range) and transfer them to the 250 mL beaker. Record the number and type of coins in your lab notebook, as well as the calculated mass of the coins.
3. Transfer about 125 mL of tap water to the beaker. Place the beaker on the hotplate, using the wire gauze to protect the beaker from direct contact with the heating surface, and bring the water to a gentle boil.
4. Use the 100 mL graduated cylinder to transfer 100.0 mL of the room-temperature water from the 2-liter bottle to your foam-cup calorimeter and place the lid on the calorimeter. Swirl the contents for a minute or so, and record the volume and starting temperature of the water in your lab notebook.
5. Use the thermometer to measure the temperature of the boiling water bath, and record that value in your lab notebook.
6. After the coins have been in the boiling water bath for at least 2 or 3 minutes, working as quickly as possible, remove the beaker from the heat (using an oven mitt to protect yourself from being burned) and pour the contents of the beaker through the colander or kitchen strainer directly into the sink. Shake the colander to eliminate as much water as possible from the coins.
7. Remove the lid of the calorimeter, pour the coins into the calorimeter, and replace the lid immediately.
8. Insert the thermometer into the calorimeter deeply enough to be immersed as far as possible into the water without being in direct contact with the coins. Swirl the contents of the calorimeter carefully. (You don't want to break the thermometer). As heat is transferred from the coins to the water, the temperature of the water gradually climbs. Once equilibrium is reached, the water will gradually cool, so continue watching the thermometer until the temperature stops increasing. Record the highest temperature reached in your lab notebook.
9. Apply the heat transfer equation to calculate an experimental value for the specific heat of the metal in your coins.
Copyright © 2013 by The Home Scientist, LLC Revision 1.0.7 – 10 January 2013
The Home Scientist, LLC CK01A Instruction Manual 160
Clean-up and Disposal
Wash and dry the equipment. All the products produced in this lab session are nonhazardous and can be discarded with household garbage or flushed down the drain with water.
Review Questions
1. Assuming you did two runs, one with pre-1982 coins and the other with post-1982 coins, calculate the expected values for specific heat in J·g-1·K-1. How closely did your experimental results compare to the expected value?
2. Propose several possible causes of experimental error.
3. With the specific heat values being so similar for the pre-1982 and post-1982 coins, why did we bother to separate the coins into date groups?
4. After completing this laboratory, a student learned that her thermometer consistently reads 0.8 °C high. What effect did this error have on the specific heat values she determined experimentally? Why?
5. After completing this laboratory, a student learned that his graduated cylinder consistently delivered 5% less liquid than indicated. What effect did this error have on the specific heat values he determined experimentally? Why?
Copyright © 2013 by The Home Scientist, LLC Revision 1.0.7 – 10 January 2013

The Home Scientist, LLC CK01A Instruction Manual 161
Topic IX. ThermochemistrySession IX-4: Determine the Enthalpy Change of a Reaction
Advance Preparation:
Session:
Prepare the diluted sodium hydroxide and hydrochloric acid solutions at least 10 minutes prior to beginning the session. Allow them to stabilize at room temperature.
90 to 120 minutes
Materials from Kit
□ Goggles□ Graduated cylinder, 10 mL□ Hydrochloric acid, 6 M
□ Sodium hydroxide, 6 M□ Thermometer
Materials You Provide
□ Gloves □ Foam cup (with lid)
Concepts and Vocabulary
□ Enthalpy change of reaction
□ Thermal energy
□ Endothermic and exothermic reactions
Background
Chemical reactions absorb or release energy, usually in the form of heat (also called thermal energy). Endothermic reactions absorb heat; exothermic reactions release heat. If the reaction occurs in a solution in a calorimeter, the heat absorbed (or released) by the reaction reduces (or increases) the temperature of the solvent. This heat transfer to or from the solvent can be quantified with the familiar formula:
Q = mcΔT
or, if water is the solvent:
Q = (mcΔT)water
where Q is the amount of heat transferred, m is the mass of the water, c is the specific heat of water, and ΔT is the change in temperature of the water. With known values for the mass and specific heat of water and ΔT determined experimentally, the value of Q can be calculated. (Remember that Q for an exothermic reaction is a negative value.) Q may be expressed in the traditional units of calories (cal) or in SI units of joules (J). The calculation is the same in either case. Only the units for the specific heat of water (c) are different:
cwater = 1.00 cal/(g·°C)
cwater = 4.18 J/(g·°C)
In this lab session, we'll neutralize a sodium hydroxide solution with a hydrochloric acid solution, using a slight excess of HCl to ensure that all of the sodium hydroxide is consumed by the reaction. The balanced equation for this reaction is:
Copyright © 2013 by The Home Scientist, LLC Revision 1.0.7 – 10 January 2013

The Home Scientist, LLC CK01A Instruction Manual 162
HCl(aq) + NaOH(aq) → H2O + NaCl(aq)
This reaction is exothermic, so the final temperature of the solution is higher than the starting temperature, and the value of Q is negative. Because the starting and final solutions are dilute, we can as a working approximation assume that their density is the same as that of water, 1.00 g/mL, which simplifies calculations. Filling in the known values gives us:
Q = [100 g] · [1.00 cal/(g·°C)] · [ΔT]
Once we determine ΔT experimentally, plugging that value into the equation gives us the value of Q, the amount of thermal energy transferred. Determining the enthalpy change requires one more step. Q is denominated in calories or Joules, while the enthalpy change of reaction, ΔH°reaction, is denominated in calories per mole or Joules per mole. To determine the enthalpy change of reaction, ΔH°reaction, we need to divide Q, the heat of reaction we observe experimentally, by the number of moles that yielded that value of Q. (If we had a large calorimeter and reacted 1.0 mole of sodium hydroxide, the values of Q and ΔH°reaction would be equal. Because we're reacting only a small fraction of a mole of sodium hydroxide, the absolute value of ΔH°reaction will be much larger than Q.)
Goals
This lab session has the following goal:
□ To determine experimentally a value for enthalpy change of reaction
Procedure
1. If you have not done so already, put on your goggles and gloves. Review the hazards of each chemical you will use.
2. Transfer about 6 mL of water to the graduated cylinder. Using a pipette, add just over 2.0 mL of 6 M sodium hydroxide solution to the cylinder. (The exact amount is not critical; roughly 2.1 mL is fine.)
3. Add water to the graduated cylinder to bring the total volume to 10.0 mL, and then pour the contents of the graduated cylinder into your foam-cup calorimeter. Rinse and dry the cylinder.
4. Transfer about 6 mL of water to the graduated cylinder. Using a pipette, transfer as accurately as possible 2.0 mL of 6 M hydrochloric acid to the cylinder. Add water to the cylinder to bring the total volume to 10.0 mL.
5. Allow both solutions to come to room temperature.
6. Replace the lid on the calorimeter and insert the thermometer, making sure the thermometer is fully immersed in the liquid. Swirl the contents and record the temperature of the solution in your lab notebook.
7. Remove the lid of the calorimeter, quickly pour the contents of the graduated cylinder into the calorimeter, and replace the lid.
8. Insert the thermometer into the calorimeter, making sure it's fully immersed in the liquid. Swirl the contents of the calorimeter and keep a close eye on the thermometer reading. As the reaction occurs, the temperature of the water climbs quickly. Once equilibrium is reached, the water will gradually cool, so continue watching the thermometer until the temperature stops increasing. Record the highest temperature
Copyright © 2013 by The Home Scientist, LLC Revision 1.0.7 – 10 January 2013

The Home Scientist, LLC CK01A Instruction Manual 163
reached in your lab notebook.
Clean-up and Disposal
Wash and dry the equipment. All the products produced in this lab session are nonhazardous and can be discarded with household garbage or flushed down the drain with water.
Review Questions
1. What value did you obtain experimentally for the enthalpy change of reaction? How did you calculate that value?
Copyright © 2013 by The Home Scientist, LLC Revision 1.0.7 – 10 January 2013

The Home Scientist, LLC CK01A Instruction Manual 164
XElectrochemistry
Electrochemistry is the study of the relationship between chemical energy and electrical energy. Electrochemical processes involve two types of redox reactions. In the first type of electrochemical process, applying an electric current causes a chemical reaction to occur. For example, applying an electric current to water causes a chemical reaction that splits the water into hydrogen gas and oxygen gas, an example of a process called electrolysis. In the second type of electrochemical process, a chemical reaction produces an electric current. For example, the chemical reaction that occurs in a standard alkaline AA cell produces electric current that can be converted to light, heat, or mechanical energy.
Normally, a redox reaction occurs when an oxidizing agent and a reducing agent are brought into contact. For example, placing an iron nail in a solution of copper sulfate causes a spontaneous redox reaction. Iron atoms lose electrons (are oxidized) and enter solution as iron ions, while copper ions gain electrons (are reduced) and are deposited as copper metal on the nail.
In such redox reactions, electrons are transferred directly from one species to another. However, if you physically separate the oxidizing agent (copper, in this example) and the reducing agent (iron), the electron transfer that occurs during this redox reaction can be redirected to flow through an external conductor, such as a wire. This is the basis of a Voltaic cell. Because the electric current is flowing through an external conductor rather than contained within the cell, it is accessible to do useful work, such as lighting a light bulb or powering an MP3 player.
Physical work (W) can be quantified as the product of the force (F) required to move an object and the distance (d) the object is to be moved, or, mathematically F = W · d. For example, if you lift a box from the floor and place it on a shelf, the amount of work required is the product of the force needed to lift the box times the distance the box is lifted. In its new position on the shelf, the box has higher potential energy than it did when sitting on the floor. (The work you did in lifting the box is converted to potential energy.) If the box falls from the shelf to the floor, that higher potential energy is converted to kinetic energy, and the potential energy of the box returns to its old, lower value.
Electrical work is similar to physical work, but instead of the physical work of moving a box
Copyright © 2013 by The Home Scientist, LLC Revision 1.0.7 – 10 January 2013

The Home Scientist, LLC CK01A Instruction Manual 165
from the floor to a shelf, electrical work is required to move electrons through a conductor or move ions through a solution to an electrode. And, just as the position of the box determines its physical potential energy, the type and state of charge of ions determine their electric potential energy (or electric potential for short).
Just as air moves (as wind) from a point of higher air pressure to a point of lower air pressure, an electric charge moves (as an electric current) from a point of higher electric pressure to a point of lower electric pressure. Electric pressure is denominated in volts, so an electric charge moves from an area at higher voltage to an area at lower voltage. To determine the electric work needed to move a charge through a conductor, multiply the charge by the potential difference:
Charge (C) · Potential Difference (V) = Electric work (J)
Electric charge is specified in Coulombs (C), the potential difference in volts (V), and electric work in Joules (J).
In this group of lab sessions, we'll examine both types of electrochemical processes by using an electric current to initiate and sustain a chemical reaction, and by using chemical reactions to produce electric current.
Copyright © 2013 by The Home Scientist, LLC Revision 1.0.7 – 10 January 2013

The Home Scientist, LLC CK01A Instruction Manual 166
Topic X. ElectrochemistrySession X-1: Observe Electrolysis
Advance Preparation:
Session:
None
90 to 120 minutes
Materials from Kit
□ Goggles□ Alligator clips□ Battery, 9V□ Battery adapter□ Beaker, 100 mL□ Beaker, 250 mL□ Graduated cylinder, 10 mL
□ Magnesium sulfate□ Phenolphthalein□ Spatula□ Stirring rod□ Stoppers□ Test tubes□ Wood splints
Materials You Provide
□ Gloves□ Aluminum foil□ Butane lighter (or other flame source)□ Clock or watch□ Rubber band
□ Cloth scrap (colored)□ Digital multimeter (optional)□ Sodium chloride (table salt)□ Water, distilled
Concepts and Vocabulary
□ Electrolysis
□ Electrolyte
□ Electrodes (anode and cathode)
□ Electrolytic side reactions
Background
Electrolysis is the process of forcing a redox reaction to occur by supplying an external electric current. For example, electrolysis can be used to plate an iron object with chromium by reducing chromium ions from solution, replacing them with iron ions. Ordinarily, this reaction could not occur, because chromium is higher in the activity series of metals than iron. The application of an external electric current overcomes the difference in activity (potentials) between these two metals, allowing the chromium ions to be reduced to chromium metal.
Electrolysis is conceptually simple. All that's required is a conductive solution (one that contains an electrolyte, typically an ionic salt), a pair of electrodes (called the anode and cathode), and a source of direct electric current. In practice, electrolysis is incredibly complex. Many factors come to bear, including the type, concentration, and temperature of the electrolyte; the pH of the solution; the presence or absence of other chemicals in the electrolyte solution; the type, size, separation, and even shape of the electrodes; whether or not the anode and cathode are partitioned (separated by a conductive bridge); whether or not the electrolyte is agitated; and the voltage and current flow used.
Copyright © 2013 by The Home Scientist, LLC Revision 1.0.7 – 10 January 2013

The Home Scientist, LLC CK01A Instruction Manual 167
For example, you may want to put nice, shiny, even, thin chromium plating on a piece of steel. To get that result, all variables must be tightly controlled. Otherwise, the chromium may deposit as a grainy dark gray coating of uneven thickness, or even flake off in chunks.
Nor does electrolysis always provide the same products from the same electrolyte solution. For example, if you run a current through a solution of sodium chloride (NaCl, or common salt), the products you get depend on the setup you use. If you keep the electrodes partitioned, chlorine gas forms at the anode and sodium metal at the cathode. However, sodium metal is so reactive with water that immediately forms sodium hydroxide with the release of hydrogen gas. (2 Na + H2O → 2 NaOH + H2).
However, if you remove the partitioning, the chlorine formed at the anode mixes and reacts with the sodium hydroxide formed at the cathode to produce ordinary chlorine laundry bleach, sodium hypochlorite (2 NaOH + Cl2 → 2 NaClO + H2), particularly if the electrolyte solution is agitated or stirred to encourage mixing. All of this assumes that electrolysis is occurring at lower temperatures. Higher temperatures favor the formation of sodium chlorate, NaClO3, rather than sodium hypochlorite.
Note: It's easy to confuse anode and cathode, particularly because they have different meanings for different types of electrical processes. For electrolysis, the anode is the positive electrode, which means it is deficient in electrons; the cathode is the negative electrode, with an excess of electrons.
“LEO the lion says GER”: Lose Electron = Oxidize and Gain Electron = Reduce
During electrolysis, oxidation occurs at the anode and reduction at the cathode.
Electrolysis is commonly used industrially and in laboratories to produce pure hydrogen and oxygen by splitting otherwise stable water molecules into their component gases, a process that requires providing an external electrical current at 1.23V or higher. This voltage is applied to two inert electrodes immersed in a dilute aqueous solution of an ionic compound. (Pure water cannot be used because it is a very poor conductor of electricity.) In an electrolytic cell (as opposed to a galvanic cell, where the direction is reversed), the negative electrode, or cathode, provides the electrons needed to reduce H+ ions to hydrogen gas. Conversely, the positive electrode, or anode, accepts the electrons needed to oxidize O- ions to oxygen gas.
We can balance this redox reaction using half-reactions. To do so, we must identify which species is being oxidized and which reduced by looking at the change in oxidation states.
H+12O-2(l) → H02(g) + O02(g)
From this balanced equation, we see that hydrogen is being reduced and oxygen is being oxidized, which allows us to set up the following two half-reactions:
(oxidation) 2 O-2 → O2 + 4 e-
(reduction) 2 H+ + 2 e- → H2
Doubling the reduction half-reaction to put the same number of electrons on each side—everything, including electrons, must balance—and then adding the two half-reactions gives us the final balanced reaction.
[2 O-2 → O2 + 4 e-] + [4 H+ + 4 e- → 2 H2] = 2 H2O → 2 H2 + O2
In this laboratory session, we'll use electrolysis to produce hydrogen and oxygen from water and to produce chlorine bleach.
Copyright © 2013 by The Home Scientist, LLC Revision 1.0.7 – 10 January 2013

The Home Scientist, LLC CK01A Instruction Manual 168
Goals
This lab session has the following goal:
□ To understand electrolysis conceptually
□ To use simple electrolysis to split water into hydrogen and oxygen gases
□ To use electrolysis to produce sodium hypochlorite via a side reaction
Procedure
This lab session is in two parts. In Part I, we'll use electrolysis to split water into hydrogen and oxygen gases. In Part II, we'll use electrolysis to produce sodium hypochlorite solution.
Part I – Electrolysis of water
Electrolysis provides a simple, inexpensive means of producing pure oxygen and hydrogen gases, and is used to produce these gases industrially as well as more unusual applications. For example, nuclear submarines, which remain submerged for weeks on end, constantly need to replace the oxygen consumed by their crews. Because nuclear subs have a ready source of essentially unlimited heat and electrical current (their reactors), they can use that heat to distill water and the electricity to produce as much oxygen as they need from that distilled water. (The electrolyte is not consumed during electrolysis, so the electrolysis apparatus need only be topped up with distilled water.) In this part, we'll repeat that operation on a much smaller scale.
Procedure
1. If you have not done so already, put on your goggles and gloves. Review the hazards of each chemical you will use.
2. Use the 10 mL graduated cylinder to determine the total volume of a test tube by adding distilled water from the cylinder to a test tube until the tube is full to the brim. Record this value in your lab notebook.
3. Transfer about 200 mL of distilled water to the 250 mL beaker.
4. If you have a DMM, immerse the probe tips on opposite sides of the beaker and measure the resistance between the probes. (Distilled water ideally has nearly infinite resistance, but dissolved CO2 gas allows it to conduct some current. Boiling distilled water drives off most of the dissolves CO2 gas and increases the resistance of the water significantly.) Record the distance between the probes and the resistance displayed on the DMM in your lab notebook.
5. Add one heaping spatula spoon of magnesium sulfate crystals to the beaker and stir until they dissolve. (If you have a DMM, repeat the resistance measurement.)
Note: Dissolving magnesium sulfate produces a solution of charged magnesium ions and sulfate ions that allow the solution to conduct electricity. The electrochemical potentials of the magnesium and sulfate ions are such that they act only to increase the conductivity of the solution, and otherwise remain unaffected by the electrolysis.
6. Use a rubber band to secure two test tubes side-by-side.
7. Carefully fill each test tube to the brim with the magnesium sulfate solution. Insert a
Copyright © 2013 by The Home Scientist, LLC Revision 1.0.7 – 10 January 2013

The Home Scientist, LLC CK01A Instruction Manual 169
stopper into each tube, making sure not to trap any air bubbles within the tubes.
8. Holding the stoppers in place gently, invert the tubes, immerse them in the beaker, and remove the stoppers.
9. Run one lead from the battery adapter into each test tube, allowing the uninsulated part of the leads to project up into the tubes
10.Connect the battery adapter to the 9V battery. Note the time and record it in your lab notebook.
11. Allow electrolysis to continue until one of the tubes is nearly full of gas.
12.Disconnect the battery from the battery adapter, and remove the battery adapter leads from the tubes.
13.Keeping the mouths of the tubes immersed, re-insert the stoppers in both tubes. Remove the tubes from the beaker.
14. Ignite a wood splint and then blow it out, so that only a burning ember remains. Carefully remove the stopper from the tube that is about half-full of gas and immediately place the charred tip of the wood splint in the mouth of the tube. Record your observations in your lab notebook.
15.Pour the remaining liquid from that tube into the graduated cylinder. Subtract the remaining volume from the volume of the tube when full to determine the volume of gas that was produced in that tube. Record that value in your lab notebook.
16.Reignite the wood splint, place the burning tip near the mouth of the test tube that was nearly full of gas, and carefully remove the stopper. (Don't be startled by the popping noise that occurs; it's entirely harmless.) Record your observations in your lab notebook.
Part II – Electrolysis of sodium chloride solution
Electrolysis of a sodium chloride solution is used industrially to produce sodium hypochlorite, AKA chlorine laundry bleach. Unlike simple electrolysis of water, which yields pure hydrogen and oxygen with no side reactions, electrolysis of sodium chloride solution depends on side reactions to form the desired product.
Chlorine gas is produced at one electrode. Chlorine is relatively soluble in water, so some or all of the gas dissolves immediately as it is produced. (In commercial electrolysis, voltage and current are controlled to avoid chlorine being lost by bubbling out of solution.) Sodium metal is fleetingly produced at the other electrode, but reacts immediately with water to form sodium hydroxide. Dissolved chlorine reacts with the sodium hydroxide to form sodium hypochlorite.
Warning: This procedure produces toxic, irritating chlorine gas. Perform it outdoors or under an effective exhaust hood. Do not inhale chlorine gas. If the amount of chlorine gas produced becomes excessive, disconnect the battery and leave the area until the gas has cleared.
If you or anyone else is affected by the chlorine gas, remove that person immediately to an uncontaminated area and seek medical attention immediately.
Copyright © 2013 by The Home Scientist, LLC Revision 1.0.7 – 10 January 2013

The Home Scientist, LLC CK01A Instruction Manual 170
Procedure
1. If you have not done so already, put on your goggles and gloves. Review the hazards of each chemical you will use.
2. Transfer two spatula spoons of sodium chloride (table salt), about 50 mL of water, and several drops of phenolphthalein to the 100 mL beaker. Swirl the contents of the beaker until the salt dissolves.
3. Cut or tear two strips of aluminum foil, each about 1 cm wide and about 2 cm longer than the height of the beaker.
4. Immerse one foil strip in the beaker, with one end of the strip touching the bottom of the beaker. Fold the excess length of the strip over the top edge of the beaker to secure the strip. Repeat this procedure to secure the other strip to the opposite side of the beaker.
5. Use the alligator strips to clamp one of the battery adapter leads to each of the foil strips along the rim of the beaker.
6. Snap the battery adapter connectors onto the 9V battery and begin observing the contents of the beaker. Continue observing the beaker until changes become evident at both electrodes. Record your observations in your lab notebook.
7. Allow the reaction to continue, with frequent stirring, for several minutes or until no further activity is obvious at either electrode. Disconnect the battery and remove the electrodes. (Warning: the solution now in the beaker is corrosive and toxic.)
8. Use the stirring rod to transfer one drop of the solution to a scrap piece of dark or stained cloth and observe the effect over several minutes. Record your observations in your lab notebook.
Clean-up and Disposal
Wash and dry the equipment. All the products produced in this lab session can be flushed down the drain with water. Retain the magnesium sulfate solution for a later session.
Review Questions
1. From looking at the balanced equation and your own observations during Part I of this lab, which gas was produced at the anode and which at the cathode? What evidence supports your conclusions?
2. Based on the volume of gases in each test tube in Part I, calculate the volume ratio and the percentage error from the theoretical yield.
3. In Part I, assume that you mixed the gases produced in both test tubes and then ignited the mixed gases. At standard temperature and pressure, one mole of a gas occupies about 22.4 L. The density of water is 1.00 g/mL and its formula weight is 18.02 g/mol. If your test tube of mixed anode and cathode gases contains a total of 25.0 mL of gases in a 2:1 hydrogen:oxygen ratio, how much liquid water is produced when they combust?
4. In Part II, what changes did you observe around the cathode and anode? Propose an explanation.
5. In Part II, why did we stir the contents of the beaker as electrolysis progressed? What
Copyright © 2013 by The Home Scientist, LLC Revision 1.0.7 – 10 January 2013

The Home Scientist, LLC CK01A Instruction Manual 171
would have happened if you didn't stir the solution?
6. In Part II, what effect did the solution have on the dark or stained cloth? Why?
Copyright © 2013 by The Home Scientist, LLC Revision 1.0.7 – 10 January 2013

The Home Scientist, LLC CK01A Instruction Manual 172
Topic X. ElectrochemistrySession X-2: Observe the Electrochemical Oxidation of Iron
Advance Preparation:
Session:
None
90 to 120 minutes
Materials from Kit
□ Goggles□ Beaker, 250 mL□ Iron wool□ Sharpie marking pen□ Spatula
□ Stirring rod□ Stoppers□ Test tubes□ Test tube rack□ Wire gauze
Materials You Provide
□ Gloves□ Hotplate or stove burner
□ Sodium chloride (table salt)□ Water, distilled
Concepts and Vocabulary
□ Electrochemical oxidation
Background
In the preceding lab session, we used an external electrical current to force a non-spontaneous redox reaction to occur. But many redox reactions occur spontaneously, without requiring an external energy source to initiate or sustain them. In this lab, we'll examine a very familiar spontaneous redox reaction, the oxidation of iron to iron oxide, otherwise known as rusting.
Although rusting occurs spontaneously, it happens only when specific conditions exist, namely the presence of oxygen and water. The balanced equation for this electrochemical reaction shows why:
4 Fe(s) + 6 H2O(l) + O2(g) → 2 Fe2O3·3H2O(s)
In the absence of oxygen or water, the reaction cannot proceed. And, although these conditions are both necessary and sufficient for the reaction to occur, the reaction rate varies with the presence or absence of electrolytes. Because the current flow inherent to an electrochemical reaction involves the migration of ions, the presence of an electrolyte, such as sodium chloride (common salt) or another ionic salt, increases the reaction rate. That's why, for example, iron and steel rust much faster near the ocean than they do in drier areas far from salt air, and why automotive rust is a major problem in areas where roads are salted during winter weather.
In this lab session, we'll examine the rusting of iron. We'll expose iron to oxygen, water, and salt, alone or in any combination, and observe the effects of each of these environments on the reaction rate.
Copyright © 2013 by The Home Scientist, LLC Revision 1.0.7 – 10 January 2013
The Home Scientist, LLC CK01A Instruction Manual 173
Goals
This lab session has the following goal:
□ To observe electrochemical oxidation of iron under various environmental conditions
Procedure
1. If you have not done so already, put on your goggles and gloves. Review the hazards of each chemical you will use.
2. Transfer about 75 mL of distilled water to the 250 mL beaker. Place the beaker on the hotplate, using the wire gauze to protect the beaker from direct contact with the burner surface, and bring the water to a gentle boil. Allow it to boil for at least a minute to drive off any dissolved oxygen, and then allow the water to cool to room temperature.
3. Label six clean, dry test tubes A through F and place them in the test tube rack.
4. Transfer a small tuft of iron wool to each of the six test tubes. Test tube A is the control tube, in which the iron wool will be exposed to oxygen but to neither water nor sodium chloride.
5. Transfer one spatula spoon of sodium chloride (table salt) to each of test tubes D, E, and F.
6. Fill test tube B to near the rim with boiled distilled water and place a stopper loosely in place. The goal of the stopper is simply to prevent the contents of this tube from absorbing atmospheric oxygen. This tube exposes the iron wool to water, but not to oxygen or sodium chloride.
7. Fill test tube C partially with distilled water that has not been boiled. Leave the tuft of iron wool partially submerged in the water. This tube exposes the iron wool to water and oxygen, but not to sodium chloride.
8. Press the tuft of iron wool in test tube D into contact with the sodium chloride. This tube exposes the iron wool to oxygen and sodium chloride, but not to water.
9. Fill test tube E to near the rim with boiled distilled water, swirl it to dissolve the sodium chloride, and place a stopper loosely in place to prevent the contents of this tube from absorbing atmospheric oxygen. This tube exposes the iron wool to water and sodium chloride, but not to oxygen.
10.Fill test tube F partially with distilled water that has not been boiled and swirl to dissolve the sodium chloride. Leave the tuft of iron wool partially submerged in the salt solution. This tube exposes the iron wool to water, oxygen, and sodium chloride.
11. Set the rack of six test tubes aside, and check it under a strong light after several hours or overnight to see if the iron wool in one or more of the test tubes has begun rusting. Continue checking the tubes periodically until it is evident that rusting is or is not occurring in each of the tubes. Record your observations in your lab notebook.
Clean-up and Disposal
Wash and dry the equipment. All the products produced in this lab session are nonhazardous and can be discarded with household garbage or flushed down the drain with water.
Copyright © 2013 by The Home Scientist, LLC Revision 1.0.7 – 10 January 2013

The Home Scientist, LLC CK01A Instruction Manual 174
Review Questions
1. Which of the tubes showed the greatest amount of rust on the iron wool and which the least? Why?
2. What might explain some rust appearing in test tubes A or D?
3. What might explain some rust appearing on the iron in test tubes B or E?
4. Did a chemical reaction occur between the iron and the sodium chloride in test tube F? Explain your reasoning.
5. Is the presence of sodium chloride alone sufficient to initiate or accelerate rusting? Explain your reasoning.
Copyright © 2013 by The Home Scientist, LLC Revision 1.0.7 – 10 January 2013

The Home Scientist, LLC CK01A Instruction Manual 175
Topic X. ElectrochemistrySession X-3: Measure Electrode Potentials
Advance Preparation:
Session:
None
90 to 120 minutes
Materials from Kit
□ Goggles□ Copper wire
□ Iron nail□ Magnesium ribbon
Materials You Provide
□ Gloves□ Aluminum foil□ Digital multimeter (DMM)
□ Knife (or scissors)□ Lemon
Concepts and Vocabulary
□ Electrode potential (reduction potential or oxidation potential)
□ Half-reaction
□ Galvanic (Voltaic) cell
Background
In session X-1, you may have wondered how we knew that electrolysis of water would require at least 1.23V. A glance at the standard reduction potentials listed in Table X-1 provides the answer. (Table X-1 lists standard reduction potentials for only a handful of half-reactions. Comprehensive tables that list reduction potentials for thousands of half-reactions are available on-line and in printed reference works.) Of the half-reactions involved in the electrolysis of water, the reduction of oxygen gas and hydrogen ions (protons) to water:
O2(g) + 4 H+(aq) + 4 e- → 2 H2O(l)
has the greatest reduction potential, +1.23V. Of course, oxidation and reduction are two sides of the same coin, so the reverse reaction is equally valid:
2 H2O(l) → O2(g) + 4 H+(aq) + 4 e-
So, looking at the oxidation reaction rather than the reduction reaction, the oxidation of water to oxygen gas and hydrogen ions has the greatest oxidation potential, which means that external current must be supplied at a minimum voltage of -1.23V for the half-reaction to occur.
Copyright © 2013 by The Home Scientist, LLC Revision 1.0.7 – 10 January 2013

The Home Scientist, LLC CK01A Instruction Manual 176
Table X-1. Standard reduction potentials at 25 °C.
Half-Reaction E0 (V)
Li+(aq) + e- → Li(s) -3.05
K+(aq) + e- → K(s) -2.93
Ba2+(aq) + 2 e- → Ba(s) -2.90
Ca2+(aq) + 2 e- → Ca(s) -2.87
Na+(aq) + e- → Na(s) -2.71
Mg2+(aq) + 2 e- → Mg(s) -2.37
Al3+(aq) + 3 e- → Al(s) -1.66
2 H2O(l) + 2 e- → H2(g) + 2 OH-(aq) -0.83
Zn2+(aq) + 2 e- → Zn(s) -0.76
Cr3+(aq) + 3 e- → Cr(s) -0.73
Fe2+(aq) + 2 e- → Fe(s) -0.44
Cd2+(aq) + 2 e- → Cd(s) -0.40
Co2+(aq) + 2 e- → Co(s) -0.28
Ni2+(aq) + 2 e- → Ni(s) -0.25
Sn2+(aq) + 2 e- → Sn(s) -0.14
Pb2+(aq) + 2 e- → Pb(s) -0.13
2 H+(aq) + 2 e- → H2(g) 0.00
Cu2+(aq) + 2 e- → Cu(s) +0.34
O2(g) + 2 H2O(l) + 4 e- → 4 OH-(aq) +0.40
Ag+(aq) + e- → Ag(s) +0.80
Hg2+(aq) + 2 e- → Hg(l) +0.85
O2(g) + 4 H+(aq) + 4 e- → 2 H2O(l) +1.23
Au3+(aq) + 3 e- → Au(s) +1.50
H2O2(aq) + 2 H+(aq) + 2 e- → 2 H2O(l) +1.78
F2(g) + 2 e- → 2 F-(aq) +2.87
Half-reactions that appear near the top of the table—those with high negative values—represent strong reducers. Those listed near the bottom of the table—those with high positive values—represent strong oxidizers. It's important to understand that a species in isolation cannot be said to be a reducer or an oxidizer, because the species with which it reacts determines whether the first species functions as a reducer or an oxidizer.
Copyright © 2013 by The Home Scientist, LLC Revision 1.0.7 – 10 January 2013

The Home Scientist, LLC CK01A Instruction Manual 177
For example, consider the pairs of ions and elements, Zn2+/Zn, Fe2+/Fe, and Cu2+/Cu, which have reduction potentials of -0.76V, -0.44V and +0.34V, respectively. If you place solid iron in a solution of Cu2+ ions, those ions are reduced to solid copper while the solid iron is oxidized to Fe2+ ions. With this combination of species, iron serves as the reducer and copper as the oxidizer. Conversely, if you place solid zinc in a solution of Fe2+ ions, those ions are reduced to solid iron while the solid zinc is oxidized to Zn2+ ions. With this combination, iron serves as the oxidizer rather than the reducer.
Standard reduction potential values can also be used to predict the voltage that will be produced by a cell that uses two different metals as electrodes, simply by calculating the difference in reduction potential between the two metals. For example, if you build a cell that uses electrodes of copper (+0.34V) and zinc (-0.76V), that cell will, in theory, provide current at 1.10V, because:
-0.76V - (+0.34V) = -1.10V
In practice, the actual voltage produced by such cells is always somewhat lower than the theoretical voltage produced by an ideal cell because real-world physical cells have inefficiencies in ion migration and other issues that reduce the voltage somewhat. Still, using reduction potential values makes it easy to estimate the approximate voltage that will be produced by a cell that uses any two arbitrarily-selected metals as electrodes.
But what exactly is a cell? When we drop an iron nail into a solution of copper ions, the iron is oxidized and the copper reduced, but these two half-reactions occur with the reactants in physical contact. Electrons are exchanged, but we have no way to access that electron flow and use it to do useful work. If we separate the reactants physically, the two half-reactions cease. Unless, that is, we join them electrically by using a conductor. An arrangement in which the two reactants are physically separated but electrically joined is called a cell, and each of the separate reactants is called a half-cell.
In a cell, electrons released by the reducing agent in its half-cell travel from its electrode as an electric current through a conductor (such as a wire) to the electrode of the half-cell that contains the oxidizing agent, which is reduced by those electrons. That electric current can be used to do useful work, such as lighting a bulb or running a motor. The electrode at which oxidation occurs is called the anode, while the electrode at which reduction occurs is called the cathode.
In this lab session, we'll build such an electrochemical cell, also called a galvanic cell or voltaic cell, using electrodes of various metals. We'll embed those electrodes in a lemon. The semipermeable membranes in the lemon will function as physical barriers to isolate the two half-cells from each other, while the hydronium and citrate ions produced by the citric acid in the lemon juice provide internal electric connectivity between the half-cells.
If we stopped at that point, no reactions would occur and no current would be produced, because the semipermeable membranes in the lemon prevent internal migration of metal ions between the electrodes. In other words, no return path for the current exists. But if we provide a return path by connecting the two electrodes directly together with a copper wire, the reaction proceeds and current is produced. We'll measure the voltage of that current to establish that an electrochemical cell exists, and compare our actual measured voltages with the voltage that an ideal cell using those electrodes would produce.
Copyright © 2013 by The Home Scientist, LLC Revision 1.0.7 – 10 January 2013

The Home Scientist, LLC CK01A Instruction Manual 178
Goals
This lab session has the following goal:
□ To determine experimentally electrode potentials of various metals
Procedure
1. If you have not done so already, put on your goggles and gloves. Review the hazards of each chemical you will use.
2. Use the knife to make two slits in the lemon, spaced as far apart as possible, and large enough to accept the electrodes. It's important that the two electrodes do not touch once they are inserted into the lemon.
3. Insert the copper wire in one of the slits and an electrode made of a different metal in the other slit.
4. Touch or clamp one of the leads from the DMM to each of the two electrodes and observe the reading on the DMM. If necessary, reverse the leads to obtain a positive voltage reading. Record the metals used and the voltage reading to 0.01V in your lab notebook.
5. Leaving the copper electrode in position, remove the second electrode and replace it with another electrode of a different metal.
6. Use the DMM to record the voltage with this second pair of metals, and record the metals used and the voltage reading to 0.01V in your lab notebook.
7. Repeat steps 5 and 6 until you have tested all combinations of the copper electrode with all of the other electrodes you have available.
8. Based on the voltage readings you obtained for copper with each of the other metals, choose one of those metals to replace the copper electrode. Test that metal in combination with all of the other metals. (But remember you've already tested it with copper.) Record the metals used and the voltage reading to 0.01V in your lab notebook.
9. Repeat step 8 until you have tested every metal paired with every other metal.
Clean-up and Disposal
Wash and dry the equipment. All the products produced in this lab session are nonhazardous and can be discarded with household garbage or flushed down the drain with water.
Review Questions
1. Of the four metals, why did we first use copper as the reference electrode for each of the other metals?
2. Using copper as the reference electrode, rank the cell voltage for each of the other anodes you tested.
3. Using the standard reduction potentials listed above, calculate the theoretical voltage for each of the cells you tested. How do the actual voltages you measured compare to the theoretical voltages you calculated? Propose an explanation for any differences.
Copyright © 2013 by The Home Scientist, LLC Revision 1.0.7 – 10 January 2013

The Home Scientist, LLC CK01A Instruction Manual 179
Topic X. ElectrochemistrySession X-4: Build a Voltaic Cell
Advance Preparation:
Session:
None
90 to 120 minutes
Materials from Kit
□ Goggles□ Copper wire□ Copper(II) sulfate□ Magnesium strip
□ Magnesium sulfate□ Pipette□ Reaction plate, 24-well□ Spatula
Materials You Provide
□ Gloves□ Digital multimeter (DMM)□ Paper towel
□ Scissors□ Water, distilled
Concepts and Vocabulary
□ Voltaic (galvanic) cell
Background
If you immerse magnesium metal in a solution of copper sulfate, a spontaneous redox reaction occurs. An atom of magnesium releases two electrons and is oxidized to an Mg2+
ion. Those two electrons are captured by a Cu2+ ion, reducing it to copper metal, which is deposited on the magnesium electrode as a thin plating. This reaction occurs spontaneously because magnesium ions are less attractive to electrons than are copper ions.
We can write this redox reaction as two half-reactions, with the standard reduction potentials shown in parentheses:
Mg(s) → Mg2+(aq) + 2e- (+2.37V)
Cu2+(aq) + 2e- → Cu(s) (+0.34V)
In the combined reaction, magnesium atoms serve as the reducing agent, which means that they are oxidized to magnesium ions. Conversely, copper ions serve as the oxidizing agent, which means that they are reduced to metallic copper. Adding up the reduction potentials tells us that this cell should be able to provide an electron flow at 2.71V. There's a problem with that, though.
When magnesium metal is in direct contact with a solution of copper ions, electrons are transferred directly from the magnesium metal to the copper ions, so those electrons are not accessible to do work. In effect, both half-reactions are occurring in the same reaction vessel, so there is no externally-accessible flow of electrons that can be captured to do work.
But what if we could split the two half-reactions into separate vessels and somehow intercept that electron flow? As it turns out, we can do just that by putting the copper and magnesium parts of the cell in separate containers. That physically isolates the magnesium atoms and
Copyright © 2013 by The Home Scientist, LLC Revision 1.0.7 – 10 January 2013

The Home Scientist, LLC CK01A Instruction Manual 180
ions from the copper atoms and ions, but we still somehow have to provide an external path for the flow of electrons and an electrical connection between the copper and magnesium segments of the cell.
The first part of that circuit is no problem. We can use ordinary copper wire clipped to the electrodes as a way to route electricity outside the cell, where it can do useful work such as lighting a light bulb. But we still need the internal connection between the two half-cells. The answer is a device called a salt bridge, which can be a tube filled with or an absorbent material saturated with a conducting solution, with one end immersed in each of the half-cells. The salt bridge conducts electricity while preventing ions from migrating from one half-cell to the other.
In this lab session, we'll build a voltaic cell comprising a magnesium half-cell and a copper half-cell, and measure the voltage and current produced by the cell.
Goals
This lab session has the following goal:
□ To construct a Voltaic cell and measure the voltage produced
Procedure
1. If you have not done so already, put on your goggles and gloves. Review the hazards of each chemical you will use.
2. Transfer about half a spatula spoon of magnesium sulfate to well A1 of the reaction plate. Use a pipette to add about 2.5 mL of distilled water, and stir the contents of the well with the pipette tip until the solid salt dissolves.
3. Transfer 1.0 mL of the magnesium sulfate solution to well B3.
4. Use a clean pipette to transfer 1.0 mL of 1 M copper(II) sulfate solution to well C3 of the reaction plate.
5. Cut a strip of paper towel about 0.5 cm wide by 4 cm long, and dip that strip into well A1 to saturate it with magnesium sulfate solution. Allow excess solution to drain. You want the strip damp, but not dripping wet.
6. Drape the strip over the division between wells B3 and C3, with each end hanging down into one of the wells far enough that it's immersed in the liquids in the wells.
7. Bend pieces of copper wire and magnesium strip into L-shapes, with the short arms of the L's about 2 cm long.
8. Place the magnesium strip flat on the top of the reaction plate, with the short part of the L immersed in the solution in well B3. Repeat this to put short arm of the L in the copper wire in well C3. Make sure that both metals are fully immersed in the solutions in the wells and that neither metal touches the paper towel.
9. Set the DMM to measure voltage in the 20V range. Touch one of the DMM probe tips to the copper wire and the other probe tip to the magnesium ribbon and note the DMM reading. If you don't get a positive voltage reading, reverse the positions of the probe tips. Record the voltage in your lab notebook.
10.Reset the DMM to measure DC current, with the range set to 200 mA. Touch the DMM probe tips to the metals and read the current flow value from the DMM display. If the
Copyright © 2013 by The Home Scientist, LLC Revision 1.0.7 – 10 January 2013

The Home Scientist, LLC CK01A Instruction Manual 181
display reads 0, reduce the range as necessary until you obtain a positive value for DC current. Record the current in your lab notebook.
11. Transfer enough copper(II) sulfate solution to well C3 to nearly fill the well and enough magnesium sulfate solution from well A1 to nearly fill well B3.
12.Repeat steps 9 and 10 to measure the voltage and current being produced by the cell, and record those values in your lab notebook.
13.Remove the paper towel strip and retest the voltage and current being produced by the cell. Record those values in your lab notebook.
Clean-up and Disposal
The copper(II) sulfate solution in well C3 has some minor contamination from magnesium sulfate, but not enough to make it unusable. If you wish, you can use a pipette to draw up the copper(II) sulfate solution and return it to the original container. The remaining solutions can be flushed down the drain with water. Wash and dry the equipment, including the magnesium strip and copper wire.
Review Questions
1. Which of the electrodes is the anode and which the cathode?
2. At which electrode does oxidation occur?
3. What is the purpose of the paper strip saturated with magnesium sulfate solution?
4. If you immerse a magnesium electrode in a solution of copper sulfate, metallic copper spontaneously plates out on the electrode. If you place a copper electrode in a solution of magnesium sulfate, no such spontaneous reaction occurs. Why?
5. If you substituted an aluminum electrode for the magnesium electrode, and a silver electrode for the copper electrode, what voltage would you expect the cell to produce? Why?
6. Did the voltage and/or current change when you altered the amount of the electrolytes in each half-cell? Why or why not? If one or both values changed, by how much did they change?
Copyright © 2013 by The Home Scientist, LLC Revision 1.0.7 – 10 January 2013

The Home Scientist, LLC CK01A Instruction Manual 182
XIPhotochemistry
Many chemical reactions occur spontaneously at normal ambient temperatures and pressures, but some chemical reactions require energy from an external source, called activation energy, to initiate the reaction. Once the reaction is initiated, it may proceed spontaneously to completion, or it may cease if external energy is not continuously supplied. (Technically, all reactions have an activation energy; however, for a spontaneous reaction at ambient temperature, that amount of energy is present in the system already.)
For example, the gasoline used to fuel an automobile does not react spontaneously with the oxygen in the air. (Well, actually it does, but not quickly enough to be useful.) The spark plug supplies the activation energy required to initiate the reaction. Once the reaction between the gasoline and oxygen begins, it is sufficiently exothermic to supply the energy required to sustain the reaction, which proceeds spontaneously to completion. Such reactions are called self-sustaining.
Conversely, when you bake a cake, the baking powder or baking soda in the cake mixture reacts to release carbon dioxide, which causes the cake to rise. But that reaction, once initiated, does not proceed spontaneously to completion, because the reaction does not produce enough energy to be self-sustaining. A continuing source of external energy is required to force the reaction to completion, and that energy is supplied by the heat of the oven as the cake bakes. (If the baking powder reaction were self-sustaining, you could bake a cake just by touching a match to it. Yee haw.)
Activation energy can take many forms. In an automobile engine, it's provided by an electrical spark. In many routine laboratory reactions, activation energy is supplied by heating a test tube or flask. In a firearm, activation energy is supplied mechanically when the firing pin strikes the primer. But there is a separate class of reactions in which the activation energy is supplied by visible or ultraviolet light, or some other form of electromagnetic radiation. A reaction of this class is called a photochemical reaction. The study of photochemical reactions is called photochemistry.
Copyright © 2013 by The Home Scientist, LLC Revision 1.0.7 – 10 January 2013

The Home Scientist, LLC CK01A Instruction Manual 183
Topic XI. PhotochemistrySession XI-1: Photochemical Reaction of Iodine and Oxalate
Advance Preparation:
Session:
None
90 to 120 minutes
Materials from Kit
□ Goggles□ Ammonia, 6 M□ Graduated cylinder, 10 mL□ Iodine/iodide solution, 0.1 M□ Oxalic acid, 0.5 M
□ Pipettes□ Reaction plate, 24-well□ Sharpie marking pen□ Test tubes□ Test tube rack
Materials You Provide
□ Gloves□ Aluminum foil□ Desk lamp or other incandescent light□ Fluorescent light source
□ Foam cups□ Paper (white copy or similar)□ Water, distilled□ Watch or clock
Concepts and Vocabulary
□ Photochemistry
□ Activation energy
□ Energy levels of different wavelengths of light
Background
Ammonium oxalate reacts in solution with elemental iodine to form ammonium iodide and carbon dioxide, but the reaction rate is very low at room temperature. In this laboratory session, we investigate the effects on the reaction rate of elemental iodine with oxalate ions by exposing these reactants to various types and intensities of light for differing periods of time.
The balanced equation shows that one molecule of aqueous ammonium oxalate reacts with one molecule of iodine to form two molecules of ammonium iodide and two molecules of carbon dioxide.
(NH4)2C2O4(aq) + I2(aq) → 2 NH4I(aq) + 2 CO2(g)
Or, looking at the individual atom and ion species,
2 NH4+(aq) + C2O42-(aq) + 2 I0(aq) → 2 NH4+(aq) + 2 I-(aq) + 2 CO2(g)
Oxalate ions are oxidized to carbon dioxide, and iodine is reduced to iodide ions. Iodine (oxidation state 0) is strongly colored in aqueous solution—an intense orange in the concentration we're using—while iodide ions (oxidation state -1) are colorless. By observing the color change, if any, we can judge how far the reaction has proceeded to the right. If the solution remains orange, we know that it contains mostly reactants. If the solution turns colorless, we know that it contains mostly products. If the solution turns an intermediate color,
Copyright © 2013 by The Home Scientist, LLC Revision 1.0.7 – 10 January 2013

The Home Scientist, LLC CK01A Instruction Manual 184
we know that the solution contains a mixture of reactants and products proportionate to the degree of color change.
Goals
This lab session has the following goal:
□ To observe photochemical initiation of the oxidation of iodine to iodide by oxalate
□ To determine the effect of wavelength on photochemical initiation of a reaction
Procedure
This laboratory session has two parts. In Part I, we prepare standard reference solutions of iodine. In Part II, we test the effects of various types of light on the iodine/oxalate solutions and compare our results against the standard reference solutions we made in Part I.
Part I – Prepare reference standards
We expect that some or all of the types of light we use will cause the iodine/oxalate solution to react, partially or completely converting the orange iodine solution to colorless iodide solution. We can use the color of the resulting solutions to judge how far the reaction has proceeded. An intense orange color tells us that the reaction has proceeded little or not at all, while a colorless or pale yellow solution tells us that the reaction has proceeded to completion, or nearly so.
Just eyeballing each sample gives us imprecise results. We can judge that the reaction has proceeded to completion, mostly to completion, only a bit, or not at all. For quantitative results, we need a set of standard reference samples, with known concentrations of iodine. By comparing the test samples with these reference samples we can judge the actual concentration of iodine in the test samples (and therefore how far the reaction has proceeded) with some degree of accuracy.
1. If you have not done so already, put on your goggles and gloves. Review the hazards of each chemical you will use.
2. Place the 24-well reaction plate on a sheet of white paper.
3. Use a pipette to transfer 2.0 mL of distilled water to well B1 and 1.0 mL of distilled water to wells B2 through B6.
4. Add 5 drops of iodine solution to well B1. Use the tip of the pipette to stir contents of the well, and draw up and expel the contents several times to mix them thoroughly.
5. Draw up 1.0 mL of the solution from well B1 and transfer it to well B2. Mix the solution well, and then repeat the serial dilution by transferring 1.0 mL of the solution from well B2 to well B3, and so on. When you finish the serial dilution, wells B1 through B5 each contain 1.0 mL of iodine solution, with each well having half the concentration of the preceding well. Well B6 contains 2.0 mL of solution. Withdraw 1.0 mL from well B6 and discard it.
At this point, you have your reference standard solutions set up. Well B1 contains the most concentrated iodine solution, and is an intense orange-brown color. Each successive well contains half the iodine concentration, down to well B6, which is a much lighter orange color.
If we define the concentration of iodine in well B1 as 100%, wells B2 through B6 contain 50%,
Copyright © 2013 by The Home Scientist, LLC Revision 1.0.7 – 10 January 2013
The Home Scientist, LLC CK01A Instruction Manual 185
25%, 12.5%, 6.25%, and 3.125%, respectively. You'll use these standards for comparison in Part II of this lab session.
Part II – Determine the Effects of Different Light Sources on Iodine/Oxalate Solution Samples
In terms of delivering sufficient activation energy to initiate a particular reaction, it's not the intensity of a light source that matters but its wavelength. Photons with long wavelengths, such as infrared, red, and orange light, have much lower energies than photons of shorter wavelengths, such as ultraviolet, violet, and blue light. For example, even very intense red light may be insufficient to initiate a particular reaction that is easily initiated by even low intensity ultraviolet light. In this part of the lab session, we'll test various types of light sources to determine their effectiveness at initiating and sustaining the photochemical oxidation of iodine to iodide ions by oxalate ions.
1. If you have not done so already, put on your goggles and gloves. Review the hazards of each chemical you will use.
2. Label six test tubes A through F and place them in the rack.
3. Transfer about 4 mL of distilled water to the graduated cylinder. Use a pipette to add 1.5 mL of 0.5 M oxalic acid solution to the cylinder and then add distilled water dropwise to bring the total volume to 6.0 mL. Use the pipette to mix the solution thoroughly and then transfer the solution to test tube A.
4. Transfer about 4 mL of distilled water to the graduated cylinder. Use a pipette to add 0.5 mL of 6 M ammonia to the cylinder and then add distilled water to bring the total volume to 6.0 mL. Use the pipette to mix the solution thoroughly and then transfer the solution to test tube A. Mix the contents of test tube A thoroughly.
5. Transfer 2.0 mL of the solution in test tube A to each of test tubes B, C, D, E, and F. When you finish each of the six tubes should contain 2.0 mL of the ammonium oxalate solution.
6. Working in subdued incandescent light, wrap test tube A in aluminum foil, leaving an open flap of foil at the top of the test tube, through which you will introduce the iodine solution. The goal is to prevent the solution in this test tube from being exposed to any light at all. The contents of this test tube will serve as the control.
7. Transfer 5 drops of iodine solution to test tube A and swirl to mix the contents. Immediately close the foil flap to prevent the contents of that test tube from being exposed to light. If necessary, put the test tube in a closed drawer or closet to protect it from exposure to light. (The reaction between ammonium oxalate and iodine produces carbon dioxide gas, so do not seal any of the test tubes with a stopper.) You can stand the tube in a foam cup to keep it upright.
8. Add 5 drops of iodine solution to each of the other test tubes and swirl each tube to mix the contents. Expose the tubes to the following light sources:
B – direct sunlightC – open shade (under an open sky, but not in direct sunlight)D – ambient light in your working areaE – as close as possible to a fluorescent lightF – close to a strong incandescent light, but not close enough to be heated by it
Copyright © 2013 by The Home Scientist, LLC Revision 1.0.7 – 10 January 2013

The Home Scientist, LLC CK01A Instruction Manual 186
9. As you expose each test tube to light, record the start time. Depending on the intensity and type of light to which the test tube is exposed, the reaction may take from a few minutes to many hours to proceed to completion.
10.Examine each of the test tubes after 15 minutes, 30 minutes, one hour, two hours, and four hours of exposure. Compare the tint of the test tube to the comparison samples. Determine the nearest match, interpolating if necessary. Record all of your observations in your lab notebook, estimating the relative concentration for each observation.
Note: You will probably find that the tints of similar concentration appear similar looking through the test tubes and into the reaction plate wells, but for a more accurate comparison you can temporarily withdraw 1.0 mL of solution from a tube and transfer it to an adjacent well in the reaction plate. Once you've made the comparison, draw up the solution from the well and return it to the test tube. You can then expose the tube to additional light for another data point.
Clean-up and Disposal
All waste products from this session can be discarded with household garbage or flushed down the drain with water. Wash and dry the equipment. To clean pipettes stained by iodine, either use a small amount of sodium thiosulfate or a vitamin C tablet dissolved in a few mL of water.
Review Questions
1. Which of the light sources caused the largest and smallest visible change in the iodine/oxalate solutions? Propose an explanation.
2. During one test run, we exposed a test tube to a light source for times ranging upward from 15 minutes and observed the following:
0:15 – halfway between B1 & B20:30 – close match to B21:00 – slightly paler than B62:00 – colorless4:00 – (not applicable; we ceased the experiment after 2 hours)
What type of light source do you think we used? Do the results for the 30 minutes and 1 hour times match what you would expect from the datum for the 15 minute exposure time? Why or why not?
3. Propose an experiment to determine if the reaction rate changes with the concentration of the iodine/oxalate solution.
Copyright © 2013 by The Home Scientist, LLC Revision 1.0.7 – 10 January 2013
The Home Scientist, LLC CK01A Instruction Manual 187
XIIColloids and Suspensions
A colloid, also called a colloidal dispersion, is a two-phase heterogeneous mixture that is made up of a dispersed phase of tiny particles that are distributed evenly within a continuous phase. For example, homogenized milk is a colloid made up of tiny particles of liquid butterfat (the dispersed phase) suspended in water (the continuous phase). In comparison to true solutions, the continuous phase can be thought of as the solvent-like substance and the dispersed phase as the solute-like substance.
Each type of colloid has a name. A solid sol is one solid dispersed in another solid, such as colloidal gold particles dispersed in glass to form ruby glass. A solid emulsion is a liquid dispersed in a solid, such as butter. A solid foam is a gas dispersed in a solid, such as Styrofoam or pumice. A sol is a solid dispersed in a liquid, such as asphalt, blood, pigmented inks, and some paints and glues. An emulsion, sometimes called a liquid emulsion, is a liquid dispersed in another liquid, such as mayonnaise or cold cream. A foam is a gas dispersed in a liquid, such as whipped cream or sea foam. A solid aerosol is a solid dispersed in a gas, such as smoke and airborne particulates. An aerosol, sometimes called a liquid aerosol, is a liquid dispersed in a gas, such as fog, which is tiny water droplets suspended in air. All gases are inherently miscible (completely soluble in each other), so by definition there is no such thing as a gas-gas colloid.
Note: Many reference sources incorrectly list gel as a type of colloid, describing a gel as a liquid dispersed phase in a solid continuous phase, which is properly called a solid emulsion. In fact, a gel is a type of sol in an intermediate physical phase. The density of a gel is similar to the density of the dispersing liquid phase, but a gel is physically closer to solid form than liquid form. Prepared gelatin is a good example of a typical gel.
Some colloidal substances are a mixture of colloid types. For example, smog is a combination of liquid and solid particles dispersed in a gas (air), and latex paint is a combination of liquid latex particles and solid pigment particles dispersed in another liquid. Table XII-1 summarizes the types of colloids and their names.
Table XII-1. Types of colloids
Copyright © 2013 by The Home Scientist, LLC Revision 1.0.7 – 10 January 2013
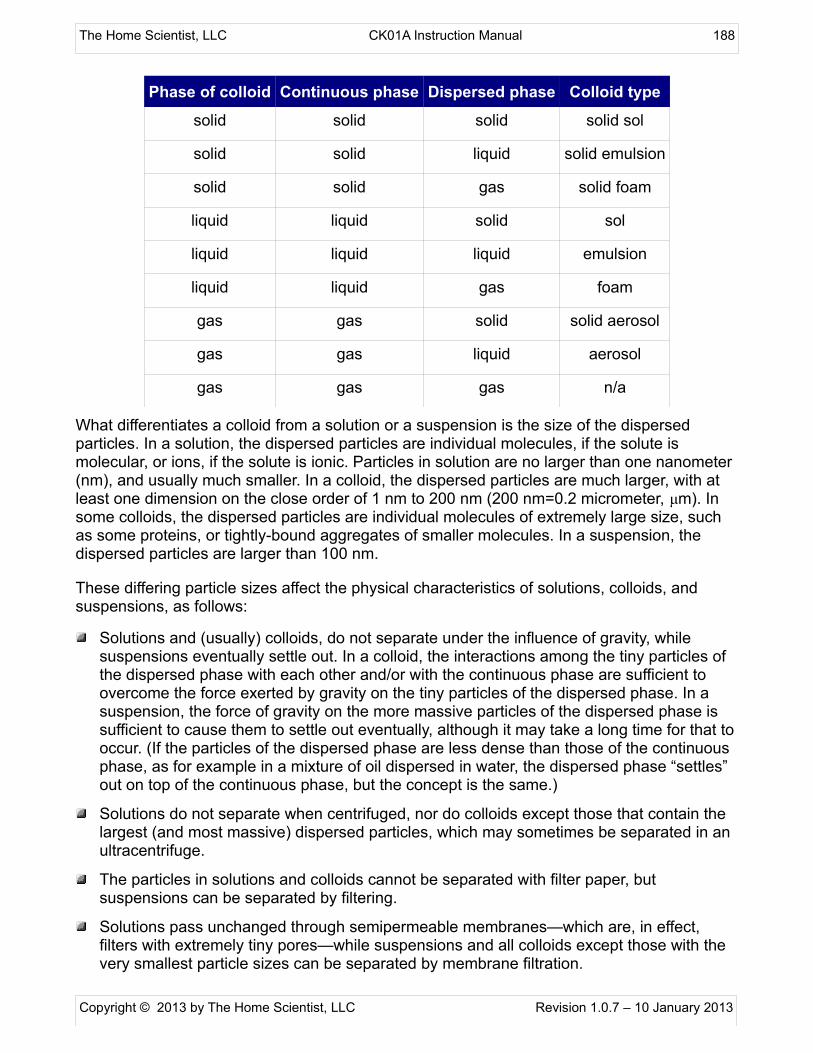
The Home Scientist, LLC CK01A Instruction Manual 188
Phase of colloid Continuous phase Dispersed phase Colloid type
solid solid solid solid sol
solid solid liquid solid emulsion
solid solid gas solid foam
liquid liquid solid sol
liquid liquid liquid emulsion
liquid liquid gas foam
gas gas solid solid aerosol
gas gas liquid aerosol
gas gas gas n/a
What differentiates a colloid from a solution or a suspension is the size of the dispersed particles. In a solution, the dispersed particles are individual molecules, if the solute is molecular, or ions, if the solute is ionic. Particles in solution are no larger than one nanometer (nm), and usually much smaller. In a colloid, the dispersed particles are much larger, with at least one dimension on the close order of 1 nm to 200 nm (200 nm=0.2 micrometer, μm). In some colloids, the dispersed particles are individual molecules of extremely large size, such as some proteins, or tightly-bound aggregates of smaller molecules. In a suspension, the dispersed particles are larger than 100 nm.
These differing particle sizes affect the physical characteristics of solutions, colloids, and suspensions, as follows:
Solutions and (usually) colloids, do not separate under the influence of gravity, while suspensions eventually settle out. In a colloid, the interactions among the tiny particles of the dispersed phase with each other and/or with the continuous phase are sufficient to overcome the force exerted by gravity on the tiny particles of the dispersed phase. In a suspension, the force of gravity on the more massive particles of the dispersed phase is sufficient to cause them to settle out eventually, although it may take a long time for that to occur. (If the particles of the dispersed phase are less dense than those of the continuous phase, as for example in a mixture of oil dispersed in water, the dispersed phase “settles” out on top of the continuous phase, but the concept is the same.)
Solutions do not separate when centrifuged, nor do colloids except those that contain the largest (and most massive) dispersed particles, which may sometimes be separated in an ultracentrifuge.
The particles in solutions and colloids cannot be separated with filter paper, but suspensions can be separated by filtering.
Solutions pass unchanged through semipermeable membranes—which are, in effect, filters with extremely tiny pores—while suspensions and all colloids except those with the very smallest particle sizes can be separated by membrane filtration.
Copyright © 2013 by The Home Scientist, LLC Revision 1.0.7 – 10 January 2013

The Home Scientist, LLC CK01A Instruction Manual 189
Flocculants are chemicals that encourage particulate aggregation by physical means. Adding a flocculant to a solution has no effect on the dispersed particles (unless the flocculent reacts chemically with the solute) but adding a flocculant to a colloid or suspension causes precipitation by encouraging the dispersed particles to aggregate into larger groups and precipitate out.
The particles in a solution affect the colligative properties of the solution, while the particles in a colloid or suspension have no effect on colligative properties.
Solutions do not exhibit the Tyndall Effect, while colloids and suspensions do. The Tyndall Effect describes the scattering effect of dispersed particles on a beam of light. Particles in solution are too small relative to the wavelength of the light to cause scattering, but the particles in colloids and suspensions are large enough to cause the light beam to scatter, making it visible as it passes through the colloid or suspension.
Figure XII-1 shows the Tyndall Effect in a beaker of water to which a few drops of milk had been added. We used a green laser pointer for this image because the much dimmer red laser pointer proved impossible to photograph well, even though it was clearly visible to the eye. The bright green line that crosses the beaker is the actual laser beam, reflected by the colloidal dispersion. The green laser pointer is bright enough that the scattered light illuminates the rest of the contents of the beaker as well.
Figure XII-1. The Tyndall Effect
Table XII-2 summarizes the physical characteristics of solutions, colloids, and suspensions. It's important to understand that there are no hard-and-fast boundaries between solutions, colloids, and suspensions. Whether a particular mixture is a colloid or a suspension, for example, depends not just on the particle size, but the nature of the continuous phase and the dispersed phase. For example, note that the particle size of colloids may range from about 1 nm to about 200 nm, while the particle size of suspensions may be anything greater than 100 nm. Furthermore, particle sizes are seldom uniform, and may cover a wide range in any particular mixture.
Copyright © 2013 by The Home Scientist, LLC Revision 1.0.7 – 10 January 2013

The Home Scientist, LLC CK01A Instruction Manual 190
So, is a particular mixture with a mean particle size of 100 nm a colloid or a suspension? It depends on the nature of the particles and the continuous phase. Solutions, colloids, and suspensions are each separated by a large gray area. Near the boundaries between types, it's reasonable to argue that a substance is both a solution and a colloid, or both a colloid and a suspension. As George S. Kaufman said, “One man's Mede is another man's Persian.”
Table XII-2. Physical characteristics of solutions, colloids and suspensions
Characteristic Solution Colloid Suspension
Type of particle individual molecules or
ions
very large individual molecules or aggregates of tens to
thousands of smaller molecules
very large aggregates of
molecules
Particle size < 1 nm ~ 1 nm to ~ 200 nm > 100 nm
Separation by gravity?
no no (usually; otherwise, very slowly)
yes
Separation by centrifugation?
no yes, for more massive dispersed particles
yes
Captured by filter paper?
no no yes
Captured by membrane?
no yes (usually) yes
Precipitatable by flocculation?
no yes yes
Exhibits Tyndall Effect?
no yes yes
Affects colligative properties?
yes no no
In this lab session, we'll prepare various colloids and suspensions and examine their properties.
Copyright © 2013 by The Home Scientist, LLC Revision 1.0.7 – 10 January 2013
The Home Scientist, LLC CK01A Instruction Manual 191
Topic XII. Colloids and SuspensionsSession XII-1: Observe Some Properties of Colloids and Suspensions
Advance Preparation:
Session:
None
90 to 120 minutes
Materials from Kit
□ Goggles□ Beaker, 250 mL□ Pipette
□ Stirring rod□ Vegetable oil
Materials You Provide
□ Gloves□ Butane lighter or other flame source□ Dishwashing detergent or liquid soap□ Laser pointer (optional; see text)□ Milk (whole or 2% homogenized)
□ Smoke source (see text)□ Sodium chloride (table salt)□ Soft drink (e.g. club soda or 7-Up)□ Starch water (see text)□ Talcum, baby, or foot powder
Concepts and Vocabulary
□ Solutions, suspensions and colloids
□ Tyndall Effect
Background
In this laboratory session, we'll use gravitational separation and the Tyndall Effect to test various samples to determine whether they are solutions, suspensions, or colloids.
Goals
This lab session has the following goal:
□ To experimentally verify if various mixtures are solutions, suspensions, or colloids
Procedure
Warning: Be careful with the laser pointer. Although standard 1 mW Class 2 laser pointers are reasonably safe to use, never look directly into the beam. Be cautious about specular reflections. A beam accidentally reflected off something shiny can be as hazardous as a direct exposure.
Note: You may substitute clear glass containers of similar size for the 250 mL beaker. It saves time to use multiple containers because you can make up samples and test the Tyndall Effect in one container while waiting for other samples to separate by gravity in other containers.
1. If you have not done so already, put on your goggles and gloves. Review the hazards of each chemical you will use.
Copyright © 2013 by The Home Scientist, LLC Revision 1.0.7 – 10 January 2013

The Home Scientist, LLC CK01A Instruction Manual 192
2. Ignite your smoke source (incense, joss stick, cigarette, even a piece of paper) and blow it out. When it starts to produce smoke, hold the 250 mL beaker inverted over the incense and allow the beaker to fill with smoke. Place the beaker inverted on a counter or other flat surface to trap the smoke.
3. Direct the beam from the laser pointer into the beaker and note whether or not the Tyndall Effect is evident. Allow the beaker to sit undisturbed for at least a minute or two, and then note whether the smoke/air sample separates on standing. Based on your observations, decide whether the smoke/air sample is a solution, colloid, or mixture. Record your observations in your lab notebook.
Note: If you don't have a laser pointer, you can use any strong beam of light. For example, you can use aluminum foil to mask a high-intensity desk lamp, allowing only a narrow beam to escape. On a sunny day, a beam of light coming through a gap in a window blind may be usable.
4. Rinse the beaker thoroughly. Add about a quarter teaspoon of table salt to about 200 mL of tap water in the beaker and stir until the salt dissolves. Repeat the procedures in step 3 and record your observations in your lab notebook.
5. Rinse the beaker thoroughly. Add about 200 mL of club soda to the beaker. Repeat the procedures in step 3 and record your observations in your lab notebook.
6. Rinse the beaker thoroughly. Add about 200 mL of water to the beaker and then about 20 drops of homogenized milk. Stir until the contents of the beaker are thoroughly mixed. Repeat the procedures in step 3 and record your observations in your lab notebook.
7. Rinse the beaker thoroughly. Add about 200 mL of water to the beaker and then about 20 drops of vegetable oil. Stir until the contents of the beaker are thoroughly mixed. Repeat the procedures in step 3 and record your observations in your lab notebook.
8. Add a mL or so of dishwashing detergent or liquid soap to the beaker, and stir gently to mix the contents. (Try to avoid creating too many bubbles or excess foam.) Repeat the procedures in step 3 and record your observations in your lab notebook.
9. Rinse the beaker thoroughly. Add about 200 mL of starch water to the beaker. Repeat the procedures in step 3 and record your observations in your lab notebook.
Note: You can produce starch water by boiling a small amount of macaroni or other pasta in 250 mL of water for several minutes. Decant the water into a clean beaker and allow it to cool before use. (Alternatively, you can just save the cooking water the next time you cook pasta; it will keep for at least a day or two if refrigerated.)
10.Rinse the beaker thoroughly. Add about a quarter teaspoon of talcum powder to about 200 mL of water in the beaker and stir until the contents of the beaker are thoroughly mixed. Repeat the procedures in step 3 and record your observations in your lab notebook.
Clean-up and Disposal
All waste products from this session can be discarded with household garbage or flushed down the drain with water. Wash and dry the equipment.
Copyright © 2013 by The Home Scientist, LLC Revision 1.0.7 – 10 January 2013

The Home Scientist, LLC CK01A Instruction Manual 193
Review Questions
1. What observable physical characteristic(s) allows you to discriminate a colloid from a suspension?
2. What observable physical characteristic allows you to discriminate a solution from a colloid?
3. Lunar gravity is about one sixth Earth's gravity. Might a sample that exhibits the characteristics of a suspension on the moon exhibit the characteristics of a colloid on Earth? Why or why not?
4. Some samples are difficult to classify because their physical properties are intermediate or mixed between the characteristics of solutions, colloids, and suspensions listed in Table XII-2 (for example, they may separate under the force of gravity, but very, very slowly). Why do some samples display such intermediate/mixed properties?
5. Consider a mixture of a solid material in water which clearly exhibits the properties of a suspension. If you created a similar mixture, but using a different continuous medium (such as vegetable oil), might that mixture behave as a colloid? Why?
Copyright © 2013 by The Home Scientist, LLC Revision 1.0.7 – 10 January 2013

The Home Scientist, LLC CK01A Instruction Manual 194
XIIIAnalytical Chemistry
Analytical chemistry concerns itself with determining the makeup of a specimen.
Qualitative analysis is used to determine the identities (but not the amounts) of the substances present in a specimen. Qualitative inorganic analysis is used to establish the presence or absence of particular elements or inorganic ions or compounds in an unknown sample. For example, an environmental chemist might test a water sample to determine if arsenic, barium, or mercury is present. Qualitative organic analysis is used to establish the presence or absence of particular organic compounds or functional groups in an unknown sample. For example, a forensic chemist might test a specimen to determine if a particular drug or poison is present. Quantitative analysis goes a step further, by determining not just the substances present in a specimen, but their relative quantities.
In modern university, corporate, and forensic laboratories, most analytical chemistry is done instrumentally, using methods such as infrared and mass spectroscopy, nuclear magnetic resonance, neutron activation analysis, x-ray diffraction, spectrophotometry, chromatography, electrophoresis, and others. Before such instruments were introduced, chemists did analyses using wet-chemistry procedures, reacting the unknown substance with various reagents and observing the results. Such wet-chemistry procedures remain important today, both for field tests or initial screening preliminary to instrumental analysis and as a learning tool.
Deciding whether to use instrumental analysis or wet-chemistry analysis requires balancing four factors: sensitivity, selectivity, time, and (of course) cost.
Sensitivity
A sensitive test is one that can detect the material in question at extremely low concentrations. In general, instrumental methods have very high sensitivity, often down into the parts-per-billion (ppb) level or even lower. Most (not all) wet-chemistry tests are much less sensitive, often by one or more orders of magnitude.
Selectivity
A selective test is one that can identify unambiguously a specific material, without being confused by the presence of a similar material. Instrumental tests are generally extremely selective, and wet chemistry tests less so (often much less so). For example, a police officer who confiscates a material suspected to be cocaine may use a wet-chemistry test (called a presumptive test) to do a quick screening.
Copyright © 2013 by The Home Scientist, LLC Revision 1.0.7 – 10 January 2013

The Home Scientist, LLC CK01A Instruction Manual 195
If the presumptive test is negative, the matter goes no further. If the presumptive test is positive, that provides probable cause to arrest the suspect. The positive presumptive test cannot be used in court, because presumptive tests may yield false positives with materials that are similar to cocaine but perfectly legal to possess.
For that reason, any material that yields a positive presumptive test is sent to a formal laboratory for instrumental analysis. If the instrumental analysis shows that cocaine is present, that is sufficiently certain to be used in court testimony.
Time
So why not skip the presumptive test and simply submit all suspect specimens to instrumental analysis? Because the officer will have to wait at least hours, if not days or weeks, to see the results of the instrumental analysis tests. Sometimes, it's better to have a quick answer you're pretty sure is right than to wait a long time for a certain answer. And that's not just true of drug testing.
Cost
The elephant in the room is always cost. Depending on the nature and number of tests done instrumentally, the cost for a test may range from a few dollars to hundreds or even thousands of dollars. That's fine if you need absolute evidence to nail a drug trafficker, but it's a bit much if you're running a lot of tests.
For example, environmental scientists may collect dozens or hundreds of soil or water specimens, and need only a rough idea of the concentrations of a few chemicals for each of the specimens. Wet-chemistry tests may tell these scientists everything they need to know, and cost only a few seconds and a few cents each.
In this chapter, we'll use various wet-chemistry procedures to do quantitative analyses of various inorganic and organic compounds.
Copyright © 2013 by The Home Scientist, LLC Revision 1.0.7 – 10 January 2013

The Home Scientist, LLC CK01A Instruction Manual 196
Topic XIII. Analytical ChemistrySession XIII-1: Determine Boron Concentration with Curcumin
Advance Preparation:
Session:
None
90 to 120 minutes
Materials from Kit
□ Goggles□ Centrifuge tubes, 15 mL□ Hydrochloric acid□ Pipettes
□ Reaction plate, 24-well□ Sodium borate□ Turmeric reagent
Materials You Provide
□ Gloves□ Desk lamp or other strong light source□ Paper towels
□ Specimens (see Part III)□ Water, distilled
Concepts and Vocabulary
□ Quantitative analysis
□ Visual colorimetry
□ Curcumin test for boron
Background
Most people are familiar with two boron compounds: sodium borate (borax) and boric acid. Borax is widely used as a laundry supplement, and boric acid is used for purposes as diverse as making eye drops, killing small rodents, and treating insect infestations on rosebushes.
Although in low concentrations these boron compounds are relatively non-toxic to people and most plants, excess boron hinders the growth of many plants. For that reason, environmental chemists frequently find it necessary to determine boron levels in soil and water samples.
One option, of course, is to obtain specimens in the field and return them to the lab for instrumental testing. The advantage to that method is that results are extremely accurate and very low levels of boron can be detected. However, these instrumental tests are costly and time-consuming, and provide both higher sensitivity and more accuracy than is really needed.
Accordingly, even today, environmental scientists frequently use a test for boron that has been in use for more than 100 years. This test depends on the fact that boric acid reacts with an organic chemical called curcumin (ker-koo'-min) to form an intensely-colored red complex called rosocyanine (roe-soe-sigh'-uh-neen). Curcumin can be purchased in pure form, but the most common curcumin reagent used for boron testing is simply an alcoholic extract of the spice turmeric.)
The curcumin test for boron is extremely sensitive, able to detect boron at levels of 1 part per million or less. It's also sufficiently selective to yield reliable results. (Some other chemicals yield a positive curcumin test, but none that are likely to be found in environmental samples.) Finally, the curcumin test takes only seconds and costs only pennies per test.
Copyright © 2013 by The Home Scientist, LLC Revision 1.0.7 – 10 January 2013

The Home Scientist, LLC CK01A Instruction Manual 197
Goals
This lab session has the following goals:
□ To observe the reaction of boron with curcumin in neutral and acidic solutions
□ To set up a set of boron dilutions as comparison standards for a boron unknown
□ To test unknown specimens for the presence and concentration of boron
Procedure
This lab session is in three parts. In Part I, we'll test our reagents to determine how they react under known conditions. In Part II, we'll set up an array of various concentrations of boron ions that we'll later use as a comparison standard. In Part III, we'll test actual environment samples for the presence of boron and try to estimate its concentration.
Part I – Test the reagents
1. If you have not done so already, put on your goggles and gloves. Review the hazards of each chemical you will use.
2. Place the 24-well reaction plate on a white paper towel under a desk lamp or other strong light source.
3. Transfer 1 mL of distilled water to each of wells A1, B1, C1, and D1.
4. Transfer 5 drops of the sodium borate solution to each of wells B1 and D1.
5. Transfer 1 drop of 6 M hydrochloric acid to each of wells B1 and C1.
At this point, well A1 contains only distilled water, well B1 contains sodium borate and hydrochloric acid, well C1 contains hydrochloric acid, and well D1 contains sodium borate but no hydrochloric acid. By observing which well or wells exhibit a color change, we can determine which of the chemicals or combination of chemicals causes that color change.
6. Add two drops of the turmeric reagent to each of wells A1, B1, C1, and D1.
7. Observe the color changes, if any, in each of the wells, and record your observations in your lab notebook. Rinse and dry the reaction plate.
Part II – Set up boron concentration comparison standards
In this part of the lab session, we'll set up a 3X3 array in the reaction plate. We'll later use the center well for testing samples. Because the eight surrounding wells each have a different concentration of boron ions, we can easily compare the center specimen well with each of the eight adjacent wells.
1. If you have not done so already, put on your goggles and gloves. Review the hazards of each chemical you will use.
2. Place the 24-well reaction plate on a white paper towel under a desk lamp or other strong light source.
3. Transfer, as accurately as possible, 1.0 mL of distilled water to each of wells A2, A3, B1, B2, B3, C1, C2, and C3.
4. Transfer 1.0 mL of the sodium borate solution to well A1 and another 1.0 mL of the
Copyright © 2013 by The Home Scientist, LLC Revision 1.0.7 – 10 January 2013

The Home Scientist, LLC CK01A Instruction Manual 198
sodium borate solution to well A2. Mix the solution in well A2 thoroughly by stirring it with the tip of the pipette and by drawing up and expelling the solution several times.
At this point, we have 1.0 mL of sodium borate solution in well A1. That solution is 0.1% with respect to boron, which can also be stated as 1,000 parts per million (ppm) boron. Well A2 contains 2.0 mL of solution that is 500 ppm with respect to boron.
5. Draw up 1.0 mL of the solution in well A2 and transfer it to well A3. Mix the solution thoroughly. Well A2 now contains 1.0 mL of 500 ppm boron, and well A3 2.0 mL of 250 ppm boron.
6. Draw up 1.0 mL of the solution in well A3 and transfer it to well B3. Mix the solution thoroughly. Well A3 now contains 1.0 mL of 250 ppm boron, and well B3 2.0 mL of 125 ppm boron.
7. Draw up 1.0 mL of the solution in well B3 and transfer it to well C3. Mix the solution thoroughly. Well B3 now contains 1.0 mL of 125 ppm boron, and well C3 2.0 mL of 62.5 ppm boron.
8. Draw up 1.0 mL of the solution in well C3 and transfer it to well C2. Mix the solution thoroughly. Well C3 now contains 1.0 mL of 62.5 ppm boron, and well C2 2.0 mL of 31.25 ppm boron.
9. Draw up 1.0 mL of the solution in well C2 and transfer it to well C1. Mix the solution thoroughly. Well C2 now contains 1.0 mL of 31.25 ppm boron, and well C1 2.0 mL of 15.625 ppm boron.
10.Draw up 1.0 mL of the solution in well C1 and transfer it to well B1. Mix the solution thoroughly. Well C1 now contains 1.0 mL of 15.625 ppm boron, and well B1 2.0 mL of 7.8125 ppm boron. To keep the solution level in all wells equal, draw up 1.0 mL of the solution in well B1 and discard it.
At this point, we have 8 concentrations of boron, each half as concentrated as the former. (Did you notice that we let the significant figures get away from us? The actual concentrations in the eight wells should be recorded as 1,000, 500, 250, 125, 63, 31, 16, and 8 ppm.)
11. Add one drop of the turmeric reagent to each of the nine wells in the array. The center well, which contains only distilled water, provides a reference to compare the other 8 wells against. That well should have a noticeable yellow color, which is the natural color of the reagent. Depending on lighting conditions, the yellow in that well may be too pale to see clearly. If that's the case, add one more drop of the turmeric reagent to well B1. If that's sufficient to show the contents of that well as clearly yellow, also add one more drop of the turmeric reagent to each of the other eight wells.
12.Record the concentrations of the wells and your observations of any color changes that occurred in your lab notebook.
Part III – Test samples for the presence and concentration of boron
In this part of the lab session, we'll test actual environmental specimens for the presence and concentration of boron. Use 15 mL centrifuge tubes to collect soil and water specimens from various locations, such as gardens or ponds. For water specimens, simply fill the tube, add 2 drops of hydrochloric acid, and cap it. For soil specimens, transfer about 2 mL of soil to the tube, add 5 mL of distilled water and 2 drops of hydrochloric acid, cap the tube and agitate it, and allow it to settle. You can also test household products that contain boron, such as eye
Copyright © 2013 by The Home Scientist, LLC Revision 1.0.7 – 10 January 2013

The Home Scientist, LLC CK01A Instruction Manual 199
drops, laundry Borax, insecticides that list boron or boric acid as an ingredient, and so on.
1. If you have not done so already, put on your goggles and gloves. Review the hazards of each chemical you will use.
2. Transfer 1.0 mL of the liquid to well B2. For solids, dissolve a tiny amount in 1.0 mL of distilled water
3. Add the number of drops of turmeric reagent you settled on in Part II. Note any color change and the intensity of the color relative to the comparison wells, and record your observations in your lab notebook.
4. Use a pipette to withdraw the liquid from well B2 and discard it. Use the corner of a paper towel to absorb the last few droplets. Fill the well with distilled water, stir the contents, and empty the well with a pipette. Repeat this rinse twice and then dry the well with the corner of a paper towel. The well is now ready for testing the next specimen.
Incidentally, don't be disappointed if none of your environmental samples contain detectable levels of boron. Some do; some don't. In science, negative results are often as useful as or more useful than positive results.
Clean-up and Disposal
All waste products from this session can be discarded with household garbage or flushed down the drain with water. Wash and dry the equipment.
Review Questions
1. What did you observe in Part I, and what do you conclude from those observations?
2. You are presented with a solution that is labeled as 0.1 M sodium borate. How would you go about testing this solution to determine the actual boron concentration? Could you test the solution directly, or would you have to make any changes to it before testing? What boron concentration, in ppm, would you expect to find if the solution had been made up and labeled correctly?
3. Which, if any, of your environmental specimens yielded positive results with the curcumin test? What level of boron did you determine in each specimen?
4. In our set of reference standards, the curcumin test was positive all the way down to about 8 ppm. Design an experiment to determine the threshold sensitivity of the curcumin test.
Copyright © 2013 by The Home Scientist, LLC Revision 1.0.7 – 10 January 2013

The Home Scientist, LLC CK01A Instruction Manual 200
Topic XIII. Analytical ChemistrySession XIII-2: Determine Salicylate Concentration in Urine
Advance Preparation:
Session:
None
90 to 120 minutes
Materials from Kit
□ Goggles□ Centrifuge tube(s), 15 mL□ Charcoal, activated□ Iron(III) chloride
□ Pipettes□ Reaction plate, 24-well□ Sodium salicylate□ Spatula
Materials You Provide
□ Gloves□ Aspirin (or other salicylate pain reliever)□ Desk lamp or other strong light source
□ Paper towel□ Urine specimen(s) (see text)□ Water, distilled
Concepts and Vocabulary
□ Quantitative analysis
□ Visual colorimetry
□ Salicylate/iron(III) complex
□ Biological half-time (BHT)
Background
Warning: Aspirin consumption by young people has been associated with increased incidence of Reye's Syndrome, a potentially fatal condition. The CDC, the Surgeon General, the American Academy of Pediatrics, and the FDA recommend that aspirin and products that contain aspirin—also listed on some labels as acetylsalicylate, salicylate, acetylsalicylic acid, ASA or salicylic acid—not be given to children under 19 years of age during episodes of fever-causing illnesses. If you are under 19 years of age, DO NOT TAKE ASPIRIN unless your physician advises you to do so.
For the purposes of this lab session, obtain urine samples from an adult who has recently consumed aspirin or used a muscle rub based on methyl salicylate (Ben-Gay or generic substitutes).
In this lab session, we'll use visual colorimetry to do a quantitative determination of salicylate ion concentration in urine. Aspirin is rapidly metabolized in the body to form salicylate ions, which quickly equilibrate in the blood serum and urine. The therapeutic range for pain relief is 10 milligrams (mg) to 20 mg of salicylate per deciliter (dL, 100 mL) of blood serum. Salicylate toxicity may occur at 30 mg/dL, and a level of 50 mg/dL or higher is a life-threatening emergency. Knowing the expected range of salicylate ions in the urine allows us to
Although aspirin and most salicylate compounds are colorless, salicylate ions form an intensely-colored violet complex with iron(III) ions. In this lab session, we'll use that fact by
Copyright © 2013 by The Home Scientist, LLC Revision 1.0.7 – 10 January 2013
The Home Scientist, LLC CK01A Instruction Manual 201
making up solutions of various known concentrations of salicylate ions, reacting those solutions with iron(III) ions, and visually comparing the intensity of the color produced against the color produced with a similarly-treated urine specimen. By comparing the intensity of the violet color of the urine specimen to those of the known concentrations of salicylate ions, we can estimate the salicylate concentration in the urine specimen.
The kit contains a solution of sodium salicylate that is 200 ppm (parts-per-million) with respect to salicylate ion. Another way of saying that is that this solution contains 200 mg of salicylate per liter of solution, or 20 mg/dL, which is near the upper end of the therapeutic range. We'll use serial dilution to produce known concentrations of about 10, 5, 2.5, 1.25, 0.625, 0.3125, and 0.15625 mg/dL. That covers the expected range of salicylate concentrations in our urine specimen(s), and also allows us to determine the sensitivity of the test at much lower concentrations.
One complicating factor is that urine may be anything from nearly colorless to a fairly deep yellow. Urine voided early in the morning is often darker in color and urine voided during the day is usually paler. To avoid the natural color of the urine masking the color produced by the reaction of salicylate ions with iron(III) ions, we'll use activated charcoal to decolorize the urine by adsorbing the organic molecules that give urine its color.
Obviously, that introduces yet another complication. What if the charcoal also adsorbs some or all of the salicylate ions? The only way to know one way or the other is to test it. So we'll add some activated charcoal to a small amount of our 200 ppm salicylate standard solution and compare the color produced by it against the color produced by the standard solution that has not been treated with activated charcoal.
Note: If you have a cooperative adult volunteer, you can explore this topic in more detail. Try to obtain a baseline urine specimen (in a 15 mL centrifuge tube) before the adult volunteer has consumed any aspirin, and determine the salicylate concentration of that specimen. Obtain additional urine specimens as close as possible to 15 minutes, 30 minutes and 1, 2, and 4 hours after the volunteer consumes the aspirin.
With a sufficient number of accurately-timed specimens, you can make at least a rough estimate of the biological half-time of aspirin in humans. (BHT is the time needed for half the dosage consumed to be eliminated.) Published figures for BHT for aspirin are in the 10 to 15 minute range, which means that aspirin present in blood serum is quickly removed by the kidneys and appears in the urine. Of course, many factors affect serum and urine concentrations of salicylate, not least the uptake time (the time needed for a consumed dose to appear in the blood serum).
Goals
This lab session has the following goals:
□ To observe the reaction of salicylate ions with iron(III) ions
□ To prepare salicylate comparison standards to test a salicylate unknown
□ To test unknown specimens for the presence and concentration of salicylate
Procedure
This lab session is in two parts. In Part I, we'll set up an array of various concentrations of salicylate ions that we'll use as a comparison standard. In Part II, we'll test urine specimens
Copyright © 2013 by The Home Scientist, LLC Revision 1.0.7 – 10 January 2013

The Home Scientist, LLC CK01A Instruction Manual 202
for the presence of salicylate and try to estimate its concentration.
Part I – Set up salicylate concentration comparison standards
In this part of the lab session, we'll set up a 3X3 array in the reaction plate, retaining the center well for testing samples. Because the eight surrounding wells each have a different concentration of salicylate ions, we can easily compare the center specimen well with each of the eight adjacent wells.
1. If you have not done so already, put on your goggles and gloves. Review the hazards of each chemical you will use.
2. Place the 24-well reaction plate on a white paper towel under a desk lamp or other strong light source.
3. Transfer, as accurately as possible, 1.0 mL of distilled water to each of wells A2, A3, B1, B3, C1, C2, and C3.
4. Transfer 1.0 mL of the sodium salicylate solution to well A1 and another 1.0 mL of the sodium salicylate solution to well A2. Mix the solution in well A2 thoroughly by stirring it with the tip of the pipette and by drawing up and expelling the solution several times.
At this point, we have 1.0 mL of sodium salicylate solution in well A1. That solution contains 20 mg/dL with respect to salicylate. Well A2 contains 2.0 mL of solution that is 10 mg/dL with respect to salicylate.
5. Draw up 1.0 mL of the solution in well A2 and transfer it to well A3. Mix the solution thoroughly. Well A2 now contains 1.0 mL of 10 mg/dL salicylate, and well A3 2.0 mL of 5 mg/dL salicylate.
6. Draw up 1.0 mL of the solution in well A3 and transfer it to well B3. Mix the solution thoroughly. Well A3 now contains 1.0 mL of 5 mg/dL salicylate, and well B3 2.0 mL of 2.5 mg/dL salicylate.
7. Draw up 1.0 mL of the solution in well B3 and transfer it to well C3. Mix the solution thoroughly. Well B3 now contains 1.0 mL of 2.5 mg/dL salicylate, and well C3 2.0 mL of 1.25 mg/dL salicylate.
8. Draw up 1.0 mL of the solution in well C3 and transfer it to well C2. Mix the solution thoroughly. Well C3 now contains 1.0 mL of 1.25 mg/dL salicylate, and well C2 2.0 mL of 0.625 mg/dL salicylate.
9. Draw up 1.0 mL of the solution in well C2 and transfer it to well C1. Mix the solution thoroughly. Well C2 now contains 1.0 mL of 0.625 mg/dL salicylate, and well C1 2.0 mL of 0.3125 mg/dL salicylate.
10.Draw up 1.0 mL of the solution in well C1 and transfer it to well B1. Mix the solution thoroughly. Well C1 now contains 1.0 mL of 0.3125 mg/dL salicylate, and well B1 2.0 mL of 0.15625 mg/dL salicylate. To keep the solution level in all wells equal, draw up 1.0 mL of the solution in well B1 and discard it.
11. Add two drops of iron(III) chloride solution to each of wells A1, A2, A3, B1, B3, C1, C2, and C3.
12.Record the concentrations of the wells and your observations of any color changes that occurred in your lab notebook.
Copyright © 2013 by The Home Scientist, LLC Revision 1.0.7 – 10 January 2013

The Home Scientist, LLC CK01A Instruction Manual 203
Part II – Test urine specimens for the presence and concentration of salicylate
In this part of the lab session, we'll test urine specimens for the presence and concentration of salicylate ions. Before we can do that, we need to determine the effect of treating a specimen with activated charcoal on the salicylate concentration of that specimen. Once we've established that, we can take it into account when we test actual urine specimens.
1. If you have not done so already, put on your goggles and gloves. Review the hazards of each chemical you will use.
2. Transfer about 1.25 mL of the standard 200 ppm salicylate solution to well D6 of the reaction plate and add about one-eight spatula spoon of activated charcoal to the well Stir the content of the well thoroughly for 15 seconds or so, and then allow the solid and liquid to separate.
3. Carefully draw up 1.0 mL of the solution in well A6 and transfer it to well B2. Add two drops of iron(III) chloride to well B2 and stir to mix the contents of the well. If the activated charcoal did not adsorb any of the salicylate ions in well B6, the colors of wells A1 and B2 should be identical, or nearly so. If the color in well B2 is less intense than well A1, we know that the activated charcoal must have adsorbed some or all of the salicylate ions. Note intensity of the color in well B2 relative to the comparison wells, and record your observations in your lab notebook.
Note: If the activated charcoal adsorbed little or none of the salicylate ions, you know that it's safe to use the charcoal to decolorize urine specimens. If the charcoal adsorbed some fraction of the salicylate ions (such as half), you can take that into account when you run the actual urine specimens. If the charcoal absorbed most or all of the salicylate ions, you know that you cannot use activated charcoal to decolorize your specimens, and will just have to do the best you can with the urine in its natural color.
4. Use a pipette to withdraw the liquid from well B2 and discard it. Use the corner of a paper towel to absorb the last few droplets. Fill the well with distilled water, stir the contents, and empty the well with a pipette. Repeat this rinse twice and then dry the well with the corner of a paper towel. The well is now ready for testing the next specimen.
5. Assuming that you have determined that it is safe to use activated charcoal to decolorize your specimens, add a level spatula spoon of charcoal to the centrifuge tube that contains your first urine specimen. Cap the tube and agitate it to decolorize the specimen.
6. Transfer 1.0 mL of the decolorized specimen to well B2 of the reaction plate. Add two drops of iron(III) chloride solution to that well, mix the contents, and compare the color in well B2 to the comparison wells. Record your observations in your lab notebook.
7. Repeat steps 5 and 6 for each of your remaining urine specimens.
Clean-up and Disposal
All waste products from this session can be flushed down the drain with water. Wash and dry the equipment.
Copyright © 2013 by The Home Scientist, LLC Revision 1.0.7 – 10 January 2013

The Home Scientist, LLC CK01A Instruction Manual 204
Review Questions
1. What concentration of salicylate ion did you detect in your urine specimen(s)?
2. In testing one of your urine specimens, you find that the color produced by the iron(III) ions is more intense than the color produced by your 20 mg/dL standard solution. You need to determine an accurate salicylate concentration for that specimen. How would you proceed?
3. Testing urine specimens from someone who'd used a methyl salicylate muscle rub showed urine salicylate concentrations similar to those obtained from someone who'd taken two extra-strength aspirin tablets. Based on that, do you believe the methyl salicylate muscle rub cream provides local pain relief or generalized pain relief? Why?
Copyright © 2013 by The Home Scientist, LLC Revision 1.0.7 – 10 January 2013

The Home Scientist, LLC CK01A Instruction Manual 205
Topic XIII. Analytical ChemistrySession XIII-3: Determine Vitamin C Concentration in Urine
Advance Preparation:
Session:
None
90 to 120 minutes
Materials from Kit
□ Goggles□ Ascorbic acid tablet□ Beaker, 100 mL□ Centrifuge tubes, 15 mL□ Charcoal, activated□ Graduated cylinder, 10 mL□ Graduated cylinder, 100 mL
□ Iodine/iodide solution□ Pipettes□ Spatula□ Stirring rod□ Test tubes□ Test tube rack
Materials You Provide
□ Gloves□ Desk lamp or other strong light source□ Foam cups□ Paper towel
□ Starch water (see text)□ Urine specimen(s) (see text)□ Vitamin C tablet(s)□ Water, distilled
Concepts and Vocabulary
□ Quantitative analysis
□ Iodometric titration
□ Absorption and adsorption
Background
Warning: The 500 mg ascorbic acid tablets included in the kit are in fact ordinary vitamin C tablets, repackaged for the kits. However, they were not repackaged under sanitary conditions, and are not intended for nor suitable for human consumption. If you take vitamin C for the purposes of this lab, take tablets that were packaged for human consumption.
Vitamin C, also called ascorbic acid, is an essential nutrient, the lack of which causes the horrible disease scurvy. Most mammals produce sufficient vitamin C for their needs; primates (including humans) and guinea pigs do not.
Humans are doubly unfortunate. Not only do we not produce as much vitamin C as we need; we don't store it, either. We must obtain the necessary amount of vitamin C from our diets, and we waste most of the vitamin C we consume. Very little vitamin C is metabolized in the human body; most is excreted unchanged. About 3% of excreted vitamin C is found in the feces, with the remainder excreted in the urine.
The concentration of vitamin C in human urine can vary dramatically, from less than 10 milligrams (mg) per liter (mg/L) to several thousand mg/L. The concentration varies from person to person and from hour to hour for the same person, depending on the amount of
Copyright © 2013 by The Home Scientist, LLC Revision 1.0.7 – 10 January 2013

The Home Scientist, LLC CK01A Instruction Manual 206
vitamin C consumed, frequency and volume of urination, time of day, state of health, and so on. For healthy people, the normal concentration of vitamin C in fresh urine ranges from about 100 mg/L to about 1,000 mg/L.
Vitamin C is a strong reducing agent. We'll use this fact to do a quantitative assay of vitamin C in urine specimens using a procedure called iodometric titration. An aqueous or alcoholic solution of iodine is brown. Vitamin C reacts quickly and quantitatively with iodine, reducing the brown elemental iodine to colorless iodide ions and oxidizing the vitamin C to dehydroascorbic acid, which is also colorless. We'll start with an iodine solution and slowly add urine until all of the iodine has been decolorized. By measuring how much urine is required to reach that point, and comparing that value with the amount of a vitamin C solution of known concentration needed to decolorize the same volume of the iodine solution, we can determine how much vitamin C is present in a known volume of that urine specimen.
One molecule of vitamin C reacts with one molecule of iodine, producing one molecule of dehydroascorbic acid and two iodide ions. The gram molecular weight of vitamin C, C6H8O6, is 176.126 g/mol, and that of iodine, I2, is 253.809 g/mol. Because we know that one molecule of vitamin C reacts with one molecule of iodine, we also know that 176.126 grams of vitamin C reacts with 253.809 grams of iodine. Simplifying this ratio, 176.126:253.809, tells us that this reaction consumes about 0.6939 milligrams (mg) of vitamin C per mg of iodine. Or, another way of looking at it, 1.4411 mg of iodine reacts with 1.0000 mg of vitamin C. We'll titrate a known volume of iodine solution with a solution of urine of unknown vitamin C concentration, and use this ratio to calculate the concentration of vitamin C in the urine specimen.
Goals
This lab session has the following goal:
□ To perform an iodometric titration
□ To prepare vitamin C comparison standards to test a vitamin C unknown
□ To test unknown specimens for the presence and concentration of vitamin C
Procedure
This lab session is in three parts. In Part I, we'll prepare a reference vitamin C solution. In Part II, we'll standardize that reference solution. In Part III, we'll test urine specimens for the presence of vitamin C and try to estimate its concentration. If possible, begin this lab session first thing in the morning. Complete Parts I and II of the session and then collect urine specimens before beginning Part III.
Part I – Prepare a reference vitamin C solution
In order to determine the unknown concentration of vitamin C in a urine specimen, we need a comparison standard with a known concentration of vitamin C. The easiest way to obtain such a standard is to dissolve a vitamin C tablet (which has a known mass of vitamin C) in a known volume of water. You can prepare this solution using one of the 500 mg ascorbic acid tablets included in the kit.
Recall that the normal range for vitamin C in human urine is about 100 mg/L to 1,000 mg/L. If we make up our standard solution to a concentration near the center of this range, say 500
Copyright © 2013 by The Home Scientist, LLC Revision 1.0.7 – 10 January 2013

The Home Scientist, LLC CK01A Instruction Manual 207
mg/L, we can expect that it will contain a roughly similar concentration of vitamin C as our urine sample and that roughly similar volumes of the standard solution and the urine should be needed to neutralize a specific volume of iodine solution. For example, if a given volume of iodine solution is neutralized by 20 drops of our 500 mg/L standard solution, we'd expect that same volume of iodine solution to be neutralized by anything from 10 drops of urine that contains 1,000 mg/L of vitamin C to 100 drops of urine that contains 100 mg/L.
1. If you have not done so already, put on your goggles and gloves. Review the hazards of each chemical you will use.
2. Transfer one 500 mg ascorbic acid tablet to a beaker that contains about 50 mL of distilled water. Swirl or stir the contents to dissolve the vitamin C tablet. (Don't worry if some solids remain undissolved; the tablet may contain starch or other insoluble binders.)
3. Pour the contents of the beaker into the 100 mL graduated cylinder. Rinse the beaker two or three times with a few mL of distilled water and add this to the cylinder to ensure that all of the vitamin C present in the beaker is transfered to the graduated cylinder. (This is called doing a quantitative transfer.)
4. Fill the graduated cylinder to the 100.0 mL mark with distilled water and stir to mix the contents thoroughly. At this point, the solution contains 500 mg of vitamin C per 100 mL, or 5,000 mg/L, which is 10 times more concentrated than we want.
5. Allow any solids in the graduated cylinder to settle, and then carefully pour 10.0 mL of the solution into the 10 mL graduated cylinder.
6. Rinse the 100 mL graduated cylinder thoroughly, and then transfer the 10.0 mL of solution from the 10 mL graduated cylinder to the 100 mL graduated cylinder. Rinse the 10 mL graduated cylinder two or three times with distilled water, and transfer the rinse water to the 100 mL graduated cylinder.
7. Fill the 100 mL graduated cylinder to the 100.0 mL mark with distilled water, and stir to mix the solution. At this point, the solution contains 50 mg of vitamin C per 100 mL, or 500 mg/L, which is the concentration we want for our standard solution.
8. Fill a 15 mL centrifuge tube with the standard vitamin C solution and cap it. (Vitamin C in solution quickly breaks down, particularly when exposed to air and light, so try to minimize such exposure over the course of this experiment.) Discard the vitamin C solution remaining in the 100 mL graduated cylinder.
Note: Even tiny amounts of free iodine react with a starch solution to produce an intensely colored blue-black complex. This phenomenon is used as an indicator for the presence of iodine (or starch). You can use any starch solution for this purpose. (We used some water that we'd cooked pasta in for dinner the previous evening; it keeps for a day or so in the refrigerator.) To prepare starch solution on the fly, simply boil a small amount of potato, rice, or pasta briefly in half a test tube of water.
Part II – Standardize the vitamin C reference solution
1. If you have not done so already, put on your goggles and gloves. Review the hazards of each chemical you will use.
2. Transfer 2.0 mL of water to each of two clean test tubes, and place those tubes in the rack.
Copyright © 2013 by The Home Scientist, LLC Revision 1.0.7 – 10 January 2013

The Home Scientist, LLC CK01A Instruction Manual 208
3. Add 10 drops of 0.1 M iodine/iodide solution to each of the two test tubes and swirl to mix the contents.
4. Working as quickly as possible, draw up a full pipette of the standard vitamin C solution and recap the centrifuge tube.
5. Add the vitamin C dropwise to the first test tube with swirling, keeping track of the number of drops you've added. As you continue adding the vitamin C solution, the color of the contents of the tube gradually fades from brownish to a pale yellow.
6. Once the tube contents appear pale yellow, add a few drops of starch water to the tube. The solution should immediately turn dark blue-black, indicating that some free iodine is still present.
7. Continue adding standard vitamin C solution with swirling until the solution in the test tube turns colorless (or very light blue). This may require only one or two more drops of solution.
8. Record the total number of drops of standard vitamin C solution required to neutralize the 10 drops of 0.1 M iodine/iodide solution in your lab notebook.
The next step is to determine whether activated charcoal adsorbs some or all of the vitamin C in the standard solution.
Note: Absorption and adsorption are different processes.
Absorption is incorporation of a material in one physical phase into another material of a different physical phase. For example, a solid paper towel absorbs liquid water, and liquid water absorbs carbon dioxide gas. Similarly, when you dissolve a solid chemical in water to make a solution, the water absorbs the solid chemical. One way to think about absorption is that the material being absorbed (the absorbate) fits into physical gaps in the structure of the material doing the absorbing (the absorbent).
Adsorption is adhesion of atoms, ions, or molecules of a gas, liquid, or dissolved solid (the adsorbate) to a solid surface (the adsorbent) by mutual attraction. Depending on the adsorbate and adsorbent, that attraction may be electrostatic, covalent, van der Waals, or some combination.
Both processes can occur simultaneously. For example, if you use activated charcoal to decolorize a solution, the charcoal both absorbs water and adsorbs the molecules that colored the solution. Because the water is not bonded to the charcoal, it can be driven off by heat, leaving the adsorbed molecules remain bonded to the charcoal.
9. Transfer a spatula spoon of activated charcoal to a 15 mL centrifuge tube. Add about 2 mL of the standard vitamin C solution to the tube, recap the tube, and swirl it for 15 to 30 seconds to mix the contents. Allow the charcoal to separate out and then draw off a pipette of the clear solution.
10.Using the second test tube, repeat steps 5 through 8 with this solution. If the activated charcoal does not adsorb vitamin C, the number of drops required to reach the end point should be the same as you recorded in step 8. If more drops are required, the activated charcoal is adsorbing vitamin C, which must be taken into account when calculating concentrations (and possibly will require modifying the experimental procedure in the following section). Record your observations in your lab notebook.
Copyright © 2013 by The Home Scientist, LLC Revision 1.0.7 – 10 January 2013

The Home Scientist, LLC CK01A Instruction Manual 209
Part III – Test specimens for the presence and concentration of vitamin C
If possible, collect urine specimens from at least two or three people, to allow comparing initial vitamin C concentrations from different sources. We'll analyze both the initial concentration of vitamin C and the effect on concentration of exposing the specimens to air and light over various periods of time. It's sufficient to analyze only the initial concentrations for all but one specimen and run the elapsed time analyses on that one specimen.
1. If you have not done so already, put on your goggles and gloves. Review the hazards of each chemical you will use.
2. Fill a foam cup with urine. If necessary, and depending on what you learned in the preceding section, add a spatula spoon of activated charcoal and stir the contents of the cup to decolorize the urine. Decant off the urine into a labeled foam cup, leaving the activated charcoal in the first cup. Discard the first cup and its contents.
3. Label five 15 mL centrifuge tubes and fill each of them completely with the urine specimen from the foam cup. Cap the tubes and store them in the refrigerator in the dark. (If anyone objects to placing urine specimens in the refrigerator, you can simply store them in a closed drawer or other dark location.)
4. Immediately titrate a portion of the specimen in the foam cup as described in the preceding section to determine the concentration of vitamin C present in the urine initially. If you've collected multiple urine specimens, titrate those as well and then discard the excess specimen. Record your observations in your lab notebook.
5. Place the uncovered foam cup on a windowsill or elsewhere that it will be exposed to daylight and air.
6. After 15 minutes has elapsed, titrate another portion of the specimen from the foam cup to determine the concentration of vitamin C present in the urine after 15 minutes' exposure to light and air. Replace the foam cup on the windowsill. Record your observations in your lab notebook.
7. Immediately remove one of the centrifuge tubes from dark storage and titrate that specimen to determine the concentration of vitamin C present in the urine after 15 minutes' of dark storage. Discard the excess specimen. Record your observations in your lab notebook.
8. Repeat steps 6 and 7 after elapsed times of 30 minutes, 1 hour, 2 hours, and 4 hours.
9. Given the known volume and concentration of the standard vitamin C solution needed to neutralize 10 drops of the 0.1 M iodine/iodide solution and the known volumes of urine needed to neutralize the same volume of the 0.1 M iodine/iodide solution, calculate the concentrations of vitamin C in the urine specimens in mg/L and record those values in your lab notebook. Graph and analyze your data.
Clean-up and Disposal
All waste products from this session can be flushed down the drain with water. Wash and dry the equipment.
Review Questions
1. What key assumption do we make in using iodometric titration to determine the
Copyright © 2013 by The Home Scientist, LLC Revision 1.0.7 – 10 January 2013

The Home Scientist, LLC CK01A Instruction Manual 210
concentration of vitamin C in urine?
2. What values did you obtain for the initial vitamin C concentration in your various urine specimens?
3. How did exposure to light and air affect the concentrations of vitamin C in the urine specimens?
4. Were the vitamin C concentrations of the specimens kept in the dark affected by the passage of time? If so, how did those concentrations compare to those in the specimen exposed to light and air?
5. Many texts recommend using a dilute solution of sodium thiosulfate to remove iodine stains. What alternative can you propose?
6. What implication does the high concentration of vitamin C typically present in urine have for the human diet?
Copyright © 2013 by The Home Scientist, LLC Revision 1.0.7 – 10 January 2013

The Home Scientist, LLC CK01A Instruction Manual 211
Topic XIII. Analytical ChemistrySession XIII-4: Detect Lead in Household Materials
Advance Preparation:
Session:
Prepare paint and other specimens (see Background)
90 to 120 minutes
Materials from Kit
□ Goggles□ Centrifuge tube(s), 15 mL and/or 50 mL□ Graduated cylinder, 10 mL□ Lead(II) acetate□ Pipettes
□ Potassium dichromate□ Potassium iodide□ Reaction plate, 24-well□ Sharpie marking pen□ Sodium sulfide
Materials You Provide
□ Gloves□ Desk lamp or other strong light source□ Knife□ Paper towels
□ Specimens (see text)□ Vinegar, distilled white□ Water, distilled
Concepts and Vocabulary
□ Screening test
□ False positive
□ Confirmatory test
□ Semi-quantitative analysis
Background
The heavy metal lead is well-known for its toxicity, both acute and chronic. Nowadays, the use of lead in consumer products is very tightly regulated. It wasn't always that way. Before the 1970's, lead and lead products were very widely used with little concern for their toxicity. In particular, lead carbonate was used, sometimes in very large amounts, as a white pigment in most inexpensive paints, and lead-based pewter was commonly used for drinking vessels, flatware, and other household objects.
Millions of homes that were built before 1978 have lead paint on their walls, and millions of household objects, notably those of pewter, contain large amounts of free lead. Lead is extremely toxic if ingested or inhaled. Ingestion toxicity is most common when lead-containing objects, such as pewter pitchers, are used to store acidic liquids, such as orange juice or vinegar, or when a child eats paint chips that have flaked off a wall painted with lead-based paint. Inhalation toxicity usually occurs when someone sands a surface that was painted with lead-based paint. The sanding produces toxic lead-containing dust, which is inhaled into the lungs and absorbed into the bloodstream.
Warning: This lab session is an educational exercise only. Do not rely upon these tests to determine if lead is actually present in your home. A negative result is not proof that lead is not present in your home, or even that it is not present in the sample you tested.
Copyright © 2013 by The Home Scientist, LLC Revision 1.0.7 – 10 January 2013

The Home Scientist, LLC CK01A Instruction Manual 212
If you suspect lead is present in your home, contact your local health department or extension service and ask their advice about how to proceed.
Metallic lead and most lead salts are extremely insoluble in water, and so must be extracted (leached) from the specimens before a test can be run. Because lead acetate is freely soluble in water, this leaching is usually done by soaking the sample in a dilute solution of acetic acid. We'll use distilled white vinegar, which is 5% acetic acid, or about 0.8 M.
Lead carbonate, the most common lead-based paint pigment reacts quickly with acetic acid to form soluble lead(II) acetate. (Some lead-based pigments, such as lead chromate, are leached to a much smaller degree by acetic acid.)
To leach lead from a lead-based paint, pry up a paint chip that you suspect may contain lead, immerse the chip in acetic acid and break it up, and allow the acetic acid to react with any lead carbonate present in the chip. (Actually, it's seldom possible to extract all of the lead, because some or most of the pigment is protected from the acetic acid by insoluble binders.) If a paint chip contains a significant amount of lead carbonate, leaching the chip for only 10 minutes or so is sufficient to extract sufficient lead to yield a positive test, but allowing the reaction to proceed overnight does no harm.
Note: Although lead-based paint has been banned from residential use for more than 30 years, lead-based paints are still often used commercially. If you want a paint chip that's more likely than residential paint to contain lead carbonate, pry up a small paint chip from a white parking lot line. (Yellow parking lot lines generally use paint based on lead chromate rather than lead carbonate; lead chromate is much less reactive with acetic acid and may yield a negative lead test until you use more concentrated acetic acid—such as the 6 M acetic acid included in the test—and allow the reaction to proceed at least overnight.)
If you have household items you'd like to test for lead—such as pewterware, old cast metal toys, and so on—you'll need to begin preparation a day or so in advance of running the lab session. Acetic acid will extract lead from objects that contain it in metallic form, but the reaction between acetic acid and metallic lead is much slower than the reaction with lead carbonate. You need to put the acetic acid in contact with the suspect material and allow it to remain in contact at least overnight.
For example, if you have a pewter goblet that you suspect contains lead, pour some vinegar into the goblet, cover the goblet with plastic wrap or aluminum foil to prevent evaporation, and allow the reaction to continue overnight. Similarly, if you have small antique toy soldiers that you'd like to test, place one of them in a foam cup, cover the cup to prevent evaporation, and allow the reaction to continue overnight.
Having extracted at least some of any lead present as the soluble acetate salt, the next question is how to test that extract for the presence of lead. The extract solution is water-white and indistinguishable from the original vinegar. Fortunately lead cations react with various anions to form insoluble colored salts.
One common lead-test reagent is sodium sulfide. Sulfide ions react with lead ions to form extremely insoluble lead(II) sulfide, which yields a brown to black stain depending on the lead concentration in the extract solution. Observing the color and intensity of the lead(II) sulfide stain produced and the time needed for the stain to form provides at least an approximate idea of the lead concentration present.
Unfortunately, many other metal ions also react with sulfide anions to form insoluble colored
Copyright © 2013 by The Home Scientist, LLC Revision 1.0.7 – 10 January 2013

The Home Scientist, LLC CK01A Instruction Manual 213
salts that are indistinguishable visually from lead(II) sulfide, yielding a false-positive test for lead. Although most of those metals are unlikely to be present in paint or household items, one of them, cobalt, is often present in paints, including lead-free paints.
The sulfide test for lead is sensitive and fast, but this lack of selectivity means it's suitable only as a screening test, one whose results must be verified by using one or more confirmatory tests. For those confirmatory tests, we'll use 0.1 M potassium dichromate and 0.1 M potassium iodide, both of which produce yellow precipitates in the presence of lead ions. (Cobalt, the most likely cause of a false-positive sulfide test, does not.) We'll use two confirmatory test reagents because, although both produce insoluble precipitates, the degree of insolubility differs. That means we can use this differential solubility to get at least an approximate idea of the actual concentration of lead ions present in the extract solution.
Obviously, if we want to test for lead at least semi-quantitatively, we'll need some basis for comparison. The kit contains a solution of 0.1 M lead(II) acetate, which we'll use as a comparison standard. We can convert that molarity to parts-per-million (ppm) by the following calculations: the gram molecular mass of lead(II) acetate, Pb(CH3COO)2, is 325.3 g/mol, of which lead (molecular mass = 207.2 g/mol) makes up (207.2 grams/mol ÷ 325.3 g/mol) = 0.637 or 63.7%. A 0.1 M lead(II) acetate solution therefore contains 32.53 g/L, of which (32.53 g/L * 0.637) = 20.72 grams is lead. We can therefore say that the concentration of this solution with respect to lead ions is 20.72 g/L or 20.72 mg/mL, or 20,720 ppm.
Warning: Solutions that contain lead, dichromate, or sulfide ions are toxic, as is paint or paint dust that contains lead. Avoid breathing paint dust that contains or may contain lead. Sodium sulfide solution emits hydrogen sulfide, which is extremely toxic and smells incredibly bad. Wear goggles and gloves, and work in a well-ventilated area. Dispose all waste from this experiment in accordance with local hazardous waste disposal regulations.
Procedure
This lab session has three parts. In Part I, we determine the sensitivity of our reagents by testing them against solutions that contain various known concentrations of lead ions. In Part II, we use sodium sulfide solution to do a preliminary screening test for lead. In Part III, we we test one or more of the sample extracts that yielded a positive sulfide test to determine approximately how much lead they actually contain.
Part I – Testing sensitivity of the reagents
In this part of the lab session, we'll do two sets of serial dilutions of our standard 20,720 ppm lead solution 1:1 with distilled water, each in 12 wells of our reaction plate, to provide two sets of known lead ion concentrations from 20,720 ppm down to about 10 ppm. We'll place one drop of each dilution in a separate circle on a sheet of paper that we'll later use to test our sodium sulfide reagent. We'll then test one set of dilutions with potassium dichromate solution and the other set of dilutions with potassium iodide solution to determine the minimum lead ion concentration at which each of those reagents provides a positive result.
1. If you have not done so already, put on your goggles and gloves. Review the hazards of each chemical you will use.
2. On a white paper towel, draw 12 circles, each about 2 to 3 cm in diameter, and labeled #1 through #12.
Copyright © 2013 by The Home Scientist, LLC Revision 1.0.7 – 10 January 2013

The Home Scientist, LLC CK01A Instruction Manual 214
3. Transfer 0.5 mL of distilled water to each well in the 24-well reaction plate except wells A1 and C1.
4. Transfer 0.5 mL of 0.1 M lead(II) acetate solution to each of wells A1, A2, C1, and C2. Transfer one drop of 0.1 M lead(II) acetate solution to circle #1 on the paper.
Note: More concentrated solutions of lead(II) acetate tend to bead up rather than spread when applied to the paper towel. Ideally, we want each spot to be the same size. You can apply one drop of distilled water to an unused part of the paper towel to determine the normal size for a spot. As best you can, use the tip of the pipette to spread the concentrated solutions to cover about the same area as the dilute solutions.
5. Mix the solution in well A2 thoroughly by drawing it up into the pipette and expelling it into the well several times. Then draw up the solution from well A2 and transfer 0.5 mL of it to well A3. Place 1 drop of the solution from well A2 in circle #2 on the paper towel, and return the remainder of the unused solution from the pipette to well A2. At this point, you have a 20,720 ppm lead solution in well A1, a 10,360 ppm solution in well A2, and a 5,180 ppm solution (as yet unmixed) in well A3.
6. Repeat step 5 with well C2, so that you end up with a 20,720 ppm lead solution in well C1, a 10,360 ppm solution in well C2, and a 5,180 ppm solution (as yet unmixed) in well C3.
7. Repeat steps 5 and 6 with the remaining wells until all 24 wells of the reaction plate are populated with the serial dilutions of the lead solution summarized in Table XIII-1 and all 12 circles on the paper have been spotted with the appropriate dilutions of the lead solution. Record the concentrations of the wells and spots in your lab notebook.
Table XIII-1. Lead ion concentration in reaction plate wells
Well Pb2+ Concentration Well Pb2+ Concentration Paper Spot #
A1 ~ 20,720 ppm C1 ~ 20,720 ppm 1
A2 ~ 10,360 ppm C2 ~ 10,360 ppm 2
A3 ~ 5,180 ppm C3 ~ 5,180 ppm 3
A4 ~ 2,590 ppm C4 ~ 2,590 ppm 4
A5 ~ 1,295 ppm C5 ~ 1,295 ppm 5
A6 ~ 648 ppm C6 ~ 648 ppm 6
B1 ~ 324 ppm D1 ~ 324 ppm 7
B2 ~ 162 ppm D2 ~ 162 ppm 8
B3 ~ 81 ppm D3 ~ 81 ppm 9
B4 ~ 40 ppm D4 ~ 40 ppm 10
B5 ~ 20 ppm D5 ~ 20 ppm 11
Copyright © 2013 by The Home Scientist, LLC Revision 1.0.7 – 10 January 2013

The Home Scientist, LLC CK01A Instruction Manual 215
B6 ~ 10 ppm D6 ~ 10 ppm 12
8. Transfer 2 drops of the potassium dichromate solution to well B6 and observe the well closely for several seconds, looking for the appearance of a yellow precipitate. If a precipitate appears, you know that the potassium chromate solution yields a positive result under these conditions with a lead concentration of about 10 ppm (0.001%).
9. If no precipitate appears in well B6, repeat step 8 with well B5. Continue testing wells with increasing concentrations of lead ions until you determine the minimum lead ion concentration that yields a positive test under these conditions. Note the approximate lower limit for lead concentration determinable by this test. Record your observations in your lab notebook.
10.Repeat steps 8 and 9, transferring two drops of potassium iodide solution to well D6, looking for the formation of a precipitate, and, if necessary, repeating with subsequent wells until you have determined what minimum lead concentration yields a positive test. Record your observations in your lab notebook.
11. After allowing all spots on the paper towel to dry completely, put one drop of sodium sulfide solution on spot #12 (the least concentrated spot). Observe the spot for 30 seconds. If a stain forms, note the approximate time required before it first becomes visible, write the time required beside the spot, and record it in your lab notebook.
12. If no stain appears on spot #12 after 30 seconds, record that fact in your lab notebook and repeat step 11 for spot #11.
13.Continue repeating the procedure for each of the remaining 10 spots, noting the time required in each case for the spot to first become visible. Write this time next to each spot and record it in your lab notebook.
Part II – Preliminary screening
In this part of the lab session, we'll use sodium sulfide solution to do a quick preliminary screening of the extract solution obtained from suspect paint samples and household objects. If lead is present in significant concentration in a specimen, the sulfide test will almost certainly be positive. However, a positive sulfide test tells us only that lead may be present, because many other metal ion species may yield false positives. Also, although the sulfide test does give some idea of how much lead is present—a little or a lot—it's only roughly quantitative.
1. If you have not done so already, put on your goggles and gloves. Review the hazards of each chemical you will use.
2. Place one drop of the each extract solution on a paper towel and add one drop of 0.1 M sodium sulfide solution to each spot. (You needn't wait for the extract spots to dry; the reaction occurs just as well with them wet.)
3. Observe the spots for 30 seconds for the appearance of a black or brown stain. Based on the reaction times and spot intensities you observed in Part I with known concentrations of lead, estimate the approximate concentration of lead in each extract solution that yielded a positive result. Record your observations in your lab notebook.
Copyright © 2013 by The Home Scientist, LLC Revision 1.0.7 – 10 January 2013

The Home Scientist, LLC CK01A Instruction Manual 216
Part III – Determining approximate lead concentrations
In this part of the lab session, we'll test the extract solutions that showed a positive sodium sulfide test, first to verify that lead is in fact present, and second, if lead is actually present, to determine its approximate concentration. The color and intensity of the sulfide spots give us a rough idea of lead concentration, which we'll use as a starting point for precipitation tests.
For the precipitation tests, we'll again use serial dilutions and determine the least concentrated solutions in which the dichromate and iodide reagents yield precipitates. By comparing those values with those we obtained in Part I, we can estimate the actual lead concentration of the extract solutions with reasonable accuracy.
1. If you have not done so already, put on your goggles and gloves. Review the hazards of each chemical you will use.
2. To verify that lead is actually present in the first specimen that tested positive with sulfide, transfer about 0.5 mL of that specimen to each of two wells of the reaction plate. Add one drop of potassium dichromate to one of the wells and one drop of potassium iodide to the other. If lead is present, both wells show a yellow precipitate. No precipitate or a precipitate that is not yellow indicates that the sulfide reagent test was a false positive.
3. Assuming that the dichromate and iodide results are positive, prepare two sets of serial dilutions of that specimen in the reaction plate. The number of wells for each serial dilution depends on the approximate concentration of lead in the specimen, as indicated by the color and intensity of the sulfide test results. For example, if the specimen shows a high concentration of lead, you'll need to prepare the full twelve wells for each set. If the sulfide test showed a moderate to low concentration, you can get by with fewer wells. In any event, you want to make sure that your dilutions reach at least the level at which neither the dichromate reagent nor the iodide reagent causes a precipitate.
4. Working your way up from the least concentrated wells, use the same procedure you used in Part I to determine the least concentrated well in which each of the precipitation reagents yields a positive test. Record your observations in your lab notebook.
Clean-up and Disposal
Treat all of the solid and liquids produced in this lab session as hazardous waste. Place them in an empty soda bottle or other container and dispose them in accordance with local hazardous waste laws and regulations. Wash and dry the equipment.
Review Questions
1. Assume that you have prepared serial dilutions and find that one of your precipitation reagents yields no precipitate at 5, 10, 20, or 40 ppm concentration, but yields a distinct precipitate at 80 ppm. Under these circumstances, a positive test tells you only that the concentration is at least 80 ppm, and a negative test tells you only that the concentration is no more than 40 ppm. Design an experiment to reduce this uncertainty to 2 ppm or less.
2. What additional data do we need to provide a full quantitative lead test? Assuming that you have access to one piece of equipment that is not included in the kit, construct an
Copyright © 2013 by The Home Scientist, LLC Revision 1.0.7 – 10 January 2013

The Home Scientist, LLC CK01A Instruction Manual 217
experiment that would provide full quantitative results.
Copyright © 2013 by The Home Scientist, LLC Revision 1.0.7 – 10 January 2013

The Home Scientist, LLC CK01A Instruction Manual 218
XIVSynthetic Chemistry
Chemical reactions are often interesting in themselves, but most chemical reactions have the practical goal of synthesizing some useful compound. With the exception of purely natural products, nearly every material you come into contact with in your daily life is the product of a chemical synthesis. Those products were first synthesized on a small scale by chemists in laboratories, and later produced on an industrial scale using processes designed by chemists and chemical engineers.
On a laboratory scale, many thousands of new chemical compounds are synthesized every month, for numerous purposes. For example, a pharmaceutical firm may synthesize literally hundreds of similar compounds as a part of initial screening for in vitro activity, and a biocide firm may do the same to screen for insecticidal activity among many similar compounds. On an industrial scale, many compounds are synthesized in huge quantities—millions of tons per year—and tens of thousands of compounds are routinely synthesized by the ton.
In choosing a session for this chapter, we were faced with an embarrassment of riches. We could have chosen to synthesize any of literally thousands of compounds, from soaps to plastics to dyes and pigments to common drugs such as aspirin to ... well, you get the idea. From that huge list of possibilities, we chose one representative synthesis.
In that lab session, we synthesize six different esters from three alcohols—ethanol, isopropanol, and n-butanol—and two carboxylic acids, acetic acid and salicylic acid. Esters are synthesized commercially on a large scale for use in foods, perfumes, and other products where the strong, pleasant odor and taste of many esters is important. Esters are also important as industrial solvents, as feedstocks for synthesizing plastics and other compounds, and for many other applications.
Copyright © 2013 by The Home Scientist, LLC Revision 1.0.7 – 10 January 2013

The Home Scientist, LLC CK01A Instruction Manual 219
Topic XIV. Synthetic ChemistrySession XIV-1: Synthesize Esters
Advance Preparation:
Session:
None
90 to 120 minutes
Materials from Kit
□ Goggles□ Acetic acid□ Beaker, 250 mL□ n-Butanol□ Cotton balls□ Hydrochloric acid□ Pipettes□ Salicylic acid
□ Sharpie marking pen□ Spatula□ Test tubes□ Test tube clamp□ Test tube rack□ Thermometer□ Wire gauze
Materials You Provide
□ Gloves□ Ethanol, 95%□ Hotplate or other heat source
□ Isopropanol, 99%□ Paper towels□ Water, distilled
Concepts and Vocabulary
□ Esters
□ Esterification
□ Oxoacid
□ Ester naming conventions
□ Refluxing
Background
Esters are organic compounds formed by esterification, a condensation reaction of an organic or inorganic oxoacid and an alcohol or phenol, with the elimination of a water molecule. In generalized form, the hydroxy (OH) group of an alcohol, R-OH (where R can be a methyl group, CH3, or a larger organic group), reacts with a proton from an acid, R'-H (where R' may be an organic or inorganic group), to form an ester, R-R', and a molecule of water, H2O.
oxoacid + alcohol ester + water⇌
For example, one molecule of methanol, CH3-OH, reacts with one molecule of acetic acid, CH3COO-H, to form one molecule of methyl acetate, CH3COO-CH3, and one molecule of water, H-OH. One molecule of phenol, C6H5-OH, reacts with one molecule of formic acid, HCOO-H, to form one molecule of phenyl formate, HCOO-C6H5 and one molecule of water, H-OH.
The common names of esters are formed by adding “yl” to the root name of the alcohol or phenol and adding “ate” to the root name of the acid. For example, ethanol and benzoic acid
Copyright © 2013 by The Home Scientist, LLC Revision 1.0.7 – 10 January 2013

The Home Scientist, LLC CK01A Instruction Manual 220
form eth(yl) benzo(ate); isopropanol and salicylic acid form isoprop(yl) salicyl(ate); and phenol and acetic acid form phen(yl) acet(ate).
Many esters have strong scents and flavors, often pleasant, and so are often used in perfumes and as flavorings in various foods. In this lab session, we'll synthesize several of these esters.
Goals
This lab session has the following goals:
□ To understand how esters are made and named
□ To prepare several esters and characterize them by their odors
Procedure
1. If you have not done so already, put on your goggles and gloves. Review the hazards of each chemical you will use.
2. Prepare a hot water bath with about 125 mL of water in the 250 mL beaker. Adjust the temperature of the bath to between 60 °C and 65 °C. Keep the bath in this temperature range throughout the experiment by adding hot or cold water, keeping the water level approximately the same.
3. Label six test tubes A through F and place them in the rack.
4. Transfer 1.0 mL of 6 M acetic acid to each of tubes A, C, and E and two heaping spatula spoons of salicylic acid to each of tubes B, D, and F.
5. Transfer 1.0 mL of 95% ethanol to each of tubes A and B, 1.0 mL of 99% isopropanol to each of tubes C and D, and 1.0 mL of n-butanol to each of tubes E and F. Swirl the tubes to mix the contents.
6. Transfer 0.25 mL of 6 M hydrochloric acid to each of tubes A through F, and swirl to mix the contents of the tubes.
7. Stopper the mouth of each tube loosely with a cotton ball and place all six of the tubes in the hot water bath.
Note: We use a cotton ball rather than a rubber stopper because the heat of the water bath causes some of the liquids to evaporate. The additional pressure caused by that evaporation would simply expel the stoppers from the tubes. Cotton balls are permeable, which allows the pressures to equalize without losing vapor from the tubes. The hot vapor cools and condenses on the upper part of the tubes and the cotton stopper, and drips back into the reaction mixture. This process is called refluxing, and is a very common procedure in organic chemistry labs.
8. Allow the tubes to remain in the hot water bath for at least 10 minutes. Keep an eye on the tubes to make sure that none of them boil over. If one or more tubes is boiling too vigorously, add cold water to the bath and maintain the bath at that lower temperature for the remaining reaction time.
9. After 10 minutes, use the test tube clamp to remove each tube from the hot water bath and place it in the rack. Allow the tubes to cool to room temperature.
10.Remove the cotton plugs and transfer enough distilled water to each of the tubes to fill
Copyright © 2013 by The Home Scientist, LLC Revision 1.0.7 – 10 January 2013

The Home Scientist, LLC CK01A Instruction Manual 221
them about 3/4 full. The contents of the tubes separate into two layers. The lower (aqueous) layers contain unreacted alcohols and acids; the upper layers are the esters.
11. Use a clean pipette to withdraw some of the upper layer from test tube A. Transfer 1 drop of that liquid to a piece of paper towel. Hold the paper towel in one hand and use the other hand to waft the odor of the ester toward your nose. Record your observations in your lab notebook.
12.Repeat step 11 for each of the other test tubes.
Clean-up and Disposal
All waste products from this session can be flushed down the drain with water. Wash and dry the equipment.
Review Questions
1. What ester did you synthesize in each of the tube tubes?
2. What general characteristics did you observe for the esters you synthesized?
3. Using only the odor, can you discriminate each of these six esters from the other five?
4. The common name of methyl salicylate is Oil of Wintergreen, familiar to anyone who has eaten a Wintergreen Lifesaver or used Ben-Gay muscle rub. Other than the items listed for this lab session, what would need to synthesize methyl salicylate?
5. Methyl salicylate is toxic if ingested, but is also commonly used as a food flavoring (such as candies and some liqueurs). How can this be?
6. Which ester would you not want to expose to air in an outdoor area where bees are present? Why? What fruit does the odor of this ester resemble?
Copyright © 2013 by The Home Scientist, LLC Revision 1.0.7 – 10 January 2013