Embed Size (px)
Citation preview

Standard Title Page - Report on State Project Report No.
Report Date
No. Pages
Type Report: Supplement to Final
Project No.: 70793
VTRC 06-R14 February 2006 30 Period Covered: 11/04–12/05
Contract No.
Title: Structural Load Testing and Flexure Analysis of the Route 701 Bridge in Louisa County, Virginia: Supplemental Report
Key Words: Structural Load Testing, Flexure, Cracking, Reinforced Concrete
Authors: Jeremy Lucas, Thomas E. Cousins, and Michael C. Brown
Performing Organization Name and Address: Virginia Transportation Research Council 530 Edgemont Road Charlottesville, VA 22903
Sponsoring Agencies’ Name and Address Virginia Department of Transportation 1401 E. Broad Street Richmond, VA 23219
Supplementary Notes
Abstract A continuous slab bridge in Louisa County, Virginia, on Route 701 developed a planar horizontal crack along the length of all three spans. This project was designed to determine if the current 12-ton posted load restriction of the bridge (instituted in January 2002) could be raised and to determine if the horizontal crack causes degradation in the structural integrity, specifically stiffness, over time. These objectives were accomplished through field tests performed in November 2003 and October 2004. One truck (loaded to three different weights) was used to perform static and dynamic tests on the bridge, and the truck was oriented in three test lanes. Vertical displacement sensors, or deflectometers, attached to the underside of the bridge slab were used to measure deflections during truck passes. The recorded deflections were analyzed and normalized to document the current behavior of the bridge. The 2003 values were compared to estimated design values in accordance with the AASHTO Standard Specifications for Highway Bridges. Under the testing loads, the bridge behaved elastically, and thus raising the load rating of the bridge to 27 tons was considered safe. Normalized deflections from both years were compared to determine if there was progressive damage to the bridge attributable to crack growth. The researchers concluded that no degradation of the stiffness of the bridge occurred over the last year of service. Carrying out the recommendation of this report to remove the posting that restricts loading of the structure will not incur any significant cost. The benefit of removing the posting would be that trucks weighing more than 12 tons, but not exceeding the legal limit, could cross the structure. This would allow the Virginia Department of Transportation to defer superstructure replacement, at an estimated cost of $350,000, thus freeing up funds to address more pressing needs.
FINAL REPORT
STRUCTURAL LOAD TESTING AND FLEXURE ANALYSIS OF THE ROUTE 701 BRIDGE IN LOUISA COUNTY, VIRGINIA:
SUPPLEMENTAL REPORT
Jeremy Lucas Graduate Research Assistant
Charles E. Via, Jr. Department of Civil and Environmental Engineering Virginia Polytechnic Institute & State University
Thomas E. Cousins, Ph.D., P.E.
Associate Professor Charles E. Via, Jr. Department of Civil and Environmental Engineering
Virginia Polytechnic Institute & State University
Michael C. Brown, Ph.D., P.E. Research Scientist
Virginia Transportation Research Council
Virginia Transportation Research Council (A Cooperative Organization Sponsored Jointly by the
Virginia Department of Transportation and the University of Virginia)
Charlottesville, Virginia
February 2006 VTRC 06-R14

ii
DISCLAIMER
The contents of this report reflect the views of the authors, who are responsible for the facts and the accuracy of the data presented herein. The contents do not necessarily reflect the official views or policies of the Virginia Department of Transportation, the Commonwealth Transportation Board, or the Federal Highway Administration. This report does not constitute a standard, specification, or regulation.
Copyright 2006 by the Commonwealth of Virginia.

iii
ABSTRACT A continuous slab bridge in Louisa County, Virginia, on Route 701 developed a planar horizontal crack along the length of all three spans. This project was designed to determine if the current 12-ton posted load restriction of the bridge (instituted in January 2002) could be raised and to determine if the horizontal crack causes degradation in the structural integrity, specifically stiffness, over time. These objectives were accomplished through field tests performed in November 2003 and October 2004. One truck (loaded to three different weights) was used to perform static and dynamic tests on the bridge, and the truck was oriented in three test lanes. Vertical displacement sensors, or deflectometers, attached to the underside of the bridge slab were used to measure deflections during truck passes. The recorded deflections were analyzed and normalized to document the current behavior of the bridge. The 2003 values were compared to estimated design values in accordance with the AASHTO Standard Specifications for Highway Bridges. Under the testing loads, the bridge behaved elastically, and thus raising the load rating of the bridge to 27 tons was considered safe. Normalized deflections from both years were compared to determine if there was progressive damage to the bridge attributable to crack growth. The researchers concluded that no degradation of the stiffness of the bridge occurred over the last year of service. Carrying out the recommendation of this report to remove the posting that restricts loading of the structure will not incur any significant cost. The benefit of removing the posting would be that trucks weighing more than 12 tons, but not exceeding the legal limit, could cross the structure. This would allow the Virginia Department of Transportation to defer superstructure replacement, at an estimated cost of $350,000, thus freeing up funds to address more pressing needs.

FINAL REPORT
STRUCTURAL LOAD TESTING AND FLEXURE ANALYSIS OF THE ROUTE 701 BRIDGE IN LOUISA COUNTY, VIRGINIA:
SUPPLEMENTAL REPORT
Jeremy Lucas Graduate Research Assistant
Charles E. Via, Jr. Department of Civil and Environmental Engineering Virginia Polytechnic Institute and State University
Thomas E. Cousins, Ph.D., P.E.
Associate Professor Charles E. Via, Jr. Department of Civil and Environmental Engineering
Virginia Polytechnic Institute and State University
Michael C. Brown, Ph.D., P.E. Research Scientist
Virginia Transportation Research Council
INTRODUCTION
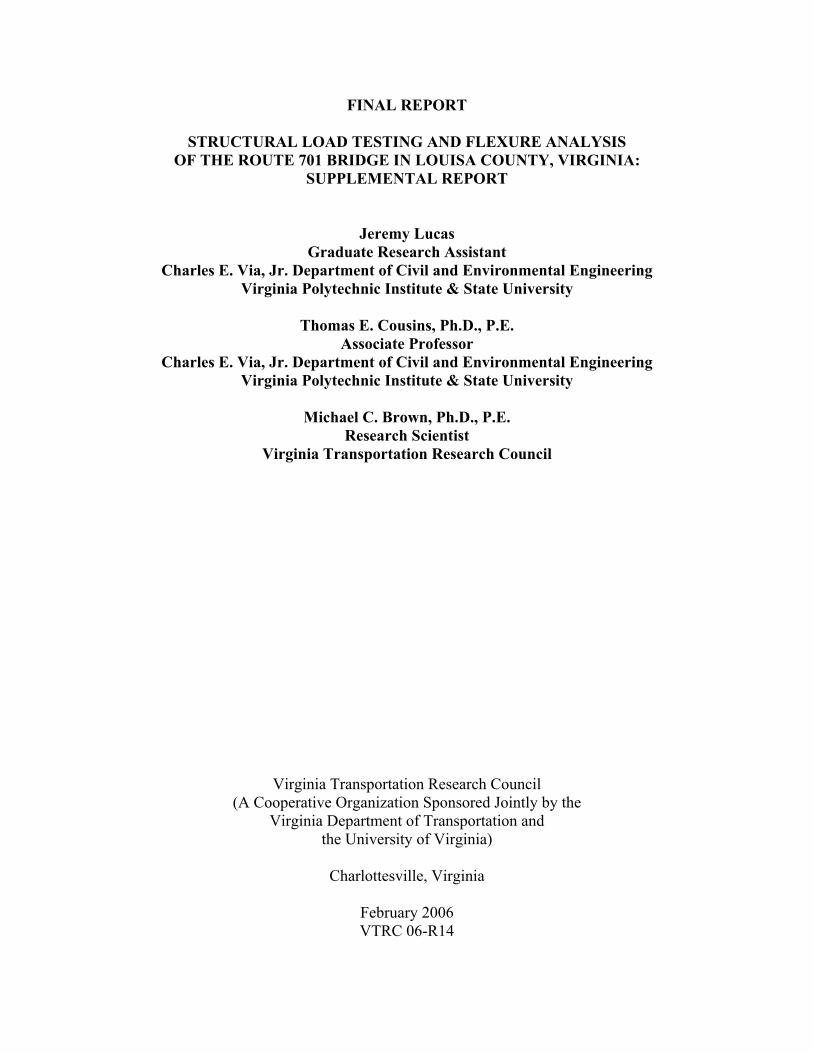
Slab bridges have been around for most of the twentieth century. With the advantages of a simplified layout and the requirement for less formwork, compared with other reinforced concrete bridge designs, slab bridges have been a popular choice where materials were cheap and labor was more expensive. Continuous slab bridges are adaptable to smaller stream crossings and grade separations. They are most economical and popular as three- to five-span configurations with middle span lengths of 35 to 45 ft. Recently, slab bridges became less popular, being replaced by prestressed concrete bridges that require less onsite work with the elimination of false work and less form work, thus speeding up the construction process. In the early 1980s, the Virginia Department of Highways & Transportation (1984) (now the Virginia Department of Transportation [VDOT]) constructed a continuous slab bridge on Route 701 across the Little River, approximately 1.4 miles south of Route 618 in Louisa County, Virginia. The bridge is a three-span continuous reinforced concrete slab bridge with a 15˚ skew. The end spans are both 40 ft and the center span is 50 ft in length. The spans are haunched toward the piers, with an average thickness of 22.5 in at the center span and 33.5 in at the piers. The overall width of the bridge is 29 ft 10 in, with two traveling lanes of 13 ft 3 in (see Figures 1 and 2).
The bridge was designed in accordance with the American Association of State Highway and Transportation Officials’ (AASHTO) Standard Specifications for Highway Bridges (1977) and the Interim Specifications from 1978 through 1983 (1983). The bridge was constructed in accordance with the Virginia Department of Highways & Transportation’s Road and Bridge Specifications (1982). Grade 60 deformed reinforcing bars were used to reinforce the structure. Class A4 (f’c = 4 ksi) concrete was used in constructing the superstructure.
2
Figure 1. Route 701 Bridge Over the Little River
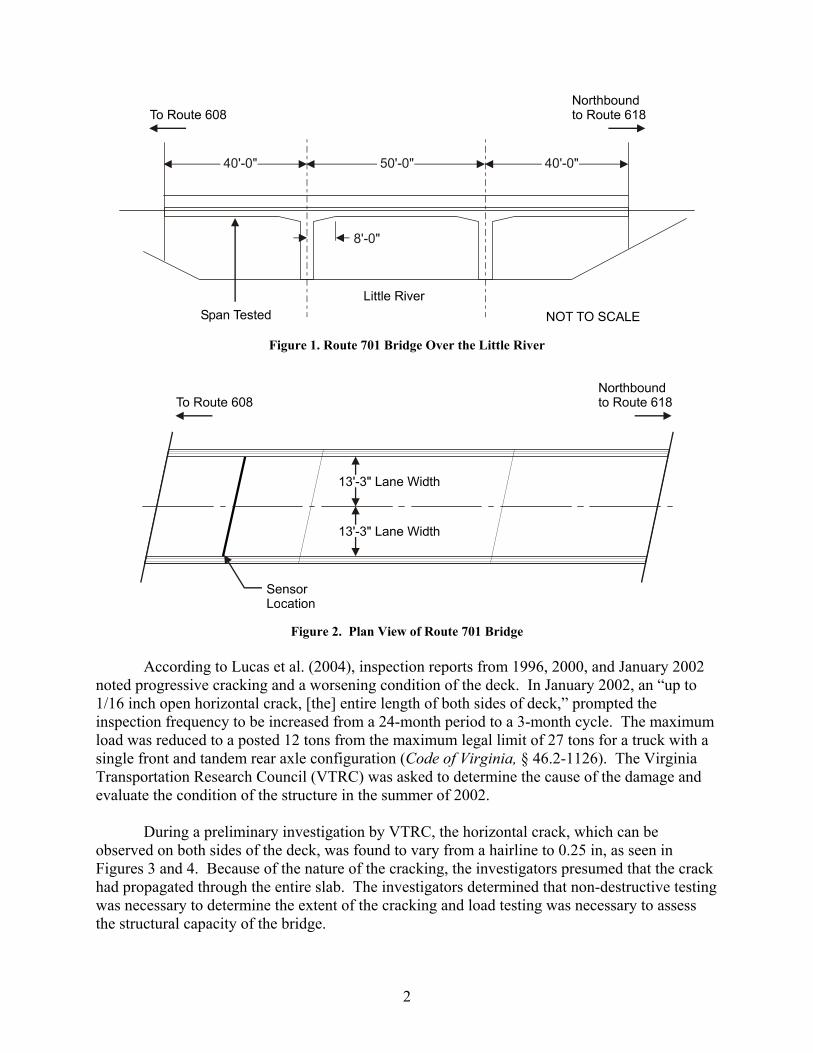
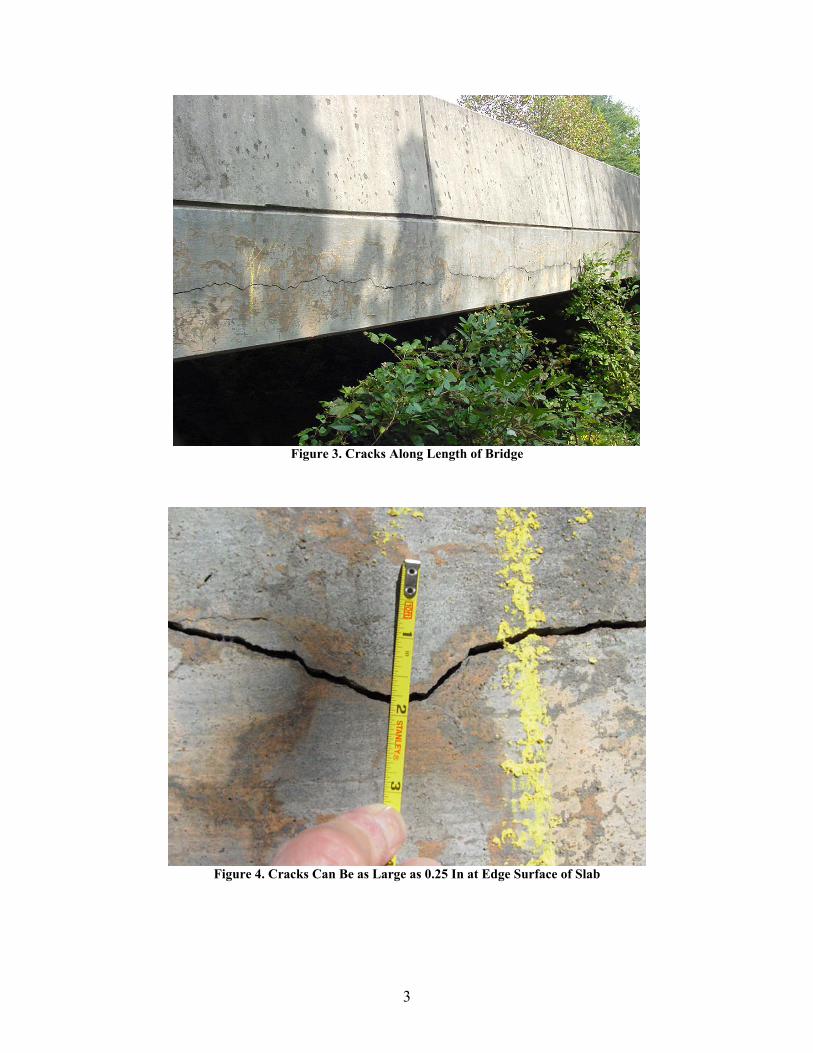
Figure 2. Plan View of Route 701 Bridge According to Lucas et al. (2004), inspection reports from 1996, 2000, and January 2002 noted progressive cracking and a worsening condition of the deck. In January 2002, an “up to 1/16 inch open horizontal crack, [the] entire length of both sides of deck,” prompted the inspection frequency to be increased from a 24-month period to a 3-month cycle. The maximum load was reduced to a posted 12 tons from the maximum legal limit of 27 tons for a truck with a single front and tandem rear axle configuration (Code of Virginia, § 46.2-1126). The Virginia Transportation Research Council (VTRC) was asked to determine the cause of the damage and evaluate the condition of the structure in the summer of 2002. During a preliminary investigation by VTRC, the horizontal crack, which can be observed on both sides of the deck, was found to vary from a hairline to 0.25 in, as seen in Figures 3 and 4. Because of the nature of the cracking, the investigators presumed that the crack had propagated through the entire slab. The investigators determined that non-destructive testing was necessary to determine the extent of the cracking and load testing was necessary to assess the structural capacity of the bridge.
3
Figure 3. Cracks Along Length of Bridge
Figure 4. Cracks Can Be as Large as 0.25 In at Edge Surface of Slab

4
PURPOSE AND SCOPE This project was designed to determine the structural characteristics of the Route 701 Bridge, including its capability to support the legal load limit of 27 tons, and whether the damage attributable to crack growth had progressed. Two load tests had been performed before this study, one in November 2003 and the other in October 2004. The results of the November 2003 test were previously reported (Lucas et al. 2004). During the November 2003 test, load testing was used to determine if the current load rating of the bridge could be raised. In this study, using normalized deflection data, the researchers compared the data collected in November 2003 to data collected during similar load tests in October 2004 to determine if there was progressive loss of structural capacity over time. Specifically, there were two objectives:
1. Evaluate the existing stiffness and conditions through field testing to determine if the current posting can be raised.
2. Evaluate and compare data from load tests at different times to determine if there is progressive damage due to the crack growth.
Through field testing, deflections of the bridge under different truck loads were recorded. During testing, the truck was empty, partially loaded, or fully loaded. Normalized deflections were used to determine if there was a linear relationship between the load and displacement. If such a linear relationship was repeatable (i.e., consistent values were obtained), it would show that the stress in the reinforcing steel was less than the yield stress of the steel. This linear and repeatable relationship would indicate that the bridge was exhibiting both linear and elastic behavior. This would indicate that the bridge, even though it was cracked, was performing safely and desirably under the tested loads. To support further that the bridge was exhibiting linearly elastic behavior, the maximum theoretical stress in the reinforcing steel was calculated using the load and dimensions of the heaviest truck. The normalized data from the two tests, November 2003 and October 2004, were compared to determine if there was progressive damage to the structural stiffness of the bridge over the year of service.
PREVIOUS WORK
Material Testing
Previous work performed by VTRC included obtaining concrete cores for petrographic examination and determining splitting tensile strength and electrical resistance. VTRC also performed impact echo testing to determine the depth of the cracking. According to Lucas et al. (2004), the visible continuous cracks along the length of the bridge along with the impact echo testing suggest that a planar crack had likely propagated through the entire slab of the bridge. Through optical evaluation of deposits lining cracks and voids, it was determined that the cracking and damage was consistent with damage related to

5
alkali-silica reactivity (ASR). It was also concluded that because of the type of ASR product found that the rapid growth phase of ASR was probably completed.
Live Load Bridge Test During November 2003, a live load test of the Route 701 Bridge was performed. One truck (loaded to three different weights) was used to perform static and dynamic tests on the bridge, and the truck was oriented in three test lanes. Vertical displacement sensors, or deflectometers, attached to the underside of the bridge slab were used to measure deflections during truck passes. Details of the first load test of the bridge and resulting conclusions and recommendations are provided elsewhere (Lucas et al., 2004).
CURRENT BRIDGE DESIGN CODE AND SPECIFICATIONS
The bridge design code used was AASHTO’s Standard Specifications for Highway Bridges (AASHTO 2002). The slab bridge is treated as a one-way slab with an effective width per wheel-line, as seen in Figure 5.
The effective width can be found using the following equation from AASHTO (2002):
ftSE 7)06.04( ≤+= [Eq. 1]
where
E = effective wheel load distribution width on slab (ft) S = length of span (ft).
Figure 5. Effective Width of Wheel Line

6
According to the code, an effective moment of inertia, found using the following equations from AASHTO (2002), can be used to determine deflections.
gcra
crg
a
cre II
MM
IMM
I ≤
−+
=
33
1 [Eq. 2]
t
grcr y
IfM = [Eq. 3]
where Ie = effective moment of inertia (in4) Mcr = cracking moment Ma = maximum applied moment Ig = gross moment of inertia (in4) Icr = cracked moment of inertia (in4) fr = modulus of rupture of concrete (psi)
yt = distance from centroidal axis of the gross section, neglecting reinforcement, to the extreme fiber in tension (in)
The deflection of the concrete can then be found using elastic beam theory.
TEST PROCEDURE Generally, the two field tests (November 2003 and October 2004) were planned to be identical. However, minor differences occurred and are noted here.
Deflection Sensors
Deflection sensors fabricated by Virginia Polytechnic Institute & State University (Virginia Tech) in 1997 were used to measure deflection of the bridge (Figure 6). For the November 2003 test, the sensors were calibrated to the nearest 0.003 in in conjunction with the Optim Electronics MEGADAC data acquisition system and Test Control Software (TCS). The sensors were calibrated to the nearest 0.002 in in conjunction with Campbell Scientific, Inc.’s CR9000 Data Acquisition System and PC9000 Software Program for the October 2004 test.
Seven deflection sensors, corresponding to test lanes, were placed at midspan on the
underside of the span nearest Route 608 (Figure 1). Since through visual inspection the crack was consistent along the entire length of the bridge, this span was used to test the slab because there was easy access to the underside of the slab (i.e., there was no water flow under it). The

7
Figure 6. Deflection Sensors
deflectometers were bolted to concrete anchors installed on the underside of the slab through the sensor’s base plate at the locations shown in Figure 7. The sensors were pre-deflected approximately 0.75 in to allow the sensors to relax as the slab displaced downward. The sensors were connected through seven separate channels to the data acquisition system to record the change in deflection as the tests were run. The acquisition system was configured for a sample rate of 400 samples per second per channel. A sample of the refined data is provided in Figure 8.
Figure 7. Deflection Sensor Locations (at Midspan of Test Span)

8
Figure 8. Refined Data Collected From Seven Deflectometers on Pass Along Upstream Shoulder (Lane 2)
Data Acquisition Systems For the 2003 tests, the MEGADAC by Optim Electronics was used. This system has been used by Virginia Tech and VTRC for many previous projects. The MEGADAC has capabilities of measuring differential and single-ended voltages; thermocouples; and quarter, half, and full bridges. Since its capabilities are well known to Virginia Tech and VTRC researchers, the system is not further discussed. The CR9000 Measurement and Control System was first used for bridge tests in November 2004. The CR9000 is a portable system that can run on internal or external battery power and AC power. The CR9000 consists of interchangeable modules that can be used to measure differential and single-ended voltages; thermocouples; pulses; frequencies; and quarter, half, and full bridges.
Test Orientation Three test lanes were used to orient the truck on the bridge. The placement of the test lanes and deflectometers were the same for the November 2003 and October 2004 tests so that the results could be compared. As seen in Figure 9, Test Lane 1 was on the downstream side of the bridge. The exterior wheel line of the truck was located 1 ft from the base of the parapet. This orientation coincides with the design lane for a slab beam (see AASHTO 2002). Three deflectometers, one under each wheel line and one corresponding to the center of the lane, were placed under this test lane. Test Lane 2, as seen in Figure 10, was located on the upstream side of the bridge with the truck’s exterior wheel located 1 ft from the base of the parapet. Test Lane 3 was located along the centerline of the bridge; with the wheel lines located 3 ft 6 in off either side of the centerline. As seen in Figure 11, three deflectometers were located under Test Lane 3 similarly to those for Test Lane 1.

9
Figure 9. Truck Test Lane 1 (Facing Northbound)
Figure 10. Truck Test Lane 2 (Facing Northbound)
Figure 11. Truck Test Lane 3 (Facing Northbound With Center of Truck Aligned to Center of Bridge)
10
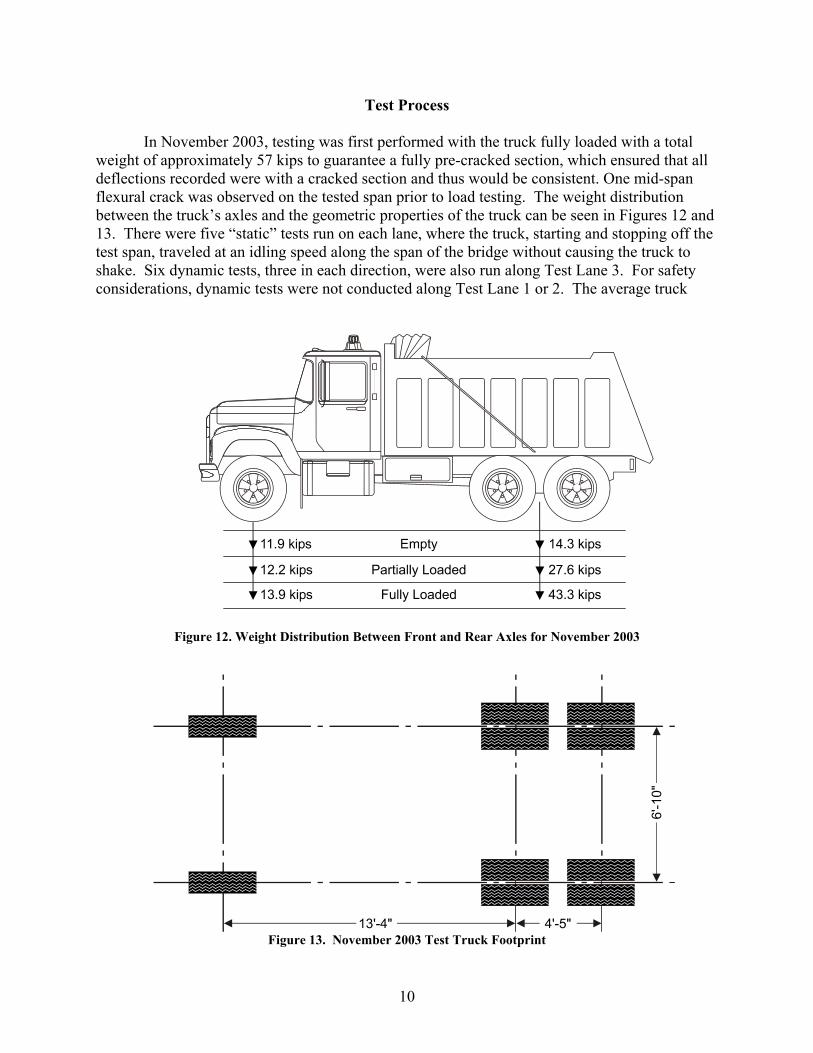
Test Process In November 2003, testing was first performed with the truck fully loaded with a total weight of approximately 57 kips to guarantee a fully pre-cracked section, which ensured that all deflections recorded were with a cracked section and thus would be consistent. One mid-span flexural crack was observed on the tested span prior to load testing. The weight distribution between the truck’s axles and the geometric properties of the truck can be seen in Figures 12 and 13. There were five “static” tests run on each lane, where the truck, starting and stopping off the test span, traveled at an idling speed along the span of the bridge without causing the truck to shake. Six dynamic tests, three in each direction, were also run along Test Lane 3. For safety considerations, dynamic tests were not conducted along Test Lane 1 or 2. The average truck
Figure 12. Weight Distribution Between Front and Rear Axles for November 2003
Figure 13. November 2003 Test Truck Footprint

11
speed for these tests was 50 mph. The same combinations of tests were then repeated with the truck weight of about 26.2 kip and then 39.7 kip. The same test configuration was run in October 2004, with a truck weighing 48.6 kip, 37.5 kip, and then 26.1 kip. The weight distributions and geometric properties of the 2004 test truck can be seen in Figures 14 and 15. A summary of the test configurations for both years can be seen in Table 1.
Figure 14. Weight Distribution Between Front and Rear Axles for October 2004
Figure 15. October 2004 Test Truck Footprint

12
Table 1. Tests Run for November 2003 and October 2004 Truck Weight Test Lane Speed Empty Half Loaded Fully Loaded
1 Static 53 5 5 2 Static 5 5 5 3 Static 5 5 5 3 50 mph1 3 SB2
3 NB 3 SB 3 NB
3 SB 3 NB
1Range for 2003 test was 45 to 50 mph and for 2004 was 47 to 51 mph. 2SB designates truck traveling southbound along bridge, and NB designates truck traveling northbound along bridge. 3Static tests were run with truck traveling northbound on bridge.
ANALYSIS AND RESULTS
Maximum Deflection and Normalization The procedure described herein was used on all static and dynamic tests for both testing years. Using Microsoft Excel, the data were visually inspected to determine if all sensors were reporting reasonable trends. A nine-point running average was then used to smooth the data and reduce electronic noise. Figure 16 shows a typical comparison of raw and smoothed data. Maximum deflections were determined for each sensor by finding the maximum point and averaging that with the surrounding points to account for electronic noise (Figure 17). During some runs, the sensors detected the “wobble” of the truck attributable to an uneven approach slab onto the span; in these cases, the average was found from the local maximum and minimum peak around that point (Figure 18). The maximums were graphed to find the deformed shape of the slab and to ensure that the deflections corresponded to the theoretical deformed shape a slab should approximately look like (Figure 19). Because of the end constraints imposed on a slab, a shallow “U” shape is expected when the slab is loaded in the center (Boresi and Schmidt, 2003).
Figure 16. Comparison of Raw and Smoothed Data (Positive Is Downward Deflection)

13
Figure 17. Determining Maximum Deflection (Downward Deflection Is Positive)
Figure 18. Determining Maximum Deflection When Truck “Wobbled” (Downward Deflection Is Positive)
Figure 19. Sample of Deformed Shape

14
For each set of load tests performed (i.e., every weight and lane combination), the average maximum deflection was determined at each sensor location. These averages were tabulated and normalized. Normalization was performed by dividing the displacement by the maximum calculated moment using the dimensions and weight of the truck. The Dr. Beam® software package was used to calculate the maximum moment of a wheel line. In this package, each wheel of a wheel line was modeled as a point load. Each point load was oriented at distances representing the spacing of the axles, specified in Figures 12 and 14, and the loads of each corresponded to half the axle weight. Deflections from November 2003 are provided in Tables 2 through 5. Data from October 2004 are provided in Tables 6 through 9. The coefficient of variation (COV) was also determined and shown representing the preciseness of the data collected. The smaller the percentage value for the COV, the more precise the data are. Considering the magnitude of the deflections measured, most COVs are very small. The larger values can be attributed to how small the deflections are (i.e., only 0.004 in variation is needed for a 15% COV) in comparison to the accuracy of the measurements (0.003 in).
Table 2. Average Static Displacements (in) and Coefficient of Variation (%) with Truck
Oriented Over Test Lane 1 (November 2003) Sensor Numbers
Truck Load 1 2 3 4 5 6 7 Full 0.035
(1.1) 0.030 (0.9)
0.034 (1.0)
0.030 (1.2)
0.026 (2.3)
0.021 (1.3)
0.011 (3.2)
Half 0.021 (1.2)
0.018 (2.1)
0.020 (3.0)
0.018 (1.8)
0.015 (3.6)
0.013 (4.5)
0.006 (7.3)
Empty 0.013 (1.4)
0.011 (1.4)
0.013 (2.6)
0.012 (2.6)
0.010 (2.6)
0.008 (2.1)
0.004 (11.0)
Table 3. Average Static Displacements (in) and Coefficient of Variation (%) with Truck
Oriented Over Test Lane 2 (November 2003) Sensor Numbers Truck Load 1 2 3 4 5 6 7
Full 0.010 (1.7)
0.011 (2.0)
0.018 (3.6)
0.019 (3.0)
0.023 (2.8)
0.027 (2.4)
0.036 (1.4)
Half 0.006 (8.8)
0.007 (6.8)
0.011 (5.2)
0.011 (3.3)
0.014 (4.1)
0.016 (1.7)
0.021 (4.4)
Empty 0.004 (6.7)
0.004 (4.9)
0.007 (4.6)
0.007 (3.9)
0.009 (2.2)
0.010 (2.7)
0.013 (2.6)
Table 4. Average Static Displacements (in) and Coefficient of Variation (%) with Truck
Oriented Over Test Lane 3 (November 2003) Sensor Numbers Truck Load 1 2 3 4 5 6 7
Full 0.020 (2.5)
0.021 (1.6)
0.029 (1.2)
0.029 (0.8)
0.031 (0.9)
0.029 (1.3)
0.021 (2.9)
Half 0.012 (1.6)
0.012 (3.5)
0.018 (1.6)
0.018 (1.5)
0.015 (1.1)
0.018 (1.6)
0.012 (4.4)
Empty 0.008 (3.3)
0.008 (4.4)
0.011 (2.1)
0.011 (1.9)
0.012 (2.1)
0.011 (1.9)
0.008 (2.7)

15
Table 5. Average Dynamic Displacement (in) and Coefficient of Variation (%) with Truck at 50 Mph Over Test Lane 3 (November 2003)
Sensor Numbers Truck Load Direction 1 2 3 4 5 6 7
NB 0.021 (3.2)
0.023 (3.0)
0.033 (3.0)
0.033 (2.3)
0.036 (1.2)
0.034 (0.7)
0.025 (3.0)
Full
SB 0.027 (2.6)
0.029 (2.4)
0.040 (1.7)
0.040 (1.5)
0.043 (1.4)
0.040 (1.2)
0.028 (1.2)
NB 0.011 (3.4)
0.012 (1.7)
0.016 (0.6)
0.016 (2.4)
0.017 (1.6)
0.017 (4.0)
0.012 (3.7)
Half
SB 0.014 (8.3)
0.015 (8.8)
0.020 (6.2)
0.020 (7.2)
0.021 (5.8)
0.021 (6.4)
0.014 (3.8)
NB 0.009 (2.9)
0.009 (1.2)
0.013 (2.3)
0.013 (0.8)
0.013 (4.4)
0.013 (4.7)
0.010 (1.7)
Empty
SB 0.009 (5.8)
0.010 (3.6)
0.013 (2.1)
0.013 (2.1)
0.014 (2.7)
0.013 (2.7)
0.009 (2.1)
Table 6. Average Static Displacements (in) and Coefficient of Variation (%) with Truck
Oriented Over Test Lane 1 (October 2004) Sensor Numbers
Truck Load 1 2 3 4 5 6 7 Full 0.026
(1.6) 0.031 (1.0)
0.027 (1.9)
0.026 (1.4)
0.021 (2.4)
0.018 (0.8)
0.007 (2.5)
Half 0.019 (0.8)
0.022 (0.7)
0.019 (0.8)
0.018 (1.2)
0.015 (1.3)
0.012 (2.1)
0.005 (4.5)
Empty 0.012 (2.8)
0.014 (2.9)
0.012 (2.2)
0.011 (1.9)
0.010 (2.4)
0.008 (3.3)
0.003 (5.4)
Table 7. Average Static Displacement (in) and Coefficient Of Variation (%) with Truck
Oriented Over Test Lane 2 (October 2004) Sensor Numbers
Truck Load 1 2 3 4 5 6 7 Full 0.007
(4.9) 0.012 (4.5)
0.013 (17.3)
0.015 (9.4)
0.019 (10.7)
0.025 (2.2)
0.026 (6.6)
Half 0.005 (1.3)
0.008 (2.3)
0.010 (1.9)
0.011 (2.7)
0.013 (2.0)
0.016 (0.8)
0.017 (0.9)
Empty 0.003 (13..5)
0.005 (9.7)
0.006 (3.4)
0.007 (4.3)
0.008 (3.3)
0.010 (2.6)
0.011 (2.0)
Table 8. Average Static Displacement (in) and Coefficient of Variation (%) with Truck
Oriented Over Test Lane 3 (October 2004) Sensor Numbers
Truck Load 1 2 3 4 5 6 7 Full 0.015
(1.4) 0.022 (1.7)
0.024 (0.8)
0.025 (0.8)
0.026 (0.9)
0.025 (1.9)
0.014 (1.3)
Half 0.011 (4.0)
0.015 (2.8)
0.017 (1.6)
0.017 (1.0)
0.018 (0.2)
0.017 (0.5)
0.010 (1.9)
Empty 0.007 (2.9)
0.010 (1.4)
0.011 (1.4)
0.011 (0.6)
0.012 (1.0)
0.011 (0.8)
0.006 (1.3)

16
Table 9. Average Dynamic Displacement (in) and Coefficient of Variation (%) with Truck at 50 mph Over Test Lane 3 (October 2004)
Sensor Numbers Truck Load Direction 1 2 3 4 5 6 7
N.B. 0.016 (5.3)
0.023 (2.5)
0.025 (4.2)
0.026 (3.0)
0.028 (3.6)
0.027 (2.7)
0.015 (3.1)
Full
S.B. 0.019 (5.1)
0.028 (5.0)
0.032 (5.2)
0.033 (3.9)
0.033 (6.7)
0.033 (7.1)
0.019 (6.9)
N.B. 0.012 (23.6)
0.017 (20.6)
0.018 (17.7)
0.018 (17.3)
0.019 (13.2)
0.019 (9.5)
0.010 (8.9)
Half
S.B. 0.013 (7.6)
0.018 (8.1)
0.020 (8.3)
0.021 (8.7)
0.022 (8.2)
0.022 (8.1)
0.012 (9.1)
N.B. 0.007 (6.0)
0.010 (9.0)
0.011 (4.8)
0.011 (2.7)
0.012 (1.8)
0.012 (3.0)
0.006 (6.7)
Empty
S.B. 0.008 (5.3)
0.012 (4.6)
0.013 (3.8)
0.013 (2.1)
0.014 (1.6)
0.013 (4.6)
0.008 (4.7)
Dynamic Load Allowance Dynamic load allowance was calculated using the average maximum dynamic and static displacements for the middle lane under each load case for each year, as seen in Tables 10 through 15. The maximum and minimum dynamic load allowance factors were also found using the extreme dynamic displacements. Equation 4 was used in determining the factors.
1,
−∆
∆=
abgstat
dynDLA [Eq. 4]
where DLA = dynamic load allowance factor ∆dyn = dynamic displacement (truck going 50 mph) ∆stat,avg = average static displacement under same load condition.
Table 10. Dynamic Load Allowance for 57 kip Load (2003 Test) Sensor Numbers
Parameter 1 2 3 4 5 6 7 Average 0.22 0.25 0.25 0.26 0.28 0.29 0.27 Minimum 0.04 0.07 0.09 0.10 0.16 0.18 0.19 Maximum 0.40 0.41 0.40 0.40 0.42 0.41 0.35
Table 11. Dynamic Load Allowance for 39.7 kip Load (2003 Test)
Sensor Numbers Parameter 1 2 3 4 5 6 7
Average 0.03 0.06 0.04 0.04 0.06 0.06 0.07 Minimum -0.09 -0.06 -0.08 -0.10 -0.07 -0.10 -0.06 Maximum 0.244 0.286 0.233 0.243 0.233 0.258 0.208

17
Table 12. Dynamic Load Allowance For 26.2 kip Load (2003 Test) Sensor Numbers
Parameter 1 2 3 4 5 6 7 Average 0.20 0.17 0.18 0.15 0.18 0.17 0.18 Minimum 0.11 0.10 0.13 0.12 0.13 0.12 0.06 Maximum 0.34 0.29 0.25 0.21 0.22 0.23 0.25
Table 13. Dynamic Load Allowance for 48.7 kip Load (2004 Test)
Sensor Numbers Parameter 1 2 3 4 5 6 7
Average 0.15 0.14 0.20 0.19 0.18 0.20 0.18 Minimum 0.02 0.02 0.00 0.04 0.04 0.06 0.01 Maximum 0.29 0.30 0.44 0.39 0.34 0.39 0.39
Table 14. Dynamic Load Allowance for 37.5 kip Load (2004 Test)
Sensor Numbers Parameter 1 2 3 4 5 6 7
Average 0.16 0.13 0.13 0.12 0.15 0.17 0.16 Minimum -0.15 -0.14 -0.14 -0.15 -0.09 -0.04 -0.06 Maximum 0.38 0.30 0.26 0.27 0.30 0.34 0.36
Table 15. Dynamic Load Allowance for 26.2 kip Load (2004 Test)
Sensor Numbers Parameter 1 2 3 4 5 6 7
Average 0.13 0.14 0.12 0.09 0.1 0.09 0.12 Minimum 0.00 0.00 -0.01 0.00 0.01 -0.03 -0.05 Maximum 0.28 0.27 0.24 0.19 0.20 0.22 0.29
Deflection Calculations According to AASHTO Some assumptions and simplifications were made to calculate the expected deflections. The slab was treated as a prismatic member with a constant, average depth of 22.5 in. There are different amounts of reinforcing steel at the edge of the slab and at the center. As seen in Figures 20 and 21, there is about the same area of steel in the top of the slab for both the edge (8 in2) and middle (7.8 in2) of the slab at midspan. There is a larger difference between the amounts of steel for the bottom reinforcement in the edge (15.2 in2) and middle (12.7 in2) of the slab. When the cracked moment of inertia was determined, it was assumed that the difference in the amount of reinforcing steel between the side and middle lanes was negligible in comparison to other assumptions when the deflection calculations were made; thus, the edge lane reinforcing steel layout was used for both loading conditions.

18
Figure 20. Reinforcement of an Effective Wheel Width at Edge of Slab
Figure 21. Reinforcement of an Effective Wheel Width at Center of Slab
Deflections were calculated in accordance with AASHTO (2002) design specifications. The effective moment of inertia was found using Equation 2. The dimensions and weights of the 2003 test truck were used to calculate the moment. The maximum moment was found using continuous beam theory with three moving point loads to simulate the wheel line of a truck. The effective wheel width was found using Equation 1. The maximum expected deflections for each load case were then found using Dr. Beam® and CONSYS v.1.3.0 by Leap Software, Inc. The maximum deflections were calculated to be 0.28, 0.15, and 0.07 in for the 57.0, 39.7, and 26.2 kip loads, respectively.
Stress in Reinforcement The stress in the reinforcing steel was calculated using Equation 5. These values were compared to the design yield stress of Grade 60 reinforcing steel.
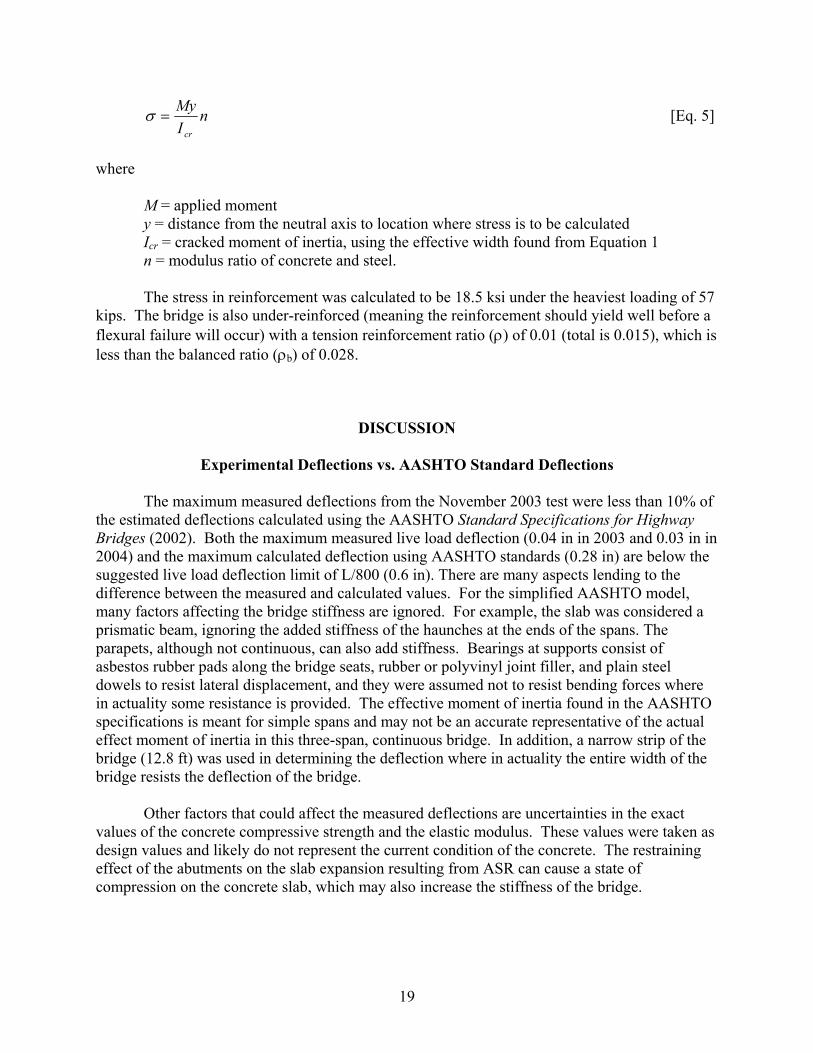
19
nIMy
cr
=σ [Eq. 5]
where M = applied moment y = distance from the neutral axis to location where stress is to be calculated Icr = cracked moment of inertia, using the effective width found from Equation 1 n = modulus ratio of concrete and steel.
The stress in reinforcement was calculated to be 18.5 ksi under the heaviest loading of 57 kips. The bridge is also under-reinforced (meaning the reinforcement should yield well before a flexural failure will occur) with a tension reinforcement ratio (ρ) of 0.01 (total is 0.015), which is less than the balanced ratio (ρb) of 0.028.
DISCUSSION
Experimental Deflections vs. AASHTO Standard Deflections The maximum measured deflections from the November 2003 test were less than 10% of the estimated deflections calculated using the AASHTO Standard Specifications for Highway Bridges (2002). Both the maximum measured live load deflection (0.04 in in 2003 and 0.03 in in 2004) and the maximum calculated deflection using AASHTO standards (0.28 in) are below the suggested live load deflection limit of L/800 (0.6 in). There are many aspects lending to the difference between the measured and calculated values. For the simplified AASHTO model, many factors affecting the bridge stiffness are ignored. For example, the slab was considered a prismatic beam, ignoring the added stiffness of the haunches at the ends of the spans. The parapets, although not continuous, can also add stiffness. Bearings at supports consist of asbestos rubber pads along the bridge seats, rubber or polyvinyl joint filler, and plain steel dowels to resist lateral displacement, and they were assumed not to resist bending forces where in actuality some resistance is provided. The effective moment of inertia found in the AASHTO specifications is meant for simple spans and may not be an accurate representative of the actual effect moment of inertia in this three-span, continuous bridge. In addition, a narrow strip of the bridge (12.8 ft) was used in determining the deflection where in actuality the entire width of the bridge resists the deflection of the bridge. Other factors that could affect the measured deflections are uncertainties in the exact values of the concrete compressive strength and the elastic modulus. These values were taken as design values and likely do not represent the current condition of the concrete. The restraining effect of the abutments on the slab expansion resulting from ASR can cause a state of compression on the concrete slab, which may also increase the stiffness of the bridge.
20
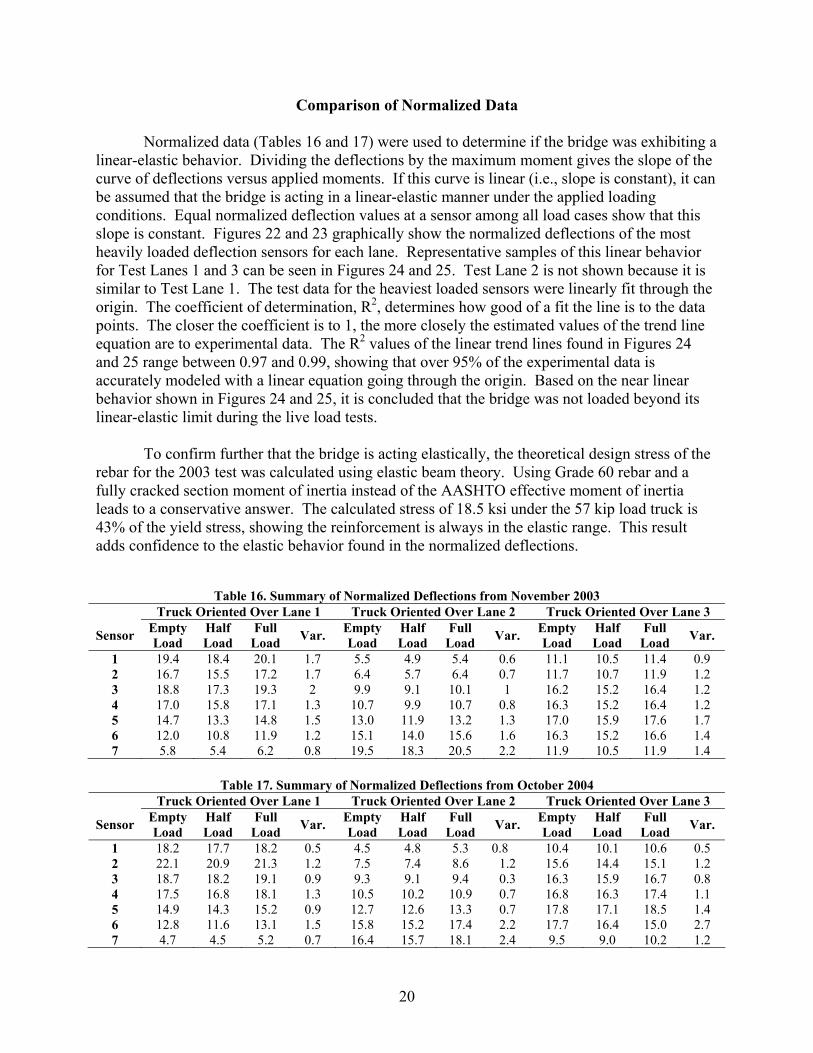
Comparison of Normalized Data Normalized data (Tables 16 and 17) were used to determine if the bridge was exhibiting a linear-elastic behavior. Dividing the deflections by the maximum moment gives the slope of the curve of deflections versus applied moments. If this curve is linear (i.e., slope is constant), it can be assumed that the bridge is acting in a linear-elastic manner under the applied loading conditions. Equal normalized deflection values at a sensor among all load cases show that this slope is constant. Figures 22 and 23 graphically show the normalized deflections of the most heavily loaded deflection sensors for each lane. Representative samples of this linear behavior for Test Lanes 1 and 3 can be seen in Figures 24 and 25. Test Lane 2 is not shown because it is similar to Test Lane 1. The test data for the heaviest loaded sensors were linearly fit through the origin. The coefficient of determination, R2, determines how good of a fit the line is to the data points. The closer the coefficient is to 1, the more closely the estimated values of the trend line equation are to experimental data. The R2 values of the linear trend lines found in Figures 24 and 25 range between 0.97 and 0.99, showing that over 95% of the experimental data is accurately modeled with a linear equation going through the origin. Based on the near linear behavior shown in Figures 24 and 25, it is concluded that the bridge was not loaded beyond its linear-elastic limit during the live load tests.
To confirm further that the bridge is acting elastically, the theoretical design stress of the rebar for the 2003 test was calculated using elastic beam theory. Using Grade 60 rebar and a fully cracked section moment of inertia instead of the AASHTO effective moment of inertia leads to a conservative answer. The calculated stress of 18.5 ksi under the 57 kip load truck is 43% of the yield stress, showing the reinforcement is always in the elastic range. This result adds confidence to the elastic behavior found in the normalized deflections.
Table 16. Summary of Normalized Deflections from November 2003
Truck Oriented Over Lane 1 Truck Oriented Over Lane 2 Truck Oriented Over Lane 3
Sensor Empty Load
Half Load
Full Load Var. Empty
Load Half Load
Full Load Var. Empty
Load Half Load
Full Load Var.
1 19.4 18.4 20.1 1.7 5.5 4.9 5.4 0.6 11.1 10.5 11.4 0.9 2 16.7 15.5 17.2 1.7 6.4 5.7 6.4 0.7 11.7 10.7 11.9 1.2 3 18.8 17.3 19.3 2 9.9 9.1 10.1 1 16.2 15.2 16.4 1.2 4 17.0 15.8 17.1 1.3 10.7 9.9 10.7 0.8 16.3 15.2 16.4 1.2 5 14.7 13.3 14.8 1.5 13.0 11.9 13.2 1.3 17.0 15.9 17.6 1.7 6 12.0 10.8 11.9 1.2 15.1 14.0 15.6 1.6 16.3 15.2 16.6 1.4 7 5.8 5.4 6.2 0.8 19.5 18.3 20.5 2.2 11.9 10.5 11.9 1.4
Table 17. Summary of Normalized Deflections from October 2004
Truck Oriented Over Lane 1 Truck Oriented Over Lane 2 Truck Oriented Over Lane 3
Sensor Empty Load
Half Load
Full Load Var. Empty
Load Half Load
Full Load Var. Empty
Load Half Load
Full Load Var.
1 18.2 17.7 18.2 0.5 4.5 4.8 5.3 0.8 10.4 10.1 10.6 0.5 2 22.1 20.9 21.3 1.2 7.5 7.4 8.6 1.2 15.6 14.4 15.1 1.2 3 18.7 18.2 19.1 0.9 9.3 9.1 9.4 0.3 16.3 15.9 16.7 0.8 4 17.5 16.8 18.1 1.3 10.5 10.2 10.9 0.7 16.8 16.3 17.4 1.1 5 14.9 14.3 15.2 0.9 12.7 12.6 13.3 0.7 17.8 17.1 18.5 1.4 6 12.8 11.6 13.1 1.5 15.8 15.2 17.4 2.2 17.7 16.4 15.0 2.7 7 4.7 4.5 5.2 0.7 16.4 15.7 18.1 2.4 9.5 9.0 10.2 1.2

21
Figure 22. Normalized Deflections (10-5 in/kip-ft) of Heaviest Loaded Sensor for Each Test Lane (2003 Test)
Figure 23. Normalized Deflections (10-5 in/kip-ft) of Heaviest Loaded Sensor for Each Test Lane (2004 Test)

22
Figure 24. Load vs. Deflection for November 2003 Test Data
Figure 25. Load vs. Deflection for October 2004 Test Data
By comparing the 2003 test data to the normalized deflections of the 2004 test (Table 18), it can be suggested that there is no decrease in structural integrity in terms of stiffness. Figure 26 graphically shows this trend. This can be stated because there is minimal variation in the normalized deflections between the two tests. What variation there is can be attributed to electronic noise in the system and the fact that the values recorded are quite small. The larger variations in Deflectometers 2 and 7 are assumed to be sensor errors in the 2003 testing. Figure 27 shows how Sensors 2 and 7 reported lower values than what would theoretically be expected. Since the deflected shape is with the truck going down the center test lane, Sensor 7 should read about the same as Sensor 1. In addition, the large variation in Sensor 2 is attributed to slight calibration and sensor errors in the earlier tests because the deflected shape should be more of a smooth curve like that of November 2004. These sensor errors can be attributed to more electronic noise resulting from the different data acquisition system used in the earlier tests.

23
Table 18. Summary of Averaged Normalized Deflections (10-5 in/kip-ft) with % Difference Sensor Number Test
Lane Test Date 1 2 3 4 5 6 7 1 Oct. 2004 18.0 21.4 18.7 17.5 14.8 12.5 4.8 1 Nov. 2003 19.3 16.4 18.5 16.6 14.2 11.6 5.8 1 Variation (%) -6.5 30.3 1.1 5.1 3.8 8.2 -16.4 2 Oct. 2004 4.8 7.8 9.3 10.5 12.9 16.1 16.7 2 Nov. 2003 5.2 6.2 9.7 10.4 12.7 14.9 19.4 2 Variation (%) -8.1 27.2 -4.4 1.0 1.3 8.1 -13.8 3 Oct. 2004 10.3 15.0 16.3 16.8 17.8 17.4 9.6 3 Nov. 2003 11.0 11.4 16.0 16.0 16.9 16.0 11.4 3 Variation (%) -5.9 31.4 1.9 5.5 5.5 8.1 -16. 1
Figure 26. Comparison of Normalized Deflections (10-5 in/kip-ft) Between the Two Years
Figure 27. Comparison of Deflected Shapes (Deflection Down Is Positive)

24
Dynamic Load Allowances There is much debate and conflict between AASHTO specifications and research documents on what a design impact factor should be. However, the maximum impact factor is commonly considered to be approximately 0.3 (Taly, 1998). The average calculated dynamic load allowance of 0.25 and 0.20 with the 57 kip test truck of 2003 and the 49 kip test truck of 2004, respectively, corresponds well with the accepted values. Figures 28 and 29 show the dynamic load allowance for each run.
Figure 28. Dynamic Load Allowances for November 2003
Figure 29. Dynamic Load Allowances for October 2004

25
The variation between the two tests can be attributed to the type of truck, weight of truck, and changes in the approach over the past year. The maximum measured values were about 0.4 for both tests, which is slightly above expected limits. This high maximum value may be attributed to the accuracy of the measurements in comparison to the magnitude of the deflections. Moving either the dynamic or the static value by a few thousandths of an inch (i.e., within the tolerance and precision of the data acquisition setup) will largely vary the impact factor. The large difference between the minimum and maximum dynamic load factors can be attributed to the different approaches the truck took to the slab. Tests that were run northbound had the truck going over an uneven approach, which may have caused lift on the truck while over the test span, whereas the tests running southbound were smoother because the truck approached the test span by traveling over the other two spans first, making the truck more likely in full contact with the deck by the time it reached the test slab.
CONCLUSIONS It is important to note that these tests considered only aspects of bridge stiffness and not specific properties or the integrity of any specific material; thus, the conclusions are based solely on the structural behavior of the bridge.
• The bridge is behaving elastically under the test loads, and the stresses in the reinforcement have not reached yield. The tests performed on the bridge used a maximum truck load of 28.4 tons for the November 2003 test, which is approximately 120% of the legal load limit for a three-axle truck.
• Since the bridge is under-reinforced, the linear-elastic behavior exhibited during
these tests suggests that the bridge is able to sustain loads up to the legal maximum load of 27 tons.
• The bridges stiffness is not deteriorating at a measurable rate because of crack
growth. The structure appears to be stable under its current condition. This suggests that the conclusion by Lucas et al. (2004) that the ASR is past the major expansive phase and that the growth of the crack has slowed down is valid.
• The average dynamic load allowance is relatively close to the accepted value of 0.3.
The maximum values of 0.4 are noticeably high. Considering the accuracy of the data acquisition system and electronic noise in comparison to the magnitude of the experimental deflections, these elevated values may not be an indicator of higher than expected dynamic response because a change of a few thousandths of an inch in either the dynamic or static deflections would result in a dynamic load allowance value of 0.3 or less.
• The structure does not need to be reevaluated with more structural load testing. The
structural stiffness of this bridge appears to be stable under its current condition. However, the significant cracking of the slab compromises its structural integrity and

26
durability. Monitoring the extent of cracking in the slab and the width along the horizontal crack on both sides of the slab will help determine progress of any damage.
• The posted load limit of 12 tons can be safely increased to the maximum legal limit of
27 tons. The structural load tests that were performed tested to weights higher than that of the maximum legal limit and the bridge was still observed to be behaving in the linear elastic range.
RECOMMENDATIONS
1. The VDOT Culpeper District Structure and Bridge Engineer should consider removing the posting that restricts the loading of the Route 701 Bridge to 12 tons and increasing the loading to the maximum legal limit of 27 tons.
2. The VDOT Culpeper District Structure and Bridge Engineer should continue to monitor the
extent of cracking in the slab and the width along the horizontal crack on both sides of the slab to determine the progress of any further damage.
BENEFITS AND COSTS ASSESSMENT
Removing the posting that restricts loading of the Route 701 Bridge will not incur any significant cost. The benefit of removing the posting will be to allow trucks over 12 tons, but not exceeding the legal limit, to cross the structure. Currently, the estimated detour for a vehicle unable to use this structure is approximately 5 miles. The resulting additional user cost would be approximately $5.27 per two-person vehicle for those forced to use the detour. The road served by this structure had an annual average daily traffic of 660 vehicles in 2001. No information is available on the percentage of trucks using this segment, although adjacent road segments had combined bus/truck traffic of less than 4%. Therefore, estimated user cost savings are not considered significant. However, the findings also show that deterioration is not progressing as quickly as initially feared. Thus, the superstructure will not need to be slated for replacement on an accelerated schedule. This allows VDOT to defer superstructure replacement, at an estimated cost of $350,000, thus freeing funds to address more pressing needs.
REFERENCES
American Association of State Highway & Transportation Officials. Interim Specifications for
Standard Specifications of Highway Bridges. Washington, DC, 1983. American Association of State Highway & Transportation Officials. Standard Specifications for
Highway Bridges. Washington, DC, 1977. American Association of State Highway & Transportation Officials. Standard Specifications for
Highway Bridges, 17th Ed. Washington, DC, 2002.
27
Boresi, A.P., and Schmidt, R.J. Advanced Mechanics of Materials. John Wiley & Sons, New York, 2003.
Lucas, J.L., Cousins, T.E., Brown, M.C., Sharp, S.R. and Lane, D.S. Structural Load Testing
and Flexure Analysis of the Route 701 Bridge in Louisa County, Virginia. VTRC 04-R12. Virginia Transportation Research Council, Charlottesville, 2004.
Taly, N. Design of Modern Highway Bridges. McGraw-Hill, New York, 1998. Virginia Department of Highways & Transportation. Road and Bridge Specifications. Richmond,
1982. Virginia Department of Highways & Transportation. As-Built Plans, Bridge on Rte. 701 Over
Little River, Louisa County. Project 0701-054-119, B606. Culpeper, 1984.