Embed Size (px)
Citation preview
R. Pitt April 18, 2011
Standard Land Use Characteristics and Pollutant Sources
ContentsStandard Land Use Development Characteristics ......................................................................................... 2
Modeled Stormwater Characteristics Compared to Observed Data ............................................................ 6
Sources of Stormwater Flows and Pollutants ............................................................................................. 10
Appendix A. Land Use Site Descriptions ........................................................................................ 20
Commercial Area Site Descriptions ........................................................................................................ 20
Commercial Area Site Descriptions ......................................................................................................... 21
Commercial Area Site Descriptions ......................................................................................................... 22
Commercial Area Land Use Description Summary ................................................................................. 23
Industrial Area Site Descriptions ............................................................................................................. 24
Industrial Area Site Descriptions ............................................................................................................. 25
Industrial Area Site Descriptions ............................................................................................................. 26
Industrial Area Land Use Summary ......................................................................................................... 27
Institutional Area Site Descriptions ....................................................................................................... 28
Institutional Area Site Descriptions ........................................................................................................ 29
Institutional Area Site Descriptions ........................................................................................................ 30
Institutional Area Land Use Summary .................................................................................................... 31
Open Space Land Use Characteristics .................................................................................................... 32
Open Space Land Use Characteristics ..................................................................................................... 33
Open Space Land Use Characteristics ..................................................................................................... 34
Open Space Area Land Use Summary ..................................................................................................... 35
Residential Area Land Use Characteristics ............................................................................................ 36
Residential Area Land Use Characteristics .............................................................................................. 37
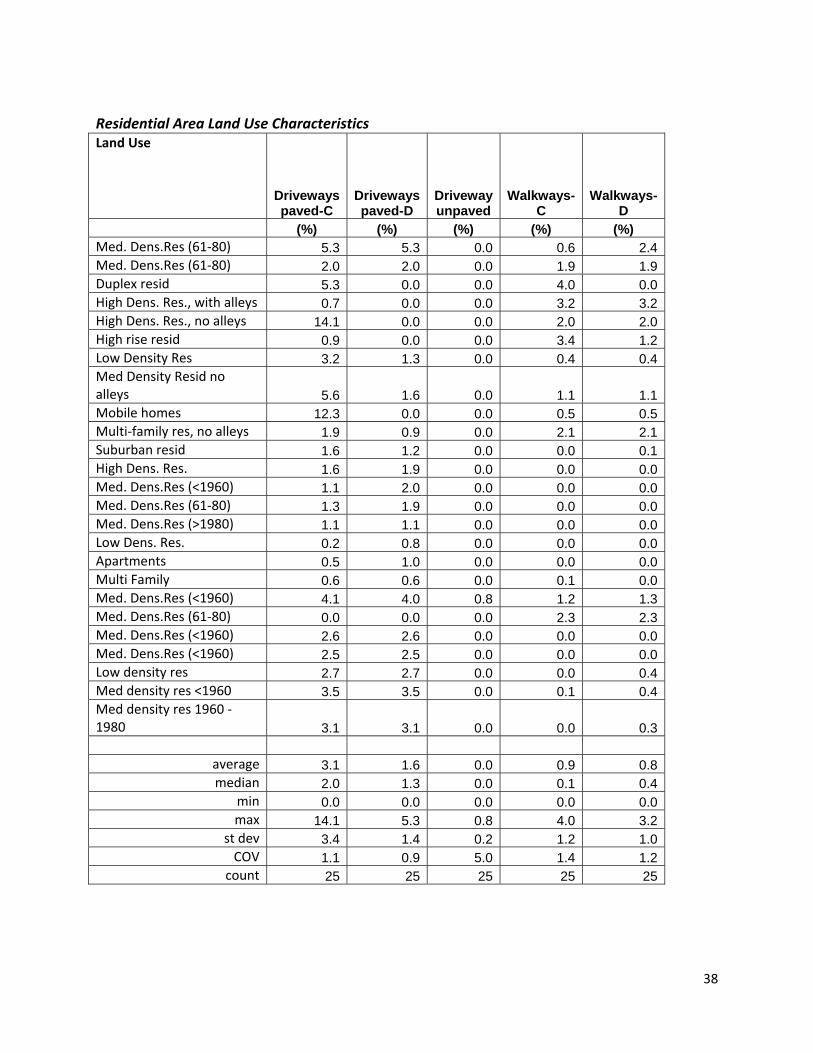
Residential Area Land Use Characteristics .............................................................................................. 38
Residential Area Land Use Characteristics .............................................................................................. 39
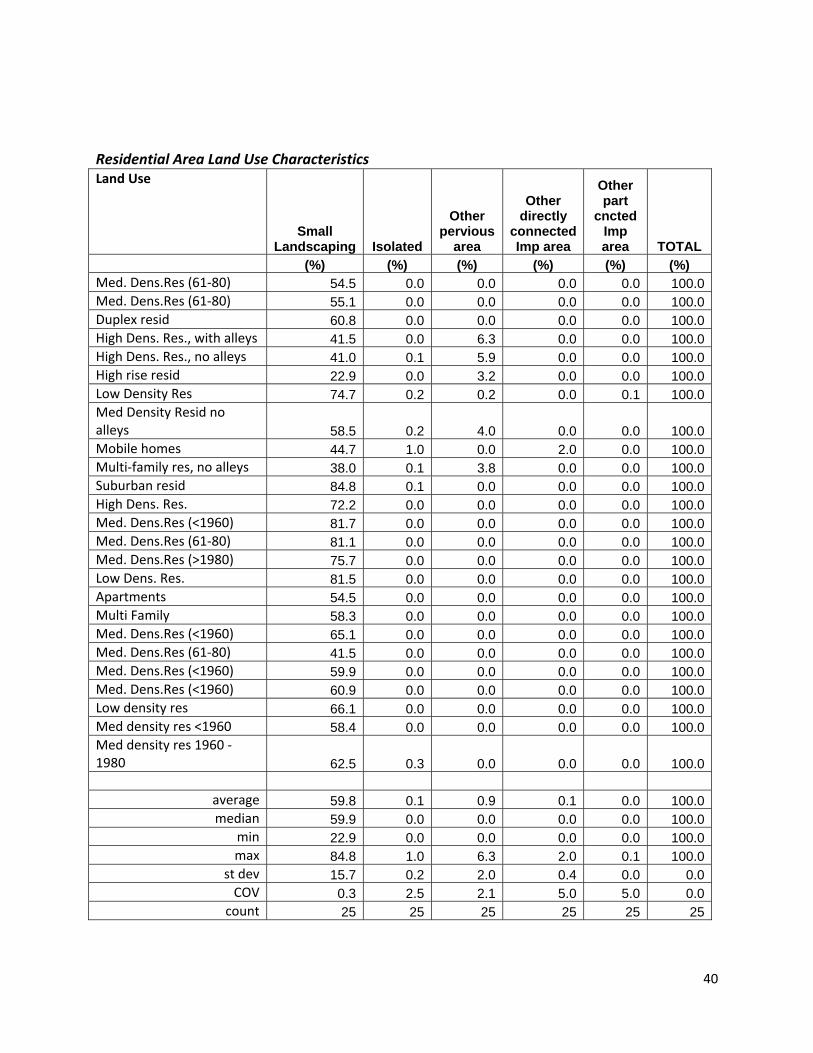
Residential Area Land Use Characteristics .............................................................................................. 40
Residential Area Land Use Characteristics Summary ............................................................................. 41
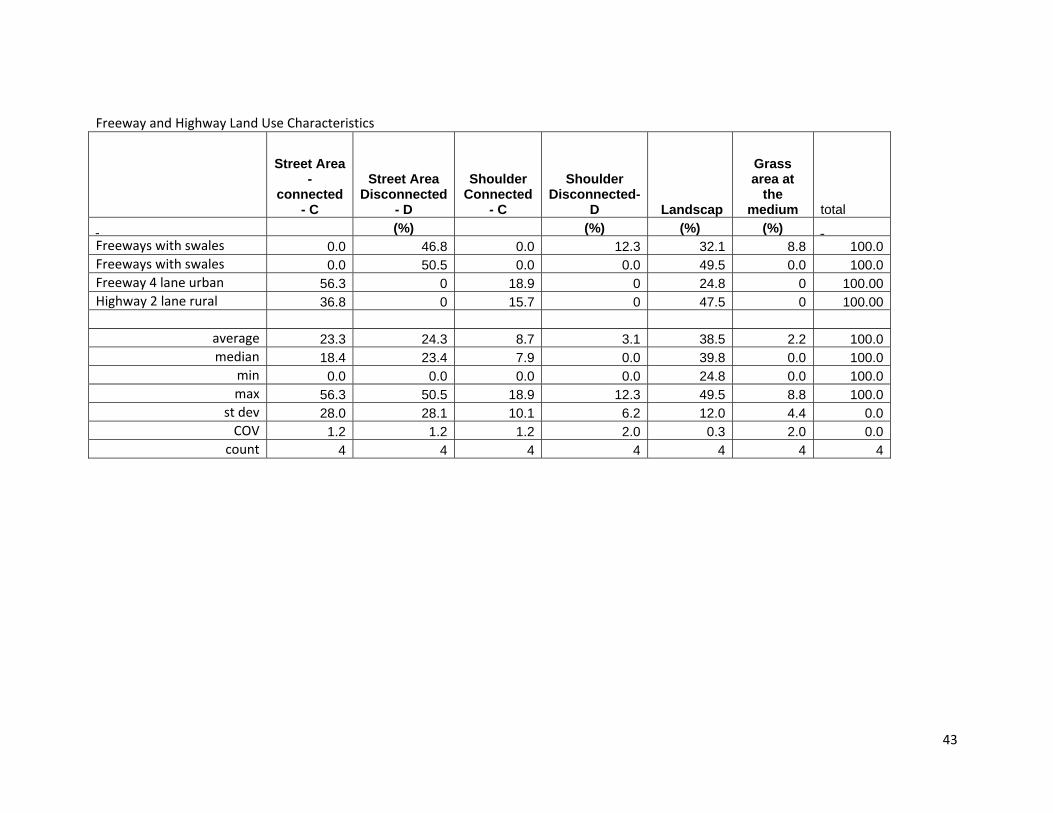
Freeway and Highway Land Use Characteristics .................................................................................. 42
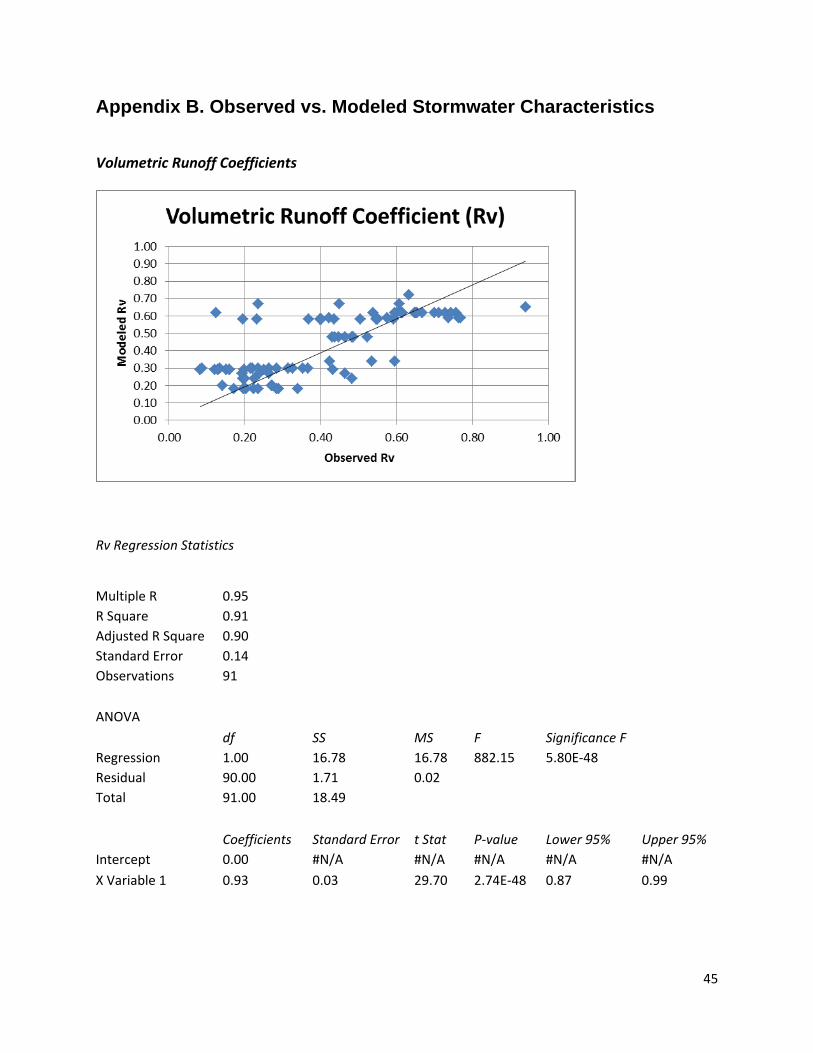
Appendix B. Observed vs. Modeled Stormwater Characteristics ............................................................... 45
Volumetric Runoff Coefficients ............................................................................................................... 45
Total Suspended Solids ........................................................................................................................... 46
Total Dissolved Solids .............................................................................................................................. 47
Chemical Oxygen Demand ...................................................................................................................... 48
Total Phosphorus .................................................................................................................................... 49
Filterable Phosphorus ............................................................................................................................. 50
Total Kjeldahl Nitrogen ........................................................................................................................... 51
Nitrite plus Nitrate Nitrogen ................................................................................................................... 52
Total Copper ............................................................................................................................................ 53
Total Lead ................................................................................................................................................ 54
Total Zinc ................................................................................................................................................. 55
Fecal Coliform Bacteria ........................................................................................................................... 56
Appendix C. Sources of Stormwater Flows and Pollutants ......................................................................... 57
Flow Contributions .................................................................................................................................. 57
Total Suspended Solids Mass Contributions ........................................................................................... 61
Total Dissolved Solids Mass Contributions ............................................................................................. 65
Filterable Phosphorus Mass Contributions ............................................................................................. 69
Total Phosphorus Mass Contributions .................................................................................................... 73
Nitrite plus Nitrate Mass Contributions .................................................................................................. 77
Total Kjeldahl Nitrogen Mass Contributions ........................................................................................... 81
Chemical Oxygen Demand Mass Contributions ...................................................................................... 85
Total Copper Mass Contributions ........................................................................................................... 89
Total Lead Mass Contributions ............................................................................................................... 93
Total Zinc Mass Contributions ................................................................................................................ 97
Fecal Coliform Contributions ................................................................................................................ 101
Standard Land Use Development Characteristics Detailed land use characteristics were available from several older and current stormwater research projects. The site survey information was organized and presented in both Appendix A and in associated WinSLAMM *.dat files. The projects and locations where these land use characteristics were available included: • Jefferson County, AL (high density residential; medium density residential <1960, 1960 to 1980 and >1980; low density residential; apartments; multi‐family; offices; shopping center; schools; churches; light industrial; parks; cemeteries; golf courses; and vacant land). These areas were inventoried as part of regional stormwater research and included about 10 single land use neighborhoods for each land use

category. Local NPDES data were available to calibrate WinSLAMM for regional conditions using the specific monitored areas. The sites are described in several publications, including: ‐ Bochis, C., R. Pitt, and P. Johnson. “Land development characteristics in Jefferson County, Alabama.” In: Stormwater and Urban Water Systems Modeling, Monograph 16. (edited by W. James, E.A. McBean, R.E. Pitt and S.J. Wright). CHI. Guelph, Ontario, pp. 249 – 282. 2008.
• Bellevue, WA (medium density residential <1960). These data were from test and control watersheds that were extensively monitored as part of the Bellevue project of the EPA’s Nationwide Urban Runoff Program (NURP). Much monitoring data from these sites are available for calibration of WinSLAMM. These areas are described in: ‐ Pitt, R. and P. Bissonnette. Bellevue Urban Runoff Program Summary Report, U.S. Environmental Protection Agency, Water Planning Division. PB84 237213. Washington, D.C. 173 pgs. 1984. ‐ Pitt, R. Characterizing and Controlling Urban Runoff through Street and Sewerage Cleaning. U.S. Environmental Protection Agency, Storm and Combined Sewer Program, Risk Reduction Engineering Laboratory. EPA/600/S2‐85/038. PB 85‐186500. Cincinnati, Ohio. 467 pgs. June 1985.
• Kansas City, MO (medium density residential <1960). These descriptions are from the test watershed in the current EPA green infrastructure demonstration project being conducted in Kansas City. Detailed inventories were made of each of the approximately 600 homes in the area. Currently, no runoff quality data are available for these areas. These are summarized in the following: ‐ Pitt, R., J. Voorhees. “Modeling green infrastructure components in a combined sewer area.” Monograph 19. ISBN 978‐0‐9808853‐4‐7. Modeling Urban Water Systems. Cognitive Modeling of Urban Water Systems. James, W., K.N. Irvine, James Y. Li, E.A. McBean, R.E. Pitt, and S.J. Wright (editors). Computational Hydraulics International. Guelph, Ontario. 2011. pp. 139 – 156. ‐ Pitt, R. and J. Voorhees. “Green infrastructure performance modeling with WinSLAMM.” 2009 World Environmental and Water Resources Congress Proceedings, Kansas City, MO, May 18 ‐ 22, 2009.
• Downtown Central Business Districts (Atlanta, GA; Chicago, IL; Los Angeles, CA; New York, NY; and San Francisco, CA). These were not monitored locations, but were selected as part of this project report, as this land use was not well represented in the available research projects. Five example areas in the high density downtown areas of each of these five cities were examined in detail using Google maps. The areas associated with each land cover in a several block area were manually measured and described. No runoff quality or quantity data are available for these areas. • Millburn, NJ (medium density residential 1961‐80). Nine homes are being monitored during this current EPA research project investigating the effects of dry‐well disposal of stormwater from individual homes, and the potential for irrigation use of this water. Google map aerial photographs and site surveys were conducted at each home to determine the land covers and characteristics. Site stormwater data are not available yet for these areas. Preliminary results will be presented at the following upcoming conferences: ‐ Talebi, L. and R. Pitt. “Stormwater Non‐potable Beneficial Uses: Modeling Groundwater Recharge at a Stormwater Drywell Installation.” ASCE/EWRI World Environment and Water Resources Congress. Palm Springs, CA, May 22‐26, 2011. ‐ Talebi, L. and R. Pitt. “Stormwater Non‐potable Beneficial Uses and Effects on Urban Infrastructure.” 84th Annual Water Environment Federation Technical Exhibition and Conference (WEFTEC), Los Angeles, CA, October 15–19, 2011.
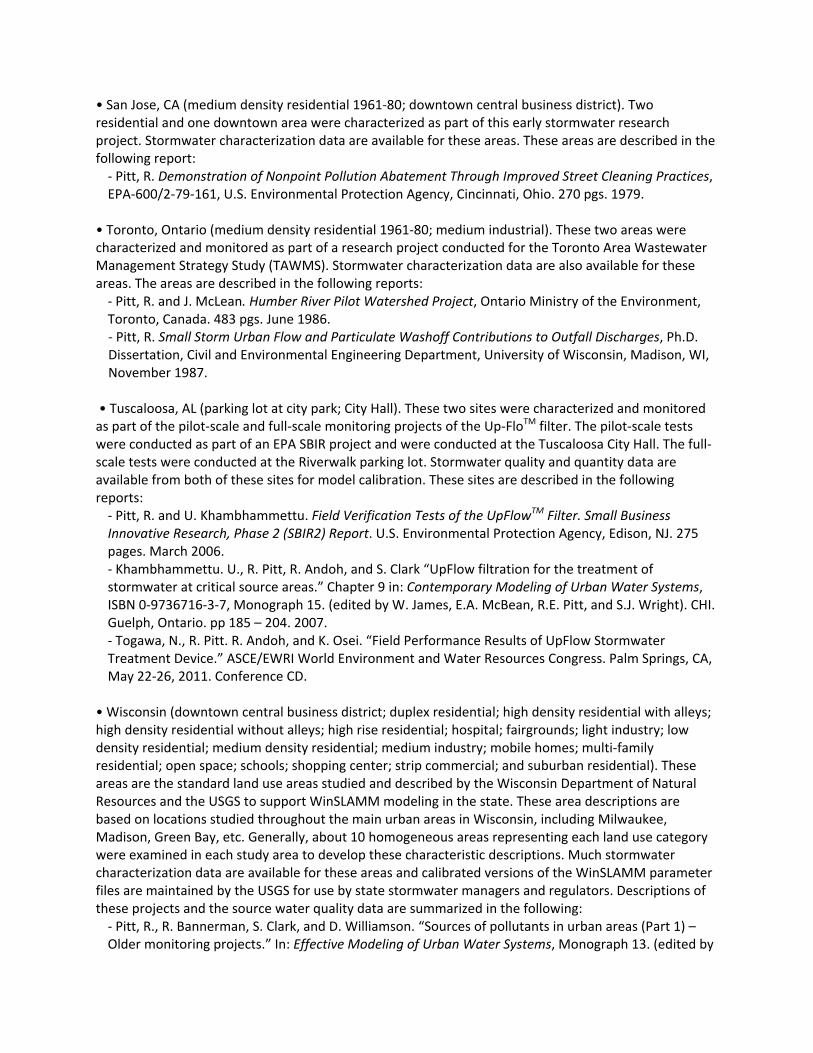
• San Jose, CA (medium density residential 1961‐80; downtown central business district). Two residential and one downtown area were characterized as part of this early stormwater research project. Stormwater characterization data are available for these areas. These areas are described in the following report: ‐ Pitt, R. Demonstration of Nonpoint Pollution Abatement Through Improved Street Cleaning Practices, EPA‐600/2‐79‐161, U.S. Environmental Protection Agency, Cincinnati, Ohio. 270 pgs. 1979.
• Toronto, Ontario (medium density residential 1961‐80; medium industrial). These two areas were characterized and monitored as part of a research project conducted for the Toronto Area Wastewater Management Strategy Study (TAWMS). Stormwater characterization data are also available for these areas. The areas are described in the following reports: ‐ Pitt, R. and J. McLean. Humber River Pilot Watershed Project, Ontario Ministry of the Environment, Toronto, Canada. 483 pgs. June 1986. ‐ Pitt, R. Small Storm Urban Flow and Particulate Washoff Contributions to Outfall Discharges, Ph.D. Dissertation, Civil and Environmental Engineering Department, University of Wisconsin, Madison, WI, November 1987.
• Tuscaloosa, AL (parking lot at city park; City Hall). These two sites were characterized and monitored as part of the pilot‐scale and full‐scale monitoring projects of the Up‐FloTM filter. The pilot‐scale tests were conducted as part of an EPA SBIR project and were conducted at the Tuscaloosa City Hall. The full‐scale tests were conducted at the Riverwalk parking lot. Stormwater quality and quantity data are available from both of these sites for model calibration. These sites are described in the following reports: ‐ Pitt, R. and U. Khambhammettu. Field Verification Tests of the UpFlowTM Filter. Small Business Innovative Research, Phase 2 (SBIR2) Report. U.S. Environmental Protection Agency, Edison, NJ. 275 pages. March 2006. ‐ Khambhammettu. U., R. Pitt, R. Andoh, and S. Clark “UpFlow filtration for the treatment of stormwater at critical source areas.” Chapter 9 in: Contemporary Modeling of Urban Water Systems, ISBN 0‐9736716‐3‐7, Monograph 15. (edited by W. James, E.A. McBean, R.E. Pitt, and S.J. Wright). CHI. Guelph, Ontario. pp 185 – 204. 2007. ‐ Togawa, N., R. Pitt. R. Andoh, and K. Osei. “Field Performance Results of UpFlow Stormwater Treatment Device.” ASCE/EWRI World Environment and Water Resources Congress. Palm Springs, CA, May 22‐26, 2011. Conference CD.
• Wisconsin (downtown central business district; duplex residential; high density residential with alleys; high density residential without alleys; high rise residential; hospital; fairgrounds; light industry; low density residential; medium density residential; medium industry; mobile homes; multi‐family residential; open space; schools; shopping center; strip commercial; and suburban residential). These areas are the standard land use areas studied and described by the Wisconsin Department of Natural Resources and the USGS to support WinSLAMM modeling in the state. These area descriptions are based on locations studied throughout the main urban areas in Wisconsin, including Milwaukee, Madison, Green Bay, etc. Generally, about 10 homogeneous areas representing each land use category were examined in each study area to develop these characteristic descriptions. Much stormwater characterization data are available for these areas and calibrated versions of the WinSLAMM parameter files are maintained by the USGS for use by state stormwater managers and regulators. Descriptions of these projects and the source water quality data are summarized in the following: ‐ Pitt, R., R. Bannerman, S. Clark, and D. Williamson. “Sources of pollutants in urban areas (Part 1) – Older monitoring projects.” In: Effective Modeling of Urban Water Systems, Monograph 13. (edited by
W. James, K.N. Irvine, E.A. McBean, and R.E. Pitt). CHI. Guelph, Ontario, pp. 465 – 484 and 507 – 530. 2005. ‐ Pitt, R., R. Bannerman, S. Clark, and D. Williamson. “Sources of pollutants in urban areas (Part 2) – Recent sheetflow monitoring results.” In: Effective Modeling of Urban Water Systems, Monograph 13. (edited by W. James, K.N. Irvine, E.A. McBean, and R.E. Pitt). CHI. Guelph, Ontario, pp. 485 – 530. 2005. ‐ Pitt, R., D. Williamson, and J. Voorhees. “Review of historical street dust and dirt accumulation and washoff data.” Effective Modeling of Urban Water Systems, Monograph 13. (edited by W. James, K.N. Irvine, E.A. McBean, and R.E. Pitt). CHI. Guelph, Ontario, pp 203 – 246. 2005.
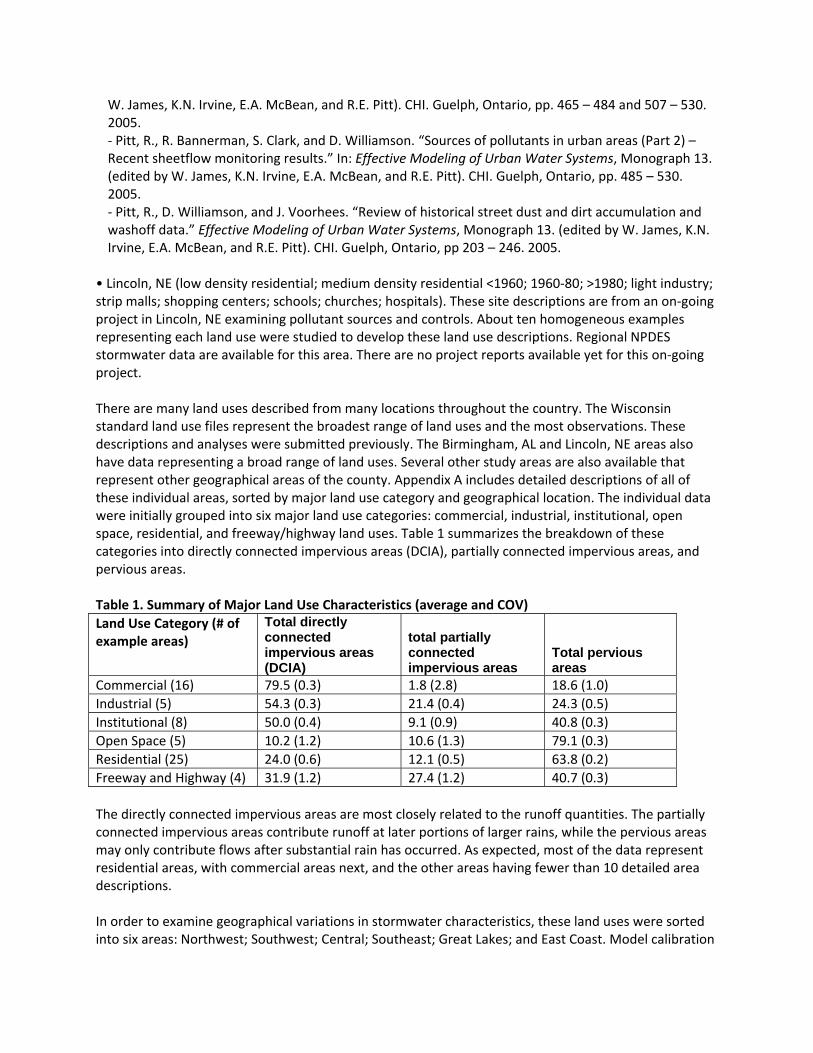
• Lincoln, NE (low density residential; medium density residential <1960; 1960‐80; >1980; light industry; strip malls; shopping centers; schools; churches; hospitals). These site descriptions are from an on‐going project in Lincoln, NE examining pollutant sources and controls. About ten homogeneous examples representing each land use were studied to develop these land use descriptions. Regional NPDES stormwater data are available for this area. There are no project reports available yet for this on‐going project. There are many land uses described from many locations throughout the country. The Wisconsin standard land use files represent the broadest range of land uses and the most observations. These descriptions and analyses were submitted previously. The Birmingham, AL and Lincoln, NE areas also have data representing a broad range of land uses. Several other study areas are also available that represent other geographical areas of the county. Appendix A includes detailed descriptions of all of these individual areas, sorted by major land use category and geographical location. The individual data were initially grouped into six major land use categories: commercial, industrial, institutional, open space, residential, and freeway/highway land uses. Table 1 summarizes the breakdown of these categories into directly connected impervious areas (DCIA), partially connected impervious areas, and pervious areas. Table 1. Summary of Major Land Use Characteristics (average and COV)
Land Use Category (# of example areas)
Total directly connected impervious areas (DCIA)
total partially connected impervious areas
Total pervious areas
Commercial (16) 79.5 (0.3) 1.8 (2.8) 18.6 (1.0)
Industrial (5) 54.3 (0.3) 21.4 (0.4) 24.3 (0.5)
Institutional (8) 50.0 (0.4) 9.1 (0.9) 40.8 (0.3)
Open Space (5) 10.2 (1.2) 10.6 (1.3) 79.1 (0.3)
Residential (25) 24.0 (0.6) 12.1 (0.5) 63.8 (0.2)
Freeway and Highway (4) 31.9 (1.2) 27.4 (1.2) 40.7 (0.3)
The directly connected impervious areas are most closely related to the runoff quantities. The partially connected impervious areas contribute runoff at later portions of larger rains, while the pervious areas may only contribute flows after substantial rain has occurred. As expected, most of the data represent residential areas, with commercial areas next, and the other areas having fewer than 10 detailed area descriptions. In order to examine geographical variations in stormwater characteristics, these land uses were sorted into six areas: Northwest; Southwest; Central; Southeast; Great Lakes; and East Coast. Model calibration

was performed in each of these six geographical areas for all of the land uses in each area. If a land use was not represented in an area, the overall average land use characteristics were used. As noted in a previous submittal, stormwater quality data from the National Stormwater Quality Database (NSQD) was sorted into groups representing major land use and geographical categories. The modeled concentrations were compared to the observed concentrations, as described in the following section.
Modeled Stormwater Characteristics Compared to Observed Data As noted above, the land use characteristics were used to create a range of standard land use files for evaluation with WinSLAMM. Six geographical areas and six major land use categories were examined. Many of the locations where the site characteristics were available also had stormwater monitoring data available that was used for regional calibration. If sites did not have site‐specific data, NSQD regional data were used instead. The first task was to sort all of the land use files into these six major land use categories. Table 2 lists the number of sites that were available for each group. As noted, most of the data were available for residential, then commercial areas, with less data available for institutional, industrial, open space, and highway/freeway areas. Overall site characteristics (averaged) were determined for each of these six categories. These six overall averaged files were then used in each of the six geographical areas, to complement available data for each location and land use data set. Some of the area and land use combinations only had this one file available, if no areas were monitored. A total of 114 files were used, with most in the residential and commercial areas, as previously noted, and with most of the files located in the Great Lakes region (due to the large number of Wisconsin observations) and in the Southeast (due to the large number of Birmingham, AL area observations). Table 2. Number of Land Use Files Used for Each Category Commercial Industrial Institutional Open
Space Residential Freeways/
Highways Total by Location
Central 4 2 4 1 5 3 19
East Coast 3 1 1 1 2 3 11
Great Lakes 6 4 4 2 11 4 31
Northwest 2 1 1 1 3 3 11
Southeast 7 2 3 5 8 4 29
Southwest 5 1 1 1 2 3 13
Total by Land Use
27 11 14 11 31 20 114
Each of these 114 files was associated with stormwater characteristic data, with preference given to site‐specific monitoring data. If local observations were not available, then NSQD data was used. As noted in the earlier NSQD project memo, those observations were separated into land use and regional EPA rain zone categories. The NSQD data associated with the land use‐area category were used if at least 30 events were monitored; if not, then the overall land use values for the constituent were used. Infrequently, the overall land use data did not have at least 30 event observations, so the overall average concentration was used.

The original WinSLAMM calibrated parameter files for Wisconsin developed and maintained by the USGS were used for all of the areas, except for the Southeast region. The Southeast region used the Birmingham area previously calibrated parameter files. The characteristics and constituents examined included: Rv (the volumetric runoff coefficient, the ratio of runoff depth to rain depth), TSS, TDS, COD, TP, filtered P, TKN, NO3+NO2, Cu, Pb, Zn, and fecal coliforms. The bacterial data was not available for the WI locations, so the NSQD was used for the Great Lakes locations. In addition, calculated peak flow (CFS/100 acres) was also examined. It was hoped that E. coli could also be used in these analyses, but the few data available did not allow suitable calibrations. Initially, each of the 114 standard land use files were used in WinSLAMM using these original calibrated parameter files. The source area concentration data used in these files are described and summarized in the following publications (previously listed as the sources of the WI data, but these also include data from most of the source areas examined): ‐ Pitt, R., R. Bannerman, S. Clark, and D. Williamson. “Sources of pollutants in urban areas (Part 1) – Older monitoring projects.” In: Effective Modeling of Urban Water Systems, Monograph 13. (edited by W. James, K.N. Irvine, E.A. McBean, and R.E. Pitt). CHI. Guelph, Ontario, pp. 465 – 484 and 507 – 530. 2005. ‐ Pitt, R., R. Bannerman, S. Clark, and D. Williamson. “Sources of pollutants in urban areas (Part 2) – Recent sheetflow monitoring results.” In: Effective Modeling of Urban Water Systems, Monograph 13. (edited by W. James, K.N. Irvine, E.A. McBean, and R.E. Pitt). CHI. Guelph, Ontario, pp. 485 – 530. 2005. ‐ Pitt, R., D. Williamson, and J. Voorhees. “Review of historical street dust and dirt accumulation and washoff data.” Effective Modeling of Urban Water Systems, Monograph 13. (edited by W. James, K.N. Irvine, E.A. McBean, and R.E. Pitt). CHI. Guelph, Ontario, pp 203 – 246. 2005. Area rain files were selected for each of the regions. The averaged land use files were evaluated using the following rain data for 4 or 5 years (1995 through 1999, except for Lincoln, NE that started in 1996 due to missing rain records): Great Lakes: Madison, WI; East Coast: Newark, NJ; Central: Lincoln, NE; Northwest: Seattle, WA; Southeast: Birmingham, AL; and Southwest: Los Angeles, CA. The sites having site‐specific observations used the rain records associated with the sites and for the period of record. The Great Lakes region recognized a winter period (Dec 3 to March 12) as did the Central region (Dec 20 to Feb 10). During these winter periods, no stormwater calculations were made. The calculated long‐term averaged modeled concentrations were compared to the monitored concentrations for each site and for the land use category combined. Factors were applied uniformly to each land use‐area pollutant parameter file to adjust the long‐term modeled concentrations to best match the monitored/observed values. The WI and AL location files were not changed as they were associated with previously calibrated conditions (except for the constituents that were not measured locally). In addition, the runoff parameter files were not modified as they have been shown to compare well to observed conditions under a wide range of situations. Appendix B shows the scatterplots of the 114 land use conditions, comparing the modeled with the observed concentrations, after the final adjustments. Table 3 summarizes the results of the comparisons of the modeled to the observed values for all of the 114 files (91 for Rv, as some areas did not have suitable comparison data) for each constituent. As noted in this summary table, the regression statistics were all excellent (the P‐values of the regression equations and for the slope terms were all highly significant), and the regression slope terms were all close to 1.0, with a few exceptions. The residual behaviors were all very good, except for total and filtered phosphorus that showed a strong bias, with modeled concentrations being too high for small observed concentrations. The Rv plot also showed a

similar, but much less severe bias. All of the other constituents had random variations about the best fit lines with small variabilities.
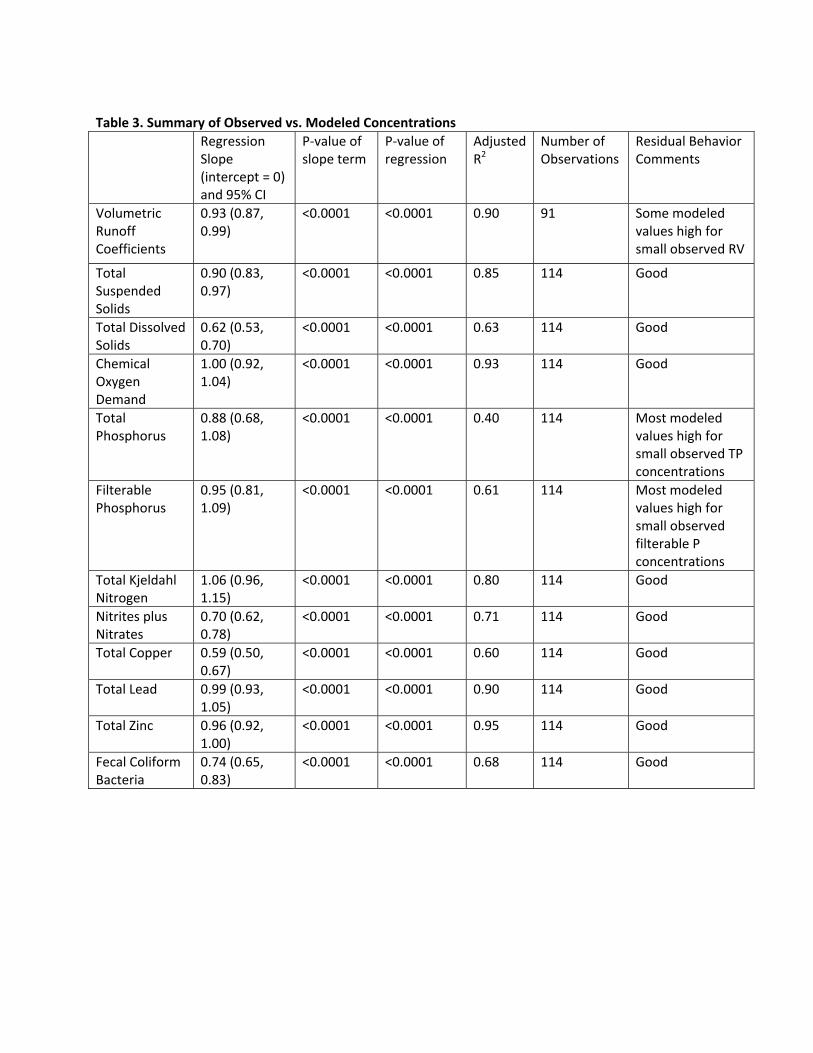
Table 3. Summary of Observed vs. Modeled Concentrations
Regression Slope (intercept = 0) and 95% CI
P‐value of slope term
P‐value of regression
Adjusted R2
Number of Observations
Residual Behavior Comments
Volumetric Runoff Coefficients
0.93 (0.87, 0.99)
<0.0001 <0.0001 0.90 91
Some modeled values high for small observed RV
Total Suspended Solids
0.90 (0.83, 0.97)
<0.0001 <0.0001 0.85 114 Good
Total Dissolved Solids
0.62 (0.53, 0.70)
<0.0001 <0.0001 0.63 114 Good
Chemical Oxygen Demand
1.00 (0.92, 1.04)
<0.0001 <0.0001 0.93 114 Good
Total Phosphorus
0.88 (0.68, 1.08)
<0.0001 <0.0001 0.40 114 Most modeled values high for small observed TP concentrations
Filterable Phosphorus
0.95 (0.81, 1.09)
<0.0001 <0.0001 0.61 114 Most modeled values high for small observed filterable P concentrations
Total Kjeldahl Nitrogen
1.06 (0.96, 1.15)
<0.0001 <0.0001 0.80 114 Good
Nitrites plus Nitrates
0.70 (0.62, 0.78)
<0.0001 <0.0001 0.71 114 Good
Total Copper 0.59 (0.50, 0.67)
<0.0001 <0.0001 0.60 114 Good
Total Lead 0.99 (0.93, 1.05)
<0.0001 <0.0001 0.90 114 Good
Total Zinc 0.96 (0.92, 1.00)
<0.0001 <0.0001 0.95 114 Good
Fecal Coliform Bacteria
0.74 (0.65, 0.83)
<0.0001 <0.0001 0.68 114 Good

Sources of Stormwater Flows and Pollutants These calibrated WinSLAMM parameter files and averaged land use files were then used, applying the Great Lakes conditions, to identify the major source areas of each pollutant and flow. This is critical information needed when designing a stormwater management program for an area. Table 4 summarizes the details presented in Appendix C. Table 4 includes summaries of the major flows and pollutant sources for each of eight land use categories (the urban freeway and rural highway were split and an office technology park category was added to the original set of land use categories). The major sources are shown for each flow and constituent, for three different rain event categories: small (<0.5 inches), intermediate (0.5 to 2 inches), and large (>2 inches). The small category generally includes most of the rain and runoff events by number, but produces a small fraction of the annual runoff mass. This category of events if therefore of greatest interest when the number of events is of concern. If regulatory limits have numeric effluent standards, then the number of runoff events is of the greatest concern, and stormwater control strategies would focus on eliminating as many of the runoff events as possible. Relatively small rains are associated with most of the runoff events, by number (although the total runoff volume from these rains is relatively small). For many locations, typical numeric standards for bacteria and total recoverable heavy metals would be frequently exceeded. Therefore, runoff volume, bacteria, and heavy metals would be of the greatest interest for removal from the small rain category. The intermediate category generally includes most of the runoff pollutant discharges by mass; frequently more than 75% of the annual pollutant discharges, by mass, occur during these rains. It is therefore greatly desired to remove as much of the runoff from this rain category. However, site soil and development conditions will likely prevent the elimination of all runoff from this category. Therefore, stormwater treatment will be needed for the constituents of concern for runoff that cannot be totally eliminated by site beneficial use or infiltration. Flow, as noted, will always be of interest, but further treatment of stormwater to reduce bacteria, nutrient, and /or heavy metal discharges will also likely be a suitable goal. The largest rain category includes events that are channel‐forming with dramatic effects on habitat conditions. Therefore, volume reductions during some portions of these large rains will provide some benefit, but reductions in runoff energy discharges will also need to be considered. Runoff energy reductions are most effectively associated with flow‐duration modifications of the discharge hydrographs. The largest rains in this category (likely not included in the 5‐year rainfall periods examined) are associated with drainage design and public safety. Flow sources are therefore of the greatest concern, and like for energy reductions, basin‐wide hydraulic analyses would be needed to result in the most effective stormwater management and drainage options. It is unlikely that pollutant discharges would be of great concern during these large events, as they contribute relatively small fractions of the amortized annual flows, and any treatment method that could manage these large flows would be extremely costly and inefficient. As shown on Table 4, most of the flows originate from the directly connected impervious areas (DCIA), except when undeveloped or landscaped portions of the areas are very large (residential, open space, rural highways). For these areas, the landscaped/undeveloped areas can produce significant flows during the large rains (also during the intermediate rains for the office technology park and open space land uses). The goal of any stormwater management program should therefore be to reduce/eliminate runoff from the DCIA areas. As noted in the project infiltration limitation memo, there are many conditions where large‐scale infiltration of stormwater may not be desirable (mainly in areas having

severely limited soils hindering infiltration, shallow groundwater, or other factors that would not adequately mitigate pollutant movement to the groundwater). In most cases, roof runoff, being the least contaminated DCIA source water, should be preferentially infiltrated or used on site for beneficial uses. In residential areas, roof runoff comprises about 20 to 30% of the total annual runoff amount. However, streets (along with driveways and landscaped areas) can comprise the majority of the total flows. A typical strategy in residential areas would therefore apply rain gardens, or otherwise disconnect the roof drainage, for roof runoff control (for currently directly connected roofs). If possible, soil amendments and other strategies to reduce soil compaction to improve infiltration in the landscaped areas could eliminate much of the runoff from those areas. Street and driveway runoff would remain. If the area was drained using grass swales, it is likely that most of the total area runoff would be eliminated. If drained by conventional curbs and gutters, curb‐cut bioinfiltration areas could be retrofitted to eliminate almost all of the runoff (and associated pollutants). In residential areas having loamy soils that are not compacted and are drained by grass swales, especially if most of the impervious areas are disconnected and drain to pervious areas, no additional stormwater controls may be needed in residential areas. High‐density residential areas having larger amounts of impervious areas would obviously require additional effort. Commercial areas have most of their runoff originating from paved parking areas, streets, and roofs. These are also the main sources for most of the pollutants examined. Few opportunities exist to utilize rain gardens for roof runoff control in most commercial areas, so bioinfiltration areas that collect runoff from mixed sources may be an appropriate approach. In many parking areas, islands or landscaped edges can be retrofitted with infiltration devices for significant runoff volume reductions. Curb‐cut biofilters would need to extend out into the street in most cases due to lack of suitable space near the street edge in most commercial areas. Treatment of commercial area stormwater runoff would therefore be needed, as complete infiltration is not likely to be achieved. Critical source area treatments in areas of major automobile activity, plus pollution prevention to reduce the use of galvanized metals are other strategies. Because of the lack of space in most commercial areas, stormwater treatment may need to be situated in adjacent areas, or in underground chambers. Industrial areas have most of their flows and pollutants originating from paved parking and storage areas. Roofs and streets are lesser, but still important sources. Infiltration in these areas is of greater concern as the runoff from industrial areas is more likely to lead to groundwater contamination. Critical source area controls (such as media filtration and biofilters using specialized media as part of treatment trains) will likely be necessary, along with pollution prevention to reduce the exposure of metals (especially galvanized) and other materials. In some industrial areas, stormwater can be used for dust suppression. If a relatively large site, wet detention ponds could also be located on available land to collect and further treat any remaining surface runoff. Many institutional, office technology park and open space areas are predominately landscaped, with less directly connected impervious areas and larger landscaped or undeveloped areas for stormwater management. Designing stormwater management features that take advantage of the topography in these areas can result in significant runoff discharge reductions. Some of these areas have large parking areas with long‐term parking that can also benefit from parking lot island or perimeter bioinfiltration areas.

Rural highways usually have substantial undeveloped land within the rights‐of‐ways that can be used for stormwater management, especially grass swales. A typical 2 or 4 land rural highway could likely be totally controlled with moderately‐sized grass swales along both roadway edges. Urban freeways from 4 to 8 (or more) traffic lanes may not have adequate space in the medians or along the roadway edges for grass swales. If the space is available, the swales can result in significant runoff reductions. However, there will likely be significant excess runoff due to the larger paved areas. Freeway intersections or exit/entrance ramps usually have substantial land contained within the rights‐of‐ways at these locations. This land could be suitable for infiltration controls, or wet detention ponds. The summaries in Table 4 and Appendix C can be used to illustrate the likely maximum level of control for different stormwater management approaches applied to source areas. If lots of attention were applied to roof rain gardens in residential areas, it is obvious that there will still be significant runoff from other sources, for example. Modeling of the different scenarios can be used to quantify how the different control approaches can (or cannot) meet desired objectives. These summary tables and the figures can however be used to indicate where management strategies should be focused.
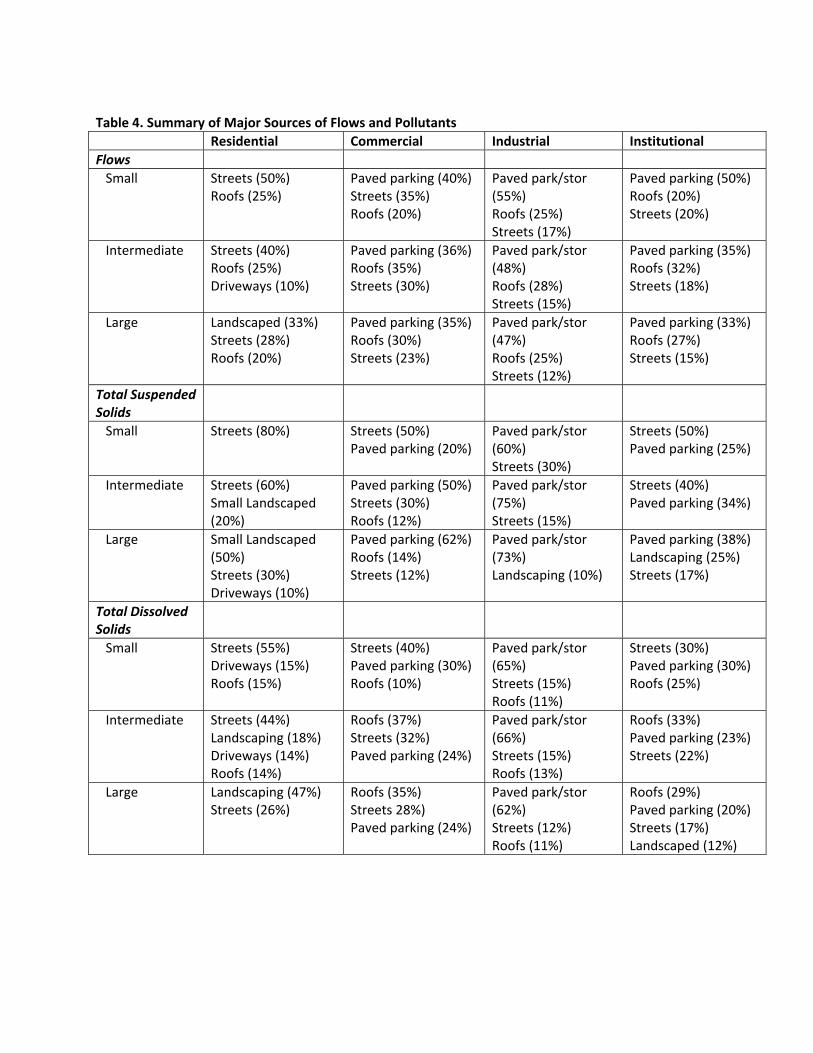
Table 4. Summary of Major Sources of Flows and Pollutants
Residential Commercial Industrial Institutional
Flows
Small Streets (50%) Roofs (25%)
Paved parking (40%) Streets (35%) Roofs (20%)
Paved park/stor (55%) Roofs (25%) Streets (17%)
Paved parking (50%) Roofs (20%) Streets (20%)
Intermediate Streets (40%) Roofs (25%) Driveways (10%)
Paved parking (36%) Roofs (35%) Streets (30%)
Paved park/stor (48%) Roofs (28%) Streets (15%)
Paved parking (35%) Roofs (32%) Streets (18%)
Large Landscaped (33%) Streets (28%) Roofs (20%)
Paved parking (35%) Roofs (30%) Streets (23%)
Paved park/stor (47%) Roofs (25%) Streets (12%)
Paved parking (33%) Roofs (27%) Streets (15%)
Total Suspended Solids
Small Streets (80%) Streets (50%) Paved parking (20%)
Paved park/stor (60%) Streets (30%)
Streets (50%) Paved parking (25%)
Intermediate Streets (60%) Small Landscaped (20%)
Paved parking (50%) Streets (30%) Roofs (12%)
Paved park/stor (75%) Streets (15%)
Streets (40%) Paved parking (34%)
Large Small Landscaped (50%) Streets (30%) Driveways (10%)
Paved parking (62%) Roofs (14%) Streets (12%)
Paved park/stor (73%) Landscaping (10%)
Paved parking (38%) Landscaping (25%) Streets (17%)
Total Dissolved Solids
Small Streets (55%) Driveways (15%) Roofs (15%)
Streets (40%) Paved parking (30%) Roofs (10%)
Paved park/stor (65%) Streets (15%) Roofs (11%)
Streets (30%) Paved parking (30%) Roofs (25%)
Intermediate Streets (44%) Landscaping (18%) Driveways (14%) Roofs (14%)
Roofs (37%) Streets (32%) Paved parking (24%)
Paved park/stor (66%) Streets (15%) Roofs (13%)
Roofs (33%) Paved parking (23%) Streets (22%)
Large Landscaping (47%) Streets (26%)
Roofs (35%) Streets 28%) Paved parking (24%)
Paved park/stor (62%) Streets (12%) Roofs (11%)
Roofs (29%) Paved parking (20%) Streets (17%) Landscaped (12%)

Residential Commercial Industrial Institutional
Chemical Oxygen Demand
Small Streets (60%) Roofs (15%) Paved parking (10%)
Streets (50%) Paved parking (35%) Roofs (12%)
Paved park/stor (45%) Streets (40%)
Streets (50%) Paved parking (20%) Roofs (17%)
Intermediate Streets (56%) Landscaping (13%) Roofs (12%) Driveways (10%)
Paved parking (36%) Roofs (35%) Streets (25%)
Paved park/stor (60%) Streets (21%) Roofs (12%)
Roofs (41%) Paved parking (25%) Streets (20%)
Large Landscaping (44%) Streets (24%) Roofs (13%)
Paved parking (38%) Roofs (36%) Streets (19%)
Paved park/stor (60%) Streets (15%) Roofs (10%)
Roofs (37%) Paved parking (24%) Landscaping (18%) Streets (11%)
Total Phosphorus
Small Streets (75%) Driveways (12%)
Streets (50%) Paved parking (25%) Roofs (13%)
Streets (40%) Paved park/stor (40%)
Streets (55%) Paved parking (20%) Roofs (9%)
Intermediate Streets (57%) Landscaped (25%)
Paved parking (30%) Roofs (30%) Streets (20%)
Paved park/stor (47%) Streets (23%) Landscaping (11%) Roofs (9%)
Landscaping (24%) Paved parking (21%) Streets (20%) Roofs (19%)
Large Landscaped (70%) Streets (17%)
Landscaped (30%) Paved parking (28%) Roofs (23%) Streets (11%)
Paved park/stor (39%) Landscaping (31%) Streets (13)
Landscaping (60%) Paved parking (14%) Roofs (11%)
Filterable Phosphorus
Small Streets (60%) Driveways (15%) Roofs (10%)
Paved parking (35%) Streets (26%) Sidewalks (17%) Roofs (16%)
Streets (68%) Paved park/stor (15%)
Paved parking (35%) Streets (20%) Driveways (12%) Playgrounds (11%)
Intermediate Landscaping (46%) Streets (33%) Driveways (10%)
Paved parking (27%) Roofs (25%) Streets (19%) Landscaping (15%)
Streets (56%) Paved park/stor (15%) Landscaping (12%)
Landscaping (34%) Paved parking (20%) Roofs (18%) Streets (11%)
Large Landscaping (77%) Streets (13%)
Landscaping (33%) Paved parking (20%) Roofs (17%) Streets (13%)
Street (37%) Landscaping (34%) Paved park/stor (12%)
Landscaping (60%) Paved parking 10%)

Residential Commercial Industrial Institutional
Total Kjeldahl Nitrogen
Small Streets (58%) Roofs (15%) Driveways (14%)
Streets (55%) Paved parking (20%) Roofs (12%)
Paved park/stor (50%) Streets (35%) Roofs (17%)
Streets (50%) Paved parking (25%) Roofs (18%)
Intermediate Streets (36%) Landscaping (38%)
Roofs (38%) Paved parking (28%) Streets (23%)
Paved park/stor (46%) Roofs (26%) Streets (12%) Landscaping (10%)
Roofs (34%) Streets (21%) Paved parking (21%) Landscaping (15%)
Large Landscaping (77%) Streets (9%)
Roofs (35%) Paved parking (28%) Landscaping (19%) Streets (15%)
Paved park/stor (36%) Landscaping (31%) Roofs (20%)
Landscaping (44%) Roofs (23%) Paved parking (16%) Streets (10%)
Nitrites + nitrates
Small Streets (45%) Roofs (25%) Driveways (10%)
Paved parking (37%) Streets (35%) Roofs (25%)
Paved park/stor (45%) Roofs (25%) Streets (20%)
Paved parking (40%) Roofs (25%) Streets (25%)
Intermediate Streets (38%) Roofs (30%) Landscaping (11%) Driveways (9%)
Roofs (41%) Paved parking (29%) Streets (27%)
Paved park/stor (40%) Roofs (37%) Streets (16%)
Roofs (39%) Paved parking (29%) Streets (20%)
Large Landscaping (33%) Streets (26%) Roofs (24%)
Roofs (39%) Paved parking (30%) Streets (24%)
Paved park/stor (40%) Roofs (34%) Streets (13%)
Roofs (34%) Paved parking (28%) Streets (16%) Landscaping (13%)
Total Copper
Small Streets (50%) Paved parking (13%) Roofs (10%)
Streets (50%) Paved parking (30%)
Paved park/stor (40%) Streets (35%) Roofs (20%)
Streets (50%) Paved parking (20%)
Intermediate Streets (49%) Driveways (14%) Roofs (14%) Paved parking (13%)
Paved parking (46%) Streets (31%) Roofs (19%)
Paved park/stor (46%) Roofs (34%) Streets (14%)
Paved parking (37%) Streets (33%) Roofs (18%)
Large Landscaping (26%) Streets (25%) Roofs (17%) Driveways (15%) Paved parking (15%)
Paved parking (52%) Roofs (21%) Streets (20%)
Paved park/stor (49%) Roofs (34%) Streets (10%)
Paved parking (42%) Streets (20%) Roofs (19%)

Residential Commercial Industrial Institutional
Total Lead
Small Streets (45%) Roofs (18%) Paved parking (15%) Driveways (15%)
Streets (50%) Paved parking (35%) Roofs (10%)
Paved park/stor (53%) Streets (30%)
Streets (65%) Paved parking (20%)
Intermediate Streets (40%) Roofs (20%) Paved parking (13%) Landscaping (12%) Driveways (11%)
Paved parking (50%) Roofs (28%) Streets (18%)
Paved park/stor (75%) Streets (10%)
Paved parking (38%) Streets (28%) Roofs (21%)
Large Landscaping (41%) Roofs (21%) Streets (13%) Paved parking (13%)
Paved parking (56%) Roofs (29%)
Paved park/stor (70%) Landscaping (10%)
Paved parking (42%) Roofs (22%) Landscaping (14%) Streets (12%)
Total Zinc
Small Streets (50%) Roofs (19%) Paved parking (15%)
Streets (55%) Paved parking (35%) Roofs (16%)
Paved park/stor (55%) Streets (25%) Roofs (13%)
Streets (55%) Paved parking (25%) Roofs (15%)
Intermediate Streets (48%) Roofs (16%) Paved parking (14%)
Roofs (40%) Paved parking (38%) Streets (20%)
Paved park/stor (59%) Roofs (14%) Streets (13%)
Roofs (38%) Paved parking (33%) Streets (23%)
Large Streets (25%) Landscaping (23%) Paved parking (17%) Roofs (16%)
Paved parking (43%) Roofs (42%) Streets (12%)
Paved park/stor (60%) Roofs (33%)
Roofs (40%) Paved parking (38%) Streets (13%)
Fecal Coliform Bacteria
Small Streets (48%) Paved parking (25%)
Paved parking (45%) Streets (31%) Sidewalks (15%)
Streets (75%) Paved park/stor (14%)
Paved parking (70%) Streets (15%)
Intermediate Streets (42%) Paved parking (22%) Sidewalks (13%) Landscaping (12%)
Paved parking (44%) Streets (28%) Sidewalks (18%)
Streets (74%) Paved park/stor (14%)
Paved parking (67%) Streets (15%)
Large Landscaping (33%) Streets (28%) Paved parking (20%)
Paved parking (38%) Streets (23%) Landscaping (19%) Sidewalks (15%)
Streets (68%) Paved park/stor (14%)
Paved parking (64%) Streets (13%)
Small events: <0.5 inches of rain Intermediate events: 0.5 to <2.5 inches of rain Large events: 2.5 and greater inches of rain

Table 4. Summary of Major Sources of Flows and Pollutants (cont.)
Office Technology Park
Open Space Urban Freeway Rural Highway
Flows
Small Streets (90%) Streets (60%) Paved parking (30%)
Paved lane and shoulder (100%)
Paved lane and shoulder (100%)
Intermediate Streets (55%) Landscaped (35%)
Streets (50%) Landscaped (25%) Paved parking (20%)
Paved lane and shoulder (98%)
Paved lane and shoulder (96%)
Large Streets (55%) Landscaped (34%) Roofs (10%)
Landscaped (60% ) Streets (22%) Paved parking (14%)
Paved lane and shoulder (93%)
Paved lane and shoulder (84%) Large turf area (16%)
Total Suspended Solids
Small Streets (95%) Streets (85%) Paved parking (10%)
Paved lane and shoulder (100%)
Paved lane and shoulder (100%)
Intermediate Landscaping (50%) Streets (46%)
Streets (65%) Landscaping (28%)
Paved lane and shoulder (99%)
Paved lane and shoulder (98%)
Large Landscaping (85%)
Landscaping (83%) Streets (12%)
Paved lane and shoulder (94%)
Paved lane and shoulder (81%) Large turf area (19%)
Total Dissolved Solids
Small Streets (95%) Streets (60%) Paved parking (20%)
Paved lane and shoulder (100%)
Paved lane and shoulder (100%)
Intermediate Streets (50%) Landscaping (43%)
Landscaping (45%) Streets (42%) Paved parking (10%)
Paved lane and shoulder (97%)
Paved lane and shoulder (93%)
Large Landscaping (70%) Streets (19%)
Landscaping (75%) Streets (16%)
Paved lane and shoulder (91%)
Paved lane and shoulder (79%) Large turf area (21%)
Chemical Oxygen Demand
Small Streets (95%) Streets (75%) Paved parking (10%)
Paved lane and shoulder (100%)
Paved lane and shoulder (100%)
Intermediate Landscaping (57%) Streets (38%)
Streets (45%) Landscaping (41%) Paved parking (10%)
Paved lane and shoulder (98%)
Paved lane and shoulder (97%)
Large Landscaping (80%) Streets (10%)
Landscaping (84%) Paved lane and shoulder (91%)
Paved lane and shoulder (77%) Large turf area (23%)

Office Technology Park
Open Space Urban Freeway Rural Highway
Total Phosphorus
Small Streets (80%) Streets (90%) Paved parking (10%)
Paved lane and shoulder (100%)
Paved lane and shoulder (100%)
Intermediate Landscaping (85%) Streets (13%)
Streets (50%) Landscaping (46%)
Paved lane and shoulder (98%)
Paved lane and shoulder (92%)
Large Landscaping (95%) Landscaping (89%) Paved lane and shoulder (81%) Large turf (19%)
Paved lane and shoulder (57%) Large turf area (43%)
Filterable Phosphorus
Small Streets (80%) Landscaped (20%)
Streets (87%) Paved parking (12%)
Paved lane and shoulder (100%)
Paved lane and shoulder (100%)
Intermediate Landscaped (90%) Landscaping (71%) Streets (23%)
Paved lane and shoulder (90%) Large turf (10%)
Paved lane and shoulder (77%) Large turf (23%)
Large Landscaped (95%) Landscaping (86%) Paved lane and shoulder (72%) Large turf (28%)
Large turf area (52%) Paved lane and shoulder (58%)
Total Kjeldahl Nitrogen
Small Streets (95%) Streets (75%) Paved parking (20%)
Paved lane and shoulder (100%)
Paved lane and shoulder (100%)
Intermediate Landscaping (78%) Streets (18%)
Landscaping (63%) Streets (29%)
Paved lane and shoulder (90%) Large turf (10%)
Paved lane and shoulder (77%) Large turf (23%)
Large Landscaping (92%) Landscaping (93%) Paved lane and shoulder (72%) Large turf (28%)
Large turf area (52%) Paved lane and shoulder (58%)
Nitrites + nitrates
Small Streets (95%) Streets (65%) Paved parking (26%)
Paved lane and shoulder (100%)
Paved lane and shoulder (100%)
Intermediate Streets (58%) Landscaping (31%) Roofs (10%)
Streets (55%) Paved parking (21%) Landscaping (20%)
Paved lane and shoulder (99%)
Paved lane and shoulder (97%)
Large Landscaping (56%) Streets (24%) Roofs (15%)
Landscaping (48%) Streets (30%) Paved parking (15%)
Paved lane and shoulder (96%)
Paved lane and shoulder (89%) Large turf area (11%)

Office Technology Park
Open Space Urban Freeway Rural Highway
Total Copper
Small Streets (99%) Streets (65%) Paved parking (33%)
Paved lane and shoulder (100%)
Paved lane and shoulder (100%)
Intermediate Streets (76%) Landscaping (16)
Streets (55%) Paved parking (24%) Landscaping (18%)
Paved lane and shoulder (99%)
Paved lane and shoulder (99%)
Large Landscaping (46%) Streets (31%) Roofs (11%)
Landscaping (53%) Streets (19%) Paved parking (19%)
Paved lane and shoulder (99%)
Paved lane and shoulder (96%)
Total Lead
Small Streets (100%) Streets (65%) Paved parking (33%)
Paved lane and shoulder (100%)
Paved lane and shoulder (100%)
Intermediate Streets (50%) Landscaping (40%)
Streets (43%) Landscaping (30%) Paved parking (21%)
Paved lane and shoulder (100%)
Paved lane and shoulder (99%)
Large Landscaping (73%) Roofs (11%) Streets (10%)
Landscaping (70%) Paved parking (10%)
Paved lane and shoulder (96%)
Paved lane and shoulder (86%) Turf areas (14%)
Total Zinc
Small Streets (95%) Streets (60%) Paved parking (35%)
Paved lane and shoulder (100%)
Paved lane and shoulder (100%)
Intermediate Streets (71%) Landscaping (14%) Roofs (11%)
Streets (55%) Paved parking (28%) Landscaping (16%)
Paved lane and shoulder (100%)
Paved lane and shoulder (99%)
Large Landscaping (36%) Roofs (28%) Streets (25%)
Landscaping (49%) Paved parking (26%) Streets (22%)
Paved lane and shoulder (98%)
Paved lane and shoulder (93%)
Fecal Coliform Bacteria
Small Streets (95%) Streets (90%) Paved lane and shoulder (100%)
Paved lane and shoulder (100%)
Intermediate Streets (59%) Landscaping (38%)
Streets (81%) Paved lane and shoulder (92%)
Paved lane and shoulder (80%) Turf area (20%)
Large Landscaping (66%) Streets (25%)
Streets (56%) Landscaping (25%) Unpaved parking (12%)
Paved lane and shoulder (74%) Turf area (26%)
Paved lane and shoulder (51%) Turf area (49%)

Appendix A. Land Use Site Descriptions Commercial Area Site Descriptions Site Description Location land use EPA
Rain Zone
Pitched Roofs to Impervious‐C
Flat Roofs to Impervious‐C
Flat Roofs to Pervious‐D
(%) (%) (%)
Office Technology Park composite commer all 0.0 0.0 15.0
Downtown CBD Chicago, IL commer 1 0.0 33.7 0.0
Downtown CBD New York, NY commer 1 0.0 48.3 0.0
Downtown CBD WI SLU file commer 1 0.0 41.0 0.0
Shopping Center WI SLU file commer 1 0.0 21.6 0.0
Strip commercial WI SLU file commer 1 3.7 19.7 0.0
Offices Jefferson County, AL commer 3 0.0 17.2 0.3
Shopping Center Jefferson County, AL commer 3 0.0 17.8 3.6
Downtown CBD Atlanta, GA commer 3 0.0 28.0 0.0
Parking lot at park Tuscaloosa, AL commer 3 0.0 0.0 0.0
City Hall Tuscaloosa, AL commer 3 20.0 18.0 0.0
Downtown CBD Los Angeles, CA commer 6 0.0 27.2 0.0
Downtown CBD San Francisco, CA commer 6 0.0 37.4 0.0
Downtown CBD San Jose, CA commer 6 0.0 26.0 0.0
Commercial ‐ strip mall Lincoln, NE commer 9 0.0 25.0 0.0
Commercial ‐ shopping center
Lincoln, NE commer 9 0.0 27.1 0.0
average 1.5 24.3 1.2
median 0.0 25.5 0.0
min 0.0 0.0 0.0
max 20.0 48.3 15.0
st dev 5.0 12.9 3.8
COV 3.4 0.5 3.2
count 16 16 16

Commercial Area Site Descriptions Site Description
Parking paved-C
Parking paved-D
Parking unpaved-
D Storage paved-C
Driveways paved-C
Driveways paved-D
Walkways-C
Walkways-D
(%) (%) (%) (%) (%) (%) (%) (%) Office Technology Park 0.0 5.0 0.0 0.0 0.0 0.0 0.0 0.5Downtown CBD (Chicago) 17.8 0.0 0.0 4.1 0.0 0.0 6.1 0.0Downtown CBD (New York) 3.0 0.0 0.0 14.0 0.0 0.0 4.9 0.0Downtown CBD (WI) 22.6 0.0 0.0 0.0 1.5 0.0 8.4 0.0Shopping Center 60.8 0.0 0.3 0.0 1.8 0.0 0.5 0.0Strip commercial 40.9 0.0 1.4 0.0 2.0 0.0 4.3 0.0Offices 24.7 1.9 0.0 0.0 1.1 0.6 0.0 0.0Shopping Center 29.2 0.0 0.6 0.0 0.7 0.0 0.0 0.0Downtown CBD 22.8 0.0 0.0 5.6 0.0 0.0 3.8 0.0Parking lot at park 33.9 0.0 0.0 0.0 0.0 0.0 5.4 0.0City Hall 62.0 0.0 0.0 0.0 0.0 0.0 0.0 0.0Downtown CBD (Los Angeles) 20.3 0.0 0.0 8.6 0.0 0.0 5.0 0.0Downtown CBD (San Francisco) 16.5 0.0 0.0 0.0 0.0 0.0 7.6 0.0Downtown CBD (San Jose) 14.0 0.0 0.0 0.0 0.0 0.0 4.0 0.0Commercial ‐ strip mall 45.7 0.0 0.0 0.0 0.3 0.0 0.0 0.0Commercial ‐ shopping center 47.7 0.0 0.0 0.0 0.1 0.0 0.0 0.0
average 28.9 0.4 0.1 2.0 0.5 0.0 3.1 0.0median 23.8 0.0 0.0 0.0 0.0 0.0 3.9 0.0
min 0.0 0.0 0.0 0.0 0.0 0.0 0.0 0.0max 62.0 5.0 1.4 14.0 2.0 0.6 8.4 0.5
st dev 18.4 1.3 0.4 4.1 0.7 0.2 3.0 0.1COV 0.6 3.0 2.6 2.0 1.5 4.0 1.0 4.0
count 16 16 16 16 16 16 16 16

Commercial Area Site Descriptions Site Description
Street Area
Curb Miles
Street Width
Large Turf
Undevel
Small Landscaping
Other pervious
area
Other directly
connected Imp area
Other part cncted Imp
area TOTAL
(%)
per 100 ac (ft) (%) (%) (%) (%) (%) (%) (%)
Office Technology Park 6.0 4.0 33.0 68.0 0.0 5.5 0.0 0.0 0.0 100.0Downtown CBD (Chicago) 33.7 11.6 48.0 0.0 0.0 4.6 0.0 0.0 0.0 100.0Downtown CBD (New York) 23.6 9.3 40.4 0.0 0.6 5.6 0.0 0.0 0.0 100.0Downtown CBD (WI) 22.2 6.0 60.0 0.0 0.0 3.6 0.6 0.0 0.1 100.0Shopping Center 6.4 1.7 60.7 0.0 2.9 4.5 0.8 0.4 0.0 100.0Strip commercial 20.1 7.8 42.0 0.0 0.2 5.8 1.9 0.0 0.0 100.0Offices 15.5 6.7 38.2 0.0 0.0 38.7 0.0 0.0 0.0 100.0Shopping Center 16.1 7.0 38.2 0.0 0.0 31.9 0.0 0.0 0.0 100.0Downtown CBD 30.2 8.5 59.0 0.0 0.0 7.0 2.6 0.0 0.0 100.0Parking lot at park 28.5 18.8 25.0 0.0 0.0 32.2 0.0 0.0 0.0 100.0City Hall 0.0 0.0 0.0 0.0 0.0 0.0 0.0 0.0 0.0 100.0Downtown CBD (Los Angeles) 25.8 7.2 59.0 0.0 2.5 10.6 0.0 0.0 0.0 100.0Downtown CBD (San Francisco) 31.2 11.0 46.8 0.0 0.0 7.3 0.0 0.0 0.0 100.0Downtown CBD (San Jose) 21.0 6.8 51.0 0.0 35.0 0.0 0.0 0.0 0.0 100.0Commercial ‐ strip mall 15.0 4.8 54.0 0.0 0.0 14.0 0.0 0.0 0.0 100.0Commercial ‐ shopping center 13.4 3.8 58.0 0.0 0.0 11.7 0.0 0.0 0.0 100.0
average 19.3 7.2 44.6 4.3 2.6 11.4 0.4 0.0 0.0 100.0median 20.6 6.9 47.4 0.0 0.0 6.4 0.0 0.0 0.0 100.0
min 0.0 0.0 0.0 0.0 0.0 0.0 0.0 0.0 0.0 100.0max 33.7 18.8 60.7 68.0 35.0 38.7 2.6 0.4 0.1 100.0
st dev 9.7 4.4 16.0 17.0 8.7 12.0 0.8 0.1 0.0 0.0COV 0.5 0.6 0.4 4.0 3.4 1.0 2.1 4.0 4.0 0.0
count 16 16 16 16 16 16 16 16 16 16
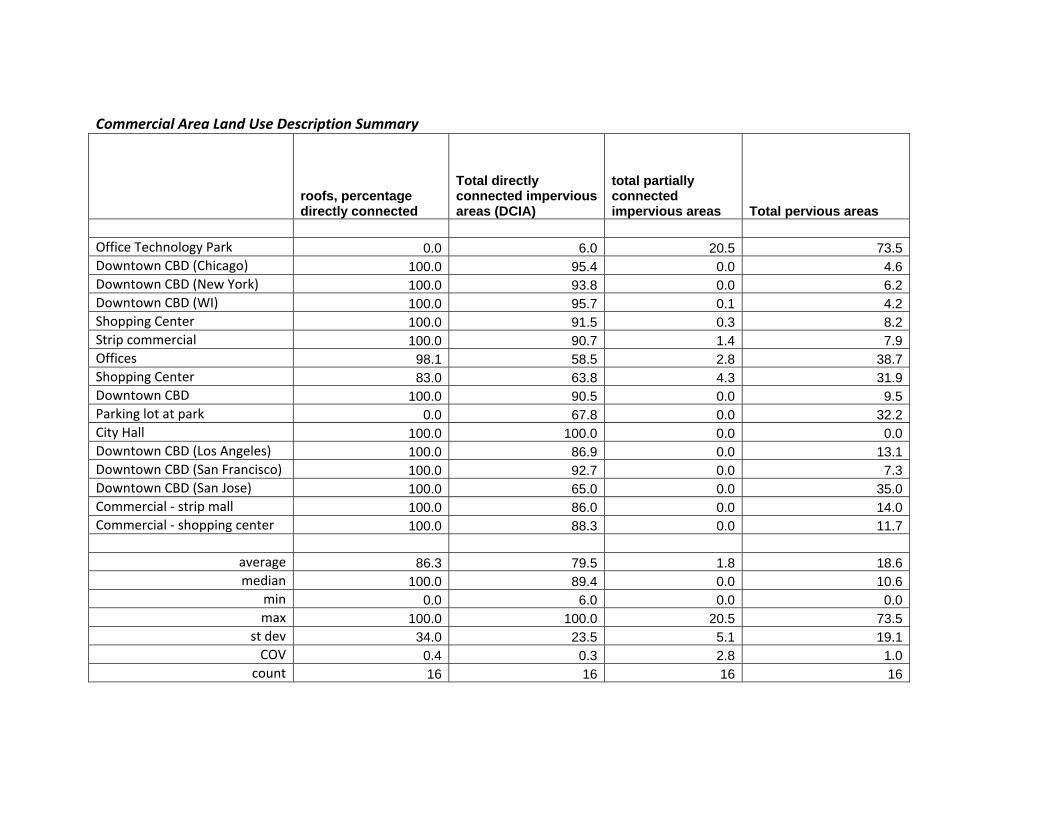
Commercial Area Land Use Description Summary
roofs, percentage directly connected
Total directly connected impervious areas (DCIA)
total partially connected impervious areas Total pervious areas
Office Technology Park 0.0 6.0 20.5 73.5Downtown CBD (Chicago) 100.0 95.4 0.0 4.6Downtown CBD (New York) 100.0 93.8 0.0 6.2Downtown CBD (WI) 100.0 95.7 0.1 4.2Shopping Center 100.0 91.5 0.3 8.2Strip commercial 100.0 90.7 1.4 7.9Offices 98.1 58.5 2.8 38.7Shopping Center 83.0 63.8 4.3 31.9Downtown CBD 100.0 90.5 0.0 9.5Parking lot at park 0.0 67.8 0.0 32.2City Hall 100.0 100.0 0.0 0.0Downtown CBD (Los Angeles) 100.0 86.9 0.0 13.1Downtown CBD (San Francisco) 100.0 92.7 0.0 7.3Downtown CBD (San Jose) 100.0 65.0 0.0 35.0Commercial ‐ strip mall 100.0 86.0 0.0 14.0Commercial ‐ shopping center 100.0 88.3 0.0 11.7
average 86.3 79.5 1.8 18.6median 100.0 89.4 0.0 10.6
min 0.0 6.0 0.0 0.0max 100.0 100.0 20.5 73.5
st dev 34.0 23.5 5.1 19.1COV 0.4 0.3 2.8 1.0
count 16 16 16 16

Industrial Area Site Descriptions Land Use Location land use EPA
Rain Zone
Pitched Roofs to Impervious‐C
Flat Roofs to Impervious‐C
Flat Roofs to Pervious‐D
(%) (%) (%)
Medium Industrial Toronto, Emery indus 1 31.1 0.0 0.0
Light Industry WI SLU file indus 1 2.6 20.5 2.3
Medium Industrial WI SLU file indus 1 1.9 16.7 4.5
Light Industrial Jefferson County, AL indus 3 0.0 5.5 5.4
Light industry Lincoln, NE indus 9 0.0 5.6 4.6
average average 7.1 9.7 3.4
median median 1.9 5.6 4.5
min min 0.0 0.0 0.0
max max 31.1 20.5 5.4
st dev st dev 13.5 8.6 2.2
COV COV 1.9 0.9 0.7
count count 5 5 5

Industrial Area Site Descriptions Land Use
Parking paved-D
Parking unpaved-
D Storage paved-C
Storage paved-D
Storage unpaved-
D Driveways paved-C
Driveways paved-D
Walkways-C
Walkways-D
(%) (%) (%) (%) (%) (%) (%) (%) (%) Medium Industrial 0.0 0.0 0.0 32.6 0.0 0.0 0.0 0.0 0.0Light Industry 0.0 6.3 0.0 0.0 0.0 2.6 0.0 1.3 0.0Medium Industrial 0.0 0.0 0.0 0.0 14.6 1.8 1.0 0.5 0.5Light Industrial 2.5 1.8 15.7 0.0 8.1 0.3 0.1 0.0 0.0Light industry 0.0 5.5 24.8 0.0 16.7 9.2 0.0 0.0 0.0
average 0.5 2.7 8.1 6.5 7.9 2.8 0.2 0.4 0.1median 0.0 1.8 0.0 0.0 8.1 1.8 0.0 0.0 0.0
min 0.0 0.0 0.0 0.0 0.0 0.0 0.0 0.0 0.0max 2.5 6.3 24.8 32.6 16.7 9.2 1.0 1.3 0.5
st dev 1.1 3.0 11.5 14.6 7.9 3.7 0.4 0.6 0.2COV 2.2 1.1 1.4 2.2 1.0 1.3 2.0 1.6 2.2
count 5 5 5 5 5 5 5 5 5
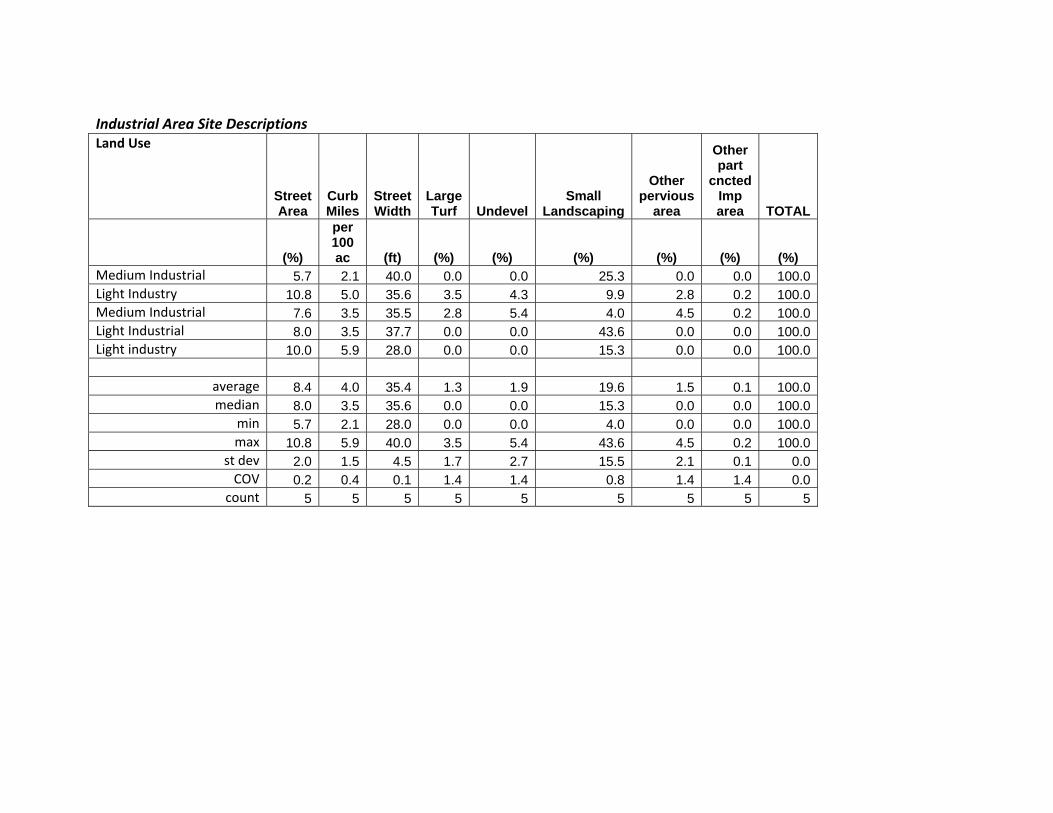
Industrial Area Site Descriptions Land Use
Street Area
Curb Miles
Street Width
Large Turf Undevel
Small Landscaping
Other pervious
area
Other part
cncted Imp area TOTAL
(%)
per 100 ac (ft) (%) (%) (%) (%) (%) (%)
Medium Industrial 5.7 2.1 40.0 0.0 0.0 25.3 0.0 0.0 100.0Light Industry 10.8 5.0 35.6 3.5 4.3 9.9 2.8 0.2 100.0Medium Industrial 7.6 3.5 35.5 2.8 5.4 4.0 4.5 0.2 100.0Light Industrial 8.0 3.5 37.7 0.0 0.0 43.6 0.0 0.0 100.0Light industry 10.0 5.9 28.0 0.0 0.0 15.3 0.0 0.0 100.0
average 8.4 4.0 35.4 1.3 1.9 19.6 1.5 0.1 100.0median 8.0 3.5 35.6 0.0 0.0 15.3 0.0 0.0 100.0
min 5.7 2.1 28.0 0.0 0.0 4.0 0.0 0.0 100.0max 10.8 5.9 40.0 3.5 5.4 43.6 4.5 0.2 100.0
st dev 2.0 1.5 4.5 1.7 2.7 15.5 2.1 0.1 0.0COV 0.2 0.4 0.1 1.4 1.4 0.8 1.4 1.4 0.0
count 5 5 5 5 5 5 5 5 5

Industrial Area Land Use Summary Land Use roofs, percentage
directly connected Total directly connected impervious areas (DCIA)
total partially connected impervious areas
Total pervious areas
Medium Industrial 100.0 42.1 32.6 25.3Light Industry 90.9 70.7 8.8 20.5Medium Industrial 80.5 62.5 20.8 16.7Light Industrial 50.6 38.4 18.0 43.6Light industry 54.9 57.9 26.8 15.3
average 75.4 54.3 21.4 24.3median 80.5 57.9 20.8 20.5
min 50.6 38.4 8.8 15.3max 100.0 70.7 32.6 43.6
st dev 21.8 13.7 9.0 11.5COV 0.3 0.3 0.4 0.5
count 5 5 5 5

Institutional Area Site Descriptions Land Use Location land use EPA
Rain Zone
Pitched Roofs to Impervious‐C
Pitched Roofs to Pervious‐D
Flat Roofs to Impervious‐C
Flat Roofs to Pervious‐D
(%) (%) (%) (%)
Inst ‐ Fairgrounds WI SLU file instit 1 8.4 0.6 5.4 0.0
Hospital WI SLU file instit 1 3.9 0.0 31.8 0.0
Schools WI SLU file instit 1 0.0 0.0 15.0 0.0
Schools Jefferson County, AL instit 3 0.0 0.0 6.0 4.8
Churches Jefferson County, AL instit 3 10.4 1.7 0.0 0.0
Institutional ‐ school Lincoln, NE instit 9 0.0 0.0 24.0 0.0
Institutional ‐ church Lincoln, NE instit 9 4.6 2.2 0.7 6.7
Institutional ‐ hospital Lincoln, NE instit 9 0.0 0.0 19.9 5.0
average 3.4 0.6 12.9 2.1
median 2.0 0.0 10.5 0.0
min 0.0 0.0 0.0 0.0
max 10.4 2.2 31.8 6.7
st dev 4.2 0.9 11.7 2.9
COV 1.2 1.6 0.9 1.4
count 8 8 8 8

Institutional Area Site Descriptions Land Use
Parking paved-C
Parking unpaved-D
Playground paved-D
Playground unpaved
Driveways paved-C
Driveways paved-D
Walkways-C
Walkways-D
(%) (%) (%) (%) (%) (%) (%) (%) Inst ‐ Fairgrounds 27.2 0.0 1.7 1.7 0.0 3.0 2.2 0.0 Hospital 20.8 0.6 0.0 0.0 6.1 0.0 2.8 0.0 Schools 10.7 0.0 17.3 0.0 0.0 2.0 2.9 0.0 Schools 5.7 0.0 0.0 15.4 0.1 0.1 0.0 0.0 Churches 24.5 4.8 0.0 0.0 0.4 0.4 0.0 0.0 Institutional ‐ school 25.5 0.0 0.0 0.0 1.5 0.0 0.5 0.5 Institutional ‐ church 22.6 0.0 0.0 0.2 2.3 0.3 0.4 0.5 Institutional ‐ hospital 35.6 0.0 0.0 0.2 1.1 0.0 0.0 0.2
average 21.6 0.7 2.4 2.2 1.4 0.7 1.1 0.2 median 23.6 0.0 0.0 0.1 0.7 0.2 0.5 0.0
min 5.7 0.0 0.0 0.0 0.0 0.0 0.0 0.0 max 35.6 4.8 17.3 15.4 6.1 3.0 2.9 0.5
st dev 9.4 1.7 6.1 5.4 2.1 1.1 1.3 0.2 COV 0.4 2.5 2.6 2.5 1.4 1.6 1.2 1.5
count 8 8 8 8 8 8 8 8

Institutional Area Site Descriptions Land Use
Street Area
Curb Miles
Street Width
Large Turf Undevel
Small Landscaping Isolated
Other pervious
area
Other part
cncted Imp area TOTAL
(%)
per 100 ac (ft) (%) (%) (%) (%) (%) (%) (%)
Inst ‐ Fairgrounds 12.1 5.8 34.5 5.3 1.8 26.6 0.0 2.7 1.3 100.0Hospital 10.9 5.3 34.0 5.3 0.2 14.0 1.1 2.5 0.0 100.0Schools 8.6 3.8 35.7 22.1 0.4 17.4 0.0 2.2 1.4 100.0Schools 4.2 1.8 38.5 13.9 1.0 48.8 0.0 0.0 0.0 100.0Churches 18.3 7.8 38.7 0.0 7.0 32.4 0.0 0.0 0.0 100.0Institutional ‐ school 4.5 1.8 42.0 34.8 0.0 8.7 0.0 0.0 0.0 100.0Institutional ‐ church 13.5 8.5 26.0 40.0 0.0 6.0 0.0 0.0 0.0 100.0Institutional ‐ hospital 5.1 2.9 29.0 16.4 0.0 16.5 0.0 0.0 0.0 100.0
average 9.6 4.7 34.8 17.2 1.3 21.3 0.1 0.9 0.3 100.0median 9.8 4.6 35.1 15.2 0.3 17.0 0.0 0.0 0.0 100.0
min 4.2 1.8 26.0 0.0 0.0 6.0 0.0 0.0 0.0 100.0max 18.3 8.5 42.0 40.0 7.0 48.8 1.1 2.7 1.4 100.0
st dev 5.0 2.6 5.3 14.4 2.4 14.1 0.4 1.3 0.6 0.0COV 0.5 0.5 0.2 0.8 1.8 0.7 2.8 1.4 1.9 0.0
count 8 8 8 8 8 8 8 8 8 8

Institutional Area Land Use Summary Land Use roofs, percentage
directly connected Total directly connected impervious areas (DCIA)
total partially connected impervious areas
Total pervious areas
Inst ‐ Fairgrounds 95.8 55.3 8.3 36.4Hospital 100.0 76.3 0.6 22.0Schools 100.0 37.2 20.7 42.1Schools 56.0 16.0 20.2 63.8Churches 85.7 53.6 6.9 39.5Institutional ‐ school 100.0 56.0 0.5 43.5Institutional ‐ church 37.3 44.1 9.9 46.0Institutional ‐ hospital 79.9 61.7 5.4 32.9
average 81.8 50.0 9.1 40.8median 90.8 54.5 7.6 40.8
min 37.3 16.0 0.5 22.0max 100.0 76.3 20.7 63.8
st dev 23.5 18.0 7.8 12.0COV 0.3 0.4 0.9 0.3
count 8 8 8 8

Open Space Land Use Characteristics Land Use Location land use EPA Rain
Zone Flat Roofs to Impervious‐C
Flat Roofs to Pervious‐D
Parking paved‐C
Parking paved‐D
Parking unpaved‐D
(%) (%) (%) (%) (%)
Open space WI SLU file open 1 0.6 0.0 0.0 0.0 0.0
Parks Jefferson County, AL open 3 0.0 0.0 16.1 0.0 0.0
Cemetery Jefferson County, AL open 3 0.0 1.0 0.0 9.2 1.8
Golf Courses Jefferson County, AL open 3 0.0 2.8 0.7 0.0 0.0
Vacant Jefferson County, AL open 3 0.0 0.0 0.0 0.0 0.0
average 0.1 0.7 3.4 1.8 0.4
median 0.0 0.0 0.0 0.0 0.0
min 0.0 0.0 0.0 0.0 0.0
max 0.6 2.8 16.1 9.2 1.8
st dev 0.3 1.2 7.1 4.1 0.8
COV 2.2 1.6 2.1 2.2 2.2
count 5 5 5 5 5

Open Space Land Use Characteristics Land Use
Playground paved-D
Playground unpaved
Driveways paved-C
Driveways paved-D
Driveway unpaved
Walkways-C
(%) (%) (%) (%) (%) (%) Open space 0.0 0.0 0.0 0.0 0.0 0.6Parks 8.3 24.8 0.1 0.1 0.0 0.0Cemetery 0.0 0.0 0.0 0.1 3.3 0.0Golf Courses 0.7 0.0 0.1 0.1 0.0 0.0Vacant 0.0 0.0 0.0 0.0 1.3 0.0
average 1.8 5.0 0.0 0.1 0.9 0.1median 0.0 0.0 0.0 0.1 0.0 0.0
min 0.0 0.0 0.0 0.0 0.0 0.0max 8.3 24.8 0.1 0.1 3.3 0.6
st dev 3.6 11.1 0.1 0.0 1.5 0.3COV 2.0 2.2 1.4 1.0 1.6 2.2
count 5 5 5 5 5 5

Open Space Land Use Characteristics Land Use
Street Area
Curb Miles
Street Width
Large Turf Undevel
Small Landscaping TOTAL
(%)
per 100 ac (ft) (%) (%) (%) (%)
Open space 3.9 2.2 27.5 0.6 94.3 0.0 100.0Parks 16.1 6.9 38.4 15.5 13.7 5.4 100.0Cemetery 6.9 5.1 22.5 69.5 0.0 8.3 100.0Golf Courses 1.2 0.5 38.1 75.7 0.0 18.8 100.0Vacant 4.8 2.1 38.4 26.9 67.0 0.0 100.0
average 6.6 3.4 33.0 37.6 35.0 6.5 100.0median 4.8 2.2 38.1 26.9 13.7 5.4 100.0
min 1.2 0.5 22.5 0.6 0.0 0.0 100.0max 16.1 6.9 38.4 75.7 94.3 18.8 100.0
st dev 5.7 2.6 7.5 33.3 43.1 7.8 0.0COV 0.9 0.8 0.2 0.9 1.2 1.2 0.0
count 5 5 5 5 5 5 5
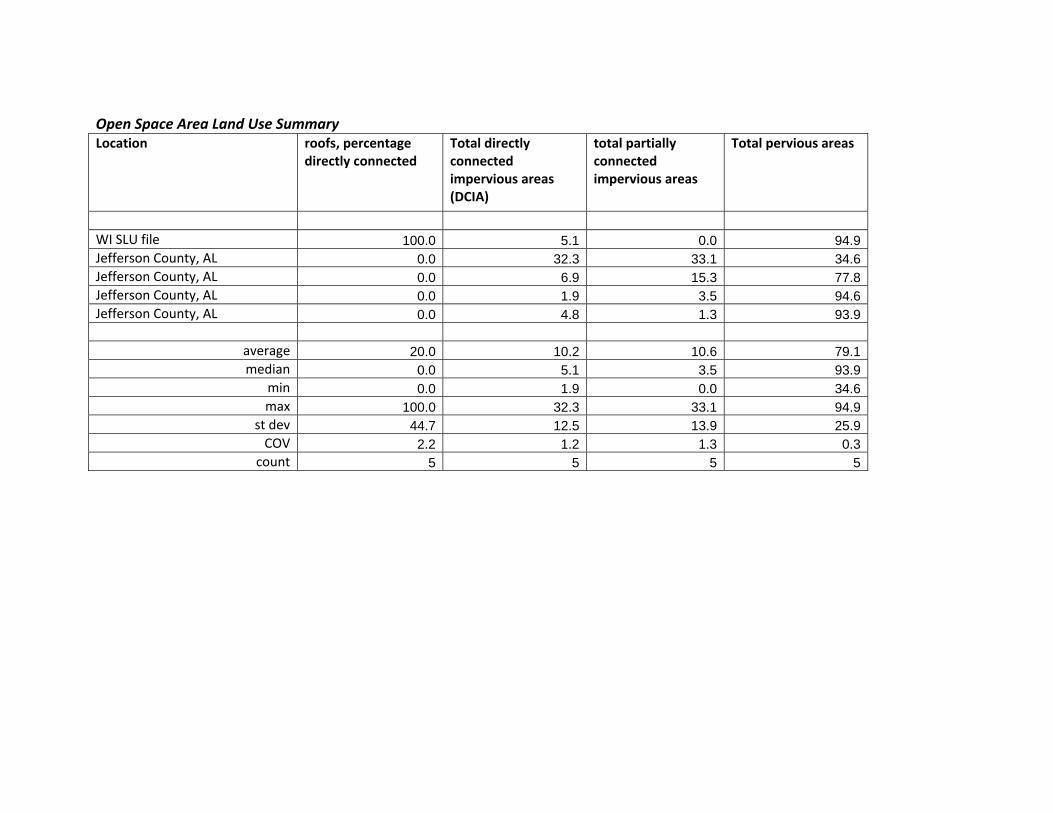
Open Space Area Land Use Summary Location roofs, percentage
directly connected Total directly connected impervious areas (DCIA)
total partially connected impervious areas
Total pervious areas
WI SLU file 100.0 5.1 0.0 94.9Jefferson County, AL 0.0 32.3 33.1 34.6Jefferson County, AL 0.0 6.9 15.3 77.8Jefferson County, AL 0.0 1.9 3.5 94.6Jefferson County, AL 0.0 4.8 1.3 93.9
average 20.0 10.2 10.6 79.1median 0.0 5.1 3.5 93.9
min 0.0 1.9 0.0 34.6max 100.0 32.3 33.1 94.9
st dev 44.7 12.5 13.9 25.9COV 2.2 1.2 1.3 0.3
count 5 5 5 5

36
Residential Area Land Use Characteristics
Land Use Location land use EPA Rain Zone
Pitched Roofs to Impervious‐C
Pitched Roofs to Pervious‐D
(%) (%)
Med. Dens.Res (61‐80) Millburn, NJ resid 1 4.5 11.0
Med. Dens.Res (61‐80) Toronto, Thistledowns, half swales
resid 1 0.0 12.6
Duplex resid WI SLU file resid 1 4.5 12.1
High Dens. Res., with alleys WI SLU file resid 1 13.6 10.6
High Dens. Res., no alleys WI SLU file resid 1 10.3 11.1
High rise resid WI SLU file resid 1 0.0 0.0
Low Density Res WI SLU file resid 1 1.9 6.1
Med Density Resid no alleys
WI SLU file resid 1 4.5 10.5
Mobile homes WI SLU file resid 1 0.0 0.0
Multi‐family res, no alleys WI SLU file resid 1 14.1 3.2
Suburban resid WI SLU file resid 1 0.0 2.6
High Dens. Res. Jefferson County, AL resid 3 4.6 8.1
Med. Dens.Res (<1960) Jefferson County, AL resid 3 4.0 5.5
Med. Dens.Res (61‐80) Jefferson County, AL resid 3 2.2 6.6
Med. Dens.Res (>1980) Jefferson County, AL resid 3 6.6 3.2
Low Dens. Res. Jefferson County, AL resid 3 0.9 2.9
Apartments Jefferson County, AL resid 3 3.6 16.0
Multi Family Jefferson County, AL resid 3 10.8 6.7
Med. Dens.Res (<1960) Kansas City, MO resid 4 1.9 10.6
Med. Dens.Res (61‐80) San Jose, CA resid 6 3.0 15.0
Med. Dens.Res (<1960) Bellevue, WA; Surrey Downs resid 7 2.9 14.2
Med. Dens.Res (<1960) Bellevue, WA; Lake Hills resid 7 3.2 15.7
Low density res Lincoln, NE resid 9 1.8 13.1
Med density res <1960 Lincoln, NE resid 9 2.8 14.7
Med density res 1960 ‐ 1980
Lincoln, NE resid 9 4.4 13.7
average 4.2 9.0
median 3.2 10.6
min 0.0 0.0
max 14.1 16.0
st dev 4.0 5.0
COV 0.9 0.6
count 25 25

37
Residential Area Land Use Characteristics Land Use
Flat Roofs to
Impervious-C
Flat Roofs to Pervious
-D Parking paved-C
Parking paved-D
Parking unpaved-
D Playground
paved-D (%) (%) (%) (%) (%) (%) Med. Dens.Res (61‐80) 0.0 0.4 1.0 1.0 0.0 0.0Med. Dens.Res (61‐80) 15.0 0.0 0.0 0.0 0.0 0.0Duplex resid 0.0 0.0 0.0 0.0 0.0 0.0High Dens. Res., with alleys 0.0 0.0 0.4 0.0 0.0 0.0High Dens. Res., no alleys 0.0 0.0 0.0 0.0 0.0 0.0High rise resid 19.0 0.0 21.8 0.0 0.0 0.0Low Density Res 0.0 0.0 0.1 0.0 0.0 0.0Med Density Resid no alleys 0.0 0.0 0.2 0.0 0.0 0.0Mobile homes 16.9 0.0 13.4 0.0 0.6 0.0Multi‐family res, no alleys 3.4 0.0 10.8 0.0 0.5 0.1Suburban resid 0.0 0.0 0.0 0.1 0.0 0.0High Dens. Res. 0.0 0.0 0.0 0.0 0.0 0.0Med. Dens.Res (<1960) 0.0 0.0 0.0 0.0 0.0 0.0Med. Dens.Res (61‐80) 0.0 0.0 0.0 0.0 0.0 0.0Med. Dens.Res (>1980) 0.0 0.0 0.0 0.0 0.0 0.0Low Dens. Res. 0.0 0.0 0.0 0.0 0.0 0.0Apartments 0.0 0.0 6.6 3.9 0.0 0.8Multi Family 0.0 0.0 8.7 0.0 0.0 0.2Med. Dens.Res (<1960) 0.0 0.0 1.6 0.0 0.0 0.0Med. Dens.Res (61‐80) 0.0 0.0 3.5 3.5 0.0 0.0Med. Dens.Res (<1960) 0.0 0.0 2.0 2.0 0.0 0.0Med. Dens.Res (<1960) 0.0 0.0 0.1 0.1 0.0 0.0Low density res 0.0 0.0 0.0 0.0 0.0 0.0Med density res <1960 0.0 0.0 0.0 0.0 1.5 0.0Med density res 1960 ‐ 1980 0.0 0.0 0.1 0.0 2.1 0.0
average 2.2 0.0 2.8 0.4 0.2 0.0median 0.0 0.0 0.1 0.0 0.0 0.0
min 0.0 0.0 0.0 0.0 0.0 0.0max 19.0 0.4 21.8 3.9 2.1 0.8
st dev 5.6 0.1 5.4 1.1 0.5 0.2COV 2.6 5.0 1.9 2.5 2.7 3.8
count 25 25 25 25 25 25
38
Residential Area Land Use Characteristics Land Use
Driveways paved-C
Driveways paved-D
Driveway unpaved
Walkways-C
Walkways-D
(%) (%) (%) (%) (%) Med. Dens.Res (61‐80) 5.3 5.3 0.0 0.6 2.4Med. Dens.Res (61‐80) 2.0 2.0 0.0 1.9 1.9Duplex resid 5.3 0.0 0.0 4.0 0.0High Dens. Res., with alleys 0.7 0.0 0.0 3.2 3.2High Dens. Res., no alleys 14.1 0.0 0.0 2.0 2.0High rise resid 0.9 0.0 0.0 3.4 1.2Low Density Res 3.2 1.3 0.0 0.4 0.4Med Density Resid no alleys 5.6 1.6 0.0 1.1 1.1Mobile homes 12.3 0.0 0.0 0.5 0.5Multi‐family res, no alleys 1.9 0.9 0.0 2.1 2.1Suburban resid 1.6 1.2 0.0 0.0 0.1High Dens. Res. 1.6 1.9 0.0 0.0 0.0Med. Dens.Res (<1960) 1.1 2.0 0.0 0.0 0.0Med. Dens.Res (61‐80) 1.3 1.9 0.0 0.0 0.0Med. Dens.Res (>1980) 1.1 1.1 0.0 0.0 0.0Low Dens. Res. 0.2 0.8 0.0 0.0 0.0Apartments 0.5 1.0 0.0 0.0 0.0Multi Family 0.6 0.6 0.0 0.1 0.0Med. Dens.Res (<1960) 4.1 4.0 0.8 1.2 1.3Med. Dens.Res (61‐80) 0.0 0.0 0.0 2.3 2.3Med. Dens.Res (<1960) 2.6 2.6 0.0 0.0 0.0Med. Dens.Res (<1960) 2.5 2.5 0.0 0.0 0.0Low density res 2.7 2.7 0.0 0.0 0.4Med density res <1960 3.5 3.5 0.0 0.1 0.4Med density res 1960 ‐ 1980 3.1 3.1 0.0 0.0 0.3
average 3.1 1.6 0.0 0.9 0.8median 2.0 1.3 0.0 0.1 0.4
min 0.0 0.0 0.0 0.0 0.0max 14.1 5.3 0.8 4.0 3.2
st dev 3.4 1.4 0.2 1.2 1.0COV 1.1 0.9 5.0 1.4 1.2
count 25 25 25 25 25

39
Residential Area Land Use Characteristics Land Use
Street Area
Curb Miles
Street Width
Large Turf Undevel
(%)
per 100 ac (ft) (%) (%)
Med. Dens.Res (61‐80) 12.3 6.2 33.0 0.0 1.7 Med. Dens.Res (61‐80) 9.5 4.5 35.0 0.0 0.0 Duplex resid 13.3 7.0 31.4 0.0 0.0 High Dens. Res., with alleys 20.2 12.3 27.0 0.0 0.3 High Dens. Res., no alleys 13.5 7.3 30.5 0.0 0.0 High rise resid 18.1 10.0 30.0 0.0 9.5 Low Density Res 7.0 4.5 27.8 0.0 4.4 Med Density Resid no alleys 12.1 6.8 31.2 0.2 0.4 Mobile homes 3.6 0.5 120.0 0.0 4.5 Multi‐family res, no alleys 14.6 7.8 30.0 1.4 3.0 Suburban resid 4.0 2.5 26.0 0.0 5.5 High Dens. Res. 7.9 3.4 37.7 0.0 3.9 Med. Dens.Res (<1960) 5.6 2.5 37.2 0.0 0.0 Med. Dens.Res (61‐80) 6.7 2.9 38.2 0.0 0.2 Med. Dens.Res (>1980) 7.5 3.3 38.3 0.0 4.8 Low Dens. Res. 5.3 2.3 38.2 0.0 8.4 Apartments 9.8 4.1 39.2 0.0 3.3 Multi Family 7.3 3.2 37.8 0.0 6.9 Med. Dens.Res (<1960) 9.4 5.9 26.2 0.0 0.0 Med. Dens.Res (61‐80) 18.0 6.2 48.0 0.0 11.0 Med. Dens.Res (<1960) 10.3 5.8 29.4 2.0 1.6 Med. Dens.Res (<1960) 11.7 6.9 28.0 3.4 0.0 Low density res 13.2 7.9 28.0 0.0 0.0 Med density res <1960 15.1 10.0 25.0 0.0 0.0 Med density res 1960 ‐ 1980 10.4 8.4 23.0 0.0 0.0
average 10.7 5.7 35.8 0.3 2.8 median 10.3 5.9 31.2 0.0 1.6
min 3.6 0.5 23.0 0.0 0.0 max 20.2 12.3 120.0 3.4 11.0
st dev 4.4 2.8 18.5 0.8 3.4 COV 0.4 0.5 0.5 2.9 1.2
count 25 25 25 25 25
40
Residential Area Land Use Characteristics Land Use
Small Landscaping Isolated
Other pervious
area
Other directly
connected Imp area
Other part
cncted Imp area TOTAL
(%) (%) (%) (%) (%) (%) Med. Dens.Res (61‐80) 54.5 0.0 0.0 0.0 0.0 100.0Med. Dens.Res (61‐80) 55.1 0.0 0.0 0.0 0.0 100.0Duplex resid 60.8 0.0 0.0 0.0 0.0 100.0High Dens. Res., with alleys 41.5 0.0 6.3 0.0 0.0 100.0High Dens. Res., no alleys 41.0 0.1 5.9 0.0 0.0 100.0High rise resid 22.9 0.0 3.2 0.0 0.0 100.0Low Density Res 74.7 0.2 0.2 0.0 0.1 100.0Med Density Resid no alleys 58.5 0.2 4.0 0.0 0.0 100.0Mobile homes 44.7 1.0 0.0 2.0 0.0 100.0Multi‐family res, no alleys 38.0 0.1 3.8 0.0 0.0 100.0Suburban resid 84.8 0.1 0.0 0.0 0.0 100.0High Dens. Res. 72.2 0.0 0.0 0.0 0.0 100.0Med. Dens.Res (<1960) 81.7 0.0 0.0 0.0 0.0 100.0Med. Dens.Res (61‐80) 81.1 0.0 0.0 0.0 0.0 100.0Med. Dens.Res (>1980) 75.7 0.0 0.0 0.0 0.0 100.0Low Dens. Res. 81.5 0.0 0.0 0.0 0.0 100.0Apartments 54.5 0.0 0.0 0.0 0.0 100.0Multi Family 58.3 0.0 0.0 0.0 0.0 100.0Med. Dens.Res (<1960) 65.1 0.0 0.0 0.0 0.0 100.0Med. Dens.Res (61‐80) 41.5 0.0 0.0 0.0 0.0 100.0Med. Dens.Res (<1960) 59.9 0.0 0.0 0.0 0.0 100.0Med. Dens.Res (<1960) 60.9 0.0 0.0 0.0 0.0 100.0Low density res 66.1 0.0 0.0 0.0 0.0 100.0Med density res <1960 58.4 0.0 0.0 0.0 0.0 100.0Med density res 1960 ‐ 1980 62.5 0.3 0.0 0.0 0.0 100.0
average 59.8 0.1 0.9 0.1 0.0 100.0median 59.9 0.0 0.0 0.0 0.0 100.0
min 22.9 0.0 0.0 0.0 0.0 100.0max 84.8 1.0 6.3 2.0 0.1 100.0
st dev 15.7 0.2 2.0 0.4 0.0 0.0COV 0.3 2.5 2.1 5.0 5.0 0.0
count 25 25 25 25 25 25

41
Residential Area Land Use Characteristics Summary Land Use roofs,
percentage directly connected
Total directly connected impervious areas (DCIA)
total partially connected impervious areas
Total pervious areas
Med. Dens.Res (61‐80) 28.3 23.7 20.1 56.2Med. Dens.Res (61‐80) 54.3 28.4 16.5 55.1Duplex resid 27.1 27.1 12.1 60.8High Dens. Res., with alleys 56.2 38.1 13.8 48.1High Dens. Res., no alleys 48.1 39.9 13.1 46.9High rise resid 100.0 63.2 1.2 35.6Low Density Res 23.8 12.6 7.9 79.3Med Density Resid no alleys 30.0 23.5 13.2 63.1Mobile homes 100.0 48.7 1.1 49.2Multi‐family res, no alleys 84.5 46.9 6.8 46.2Suburban resid 0.0 5.6 4.0 90.3High Dens. Res. 36.2 14.0 10.0 76.1Med. Dens.Res (<1960) 41.9 10.7 7.5 81.7Med. Dens.Res (61‐80) 24.8 10.3 8.5 81.2Med. Dens.Res (>1980) 67.0 15.2 4.3 80.5Low Dens. Res. 23.0 6.4 3.7 89.8Apartments 18.4 20.5 21.7 57.8Multi Family 61.8 27.4 7.4 65.2Med. Dens.Res (<1960) 15.0 18.1 16.8 65.1Med. Dens.Res (61‐80) 16.7 26.8 20.8 52.5Med. Dens.Res (<1960) 17.0 17.8 18.8 63.5Med. Dens.Res (<1960) 17.0 17.5 18.2 64.3Low density res 12.1 17.7 16.2 66.1Med density res <1960 16.0 21.5 20.1 58.4Med density res 1960 ‐ 1980 24.3 18.0 19.2 62.5
average 37.7 24.0 12.1 63.8median 27.1 20.5 13.1 63.1
min 0.0 5.6 1.1 35.6max 100.0 63.2 21.7 90.3
st dev 27.3 14.0 6.6 14.3COV 0.7 0.6 0.5 0.2
count 25 25 25 25

42
Freeway and Highway Land Use Characteristics Curb Miles
per 100 ac Freeways with swales Jefferson County, AL freeways 3 8.9 with swales 30,000 AADT Freeways with swales WI SLU file freeways 1 12.4 with swales 30,000 AADT Freeway 4 lane urban type 5 WisDOT 120 ft ROW freeways 1 6.8 curb and gutters 30,000 ADT Highway 2 lane rural type 7 WisDOT 66 ft ROW freeways 1 12.5 curb and gutters 7,500 ADT
average 10.2
median 10.7
min 6.8
max 12.5
st dev 2.8
COV 0.3
count 4
43
Freeway and Highway Land Use Characteristics
Street Area -
connected - C
Street Area Disconnected
- D
Shoulder Connected
- C
Shoulder Disconnected-
D Landscap
Grass area at
the medium total
(%) (%) (%) (%) Freeways with swales 0.0 46.8 0.0 12.3 32.1 8.8 100.0Freeways with swales 0.0 50.5 0.0 0.0 49.5 0.0 100.0Freeway 4 lane urban 56.3 0 18.9 0 24.8 0 100.00Highway 2 lane rural 36.8 0 15.7 0 47.5 0 100.00
average 23.3 24.3 8.7 3.1 38.5 2.2 100.0median 18.4 23.4 7.9 0.0 39.8 0.0 100.0
min 0.0 0.0 0.0 0.0 24.8 0.0 100.0max 56.3 50.5 18.9 12.3 49.5 8.8 100.0
st dev 28.0 28.1 10.1 6.2 12.0 4.4 0.0COV 1.2 1.2 1.2 2.0 0.3 2.0 0.0
count 4 4 4 4 4 4 4

44
Freeway Land Use Characteristics Summary
Total directly connected impervious areas (DCIA)
total partially connected impervious areas
Total pervious areas
Freeways with swales 0.0 59.1 40.9Freeways with swales 0.0 50.5 49.5Freeway 4 lane urban 75.2 0.0 24.8Highway 2 lane rural 52.5 0.0 47.5
average 31.9 27.4 40.7median 26.3 25.3 44.2
min 0.0 0.0 24.8max 75.2 59.1 49.5
st dev 38.0 31.8 11.2COV 1.2 1.2 0.3
count 4 4 4
45
Appendix B. Observed vs. Modeled Stormwater Characteristics
Volumetric Runoff Coefficients
Rv Regression Statistics
Multiple R 0.95
R Square 0.91
Adjusted R Square 0.90
Standard Error 0.14
Observations 91
ANOVA
df SS MS F Significance F
Regression 1.00 16.78 16.78 882.15 5.80E‐48
Residual 90.00 1.71 0.02
Total 91.00 18.49
Coefficients Standard Error t Stat P‐value Lower 95% Upper 95%
Intercept 0.00 #N/A #N/A #N/A #N/A #N/A
X Variable 1 0.93 0.03 29.70 2.74E‐48 0.87 0.99

46
Total Suspended Solids
TSS Regression Statistics
Multiple R 0.93
R Square 0.86
Adjusted R Square 0.85
Standard Error 69.10
Observations 114
ANOVA
df SS MS F Significance F
Regression 1 3247990 3247990 680.19 2.14E‐49
Residual 113 539589 4775
Total 114 3787579
Coefficients Standard Error
t Stat P‐value Lower 95% Upper 95%
Intercept 0.00 #N/A #N/A #N/A #N/A #N/A
X Variable 1 0.90 0.03 26.08 1.23E‐49 0.83 0.97
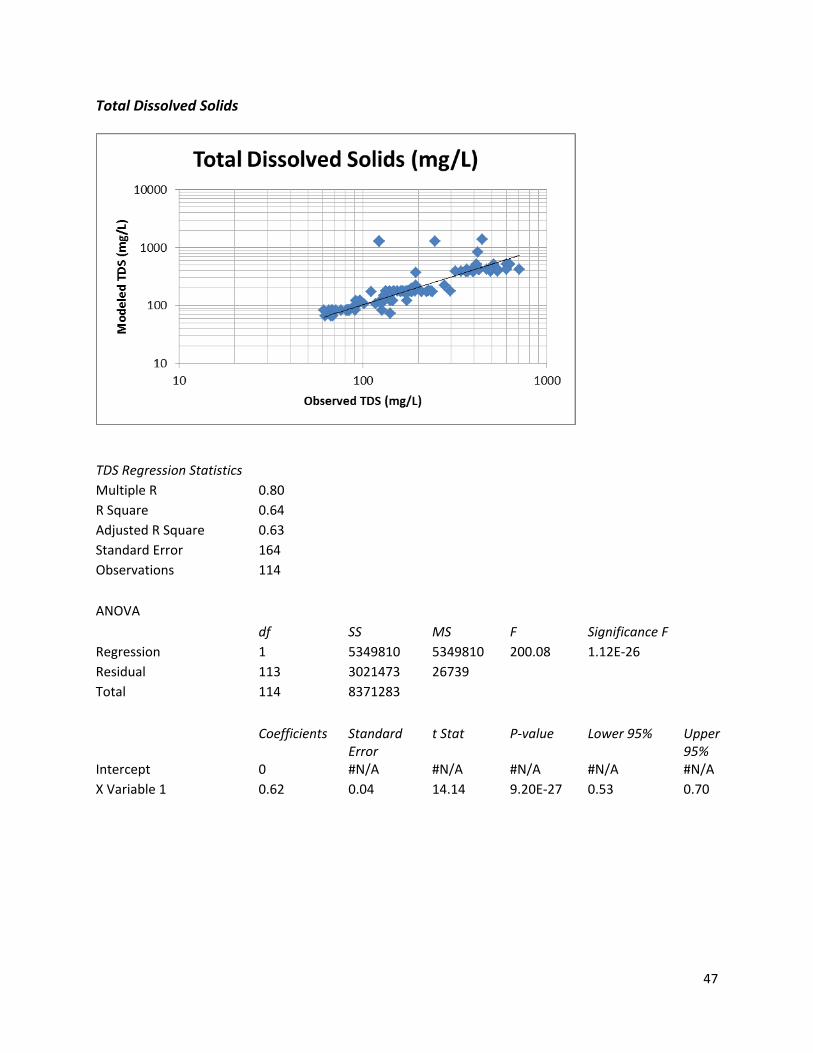
47
Total Dissolved Solids
TDS Regression Statistics
Multiple R 0.80
R Square 0.64
Adjusted R Square 0.63
Standard Error 164
Observations 114
ANOVA
df SS MS F Significance F
Regression 1 5349810 5349810 200.08 1.12E‐26
Residual 113 3021473 26739
Total 114 8371283
Coefficients Standard Error
t Stat P‐value Lower 95% Upper 95%
Intercept 0 #N/A #N/A #N/A #N/A #N/A
X Variable 1 0.62 0.04 14.14 9.20E‐27 0.53 0.70

48
Chemical Oxygen Demand
COD Regression Statistics
Multiple R 0.97
R Square 0.94
Adjusted R Square 0.93
Standard Error 20.37
Observations 114
ANOVA
df SS MS F Significance F
Regression 1 772664 772664 1861 1.29E‐71
Residual 113 46904 415
Total 114 819568
Coefficients Standard Error t Stat P‐value Lower 95% Upper 95%
Intercept 0.00 #N/A #N/A #N/A #N/A #N/A
X Variable 1 1.00 0.02 43.14 4.93E‐72 0.95 1.04

49
Total Phosphorus
TP Regression Statistics
Multiple R 0.64
R Square 0.40
Adjusted R Square 0.40
Standard Error 0.55
Observations 114
ANOVA
df SS MS F Significance F
Regression 1 24 23.55 76.75 2.36E‐14
Residual 113 35 0.31
Total 114 58
Coefficients Standard Error
t Stat P‐value Lower 95% Upper 95%
Intercept 0.00 #N/A #N/A #N/A #N/A #N/A
X Variable 1 0.88 0.10 8.76 2.23E‐14 0.68 1.08
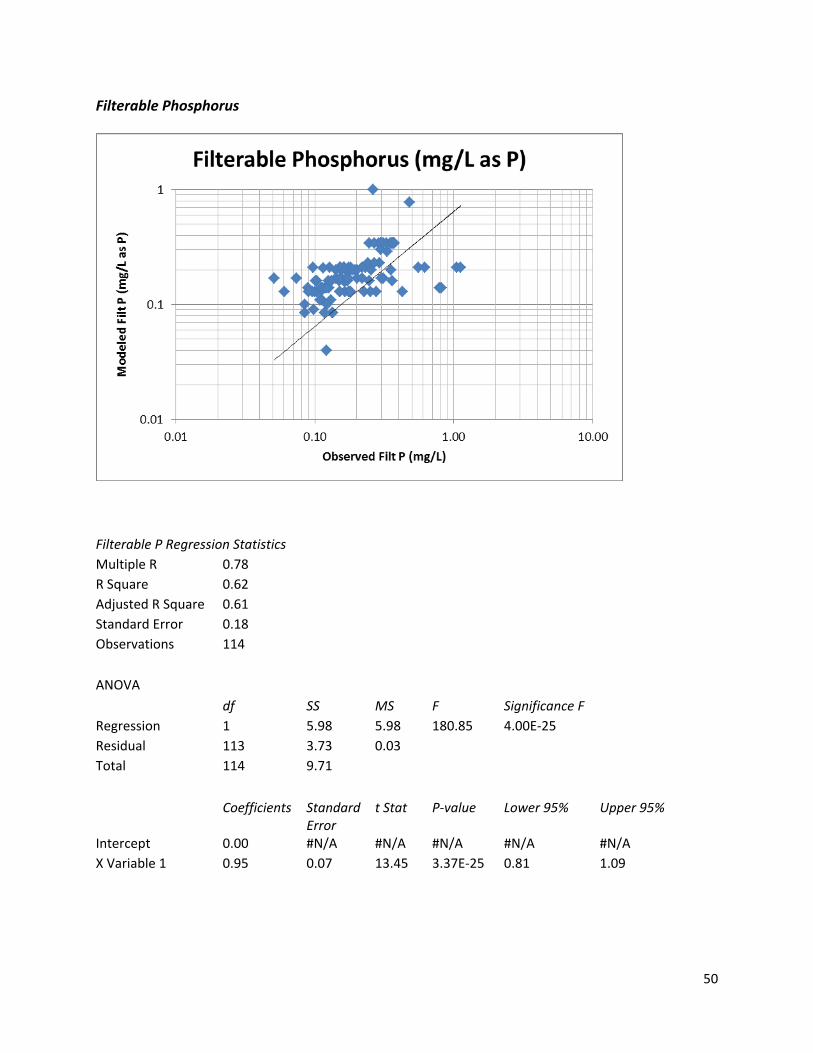
50
Filterable Phosphorus
Filterable P Regression Statistics
Multiple R 0.78
R Square 0.62
Adjusted R Square 0.61
Standard Error 0.18
Observations 114
ANOVA
df SS MS F Significance F
Regression 1 5.98 5.98 180.85 4.00E‐25
Residual 113 3.73 0.03
Total 114 9.71
Coefficients Standard Error
t Stat P‐value Lower 95% Upper 95%
Intercept 0.00 #N/A #N/A #N/A #N/A #N/A
X Variable 1 0.95 0.07 13.45 3.37E‐25 0.81 1.09

51
Total Kjeldahl Nitrogen
TKN Regression Statistics
Multiple R 0.90
R Square 0.81
Adjusted R Square 0.80
Standard Error 1.09
Observations 114
ANOVA
df SS MS F Significance F Regression 1 581 580.70 491.96 8.71E‐43 Residual 113 133 1.18 Total 114 714 Coefficients Standard
Error t Stat P‐value Lower 95% Upper 95%
Intercept 0.00 #N/A #N/A #N/A #N/A #N/A X Variable 1 1.06 0.05 22.18 5.62E‐43 0.96 1.15

52
Nitrite plus Nitrate Nitrogen
Nitrate + Nitrite Regression Statistics
Multiple R 0.85 R Square 0.72 Adjusted R Square 0.71 Standard Error 0.60 Observations 114 ANOVA df SS MS F Significance F Regression 1 108 108.20 295.89 3.24E‐33 Residual 113 41 0.37 Total 114 150 Coefficients Standard Error t Stat P‐value Lower 95% Upper 95% Intercept 0.00 #N/A #N/A #N/A #N/A #N/A X Variable 1 0.70 0.04 17.20 2.43E‐33 0.62 0.78

53
Total Copper
Total Copper Regression Statistics
Multiple R 0.78 R Square 0.61 Adjusted R Square
0.60
Standard Error 29.60 Observations 114 ANOVA df SS MS F Significance F Regression 1 154868 154868 176.78 8.81E‐25 Residual 113 98994 876.05 Total 114 253862 Coefficients Standard
Error t Stat P‐value Lower 95% Upper 95%
Intercept 0.00 #N/A #N/A #N/A #N/A #N/A X Variable 1 0.59 0.04 13.30 7.44E‐25 0.50 0.67
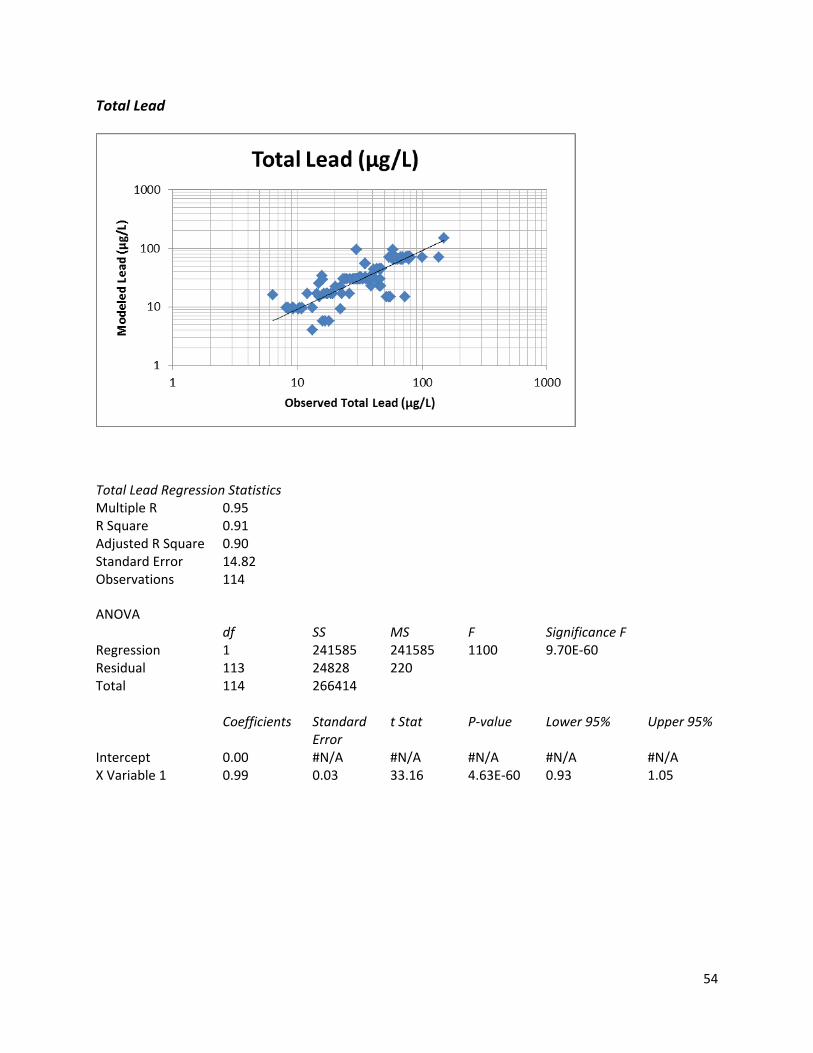
54
Total Lead
Total Lead Regression Statistics Multiple R 0.95 R Square 0.91 Adjusted R Square 0.90 Standard Error 14.82 Observations 114 ANOVA df SS MS F Significance F Regression 1 241585 241585 1100 9.70E‐60 Residual 113 24828 220 Total 114 266414 Coefficients Standard
Error t Stat P‐value Lower 95% Upper 95%
Intercept 0.00 #N/A #N/A #N/A #N/A #N/A X Variable 1 0.99 0.03 33.16 4.63E‐60 0.93 1.05
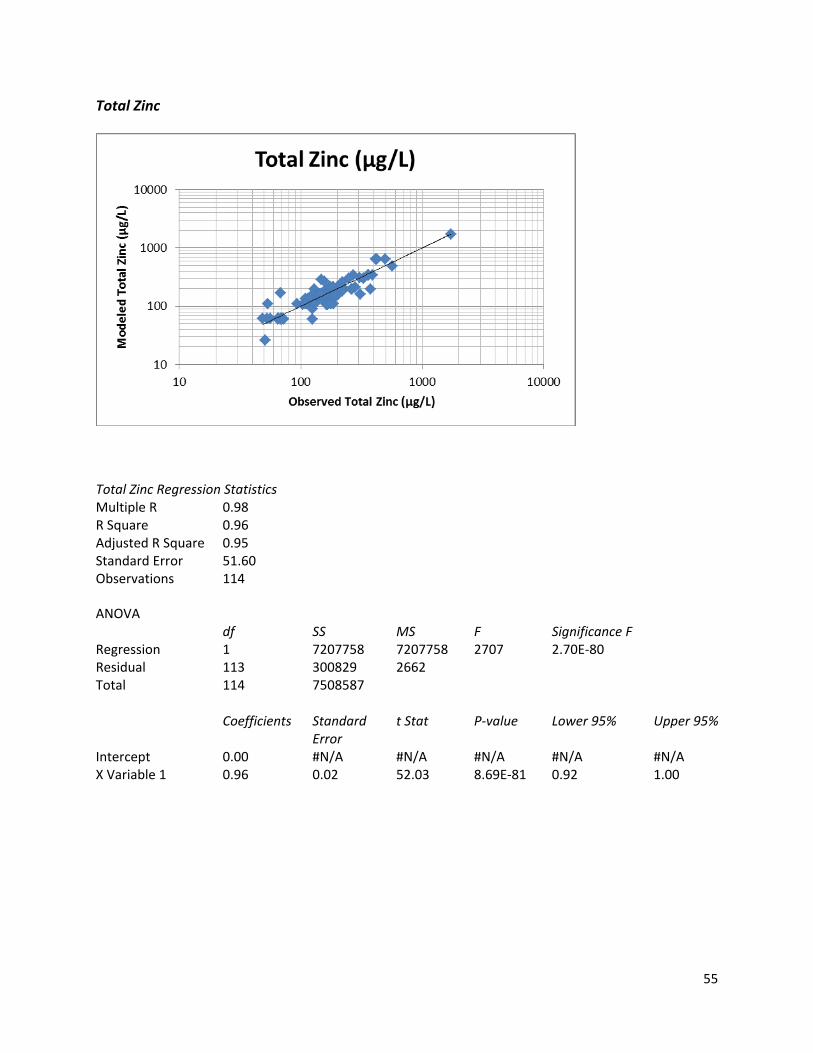
55
Total Zinc
Total Zinc Regression Statistics Multiple R 0.98 R Square 0.96 Adjusted R Square 0.95 Standard Error 51.60 Observations 114 ANOVA df SS MS F Significance F Regression 1 7207758 7207758 2707 2.70E‐80 Residual 113 300829 2662 Total 114 7508587 Coefficients Standard
Error t Stat P‐value Lower 95% Upper 95%
Intercept 0.00 #N/A #N/A #N/A #N/A #N/A X Variable 1 0.96 0.02 52.03 8.69E‐81 0.92 1.00

56
Fecal Coliform Bacteria
Fecal Coliforms Regression Statistics
Multiple R 0.83 R Square 0.68 Adjusted R Square 0.68 Standard Error 52044 Observations 114 ANOVA df SS MS F Significance F Regression 1 663022202118 663022202118 245 6.00E‐30 Residual 113 306069843794 2708582688 Total 114 969092045912 Coefficients Standard Error t Stat P‐value Lower 95% Upper 95% Intercept 0.00 #N/A #N/A #N/A #N/A #N/A X Variable 1 0.74 0.05 15.65 4.72E‐30 0.65 0.83
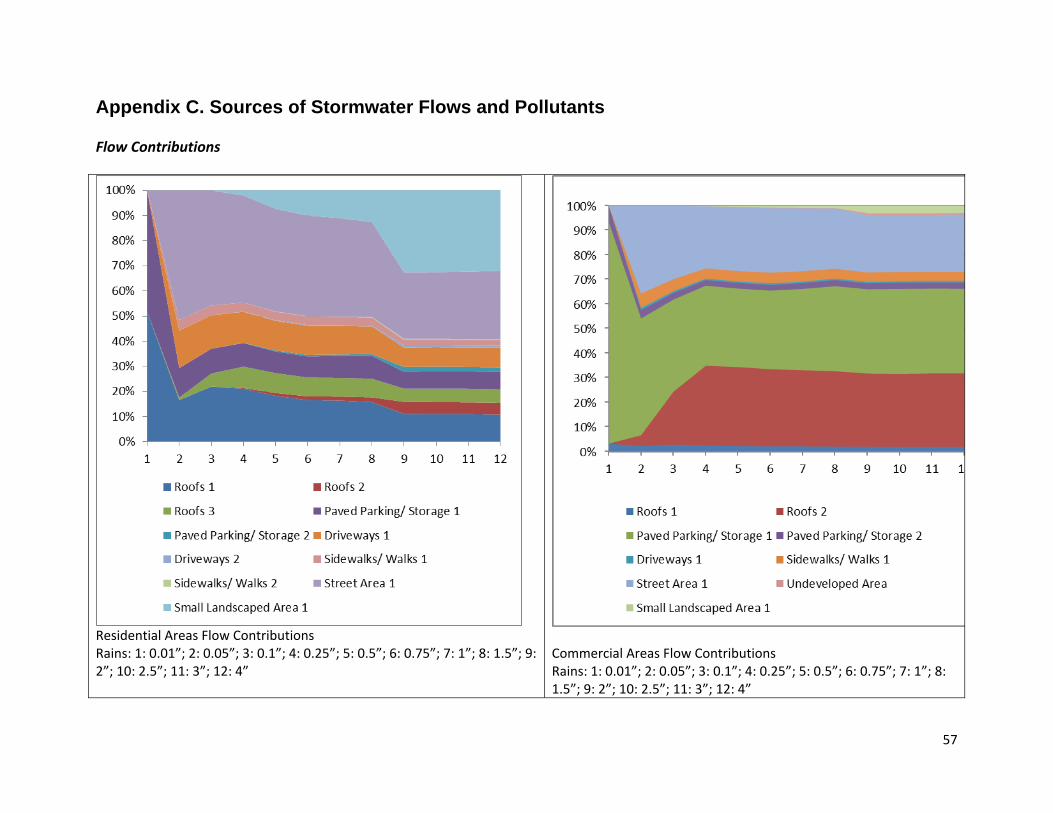
57
Appendix C. Sources of Stormwater Flows and Pollutants Flow Contributions
Residential Areas Flow Contributions Rains: 1: 0.01”; 2: 0.05”; 3: 0.1”; 4: 0.25”; 5: 0.5”; 6: 0.75”; 7: 1”; 8: 1.5”; 9: 2”; 10: 2.5”; 11: 3”; 12: 4”
Commercial Areas Flow Contributions Rains: 1: 0.01”; 2: 0.05”; 3: 0.1”; 4: 0.25”; 5: 0.5”; 6: 0.75”; 7: 1”; 8: 1.5”; 9: 2”; 10: 2.5”; 11: 3”; 12: 4”
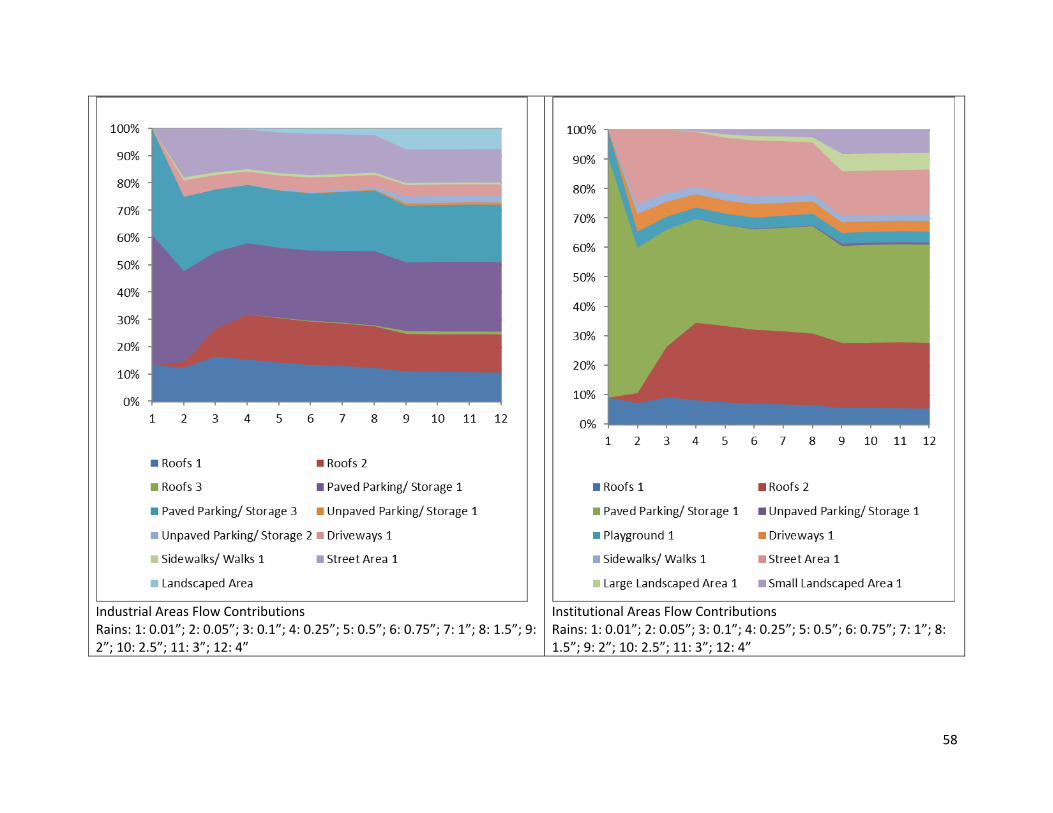
58
Industrial Areas Flow Contributions Rains: 1: 0.01”; 2: 0.05”; 3: 0.1”; 4: 0.25”; 5: 0.5”; 6: 0.75”; 7: 1”; 8: 1.5”; 9: 2”; 10: 2.5”; 11: 3”; 12: 4”
Institutional Areas Flow Contributions Rains: 1: 0.01”; 2: 0.05”; 3: 0.1”; 4: 0.25”; 5: 0.5”; 6: 0.75”; 7: 1”; 8: 1.5”; 9: 2”; 10: 2.5”; 11: 3”; 12: 4”

59
Office Technology Park Areas Flow Contributions Rains: 1: 0.05”; 2: 0.1”; 3: 0.25”; 4: 0.5”; 5: 0.75”; 6: 1”; 7: 1.5”; 8: 2”; 9: 2.5”; 10:3”; 11: 4” (no runoff expected for 0.01 inch rains)
Open Space Areas Flow Contributions Rains: 1: 0.01”; 2: 0.05”; 3: 0.1”; 4: 0.25”; 5: 0.5”; 6: 0.75”; 7: 1”; 8: 1.5”; 9: 2”; 10: 2.5”; 11: 3”; 12: 4”

60
Urban Freeway Areas Flow Contributions Rains: 1: 0.01”; 2: 0.05”; 3: 0.1”; 4: 0.25”; 5: 0.5”; 6: 0.75”; 7: 1”; 8: 1.5”; 9: 2”; 10: 2.5”; 11: 3”; 12: 4”
Rural Highway Areas Flow Contributions Rains: 1: 0.01”; 2: 0.05”; 3: 0.1”; 4: 0.25”; 5: 0.5”; 6: 0.75”; 7: 1”; 8: 1.5”; 9: 2”; 10: 2.5”; 11: 3”; 12: 4”

61
Total Suspended Solids Mass Contributions
Residential Areas Total Suspended Solids Mass Contributions Rains: 1: 0.01”; 2: 0.05”; 3: 0.1”; 4: 0.25”; 5: 0.5”; 6: 0.75”; 7: 1”; 8: 1.5”; 9: 2”; 10: 2.5”; 11: 3”; 12: 4”
Commercial Areas Total Suspended Solids Mass Contributions Rains: 1: 0.01”; 2: 0.05”; 3: 0.1”; 4: 0.25”; 5: 0.5”; 6: 0.75”; 7: 1”; 8: 1.5”; 9: 2”; 10: 2.5”; 11: 3”; 12: 4”
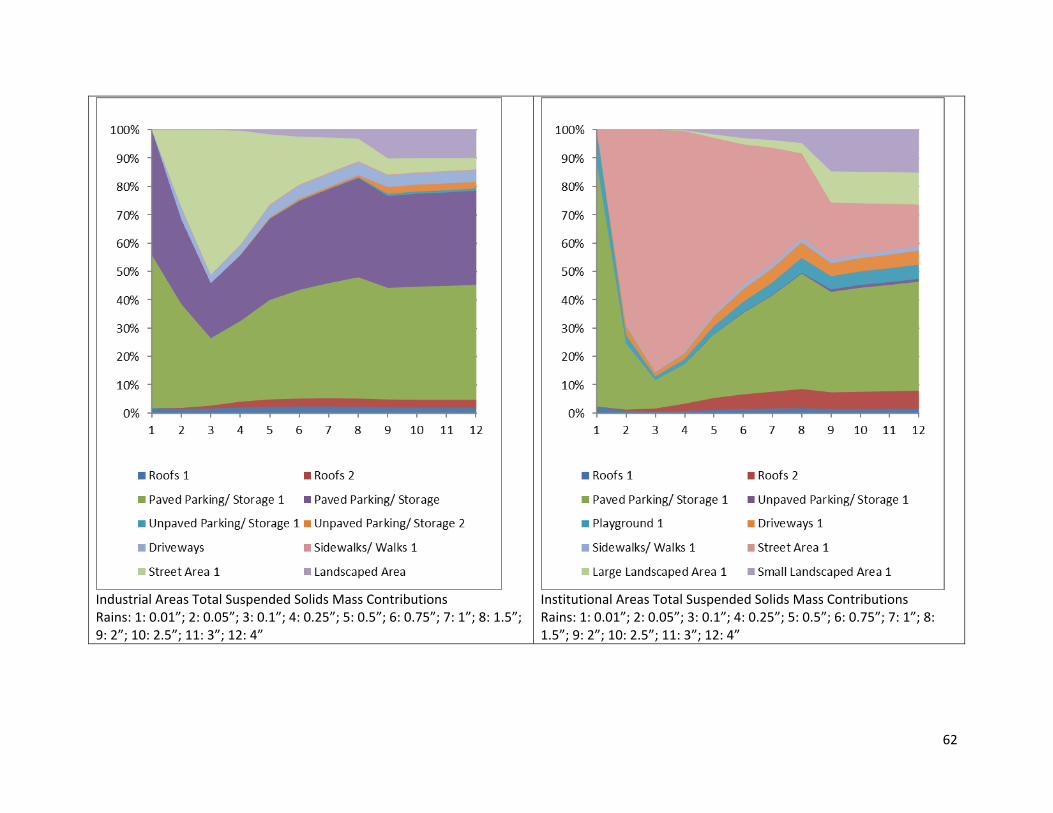
62
Industrial Areas Total Suspended Solids Mass Contributions Rains: 1: 0.01”; 2: 0.05”; 3: 0.1”; 4: 0.25”; 5: 0.5”; 6: 0.75”; 7: 1”; 8: 1.5”; 9: 2”; 10: 2.5”; 11: 3”; 12: 4”
Institutional Areas Total Suspended Solids Mass Contributions Rains: 1: 0.01”; 2: 0.05”; 3: 0.1”; 4: 0.25”; 5: 0.5”; 6: 0.75”; 7: 1”; 8: 1.5”; 9: 2”; 10: 2.5”; 11: 3”; 12: 4”
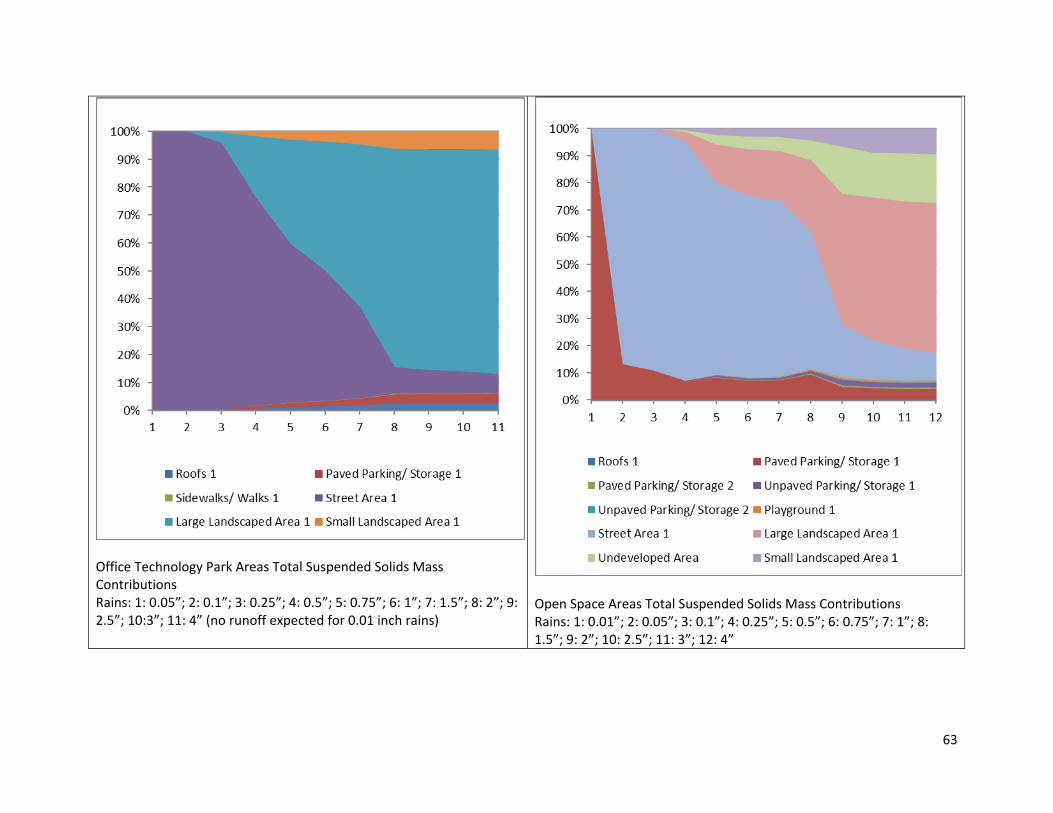
63
Office Technology Park Areas Total Suspended Solids Mass Contributions Rains: 1: 0.05”; 2: 0.1”; 3: 0.25”; 4: 0.5”; 5: 0.75”; 6: 1”; 7: 1.5”; 8: 2”; 9: 2.5”; 10:3”; 11: 4” (no runoff expected for 0.01 inch rains)
Open Space Areas Total Suspended Solids Mass Contributions Rains: 1: 0.01”; 2: 0.05”; 3: 0.1”; 4: 0.25”; 5: 0.5”; 6: 0.75”; 7: 1”; 8: 1.5”; 9: 2”; 10: 2.5”; 11: 3”; 12: 4”
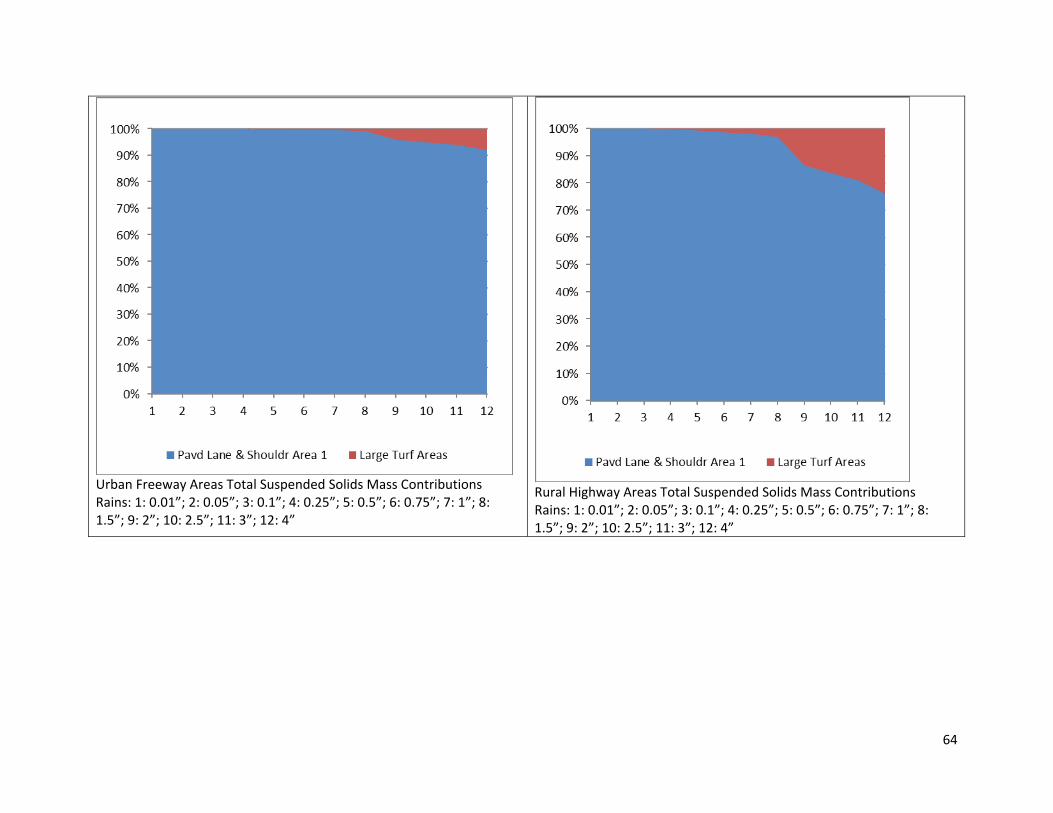
64
Urban Freeway Areas Total Suspended Solids Mass Contributions Rains: 1: 0.01”; 2: 0.05”; 3: 0.1”; 4: 0.25”; 5: 0.5”; 6: 0.75”; 7: 1”; 8: 1.5”; 9: 2”; 10: 2.5”; 11: 3”; 12: 4”
Rural Highway Areas Total Suspended Solids Mass Contributions Rains: 1: 0.01”; 2: 0.05”; 3: 0.1”; 4: 0.25”; 5: 0.5”; 6: 0.75”; 7: 1”; 8: 1.5”; 9: 2”; 10: 2.5”; 11: 3”; 12: 4”

65
Total Dissolved Solids Mass Contributions
Residential Areas Total Dissolved Solids Mass Contributions Rains: 1: 0.01”; 2: 0.05”; 3: 0.1”; 4: 0.25”; 5: 0.5”; 6: 0.75”; 7: 1”; 8: 1.5”; 9: 2”; 10: 2.5”; 11: 3”; 12: 4”
Commercial Areas Total Dissolved Solids Mass Contributions Rains: 1: 0.01”; 2: 0.05”; 3: 0.1”; 4: 0.25”; 5: 0.5”; 6: 0.75”; 7: 1”; 8: 1.5”; 9: 2”; 10: 2.5”; 11: 3”; 12: 4”

66
Industrial Areas Total Dissolved Solids Mass Contributions Rains: 1: 0.01”; 2: 0.05”; 3: 0.1”; 4: 0.25”; 5: 0.5”; 6: 0.75”; 7: 1”; 8: 1.5”; 9: 2”; 10: 2.5”; 11: 3”; 12: 4”
Institutional Areas Total Dissolved Solids Mass Contributions Rains: 1: 0.01”; 2: 0.05”; 3: 0.1”; 4: 0.25”; 5: 0.5”; 6: 0.75”; 7: 1”; 8: 1.5”; 9: 2”; 10: 2.5”; 11: 3”; 12: 4”

67
Office Technology Park Areas Total Dissolved Solids Mass Contributions Rains: 1: 0.05”; 2: 0.1”; 3: 0.25”; 4: 0.5”; 5: 0.75”; 6: 1”; 7: 1.5”; 8: 2”; 9: 2.5”; 10:3”; 11: 4” (no runoff expected for 0.01 inch rains)
Open Space Areas Total Dissolved Solids Mass Contributions Rains: 1: 0.01”; 2: 0.05”; 3: 0.1”; 4: 0.25”; 5: 0.5”; 6: 0.75”; 7: 1”; 8: 1.5”; 9: 2”; 10: 2.5”; 11: 3”; 12: 4”
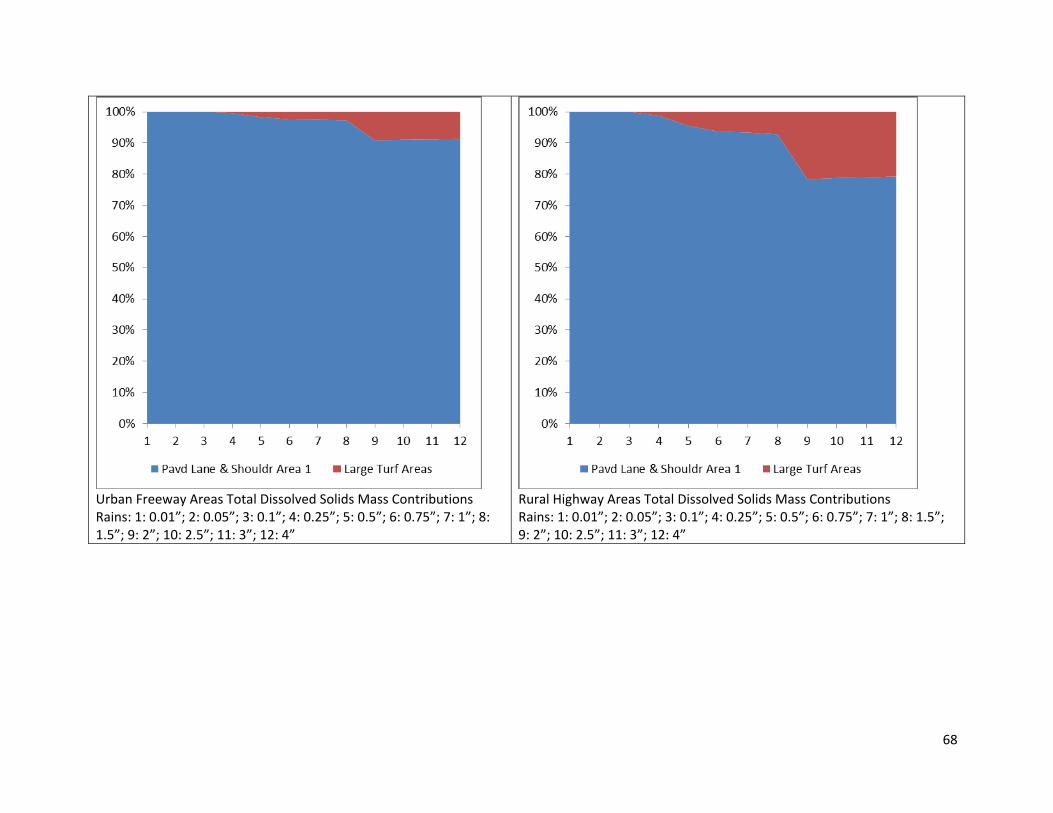
68
Urban Freeway Areas Total Dissolved Solids Mass Contributions Rains: 1: 0.01”; 2: 0.05”; 3: 0.1”; 4: 0.25”; 5: 0.5”; 6: 0.75”; 7: 1”; 8: 1.5”; 9: 2”; 10: 2.5”; 11: 3”; 12: 4”
Rural Highway Areas Total Dissolved Solids Mass Contributions Rains: 1: 0.01”; 2: 0.05”; 3: 0.1”; 4: 0.25”; 5: 0.5”; 6: 0.75”; 7: 1”; 8: 1.5”; 9: 2”; 10: 2.5”; 11: 3”; 12: 4”
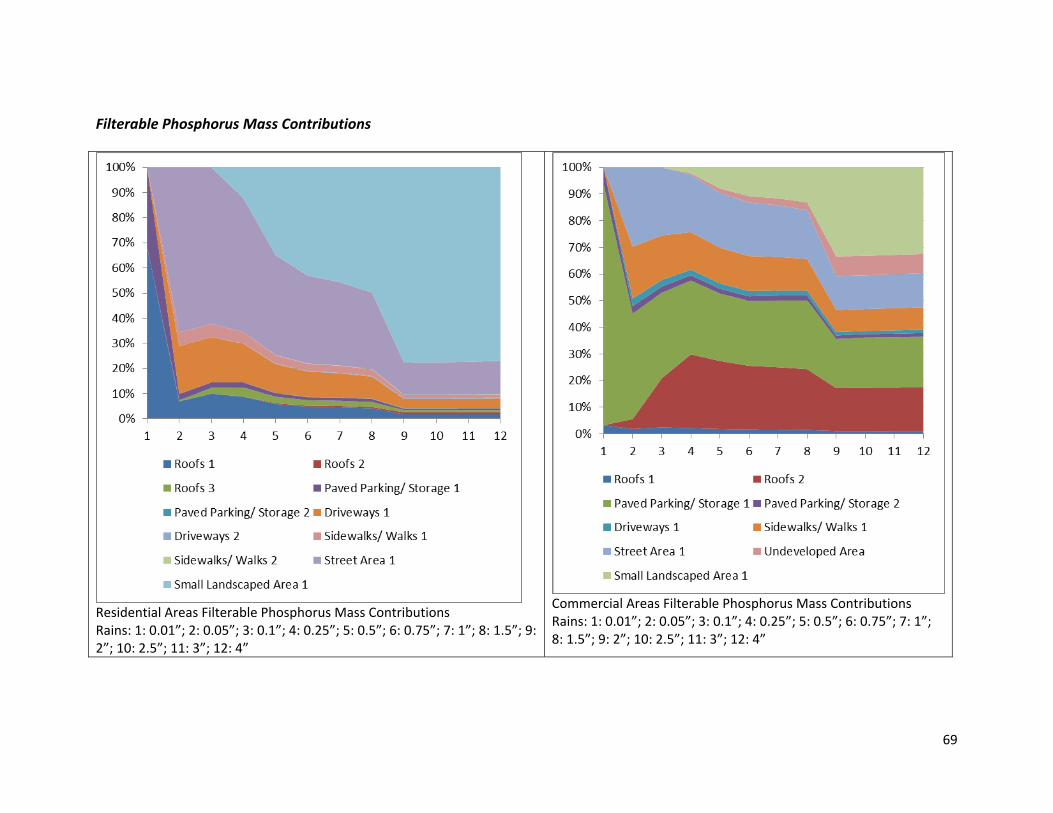
69
Filterable Phosphorus Mass Contributions
Residential Areas Filterable Phosphorus Mass Contributions Rains: 1: 0.01”; 2: 0.05”; 3: 0.1”; 4: 0.25”; 5: 0.5”; 6: 0.75”; 7: 1”; 8: 1.5”; 9: 2”; 10: 2.5”; 11: 3”; 12: 4”
Commercial Areas Filterable Phosphorus Mass Contributions Rains: 1: 0.01”; 2: 0.05”; 3: 0.1”; 4: 0.25”; 5: 0.5”; 6: 0.75”; 7: 1”; 8: 1.5”; 9: 2”; 10: 2.5”; 11: 3”; 12: 4”

70
Industrial Areas Filterable Phosphorus Mass Contributions Rains: 1: 0.01”; 2: 0.05”; 3: 0.1”; 4: 0.25”; 5: 0.5”; 6: 0.75”; 7: 1”; 8: 1.5”; 9: 2”; 10: 2.5”; 11: 3”; 12: 4”
Institutional Areas Filterable Phosphorus Mass Contributions Rains: 1: 0.01”; 2: 0.05”; 3: 0.1”; 4: 0.25”; 5: 0.5”; 6: 0.75”; 7: 1”; 8: 1.5”; 9: 2”; 10: 2.5”; 11: 3”; 12: 4”
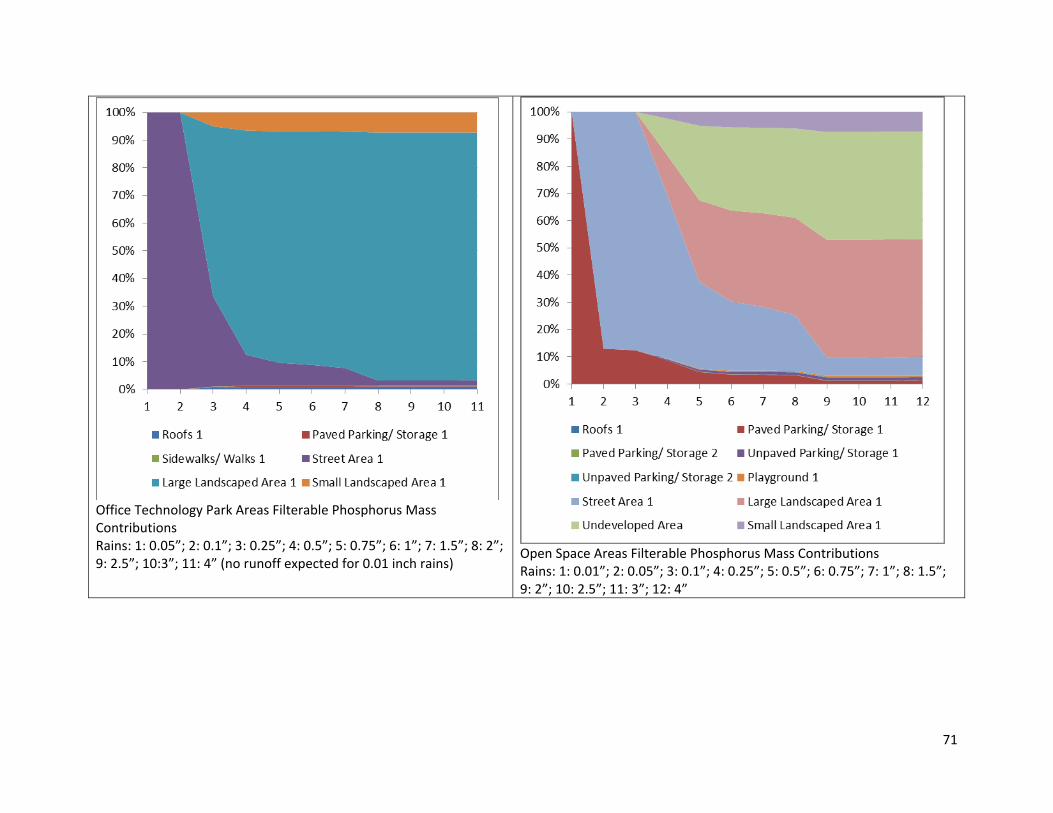
71
Office Technology Park Areas Filterable Phosphorus Mass Contributions Rains: 1: 0.05”; 2: 0.1”; 3: 0.25”; 4: 0.5”; 5: 0.75”; 6: 1”; 7: 1.5”; 8: 2”; 9: 2.5”; 10:3”; 11: 4” (no runoff expected for 0.01 inch rains)
Open Space Areas Filterable Phosphorus Mass Contributions Rains: 1: 0.01”; 2: 0.05”; 3: 0.1”; 4: 0.25”; 5: 0.5”; 6: 0.75”; 7: 1”; 8: 1.5”; 9: 2”; 10: 2.5”; 11: 3”; 12: 4”
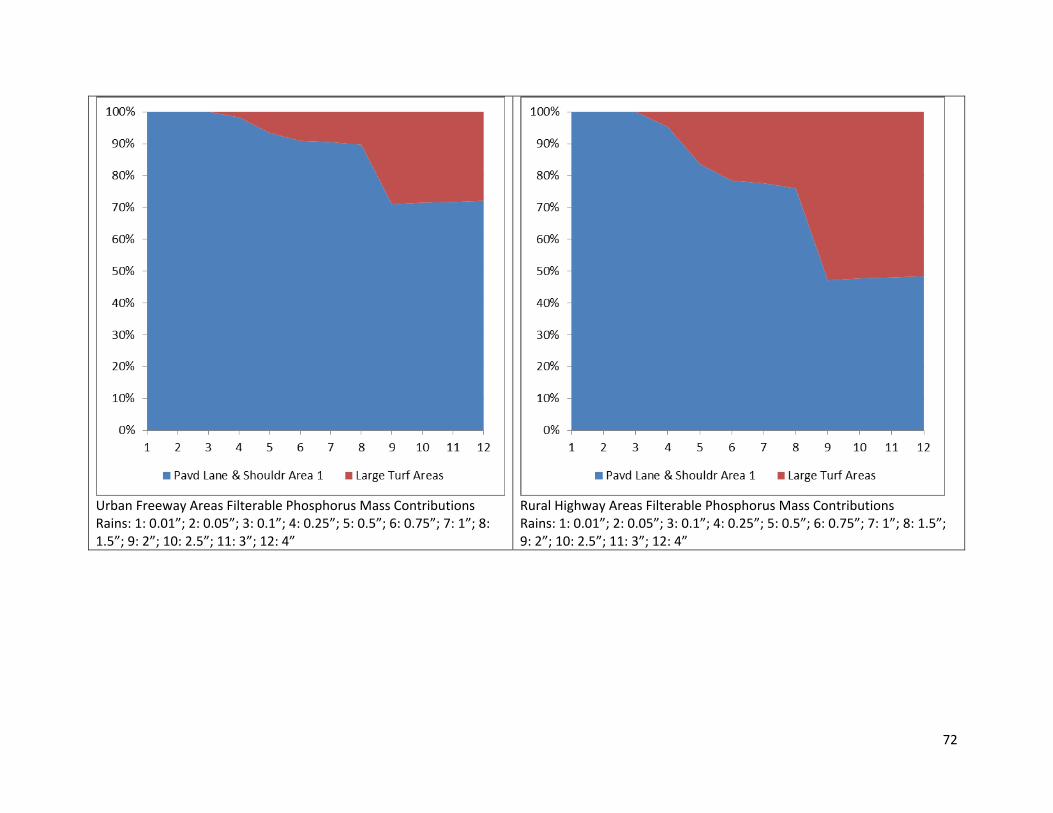
72
Urban Freeway Areas Filterable Phosphorus Mass Contributions Rains: 1: 0.01”; 2: 0.05”; 3: 0.1”; 4: 0.25”; 5: 0.5”; 6: 0.75”; 7: 1”; 8: 1.5”; 9: 2”; 10: 2.5”; 11: 3”; 12: 4”
Rural Highway Areas Filterable Phosphorus Mass Contributions Rains: 1: 0.01”; 2: 0.05”; 3: 0.1”; 4: 0.25”; 5: 0.5”; 6: 0.75”; 7: 1”; 8: 1.5”; 9: 2”; 10: 2.5”; 11: 3”; 12: 4”

73
Total Phosphorus Mass Contributions
Residential Areas Total Phosphorus Mass Contributions Rains: 1: 0.01”; 2: 0.05”; 3: 0.1”; 4: 0.25”; 5: 0.5”; 6: 0.75”; 7: 1”; 8: 1.5”; 9: 2”; 10: 2.5”; 11: 3”; 12: 4”
Commercial Areas Total Phosphorus Mass Contributions Rains: 1: 0.01”; 2: 0.05”; 3: 0.1”; 4: 0.25”; 5: 0.5”; 6: 0.75”; 7: 1”; 8: 1.5”; 9: 2”; 10: 2.5”; 11: 3”; 12: 4”
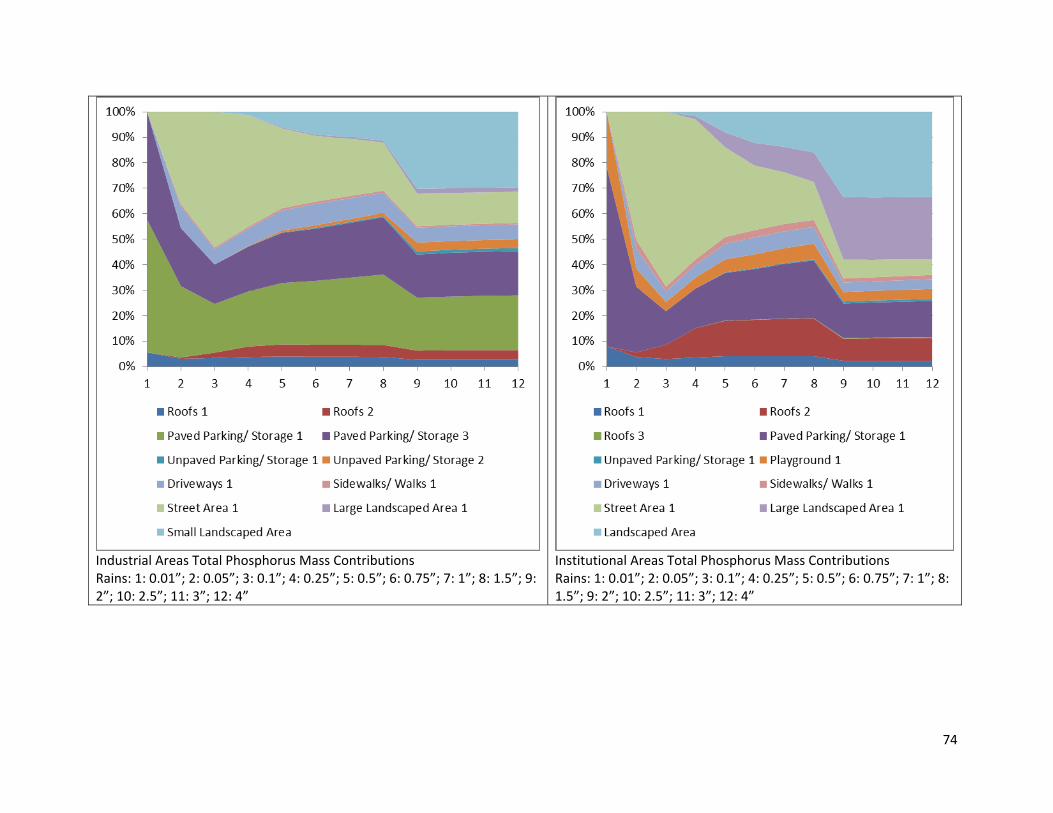
74
Industrial Areas Total Phosphorus Mass Contributions Rains: 1: 0.01”; 2: 0.05”; 3: 0.1”; 4: 0.25”; 5: 0.5”; 6: 0.75”; 7: 1”; 8: 1.5”; 9: 2”; 10: 2.5”; 11: 3”; 12: 4”
Institutional Areas Total Phosphorus Mass Contributions Rains: 1: 0.01”; 2: 0.05”; 3: 0.1”; 4: 0.25”; 5: 0.5”; 6: 0.75”; 7: 1”; 8: 1.5”; 9: 2”; 10: 2.5”; 11: 3”; 12: 4”

75
Office Technology Park Areas Total Phosphorus Mass Contributions Rains: 1: 0.05”; 2: 0.1”; 3: 0.25”; 4: 0.5”; 5: 0.75”; 6: 1”; 7: 1.5”; 8: 2”; 9: 2.5”; 10:3”; 11: 4” (no runoff expected for 0.01 inch rains)
Open Space Areas Total Phosphorus Mass Contributions Rains: 1: 0.01”; 2: 0.05”; 3: 0.1”; 4: 0.25”; 5: 0.5”; 6: 0.75”; 7: 1”; 8: 1.5”; 9: 2”; 10: 2.5”; 11: 3”; 12: 4”

76
Urban Freeway Areas Total Phosphorus Mass Contributions Rains: 1: 0.01”; 2: 0.05”; 3: 0.1”; 4: 0.25”; 5: 0.5”; 6: 0.75”; 7: 1”; 8: 1.5”; 9: 2”; 10: 2.5”; 11: 3”; 12: 4”
Rural Highway Areas Total Phosphorus Mass Contributions Rains: 1: 0.01”; 2: 0.05”; 3: 0.1”; 4: 0.25”; 5: 0.5”; 6: 0.75”; 7: 1”; 8: 1.5”; 9: 2”; 10: 2.5”; 11: 3”; 12: 4”

77
Nitrite plus Nitrate Mass Contributions
Residential Areas Nitrite plus Nitrate Mass Contributions Rains: 1: 0.01”; 2: 0.05”; 3: 0.1”; 4: 0.25”; 5: 0.5”; 6: 0.75”; 7: 1”; 8: 1.5”; 9: 2”; 10: 2.5”; 11: 3”; 12: 4”
Commercial Areas Nitrite plus Nitrate Mass Contributions Rains: 1: 0.01”; 2: 0.05”; 3: 0.1”; 4: 0.25”; 5: 0.5”; 6: 0.75”; 7: 1”; 8: 1.5”; 9: 2”; 10: 2.5”; 11: 3”; 12: 4”

78
Industrial Areas Nitrite plus Nitrate Mass Contributions Rains: 1: 0.01”; 2: 0.05”; 3: 0.1”; 4: 0.25”; 5: 0.5”; 6: 0.75”; 7: 1”; 8: 1.5”; 9: 2”; 10: 2.5”; 11: 3”; 12: 4”
Institutional Areas Nitrite plus Nitrate Mass Contributions Rains: 1: 0.01”; 2: 0.05”; 3: 0.1”; 4: 0.25”; 5: 0.5”; 6: 0.75”; 7: 1”; 8: 1.5”; 9: 2”; 10: 2.5”; 11: 3”; 12: 4”

79
Office Technology Park Areas Nitrite plus Nitrate Mass Contributions Rains: 1: 0.05”; 2: 0.1”; 3: 0.25”; 4: 0.5”; 5: 0.75”; 6: 1”; 7: 1.5”; 8: 2”; 9: 2.5”; 10:3”; 11: 4” (no runoff expected for 0.01 inch rains)
Open Space Areas Nitrite plus Nitrate Mass Contributions Rains: 1: 0.01”; 2: 0.05”; 3: 0.1”; 4: 0.25”; 5: 0.5”; 6: 0.75”; 7: 1”; 8: 1.5”; 9: 2”; 10: 2.5”; 11: 3”; 12: 4”

80
Urban Freeway Areas Nitrite plus Nitrate Mass Contributions Rains: 1: 0.01”; 2: 0.05”; 3: 0.1”; 4: 0.25”; 5: 0.5”; 6: 0.75”; 7: 1”; 8: 1.5”; 9: 2”; 10: 2.5”; 11: 3”; 12: 4”
Rural Highway Areas Nitrite plus Nitrate Mass Contributions Rains: 1: 0.01”; 2: 0.05”; 3: 0.1”; 4: 0.25”; 5: 0.5”; 6: 0.75”; 7: 1”; 8: 1.5”; 9: 2”; 10: 2.5”; 11: 3”; 12: 4”
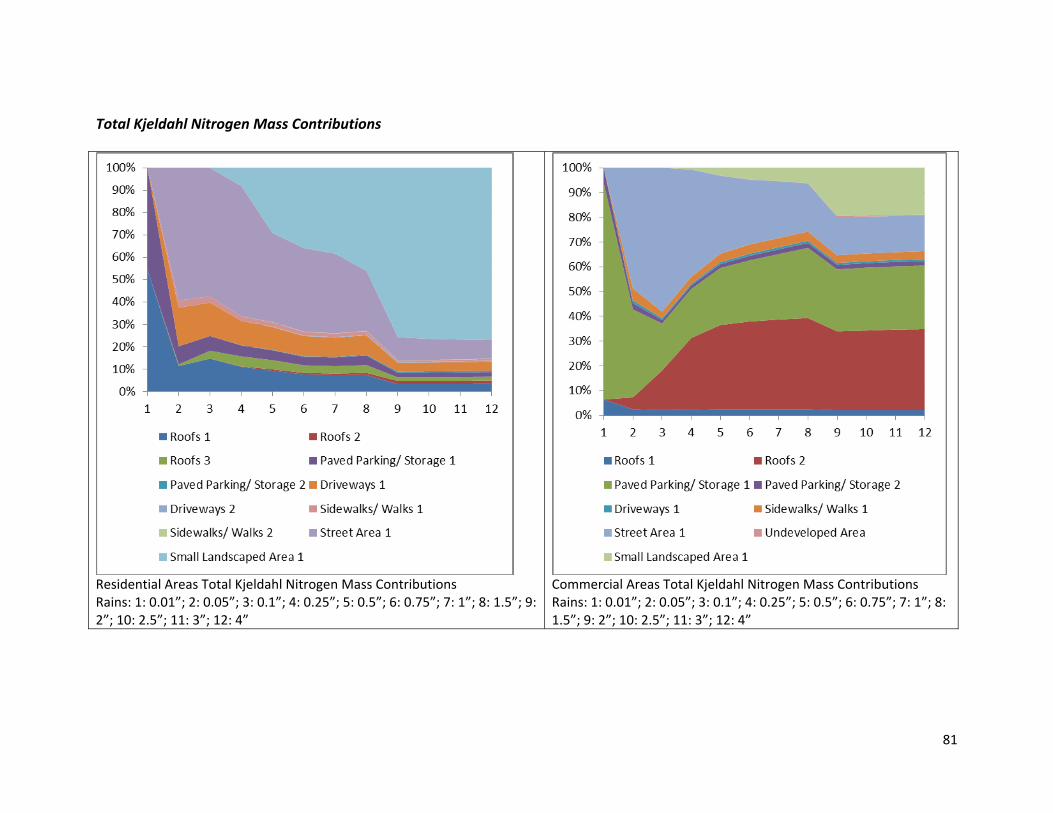
81
Total Kjeldahl Nitrogen Mass Contributions
Residential Areas Total Kjeldahl Nitrogen Mass Contributions Rains: 1: 0.01”; 2: 0.05”; 3: 0.1”; 4: 0.25”; 5: 0.5”; 6: 0.75”; 7: 1”; 8: 1.5”; 9: 2”; 10: 2.5”; 11: 3”; 12: 4”
Commercial Areas Total Kjeldahl Nitrogen Mass Contributions Rains: 1: 0.01”; 2: 0.05”; 3: 0.1”; 4: 0.25”; 5: 0.5”; 6: 0.75”; 7: 1”; 8: 1.5”; 9: 2”; 10: 2.5”; 11: 3”; 12: 4”

82
Industrial Areas Total Kjeldahl Nitrogen Mass Contributions Rains: 1: 0.01”; 2: 0.05”; 3: 0.1”; 4: 0.25”; 5: 0.5”; 6: 0.75”; 7: 1”; 8: 1.5”; 9: 2”; 10: 2.5”; 11: 3”; 12: 4”
Institutional Areas Total Kjeldahl Nitrogen Mass Contributions Rains: 1: 0.01”; 2: 0.05”; 3: 0.1”; 4: 0.25”; 5: 0.5”; 6: 0.75”; 7: 1”; 8: 1.5”; 9: 2”; 10: 2.5”; 11: 3”; 12: 4”

83
Office Technology Park Areas Total Kjeldahl Nitrogen Mass Contributions Rains: 1: 0.05”; 2: 0.1”; 3: 0.25”; 4: 0.5”; 5: 0.75”; 6: 1”; 7: 1.5”; 8: 2”; 9: 2.5”; 10:3”; 11: 4” (no runoff expected for 0.01 inch rains)
Open Space Areas Total Kjeldahl Nitrogen Mass Contributions Rains: 1: 0.01”; 2: 0.05”; 3: 0.1”; 4: 0.25”; 5: 0.5”; 6: 0.75”; 7: 1”; 8: 1.5”; 9: 2”; 10: 2.5”; 11: 3”; 12: 4”

84
Urban Freeway Areas Total Kjeldahl Nitrogen Mass Contributions Rains: 1: 0.01”; 2: 0.05”; 3: 0.1”; 4: 0.25”; 5: 0.5”; 6: 0.75”; 7: 1”; 8: 1.5”; 9: 2”; 10: 2.5”; 11: 3”; 12: 4”
Rural Highway Areas Total Kjeldahl Nitrogen Mass Contributions Rains: 1: 0.01”; 2: 0.05”; 3: 0.1”; 4: 0.25”; 5: 0.5”; 6: 0.75”; 7: 1”; 8: 1.5”; 9: 2”; 10: 2.5”; 11: 3”; 12: 4”
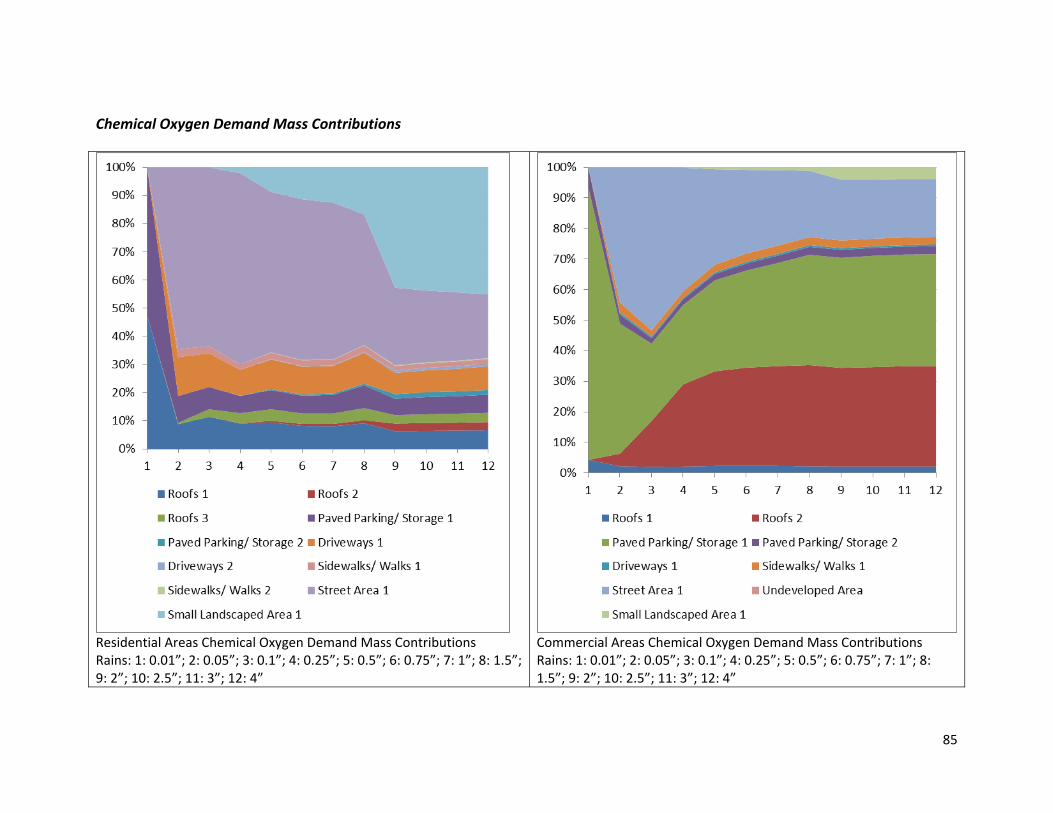
85
Chemical Oxygen Demand Mass Contributions
Residential Areas Chemical Oxygen Demand Mass Contributions Rains: 1: 0.01”; 2: 0.05”; 3: 0.1”; 4: 0.25”; 5: 0.5”; 6: 0.75”; 7: 1”; 8: 1.5”; 9: 2”; 10: 2.5”; 11: 3”; 12: 4”
Commercial Areas Chemical Oxygen Demand Mass Contributions Rains: 1: 0.01”; 2: 0.05”; 3: 0.1”; 4: 0.25”; 5: 0.5”; 6: 0.75”; 7: 1”; 8: 1.5”; 9: 2”; 10: 2.5”; 11: 3”; 12: 4”

86
Industrial Areas Chemical Oxygen Demand Mass Contributions Rains: 1: 0.01”; 2: 0.05”; 3: 0.1”; 4: 0.25”; 5: 0.5”; 6: 0.75”; 7: 1”; 8: 1.5”; 9: 2”; 10: 2.5”; 11: 3”; 12: 4”
Institutional Areas Chemical Oxygen Demand Mass Contributions Rains: 1: 0.01”; 2: 0.05”; 3: 0.1”; 4: 0.25”; 5: 0.5”; 6: 0.75”; 7: 1”; 8: 1.5”; 9: 2”; 10: 2.5”; 11: 3”; 12: 4”

87
Office Technology Park Areas Chemical Oxygen Demand Mass Contributions Rains: 1: 0.05”; 2: 0.1”; 3: 0.25”; 4: 0.5”; 5: 0.75”; 6: 1”; 7: 1.5”; 8: 2”; 9: 2.5”; 10:3”; 11: 4” (no runoff expected for 0.01 inch rains) Open Space Areas Chemical Oxygen Demand Mass Contributions
Rains: 1: 0.01”; 2: 0.05”; 3: 0.1”; 4: 0.25”; 5: 0.5”; 6: 0.75”; 7: 1”; 8: 1.5”; 9: 2”; 10: 2.5”; 11: 3”; 12: 4”

88
Urban Freeway Areas Chemical Oxygen Demand Mass Contributions Rains: 1: 0.01”; 2: 0.05”; 3: 0.1”; 4: 0.25”; 5: 0.5”; 6: 0.75”; 7: 1”; 8: 1.5”; 9: 2”; 10: 2.5”; 11: 3”; 12: 4”
Rural Highway Areas Chemical Oxygen Demand Mass Contributions Rains: 1: 0.01”; 2: 0.05”; 3: 0.1”; 4: 0.25”; 5: 0.5”; 6: 0.75”; 7: 1”; 8: 1.5”; 9: 2”; 10: 2.5”; 11: 3”; 12: 4”

89
Total Copper Mass Contributions
Residential Areas Total Copper Mass Contributions Rains: 1: 0.01”; 2: 0.05”; 3: 0.1”; 4: 0.25”; 5: 0.5”; 6: 0.75”; 7: 1”; 8: 1.5”; 9: 2”; 10: 2.5”; 11: 3”; 12: 4”
Commercial Areas Total Copper Mass Contributions Rains: 1: 0.01”; 2: 0.05”; 3: 0.1”; 4: 0.25”; 5: 0.5”; 6: 0.75”; 7: 1”; 8: 1.5”; 9: 2”; 10: 2.5”; 11: 3”; 12: 4”

90
Industrial Areas Total Copper Mass Contributions Rains: 1: 0.01”; 2: 0.05”; 3: 0.1”; 4: 0.25”; 5: 0.5”; 6: 0.75”; 7: 1”; 8: 1.5”; 9: 2”; 10: 2.5”; 11: 3”; 12: 4”
Institutional Areas Total Copper Mass Contributions Rains: 1: 0.01”; 2: 0.05”; 3: 0.1”; 4: 0.25”; 5: 0.5”; 6: 0.75”; 7: 1”; 8: 1.5”; 9: 2”; 10: 2.5”; 11: 3”; 12: 4”
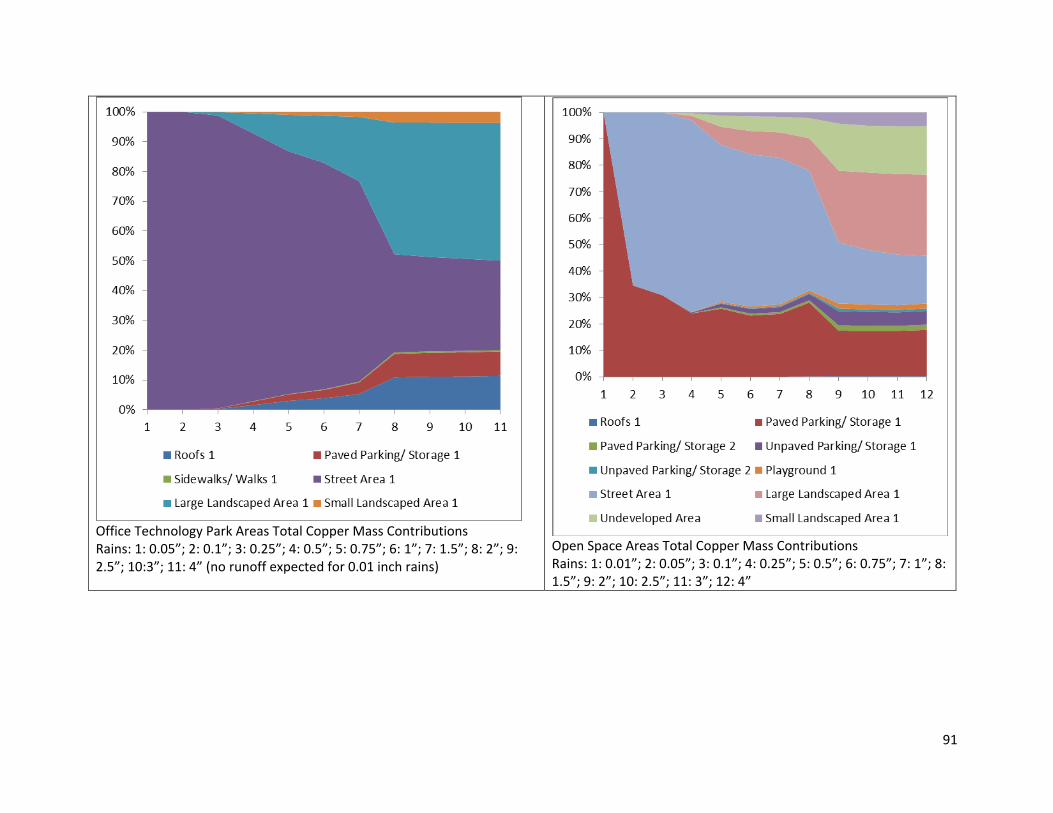
91
Office Technology Park Areas Total Copper Mass Contributions Rains: 1: 0.05”; 2: 0.1”; 3: 0.25”; 4: 0.5”; 5: 0.75”; 6: 1”; 7: 1.5”; 8: 2”; 9: 2.5”; 10:3”; 11: 4” (no runoff expected for 0.01 inch rains)
Open Space Areas Total Copper Mass Contributions Rains: 1: 0.01”; 2: 0.05”; 3: 0.1”; 4: 0.25”; 5: 0.5”; 6: 0.75”; 7: 1”; 8: 1.5”; 9: 2”; 10: 2.5”; 11: 3”; 12: 4”

92
Urban Freeway Areas Total Copper Mass Contributions Rains: 1: 0.01”; 2: 0.05”; 3: 0.1”; 4: 0.25”; 5: 0.5”; 6: 0.75”; 7: 1”; 8: 1.5”; 9: 2”; 10: 2.5”; 11: 3”; 12: 4”
Rural Highway Areas Total Copper Mass Contributions Rains: 1: 0.01”; 2: 0.05”; 3: 0.1”; 4: 0.25”; 5: 0.5”; 6: 0.75”; 7: 1”; 8: 1.5”; 9: 2”; 10: 2.5”; 11: 3”; 12: 4”

93
Total Lead Mass Contributions
Residential Areas Total Lead Mass Contributions Rains: 1: 0.01”; 2: 0.05”; 3: 0.1”; 4: 0.25”; 5: 0.5”; 6: 0.75”; 7: 1”; 8: 1.5”; 9: 2”; 10: 2.5”; 11: 3”; 12: 4”
Commercial Areas Total Lead Mass Contributions Rains: 1: 0.01”; 2: 0.05”; 3: 0.1”; 4: 0.25”; 5: 0.5”; 6: 0.75”; 7: 1”; 8: 1.5”; 9: 2”; 10: 2.5”; 11: 3”; 12: 4”
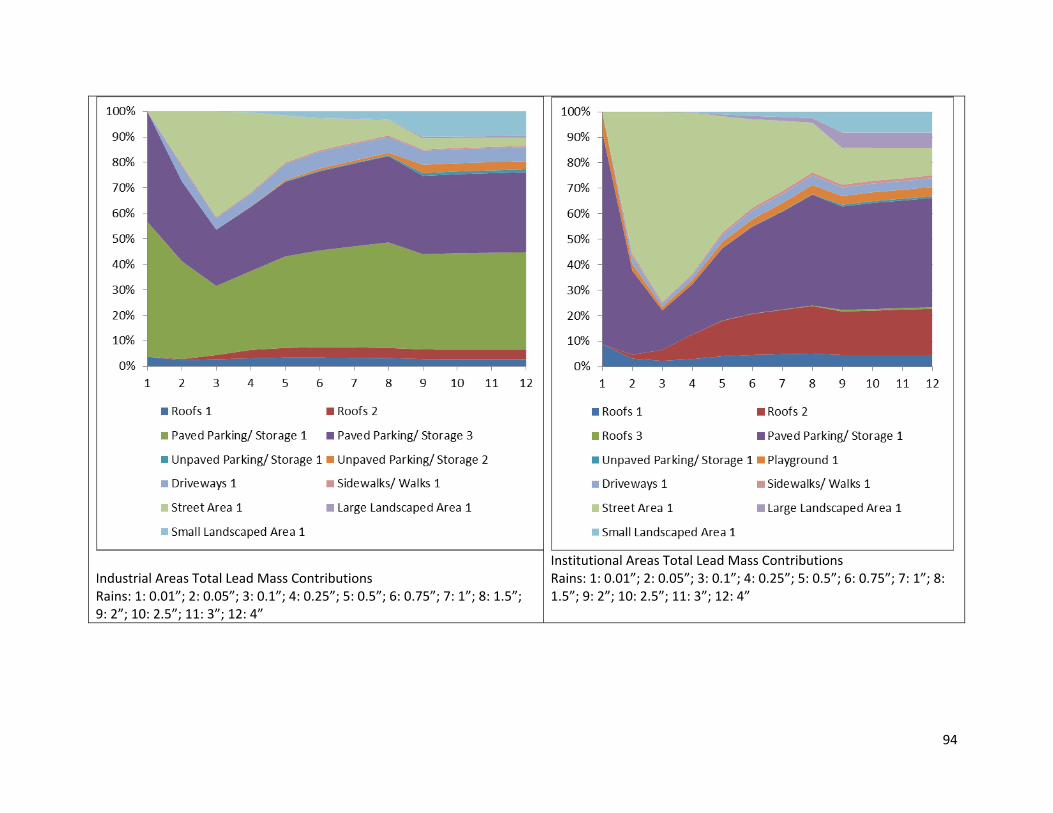
94
Industrial Areas Total Lead Mass Contributions Rains: 1: 0.01”; 2: 0.05”; 3: 0.1”; 4: 0.25”; 5: 0.5”; 6: 0.75”; 7: 1”; 8: 1.5”; 9: 2”; 10: 2.5”; 11: 3”; 12: 4”
Institutional Areas Total Lead Mass Contributions Rains: 1: 0.01”; 2: 0.05”; 3: 0.1”; 4: 0.25”; 5: 0.5”; 6: 0.75”; 7: 1”; 8: 1.5”; 9: 2”; 10: 2.5”; 11: 3”; 12: 4”

95
Office Technology Park Areas Total Lead Mass Contributions Rains: 1: 0.05”; 2: 0.1”; 3: 0.25”; 4: 0.5”; 5: 0.75”; 6: 1”; 7: 1.5”; 8: 2”; 9: 2.5”; 10:3”; 11: 4” (no runoff expected for 0.01 inch rains)
Open Space Areas Total Lead Mass Contributions Rains: 1: 0.01”; 2: 0.05”; 3: 0.1”; 4: 0.25”; 5: 0.5”; 6: 0.75”; 7: 1”; 8: 1.5”; 9: 2”; 10: 2.5”; 11: 3”; 12: 4”
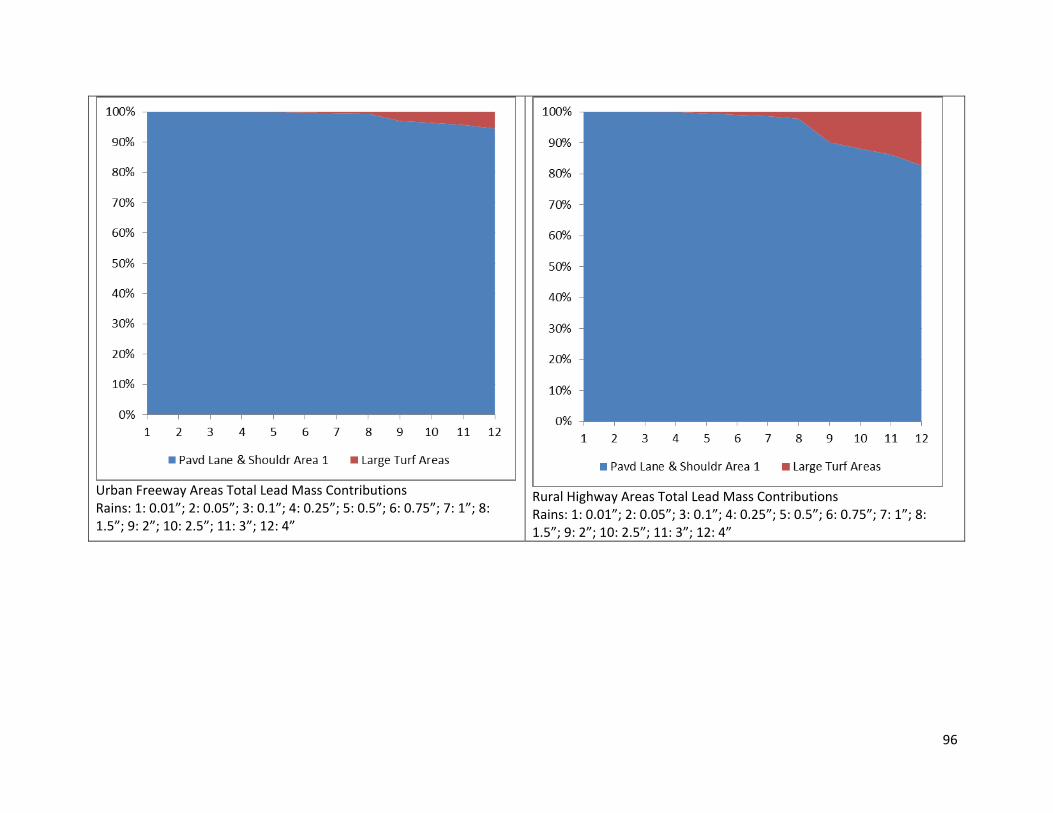
96
Urban Freeway Areas Total Lead Mass Contributions Rains: 1: 0.01”; 2: 0.05”; 3: 0.1”; 4: 0.25”; 5: 0.5”; 6: 0.75”; 7: 1”; 8: 1.5”; 9: 2”; 10: 2.5”; 11: 3”; 12: 4”
Rural Highway Areas Total Lead Mass Contributions Rains: 1: 0.01”; 2: 0.05”; 3: 0.1”; 4: 0.25”; 5: 0.5”; 6: 0.75”; 7: 1”; 8: 1.5”; 9: 2”; 10: 2.5”; 11: 3”; 12: 4”

97
Total Zinc Mass Contributions
Residential Areas Total Zinc Mass Contributions Rains: 1: 0.01”; 2: 0.05”; 3: 0.1”; 4: 0.25”; 5: 0.5”; 6: 0.75”; 7: 1”; 8: 1.5”; 9: 2”; 10: 2.5”; 11: 3”; 12: 4”
Commercial Areas Total Zinc Mass Contributions Rains: 1: 0.01”; 2: 0.05”; 3: 0.1”; 4: 0.25”; 5: 0.5”; 6: 0.75”; 7: 1”; 8: 1.5”; 9: 2”; 10: 2.5”; 11: 3”; 12: 4”
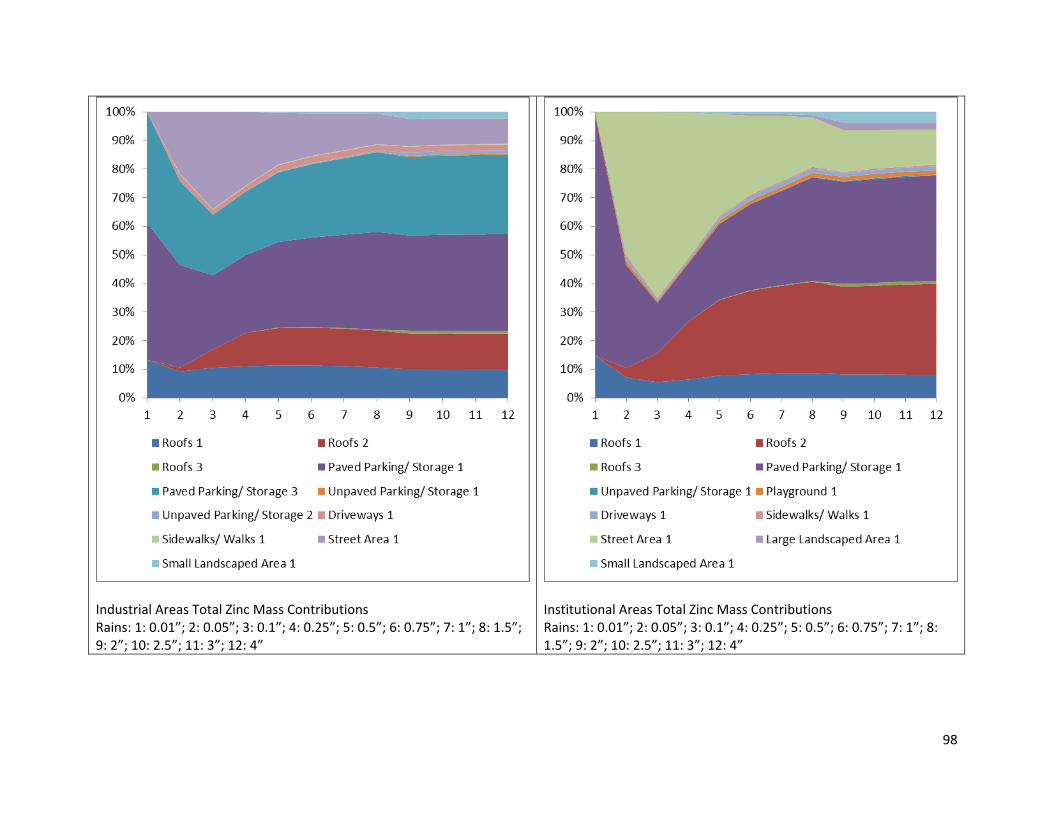
98
Industrial Areas Total Zinc Mass Contributions Rains: 1: 0.01”; 2: 0.05”; 3: 0.1”; 4: 0.25”; 5: 0.5”; 6: 0.75”; 7: 1”; 8: 1.5”; 9: 2”; 10: 2.5”; 11: 3”; 12: 4”
Institutional Areas Total Zinc Mass Contributions Rains: 1: 0.01”; 2: 0.05”; 3: 0.1”; 4: 0.25”; 5: 0.5”; 6: 0.75”; 7: 1”; 8: 1.5”; 9: 2”; 10: 2.5”; 11: 3”; 12: 4”

99
Office Technology Park Areas Total Zinc Mass Contributions Rains: 1: 0.05”; 2: 0.1”; 3: 0.25”; 4: 0.5”; 5: 0.75”; 6: 1”; 7: 1.5”; 8: 2”; 9: 2.5”; 10:3”; 11: 4” (no runoff expected for 0.01 inch rains)
Open Space Areas Total Zinc Mass Contributions Rains: 1: 0.01”; 2: 0.05”; 3: 0.1”; 4: 0.25”; 5: 0.5”; 6: 0.75”; 7: 1”; 8: 1.5”; 9: 2”; 10: 2.5”; 11: 3”; 12: 4”

100
Urban Freeway Areas Total Zinc Mass Contributions Rains: 1: 0.01”; 2: 0.05”; 3: 0.1”; 4: 0.25”; 5: 0.5”; 6: 0.75”; 7: 1”; 8: 1.5”; 9: 2”; 10: 2.5”; 11: 3”; 12: 4”
Rural Highway Areas Total Zinc Mass Contributions Rains: 1: 0.01”; 2: 0.05”; 3: 0.1”; 4: 0.25”; 5: 0.5”; 6: 0.75”; 7: 1”; 8: 1.5”; 9: 2”; 10: 2.5”; 11: 3”; 12: 4”

101
Fecal Coliform Contributions
Residential Areas Fecal Coliform Contributions Rains: 1: 0.01”; 2: 0.05”; 3: 0.1”; 4: 0.25”; 5: 0.5”; 6: 0.75”; 7: 1”; 8: 1.5”; 9: 2”; 10: 2.5”; 11: 3”; 12: 4”
Commercial Areas Fecal Coliform Contributions Rains: 1: 0.01”; 2: 0.05”; 3: 0.1”; 4: 0.25”; 5: 0.5”; 6: 0.75”; 7: 1”; 8: 1.5”; 9: 2”; 10: 2.5”; 11: 3”; 12: 4”

102
Industrial Areas Fecal Coliform Contributions Rains: 1: 0.01”; 2: 0.05”; 3: 0.1”; 4: 0.25”; 5: 0.5”; 6: 0.75”; 7: 1”; 8: 1.5”; 9: 2”; 10: 2.5”; 11: 3”; 12: 4”
Institutional Areas Fecal Coliform Contributions Rains: 1: 0.01”; 2: 0.05”; 3: 0.1”; 4: 0.25”; 5: 0.5”; 6: 0.75”; 7: 1”; 8: 1.5”; 9: 2”; 10: 2.5”; 11: 3”; 12: 4”
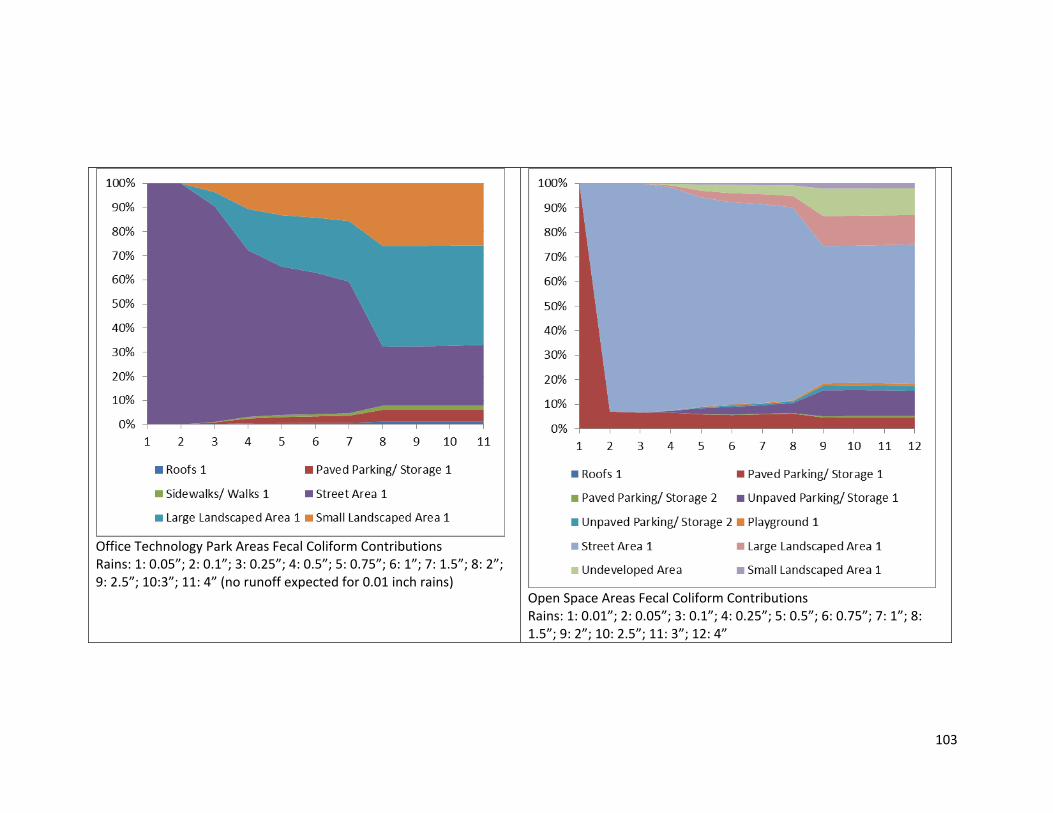
103
Office Technology Park Areas Fecal Coliform Contributions Rains: 1: 0.05”; 2: 0.1”; 3: 0.25”; 4: 0.5”; 5: 0.75”; 6: 1”; 7: 1.5”; 8: 2”; 9: 2.5”; 10:3”; 11: 4” (no runoff expected for 0.01 inch rains)
Open Space Areas Fecal Coliform Contributions Rains: 1: 0.01”; 2: 0.05”; 3: 0.1”; 4: 0.25”; 5: 0.5”; 6: 0.75”; 7: 1”; 8: 1.5”; 9: 2”; 10: 2.5”; 11: 3”; 12: 4”
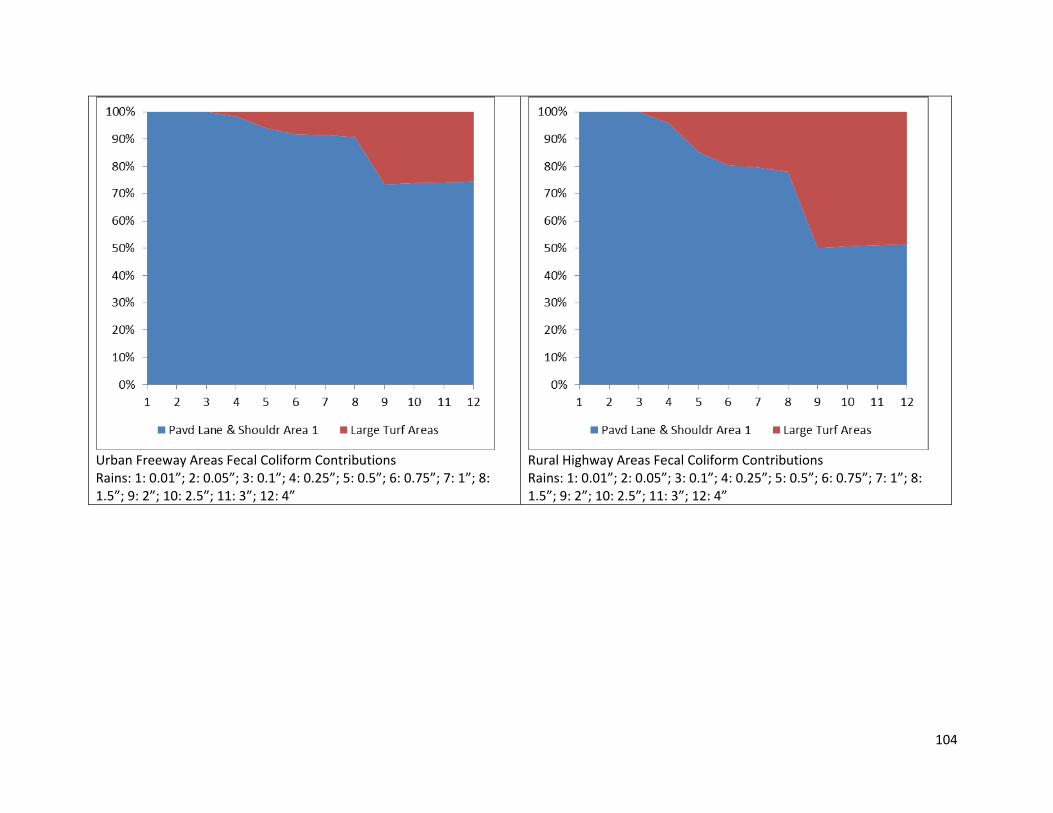
104
Urban Freeway Areas Fecal Coliform Contributions Rains: 1: 0.01”; 2: 0.05”; 3: 0.1”; 4: 0.25”; 5: 0.5”; 6: 0.75”; 7: 1”; 8: 1.5”; 9: 2”; 10: 2.5”; 11: 3”; 12: 4”
Rural Highway Areas Fecal Coliform Contributions Rains: 1: 0.01”; 2: 0.05”; 3: 0.1”; 4: 0.25”; 5: 0.5”; 6: 0.75”; 7: 1”; 8: 1.5”; 9: 2”; 10: 2.5”; 11: 3”; 12: 4”