Embed Size (px)
Citation preview
Standalone financial statements | 139 Infosys Annual Report 2017-18
Standalone Financial Statements under Indian Accounting Standards (Ind AS) for the year ended March 31, 2018
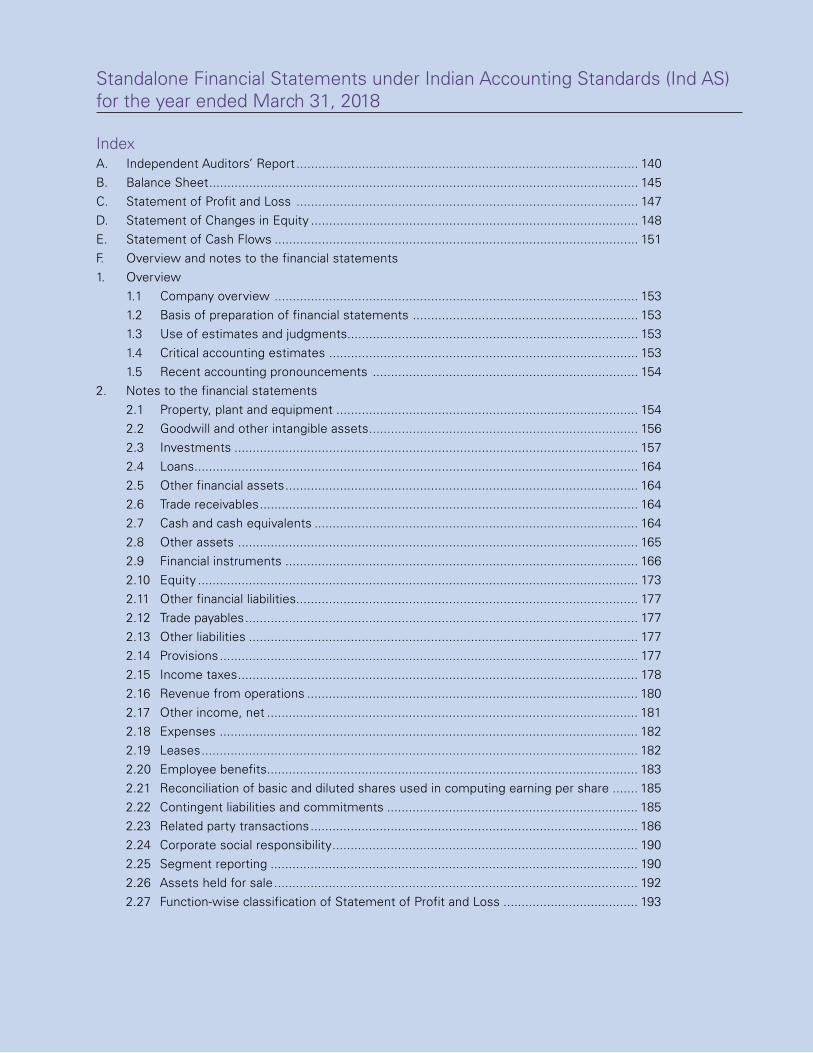
IndexA. Independent Auditors’ Report .............................................................................................. 140B. Balance Sheet ...................................................................................................................... 145C. Statement of Profit and Loss .............................................................................................. 147D. Statement of Changes in Equity .......................................................................................... 148E. Statement of Cash Flows .................................................................................................... 151F. Overview and notes to the financial statements1. Overview 1.1 Company overview .................................................................................................... 153 1.2 Basis of preparation of financial statements .............................................................. 153 1.3 Use of estimates and judgments................................................................................ 153 1.4 Critical accounting estimates ..................................................................................... 153 1.5 Recent accounting pronouncements ......................................................................... 1542. Notes to the financial statements 2.1 Property, plant and equipment ................................................................................... 154 2.2 Goodwill and other intangible assets .......................................................................... 156 2.3 Investments ............................................................................................................... 157 2.4 Loans .......................................................................................................................... 164 2.5 Other financial assets ................................................................................................. 164 2.6 Trade receivables ........................................................................................................ 164 2.7 Cash and cash equivalents ......................................................................................... 164 2.8 Other assets .............................................................................................................. 165 2.9 Financial instruments ................................................................................................. 166 2.10 Equity ......................................................................................................................... 173 2.11 Other financial liabilities.............................................................................................. 177 2.12 Trade payables ............................................................................................................ 177 2.13 Other liabilities ........................................................................................................... 177 2.14 Provisions ................................................................................................................... 177 2.15 Income taxes .............................................................................................................. 178 2.16 Revenue from operations ........................................................................................... 180 2.17 Other income, net ...................................................................................................... 181 2.18 Expenses ................................................................................................................... 182 2.19 Leases ........................................................................................................................ 182 2.20 Employee benefits...................................................................................................... 183 2.21 Reconciliation of basic and diluted shares used in computing earning per share ....... 185 2.22 Contingent liabilities and commitments ..................................................................... 185 2.23 Related party transactions .......................................................................................... 186 2.24 Corporate social responsibility .................................................................................... 190 2.25 Segment reporting ..................................................................................................... 190 2.26 Assets held for sale .................................................................................................... 192 2.27 Function-wise classification of Statement of Profit and Loss ..................................... 193

140 | Standalone financial statements Infosys Annual Report 2017-18
Independent Auditors’ Report
To the Members of Infosys Limited
Report on the Standalone Financial Statements We have audited the accompanying standalone financial statements of Infosys Limited (‘the Company’), which comprise the Balance Sheet as at March 31, 2018, the Statement of Profit and Loss (including other comprehensive income), the Statement of Changes in Equity and the Statement of Cash Flows for the year then ended and a summary of the significant accounting policies and other explanatory information.
Management’s Responsibility for the Standalone Financial StatementsThe Company’s Board of Directors is responsible for the matters stated in Section 134(5) of the Companies Act, 2013 (‘the Act’) with respect to the preparation of these standalone financial statements that give a true and fair view of the financial position, financial performance including other comprehensive income, cash flows and changes in equity of the Company in accordance with the Indian Accounting Standards (Ind AS) prescribed under Section 133 of the Act read with the Companies (Indian Accounting Standards) Rules, 2015, as amended, and other accounting principles generally accepted in India.
This responsibility also includes maintenance of adequate accounting records in accordance with the provisions of the Act for safeguarding the assets of the Company and for preventing and detecting frauds and other irregularities; selection and application of appropriate accounting policies; making judgments and estimates that are reasonable and prudent; and design, implementation and maintenance of adequate internal financial controls, that were operating effectively for ensuring the accuracy and completeness of the accounting records, relevant to the preparation and presentation of the standalone financial statements that give a true and fair view and are free from material misstatement, whether due to fraud or error.
Auditors’ ResponsibilityOur responsibility is to express an opinion on these standalone financial statements based on our audit.
In conducting our audit, we have taken into account the provisions of the Act, the accounting and auditing standards and matters which are required to be included in the audit report under the provisions of the Act and the Rules made thereunder and the Order issued under Section 143(11) of the Act.
We conducted our audit of the standalone financial statements in accordance with the Standards on Auditing specified under Section 143(10) of the Act. Those Standards require that we comply with ethical requirements and plan and perform the audit to obtain reasonable assurance about whether the standalone financial statements are free from material misstatement.
An audit involves performing procedures to obtain audit evidence about the amounts and the disclosures in the standalone financial statements. The procedures selected depend on the auditor’s judgment, including the assessment of the risks of material misstatement of the standalone financial statements, whether due to fraud or error. In making those risk assessments, the auditor considers internal financial control relevant to the Company’s preparation of the standalone financial statements that give a true and fair view in order to design audit procedures that are appropriate in the circumstances. An audit also includes evaluating the appropriateness of the accounting policies used and the reasonableness of the accounting estimates made by the Company’s Directors, as well as evaluating the overall presentation of the standalone financial statements.
We believe that the audit evidence obtained by us is sufficient and appropriate to provide a basis for our audit opinion on the standalone financial statements.
OpinionIn our opinion and to the best of our information and according to the explanations given to us, the aforesaid standalone financial statements give the information required by the Act in the manner so required and give a true and fair view in conformity with the accounting principles generally accepted in India, of the state of affairs of the Company as at March 31, 2018, and its profit, total comprehensive income, the changes in equity and its cash flows for the year ended on that date.
Report on Other Legal and Regulatory Requirements1. As required by Section 143(3) of the Act, based on our audit, we report that:
a. we have sought and obtained all the information and explanations which to the best of our knowledge and belief were necessary for the purposes of our audit.
b. in our opinion, proper books of account as required by law have been kept by the Company so far as it appears from our examination of those books.
c. the Balance Sheet, the Statement of Profit and Loss including other comprehensive income, Statement of Changes in Equity and the Statement of Cash Flows dealt with by this Report are in agreement with the books of account.
d. in our opinion, the aforesaid standalone financial statements comply with the Indian Accounting Standards prescribed under Section 133 of the Act.
Independent Auditors’ Report

Standalone financial statements | 141 Infosys Annual Report 2017-18
e. on the basis of the written representations received from the directors of the Company as on March 31, 2018 taken on record by the Board of Directors, none of the directors is disqualified as on March 31, 2018 from being appointed as a director in terms of Section 164(2) of the Act.
f. with respect to the adequacy of the internal financial controls over financial reporting of the Company and the operating effectiveness of such controls, refer to our separate report in ‘Annexure A’. Our report expresses an unmodified opinion on the adequacy and operating effectiveness of the Company’s internal financial controls over financial reporting.
g. with respect to the other matters to be included in the Auditor’s Report in accordance with Rule 11 of the Companies (Audit and Auditors) Rules, 2014, as amended, in our opinion and to the best of our information and according to the explanations given to us:
i. The Company has disclosed the impact of pending litigations on its financial position in its standalone financial statements.
ii. The Company has made provision, as required under the applicable law or accounting standards, for material foreseeable losses, if any, on long-term contracts including derivative contracts.
iii. There has been no delay in transferring amounts, required to be transferred, to the Investor Education and Protection Fund by the Company.
2. As required by the Companies (Auditor’s Report) Order, 2016 (‘the Order’) issued by the Central Government in terms of Section 143(11) of the Act, we give in ‘Annexure B’ a statement on the matters specified in paragraphs 3 and 4 of the Order.
For Deloitte Haskins & Sells LLPChartered Accountants
Firm’s registration number : 117366W/W-100018
Bengaluru
April 13, 2018
Sd/-
P.R. Ramesh Partner
Membership number : 70928
Annexure A to the Independent Auditors’ Report
(Referred to in paragraph 1(f) under ‘Report on Other Legal and Regulatory Requirements’ section of our report to the members of Infosys Limited of even date)
Report on the Internal Financial Controls Over Financial Reporting under Clause (i) of sub-section 3 of Section 143 of the Companies Act, 2013 (‘the Act’)
We have audited the internal financial controls over financial reporting of INFOSYS LIMITED (‘the Company’) as of March 31, 2018 in conjunction with our audit of the standalone financial statements of the Company for the year ended on that date.
Management’s Responsibility for Internal Financial ControlsThe Board of Directors of the Company is responsible for establishing and maintaining internal financial controls based on the internal control over financial reporting criteria established by the Company considering the essential components of internal control stated in the Guidance Note on Audit of Internal Financial Controls Over Financial Reporting issued by the Institute of Chartered Accountants of India. These responsibilities include the design, implementation and maintenance of adequate internal financial controls that were operating effectively for ensuring the orderly and efficient conduct of its business, the safeguarding of its assets, the prevention and detection of frauds and errors, the accuracy and completeness of the accounting records, and the timely preparation of reliable financial information, as required under the Companies Act, 2013.
Auditor’s ResponsibilityOur responsibility is to express an opinion on the internal financial controls over financial reporting of the Company based on our audit. We conducted our audit in accordance with the Guidance Note on Audit of Internal Financial Controls Over Financial Reporting (the ‘Guidance Note’) issued by the Institute of Chartered Accountants of India and the Standards on Auditing prescribed under Section 143(10) of the Companies Act, 2013, to the extent applicable to an audit of internal financial controls. Those Standards and the Guidance Note require that we comply with ethical requirements and plan and perform the audit to obtain reasonable assurance about whether adequate internal financial controls over financial reporting was established and maintained and if such controls operated effectively in all material respects.
Our audit involves performing procedures to obtain audit evidence about the adequacy of the internal financial controls system over financial reporting and their operating effectiveness. Our audit of internal financial controls over financial reporting included obtaining an understanding of internal financial controls over financial reporting, assessing the risk that a material weakness exists, and testing and evaluating the design and operating effectiveness of internal control based on the assessed risk.
142 | Standalone financial statements Infosys Annual Report 2017-18
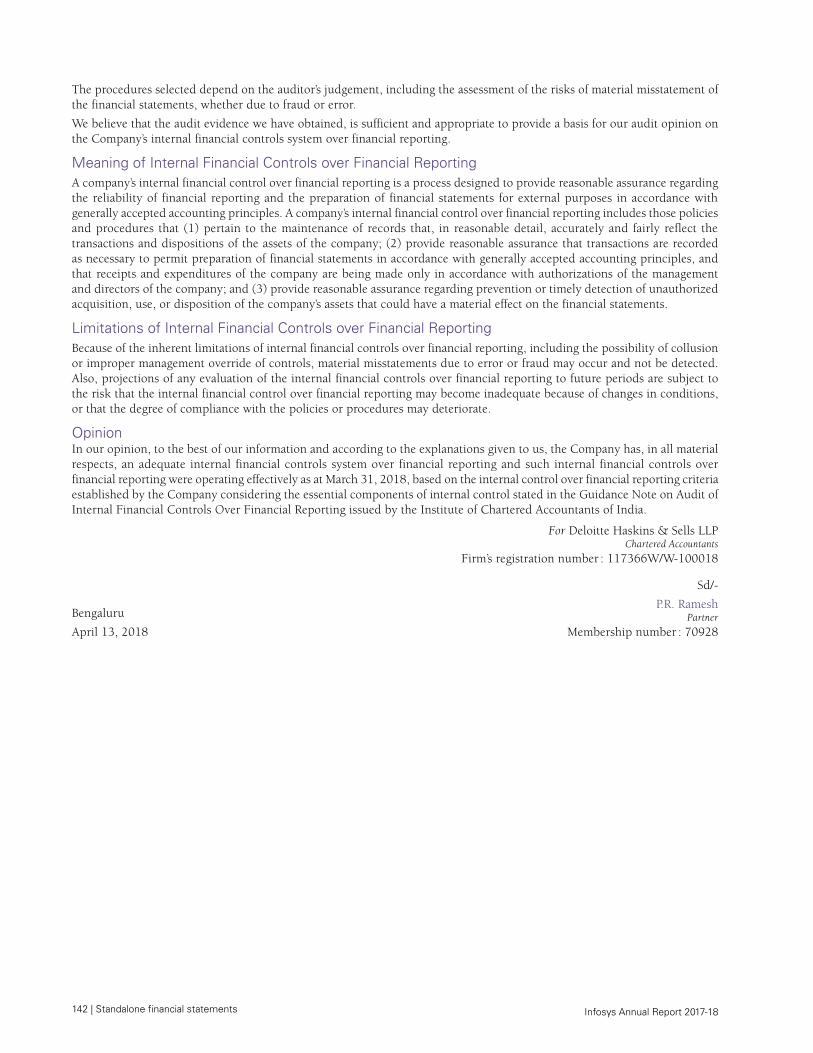
The procedures selected depend on the auditor’s judgement, including the assessment of the risks of material misstatement of the financial statements, whether due to fraud or error.
We believe that the audit evidence we have obtained, is sufficient and appropriate to provide a basis for our audit opinion on the Company’s internal financial controls system over financial reporting.
Meaning of Internal Financial Controls over Financial ReportingA company’s internal financial control over financial reporting is a process designed to provide reasonable assurance regarding the reliability of financial reporting and the preparation of financial statements for external purposes in accordance with generally accepted accounting principles. A company’s internal financial control over financial reporting includes those policies and procedures that (1) pertain to the maintenance of records that, in reasonable detail, accurately and fairly reflect the transactions and dispositions of the assets of the company; (2) provide reasonable assurance that transactions are recorded as necessary to permit preparation of financial statements in accordance with generally accepted accounting principles, and that receipts and expenditures of the company are being made only in accordance with authorizations of the management and directors of the company; and (3) provide reasonable assurance regarding prevention or timely detection of unauthorized acquisition, use, or disposition of the company’s assets that could have a material effect on the financial statements.
Limitations of Internal Financial Controls over Financial ReportingBecause of the inherent limitations of internal financial controls over financial reporting, including the possibility of collusion or improper management override of controls, material misstatements due to error or fraud may occur and not be detected. Also, projections of any evaluation of the internal financial controls over financial reporting to future periods are subject to the risk that the internal financial control over financial reporting may become inadequate because of changes in conditions, or that the degree of compliance with the policies or procedures may deteriorate.
OpinionIn our opinion, to the best of our information and according to the explanations given to us, the Company has, in all material respects, an adequate internal financial controls system over financial reporting and such internal financial controls over financial reporting were operating effectively as at March 31, 2018, based on the internal control over financial reporting criteria established by the Company considering the essential components of internal control stated in the Guidance Note on Audit of Internal Financial Controls Over Financial Reporting issued by the Institute of Chartered Accountants of India.
For Deloitte Haskins & Sells LLPChartered Accountants
Firm’s registration number : 117366W/W-100018
Bengaluru
April 13, 2018
Sd/-
P.R. Ramesh Partner
Membership number : 70928

Standalone financial statements | 143 Infosys Annual Report 2017-18
Annexure B to the Independent Auditors’ Report
(Referred to in paragraph 2 under ‘Report on Other Legal and Regulatory Requirements’ section of our report to the members of Infosys Limited of even date)
i. In respect of the Company’s fixed assets:
a. The Company has maintained proper records showing full particulars, including quantitative details and situation of fixed assets.
b. The Company has a program of verification to cover all the items of fixed assets in a phased manner which, in our opinion, is reasonable having regard to the size of the Company and the nature of its assets. Pursuant to the program, certain fixed assets were physically verified by the Management during the year. According to the information and explanations given to us, no material discrepancies were noticed on such verification.
c. According to the information and explanations given to us, the records examined by us and based on the examination of the conveyance deeds provided to us, we report that, the title deeds, comprising all the immovable properties of land and buildings which are freehold, are held in the name of the Company as at the Balance Sheet date. In respect of immovable properties of land and building that have been taken on lease and disclosed as fixed assets in the standalone financial statements, the lease agreements are in the name of the Company.
ii. The Company is in the business of providing software services and does not have any physical inventories. Accordingly, reporting under Clause 3 (ii) of the Order is not applicable to the Company.
iii. According to the information and explanations given to us, the Company has granted unsecured loans to three bodies corporate, covered in the register maintained under Section 189 of the Companies Act, 2013, in respect of which:
a. The terms and conditions of the grant of such loans are, in our opinion, prima facie, not prejudicial to the Company’s interest.
b. The schedule of repayment of principal and payment of interest has been stipulated and repayments or receipts of principal amounts and interest have been regular as per stipulations.
c. There is no overdue amount remaining outstanding as at the year-end.iv. In our opinion and according to the information and explanations given to us, the Company has complied with the
provisions of Sections 185 and 186 of the Act in respect of grant of loans, making investments and providing guarantees and securities, as applicable.
v. The Company has not accepted deposits during the year and does not have any unclaimed deposits as at March 31, 2018 and therefore, the provisions of the clause 3 (v) of the Order are not applicable to the Company.
vi. The maintenance of cost records has not been specified by the Central Government under Section 148(1) of the Companies Act, 2013 for the business activities carried out by the Company. Thus reporting under Clause 3(vi) of the order is not applicable to the Company.
vii. According to the information and explanations given to us, in respect of statutory dues:
a. The Company has generally been regular in depositing undisputed statutory dues, including Provident Fund, Employees’ State Insurance, Income Tax, Sales Tax, Service Tax, Goods and Service Tax, Value Added Tax, Customs Duty, Excise Duty, Cess and other material statutory dues applicable to it with the appropriate authorities.
b. There were no undisputed amounts payable in respect of Provident Fund, Employees’ State Insurance, Income Tax, Sales Tax, Service Tax, Value Added Tax, Goods and Service Tax, Customs Duty, Excise Duty, Cess and other material statutory dues in arrears as at March 31, 2018 for a period of more than six months from the date they became payable.

144 | Standalone financial statements Infosys Annual Report 2017-18
c. Details of dues of Income Tax, Sales Tax, Service Tax, Excise Duty and Value Added Tax which have not been deposited as at March 31, 2018 on account of dispute are given below:
Nature of the statute
Nature of dues Forum where dispute is pending
Period to which the amount relates
Amount in ` crore
The Income Tax Act, 1961
Income Tax Appellate Tribunal A.Y. 2010-11 to A.Y. 2013-14 and AY 2016-17
1,391
Income Tax Appellate Authority upto Commissioner’s level
A.Y. 2008-09 to A.Y. 2018-19
2,192
Finance Act, 1994 Service Tax Appellate Tribunal F.Y 2004-05 to F.Y 2014-15 60Central Excise Act, 1944
Excise Duty Appellate Tribunal F.Y 2005-06 to F.Y 2015-16 68
Sales Tax Act and VAT Laws
Sales Tax and Interest
High Court F.Y. 2007-08 (1) –
Appellate Authority upto Commissioner’s level
F.Y. 2006-07 to F.Y. 2010-11, F.Y 2012-13 and F.Y 2014-15 to F.Y 2016-17 22
Specified Officer of SEZ F.Y 2008-09 to F.Y 2011-12 5(1) Less than ` 1 crore
viii. The Company has not taken any loans or borrowings from financial institutions, banks and government or has not issued any debentures. Hence reporting under Clause 3 (viii) of the Order is not applicable to the Company.
ix. The Company has not raised moneys by way of initial public offer or further public offer (including debt instruments) or term loans and hence reporting under Clause 3 (ix) of the Order is not applicable to the Company.
x. To the best of our knowledge and according to the information and explanations given to us, no fraud by the Company or no material fraud on the Company by its officers or employees has been noticed or reported during the year.
xi. In our opinion and according to the information and explanations given to us, the Company has paid/provided managerial remuneration in accordance with the requisite approvals mandated by the provisions of Section 197 read with Schedule V to the Act.
xii. The Company is not a nidhi company and hence, reporting under Clause 3 (xii) of the Order is not applicable to the Company.xiii. In our opinion and according to the information and explanations given to us, the Company is in compliance with Section
177 and 188 of the Companies Act, 2013 where applicable, for all transactions with the related parties and the details of related party transactions have been disclosed in the standalone financial statements as required by the applicable accounting standards.
xiv. During the year, the Company has not made any preferential allotment or private placement of shares or fully or partly paid convertible debentures and hence, reporting under Clause 3 (xiv) of the Order is not applicable to the Company.
xv. In our opinion and according to the information and explanations given to us, during the year the Company has not entered into any non-cash transactions with its directors or persons connected to its directors and hence provisions of Section 192 of the Companies Act, 2013 are not applicable to the Company.
xvi. The Company is not required to be registered under Section 45-IA of the Reserve Bank of India Act, 1934.
For Deloitte Haskins & Sells LLPChartered Accountants
Firm’s registration number : 117366W/W-100018
Bengaluru
April 13, 2018
Sd/-
P.R. Ramesh Partner
Membership number : 70928

Standalone financial statements | 145 Infosys Annual Report 2017-18
Balance Sheet
in ` crore
Particulars Note no. As at March 31, 2018 2017
ASSETSNON-CURRENT ASSETS
Property, plant and equipment 2.1 9,027 8,605 Capital work-in-progress 1,442 1,247 Goodwill 2.2.1 29 – Other intangible assets 2.2.2 101 – Financial assets
Investments 2.3 11,993 15,334 Loans 2.4 19 5 Other financial assets 2.5 177 216
Deferred tax assets (net) 2.15 1,128 346 Income tax assets (net) 2.15 5,710 5,454 Other non-current assets 2.8 2,161 996
TOTAL NON-CURRENT ASSETS 31,787 32,203 CURRENT ASSETS
Financial assets Investments 2.3 5,906 9,643 Trade receivables 2.6 12,151 10,960 Cash and cash equivalents 2.7 16,770 19,153 Loans 2.4 393 310 Other financial assets 2.5 5,906 5,403
Other current assets 2.8 1,439 2,213 42,565 47,682
Assets held for sale 2.26 1,525 – TOTAL CURRENT ASSETS 44,090 47,682
TOTAL ASSETS 75,877 79,885 EQUITY AND LIABILITIES
EQUITY Equity share capital 2.10 1,092 1,148 Other equity 62,410 66,869
TOTAL EQUITY 63,502 68,017
Balance Sheet
146 | Standalone financial statements Infosys Annual Report 2017-18
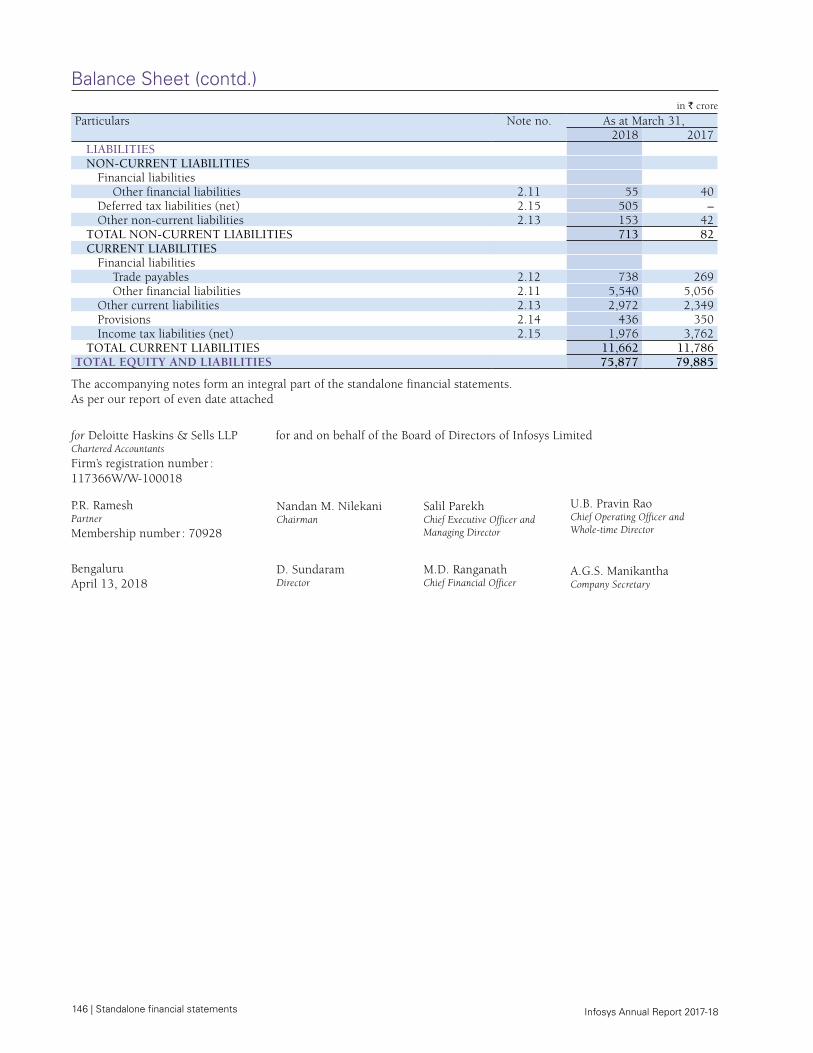
Balance Sheet (contd.)in ` crore
Particulars Note no. As at March 31, 2018 2017
LIABILITIES NON-CURRENT LIABILITIES
Financial liabilitiesOther financial liabilities 2.11 55 40
Deferred tax liabilities (net) 2.15 505 – Other non-current liabilities 2.13 153 42
TOTAL NON-CURRENT LIABILITIES 713 82 CURRENT LIABILITIES
Financial liabilitiesTrade payables 2.12 738 269 Other financial liabilities 2.11 5,540 5,056
Other current liabilities 2.13 2,972 2,349 Provisions 2.14 436 350 Income tax liabilities (net) 2.15 1,976 3,762
TOTAL CURRENT LIABILITIES 11,662 11,786 TOTAL EQUITY AND LIABILITIES 75,877 79,885
The accompanying notes form an integral part of the standalone financial statements.As per our report of even date attached
for Deloitte Haskins & Sells LLPChartered Accountants
Firm’s registration number : 117366W/W-100018
for and on behalf of the Board of Directors of Infosys Limited
P.R. RameshPartner
Membership number : 70928
Nandan M. NilekaniChairman
Salil ParekhChief Executive Officer and Managing Director
U.B. Pravin RaoChief Operating Officer and Whole‑time Director
BengaluruApril 13, 2018
D. SundaramDirector
M.D. RanganathChief Financial Officer
A.G.S. ManikanthaCompany Secretary
Standalone financial statements | 147 Infosys Annual Report 2017-18
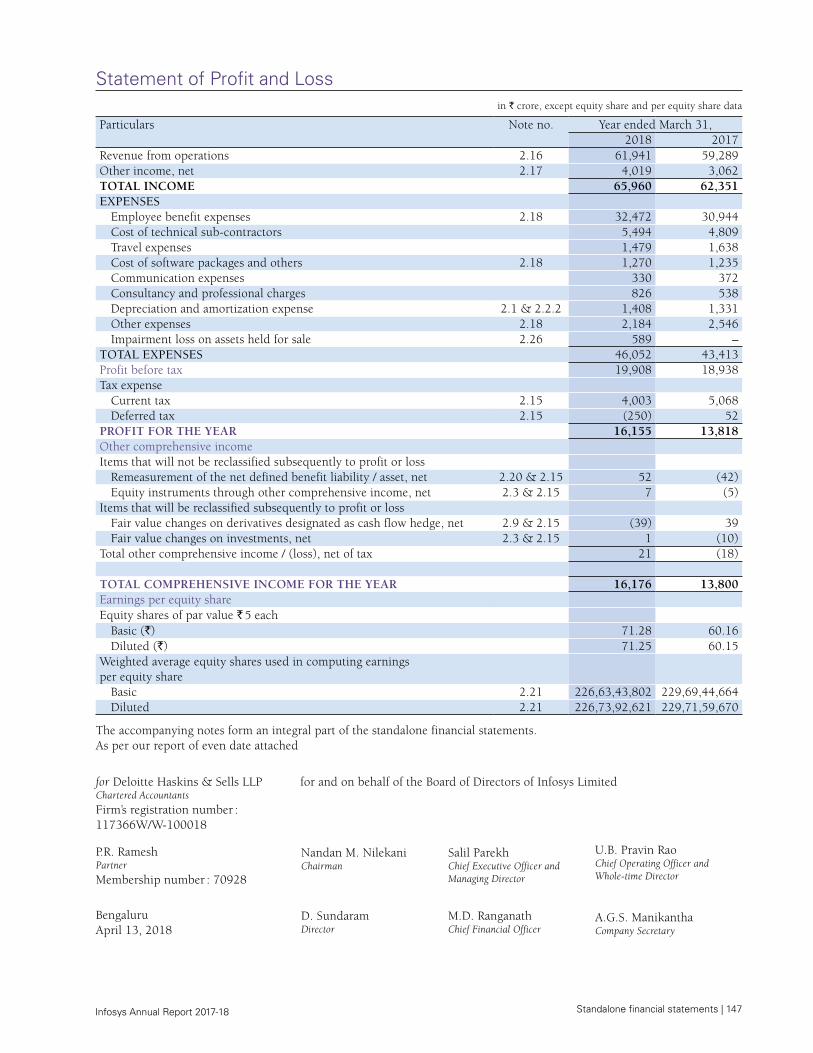
Statement of Profit and Loss in ` crore, except equity share and per equity share data
Particulars Note no. Year ended March 31,2018 2017
Revenue from operations 2.16 61,941 59,289 Other income, net 2.17 4,019 3,062 TOTAL INCOME 65,960 62,351 EXPENSES
Employee benefit expenses 2.18 32,472 30,944 Cost of technical sub-contractors 5,494 4,809 Travel expenses 1,479 1,638 Cost of software packages and others 2.18 1,270 1,235 Communication expenses 330 372 Consultancy and professional charges 826 538 Depreciation and amortization expense 2.1 & 2.2.2 1,408 1,331 Other expenses 2.18 2,184 2,546 Impairment loss on assets held for sale 2.26 589 –
TOTAL EXPENSES 46,052 43,413 Profit before tax 19,908 18,938 Tax expense
Current tax 2.15 4,003 5,068 Deferred tax 2.15 (250) 52
PROFIT FOR THE YEAR 16,155 13,818 Other comprehensive income Items that will not be reclassified subsequently to profit or loss
Remeasurement of the net defined benefit liability / asset, net 2.20 & 2.15 52 (42)Equity instruments through other comprehensive income, net 2.3 & 2.15 7 (5)
Items that will be reclassified subsequently to profit or lossFair value changes on derivatives designated as cash flow hedge, net 2.9 & 2.15 (39) 39 Fair value changes on investments, net 2.3 & 2.15 1 (10)
Total other comprehensive income / (loss), net of tax 21 (18)
TOTAL COMPREHENSIVE INCOME FOR THE YEAR 16,176 13,800 Earnings per equity share Equity shares of par value ` 5 each
Basic (`) 71.28 60.16Diluted (`) 71.25 60.15
Weighted average equity shares used in computing earnings per equity share
Basic 2.21 226,63,43,802 229,69,44,664 Diluted 2.21 226,73,92,621 229,71,59,670
The accompanying notes form an integral part of the standalone financial statements.As per our report of even date attached
for Deloitte Haskins & Sells LLPChartered Accountants
Firm’s registration number : 117366W/W-100018
for and on behalf of the Board of Directors of Infosys Limited
P.R. RameshPartner
Membership number : 70928
Nandan M. NilekaniChairman
Salil ParekhChief Executive Officer and Managing Director
U.B. Pravin RaoChief Operating Officer and Whole‑time Director
BengaluruApril 13, 2018
D. SundaramDirector
M.D. RanganathChief Financial Officer
A.G.S. ManikanthaCompany Secretary
Statement of Profit and Loss

148 | Standalone financial statements Infosys Annual Report 2017-18
Sta
tem
ent
of C
hang
es in
Equ
ity in
` c
rore
Part
icul
ars
Equ
ity
shar
e ca
pita
l
Oth
er e
quit
yTo
tal e
quit
y at
trib
utab
le
to e
quit
y ho
lder
s of
the
C
ompa
ny
Res
erve
s an
d su
rplu
sO
ther
com
preh
ensi
ve in
com
eSe
curi
ties
pr
emiu
m
rese
rve
Ret
aine
d ea
rnin
gsG
ener
al
rese
rve
Shar
e op
tion
s ou
tsta
ndin
g ac
coun
t
Spec
ial
Eco
nom
ic
Zon
e R
e-in
vest
men
t R
eser
ve(1
)
Cap
ital
res
erve
Cap
ital
re
dem
ptio
n re
serv
e
Equ
ity
inst
rum
ents
th
roug
h ot
her
com
preh
ensi
ve
inco
me
Eff
ecti
ve
port
ion
of c
ash
flow
he
dges
Oth
er it
ems
of o
ther
co
mpr
ehen
sive
in
com
e
Cap
ital
re
serv
eBu
sine
ss
tran
sfer
ad
just
men
t re
serv
e(2)
Bal
ance
as
at A
pril
1, 2
016
1,1
48
2,20
444
,698
9,50
8 9
–
5
4 3
,448
–
–
–
13
61,0
82C
hang
es in
equ
ity
for
the
year
en
ded
Mar
ch 3
1, 2
017
Tran
sfer
to
gene
ral r
eser
ve –
–
(1
,579
) 1
,579
–
–
–
–
–
–
–
–
–
Tr
ansf
erre
d to
Spe
cial
Eco
nom
ic
Zon
e R
e-in
vest
men
t R
eser
ve –
–
(
953)
–
–
953
–
–
–
–
–
–
–
Tr
ansf
erre
d fr
om S
peci
al
Eco
nom
ic Z
one
Re-
inve
stm
ent
Res
erve
on
utili
zati
on –
–
9
53
–
–
(95
3) –
–
–
–
–
–
–
E
xerc
ise
of s
tock
opt
ions
(R
efer
to N
ote
2.10
) –
3
–
–
(
3) –
–
–
–
–
–
–
–
In
com
e ta
x be
nefi
t ar
isin
g on
ex
erci
se o
f st
ock
opti
ons
–
1
–
–
–
–
–
–
–
–
–
–
1
Shar
e-ba
sed
paym
ent
to
empl
oyee
s of
the
gro
up
(Ref
er to
Not
e 2.
10)
–
–
–
–
114
–
–
–
–
–
–
–
1
14
Rem
easu
rem
ent
of t
he n
et
defi
ned
bene
fit
liabi
lity/
asse
t(3)
–
–
–
–
–
–
–
–
–
–
–
(42
) (
42)
Fair
val
ue c
hang
es o
n de
riva
tive
s de
sign
ated
as
cash
fl
ow h
edge
(3) (
Ref
er to
Not
e 2.
9) –
–
–
–
–
–
–
–
–
–
3
9 –
3
9 Fa
ir v
alue
cha
nges
on
inve
stm
ents
, net
(3)
(Ref
er to
Not
e 2.
3) –
–
–
–
–
–
–
–
–
–
–
(
10)
(10
)E
quit
y in
stru
men
ts t
hrou
gh
othe
r co
mpr
ehen
sive
inco
me(3
) (R
efer
to N
ote
2.3)
–
–
–
–
–
–
–
–
–
(5)
–
–
(5)
Div
iden
ds (
incl
udin
g di
vide
nd
dist
ribu
tion
tax
) –
–
(6,9
80)
–
–
–
–
–
–
–
–
–
(6,
980)
Prof
it f
or t
he y
ear
–
–
13,
818
–
–
–
–
–
–
–
–
–
13,
818
Bal
ance
as
at M
arch
31,
201
7 1
,148
2,
208
49,9
5711
,087
120
–
5
4 3
,448
–
(
5) 3
9 (
39)
68,
017
Sta
tem
ent
of C
hang
es in
Equ
ity
Standalone financial statements | 149 Infosys Annual Report 2017-18
Sta
tem
ent
of C
hang
es in
Equ
ity (c
ontd
.)in
` c
rore
Part
icul
ars
Equ
ity
shar
e ca
pita
l
Oth
er e
quit
yTo
tal e
quit
y at
trib
utab
le
to e
quit
y ho
lder
s of
the
C
ompa
ny
Res
erve
s an
d su
rplu
sO
ther
com
preh
ensi
ve in
com
eSe
curi
ties
pr
emiu
m
rese
rve
Ret
aine
d ea
rnin
gsG
ener
al
rese
rve
Shar
e op
tion
s ou
tsta
ndin
g ac
coun
t
Spec
ial
Eco
nom
ic
Zon
e R
e-in
vest
men
t R
eser
ve(1
)
Cap
ital
res
erve
Cap
ital
re
dem
ptio
n re
serv
e
Equ
ity
inst
rum
ents
th
roug
h ot
her
com
preh
ensi
ve
inco
me
Eff
ecti
ve
port
ion
of c
ash
flow
he
dges
Oth
er it
ems
of o
ther
co
mpr
ehen
sive
in
com
e
Cap
ital
re
serv
eBu
sine
ss
tran
sfer
ad
just
men
t re
serv
e(2)
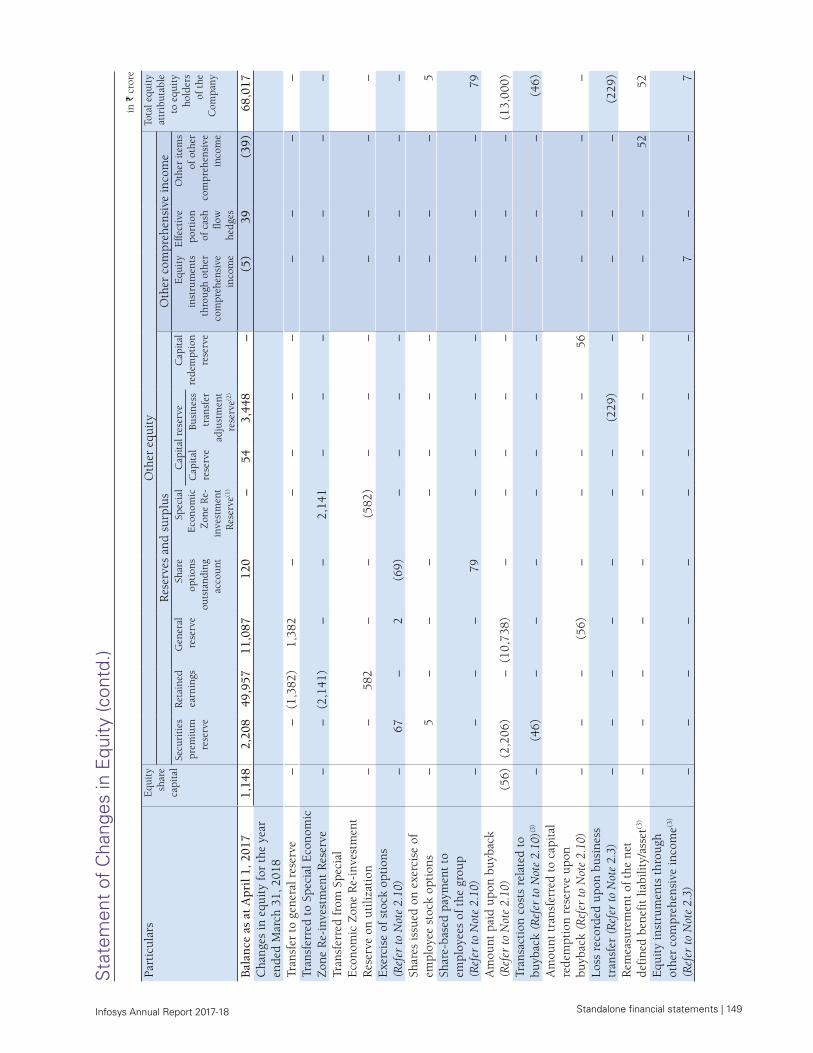
Bal
ance
as
at A
pril
1, 2
017
1,1
48
2,20
849
,957
11,0
87 1
20
–
54
3,4
48
–
(5)
39
(39
) 6
8,01
7 C
hang
es in
equ
ity
for
the
year
en
ded
Mar
ch 3
1, 2
018
Tran
sfer
to
gene
ral r
eser
ve–
–(1
,382
)1,
382
––
––
––
––
–Tr
ansf
erre
d to
Spe
cial
Eco
nom
ic
Zon
e R
e-in
vest
men
t R
eser
ve
–
–
(2
,141
) –
–
2
,141
–
–
–
–
–
–
–
Tr
ansf
erre
d fr
om S
peci
al
Eco
nom
ic Z
one
Re-
inve
stm
ent
Res
erve
on
utili
zati
on –
–
5
82
–
–
(58
2) –
–
–
–
–
–
–
E
xerc
ise
of s
tock
opt
ions
(R
efer
to N
ote
2.10
) –
6
7 –
2
(
69)
–
–
–
–
–
–
–
–
Shar
es is
sued
on
exer
cise
of
empl
oyee
sto
ck o
ptio
ns –
5
–
–
–
–
–
–
–
–
–
–
5
Sh
are-
base
d pa
ymen
t to
em
ploy
ees
of t
he g
roup
(R
efer
to N
ote
2.10
) –
–
–
–
7
9 –
–
–
–
–
–
–
7
9 A
mou
nt p
aid
upon
buy
back
(R
efer
to N
ote
2.10
) (
56)
(2
,206
) –
(1
0,73
8) –
–
–
–
–
–
–
–
(
13,0
00)
Tran
sact
ion
cost
s re
late
d to
bu
ybac
k (R
efer
to N
ote
2.10
)(3)
–
(46
) –
–
–
–
–
–
–
–
–
–
(
46)
Am
ount
tra
nsfe
rred
to
capi
tal
rede
mpt
ion
rese
rve
upon
bu
ybac
k (R
efer
to N
ote
2.10
) –
–
–
(
56)
–
–
–
–
56
–
–
–
–
Loss
rec
orde
d up
on b
usin
ess
tran
sfer
(R
efer
to N
ote
2.3)
–
–
–
–
–
–
–
(22
9) –
–
–
–
(
229)
Rem
easu
rem
ent
of t
he n
et
defi
ned
bene
fit
liabi
lity/
asse
t(3)
–
–
–
–
–
–
–
–
–
–
–
52
52
Equ
ity
inst
rum
ents
thr
ough
ot
her
com
preh
ensi
ve in
com
e(3)
(Ref
er to
Not
e 2.
3)–
–
–
–
–
–
–
–
–
7
–
–
7
150 | Standalone financial statements Infosys Annual Report 2017-18
Part
icul
ars
Equ
ity
shar
e ca
pita
l
Oth
er e
quit
yTo
tal e
quit
y at
trib
utab
le
to e
quit
y ho
lder
s of
the
C
ompa
ny
Res
erve
s an
d su
rplu
sO
ther
com
preh
ensi
ve in
com
eSe
curi
ties
pr
emiu
m
rese
rve
Ret
aine
d ea
rnin
gsG
ener
al
rese
rve
Shar
e op
tion
s ou
tsta
ndin
g ac
coun
t
Spec
ial
Eco
nom
ic
Zon
e R
e-in
vest
men
t R
eser
ve(1
)
Cap
ital
res
erve
Cap
ital
re
dem
ptio
n re
serv
e
Equ
ity
inst
rum
ents
th
roug
h ot
her
com
preh
ensi
ve
inco
me
Eff
ecti
ve
port
ion
of c
ash
flow
he
dges
Oth
er it
ems
of o
ther
co
mpr
ehen
sive
in
com
e
Cap
ital
re
serv
eBu
sine
ss
tran
sfer
ad
just
men
t re
serv
e(2)
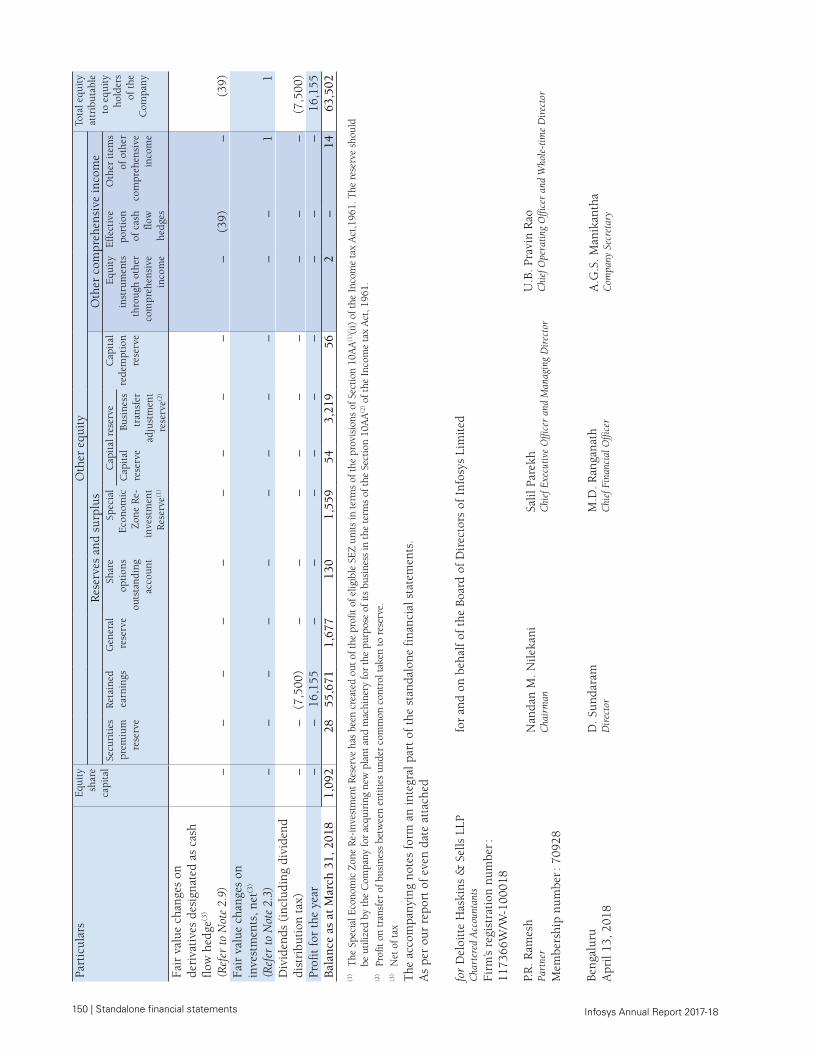
Fair
val
ue c
hang
es o
n de
riva
tive
s de
sign
ated
as
cash
fl
ow h
edge
(3)
(Ref
er to
Not
e 2.
9) –
–
–
–
–
–
–
–
–
–
(
39)
–
(39
)Fa
ir v
alue
cha
nges
on
inve
stm
ents
, net
(3)
(Ref
er to
Not
e 2.
3) –
–
–
–
–
–
–
–
–
–
–
1
1
D
ivid
ends
(in
clud
ing
divi
dend
di
stri
buti
on t
ax)
–
–
(7
,500
) –
–
–
–
–
–
–
–
–
(
7,50
0)Pr
ofit
for
the
yea
r –
–
1
6,15
5 –
–
–
–
–
–
–
–
–
1
6,15
5 B
alan
ce a
s at
Mar
ch 3
1, 2
018
1,0
92
28
55,6
71 1
,677
1
30
1,5
59
54
3,2
19
56
2
–
14
63,
502
(1)
The
Spe
cial
Eco
nom
ic Z
one
Re-
inve
stm
ent R
eser
ve h
as b
een
crea
ted
out o
f the
pro
fit o
f elig
ible
SEZ
uni
ts in
term
s of
the
prov
isio
ns o
f Sec
tion
10A
A(1
) (ii)
of t
he I
ncom
e ta
x A
ct,1
961.
The
res
erve
sho
uld
be u
tiliz
ed b
y th
e C
ompa
ny fo
r ac
quir
ing
new
pla
nt a
nd m
achi
nery
for
the
purp
ose
of it
s bu
sine
ss in
the
term
s of
the
Sect
ion
10A
A(2
) of t
he I
ncom
e ta
x A
ct, 1
961.
(2)
Prof
it on
tran
sfer
of b
usin
ess
betw
een
entit
ies
unde
r co
mm
on c
ontr
ol ta
ken
to r
eser
ve.
(3)
Net
of t
ax
The
acc
ompa
nyin
g no
tes
form
an
inte
gral
par
t of
the
sta
ndal
one
fina
ncia
l sta
tem
ents
.A
s pe
r ou
r re
port
of
even
dat
e at
tach
ed
for
Del
oitt
e H
aski
ns &
Sel
ls L
LPC
hart
ered
Acc
ount
ants
Firm
’s re
gist
rati
on n
umbe
r :
1173
66W
/W-1
0001
8
for
and
on b
ehal
f of
the
Boa
rd o
f D
irec
tors
of
Info
sys
Lim
ited
P.R
. Ram
esh
Part
ner
Mem
bers
hip
num
ber :
709
28
Nan
dan
M. N
ileka
niC
hair
man
Salil
Par
ekh
Chi
ef E
xecu
tive
Offi
cer
and
Man
agin
g D
irec
tor
U.B
. Pra
vin
Rao
Chi
ef O
pera
ting
Offi
cer
and
Who
le‑t
ime
Dir
ecto
r
Beng
alur
uA
pril
13, 2
018
D. S
unda
ram
Dir
ecto
rM
.D. R
anga
nath
Chi
ef F
inan
cial
Offi
cer
A.G
.S. M
anik
anth
aC
ompa
ny S
ecre
tary
Standalone financial statements | 151 Infosys Annual Report 2017-18
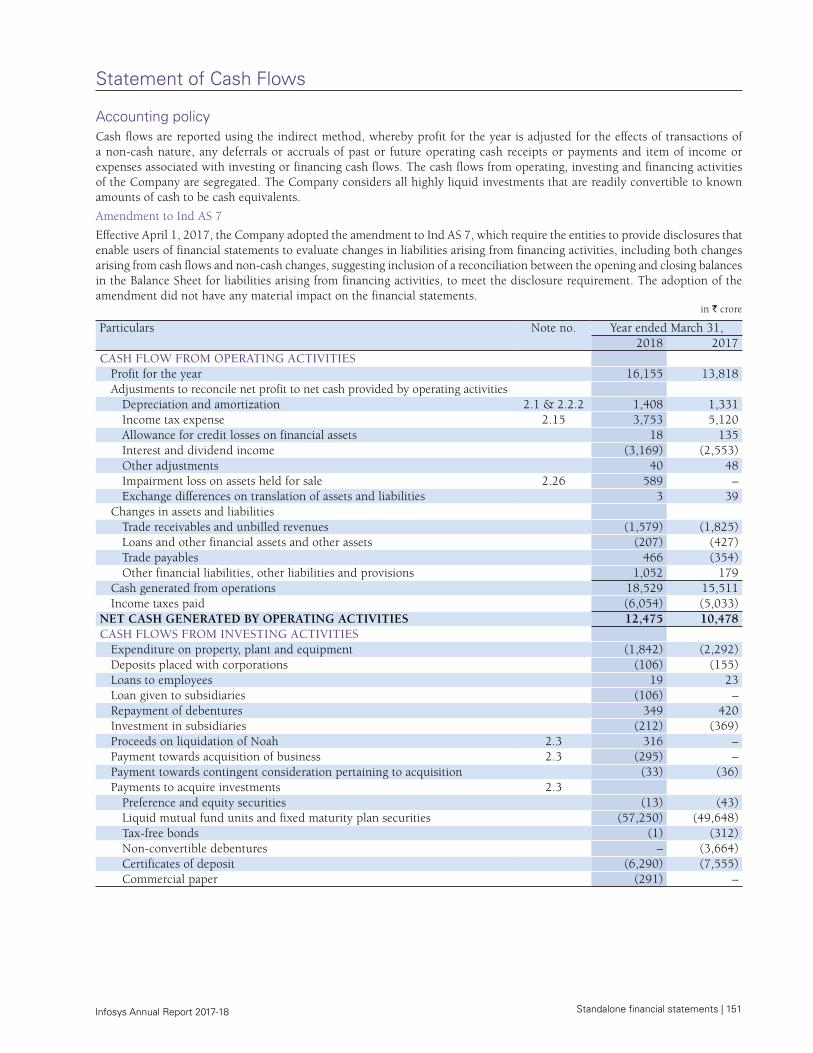
Statement of Cash Flows
Accounting policyCash flows are reported using the indirect method, whereby profit for the year is adjusted for the effects of transactions of a non-cash nature, any deferrals or accruals of past or future operating cash receipts or payments and item of income or expenses associated with investing or financing cash flows. The cash flows from operating, investing and financing activities of the Company are segregated. The Company considers all highly liquid investments that are readily convertible to known amounts of cash to be cash equivalents.
Amendment to Ind AS 7
Effective April 1, 2017, the Company adopted the amendment to Ind AS 7, which require the entities to provide disclosures that enable users of financial statements to evaluate changes in liabilities arising from financing activities, including both changes arising from cash flows and non-cash changes, suggesting inclusion of a reconciliation between the opening and closing balances in the Balance Sheet for liabilities arising from financing activities, to meet the disclosure requirement. The adoption of the amendment did not have any material impact on the financial statements.
in ` crore
Particulars Note no. Year ended March 31,2018 2017
CASH FLOW FROM OPERATING ACTIVITIESProfit for the year 16,155 13,818 Adjustments to reconcile net profit to net cash provided by operating activities
Depreciation and amortization 2.1 & 2.2.2 1,408 1,331 Income tax expense 2.15 3,753 5,120 Allowance for credit losses on financial assets 18 135 Interest and dividend income (3,169) (2,553)Other adjustments 40 48 Impairment loss on assets held for sale 2.26 589 – Exchange differences on translation of assets and liabilities 3 39
Changes in assets and liabilitiesTrade receivables and unbilled revenues (1,579) (1,825)Loans and other financial assets and other assets (207) (427)Trade payables 466 (354)Other financial liabilities, other liabilities and provisions 1,052 179
Cash generated from operations 18,529 15,511 Income taxes paid (6,054) (5,033)
NET CASH GENERATED BY OPERATING ACTIVITIES 12,475 10,478 CASH FLOWS FROM INVESTING ACTIVITIES
Expenditure on property, plant and equipment (1,842) (2,292)Deposits placed with corporations (106) (155)Loans to employees 19 23 Loan given to subsidiaries (106) – Repayment of debentures 349 420 Investment in subsidiaries (212) (369)Proceeds on liquidation of Noah 2.3 316 – Payment towards acquisition of business 2.3 (295) – Payment towards contingent consideration pertaining to acquisition (33) (36)Payments to acquire investments 2.3
Preference and equity securities (13) (43)Liquid mutual fund units and fixed maturity plan securities (57,250) (49,648)Tax-free bonds (1) (312)Non-convertible debentures – (3,664)Certificates of deposit (6,290) (7,555)Commercial paper (291) –
Statement of Cash Flows

152 | Standalone financial statements Infosys Annual Report 2017-18
Particulars Note no. Year ended March 31,2018 2017
Proceeds on sale of investments 2.3Preference and equity securities 10 – Liquid mutual fund units and fixed maturity plan securities 59,364 47,495 Tax-free bonds – 2 Non-convertible debentures 100 – Certificates of deposit 9,411 –
Dividend received from subsidiaries 846 – Interest and dividend received 1,708 2,640
NET CASH FROM / (USED IN) INVESTING ACTIVITIES 5,684 (13,494)CASH FLOW FROM FINANCING ACTIVITIES
Shares issued on exercise of employee stock options 5 – Buyback including transaction cost 2.10 (13,046) – Payment of dividends (including dividend distribution tax) (7,495) (6,968)
NET CASH USED IN FINANCING ACTIVITIES (20,536) (6,968)Effect of exchange differences on translation of foreign currency cash and cash equivalents (6) (39)Net decrease in cash and cash equivalents (2,377) (9,984)Cash and cash equivalents at the beginning of the year 2.7 19,153 29,176 CASH AND CASH EQUIVALENTS AT THE END OF THE YEAR 2.7 16,770 19,153 Supplementary information
Restricted cash balance 2.7 375 411
The accompanying notes form an integral part of the standalone financial statements.As per our report of even date attached
for Deloitte Haskins & Sells LLPChartered Accountants
Firm’s registration number : 117366W/W-100018
for and on behalf of the Board of Directors of Infosys Limited
P.R. RameshPartner
Membership number : 70928
Nandan M. NilekaniChairman
Salil ParekhChief Executive Officer and Managing Director
U.B. Pravin RaoChief Operating Officer and Whole‑time Director
BengaluruApril 13, 2018
D. SundaramDirector
M.D. RanganathChief Financial Officer
A.G.S. ManikanthaCompany Secretary
Standalone financial statements | 153 Infosys Annual Report 2017-18
Overview and notes to the financial statements
1. Overview
1.1 Company overview Infosys Limited (‘the Company’ or Infosys) is a leading provider of consulting, technology, outsourcing, next-generation services and software. Along with its subsidiaries, Infosys provides business IT services (comprising application development and maintenance, independent validation, infrastructure management, engineering services comprising product engineering and life-cycle solutions and business process management); consulting and systems integration services (comprising consulting, enterprise solutions, systems integration and advanced technologies); products, business platforms and solutions to accelerate intellectual property-led innovation. Its new offerings span areas like digital, big data and analytics, cloud, data and mainframe modernization, cyber security, IoT engineering services and API and micro services.
The Company is a public limited company incorporated and domiciled in India and has its registered office in Bengaluru, Karnataka, India. The Company has its primary listings on the BSE Limited and National Stock Exchange of India Limited, in India. The Company’s American Depositary Shares (ADSs) representing equity shares are also listed on the New York Stock Exchange (NYSE), Euronext London and Euronext Paris.
The Company has proposed to voluntarily delist its ADSs from the Euronext Paris and Euronext London exchanges due to low average daily trading volume of Infosys ADSs on these exchanges. The proposed delisting is subject to approval from the said stock exchanges.
The financial statements are approved for issue by the Company’s Board of Directors on April 13, 2018.
1.2 Basis of preparation of financial statements These financial statements are prepared in accordance with Indian Accounting Standards (Ind AS), under the historical cost convention on the accrual basis except for certain financial instruments which are measured at fair values, the provisions of the Companies Act , 2013 (‘the Act’) (to the extent notified) and guidelines issued by the Securities and Exchange Board of India (SEBI). The Ind AS are prescribed under Section 133 of the Act read with Rule 3 of the Companies (Indian Accounting Standards) Rules, 2015 and the relevant amendment rules issued thereafter.
Effective April 1, 2016, the Company has adopted all the Ind AS standards and the adoption was carried out in accordance with Ind AS 101, First‑time Adoption of Indian Accounting Standards, with April 1, 2015 as the transition date. The transition was carried out from Indian Accounting Principles generally accepted in India as prescribed under Section 133 of the Act, read with Rule 7 of the Companies (Accounts) Rules, 2014 (IGAAP), which was the previous GAAP.
Accounting policies have been consistently applied except where a newly-issued accounting standard is initially adopted or a revision to an existing accounting standard requires a change in the accounting policy hitherto in use.
Amounts for the year ended March 31, 2017 and as at March 31, 2017 were audited by previous auditors - B S R & Co LLP.
As the year-end figures are taken from the source and rounded to the nearest digits, the figures reported for the previous quarters might not always add up to the year-end figures reported in this statement.
1.3 Use of estimates and judgmentsThe preparation of the financial statements in conformity with Ind AS requires the Management to make estimates, judgments and assumptions. These estimates, judgments and assumptions affect the application of accounting policies and the reported amounts of assets and liabilities, the disclosures of contingent assets and liabilities at the date of the financial statements and reported amounts of revenues and expenses during the period. The application of accounting policies that require critical accounting estimates involving complex and subjective judgments and the use of assumptions in these financial statements have been disclosed in Note 1.4. Accounting estimates could change from period to period. Actual results could differ from those estimates. Appropriate changes in estimates are made as the Management becomes aware of changes in circumstances surrounding the estimates. Changes in estimates are reflected in the financial statements in the period in which changes are made and, if material, their effects are disclosed in the notes to the financial statements.
1.4 Critical accounting estimates
a. Revenue recognition The Company uses the percentage-of-completion method in accounting for its fixed-price contracts. Use of the percentage-of-completion method requires the Company to estimate the efforts or costs expended to date as a proportion of the total efforts or costs to be expended. Efforts or costs expended have been used to measure progress towards completion as there is a direct relationship between input and productivity. Provisions for estimated losses, if any, on uncompleted contracts are recorded in the period in which such losses become probable based on the expected contract estimates at the reporting date.
b. Income taxes The Company’s two major tax jurisdictions are India and the US, though the Company also files tax returns in other overseas jurisdictions. Significant judgments are involved in determining the provision for income taxes, including amount expected to be paid/recovered for uncertain tax positions. Also, refer to Notes 2.15 and 2.22.
c. Property, plant and equipment Property, plant and equipment represent a significant proportion of the asset base of the Company. The charge in respect of periodic depreciation is derived after determining an estimate of an asset’s expected useful life and the expected residual value at the end of its life. The useful lives and residual values of Company’s assets are determined by the Management at the time the asset is acquired and reviewed
Notes to the Financial Statements

154 | Standalone financial statements Infosys Annual Report 2017-18
periodically, including at each financial year end. The lives are based on historical experience with similar assets as well as anticipation of future events, which may impact their life, such as changes in technology.
d. Non-current assets held for saleAssets held for sale are measured at the lower of carrying amount or fair value less costs to sell. The determination of fair value less costs to sell includes use of management estimates and assumptions. The fair value of the asset held for sale has been estimated using valuation techniques (mainly income and market approach), which include unobservable inputs.
1.5 Recent accounting pronouncements Appendix B to Ind AS 21, Foreign currency transactions and advance consideration: On March 28, 2018, the Ministry of Corporate Affairs (‘the MCA’) notified the Companies (Indian Accounting Standards) Amendment Rules, 2018 containing Appendix B to Ind AS 21, Foreign currency transactions and advance consideration which clarifies the date of the transaction for the purpose of determining the exchange rate to use on initial recognition of the related asset, expense or income, when an entity has received or paid advance consideration in a foreign currency.
The amendment will come into force from April 1, 2018. The Company has evaluated the effect of this on the financial statements and the impact is not material.
Ind AS 115, Revenue from Contract with Customers : On March 28, 2018, the MCA notified the Ind AS 115. The core principle of the new standard is that an entity should recognize revenue to depict the transfer of promised goods or services to customers in an amount that reflects the consideration to which the entity expects to be entitled in exchange for those goods or services. Further, the new standard requires enhanced disclosures about the nature, amount, timing and uncertainty of revenue and cash flows arising from the entity’s contracts with customers.
The standard permits two possible methods of transition:
• Retrospective approach - Under this approach the standard will be applied retrospectively to each prior reporting period presented in accordance with Ind AS 8, Accounting Policies, Changes in Accounting Estimates and Errors.
• Retrospectively with cumulative effect of initially applying the standard recognized at the date of initial application (Cumulative catch - up approach)
The effective date for adoption of Ind AS 115 is financial period beginning on or after April 1, 2018.
The Company will adopt the standard on April 1, 2018 by using the cumulative catch-up transition method and accordingly, comparatives for the year ending or ended March 31, 2018 will not be retrospectively adjusted. The effect on adoption of Ind AS 115 is expected to be insignificant.
2.1 Property, plant and equipment
Accounting policyProperty, plant and equipment are stated at cost, less accumulated depreciation and impairment, if any. Costs directly attributable to acquisition are capitalized until the
property, plant and equipment are ready for use, as intended by the Management. The Company depreciates property, plant and equipment over their estimated useful lives using the straight-line method. The estimated useful lives of assets are as follows:
Building(1) 22-25 yearsPlant and machinery(1) 5 yearsOffice equipment 5 yearsComputer equipment(1) 3-5 yearsFurniture and fixtures(1) 5 yearsVehicles(1) 5 yearsLeasehold improvements Over lease term
(1) Based on technical evaluation, the Management believes that the useful lives as given above best represent the period over which the Management expects to use these assets. Hence, the useful lives for these assets are different from the useful lives as prescribed under Part C of Schedule II of the Companies Act 2013.
Depreciation methods, useful lives and residual values are reviewed periodically, including at each financial year end.
Advances paid towards the acquisition of property, plant and equipment outstanding at each Balance Sheet date is classified as capital advances under other non-current assets and the cost of assets not ready to use before such date are disclosed under ‘Capital work-in-progress’. Subsequent expenditures relating to property, plant and equipment are capitalized only when it is probable that future economic benefits associated with these will flow to the Company and the cost of the item can be measured reliably. Repairs and maintenance costs are recognized in the Statement of Profit and Loss when incurred. The cost and related accumulated depreciation are eliminated from the financial statements upon sale or retirement of the asset and the resultant gains or losses are recognized in the Statement of Profit and Loss.
ImpairmentProperty, plant and equipment are evaluated for recoverability whenever events or changes in circumstances indicate that their carrying amounts may not be recoverable. For the purpose of impairment testing, the recoverable amount (i.e. the higher of the fair value less cost to sell and the value-in-use) is determined on an individual asset basis unless the asset does not generate cash flows that are largely independent of those from other assets. In such cases, the recoverable amount is determined for the Cash Generating Unit (CGU) to which the asset belongs.
If such assets are considered to be impaired, the impairment to be recognized in the Statement of Profit and Loss is measured by the amount by which the carrying value of the assets exceeds the estimated recoverable amount of the asset. An impairment loss is reversed in the Statement of Profit and Loss if there has been a change in the estimates used to determine the recoverable amount. The carrying amount of the asset is increased to its revised recoverable amount, provided that this amount does not exceed the carrying amount that would have been determined (net of any accumulated depreciation) had no impairment loss been recognized for the asset in prior years.
Standalone financial statements | 155 Infosys Annual Report 2017-18
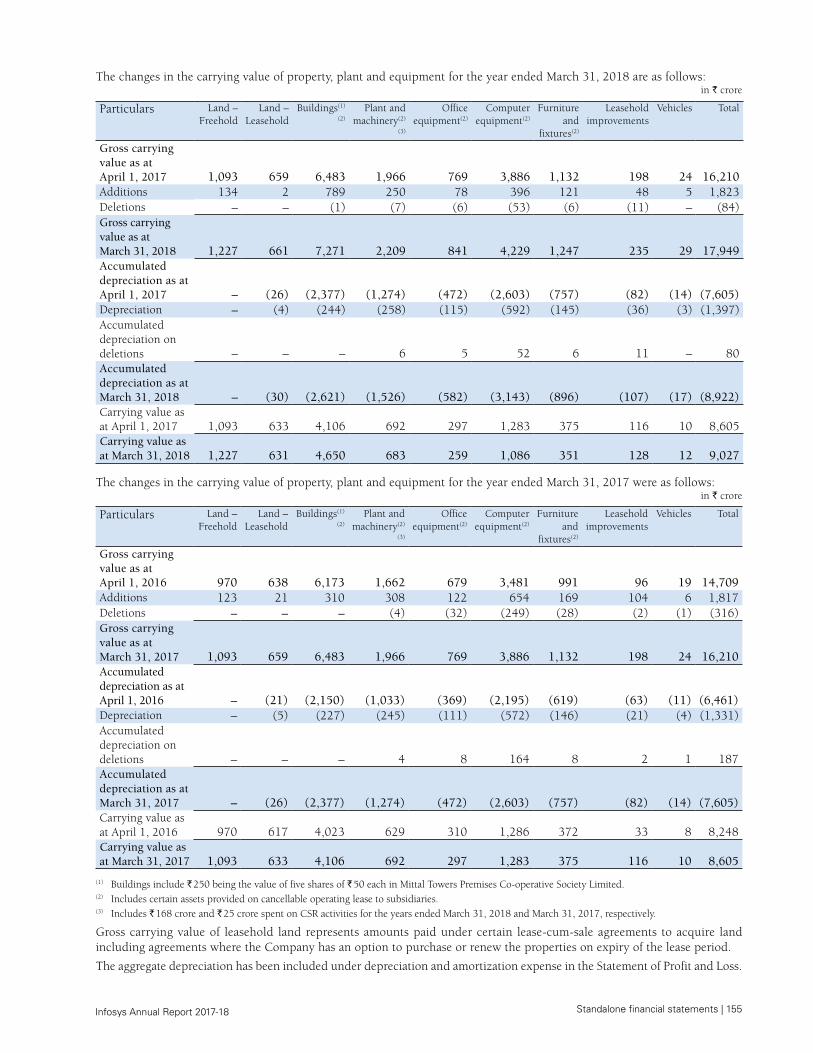
The changes in the carrying value of property, plant and equipment for the year ended March 31, 2018 are as follows: in ` crore
Particulars Land – Freehold
Land – Leasehold
Buildings(1)
(2)
Plant and machinery(2)
(3)
Office equipment(2)
Computer equipment(2)
Furniture and
fixtures(2)
Leasehold improvements
Vehicles Total
Gross carrying value as at April 1, 2017 1,093 659 6,483 1,966 769 3,886 1,132 198 24
16,210
Additions 134 2 789 250 78 396 121 48 5 1,823 Deletions – – (1) (7) (6) (53) (6) (11) – (84)Gross carrying value as at March 31, 2018 1,227 661 7,271 2,209 841 4,229 1,247 235 29
17,949
Accumulated depreciation as at April 1, 2017 – (26) (2,377) (1,274) (472) (2,603) (757) (82) (14)
(7,605)
Depreciation – (4) (244) (258) (115) (592) (145) (36) (3) (1,397)Accumulated depreciation on deletions – – – 6 5 52 6 11 – 80 Accumulated depreciation as at March 31, 2018 – (30) (2,621) (1,526) (582) (3,143) (896) (107) (17)
(8,922)
Carrying value as at April 1, 2017 1,093 633 4,106 692 297 1,283 375 116 10 8,605 Carrying value as at March 31, 2018 1,227 631 4,650 683 259 1,086 351 128 12 9,027
The changes in the carrying value of property, plant and equipment for the year ended March 31, 2017 were as follows: in ` crore
Particulars Land – Freehold
Land – Leasehold
Buildings(1)
(2)
Plant and machinery(2)
(3)
Office equipment(2)
Computer equipment(2)
Furniture and
fixtures(2)
Leasehold improvements
Vehicles Total
Gross carrying value as at April 1, 2016 970 638 6,173 1,662 679 3,481 991 96 19 14,709 Additions 123 21 310 308 122 654 169 104 6 1,817 Deletions – – – (4) (32) (249) (28) (2) (1) (316)Gross carrying value as at March 31, 2017 1,093 659 6,483 1,966 769 3,886 1,132 198 24 16,210 Accumulated depreciation as at April 1, 2016 – (21) (2,150) (1,033) (369) (2,195) (619) (63) (11)
(6,461)
Depreciation – (5) (227) (245) (111) (572) (146) (21) (4) (1,331)Accumulated depreciation on deletions – – – 4 8 164 8 2 1 187 Accumulated depreciation as at March 31, 2017 – (26) (2,377) (1,274) (472) (2,603) (757) (82) (14)
(7,605)
Carrying value as at April 1, 2016 970 617 4,023 629 310 1,286 372 33 8 8,248 Carrying value as at March 31, 2017 1,093 633 4,106 692 297 1,283 375 116 10 8,605
(1) Buildings include ` 250 being the value of five shares of ` 50 each in Mittal Towers Premises Co-operative Society Limited.(2) Includes certain assets provided on cancellable operating lease to subsidiaries.(3) Includes ` 168 crore and ` 25 crore spent on CSR activities for the years ended March 31, 2018 and March 31, 2017, respectively.
Gross carrying value of leasehold land represents amounts paid under certain lease-cum-sale agreements to acquire land including agreements where the Company has an option to purchase or renew the properties on expiry of the lease period.
The aggregate depreciation has been included under depreciation and amortization expense in the Statement of Profit and Loss.
156 | Standalone financial statements Infosys Annual Report 2017-18
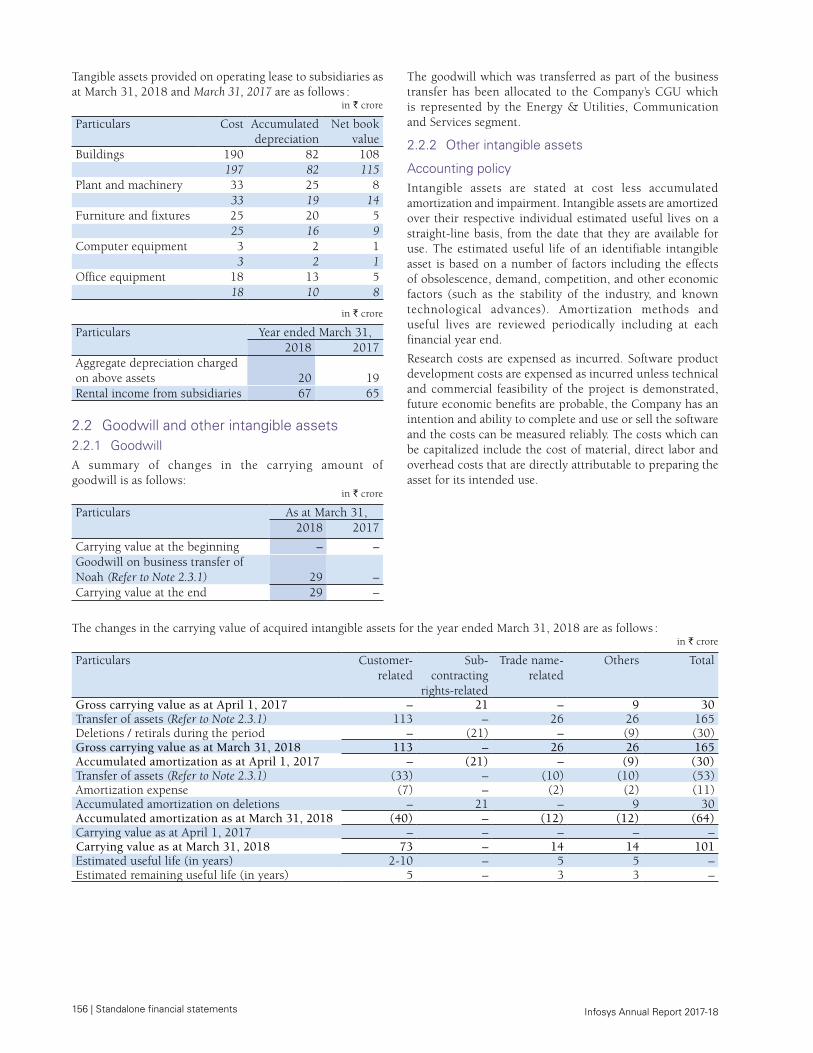
Tangible assets provided on operating lease to subsidiaries as at March 31, 2018 and March 31, 2017 are as follows :
in ` crore
Particulars Cost Accumulated depreciation
Net book value
Buildings 190 82 108 197 82 115
Plant and machinery 33 25 8 33 19 14
Furniture and fixtures 25 20 5 25 16 9
Computer equipment 3 2 1 3 2 1
Office equipment 18 13 5 18 10 8
in ` crore
Particulars Year ended March 31,2018 2017
Aggregate depreciation charged on above assets 20 19Rental income from subsidiaries 67 65
2.2 Goodwill and other intangible assets2.2.1 GoodwillA summary of changes in the carrying amount of goodwill is as follows:
in ` crore
Particulars
As at March 31,2018 2017
Carrying value at the beginning – – Goodwill on business transfer of Noah (Refer to Note 2.3.1) 29 – Carrying value at the end 29 –
The goodwill which was transferred as part of the business transfer has been allocated to the Company’s CGU which is represented by the Energy & Utilities, Communication and Services segment.
2.2.2 Other intangible assets
Accounting policyIntangible assets are stated at cost less accumulated amortization and impairment. Intangible assets are amortized over their respective individual estimated useful lives on a straight-line basis, from the date that they are available for use. The estimated useful life of an identifiable intangible asset is based on a number of factors including the effects of obsolescence, demand, competition, and other economic factors (such as the stability of the industry, and known technological advances). Amortization methods and useful lives are reviewed periodically including at each financial year end.
Research costs are expensed as incurred. Software product development costs are expensed as incurred unless technical and commercial feasibility of the project is demonstrated, future economic benefits are probable, the Company has an intention and ability to complete and use or sell the software and the costs can be measured reliably. The costs which can be capitalized include the cost of material, direct labor and overhead costs that are directly attributable to preparing the asset for its intended use.
The changes in the carrying value of acquired intangible assets for the year ended March 31, 2018 are as follows : in ` crore
Particulars Customer- related
Sub-contracting
rights-related
Trade name- related
Others Total
Gross carrying value as at April 1, 2017 – 21 – 9 30 Transfer of assets (Refer to Note 2.3.1) 113 – 26 26 165 Deletions / retirals during the period – (21) – (9) (30)Gross carrying value as at March 31, 2018 113 – 26 26 165 Accumulated amortization as at April 1, 2017 – (21) – (9) (30)Transfer of assets (Refer to Note 2.3.1) (33) – (10) (10) (53)Amortization expense (7) – (2) (2) (11)Accumulated amortization on deletions – 21 – 9 30 Accumulated amortization as at March 31, 2018 (40) – (12) (12) (64)Carrying value as at April 1, 2017 – – – – – Carrying value as at March 31, 2018 73 – 14 14 101 Estimated useful life (in years) 2-10 – 5 5 – Estimated remaining useful life (in years) 5 – 3 3 –

Standalone financial statements | 157 Infosys Annual Report 2017-18
The changes in the carrying value of acquired intangible assets for the year ended March 31, 2017 were as follows : in ` crore
Particulars Sub-contracting
rights related
Others Total
Gross carrying value as at April 1, 2016 21 9 30 Additions – – – Deletions – – – Gross carrying value as at March 31, 2017 21 9 30 Accumulated depreciation as at April 1, 2016 (21) (9) (30)Depreciation – – – Accumulated depreciation on deletions – – – Accumulated depreciation as at March 31, 2017 (21) (9) (30)Carrying value as at April 1, 2016 – – – Carrying value as at March 31, 2017 – – – Estimated useful life (in years) – – – Estimated remaining useful life (in years) – – –
Research and development expense recognized in the Statement of Profit and Loss for the years ended March 31, 2018 and March 31, 2017 is ` 374 crore and ` 351 crore, respectively.
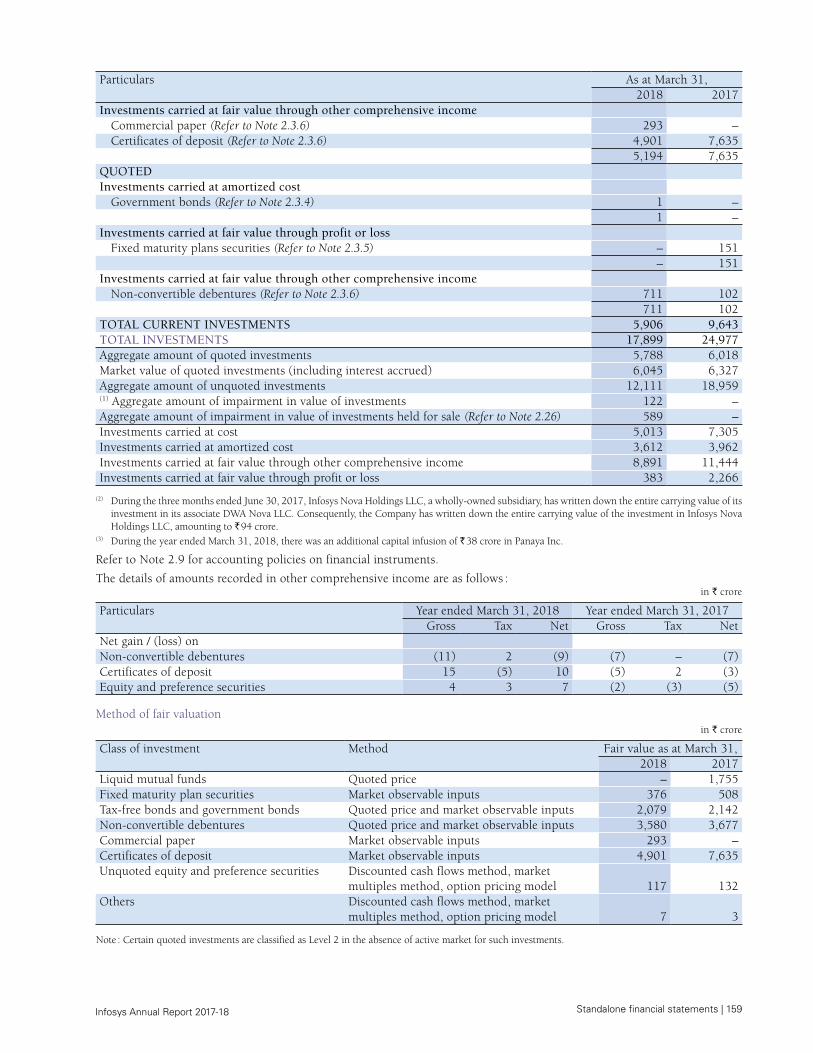
2.3 Investmentsin ` crore
Particulars As at March 31,2018 2017
NON-CURRENT INVESTMENTSEquity instruments of subsidiaries 5,013 7,305 Debentures of subsidiary 1,780 2,129 Preference securities and equity instruments 117 132 Others 7 3 Tax-free bonds 1,831 1,833 Fixed maturity plans securities 376 357 Non-convertible debentures 2,869 3,575
TOTAL NON-CURRENT INVESTMENTS 11,993 15,334 CURRENT INVESTMENTS
Liquid mutual fund units – 1,755 Fixed maturity plans securities – 151 Certificates of deposit 4,901 7,635 Government bonds 1 – Non-convertible debentures 711 102 Commercial paper 293 –
TOTAL CURRENT INVESTMENTS 5,906 9,643 TOTAL CARRYING VALUE 17,899 24,977
in ` crore, except as otherwise stated
Particulars As at March 31,2018 2017
NON-CURRENT INVESTMENTSUNQUOTEDInvestment carried at cost
Investments in equity instruments of subsidiariesInfosys BPM Limited (formerly Infosys BPO Limited) 659 659 3,38,22,319 (3,38,22,319) equity shares of ` 10 each, fully paidInfosys Technologies (China) Co. Limited 333 236 Infosys Technologies (Australia) Pty Limited(1) 38 66 1,01,08,869 (1,01,08,869) equity shares of AUD 0.11 par value, fully paidInfosys Technologies, S. de R.L. de C.V., Mexico 65 65 17,49,99,990 (17,49,99,990) equity shares of MXN 1 par value, fully paid upInfosys Technologies (Sweden) AB 76 76 1,000 (1,000) equity shares of SEK 100 par value, fully paid
158 | Standalone financial statements Infosys Annual Report 2017-18
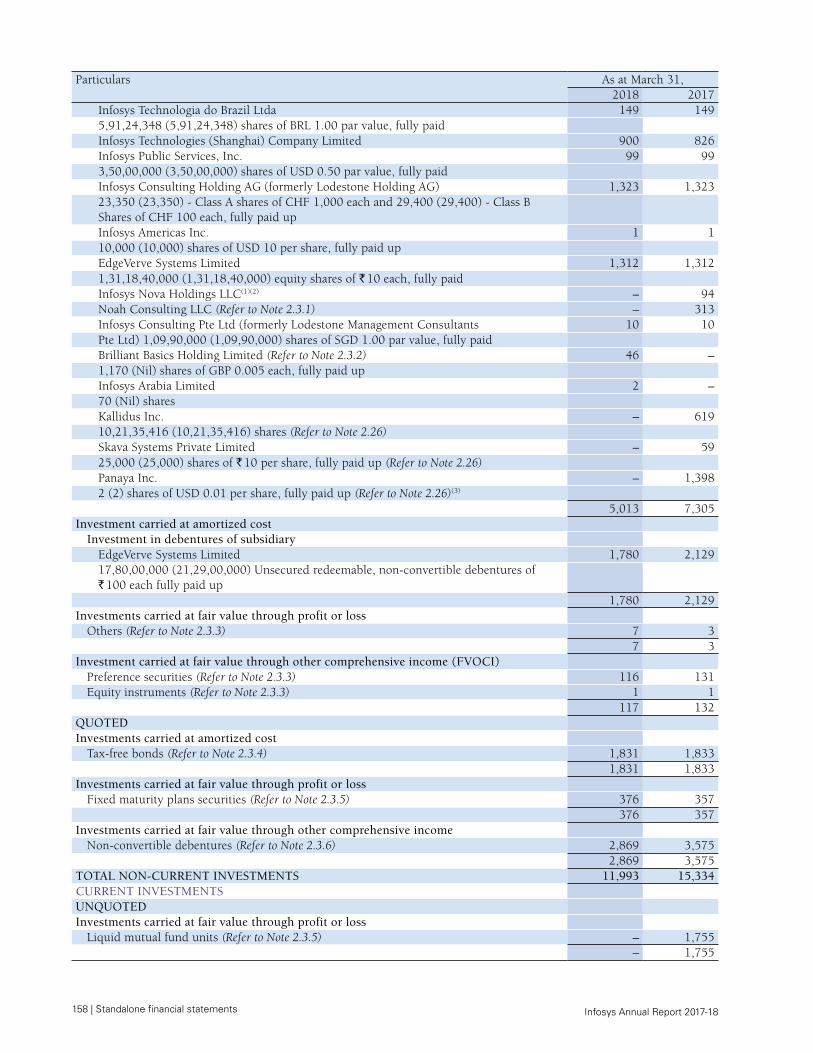
Particulars As at March 31,2018 2017
Infosys Technologia do Brazil Ltda 149 149 5,91,24,348 (5,91,24,348) shares of BRL 1.00 par value, fully paidInfosys Technologies (Shanghai) Company Limited 900 826 Infosys Public Services, Inc. 99 99 3,50,00,000 (3,50,00,000) shares of USD 0.50 par value, fully paidInfosys Consulting Holding AG (formerly Lodestone Holding AG) 1,323 1,323 23,350 (23,350) - Class A shares of CHF 1,000 each and 29,400 (29,400) - Class B Shares of CHF 100 each, fully paid upInfosys Americas Inc. 1 1 10,000 (10,000) shares of USD 10 per share, fully paid upEdgeVerve Systems Limited 1,312 1,312 1,31,18,40,000 (1,31,18,40,000) equity shares of ` 10 each, fully paidInfosys Nova Holdings LLC(1)(2) – 94 Noah Consulting LLC (Refer to Note 2.3.1) – 313 Infosys Consulting Pte Ltd (formerly Lodestone Management Consultants 10 10 Pte Ltd) 1,09,90,000 (1,09,90,000) shares of SGD 1.00 par value, fully paidBrilliant Basics Holding Limited (Refer to Note 2.3.2) 46 – 1,170 (Nil) shares of GBP 0.005 each, fully paid upInfosys Arabia Limited 2 – 70 (Nil) shares Kallidus Inc. – 619 10,21,35,416 (10,21,35,416) shares (Refer to Note 2.26)Skava Systems Private Limited – 59 25,000 (25,000) shares of ` 10 per share, fully paid up (Refer to Note 2.26)Panaya Inc. – 1,398 2 (2) shares of USD 0.01 per share, fully paid up (Refer to Note 2.26)(3)
5,013 7,305 Investment carried at amortized cost
Investment in debentures of subsidiaryEdgeVerve Systems Limited 1,780 2,129 17,80,00,000 (21,29,00,000) Unsecured redeemable, non-convertible debentures of ` 100 each fully paid up
1,780 2,129 Investments carried at fair value through profit or loss
Others (Refer to Note 2.3.3) 7 3 7 3
Investment carried at fair value through other comprehensive income (FVOCI) Preference securities (Refer to Note 2.3.3) 116 131 Equity instruments (Refer to Note 2.3.3) 1 1
117 132 QUOTEDInvestments carried at amortized cost
Tax-free bonds (Refer to Note 2.3.4) 1,831 1,833 1,831 1,833
Investments carried at fair value through profit or lossFixed maturity plans securities (Refer to Note 2.3.5) 376 357
376 357 Investments carried at fair value through other comprehensive income
Non-convertible debentures (Refer to Note 2.3.6) 2,869 3,575 2,869 3,575
TOTAL NON-CURRENT INVESTMENTS 11,993 15,334 CURRENT INVESTMENTS UNQUOTEDInvestments carried at fair value through profit or loss
Liquid mutual fund units (Refer to Note 2.3.5) – 1,755 – 1,755
Standalone financial statements | 159 Infosys Annual Report 2017-18
Particulars As at March 31,2018 2017
Investments carried at fair value through other comprehensive incomeCommercial paper (Refer to Note 2.3.6) 293 – Certificates of deposit (Refer to Note 2.3.6) 4,901 7,635
5,194 7,635 QUOTEDInvestments carried at amortized cost
Government bonds (Refer to Note 2.3.4) 1 – 1 –
Investments carried at fair value through profit or lossFixed maturity plans securities (Refer to Note 2.3.5) – 151
– 151 Investments carried at fair value through other comprehensive income
Non-convertible debentures (Refer to Note 2.3.6) 711 102 711 102
TOTAL CURRENT INVESTMENTS 5,906 9,643 TOTAL INVESTMENTS 17,899 24,977 Aggregate amount of quoted investments 5,788 6,018 Market value of quoted investments (including interest accrued) 6,045 6,327 Aggregate amount of unquoted investments 12,111 18,959 (1) Aggregate amount of impairment in value of investments 122 – Aggregate amount of impairment in value of investments held for sale (Refer to Note 2.26) 589 – Investments carried at cost 5,013 7,305 Investments carried at amortized cost 3,612 3,962 Investments carried at fair value through other comprehensive income 8,891 11,444 Investments carried at fair value through profit or loss 383 2,266
(2) During the three months ended June 30, 2017, Infosys Nova Holdings LLC, a wholly-owned subsidiary, has written down the entire carrying value of its investment in its associate DWA Nova LLC. Consequently, the Company has written down the entire carrying value of the investment in Infosys Nova Holdings LLC, amounting to ` 94 crore.
(3) During the year ended March 31, 2018, there was an additional capital infusion of ` 38 crore in Panaya Inc.
Refer to Note 2.9 for accounting policies on financial instruments.
The details of amounts recorded in other comprehensive income are as follows :in ` crore
Particulars Year ended March 31, 2018 Year ended March 31, 2017Gross Tax Net Gross Tax Net
Net gain / (loss) onNon-convertible debentures (11) 2 (9) (7) – (7)Certificates of deposit 15 (5) 10 (5) 2 (3)Equity and preference securities 4 3 7 (2) (3) (5)
Method of fair valuationin ` crore
Class of investment Method Fair value as at March 31,2018 2017
Liquid mutual funds Quoted price – 1,755 Fixed maturity plan securities Market observable inputs 376 508 Tax-free bonds and government bonds Quoted price and market observable inputs 2,079 2,142 Non-convertible debentures Quoted price and market observable inputs 3,580 3,677 Commercial paper Market observable inputs 293 – Certificates of deposit Market observable inputs 4,901 7,635 Unquoted equity and preference securities Discounted cash flows method, market
multiples method, option pricing model 117 132 Others Discounted cash flows method, market
multiples method, option pricing model 7 3
Note : Certain quoted investments are classified as Level 2 in the absence of active market for such investments.
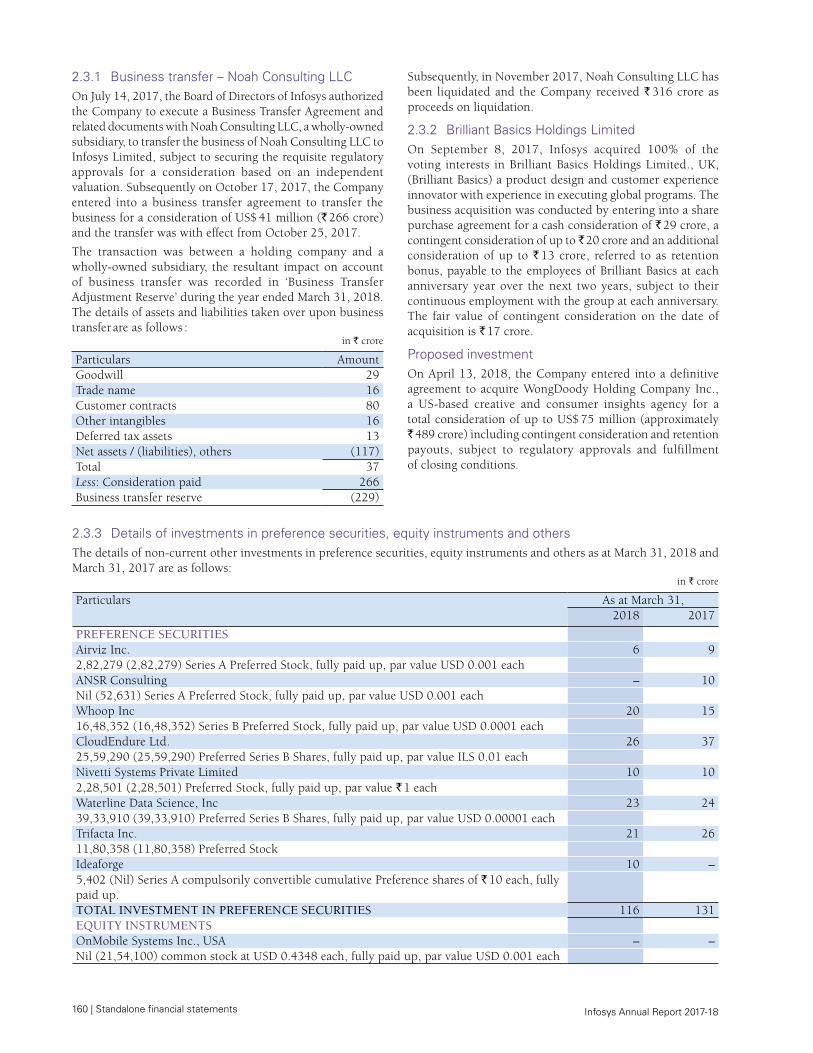
160 | Standalone financial statements Infosys Annual Report 2017-18
2.3.1 Business transfer – Noah Consulting LLCOn July 14, 2017, the Board of Directors of Infosys authorized the Company to execute a Business Transfer Agreement and related documents with Noah Consulting LLC, a wholly-owned subsidiary, to transfer the business of Noah Consulting LLC to Infosys Limited, subject to securing the requisite regulatory approvals for a consideration based on an independent valuation. Subsequently on October 17, 2017, the Company entered into a business transfer agreement to transfer the business for a consideration of US$ 41 million (` 266 crore) and the transfer was with effect from October 25, 2017.
The transaction was between a holding company and a wholly-owned subsidiary, the resultant impact on account of business transfer was recorded in ‘Business Transfer Adjustment Reserve’ during the year ended March 31, 2018. The details of assets and liabilities taken over upon business transfer are as follows :
in ` crore
Particulars AmountGoodwill 29 Trade name 16 Customer contracts 80 Other intangibles 16 Deferred tax assets 13 Net assets / (liabilities), others (117)Total 37 Less: Consideration paid 266 Business transfer reserve (229)
Subsequently, in November 2017, Noah Consulting LLC has been liquidated and the Company received ` 316 crore as proceeds on liquidation.
2.3.2 Brilliant Basics Holdings LimitedOn September 8, 2017, Infosys acquired 100% of the voting interests in Brilliant Basics Holdings Limited., UK, (Brilliant Basics) a product design and customer experience innovator with experience in executing global programs. The business acquisition was conducted by entering into a share purchase agreement for a cash consideration of ` 29 crore, a contingent consideration of up to ̀ 20 crore and an additional consideration of up to ` 13 crore, referred to as retention bonus, payable to the employees of Brilliant Basics at each anniversary year over the next two years, subject to their continuous employment with the group at each anniversary. The fair value of contingent consideration on the date of acquisition is ` 17 crore.
Proposed investmentOn April 13, 2018, the Company entered into a definitive agreement to acquire WongDoody Holding Company Inc., a US-based creative and consumer insights agency for a total consideration of up to US$ 75 million (approximately ` 489 crore) including contingent consideration and retention payouts, subject to regulatory approvals and fulfillment of closing conditions.
2.3.3 Details of investments in preference securities, equity instruments and othersThe details of non-current other investments in preference securities, equity instruments and others as at March 31, 2018 and March 31, 2017 are as follows:
in ` crore
Particulars
As at March 31,2018 2017
PREFERENCE SECURITIESAirviz Inc. 6 9 2,82,279 (2,82,279) Series A Preferred Stock, fully paid up, par value USD 0.001 each ANSR Consulting – 10 Nil (52,631) Series A Preferred Stock, fully paid up, par value USD 0.001 eachWhoop Inc 20 15 16,48,352 (16,48,352) Series B Preferred Stock, fully paid up, par value USD 0.0001 eachCloudEndure Ltd. 26 37 25,59,290 (25,59,290) Preferred Series B Shares, fully paid up, par value ILS 0.01 eachNivetti Systems Private Limited 10 10 2,28,501 (2,28,501) Preferred Stock, fully paid up, par value ` 1 eachWaterline Data Science, Inc 23 24 39,33,910 (39,33,910) Preferred Series B Shares, fully paid up, par value USD 0.00001 eachTrifacta Inc. 21 26 11,80,358 (11,80,358) Preferred StockIdeaforge 10 – 5,402 (Nil) Series A compulsorily convertible cumulative Preference shares of ` 10 each, fully paid up.TOTAL INVESTMENT IN PREFERENCE SECURITIES 116 131EQUITY INSTRUMENTSOnMobile Systems Inc., USA – – Nil (21,54,100) common stock at USD 0.4348 each, fully paid up, par value USD 0.001 each
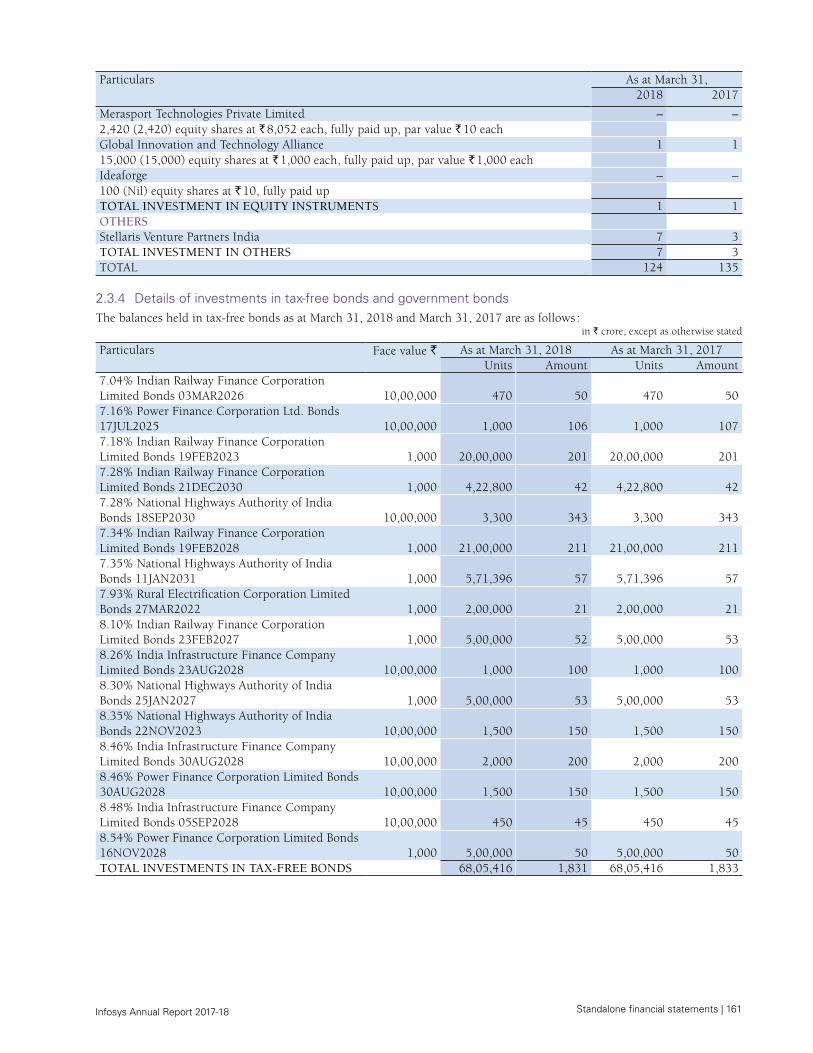
Standalone financial statements | 161 Infosys Annual Report 2017-18
Particulars
As at March 31,2018 2017
Merasport Technologies Private Limited – – 2,420 (2,420) equity shares at ` 8,052 each, fully paid up, par value ` 10 eachGlobal Innovation and Technology Alliance 1 1 15,000 (15,000) equity shares at ` 1,000 each, fully paid up, par value ` 1,000 eachIdeaforge – – 100 (Nil) equity shares at ` 10, fully paid upTOTAL INVESTMENT IN EQUITY INSTRUMENTS 1 1OTHERSStellaris Venture Partners India 7 3 TOTAL INVESTMENT IN OTHERS 7 3TOTAL 124 135
2.3.4 Details of investments in tax-free bonds and government bondsThe balances held in tax-free bonds as at March 31, 2018 and March 31, 2017 are as follows :
in ` crore, except as otherwise stated
Particulars Face value ` As at March 31, 2018 As at March 31, 2017 Units Amount Units Amount
7.04% Indian Railway Finance Corporation Limited Bonds 03MAR2026 10,00,000 470 50 470 50 7.16% Power Finance Corporation Ltd. Bonds 17JUL2025 10,00,000 1,000 106 1,000 107 7.18% Indian Railway Finance Corporation Limited Bonds 19FEB2023 1,000 20,00,000 201 20,00,000 201 7.28% Indian Railway Finance Corporation Limited Bonds 21DEC2030 1,000 4,22,800 42 4,22,800 42 7.28% National Highways Authority of India Bonds 18SEP2030 10,00,000 3,300 343 3,300 343 7.34% Indian Railway Finance Corporation Limited Bonds 19FEB2028 1,000 21,00,000 211 21,00,000 211 7.35% National Highways Authority of India Bonds 11JAN2031 1,000 5,71,396 57 5,71,396 57 7.93% Rural Electrification Corporation Limited Bonds 27MAR2022 1,000 2,00,000 21 2,00,000 21 8.10% Indian Railway Finance Corporation Limited Bonds 23FEB2027 1,000 5,00,000 52 5,00,000 53 8.26% India Infrastructure Finance Company Limited Bonds 23AUG2028 10,00,000 1,000 100 1,000 100 8.30% National Highways Authority of India Bonds 25JAN2027 1,000 5,00,000 53 5,00,000 53 8.35% National Highways Authority of India Bonds 22NOV2023 10,00,000 1,500 150 1,500 150 8.46% India Infrastructure Finance Company Limited Bonds 30AUG2028 10,00,000 2,000 200 2,000 200 8.46% Power Finance Corporation Limited Bonds 30AUG2028 10,00,000 1,500 150 1,500 150 8.48% India Infrastructure Finance Company Limited Bonds 05SEP2028 10,00,000 450 45 450 45 8.54% Power Finance Corporation Limited Bonds 16NOV2028 1,000 5,00,000 50 5,00,000 50 TOTAL INVESTMENTS IN TAX-FREE BONDS 68,05,416 1,831 68,05,416 1,833
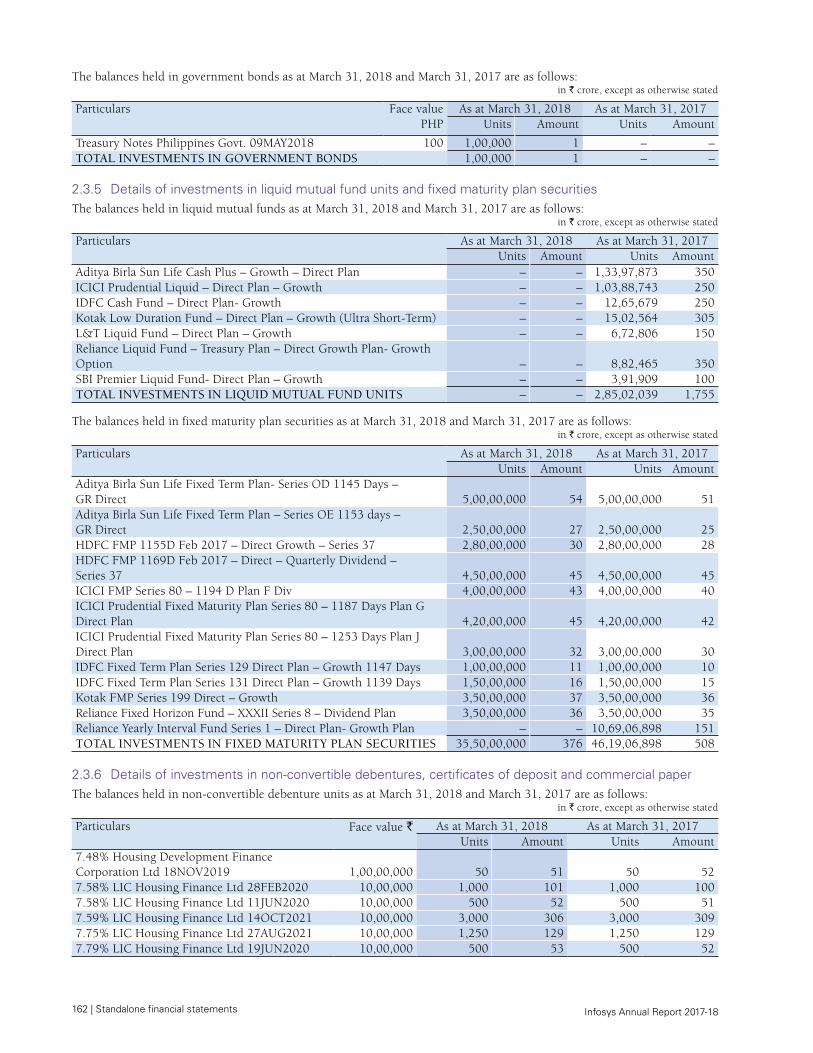
162 | Standalone financial statements Infosys Annual Report 2017-18
The balances held in government bonds as at March 31, 2018 and March 31, 2017 are as follows: in ` crore, except as otherwise stated
Particulars
Face value PHP
As at March 31, 2018 As at March 31, 2017 Units Amount Units Amount
Treasury Notes Philippines Govt. 09MAY2018 100 1,00,000 1 – – TOTAL INVESTMENTS IN GOVERNMENT BONDS 1,00,000 1 – –
2.3.5 Details of investments in liquid mutual fund units and fixed maturity plan securitiesThe balances held in liquid mutual funds as at March 31, 2018 and March 31, 2017 are as follows:
in ` crore, except as otherwise stated
Particulars As at March 31, 2018 As at March 31, 2017 Units Amount Units Amount
Aditya Birla Sun Life Cash Plus – Growth – Direct Plan – – 1,33,97,873 350 ICICI Prudential Liquid – Direct Plan – Growth – – 1,03,88,743 250 IDFC Cash Fund – Direct Plan- Growth – – 12,65,679 250 Kotak Low Duration Fund – Direct Plan – Growth (Ultra Short-Term) – – 15,02,564 305 L&T Liquid Fund – Direct Plan – Growth – – 6,72,806 150 Reliance Liquid Fund – Treasury Plan – Direct Growth Plan- Growth Option – – 8,82,465 350 SBI Premier Liquid Fund- Direct Plan – Growth – – 3,91,909 100 TOTAL INVESTMENTS IN LIQUID MUTUAL FUND UNITS – – 2,85,02,039 1,755
The balances held in fixed maturity plan securities as at March 31, 2018 and March 31, 2017 are as follows:in ` crore, except as otherwise stated
Particulars As at March 31, 2018 As at March 31, 2017 Units Amount Units Amount
Aditya Birla Sun Life Fixed Term Plan- Series OD 1145 Days – GR Direct 5,00,00,000 54 5,00,00,000 51 Aditya Birla Sun Life Fixed Term Plan – Series OE 1153 days – GR Direct 2,50,00,000 27 2,50,00,000 25 HDFC FMP 1155D Feb 2017 – Direct Growth – Series 37 2,80,00,000 30 2,80,00,000 28 HDFC FMP 1169D Feb 2017 – Direct – Quarterly Dividend – Series 37 4,50,00,000 45 4,50,00,000 45 ICICI FMP Series 80 – 1194 D Plan F Div 4,00,00,000 43 4,00,00,000 40 ICICI Prudential Fixed Maturity Plan Series 80 – 1187 Days Plan G Direct Plan 4,20,00,000 45 4,20,00,000 42 ICICI Prudential Fixed Maturity Plan Series 80 – 1253 Days Plan J Direct Plan 3,00,00,000 32 3,00,00,000 30 IDFC Fixed Term Plan Series 129 Direct Plan – Growth 1147 Days 1,00,00,000 11 1,00,00,000 10 IDFC Fixed Term Plan Series 131 Direct Plan – Growth 1139 Days 1,50,00,000 16 1,50,00,000 15 Kotak FMP Series 199 Direct – Growth 3,50,00,000 37 3,50,00,000 36 Reliance Fixed Horizon Fund – XXXII Series 8 – Dividend Plan 3,50,00,000 36 3,50,00,000 35 Reliance Yearly Interval Fund Series 1 – Direct Plan- Growth Plan – – 10,69,06,898 151 TOTAL INVESTMENTS IN FIXED MATURITY PLAN SECURITIES 35,50,00,000 376 46,19,06,898 508
2.3.6 Details of investments in non-convertible debentures, certificates of deposit and commercial paperThe balances held in non-convertible debenture units as at March 31, 2018 and March 31, 2017 are as follows:
in ` crore, except as otherwise stated
Particulars Face value ` As at March 31, 2018 As at March 31, 2017 Units Amount Units Amount
7.48% Housing Development Finance Corporation Ltd 18NOV2019 1,00,00,000 50 51 50 52 7.58% LIC Housing Finance Ltd 28FEB2020 10,00,000 1,000 101 1,000 100 7.58% LIC Housing Finance Ltd 11JUN2020 10,00,000 500 52 500 51 7.59% LIC Housing Finance Ltd 14OCT2021 10,00,000 3,000 306 3,000 309 7.75% LIC Housing Finance Ltd 27AUG2021 10,00,000 1,250 129 1,250 129 7.79% LIC Housing Finance Ltd 19JUN2020 10,00,000 500 53 500 52
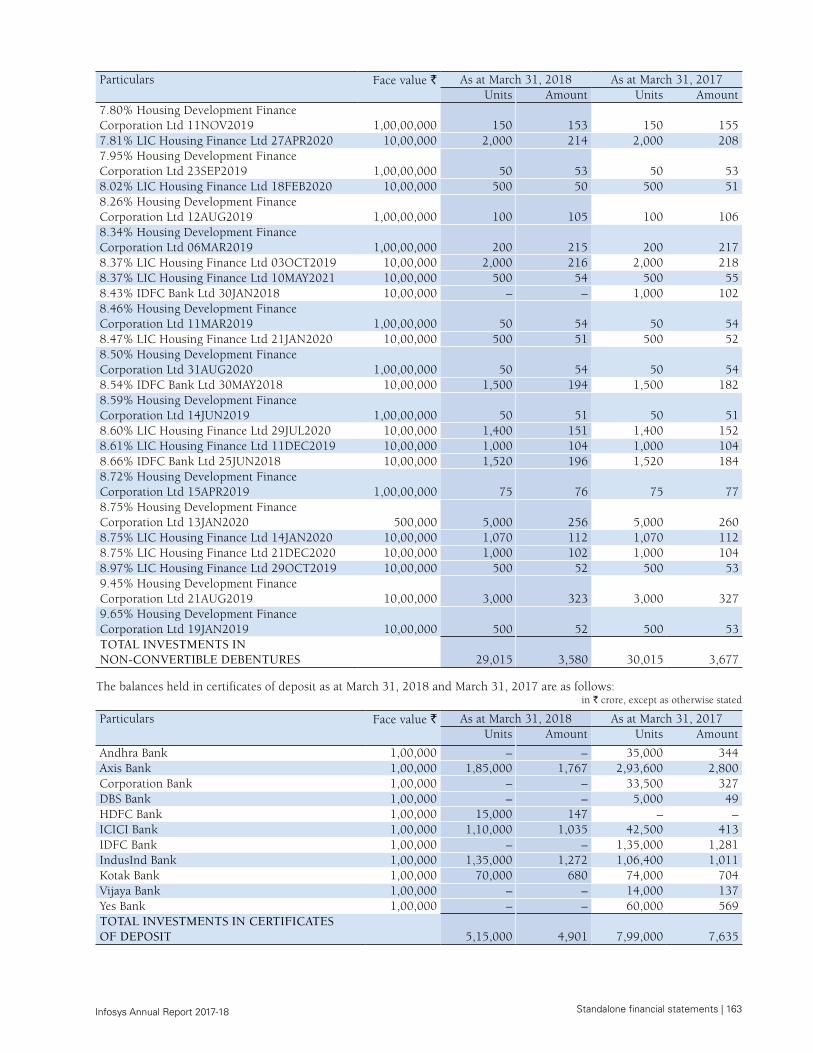
Standalone financial statements | 163 Infosys Annual Report 2017-18
Particulars Face value ` As at March 31, 2018 As at March 31, 2017 Units Amount Units Amount
7.80% Housing Development Finance Corporation Ltd 11NOV2019 1,00,00,000 150 153 150 155 7.81% LIC Housing Finance Ltd 27APR2020 10,00,000 2,000 214 2,000 208 7.95% Housing Development Finance Corporation Ltd 23SEP2019 1,00,00,000 50 53 50 53 8.02% LIC Housing Finance Ltd 18FEB2020 10,00,000 500 50 500 51 8.26% Housing Development Finance Corporation Ltd 12AUG2019 1,00,00,000 100 105 100 106 8.34% Housing Development Finance Corporation Ltd 06MAR2019 1,00,00,000 200 215 200 217 8.37% LIC Housing Finance Ltd 03OCT2019 10,00,000 2,000 216 2,000 218 8.37% LIC Housing Finance Ltd 10MAY2021 10,00,000 500 54 500 55 8.43% IDFC Bank Ltd 30JAN2018 10,00,000 – – 1,000 102 8.46% Housing Development Finance Corporation Ltd 11MAR2019 1,00,00,000 50 54 50 54 8.47% LIC Housing Finance Ltd 21JAN2020 10,00,000 500 51 500 52 8.50% Housing Development Finance Corporation Ltd 31AUG2020 1,00,00,000 50 54 50 54 8.54% IDFC Bank Ltd 30MAY2018 10,00,000 1,500 194 1,500 182 8.59% Housing Development Finance Corporation Ltd 14JUN2019 1,00,00,000 50 51 50 51 8.60% LIC Housing Finance Ltd 29JUL2020 10,00,000 1,400 151 1,400 152 8.61% LIC Housing Finance Ltd 11DEC2019 10,00,000 1,000 104 1,000 104 8.66% IDFC Bank Ltd 25JUN2018 10,00,000 1,520 196 1,520 184 8.72% Housing Development Finance Corporation Ltd 15APR2019 1,00,00,000 75 76 75 77 8.75% Housing Development Finance Corporation Ltd 13JAN2020 500,000 5,000 256 5,000 260 8.75% LIC Housing Finance Ltd 14JAN2020 10,00,000 1,070 112 1,070 112 8.75% LIC Housing Finance Ltd 21DEC2020 10,00,000 1,000 102 1,000 104 8.97% LIC Housing Finance Ltd 29OCT2019 10,00,000 500 52 500 53 9.45% Housing Development Finance Corporation Ltd 21AUG2019 10,00,000 3,000 323 3,000 327 9.65% Housing Development Finance Corporation Ltd 19JAN2019 10,00,000 500 52 500 53 TOTAL INVESTMENTS IN NON-CONVERTIBLE DEBENTURES 29,015 3,580 30,015 3,677
The balances held in certificates of deposit as at March 31, 2018 and March 31, 2017 are as follows: in ` crore, except as otherwise stated
Particulars
Face value ` As at March 31, 2018 As at March 31, 2017 Units Amount Units Amount
Andhra Bank 1,00,000 – – 35,000 344 Axis Bank 1,00,000 1,85,000 1,767 2,93,600 2,800 Corporation Bank 1,00,000 – – 33,500 327 DBS Bank 1,00,000 – – 5,000 49 HDFC Bank 1,00,000 15,000 147 – – ICICI Bank 1,00,000 1,10,000 1,035 42,500 413 IDFC Bank 1,00,000 – – 1,35,000 1,281 IndusInd Bank 1,00,000 1,35,000 1,272 1,06,400 1,011 Kotak Bank 1,00,000 70,000 680 74,000 704 Vijaya Bank 1,00,000 – – 14,000 137 Yes Bank 1,00,000 – – 60,000 569 TOTAL INVESTMENTS IN CERTIFICATES OF DEPOSIT 5,15,000 4,901 7,99,000 7,635
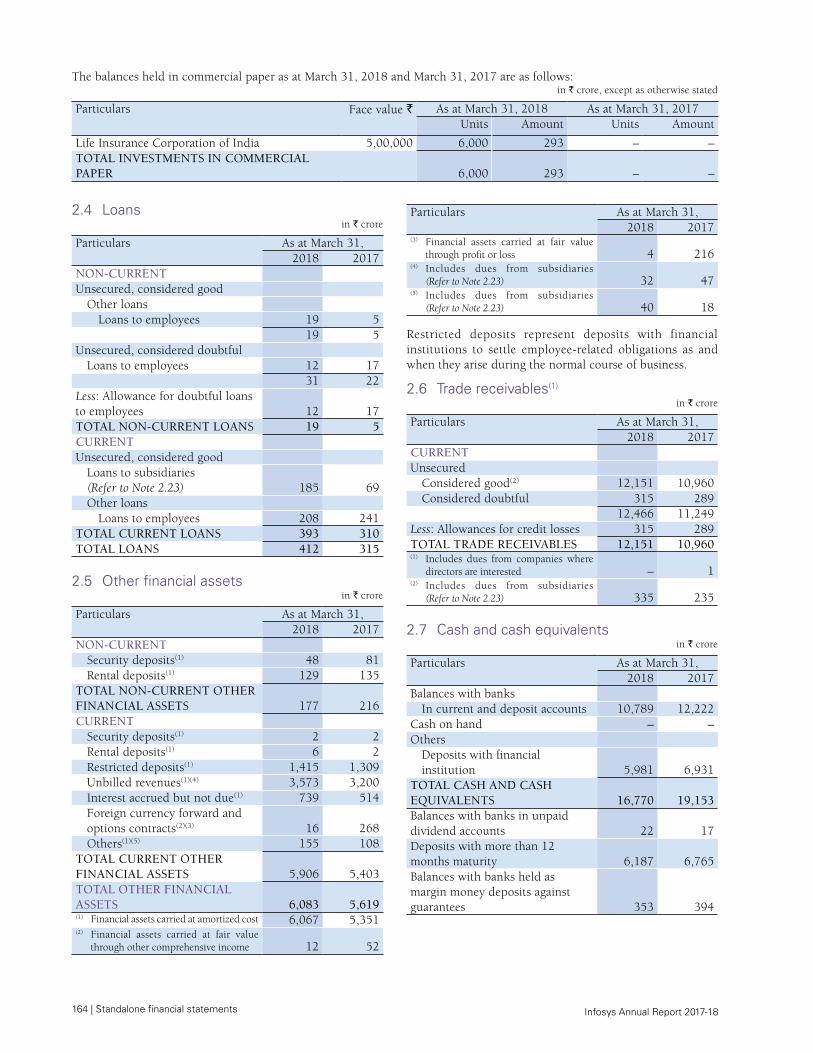
164 | Standalone financial statements Infosys Annual Report 2017-18
2.4 Loansin ` crore
Particulars As at March 31,2018 2017
NON-CURRENTUnsecured, considered good
Other loansLoans to employees 19 5
19 5 Unsecured, considered doubtful
Loans to employees 12 17 31 22
Less: Allowance for doubtful loans to employees 12 17TOTAL NON-CURRENT LOANS 19 5 CURRENTUnsecured, considered good
Loans to subsidiaries (Refer to Note 2.23) 185 69Other loans
Loans to employees 208 241TOTAL CURRENT LOANS 393 310 TOTAL LOANS 412 315
2.5 Other financial assetsin ` crore
Particulars As at March 31, 2018 2017
NON-CURRENTSecurity deposits(1) 48 81 Rental deposits(1) 129 135
TOTAL NON-CURRENT OTHER FINANCIAL ASSETS 177 216 CURRENT
Security deposits(1) 2 2 Rental deposits(1) 6 2 Restricted deposits(1) 1,415 1,309 Unbilled revenues(1)(4) 3,573 3,200 Interest accrued but not due(1) 739 514 Foreign currency forward and options contracts(2)(3) 16 268 Others(1)(5) 155 108
TOTAL CURRENT OTHER FINANCIAL ASSETS 5,906 5,403 TOTAL OTHER FINANCIAL ASSETS 6,083 5,619 (1) Financial assets carried at amortized cost 6,067 5,351 (2) Financial assets carried at fair value
through other comprehensive income 12 52
Particulars As at March 31, 2018 2017
(3) Financial assets carried at fair value through profit or loss 4 216
(4) Includes dues from subsidiaries (Refer to Note 2.23) 32 47
(5) Includes dues from subsidiaries (Refer to Note 2.23) 40 18
Restricted deposits represent deposits with financial institutions to settle employee-related obligations as and when they arise during the normal course of business.
2.6 Trade receivables(1)
in ` crore
Particulars As at March 31,2018 2017
CURRENTUnsecured
Considered good(2) 12,151 10,960 Considered doubtful 315 289
12,466 11,249 Less: Allowances for credit losses 315 289 TOTAL TRADE RECEIVABLES 12,151 10,960 (1) Includes dues from companies where
directors are interested – 1 (2) Includes dues from subsidiaries
(Refer to Note 2.23) 335 235
2.7 Cash and cash equivalents in ` crore
Particulars As at March 31,2018 2017
Balances with banksIn current and deposit accounts 10,789 12,222
Cash on hand – – Others
Deposits with financial institution 5,981 6,931
TOTAL CASH AND CASH EQUIVALENTS 16,770 19,153 Balances with banks in unpaid dividend accounts 22 17 Deposits with more than 12 months maturity 6,187 6,765 Balances with banks held as margin money deposits against guarantees 353 394
The balances held in commercial paper as at March 31, 2018 and March 31, 2017 are as follows:in ` crore, except as otherwise stated
Particulars
Face value ` As at March 31, 2018 As at March 31, 2017 Units Amount Units Amount
Life Insurance Corporation of India 5,00,000 6,000 293 – – TOTAL INVESTMENTS IN COMMERCIAL PAPER 6,000 293 – –

Standalone financial statements | 165 Infosys Annual Report 2017-18
Cash and cash equivalents as at March 31, 2018 and March 31, 2017 include restricted cash and bank balances of ` 375 crore and ` 411 crore, respectively. The restrictions are primarily on account of bank balances held as margin money deposits against guarantees and balances held in unpaid dividend bank accounts.
The deposits maintained by the Company with banks and financial institutions comprise time deposits, which can be withdrawn by the Company at any point without prior notice or penalty on the principal.
The details of balances with banks as on Balance Sheet dates are as follows :
in ` crore
Particulars As at March 31,2018 2017
In current accountsANZ Bank, Taiwan 9 3 Bank of America, USA 814 769 Bank of Baroda, Mauritius 1 – BNP Paribas Bank, Norway 88 7 Citibank N.A., Australia 184 8 Citibank N.A., Dubai 5 1 Citibank N.A., EEFC (US Dollar account) 4 1 Citibank N.A., Hungary 6 3 Citibank N.A., India 3 2 Citibank N.A., Japan 18 12 Citibank N.A., New Zealand 8 6 Citibank N.A., South Africa 33 9 Citibank N.A., South Korea 2 1 Deutsche Bank, Belgium 27 10 Deutsche Bank, EEFC (Australian Dollar account) 2 38 Deutsche Bank, EEFC (Euro account) 14 11 Deutsche Bank, EEFC (Swiss Franc account) 2 2 Deutsche Bank, EEFC (US Dollar account) 27 73 Deutsche Bank, EEFC (United Kingdom Pound Sterling account) 8 8 Deutsche Bank, France 19 8 Deutsche Bank, Germany 70 48 Deutsche Bank, India 40 9 Deutsche Bank, Malaysia 5 7 Deutsche Bank, Netherlands 8 2 Deutsche Bank, Philippines 14 4 Deutsche Bank, Russia 3 3 Deutsche Bank, Russia (US Dollar account) 5 1 Deutsche Bank, Singapore 17 6 Deutsche Bank, Spain 1 – Deutsche Bank, Switzerland 18 5 Deutsche Bank, Switzerland (US Dollar account) – 1 Deutsche Bank, United Kingdom 74 25 HSBC Bank, Hong Kong 2 1 ICICI Bank, EEFC (US Dollar account) 5 3
Particulars As at March 31,2018 2017
ICICI Bank, India 33 40 Nordbanken, Sweden 26 22 Punjab National Bank, India 12 6 Royal Bank of Canada, Canada 9 5 Splitska Banka D.D., Société Générale Group, Croatia 8 – State Bank of India – 6
1,624 1,166 In deposit accountsAxis Bank – 945 Barclays Bank 200 825 HDFC Bank 2,423 349 HSBC Bank – 500 ICICI Bank 3,467 4,351 IDBI Bank – 1,750 IDFC Bank 1,500 – IndusInd Bank 1,000 191 Kotak Mahindra Bank – 500 South Indian Bank 200 200 Standard Chartered Bank – 500 Syndicate Bank – 49 Yes Bank – 485
8,790 10,645 In unpaid dividend accountsAxis Bank, unpaid dividend account 1 2 HDFC Bank, unpaid dividend account 1 2 ICICI Bank, unpaid dividend account 20 13
22 17 In margin money deposits against guaranteesCanara Bank 151 177 ICICI Bank 202 217
353 394 Deposits with financial institutionHDFC Limited 4,781 6,231 LIC Housing Finance Limited 1,200 700
5,981 6,931 TOTAL CASH AND CASH EQUIVALENTS 16,770 19,153
2.8 Other assets in ` crore
Particulars As at March 31,2018 2017
NON-CURRENTCapital advances 420 562Advances other than capital advance
Prepaid gratuity (Refer to Note 2.20) 23 56
OthersPrepaid expenses 49 95Deferred contract cost 262 283Withholding taxes and others 1,407 –
TOTAL NON-CURRENT OTHER ASSETS 2,161 996
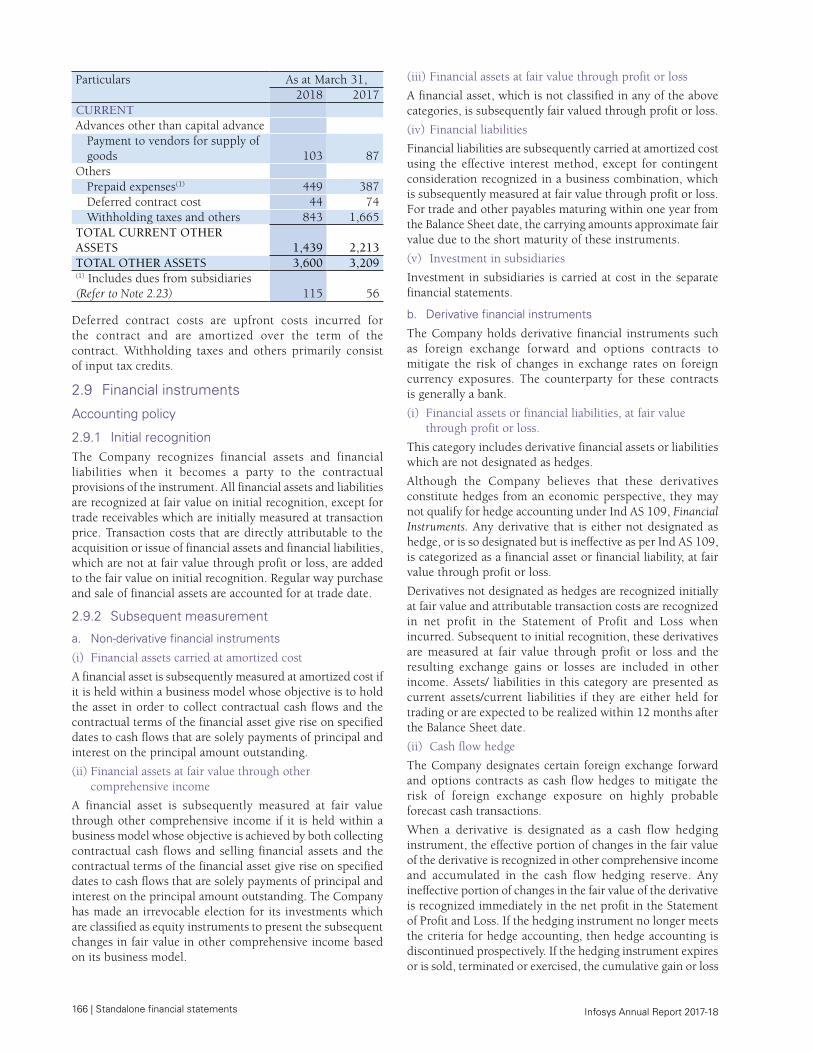
166 | Standalone financial statements Infosys Annual Report 2017-18
Particulars As at March 31,2018 2017
CURRENTAdvances other than capital advance
Payment to vendors for supply of goods 103 87
OthersPrepaid expenses(1) 449 387 Deferred contract cost 44 74 Withholding taxes and others 843 1,665
TOTAL CURRENT OTHER ASSETS 1,439 2,213 TOTAL OTHER ASSETS 3,600 3,209 (1) Includes dues from subsidiaries (Refer to Note 2.23) 115 56
Deferred contract costs are upfront costs incurred for the contract and are amortized over the term of the contract. Withholding taxes and others primarily consist of input tax credits.
2.9 Financial instruments
Accounting policy
2.9.1 Initial recognitionThe Company recognizes financial assets and financial liabilities when it becomes a party to the contractual provisions of the instrument. All financial assets and liabilities are recognized at fair value on initial recognition, except for trade receivables which are initially measured at transaction price. Transaction costs that are directly attributable to the acquisition or issue of financial assets and financial liabilities, which are not at fair value through profit or loss, are added to the fair value on initial recognition. Regular way purchase and sale of financial assets are accounted for at trade date.
2.9.2 Subsequent measurement
a. Non-derivative financial instruments
(i) Financial assets carried at amortized cost
A financial asset is subsequently measured at amortized cost if it is held within a business model whose objective is to hold the asset in order to collect contractual cash flows and the contractual terms of the financial asset give rise on specified dates to cash flows that are solely payments of principal and interest on the principal amount outstanding.
(ii) Financial assets at fair value through other comprehensive income
A financial asset is subsequently measured at fair value through other comprehensive income if it is held within a business model whose objective is achieved by both collecting contractual cash flows and selling financial assets and the contractual terms of the financial asset give rise on specified dates to cash flows that are solely payments of principal and interest on the principal amount outstanding. The Company has made an irrevocable election for its investments which are classified as equity instruments to present the subsequent changes in fair value in other comprehensive income based on its business model.
(iii) Financial assets at fair value through profit or loss
A financial asset, which is not classified in any of the above categories, is subsequently fair valued through profit or loss.
(iv) Financial liabilities
Financial liabilities are subsequently carried at amortized cost using the effective interest method, except for contingent consideration recognized in a business combination, which is subsequently measured at fair value through profit or loss. For trade and other payables maturing within one year from the Balance Sheet date, the carrying amounts approximate fair value due to the short maturity of these instruments.
(v) Investment in subsidiaries
Investment in subsidiaries is carried at cost in the separate financial statements.
b. Derivative financial instruments
The Company holds derivative financial instruments such as foreign exchange forward and options contracts to mitigate the risk of changes in exchange rates on foreign currency exposures. The counterparty for these contracts is generally a bank.
(i) Financial assets or financial liabilities, at fair value through profit or loss.
This category includes derivative financial assets or liabilities which are not designated as hedges.
Although the Company believes that these derivatives constitute hedges from an economic perspective, they may not qualify for hedge accounting under Ind AS 109, Financial Instruments. Any derivative that is either not designated as hedge, or is so designated but is ineffective as per Ind AS 109, is categorized as a financial asset or financial liability, at fair value through profit or loss.
Derivatives not designated as hedges are recognized initially at fair value and attributable transaction costs are recognized in net profit in the Statement of Profit and Loss when incurred. Subsequent to initial recognition, these derivatives are measured at fair value through profit or loss and the resulting exchange gains or losses are included in other income. Assets/ liabilities in this category are presented as current assets/current liabilities if they are either held for trading or are expected to be realized within 12 months after the Balance Sheet date.
(ii) Cash flow hedge
The Company designates certain foreign exchange forward and options contracts as cash flow hedges to mitigate the risk of foreign exchange exposure on highly probable forecast cash transactions.
When a derivative is designated as a cash flow hedging instrument, the effective portion of changes in the fair value of the derivative is recognized in other comprehensive income and accumulated in the cash flow hedging reserve. Any ineffective portion of changes in the fair value of the derivative is recognized immediately in the net profit in the Statement of Profit and Loss. If the hedging instrument no longer meets the criteria for hedge accounting, then hedge accounting is discontinued prospectively. If the hedging instrument expires or is sold, terminated or exercised, the cumulative gain or loss
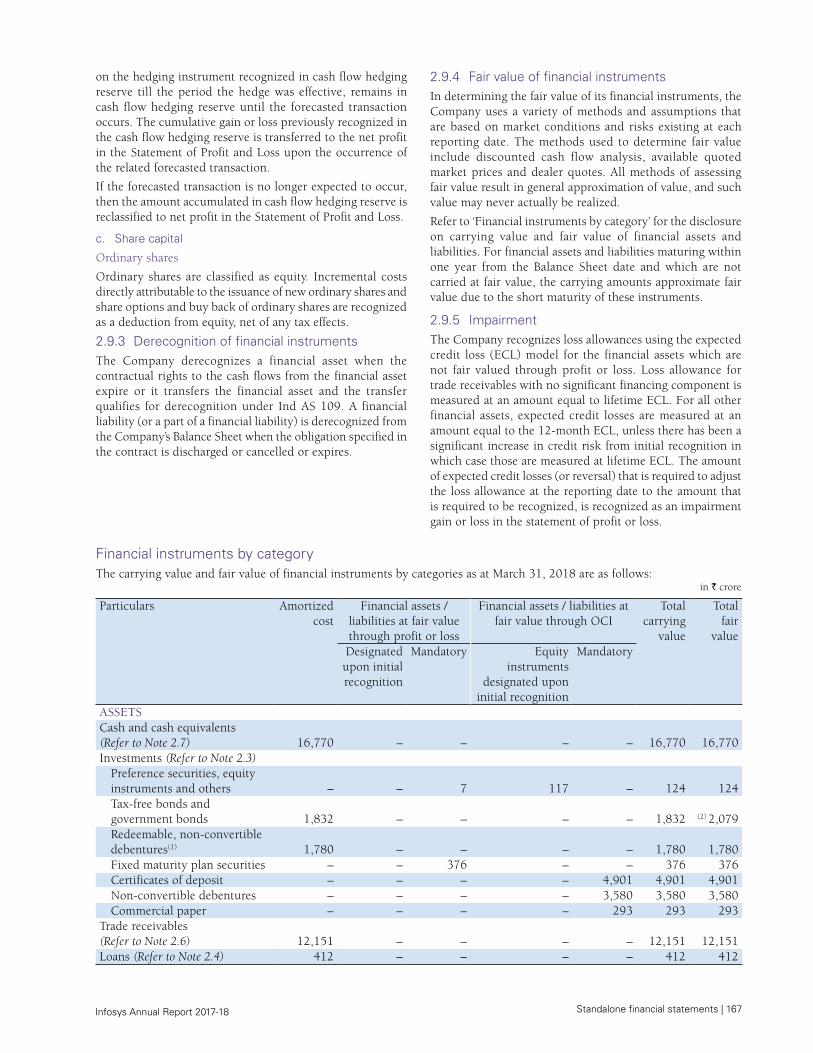
Standalone financial statements | 167 Infosys Annual Report 2017-18
on the hedging instrument recognized in cash flow hedging reserve till the period the hedge was effective, remains in cash flow hedging reserve until the forecasted transaction occurs. The cumulative gain or loss previously recognized in the cash flow hedging reserve is transferred to the net profit in the Statement of Profit and Loss upon the occurrence of the related forecasted transaction.
If the forecasted transaction is no longer expected to occur, then the amount accumulated in cash flow hedging reserve is reclassified to net profit in the Statement of Profit and Loss.
c. Share capital
Ordinary shares
Ordinary shares are classified as equity. Incremental costs directly attributable to the issuance of new ordinary shares and share options and buy back of ordinary shares are recognized as a deduction from equity, net of any tax effects.
2.9.3 Derecognition of financial instrumentsThe Company derecognizes a financial asset when the contractual rights to the cash flows from the financial asset expire or it transfers the financial asset and the transfer qualifies for derecognition under Ind AS 109. A financial liability (or a part of a financial liability) is derecognized from the Company’s Balance Sheet when the obligation specified in the contract is discharged or cancelled or expires.
2.9.4 Fair value of financial instrumentsIn determining the fair value of its financial instruments, the Company uses a variety of methods and assumptions that are based on market conditions and risks existing at each reporting date. The methods used to determine fair value include discounted cash flow analysis, available quoted market prices and dealer quotes. All methods of assessing fair value result in general approximation of value, and such value may never actually be realized.
Refer to ‘Financial instruments by category’ for the disclosure on carrying value and fair value of financial assets and liabilities. For financial assets and liabilities maturing within one year from the Balance Sheet date and which are not carried at fair value, the carrying amounts approximate fair value due to the short maturity of these instruments.
2.9.5 Impairment The Company recognizes loss allowances using the expected credit loss (ECL) model for the financial assets which are not fair valued through profit or loss. Loss allowance for trade receivables with no significant financing component is measured at an amount equal to lifetime ECL. For all other financial assets, expected credit losses are measured at an amount equal to the 12-month ECL, unless there has been a significant increase in credit risk from initial recognition in which case those are measured at lifetime ECL. The amount of expected credit losses (or reversal) that is required to adjust the loss allowance at the reporting date to the amount that is required to be recognized, is recognized as an impairment gain or loss in the statement of profit or loss.
Financial instruments by category The carrying value and fair value of financial instruments by categories as at March 31, 2018 are as follows:
in ` crore
Particulars
Amortized cost
Financial assets / liabilities at fair value through profit or loss
Financial assets / liabilities at fair value through OCI
Total carrying
value
Total fair
valueDesignated
upon initial recognition
Mandatory Equity instruments
designated upon initial recognition
Mandatory
ASSETS Cash and cash equivalents (Refer to Note 2.7) 16,770 – – – – 16,770 16,770 Investments (Refer to Note 2.3)
Preference securities, equity instruments and others – – 7 117 – 124 124 Tax-free bonds and government bonds 1,832 – – – – 1,832 (2) 2,079Redeemable, non-convertible debentures(1) 1,780 – – – – 1,780 1,780 Fixed maturity plan securities – – 376 – – 376 376 Certificates of deposit – – – – 4,901 4,901 4,901 Non-convertible debentures – – – – 3,580 3,580 3,580 Commercial paper – – – – 293 293 293
Trade receivables (Refer to Note 2.6) 12,151 – – – – 12,151 12,151 Loans (Refer to Note 2.4) 412 – – – – 412 412
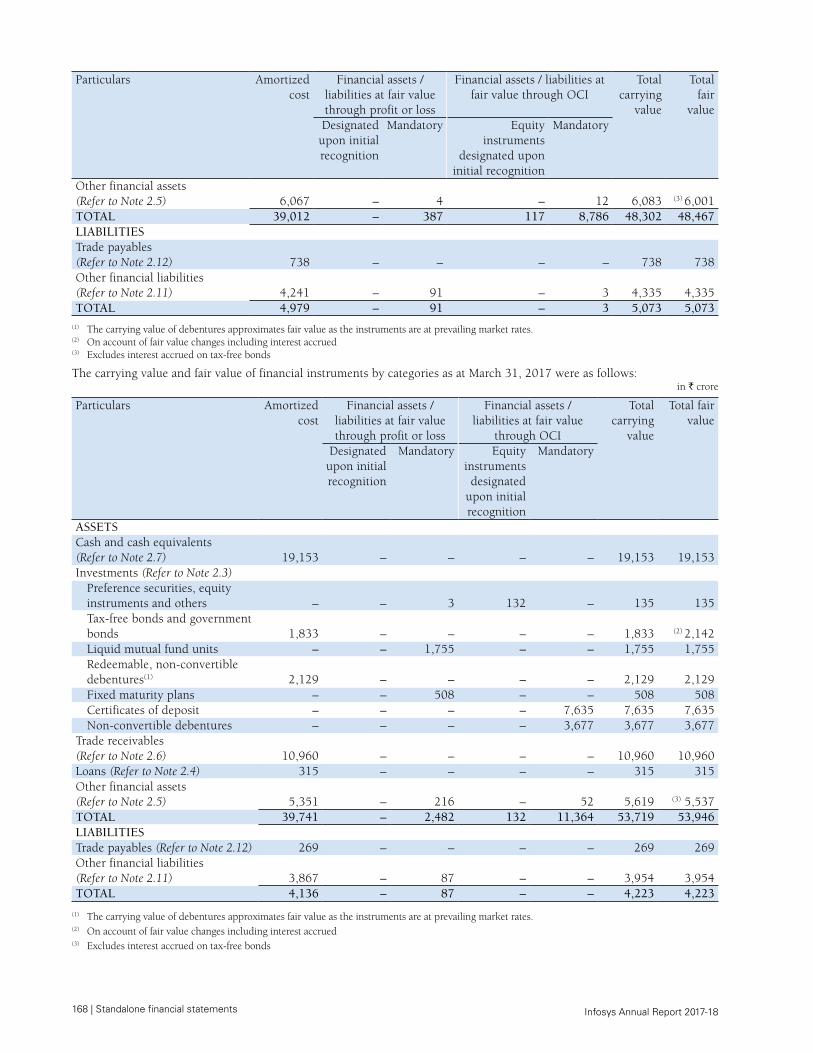
168 | Standalone financial statements Infosys Annual Report 2017-18
Particulars
Amortized cost
Financial assets / liabilities at fair value through profit or loss
Financial assets / liabilities at fair value through OCI
Total carrying
value
Total fair
valueDesignated
upon initial recognition
Mandatory Equity instruments
designated upon initial recognition
Mandatory
Other financial assets (Refer to Note 2.5) 6,067 – 4 – 12 6,083 (3) 6,001TOTAL 39,012 – 387 117 8,786 48,302 48,467 LIABILITIES Trade payables (Refer to Note 2.12) 738 – – – – 738 738 Other financial liabilities (Refer to Note 2.11) 4,241 – 91 – 3 4,335 4,335 TOTAL 4,979 – 91 – 3 5,073 5,073
(1) The carrying value of debentures approximates fair value as the instruments are at prevailing market rates.(2) On account of fair value changes including interest accrued(3) Excludes interest accrued on tax-free bonds
The carrying value and fair value of financial instruments by categories as at March 31, 2017 were as follows: in ` crore
Particulars
Amortized cost
Financial assets / liabilities at fair value through profit or loss
Financial assets / liabilities at fair value
through OCI
Total carrying
value
Total fair value
Designated upon initial recognition
Mandatory Equity instruments designated
upon initial recognition
Mandatory
ASSETSCash and cash equivalents (Refer to Note 2.7) 19,153 – – – – 19,153 19,153 Investments (Refer to Note 2.3)
Preference securities, equity instruments and others – – 3 132 – 135 135 Tax-free bonds and government bonds 1,833 – – – – 1,833 (2) 2,142Liquid mutual fund units – – 1,755 – – 1,755 1,755 Redeemable, non-convertible debentures(1) 2,129 – – – – 2,129 2,129 Fixed maturity plans – – 508 – – 508 508 Certificates of deposit – – – – 7,635 7,635 7,635 Non-convertible debentures – – – – 3,677 3,677 3,677
Trade receivables (Refer to Note 2.6) 10,960 – – – – 10,960 10,960 Loans (Refer to Note 2.4) 315 – – – – 315 315 Other financial assets (Refer to Note 2.5) 5,351 – 216 – 52 5,619 (3) 5,537TOTAL 39,741 – 2,482 132 11,364 53,719 53,946 LIABILITIES Trade payables (Refer to Note 2.12) 269 – – – – 269 269 Other financial liabilities (Refer to Note 2.11) 3,867 – 87 – – 3,954 3,954 TOTAL 4,136 – 87 – – 4,223 4,223
(1) The carrying value of debentures approximates fair value as the instruments are at prevailing market rates.(2) On account of fair value changes including interest accrued(3) Excludes interest accrued on tax-free bonds
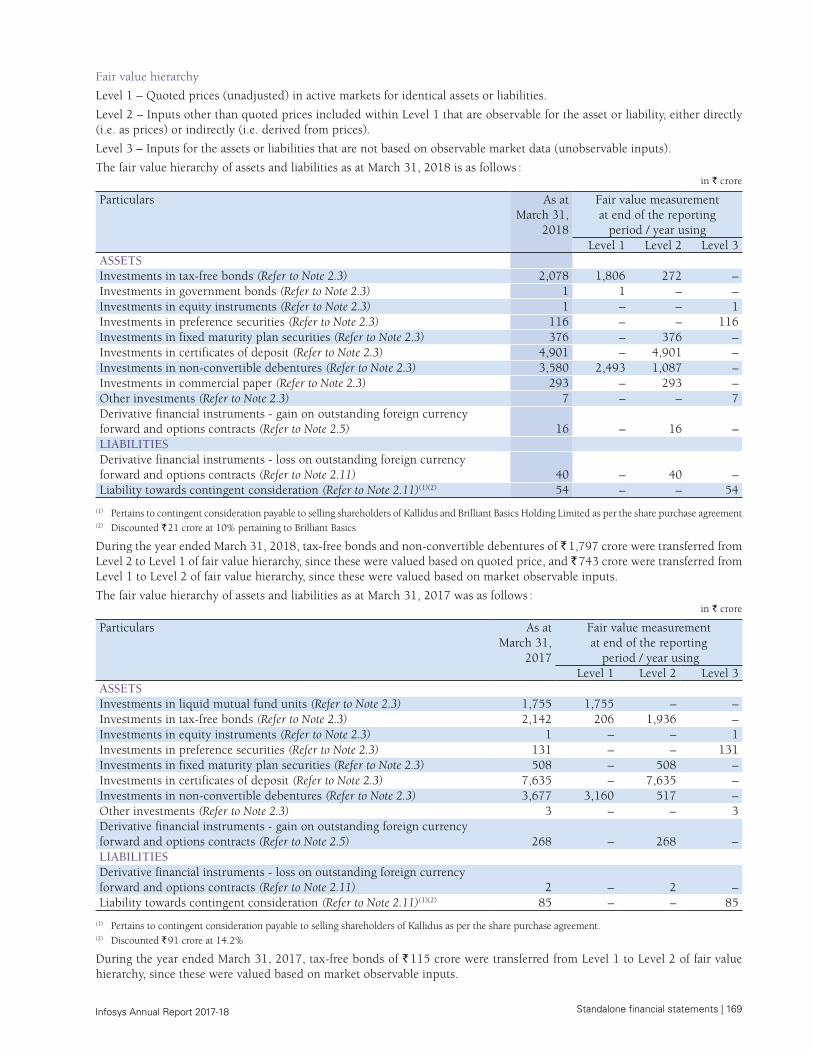
Standalone financial statements | 169 Infosys Annual Report 2017-18
Fair value hierarchy
Level 1 – Quoted prices (unadjusted) in active markets for identical assets or liabilities.
Level 2 – Inputs other than quoted prices included within Level 1 that are observable for the asset or liability, either directly (i.e. as prices) or indirectly (i.e. derived from prices).
Level 3 – Inputs for the assets or liabilities that are not based on observable market data (unobservable inputs).
The fair value hierarchy of assets and liabilities as at March 31, 2018 is as follows : in ` crore
Particulars As at March 31,
2018
Fair value measurement at end of the reporting
period / year using Level 1 Level 2 Level 3
ASSETS Investments in tax-free bonds (Refer to Note 2.3) 2,078 1,806 272 – Investments in government bonds (Refer to Note 2.3) 1 1 – – Investments in equity instruments (Refer to Note 2.3) 1 – – 1 Investments in preference securities (Refer to Note 2.3) 116 – – 116 Investments in fixed maturity plan securities (Refer to Note 2.3) 376 – 376 – Investments in certificates of deposit (Refer to Note 2.3) 4,901 – 4,901 – Investments in non-convertible debentures (Refer to Note 2.3) 3,580 2,493 1,087 – Investments in commercial paper (Refer to Note 2.3) 293 – 293 – Other investments (Refer to Note 2.3) 7 – – 7 Derivative financial instruments - gain on outstanding foreign currency forward and options contracts (Refer to Note 2.5) 16 – 16 – LIABILITIESDerivative financial instruments - loss on outstanding foreign currency forward and options contracts (Refer to Note 2.11) 40 – 40 – Liability towards contingent consideration (Refer to Note 2.11)(1)(2) 54 – – 54
(1) Pertains to contingent consideration payable to selling shareholders of Kallidus and Brilliant Basics Holding Limited as per the share purchase agreement(2) Discounted ` 21 crore at 10% pertaining to Brilliant Basics
During the year ended March 31, 2018, tax-free bonds and non-convertible debentures of ` 1,797 crore were transferred from Level 2 to Level 1 of fair value hierarchy, since these were valued based on quoted price, and ` 743 crore were transferred from Level 1 to Level 2 of fair value hierarchy, since these were valued based on market observable inputs.
The fair value hierarchy of assets and liabilities as at March 31, 2017 was as follows : in ` crore
Particulars As at March 31,
2017
Fair value measurement at end of the reporting
period / year using Level 1 Level 2 Level 3
ASSETS Investments in liquid mutual fund units (Refer to Note 2.3) 1,755 1,755 – – Investments in tax-free bonds (Refer to Note 2.3) 2,142 206 1,936 – Investments in equity instruments (Refer to Note 2.3) 1 – – 1 Investments in preference securities (Refer to Note 2.3) 131 – – 131 Investments in fixed maturity plan securities (Refer to Note 2.3) 508 – 508 – Investments in certificates of deposit (Refer to Note 2.3) 7,635 – 7,635 – Investments in non-convertible debentures (Refer to Note 2.3) 3,677 3,160 517 – Other investments (Refer to Note 2.3) 3 – – 3 Derivative financial instruments - gain on outstanding foreign currency forward and options contracts (Refer to Note 2.5) 268 – 268 – LIABILITIESDerivative financial instruments - loss on outstanding foreign currency forward and options contracts (Refer to Note 2.11) 2 – 2 – Liability towards contingent consideration (Refer to Note 2.11)(1)(2) 85 – – 85
(1) Pertains to contingent consideration payable to selling shareholders of Kallidus as per the share purchase agreement.(2) Discounted ` 91 crore at 14.2%
During the year ended March 31, 2017, tax-free bonds of ` 115 crore were transferred from Level 1 to Level 2 of fair value hierarchy, since these were valued based on market observable inputs.
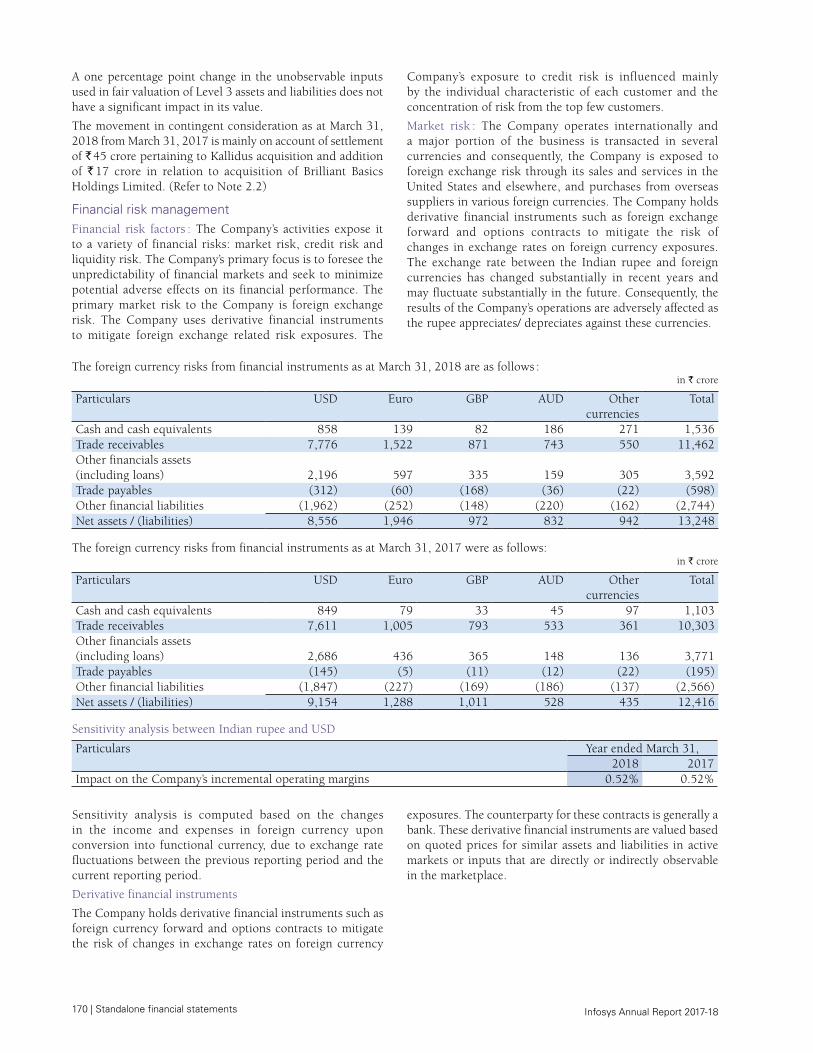
170 | Standalone financial statements Infosys Annual Report 2017-18
Company’s exposure to credit risk is influenced mainly by the individual characteristic of each customer and the concentration of risk from the top few customers.
Market risk : The Company operates internationally and a major portion of the business is transacted in several currencies and consequently, the Company is exposed to foreign exchange risk through its sales and services in the United States and elsewhere, and purchases from overseas suppliers in various foreign currencies. The Company holds derivative financial instruments such as foreign exchange forward and options contracts to mitigate the risk of changes in exchange rates on foreign currency exposures. The exchange rate between the Indian rupee and foreign currencies has changed substantially in recent years and may fluctuate substantially in the future. Consequently, the results of the Company’s operations are adversely affected as the rupee appreciates/ depreciates against these currencies.
The foreign currency risks from financial instruments as at March 31, 2018 are as follows :in ` crore
Particulars USD Euro GBP AUD Other currencies
Total
Cash and cash equivalents 858 139 82 186 271 1,536 Trade receivables 7,776 1,522 871 743 550 11,462 Other financials assets (including loans) 2,196 597 335 159 305 3,592 Trade payables (312) (60) (168) (36) (22) (598)Other financial liabilities (1,962) (252) (148) (220) (162) (2,744)Net assets / (liabilities) 8,556 1,946 972 832 942 13,248
The foreign currency risks from financial instruments as at March 31, 2017 were as follows:in ` crore
Particulars USD Euro GBP AUD Other currencies
Total
Cash and cash equivalents 849 79 33 45 97 1,103 Trade receivables 7,611 1,005 793 533 361 10,303 Other financials assets (including loans) 2,686 436 365 148 136 3,771 Trade payables (145) (5) (11) (12) (22) (195)Other financial liabilities (1,847) (227) (169) (186) (137) (2,566)Net assets / (liabilities) 9,154 1,288 1,011 528 435 12,416
Sensitivity analysis between Indian rupee and USD
Particulars Year ended March 31,2018 2017
Impact on the Company’s incremental operating margins 0.52% 0.52%
Sensitivity analysis is computed based on the changes in the income and expenses in foreign currency upon conversion into functional currency, due to exchange rate fluctuations between the previous reporting period and the current reporting period.
Derivative financial instruments
The Company holds derivative financial instruments such as foreign currency forward and options contracts to mitigate the risk of changes in exchange rates on foreign currency
A one percentage point change in the unobservable inputs used in fair valuation of Level 3 assets and liabilities does not have a significant impact in its value.
The movement in contingent consideration as at March 31, 2018 from March 31, 2017 is mainly on account of settlement of ` 45 crore pertaining to Kallidus acquisition and addition of ` 17 crore in relation to acquisition of Brilliant Basics Holdings Limited. (Refer to Note 2.2)
Financial risk management Financial risk factors : The Company’s activities expose it to a variety of financial risks: market risk, credit risk and liquidity risk. The Company’s primary focus is to foresee the unpredictability of financial markets and seek to minimize potential adverse effects on its financial performance. The primary market risk to the Company is foreign exchange risk. The Company uses derivative financial instruments to mitigate foreign exchange related risk exposures. The
exposures. The counterparty for these contracts is generally a bank. These derivative financial instruments are valued based on quoted prices for similar assets and liabilities in active markets or inputs that are directly or indirectly observable in the marketplace.

Standalone financial statements | 171 Infosys Annual Report 2017-18
The details in respect of outstanding foreign currency forward and options contracts are as follows :
Particulars As at March 31, 2018 As at March 31, 2017In million In ` crore In million In ` crore
DERIVATIVES DESIGNATED AS CASH FLOW HEDGESForward contracts
In AUD – – 130 644 In Euro – – 95 658 In GBP – – 40 324
Options ContractsIn AUD 60 300 – – In Euro 100 808 40 277 In GBP 20 184 – –
OTHER DERIVATIVESForward contracts
In AUD – – 30 149 In CAD 20 99 – – In Euro 86 695 106 735 In JPY 550 34 – – In NZD 16 76 – – In NOK 40 34 – – In ZAR 25 14 – – In SGD 5 25 5 23 In SEK 50 40 50 36 In CHF 21 146 10 65 In USD 556 3,624 480 3,113 In GBP 45 415 70 566
Options contractsIn AUD 20 100 – – In CAD – – 13 65 In Euro 45 363 25 173 In CHF 5 33 – – In USD 320 2,086 195 1,265 In GBP 25 231 30 243
TOTAL FORWARD AND OPTIONS CONTRACTS 9,307 8,336
The foreign exchange forward and options contracts mature within 12 months. The table below analyzes the derivative financial instruments into relevant maturity groupings based on the remaining period as at the Balance Sheet date:
in ` crore
Particulars As at March 31,2018 2017
Not later than one month 2,693 2,215 Later than one month and not later than three months 4,274 4,103 Later than three months and not later than one year 2,340 2,018 TOTAL 9,307 8,336
During the years ended March 31, 2018 and March 31, 2017, the Company has designated certain foreign exchange forward and options contracts as cash flow hedges to mitigate the risk of foreign exchange exposure on highly probable forecast cash transactions. The related hedge transactions for balance in cash flow hedging reserve as at March 31, 2018 are expected to occur and reclassified to the Statement of Profit or Loss within three months.
Hedge effectiveness is determined at the inception of the hedge relationship, and through periodic prospective effectiveness
assessments to ensure that an economic relationship exists between the hedged item and hedging instrument, including whether the hedging instrument is expected to offset changes in cash flows of hedged items.
If the hedge ratio for risk management purposes is no longer optimal but the risk management objective remains unchanged and the hedge continues to qualify for hedge accounting, the hedge relationship will be rebalanced by adjusting either the volume of the hedging instrument or the volume of the hedged item so that the hedge ratio aligns with the ratio used for risk management purposes. Any hedge ineffectiveness is calculated and accounted for in the Statement of Profit or Loss at the time of the hedge relationship rebalancing.
The reconciliation of effective portion of cash flow hedges is as follows :
in ` crore
Particulars Year ended March 31,2018 2017
Gain / (Loss)Balance at the beginning of the year 39 – Gain / (Loss) recognized in other comprehensive income during the year (93) 121
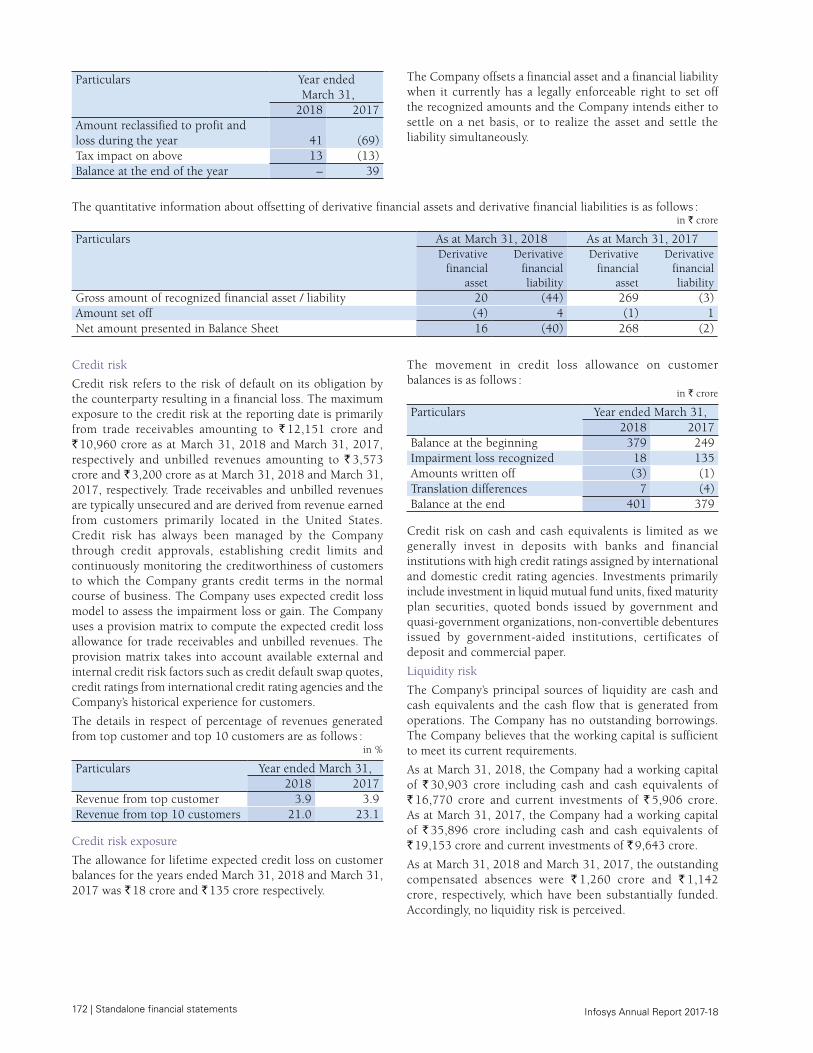
172 | Standalone financial statements Infosys Annual Report 2017-18
Particulars Year ended March 31,2018 2017
Amount reclassified to profit and loss during the year 41 (69)Tax impact on above 13 (13)Balance at the end of the year – 39
The Company offsets a financial asset and a financial liability when it currently has a legally enforceable right to set off the recognized amounts and the Company intends either to settle on a net basis, or to realize the asset and settle the liability simultaneously.
The quantitative information about offsetting of derivative financial assets and derivative financial liabilities is as follows :in ` crore
Particulars As at March 31, 2018 As at March 31, 2017Derivative
financial asset
Derivative financial liability
Derivative financial
asset
Derivative financial liability
Gross amount of recognized financial asset / liability 20 (44) 269 (3)Amount set off (4) 4 (1) 1 Net amount presented in Balance Sheet 16 (40) 268 (2)
Credit risk
Credit risk refers to the risk of default on its obligation by the counterparty resulting in a financial loss. The maximum exposure to the credit risk at the reporting date is primarily from trade receivables amounting to ` 12,151 crore and ` 10,960 crore as at March 31, 2018 and March 31, 2017, respectively and unbilled revenues amounting to ` 3,573 crore and ` 3,200 crore as at March 31, 2018 and March 31, 2017, respectively. Trade receivables and unbilled revenues are typically unsecured and are derived from revenue earned from customers primarily located in the United States. Credit risk has always been managed by the Company through credit approvals, establishing credit limits and continuously monitoring the creditworthiness of customers to which the Company grants credit terms in the normal course of business. The Company uses expected credit loss model to assess the impairment loss or gain. The Company uses a provision matrix to compute the expected credit loss allowance for trade receivables and unbilled revenues. The provision matrix takes into account available external and internal credit risk factors such as credit default swap quotes, credit ratings from international credit rating agencies and the Company’s historical experience for customers.
The details in respect of percentage of revenues generated from top customer and top 10 customers are as follows :
in %
Particulars Year ended March 31,2018 2017
Revenue from top customer 3.9 3.9Revenue from top 10 customers 21.0 23.1
Credit risk exposure
The allowance for lifetime expected credit loss on customer balances for the years ended March 31, 2018 and March 31, 2017 was ` 18 crore and ` 135 crore respectively.
The movement in credit loss allowance on customer balances is as follows :
in ` crore
Particulars Year ended March 31,2018 2017
Balance at the beginning 379 249 Impairment loss recognized 18 135 Amounts written off (3) (1)Translation differences 7 (4)Balance at the end 401 379
Credit risk on cash and cash equivalents is limited as we generally invest in deposits with banks and financial institutions with high credit ratings assigned by international and domestic credit rating agencies. Investments primarily include investment in liquid mutual fund units, fixed maturity plan securities, quoted bonds issued by government and quasi-government organizations, non-convertible debentures issued by government-aided institutions, certificates of deposit and commercial paper.
Liquidity risk
The Company’s principal sources of liquidity are cash and cash equivalents and the cash flow that is generated from operations. The Company has no outstanding borrowings. The Company believes that the working capital is sufficient to meet its current requirements.
As at March 31, 2018, the Company had a working capital of ` 30,903 crore including cash and cash equivalents of ` 16,770 crore and current investments of ` 5,906 crore. As at March 31, 2017, the Company had a working capital of ` 35,896 crore including cash and cash equivalents of ` 19,153 crore and current investments of ` 9,643 crore.
As at March 31, 2018 and March 31, 2017, the outstanding compensated absences were ` 1,260 crore and ` 1,142 crore, respectively, which have been substantially funded. Accordingly, no liquidity risk is perceived.
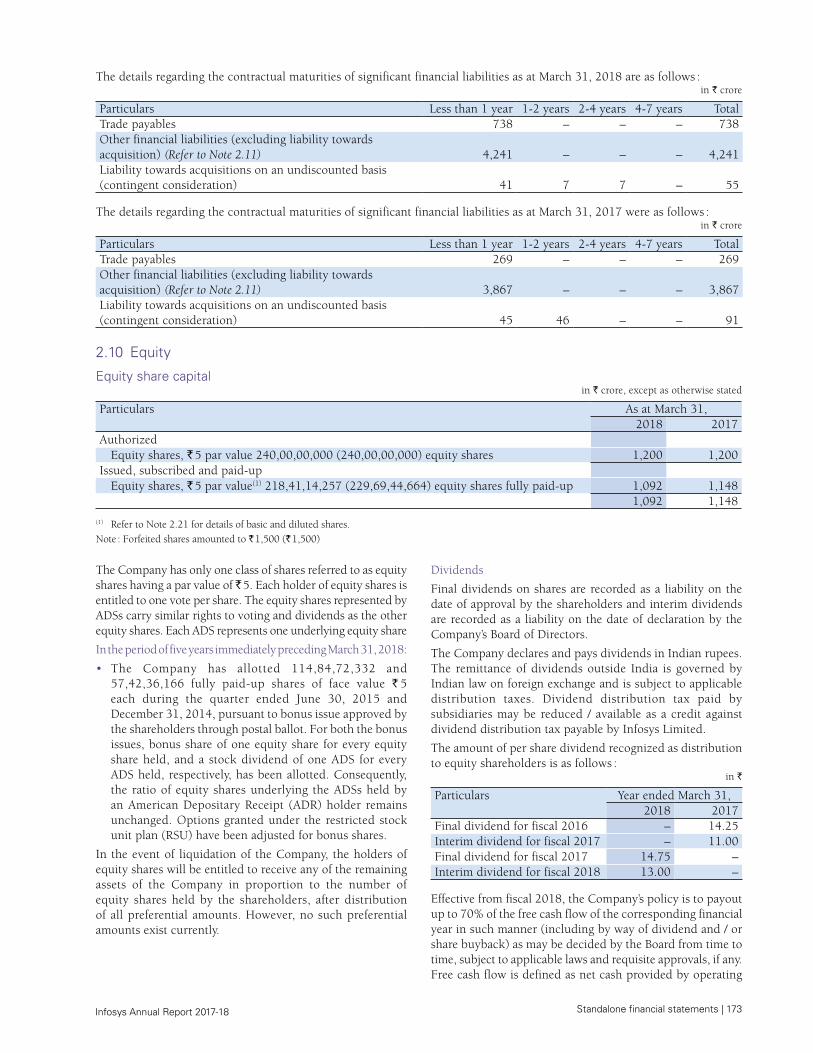
Standalone financial statements | 173 Infosys Annual Report 2017-18
The details regarding the contractual maturities of significant financial liabilities as at March 31, 2018 are as follows : in ` crore
Particulars Less than 1 year 1-2 years 2-4 years 4-7 years Total Trade payables 738 – – – 738 Other financial liabilities (excluding liability towards acquisition) (Refer to Note 2.11) 4,241 – – – 4,241 Liability towards acquisitions on an undiscounted basis (contingent consideration) 41 7 7 – 55
The details regarding the contractual maturities of significant financial liabilities as at March 31, 2017 were as follows : in ` crore
Particulars Less than 1 year 1-2 years 2-4 years 4-7 years Total Trade payables 269 – – – 269 Other financial liabilities (excluding liability towards acquisition) (Refer to Note 2.11) 3,867 – – – 3,867 Liability towards acquisitions on an undiscounted basis (contingent consideration) 45 46 – – 91
2.10 Equity
Equity share capitalin ` crore, except as otherwise stated
Particulars As at March 31, 2018 2017
AuthorizedEquity shares, ` 5 par value 240,00,00,000 (240,00,00,000) equity shares 1,200 1,200
Issued, subscribed and paid-upEquity shares, ` 5 par value(1) 218,41,14,257 (229,69,44,664) equity shares fully paid-up 1,092 1,148
1,092 1,148
(1) Refer to Note 2.21 for details of basic and diluted shares.Note : Forfeited shares amounted to ` 1,500 (` 1,500)
The Company has only one class of shares referred to as equity shares having a par value of ̀ 5. Each holder of equity shares is entitled to one vote per share. The equity shares represented by ADSs carry similar rights to voting and dividends as the other equity shares. Each ADS represents one underlying equity share
In the period of five years immediately preceding March 31, 2018:
• The Company has allotted 114,84,72,332 and 57,42,36,166 fully paid-up shares of face value ` 5 each during the quarter ended June 30, 2015 and December 31, 2014, pursuant to bonus issue approved by the shareholders through postal ballot. For both the bonus issues, bonus share of one equity share for every equity share held, and a stock dividend of one ADS for every ADS held, respectively, has been allotted. Consequently, the ratio of equity shares underlying the ADSs held by an American Depositary Receipt (ADR) holder remains unchanged. Options granted under the restricted stock unit plan (RSU) have been adjusted for bonus shares.
In the event of liquidation of the Company, the holders of equity shares will be entitled to receive any of the remaining assets of the Company in proportion to the number of equity shares held by the shareholders, after distribution of all preferential amounts. However, no such preferential amounts exist currently.
Dividends
Final dividends on shares are recorded as a liability on the date of approval by the shareholders and interim dividends are recorded as a liability on the date of declaration by the Company’s Board of Directors.
The Company declares and pays dividends in Indian rupees. The remittance of dividends outside India is governed by Indian law on foreign exchange and is subject to applicable distribution taxes. Dividend distribution tax paid by subsidiaries may be reduced / available as a credit against dividend distribution tax payable by Infosys Limited.
The amount of per share dividend recognized as distribution to equity shareholders is as follows :
in `
Particulars Year ended March 31,2018 2017
Final dividend for fiscal 2016 – 14.25Interim dividend for fiscal 2017 – 11.00Final dividend for fiscal 2017 14.75 – Interim dividend for fiscal 2018 13.00 –
Effective from fiscal 2018, the Company’s policy is to payout up to 70% of the free cash flow of the corresponding financial year in such manner (including by way of dividend and / or share buyback) as may be decided by the Board from time to time, subject to applicable laws and requisite approvals, if any. Free cash flow is defined as net cash provided by operating
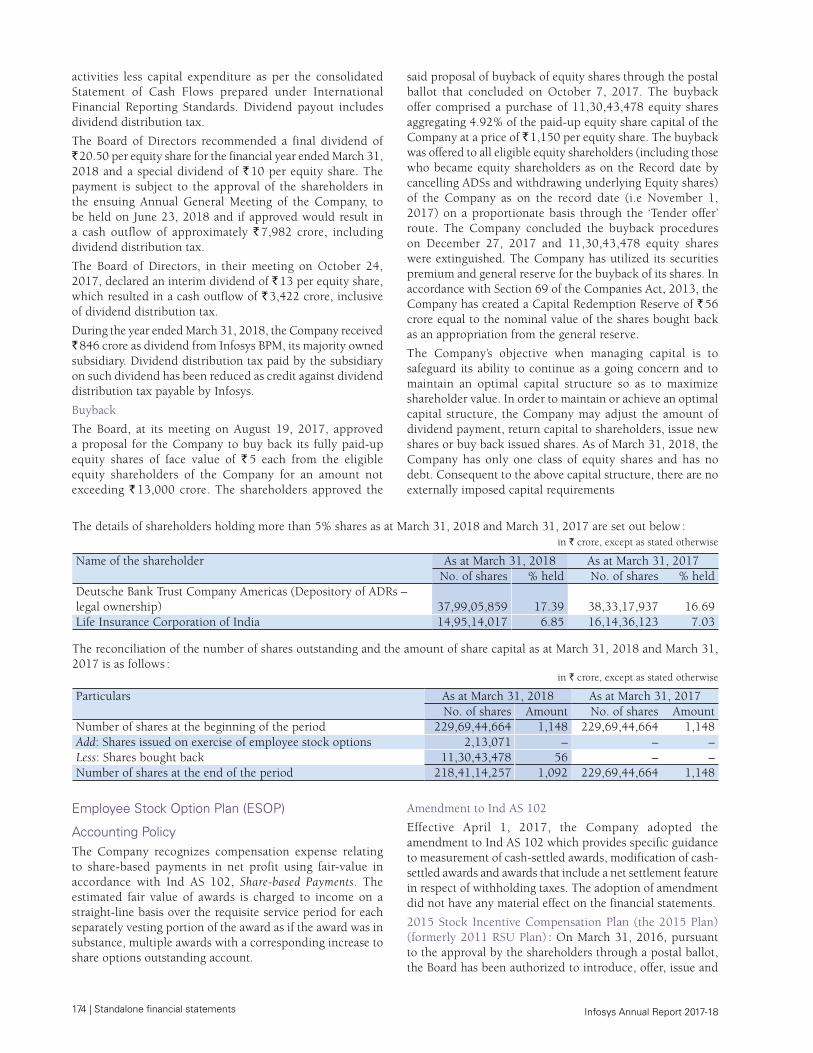
174 | Standalone financial statements Infosys Annual Report 2017-18
The details of shareholders holding more than 5% shares as at March 31, 2018 and March 31, 2017 are set out below :in ` crore, except as stated otherwise
Name of the shareholder As at March 31, 2018 As at March 31, 2017No. of shares % held No. of shares % held
Deutsche Bank Trust Company Americas (Depository of ADRs – legal ownership) 37,99,05,859 17.39 38,33,17,937 16.69Life Insurance Corporation of India 14,95,14,017 6.85 16,14,36,123 7.03
The reconciliation of the number of shares outstanding and the amount of share capital as at March 31, 2018 and March 31, 2017 is as follows :
in ` crore, except as stated otherwise
Particulars As at March 31, 2018 As at March 31, 2017No. of shares Amount No. of shares Amount
Number of shares at the beginning of the period 229,69,44,664 1,148 229,69,44,664 1,148 Add: Shares issued on exercise of employee stock options 2,13,071 – – – Less: Shares bought back 11,30,43,478 56 – – Number of shares at the end of the period 218,41,14,257 1,092 229,69,44,664 1,148
activities less capital expenditure as per the consolidated Statement of Cash Flows prepared under International Financial Reporting Standards. Dividend payout includes dividend distribution tax.
The Board of Directors recommended a final dividend of ` 20.50 per equity share for the financial year ended March 31, 2018 and a special dividend of ` 10 per equity share. The payment is subject to the approval of the shareholders in the ensuing Annual General Meeting of the Company, to be held on June 23, 2018 and if approved would result in a cash outflow of approximately ` 7,982 crore, including dividend distribution tax.
The Board of Directors, in their meeting on October 24, 2017, declared an interim dividend of ` 13 per equity share, which resulted in a cash outflow of ` 3,422 crore, inclusive of dividend distribution tax.
During the year ended March 31, 2018, the Company received ` 846 crore as dividend from Infosys BPM, its majority owned subsidiary. Dividend distribution tax paid by the subsidiary on such dividend has been reduced as credit against dividend distribution tax payable by Infosys.
Buyback
The Board, at its meeting on August 19, 2017, approved a proposal for the Company to buy back its fully paid-up equity shares of face value of ` 5 each from the eligible equity shareholders of the Company for an amount not exceeding ` 13,000 crore. The shareholders approved the
said proposal of buyback of equity shares through the postal ballot that concluded on October 7, 2017. The buyback offer comprised a purchase of 11,30,43,478 equity shares aggregating 4.92% of the paid-up equity share capital of the Company at a price of ` 1,150 per equity share. The buyback was offered to all eligible equity shareholders (including those who became equity shareholders as on the Record date by cancelling ADSs and withdrawing underlying Equity shares) of the Company as on the record date (i.e November 1, 2017) on a proportionate basis through the ‘Tender offer’ route. The Company concluded the buyback procedures on December 27, 2017 and 11,30,43,478 equity shares were extinguished. The Company has utilized its securities premium and general reserve for the buyback of its shares. In accordance with Section 69 of the Companies Act, 2013, the Company has created a Capital Redemption Reserve of ` 56 crore equal to the nominal value of the shares bought back as an appropriation from the general reserve.
The Company’s objective when managing capital is to safeguard its ability to continue as a going concern and to maintain an optimal capital structure so as to maximize shareholder value. In order to maintain or achieve an optimal capital structure, the Company may adjust the amount of dividend payment, return capital to shareholders, issue new shares or buy back issued shares. As of March 31, 2018, the Company has only one class of equity shares and has no debt. Consequent to the above capital structure, there are no externally imposed capital requirements
Employee Stock Option Plan (ESOP)
Accounting PolicyThe Company recognizes compensation expense relating to share-based payments in net profit using fair-value in accordance with Ind AS 102, Share‑based Payments. The estimated fair value of awards is charged to income on a straight-line basis over the requisite service period for each separately vesting portion of the award as if the award was in substance, multiple awards with a corresponding increase to share options outstanding account.
Amendment to Ind AS 102
Effective April 1, 2017, the Company adopted the amendment to Ind AS 102 which provides specific guidance to measurement of cash-settled awards, modification of cash-settled awards and awards that include a net settlement feature in respect of withholding taxes. The adoption of amendment did not have any material effect on the financial statements.
2015 Stock Incentive Compensation Plan (the 2015 Plan) (formerly 2011 RSU Plan) : On March 31, 2016, pursuant to the approval by the shareholders through a postal ballot, the Board has been authorized to introduce, offer, issue and
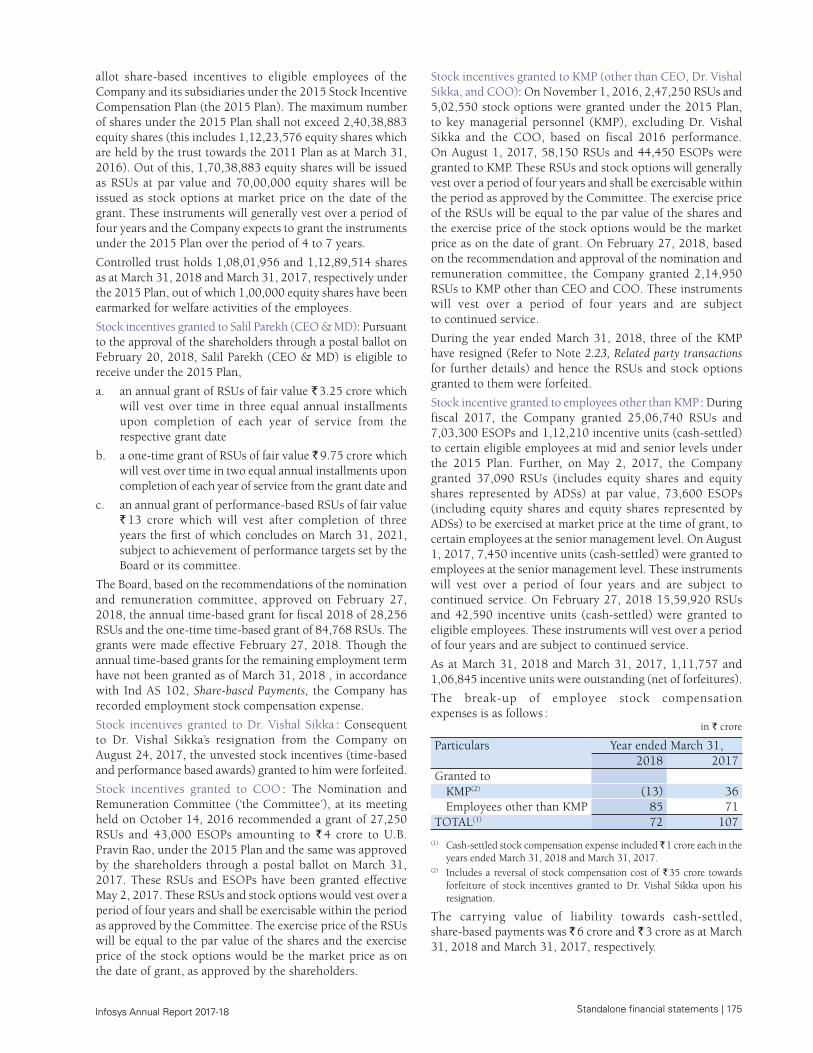
Standalone financial statements | 175 Infosys Annual Report 2017-18
allot share-based incentives to eligible employees of the Company and its subsidiaries under the 2015 Stock Incentive Compensation Plan (the 2015 Plan). The maximum number of shares under the 2015 Plan shall not exceed 2,40,38,883 equity shares (this includes 1,12,23,576 equity shares which are held by the trust towards the 2011 Plan as at March 31, 2016). Out of this, 1,70,38,883 equity shares will be issued as RSUs at par value and 70,00,000 equity shares will be issued as stock options at market price on the date of the grant. These instruments will generally vest over a period of four years and the Company expects to grant the instruments under the 2015 Plan over the period of 4 to 7 years.
Controlled trust holds 1,08,01,956 and 1,12,89,514 shares as at March 31, 2018 and March 31, 2017, respectively under the 2015 Plan, out of which 1,00,000 equity shares have been earmarked for welfare activities of the employees.
Stock incentives granted to Salil Parekh (CEO & MD): Pursuant to the approval of the shareholders through a postal ballot on February 20, 2018, Salil Parekh (CEO & MD) is eligible to receive under the 2015 Plan,
a. an annual grant of RSUs of fair value ` 3.25 crore which will vest over time in three equal annual installments upon completion of each year of service from the respective grant date
b. a one-time grant of RSUs of fair value ̀ 9.75 crore which will vest over time in two equal annual installments upon completion of each year of service from the grant date and
c. an annual grant of performance-based RSUs of fair value ` 13 crore which will vest after completion of three years the first of which concludes on March 31, 2021, subject to achievement of performance targets set by the Board or its committee.
The Board, based on the recommendations of the nomination and remuneration committee, approved on February 27, 2018, the annual time-based grant for fiscal 2018 of 28,256 RSUs and the one-time time-based grant of 84,768 RSUs. The grants were made effective February 27, 2018. Though the annual time-based grants for the remaining employment term have not been granted as of March 31, 2018 , in accordance with Ind AS 102, Share‑based Payments, the Company has recorded employment stock compensation expense.
Stock incentives granted to Dr. Vishal Sikka : Consequent to Dr. Vishal Sikka’s resignation from the Company on August 24, 2017, the unvested stock incentives (time-based and performance based awards) granted to him were forfeited.
Stock incentives granted to COO : The Nomination and Remuneration Committee (‘the Committee’), at its meeting held on October 14, 2016 recommended a grant of 27,250 RSUs and 43,000 ESOPs amounting to ` 4 crore to U.B. Pravin Rao, under the 2015 Plan and the same was approved by the shareholders through a postal ballot on March 31, 2017. These RSUs and ESOPs have been granted effective May 2, 2017. These RSUs and stock options would vest over a period of four years and shall be exercisable within the period as approved by the Committee. The exercise price of the RSUs will be equal to the par value of the shares and the exercise price of the stock options would be the market price as on the date of grant, as approved by the shareholders.
Stock incentives granted to KMP (other than CEO, Dr. Vishal Sikka, and COO): On November 1, 2016, 2,47,250 RSUs and 5,02,550 stock options were granted under the 2015 Plan, to key managerial personnel (KMP), excluding Dr. Vishal Sikka and the COO, based on fiscal 2016 performance. On August 1, 2017, 58,150 RSUs and 44,450 ESOPs were granted to KMP. These RSUs and stock options will generally vest over a period of four years and shall be exercisable within the period as approved by the Committee. The exercise price of the RSUs will be equal to the par value of the shares and the exercise price of the stock options would be the market price as on the date of grant. On February 27, 2018, based on the recommendation and approval of the nomination and remuneration committee, the Company granted 2,14,950 RSUs to KMP other than CEO and COO. These instruments will vest over a period of four years and are subject to continued service.
During the year ended March 31, 2018, three of the KMP have resigned (Refer to Note 2.23, Related party transactions for further details) and hence the RSUs and stock options granted to them were forfeited.
Stock incentive granted to employees other than KMP : During fiscal 2017, the Company granted 25,06,740 RSUs and 7,03,300 ESOPs and 1,12,210 incentive units (cash-settled) to certain eligible employees at mid and senior levels under the 2015 Plan. Further, on May 2, 2017, the Company granted 37,090 RSUs (includes equity shares and equity shares represented by ADSs) at par value, 73,600 ESOPs (including equity shares and equity shares represented by ADSs) to be exercised at market price at the time of grant, to certain employees at the senior management level. On August 1, 2017, 7,450 incentive units (cash-settled) were granted to employees at the senior management level. These instruments will vest over a period of four years and are subject to continued service. On February 27, 2018 15,59,920 RSUs and 42,590 incentive units (cash-settled) were granted to eligible employees. These instruments will vest over a period of four years and are subject to continued service.
As at March 31, 2018 and March 31, 2017, 1,11,757 and 1,06,845 incentive units were outstanding (net of forfeitures).
The break-up of employee stock compensation expenses is as follows :
in ` crore
Particulars Year ended March 31,2018 2017
Granted to KMP(2) (13) 36 Employees other than KMP 85 71
TOTAL(1) 72 107
(1) Cash-settled stock compensation expense included ̀ 1 crore each in the years ended March 31, 2018 and March 31, 2017.
(2) Includes a reversal of stock compensation cost of ` 35 crore towards forfeiture of stock incentives granted to Dr. Vishal Sikka upon his resignation.
The carrying value of liability towards cash-settled, share-based payments was ` 6 crore and ` 3 crore as at March 31, 2018 and March 31, 2017, respectively.
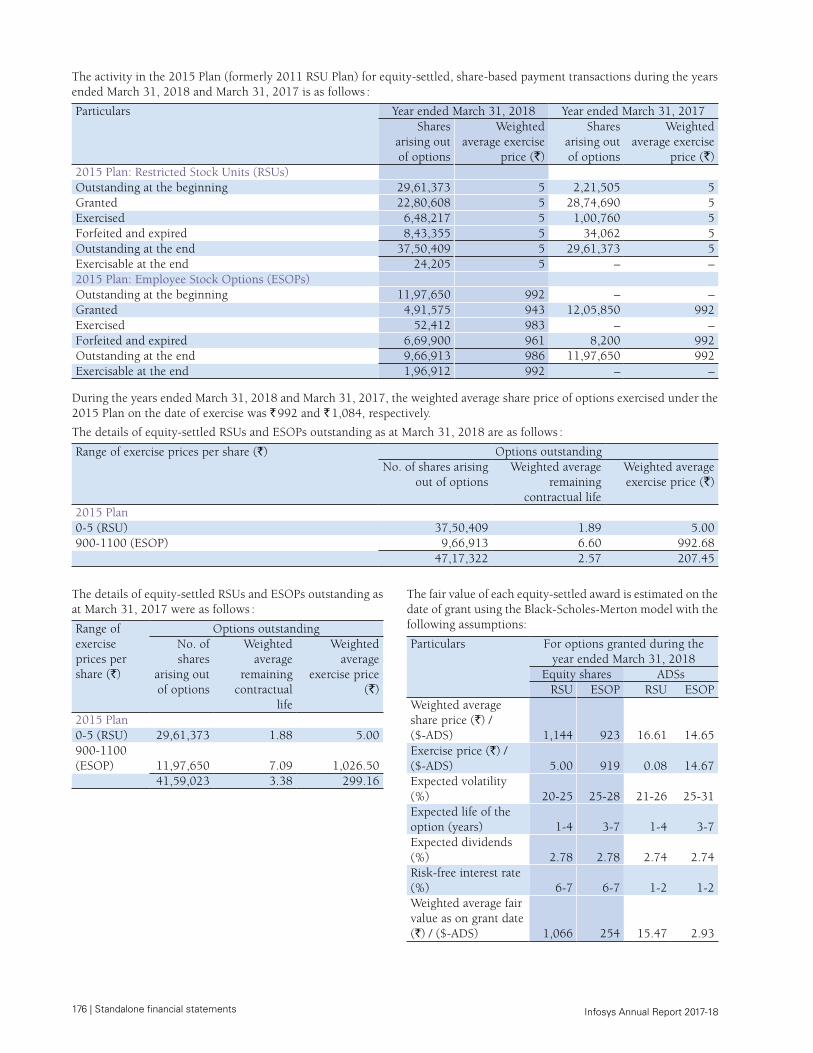
176 | Standalone financial statements Infosys Annual Report 2017-18
The activity in the 2015 Plan (formerly 2011 RSU Plan) for equity-settled, share-based payment transactions during the years ended March 31, 2018 and March 31, 2017 is as follows :
Particulars Year ended March 31, 2018 Year ended March 31, 2017Shares
arising out of options
Weighted average exercise
price (`)
Shares arising out of options
Weighted average exercise
price (`)2015 Plan: Restricted Stock Units (RSUs)Outstanding at the beginning 29,61,373 5 2,21,505 5 Granted 22,80,608 5 28,74,690 5 Exercised 6,48,217 5 1,00,760 5 Forfeited and expired 8,43,355 5 34,062 5 Outstanding at the end 37,50,409 5 29,61,373 5 Exercisable at the end 24,205 5 – – 2015 Plan: Employee Stock Options (ESOPs)Outstanding at the beginning 11,97,650 992 – – Granted 4,91,575 943 12,05,850 992 Exercised 52,412 983 – – Forfeited and expired 6,69,900 961 8,200 992 Outstanding at the end 9,66,913 986 11,97,650 992 Exercisable at the end 1,96,912 992 – –
During the years ended March 31, 2018 and March 31, 2017, the weighted average share price of options exercised under the 2015 Plan on the date of exercise was ` 992 and ` 1,084, respectively.
The details of equity-settled RSUs and ESOPs outstanding as at March 31, 2018 are as follows :
Range of exercise prices per share (`) Options outstandingNo. of shares arising
out of optionsWeighted average
remaining contractual life
Weighted average exercise price (`)
2015 Plan0-5 (RSU) 37,50,409 1.89 5.00 900-1100 (ESOP) 9,66,913 6.60 992.68
47,17,322 2.57 207.45
The details of equity-settled RSUs and ESOPs outstanding as at March 31, 2017 were as follows :
Range of exercise prices per share (`)
Options outstandingNo. of shares
arising out of options
Weighted average
remaining contractual
life
Weighted average
exercise price (`)
2015 Plan0-5 (RSU) 29,61,373 1.88 5.00 900-1100 (ESOP) 11,97,650 7.09 1,026.50
41,59,023 3.38 299.16
The fair value of each equity-settled award is estimated on the date of grant using the Black-Scholes-Merton model with the following assumptions:
Particulars
For options granted during the year ended March 31, 2018
Equity shares ADSsRSU ESOP RSU ESOP
Weighted average share price (`) / ($-ADS) 1,144 923 16.61 14.65Exercise price (`) / ($-ADS) 5.00 919 0.08 14.67Expected volatility (%) 20-25 25-28 21-26 25-31Expected life of the option (years) 1-4 3-7 1-4 3-7Expected dividends (%) 2.78 2.78 2.74 2.74Risk-free interest rate (%) 6-7 6-7 1-2 1-2Weighted average fair value as on grant date (`) / ($-ADS) 1,066 254 15.47 2.93
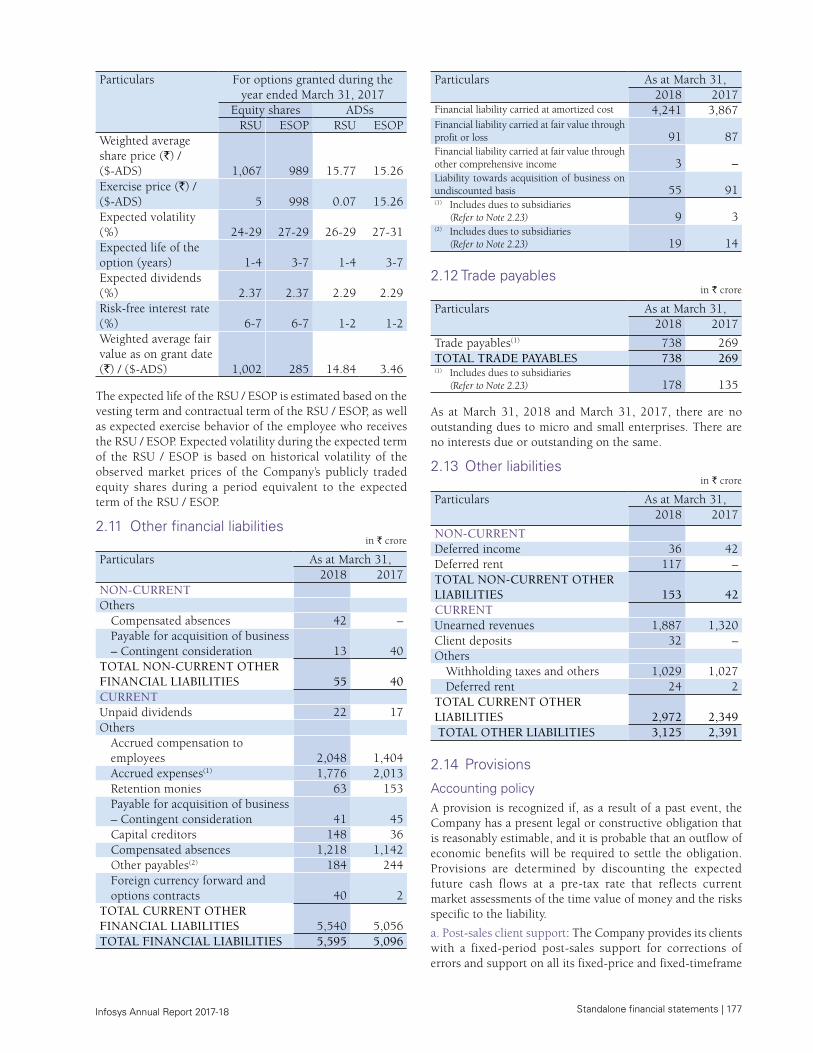
Standalone financial statements | 177 Infosys Annual Report 2017-18
Particulars For options granted during the year ended March 31, 2017
Equity shares ADSsRSU ESOP RSU ESOP
Weighted average share price (`) / ($-ADS) 1,067 989 15.77 15.26Exercise price (`) / ($-ADS) 5 998 0.07 15.26Expected volatility (%) 24-29 27-29 26-29 27-31Expected life of the option (years) 1-4 3-7 1-4 3-7Expected dividends (%) 2.37 2.37 2.29 2.29Risk-free interest rate (%) 6-7 6-7 1-2 1-2Weighted average fair value as on grant date (`) / ($-ADS) 1,002 285 14.84 3.46
The expected life of the RSU / ESOP is estimated based on the vesting term and contractual term of the RSU / ESOP, as well as expected exercise behavior of the employee who receives the RSU / ESOP. Expected volatility during the expected term of the RSU / ESOP is based on historical volatility of the observed market prices of the Company’s publicly traded equity shares during a period equivalent to the expected term of the RSU / ESOP.
2.11 Other financial liabilitiesin ` crore
Particulars As at March 31,2018 2017
NON-CURRENTOthers
Compensated absences 42 – Payable for acquisition of business – Contingent consideration 13 40
TOTAL NON-CURRENT OTHER FINANCIAL LIABILITIES 55 40 CURRENTUnpaid dividends 22 17 Others
Accrued compensation to employees 2,048 1,404 Accrued expenses(1) 1,776 2,013 Retention monies 63 153 Payable for acquisition of business – Contingent consideration 41 45 Capital creditors 148 36 Compensated absences 1,218 1,142 Other payables(2) 184 244 Foreign currency forward and options contracts 40 2
TOTAL CURRENT OTHER FINANCIAL LIABILITIES 5,540 5,056 TOTAL FINANCIAL LIABILITIES 5,595 5,096
Particulars As at March 31,2018 2017
Financial liability carried at amortized cost 4,241 3,867 Financial liability carried at fair value through profit or loss 91 87 Financial liability carried at fair value through other comprehensive income 3 – Liability towards acquisition of business on undiscounted basis 55 91 (1) Includes dues to subsidiaries
(Refer to Note 2.23) 9 3 (2) Includes dues to subsidiaries
(Refer to Note 2.23) 19 14
2.12 Trade payablesin ` crore
Particulars
As at March 31,2018 2017
Trade payables(1) 738 269 TOTAL TRADE PAYABLES 738 269 (1) Includes dues to subsidiaries
(Refer to Note 2.23) 178 135
As at March 31, 2018 and March 31, 2017, there are no outstanding dues to micro and small enterprises. There are no interests due or outstanding on the same.
2.13 Other liabilitiesin ` crore
Particulars
As at March 31,2018 2017
NON-CURRENTDeferred income 36 42 Deferred rent 117 – TOTAL NON-CURRENT OTHER LIABILITIES 153 42 CURRENTUnearned revenues 1,887 1,320 Client deposits 32 – Others
Withholding taxes and others 1,029 1,027 Deferred rent 24 2
TOTAL CURRENT OTHER LIABILITIES 2,972 2,349 TOTAL OTHER LIABILITIES 3,125 2,391
2.14 Provisions
Accounting policyA provision is recognized if, as a result of a past event, the Company has a present legal or constructive obligation that is reasonably estimable, and it is probable that an outflow of economic benefits will be required to settle the obligation. Provisions are determined by discounting the expected future cash flows at a pre-tax rate that reflects current market assessments of the time value of money and the risks specific to the liability.
a. Post-sales client support: The Company provides its clients with a fixed-period post-sales support for corrections of errors and support on all its fixed-price and fixed-timeframe
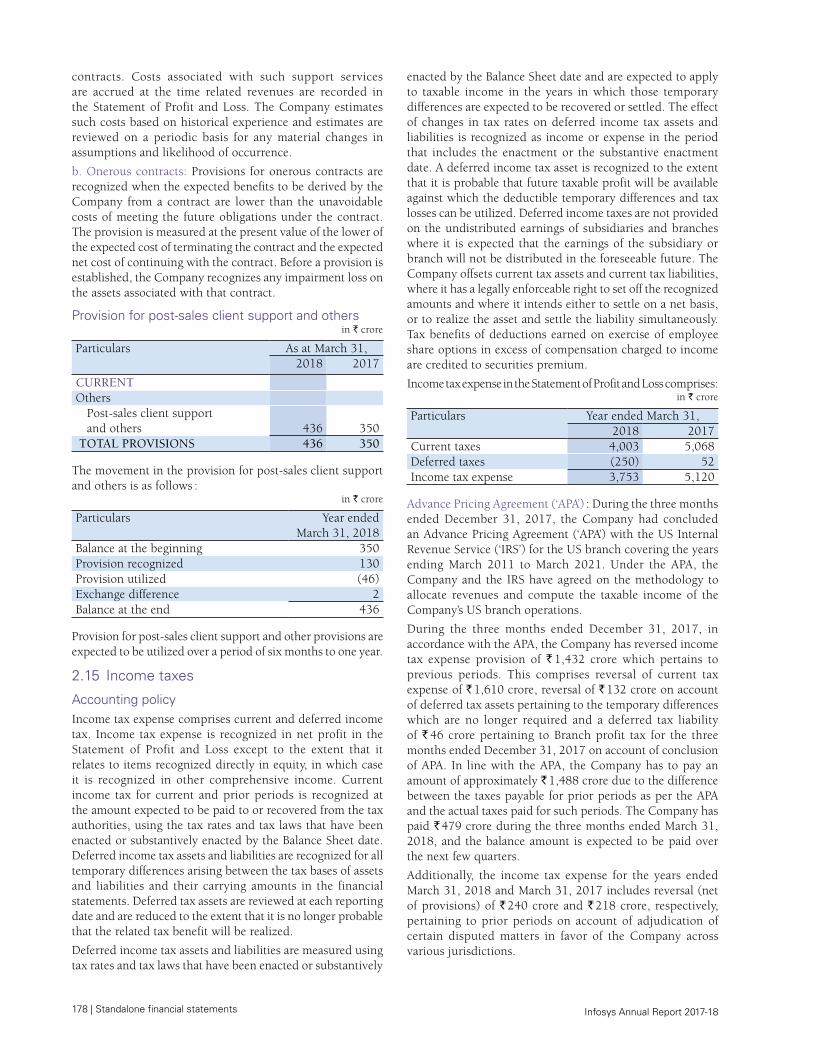
178 | Standalone financial statements Infosys Annual Report 2017-18
contracts. Costs associated with such support services are accrued at the time related revenues are recorded in the Statement of Profit and Loss. The Company estimates such costs based on historical experience and estimates are reviewed on a periodic basis for any material changes in assumptions and likelihood of occurrence.
b. Onerous contracts: Provisions for onerous contracts are recognized when the expected benefits to be derived by the Company from a contract are lower than the unavoidable costs of meeting the future obligations under the contract. The provision is measured at the present value of the lower of the expected cost of terminating the contract and the expected net cost of continuing with the contract. Before a provision is established, the Company recognizes any impairment loss on the assets associated with that contract.
Provision for post-sales client support and othersin ` crore
Particulars
As at March 31,2018 2017
CURRENTOthers
Post-sales client support and others 436 350
TOTAL PROVISIONS 436 350
The movement in the provision for post-sales client support and others is as follows :
in ` crore
Particulars Year ended March 31, 2018
Balance at the beginning 350 Provision recognized 130 Provision utilized (46)Exchange difference 2 Balance at the end 436
Provision for post-sales client support and other provisions are expected to be utilized over a period of six months to one year.
2.15 Income taxes
Accounting policyIncome tax expense comprises current and deferred income tax. Income tax expense is recognized in net profit in the Statement of Profit and Loss except to the extent that it relates to items recognized directly in equity, in which case it is recognized in other comprehensive income. Current income tax for current and prior periods is recognized at the amount expected to be paid to or recovered from the tax authorities, using the tax rates and tax laws that have been enacted or substantively enacted by the Balance Sheet date. Deferred income tax assets and liabilities are recognized for all temporary differences arising between the tax bases of assets and liabilities and their carrying amounts in the financial statements. Deferred tax assets are reviewed at each reporting date and are reduced to the extent that it is no longer probable that the related tax benefit will be realized.
Deferred income tax assets and liabilities are measured using tax rates and tax laws that have been enacted or substantively
enacted by the Balance Sheet date and are expected to apply to taxable income in the years in which those temporary differences are expected to be recovered or settled. The effect of changes in tax rates on deferred income tax assets and liabilities is recognized as income or expense in the period that includes the enactment or the substantive enactment date. A deferred income tax asset is recognized to the extent that it is probable that future taxable profit will be available against which the deductible temporary differences and tax losses can be utilized. Deferred income taxes are not provided on the undistributed earnings of subsidiaries and branches where it is expected that the earnings of the subsidiary or branch will not be distributed in the foreseeable future. The Company offsets current tax assets and current tax liabilities, where it has a legally enforceable right to set off the recognized amounts and where it intends either to settle on a net basis, or to realize the asset and settle the liability simultaneously. Tax benefits of deductions earned on exercise of employee share options in excess of compensation charged to income are credited to securities premium.
Income tax expense in the Statement of Profit and Loss comprises:in ` crore
Particulars Year ended March 31,2018 2017
Current taxes 4,003 5,068 Deferred taxes (250) 52 Income tax expense 3,753 5,120
Advance Pricing Agreement (‘APA’) : During the three months ended December 31, 2017, the Company had concluded an Advance Pricing Agreement (‘APA’) with the US Internal Revenue Service (‘IRS’) for the US branch covering the years ending March 2011 to March 2021. Under the APA, the Company and the IRS have agreed on the methodology to allocate revenues and compute the taxable income of the Company’s US branch operations.
During the three months ended December 31, 2017, in accordance with the APA, the Company has reversed income tax expense provision of ` 1,432 crore which pertains to previous periods. This comprises reversal of current tax expense of ` 1,610 crore, reversal of ` 132 crore on account of deferred tax assets pertaining to the temporary differences which are no longer required and a deferred tax liability of ` 46 crore pertaining to Branch profit tax for the three months ended December 31, 2017 on account of conclusion of APA. In line with the APA, the Company has to pay an amount of approximately ` 1,488 crore due to the difference between the taxes payable for prior periods as per the APA and the actual taxes paid for such periods. The Company has paid ` 479 crore during the three months ended March 31, 2018, and the balance amount is expected to be paid over the next few quarters.
Additionally, the income tax expense for the years ended March 31, 2018 and March 31, 2017 includes reversal (net of provisions) of ` 240 crore and ` 218 crore, respectively, pertaining to prior periods on account of adjudication of certain disputed matters in favor of the Company across various jurisdictions.
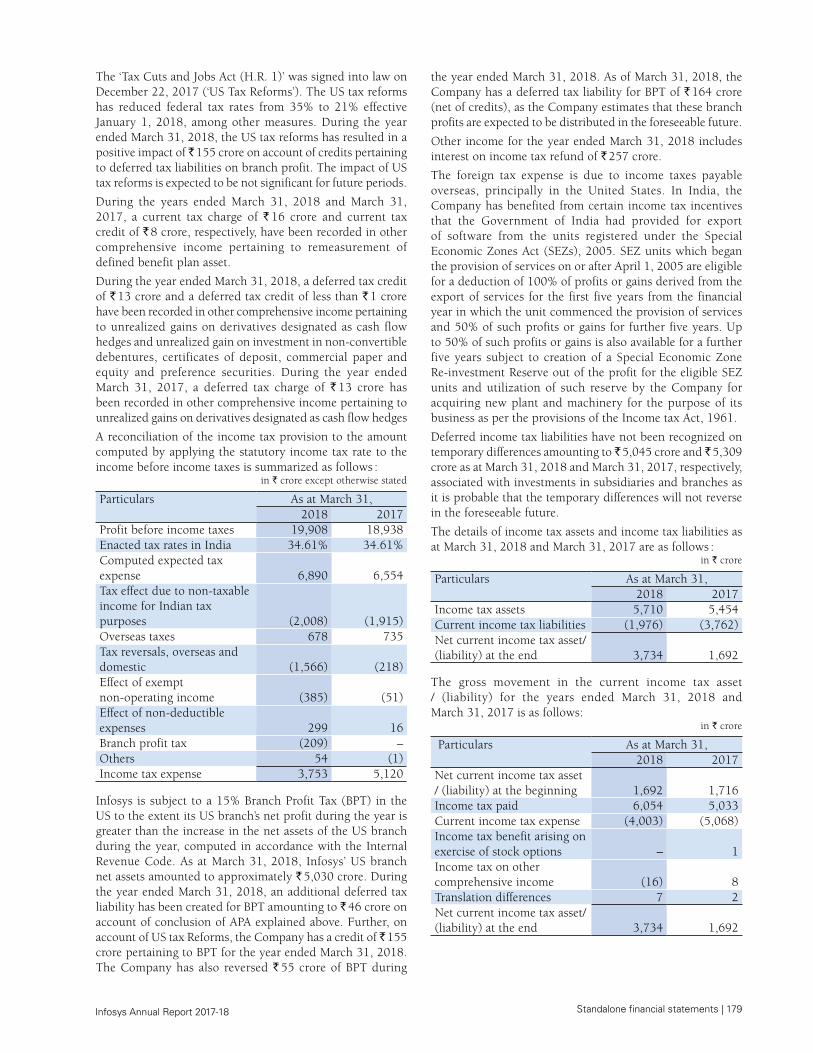
Standalone financial statements | 179 Infosys Annual Report 2017-18
The ‘Tax Cuts and Jobs Act (H.R. 1)’ was signed into law on December 22, 2017 (‘US Tax Reforms’). The US tax reforms has reduced federal tax rates from 35% to 21% effective January 1, 2018, among other measures. During the year ended March 31, 2018, the US tax reforms has resulted in a positive impact of ̀ 155 crore on account of credits pertaining to deferred tax liabilities on branch profit. The impact of US tax reforms is expected to be not significant for future periods.
During the years ended March 31, 2018 and March 31, 2017, a current tax charge of ` 16 crore and current tax credit of ` 8 crore, respectively, have been recorded in other comprehensive income pertaining to remeasurement of defined benefit plan asset.
During the year ended March 31, 2018, a deferred tax credit of ` 13 crore and a deferred tax credit of less than ` 1 crore have been recorded in other comprehensive income pertaining to unrealized gains on derivatives designated as cash flow hedges and unrealized gain on investment in non-convertible debentures, certificates of deposit, commercial paper and equity and preference securities. During the year ended March 31, 2017, a deferred tax charge of ` 13 crore has been recorded in other comprehensive income pertaining to unrealized gains on derivatives designated as cash flow hedges
A reconciliation of the income tax provision to the amount computed by applying the statutory income tax rate to the income before income taxes is summarized as follows :
in ` crore except otherwise stated
Particulars As at March 31,2018 2017
Profit before income taxes 19,908 18,938 Enacted tax rates in India 34.61% 34.61%Computed expected tax expense 6,890 6,554 Tax effect due to non-taxable income for Indian tax purposes (2,008) (1,915)Overseas taxes 678 735 Tax reversals, overseas and domestic (1,566) (218)Effect of exempt non-operating income (385) (51)Effect of non-deductible expenses 299 16 Branch profit tax (209) – Others 54 (1)Income tax expense 3,753 5,120
Infosys is subject to a 15% Branch Profit Tax (BPT) in the US to the extent its US branch’s net profit during the year is greater than the increase in the net assets of the US branch during the year, computed in accordance with the Internal Revenue Code. As at March 31, 2018, Infosys’ US branch net assets amounted to approximately ` 5,030 crore. During the year ended March 31, 2018, an additional deferred tax liability has been created for BPT amounting to ` 46 crore on account of conclusion of APA explained above. Further, on account of US tax Reforms, the Company has a credit of ̀ 155 crore pertaining to BPT for the year ended March 31, 2018. The Company has also reversed ` 55 crore of BPT during
the year ended March 31, 2018. As of March 31, 2018, the Company has a deferred tax liability for BPT of ` 164 crore (net of credits), as the Company estimates that these branch profits are expected to be distributed in the foreseeable future.
Other income for the year ended March 31, 2018 includes interest on income tax refund of ` 257 crore.
The foreign tax expense is due to income taxes payable overseas, principally in the United States. In India, the Company has benefited from certain income tax incentives that the Government of India had provided for export of software from the units registered under the Special Economic Zones Act (SEZs), 2005. SEZ units which began the provision of services on or after April 1, 2005 are eligible for a deduction of 100% of profits or gains derived from the export of services for the first five years from the financial year in which the unit commenced the provision of services and 50% of such profits or gains for further five years. Up to 50% of such profits or gains is also available for a further five years subject to creation of a Special Economic Zone Re-investment Reserve out of the profit for the eligible SEZ units and utilization of such reserve by the Company for acquiring new plant and machinery for the purpose of its business as per the provisions of the Income tax Act, 1961.
Deferred income tax liabilities have not been recognized on temporary differences amounting to ` 5,045 crore and ̀ 5,309 crore as at March 31, 2018 and March 31, 2017, respectively, associated with investments in subsidiaries and branches as it is probable that the temporary differences will not reverse in the foreseeable future.
The details of income tax assets and income tax liabilities as at March 31, 2018 and March 31, 2017 are as follows :
in ` crore
Particulars As at March 31,2018 2017
Income tax assets 5,710 5,454 Current income tax liabilities (1,976) (3,762) Net current income tax asset/ (liability) at the end 3,734 1,692
The gross movement in the current income tax asset / (liability) for the years ended March 31, 2018 and March 31, 2017 is as follows:
in ` crore
Particulars As at March 31,2018 2017
Net current income tax asset / (liability) at the beginning 1,692 1,716 Income tax paid 6,054 5,033 Current income tax expense (4,003) (5,068)Income tax benefit arising on exercise of stock options – 1 Income tax on other comprehensive income (16) 8 Translation differences 7 2 Net current income tax asset/ (liability) at the end 3,734 1,692
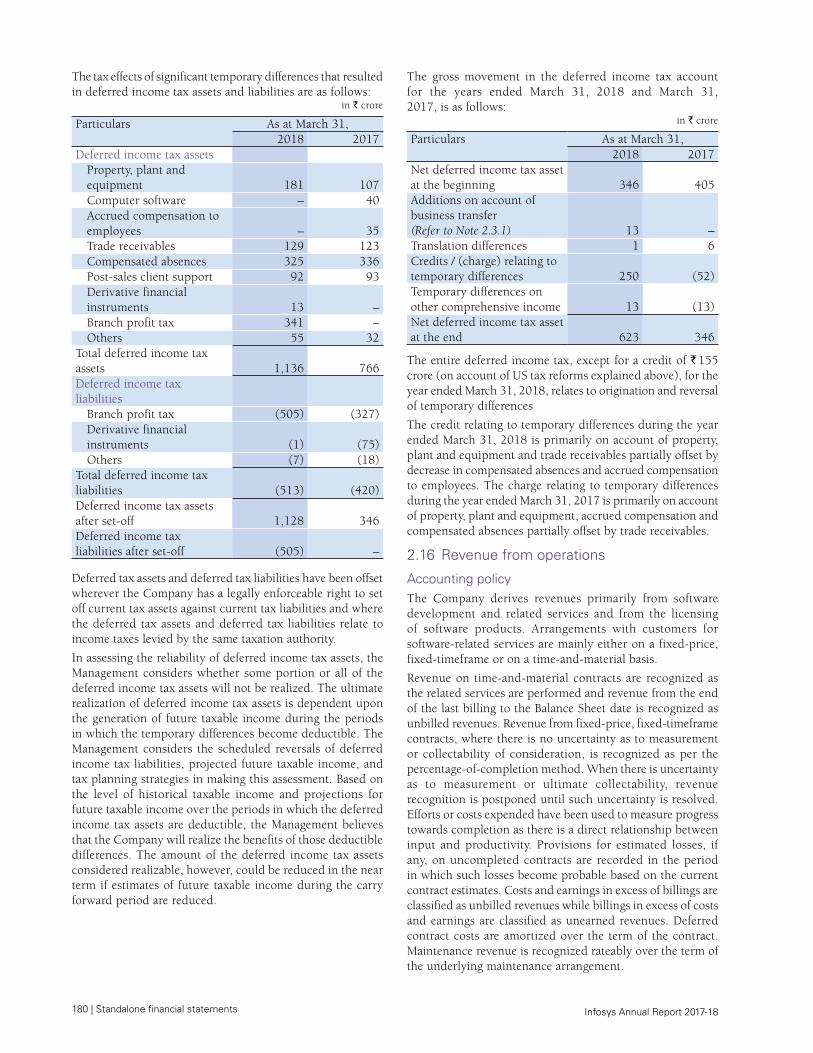
180 | Standalone financial statements Infosys Annual Report 2017-18
The tax effects of significant temporary differences that resulted in deferred income tax assets and liabilities are as follows:
in ` crore
Particulars As at March 31, 2018 2017
Deferred income tax assetsProperty, plant and equipment 181 107 Computer software – 40 Accrued compensation to employees – 35 Trade receivables 129 123 Compensated absences 325 336 Post-sales client support 92 93 Derivative financial instruments 13 – Branch profit tax 341 – Others 55 32
Total deferred income tax assets 1,136 766 Deferred income tax liabilities
Branch profit tax (505) (327) Derivative financial instruments (1) (75) Others (7) (18)
Total deferred income tax liabilities (513) (420) Deferred income tax assets after set-off 1,128 346 Deferred income tax liabilities after set-off (505) –
Deferred tax assets and deferred tax liabilities have been offset wherever the Company has a legally enforceable right to set off current tax assets against current tax liabilities and where the deferred tax assets and deferred tax liabilities relate to income taxes levied by the same taxation authority.
In assessing the reliability of deferred income tax assets, the Management considers whether some portion or all of the deferred income tax assets will not be realized. The ultimate realization of deferred income tax assets is dependent upon the generation of future taxable income during the periods in which the temporary differences become deductible. The Management considers the scheduled reversals of deferred income tax liabilities, projected future taxable income, and tax planning strategies in making this assessment. Based on the level of historical taxable income and projections for future taxable income over the periods in which the deferred income tax assets are deductible, the Management believes that the Company will realize the benefits of those deductible differences. The amount of the deferred income tax assets considered realizable, however, could be reduced in the near term if estimates of future taxable income during the carry forward period are reduced.
The gross movement in the deferred income tax account for the years ended March 31, 2018 and March 31, 2017, is as follows:
in ` crore
Particulars As at March 31,2018 2017
Net deferred income tax asset at the beginning 346 405Additions on account of business transfer (Refer to Note 2.3.1) 13 – Translation differences 1 6 Credits / (charge) relating to temporary differences 250 (52)Temporary differences on other comprehensive income 13 (13)Net deferred income tax asset at the end 623 346
The entire deferred income tax, except for a credit of ` 155 crore (on account of US tax reforms explained above), for the year ended March 31, 2018, relates to origination and reversal of temporary differences
The credit relating to temporary differences during the year ended March 31, 2018 is primarily on account of property, plant and equipment and trade receivables partially offset by decrease in compensated absences and accrued compensation to employees. The charge relating to temporary differences during the year ended March 31, 2017 is primarily on account of property, plant and equipment, accrued compensation and compensated absences partially offset by trade receivables.
2.16 Revenue from operations
Accounting policyThe Company derives revenues primarily from software development and related services and from the licensing of software products. Arrangements with customers for software-related services are mainly either on a fixed-price, fixed-timeframe or on a time-and-material basis.
Revenue on time-and-material contracts are recognized as the related services are performed and revenue from the end of the last billing to the Balance Sheet date is recognized as unbilled revenues. Revenue from fixed-price, fixed-timeframe contracts, where there is no uncertainty as to measurement or collectability of consideration, is recognized as per the percentage-of-completion method. When there is uncertainty as to measurement or ultimate collectability, revenue recognition is postponed until such uncertainty is resolved. Efforts or costs expended have been used to measure progress towards completion as there is a direct relationship between input and productivity. Provisions for estimated losses, if any, on uncompleted contracts are recorded in the period in which such losses become probable based on the current contract estimates. Costs and earnings in excess of billings are classified as unbilled revenues while billings in excess of costs and earnings are classified as unearned revenues. Deferred contract costs are amortized over the term of the contract. Maintenance revenue is recognized rateably over the term of the underlying maintenance arrangement.
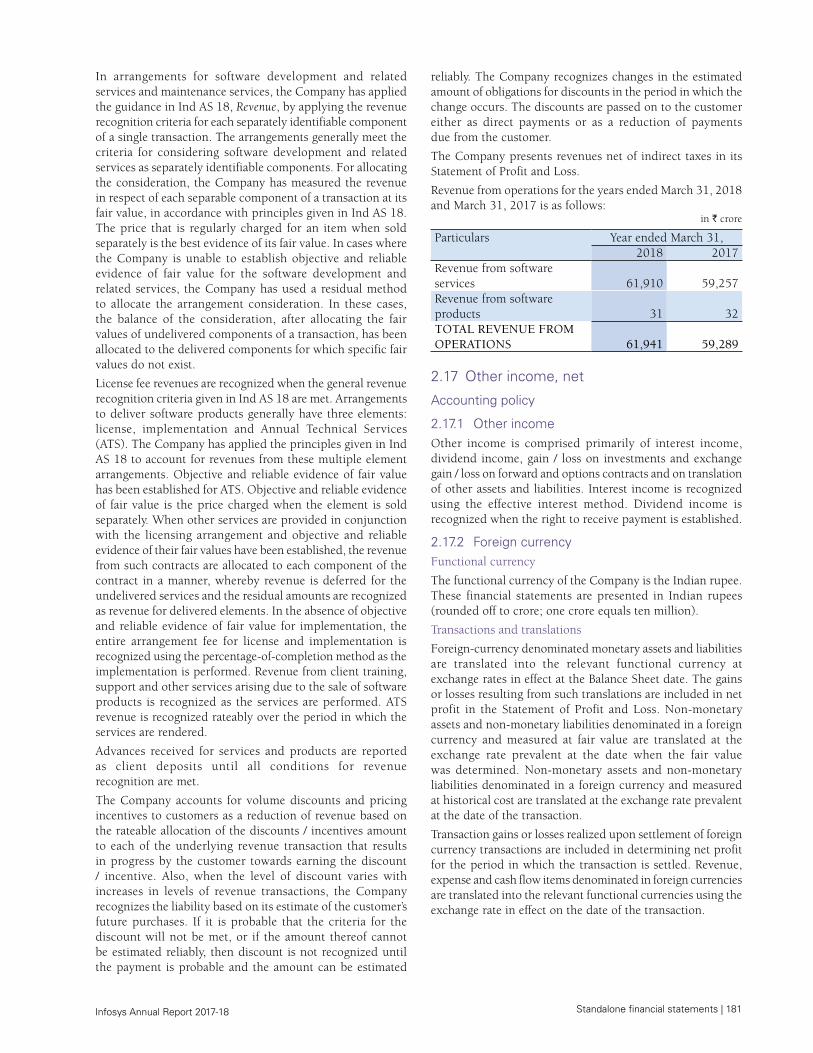
Standalone financial statements | 181 Infosys Annual Report 2017-18
In arrangements for software development and related services and maintenance services, the Company has applied the guidance in Ind AS 18, Revenue, by applying the revenue recognition criteria for each separately identifiable component of a single transaction. The arrangements generally meet the criteria for considering software development and related services as separately identifiable components. For allocating the consideration, the Company has measured the revenue in respect of each separable component of a transaction at its fair value, in accordance with principles given in Ind AS 18. The price that is regularly charged for an item when sold separately is the best evidence of its fair value. In cases where the Company is unable to establish objective and reliable evidence of fair value for the software development and related services, the Company has used a residual method to allocate the arrangement consideration. In these cases, the balance of the consideration, after allocating the fair values of undelivered components of a transaction, has been allocated to the delivered components for which specific fair values do not exist.
License fee revenues are recognized when the general revenue recognition criteria given in Ind AS 18 are met. Arrangements to deliver software products generally have three elements: license, implementation and Annual Technical Services (ATS). The Company has applied the principles given in Ind AS 18 to account for revenues from these multiple element arrangements. Objective and reliable evidence of fair value has been established for ATS. Objective and reliable evidence of fair value is the price charged when the element is sold separately. When other services are provided in conjunction with the licensing arrangement and objective and reliable evidence of their fair values have been established, the revenue from such contracts are allocated to each component of the contract in a manner, whereby revenue is deferred for the undelivered services and the residual amounts are recognized as revenue for delivered elements. In the absence of objective and reliable evidence of fair value for implementation, the entire arrangement fee for license and implementation is recognized using the percentage-of-completion method as the implementation is performed. Revenue from client training, support and other services arising due to the sale of software products is recognized as the services are performed. ATS revenue is recognized rateably over the period in which the services are rendered.
Advances received for services and products are reported as client deposits until all conditions for revenue recognition are met.
The Company accounts for volume discounts and pricing incentives to customers as a reduction of revenue based on the rateable allocation of the discounts / incentives amount to each of the underlying revenue transaction that results in progress by the customer towards earning the discount / incentive. Also, when the level of discount varies with increases in levels of revenue transactions, the Company recognizes the liability based on its estimate of the customer’s future purchases. If it is probable that the criteria for the discount will not be met, or if the amount thereof cannot be estimated reliably, then discount is not recognized until the payment is probable and the amount can be estimated
reliably. The Company recognizes changes in the estimated amount of obligations for discounts in the period in which the change occurs. The discounts are passed on to the customer either as direct payments or as a reduction of payments due from the customer.
The Company presents revenues net of indirect taxes in its Statement of Profit and Loss.
Revenue from operations for the years ended March 31, 2018 and March 31, 2017 is as follows:
in ` crore
Particulars Year ended March 31,2018 2017
Revenue from software services 61,910 59,257 Revenue from software products 31 32 TOTAL REVENUE FROM OPERATIONS 61,941 59,289
2.17 Other income, net
Accounting policy
2.17.1 Other incomeOther income is comprised primarily of interest income, dividend income, gain / loss on investments and exchange gain / loss on forward and options contracts and on translation of other assets and liabilities. Interest income is recognized using the effective interest method. Dividend income is recognized when the right to receive payment is established.
2.17.2 Foreign currency Functional currency
The functional currency of the Company is the Indian rupee. These financial statements are presented in Indian rupees (rounded off to crore; one crore equals ten million).
Transactions and translations
Foreign-currency denominated monetary assets and liabilities are translated into the relevant functional currency at exchange rates in effect at the Balance Sheet date. The gains or losses resulting from such translations are included in net profit in the Statement of Profit and Loss. Non-monetary assets and non-monetary liabilities denominated in a foreign currency and measured at fair value are translated at the exchange rate prevalent at the date when the fair value was determined. Non-monetary assets and non-monetary liabilities denominated in a foreign currency and measured at historical cost are translated at the exchange rate prevalent at the date of the transaction.
Transaction gains or losses realized upon settlement of foreign currency transactions are included in determining net profit for the period in which the transaction is settled. Revenue, expense and cash flow items denominated in foreign currencies are translated into the relevant functional currencies using the exchange rate in effect on the date of the transaction.
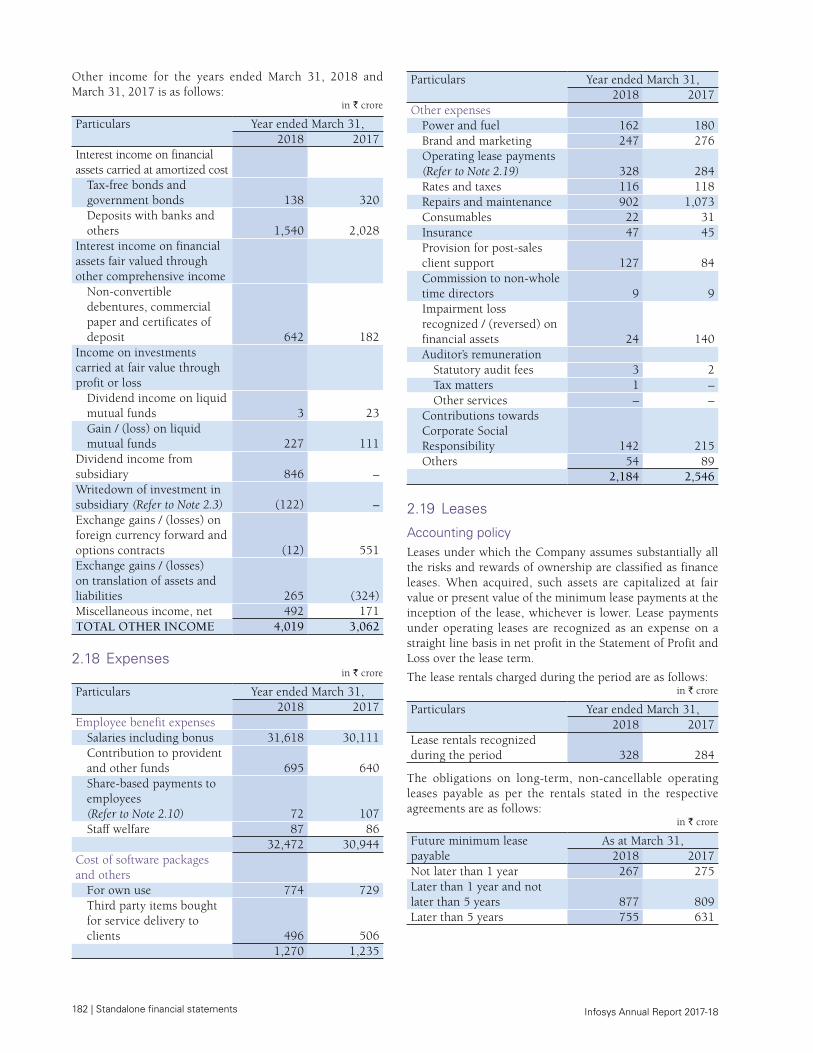
182 | Standalone financial statements Infosys Annual Report 2017-18
Other income for the years ended March 31, 2018 and March 31, 2017 is as follows:
in ` crore
Particulars Year ended March 31,2018 2017
Interest income on financial assets carried at amortized cost
Tax-free bonds and government bonds 138 320 Deposits with banks and others 1,540 2,028
Interest income on financial assets fair valued through other comprehensive income
Non-convertible debentures, commercial paper and certificates of deposit 642 182
Income on investments carried at fair value through profit or loss
Dividend income on liquid mutual funds 3 23 Gain / (loss) on liquid mutual funds 227 111
Dividend income from subsidiary 846 – Writedown of investment in subsidiary (Refer to Note 2.3) (122) – Exchange gains / (losses) on foreign currency forward and options contracts (12) 551 Exchange gains / (losses) on translation of assets and liabilities 265 (324)Miscellaneous income, net 492 171 TOTAL OTHER INCOME 4,019 3,062
2.18 Expenses in ` crore
Particulars Year ended March 31,2018 2017
Employee benefit expensesSalaries including bonus 31,618 30,111 Contribution to provident and other funds 695 640 Share-based payments to employees (Refer to Note 2.10) 72 107 Staff welfare 87 86
32,472 30,944 Cost of software packages and others
For own use 774 729 Third party items bought for service delivery to clients 496 506
1,270 1,235
Particulars Year ended March 31,2018 2017
Other expensesPower and fuel 162 180 Brand and marketing 247 276 Operating lease payments (Refer to Note 2.19) 328 284 Rates and taxes 116 118 Repairs and maintenance 902 1,073 Consumables 22 31 Insurance 47 45 Provision for post-sales client support 127 84 Commission to non-whole time directors 9 9 Impairment loss recognized / (reversed) on financial assets 24 140 Auditor’s remuneration
Statutory audit fees 3 2 Tax matters 1 – Other services – –
Contributions towards Corporate Social Responsibility 142 215 Others 54 89
2,184 2,546
2.19 Leases
Accounting policyLeases under which the Company assumes substantially all the risks and rewards of ownership are classified as finance leases. When acquired, such assets are capitalized at fair value or present value of the minimum lease payments at the inception of the lease, whichever is lower. Lease payments under operating leases are recognized as an expense on a straight line basis in net profit in the Statement of Profit and Loss over the lease term.
The lease rentals charged during the period are as follows:in ` crore
Particulars Year ended March 31,2018 2017
Lease rentals recognized during the period 328 284
The obligations on long-term, non-cancellable operating leases payable as per the rentals stated in the respective agreements are as follows:
in ` crore
Future minimum lease payable
As at March 31,2018 2017
Not later than 1 year 267 275 Later than 1 year and not later than 5 years 877 809 Later than 5 years 755 631
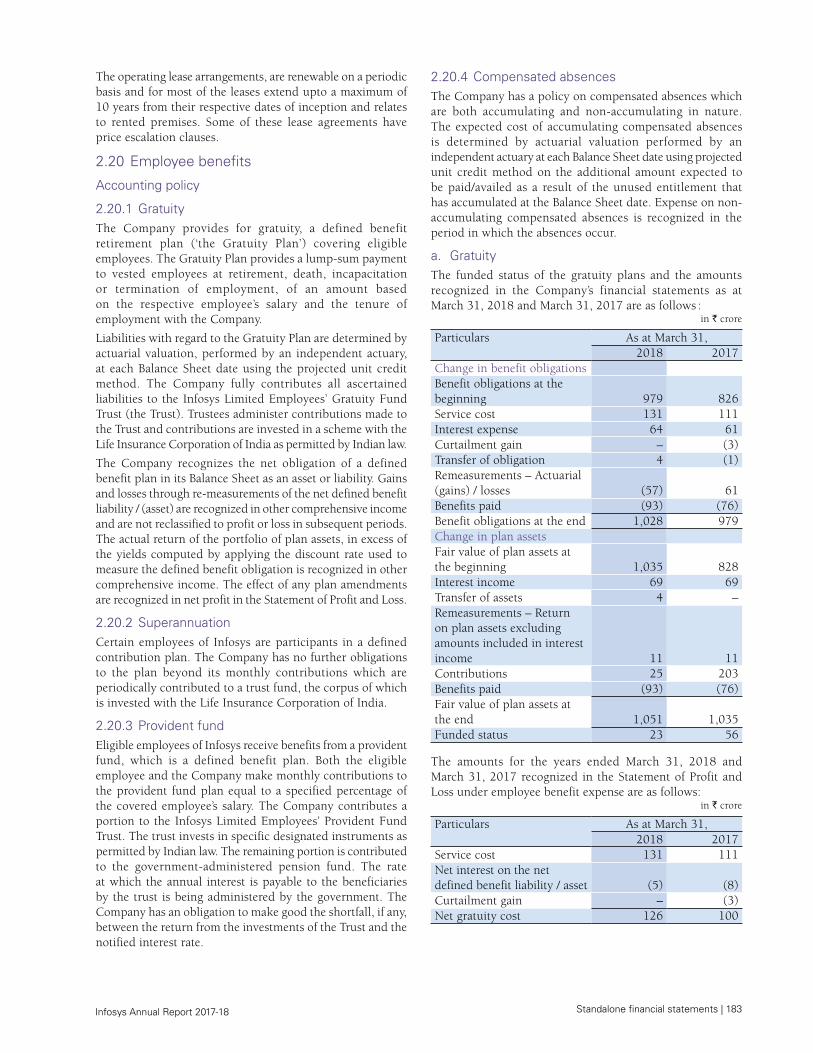
Standalone financial statements | 183 Infosys Annual Report 2017-18
The operating lease arrangements, are renewable on a periodic basis and for most of the leases extend upto a maximum of 10 years from their respective dates of inception and relates to rented premises. Some of these lease agreements have price escalation clauses.
2.20 Employee benefits
Accounting policy
2.20.1 Gratuity The Company provides for gratuity, a defined benefit retirement plan (‘the Gratuity Plan’) covering eligible employees. The Gratuity Plan provides a lump-sum payment to vested employees at retirement, death, incapacitation or termination of employment, of an amount based on the respective employee’s salary and the tenure of employment with the Company.
Liabilities with regard to the Gratuity Plan are determined by actuarial valuation, performed by an independent actuary, at each Balance Sheet date using the projected unit credit method. The Company fully contributes all ascertained liabilities to the Infosys Limited Employees’ Gratuity Fund Trust (the Trust). Trustees administer contributions made to the Trust and contributions are invested in a scheme with the Life Insurance Corporation of India as permitted by Indian law.
The Company recognizes the net obligation of a defined benefit plan in its Balance Sheet as an asset or liability. Gains and losses through re-measurements of the net defined benefit liability / (asset) are recognized in other comprehensive income and are not reclassified to profit or loss in subsequent periods. The actual return of the portfolio of plan assets, in excess of the yields computed by applying the discount rate used to measure the defined benefit obligation is recognized in other comprehensive income. The effect of any plan amendments are recognized in net profit in the Statement of Profit and Loss.
2.20.2 SuperannuationCertain employees of Infosys are participants in a defined contribution plan. The Company has no further obligations to the plan beyond its monthly contributions which are periodically contributed to a trust fund, the corpus of which is invested with the Life Insurance Corporation of India.
2.20.3 Provident fundEligible employees of Infosys receive benefits from a provident fund, which is a defined benefit plan. Both the eligible employee and the Company make monthly contributions to the provident fund plan equal to a specified percentage of the covered employee’s salary. The Company contributes a portion to the Infosys Limited Employees’ Provident Fund Trust. The trust invests in specific designated instruments as permitted by Indian law. The remaining portion is contributed to the government-administered pension fund. The rate at which the annual interest is payable to the beneficiaries by the trust is being administered by the government. The Company has an obligation to make good the shortfall, if any, between the return from the investments of the Trust and the notified interest rate.
2.20.4 Compensated absences The Company has a policy on compensated absences which are both accumulating and non-accumulating in nature. The expected cost of accumulating compensated absences is determined by actuarial valuation performed by an independent actuary at each Balance Sheet date using projected unit credit method on the additional amount expected to be paid/availed as a result of the unused entitlement that has accumulated at the Balance Sheet date. Expense on non-accumulating compensated absences is recognized in the period in which the absences occur.
a. GratuityThe funded status of the gratuity plans and the amounts recognized in the Company’s financial statements as at March 31, 2018 and March 31, 2017 are as follows :
in ` crore
Particulars As at March 31,2018 2017
Change in benefit obligations Benefit obligations at the beginning 979 826 Service cost 131 111 Interest expense 64 61 Curtailment gain – (3)Transfer of obligation 4 (1)Remeasurements – Actuarial (gains) / losses (57) 61 Benefits paid (93) (76)Benefit obligations at the end 1,028 979 Change in plan assets Fair value of plan assets at the beginning 1,035 828 Interest income 69 69 Transfer of assets 4 – Remeasurements – Return on plan assets excluding amounts included in interest income 11 11 Contributions 25 203 Benefits paid (93) (76)Fair value of plan assets at the end 1,051 1,035 Funded status 23 56
The amounts for the years ended March 31, 2018 and March 31, 2017 recognized in the Statement of Profit and Loss under employee benefit expense are as follows:
in ` crore
Particulars As at March 31,2018 2017
Service cost 131 111 Net interest on the net defined benefit liability / asset (5) (8)Curtailment gain – (3)Net gratuity cost 126 100
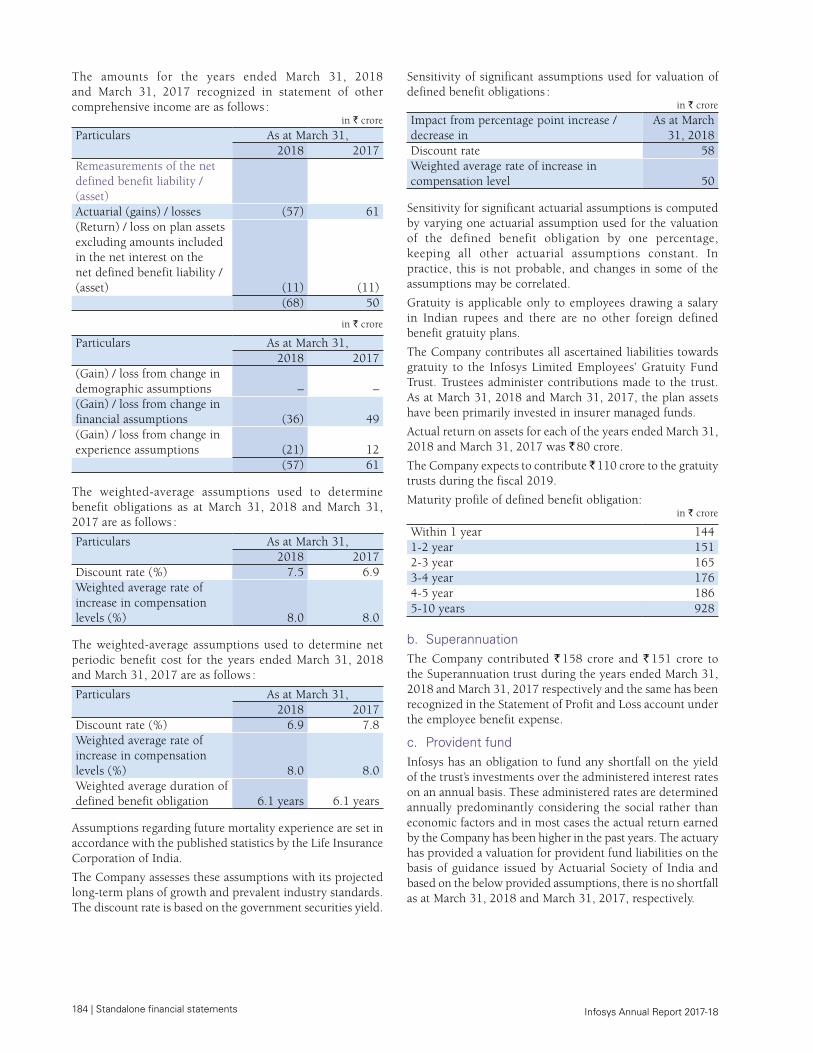
184 | Standalone financial statements Infosys Annual Report 2017-18
The amounts for the years ended March 31, 2018 and March 31, 2017 recognized in statement of other comprehensive income are as follows :
in ` crore
Particulars As at March 31,2018 2017
Remeasurements of the net defined benefit liability / (asset) Actuarial (gains) / losses (57) 61 (Return) / loss on plan assets excluding amounts included in the net interest on the net defined benefit liability /(asset) (11) (11) (68) 50
in ` crore
Particulars As at March 31,2018 2017
(Gain) / loss from change in demographic assumptions – – (Gain) / loss from change in financial assumptions (36) 49 (Gain) / loss from change in experience assumptions (21) 12 (57) 61
The weighted-average assumptions used to determine benefit obligations as at March 31, 2018 and March 31, 2017 are as follows :
Particulars As at March 31,2018 2017
Discount rate (%) 7.5 6.9Weighted average rate of increase in compensation levels (%) 8.0 8.0
The weighted-average assumptions used to determine net periodic benefit cost for the years ended March 31, 2018 and March 31, 2017 are as follows :
Particulars As at March 31,2018 2017
Discount rate (%) 6.9 7.8Weighted average rate of increase in compensation levels (%) 8.0 8.0Weighted average duration of defined benefit obligation 6.1 years 6.1 years
Assumptions regarding future mortality experience are set in accordance with the published statistics by the Life Insurance Corporation of India.
The Company assesses these assumptions with its projected long-term plans of growth and prevalent industry standards. The discount rate is based on the government securities yield.
Sensitivity of significant assumptions used for valuation of defined benefit obligations :
in ` crore
Impact from percentage point increase / decrease in
As at March 31, 2018
Discount rate 58Weighted average rate of increase in compensation level 50
Sensitivity for significant actuarial assumptions is computed by varying one actuarial assumption used for the valuation of the defined benefit obligation by one percentage, keeping all other actuarial assumptions constant. In practice, this is not probable, and changes in some of the assumptions may be correlated.
Gratuity is applicable only to employees drawing a salary in Indian rupees and there are no other foreign defined benefit gratuity plans.
The Company contributes all ascertained liabilities towards gratuity to the Infosys Limited Employees’ Gratuity Fund Trust. Trustees administer contributions made to the trust. As at March 31, 2018 and March 31, 2017, the plan assets have been primarily invested in insurer managed funds.
Actual return on assets for each of the years ended March 31, 2018 and March 31, 2017 was ` 80 crore.
The Company expects to contribute ̀ 110 crore to the gratuity trusts during the fiscal 2019.
Maturity profile of defined benefit obligation: in ` crore
Within 1 year 144 1-2 year 151 2-3 year 165 3-4 year 176 4-5 year 186 5-10 years 928
b. SuperannuationThe Company contributed ` 158 crore and ` 151 crore to the Superannuation trust during the years ended March 31, 2018 and March 31, 2017 respectively and the same has been recognized in the Statement of Profit and Loss account under the employee benefit expense.
c. Provident fund Infosys has an obligation to fund any shortfall on the yield of the trust’s investments over the administered interest rates on an annual basis. These administered rates are determined annually predominantly considering the social rather than economic factors and in most cases the actual return earned by the Company has been higher in the past years. The actuary has provided a valuation for provident fund liabilities on the basis of guidance issued by Actuarial Society of India and based on the below provided assumptions, there is no shortfall as at March 31, 2018 and March 31, 2017, respectively.
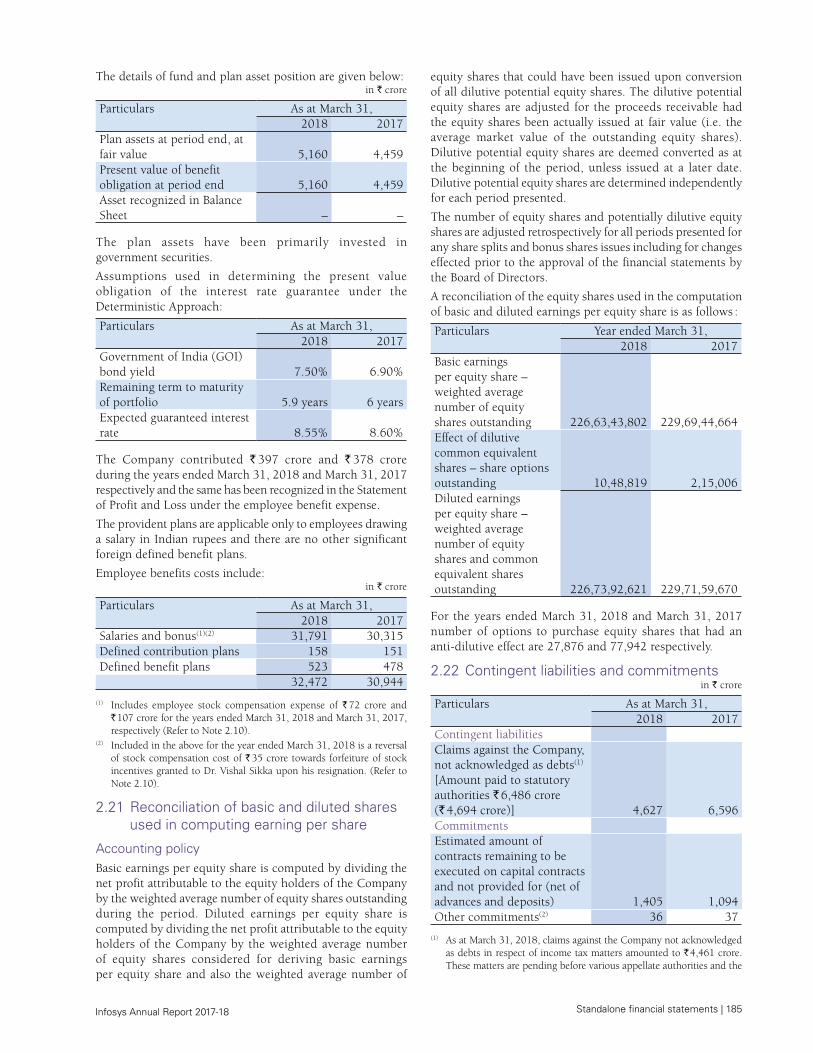
Standalone financial statements | 185 Infosys Annual Report 2017-18
The details of fund and plan asset position are given below:in ` crore
Particulars As at March 31,2018 2017
Plan assets at period end, at fair value 5,160 4,459 Present value of benefit obligation at period end 5,160 4,459 Asset recognized in Balance Sheet – –
The plan assets have been primarily invested in government securities.
Assumptions used in determining the present value obligation of the interest rate guarantee under the Deterministic Approach:
Particulars As at March 31,2018 2017
Government of India (GOI) bond yield 7.50% 6.90%Remaining term to maturity of portfolio 5.9 years 6 yearsExpected guaranteed interest rate 8.55% 8.60%
The Company contributed ` 397 crore and ` 378 crore during the years ended March 31, 2018 and March 31, 2017 respectively and the same has been recognized in the Statement of Profit and Loss under the employee benefit expense.
The provident plans are applicable only to employees drawing a salary in Indian rupees and there are no other significant foreign defined benefit plans.
Employee benefits costs include:in ` crore
Particulars As at March 31,2018 2017
Salaries and bonus(1)(2) 31,791 30,315 Defined contribution plans 158 151 Defined benefit plans 523 478 32,472 30,944
(1) Includes employee stock compensation expense of ` 72 crore and ` 107 crore for the years ended March 31, 2018 and March 31, 2017, respectively (Refer to Note 2.10).
(2) Included in the above for the year ended March 31, 2018 is a reversal of stock compensation cost of ` 35 crore towards forfeiture of stock incentives granted to Dr. Vishal Sikka upon his resignation. (Refer to Note 2.10).
2.21 Reconciliation of basic and diluted shares used in computing earning per share
Accounting policyBasic earnings per equity share is computed by dividing the net profit attributable to the equity holders of the Company by the weighted average number of equity shares outstanding during the period. Diluted earnings per equity share is computed by dividing the net profit attributable to the equity holders of the Company by the weighted average number of equity shares considered for deriving basic earnings per equity share and also the weighted average number of
equity shares that could have been issued upon conversion of all dilutive potential equity shares. The dilutive potential equity shares are adjusted for the proceeds receivable had the equity shares been actually issued at fair value (i.e. the average market value of the outstanding equity shares). Dilutive potential equity shares are deemed converted as at the beginning of the period, unless issued at a later date. Dilutive potential equity shares are determined independently for each period presented.
The number of equity shares and potentially dilutive equity shares are adjusted retrospectively for all periods presented for any share splits and bonus shares issues including for changes effected prior to the approval of the financial statements by the Board of Directors.
A reconciliation of the equity shares used in the computation of basic and diluted earnings per equity share is as follows :
Particulars Year ended March 31,2018 2017
Basic earnings per equity share – weighted average number of equity shares outstanding 226,63,43,802 229,69,44,664Effect of dilutive common equivalent shares – share options outstanding 10,48,819 2,15,006Diluted earnings per equity share – weighted average number of equity shares and common equivalent shares outstanding 226,73,92,621 229,71,59,670
For the years ended March 31, 2018 and March 31, 2017 number of options to purchase equity shares that had an anti-dilutive effect are 27,876 and 77,942 respectively.
2.22 Contingent liabilities and commitmentsin ` crore
Particulars As at March 31,2018 2017
Contingent liabilities Claims against the Company, not acknowledged as debts(1) [Amount paid to statutory authorities ` 6,486 crore (` 4,694 crore)] 4,627 6,596 Commitments Estimated amount of contracts remaining to be executed on capital contracts and not provided for (net of advances and deposits) 1,405 1,094 Other commitments(2) 36 37
(1) As at March 31, 2018, claims against the Company not acknowledged as debts in respect of income tax matters amounted to ` 4,461 crore. These matters are pending before various appellate authorities and the
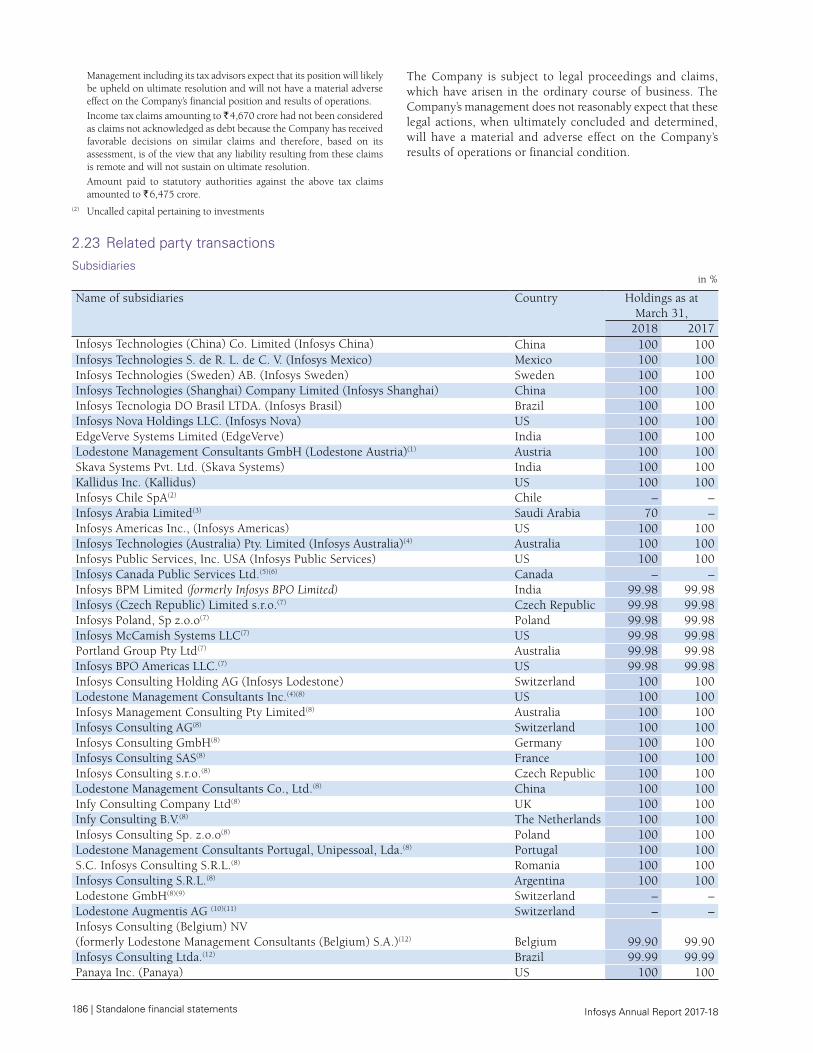
186 | Standalone financial statements Infosys Annual Report 2017-18
Management including its tax advisors expect that its position will likely be upheld on ultimate resolution and will not have a material adverse effect on the Company’s financial position and results of operations.
Income tax claims amounting to ̀ 4,670 crore had not been considered as claims not acknowledged as debt because the Company has received favorable decisions on similar claims and therefore, based on its assessment, is of the view that any liability resulting from these claims is remote and will not sustain on ultimate resolution.
Amount paid to statutory authorities against the above tax claims amounted to ` 6,475 crore.
(2) Uncalled capital pertaining to investments
The Company is subject to legal proceedings and claims, which have arisen in the ordinary course of business. The Company’s management does not reasonably expect that these legal actions, when ultimately concluded and determined, will have a material and adverse effect on the Company’s results of operations or financial condition.
2.23 Related party transactionsSubsidiaries
in %
Name of subsidiaries Country
Holdings as at March 31,
2018 2017Infosys Technologies (China) Co. Limited (Infosys China) China 100 100Infosys Technologies S. de R. L. de C. V. (Infosys Mexico) Mexico 100 100Infosys Technologies (Sweden) AB. (Infosys Sweden) Sweden 100 100Infosys Technologies (Shanghai) Company Limited (Infosys Shanghai) China 100 100Infosys Tecnologia DO Brasil LTDA. (Infosys Brasil) Brazil 100 100Infosys Nova Holdings LLC. (Infosys Nova) US 100 100EdgeVerve Systems Limited (EdgeVerve) India 100 100Lodestone Management Consultants GmbH (Lodestone Austria)(1) Austria 100 100Skava Systems Pvt. Ltd. (Skava Systems) India 100 100Kallidus Inc. (Kallidus) US 100 100Infosys Chile SpA(2) Chile – – Infosys Arabia Limited(3) Saudi Arabia 70 – Infosys Americas Inc., (Infosys Americas) US 100 100Infosys Technologies (Australia) Pty. Limited (Infosys Australia)(4) Australia 100 100Infosys Public Services, Inc. USA (Infosys Public Services) US 100 100Infosys Canada Public Services Ltd.(5)(6) Canada – – Infosys BPM Limited (formerly Infosys BPO Limited) India 99.98 99.98Infosys (Czech Republic) Limited s.r.o.(7) Czech Republic 99.98 99.98Infosys Poland, Sp z.o.o(7) Poland 99.98 99.98Infosys McCamish Systems LLC(7) US 99.98 99.98Portland Group Pty Ltd(7) Australia 99.98 99.98Infosys BPO Americas LLC.(7) US 99.98 99.98Infosys Consulting Holding AG (Infosys Lodestone) Switzerland 100 100Lodestone Management Consultants Inc.(4)(8) US 100 100Infosys Management Consulting Pty Limited(8) Australia 100 100Infosys Consulting AG(8) Switzerland 100 100Infosys Consulting GmbH(8) Germany 100 100Infosys Consulting SAS(8) France 100 100Infosys Consulting s.r.o.(8) Czech Republic 100 100Lodestone Management Consultants Co., Ltd.(8) China 100 100Infy Consulting Company Ltd(8) UK 100 100Infy Consulting B.V.(8) The Netherlands 100 100Infosys Consulting Sp. z.o.o(8) Poland 100 100Lodestone Management Consultants Portugal, Unipessoal, Lda.(8) Portugal 100 100S.C. Infosys Consulting S.R.L.(8) Romania 100 100Infosys Consulting S.R.L.(8) Argentina 100 100Lodestone GmbH(8)(9) Switzerland – – Lodestone Augmentis AG (10)(11) Switzerland – – Infosys Consulting (Belgium) NV (formerly Lodestone Management Consultants (Belgium) S.A.)(12) Belgium 99.90 99.90Infosys Consulting Ltda.(12) Brazil 99.99 99.99Panaya Inc. (Panaya) US 100 100
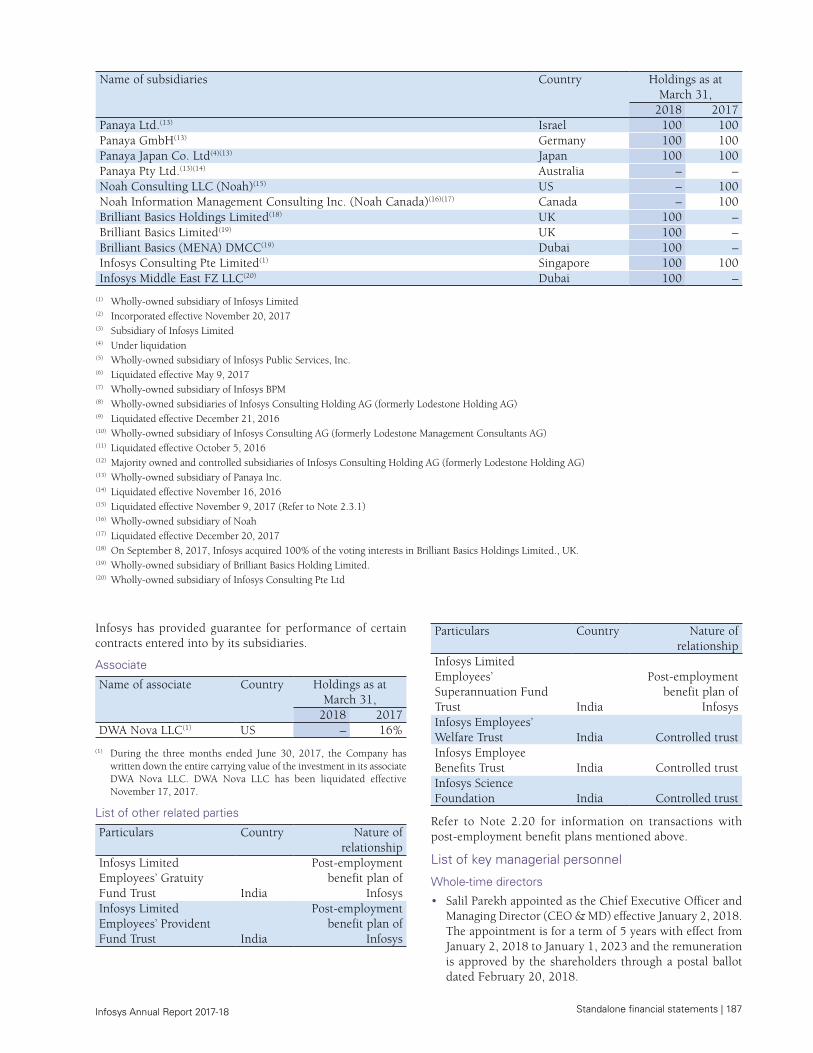
Standalone financial statements | 187 Infosys Annual Report 2017-18
Name of subsidiaries Country
Holdings as at March 31,
2018 2017Panaya Ltd.(13) Israel 100 100Panaya GmbH(13) Germany 100 100Panaya Japan Co. Ltd(4)(13) Japan 100 100Panaya Pty Ltd.(13)(14) Australia – – Noah Consulting LLC (Noah)(15) US – 100Noah Information Management Consulting Inc. (Noah Canada)(16)(17) Canada – 100Brilliant Basics Holdings Limited(18) UK 100 – Brilliant Basics Limited(19) UK 100 – Brilliant Basics (MENA) DMCC(19) Dubai 100 – Infosys Consulting Pte Limited(1) Singapore 100 100Infosys Middle East FZ LLC(20) Dubai 100 –
(1) Wholly-owned subsidiary of Infosys Limited(2) Incorporated effective November 20, 2017(3) Subsidiary of Infosys Limited(4) Under liquidation(5) Wholly-owned subsidiary of Infosys Public Services, Inc. (6) Liquidated effective May 9, 2017(7) Wholly-owned subsidiary of Infosys BPM(8) Wholly-owned subsidiaries of Infosys Consulting Holding AG (formerly Lodestone Holding AG)(9) Liquidated effective December 21, 2016(10) Wholly-owned subsidiary of Infosys Consulting AG (formerly Lodestone Management Consultants AG)(11) Liquidated effective October 5, 2016(12) Majority owned and controlled subsidiaries of Infosys Consulting Holding AG (formerly Lodestone Holding AG)(13) Wholly-owned subsidiary of Panaya Inc.(14) Liquidated effective November 16, 2016(15) Liquidated effective November 9, 2017 (Refer to Note 2.3.1)(16) Wholly-owned subsidiary of Noah(17) Liquidated effective December 20, 2017(18) On September 8, 2017, Infosys acquired 100% of the voting interests in Brilliant Basics Holdings Limited., UK. (19) Wholly-owned subsidiary of Brilliant Basics Holding Limited.(20) Wholly-owned subsidiary of Infosys Consulting Pte Ltd
Infosys has provided guarantee for performance of certain contracts entered into by its subsidiaries.
Associate
Name of associate Country Holdings as at March 31,
2018 2017DWA Nova LLC(1) US – 16%
(1) During the three months ended June 30, 2017, the Company has written down the entire carrying value of the investment in its associate DWA Nova LLC. DWA Nova LLC has been liquidated effective November 17, 2017.
List of other related parties
Particulars Country Nature of relationship
Infosys Limited Employees’ Gratuity Fund Trust India
Post-employment benefit plan of
InfosysInfosys Limited Employees’ Provident Fund Trust India
Post-employment benefit plan of
Infosys
Particulars Country Nature of relationship
Infosys Limited Employees’ Superannuation Fund Trust India
Post-employment benefit plan of
InfosysInfosys Employees’ Welfare Trust India Controlled trustInfosys Employee Benefits Trust India Controlled trustInfosys Science Foundation India Controlled trust
Refer to Note 2.20 for information on transactions with post-employment benefit plans mentioned above.
List of key managerial personnel
Whole-time directors
• Salil Parekh appointed as the Chief Executive Officer and Managing Director (CEO & MD) effective January 2, 2018. The appointment is for a term of 5 years with effect from January 2, 2018 to January 1, 2023 and the remuneration is approved by the shareholders through a postal ballot dated February 20, 2018.
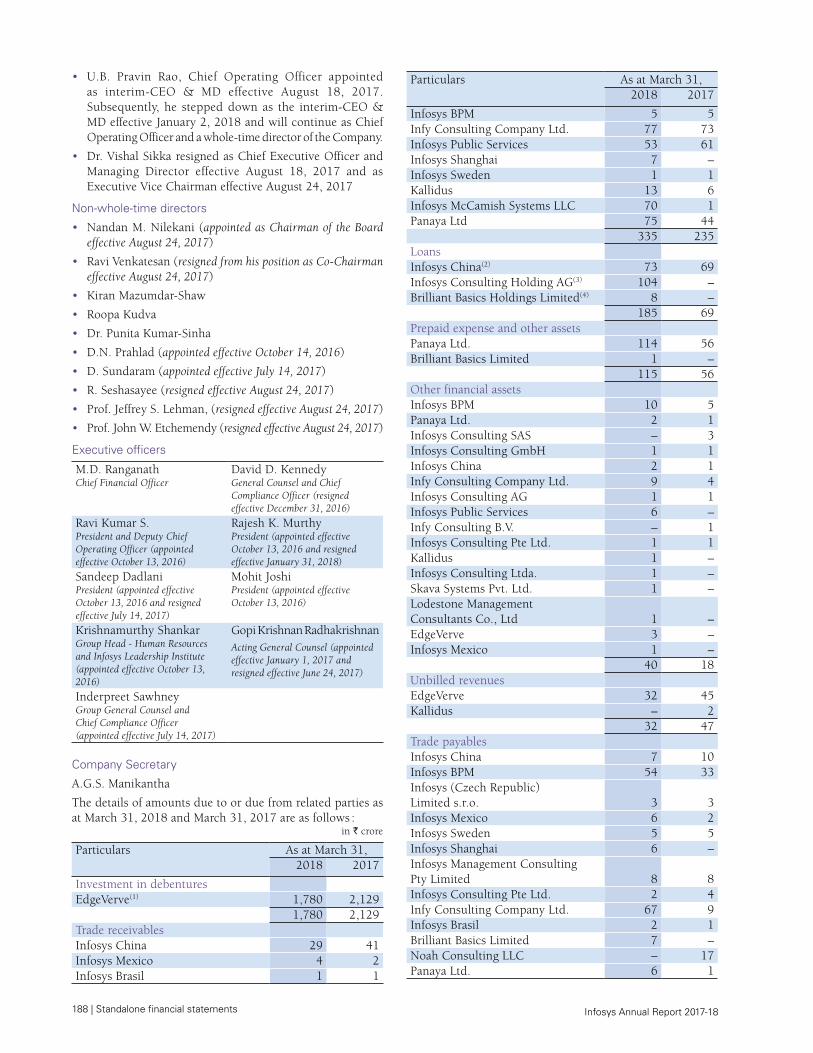
188 | Standalone financial statements Infosys Annual Report 2017-18
• U.B. Pravin Rao, Chief Operating Officer appointed as interim-CEO & MD effective August 18, 2017. Subsequently, he stepped down as the interim-CEO & MD effective January 2, 2018 and will continue as Chief Operating Officer and a whole-time director of the Company.
• Dr. Vishal Sikka resigned as Chief Executive Officer and Managing Director effective August 18, 2017 and as Executive Vice Chairman effective August 24, 2017
Non-whole-time directors
• Nandan M. Nilekani (appointed as Chairman of the Board effective August 24, 2017)
• Ravi Venkatesan (resigned from his position as Co‑Chairman effective August 24, 2017)
• Kiran Mazumdar-Shaw
• Roopa Kudva
• Dr. Punita Kumar-Sinha
• D.N. Prahlad (appointed effective October 14, 2016)
• D. Sundaram (appointed effective July 14, 2017)
• R. Seshasayee (resigned effective August 24, 2017)
• Prof. Jeffrey S. Lehman, (resigned effective August 24, 2017)
• Prof. John W. Etchemendy (resigned effective August 24, 2017)
Executive officers
M.D. RanganathChief Financial Officer
David D. KennedyGeneral Counsel and Chief Compliance Officer (resigned effective December 31, 2016)
Ravi Kumar S.President and Deputy Chief Operating Officer (appointed effective October 13, 2016)
Rajesh K. MurthyPresident (appointed effective October 13, 2016 and resigned effective January 31, 2018)
Sandeep DadlaniPresident (appointed effective October 13, 2016 and resigned effective July 14, 2017)
Mohit JoshiPresident (appointed effective October 13, 2016)
Krishnamurthy ShankarGroup Head ‑ Human Resources and Infosys Leadership Institute (appointed effective October 13, 2016)
Gopi Krishnan RadhakrishnanActing General Counsel (appointed effective January 1, 2017 and resigned effective June 24, 2017)
Inderpreet SawhneyGroup General Counsel and Chief Compliance Officer (appointed effective July 14, 2017)
Company Secretary
A.G.S. Manikantha
The details of amounts due to or due from related parties as at March 31, 2018 and March 31, 2017 are as follows :
in ` crore
Particulars
As at March 31,2018 2017
Investment in debentures EdgeVerve(1) 1,780 2,129
1,780 2,129 Trade receivablesInfosys China 29 41 Infosys Mexico 4 2 Infosys Brasil 1 1
Particulars
As at March 31,2018 2017
Infosys BPM 5 5 Infy Consulting Company Ltd. 77 73 Infosys Public Services 53 61 Infosys Shanghai 7 – Infosys Sweden 1 1 Kallidus 13 6 Infosys McCamish Systems LLC 70 1 Panaya Ltd 75 44
335 235 LoansInfosys China(2) 73 69 Infosys Consulting Holding AG(3) 104 – Brilliant Basics Holdings Limited(4) 8 –
185 69 Prepaid expense and other assetsPanaya Ltd. 114 56 Brilliant Basics Limited 1 –
115 56 Other financial assetsInfosys BPM 10 5 Panaya Ltd. 2 1 Infosys Consulting SAS – 3 Infosys Consulting GmbH 1 1 Infosys China 2 1 Infy Consulting Company Ltd. 9 4 Infosys Consulting AG 1 1 Infosys Public Services 6 – Infy Consulting B.V. – 1 Infosys Consulting Pte Ltd. 1 1 Kallidus 1 – Infosys Consulting Ltda. 1 – Skava Systems Pvt. Ltd. 1 – Lodestone Management Consultants Co., Ltd 1 – EdgeVerve 3 – Infosys Mexico 1 –
40 18 Unbilled revenuesEdgeVerve 32 45 Kallidus – 2
32 47 Trade payablesInfosys China 7 10 Infosys BPM 54 33 Infosys (Czech Republic) Limited s.r.o. 3 3 Infosys Mexico 6 2 Infosys Sweden 5 5 Infosys Shanghai 6 – Infosys Management Consulting Pty Limited 8 8 Infosys Consulting Pte Ltd. 2 4 Infy Consulting Company Ltd. 67 9 Infosys Brasil 2 1 Brilliant Basics Limited 7 – Noah Consulting LLC – 17 Panaya Ltd. 6 1
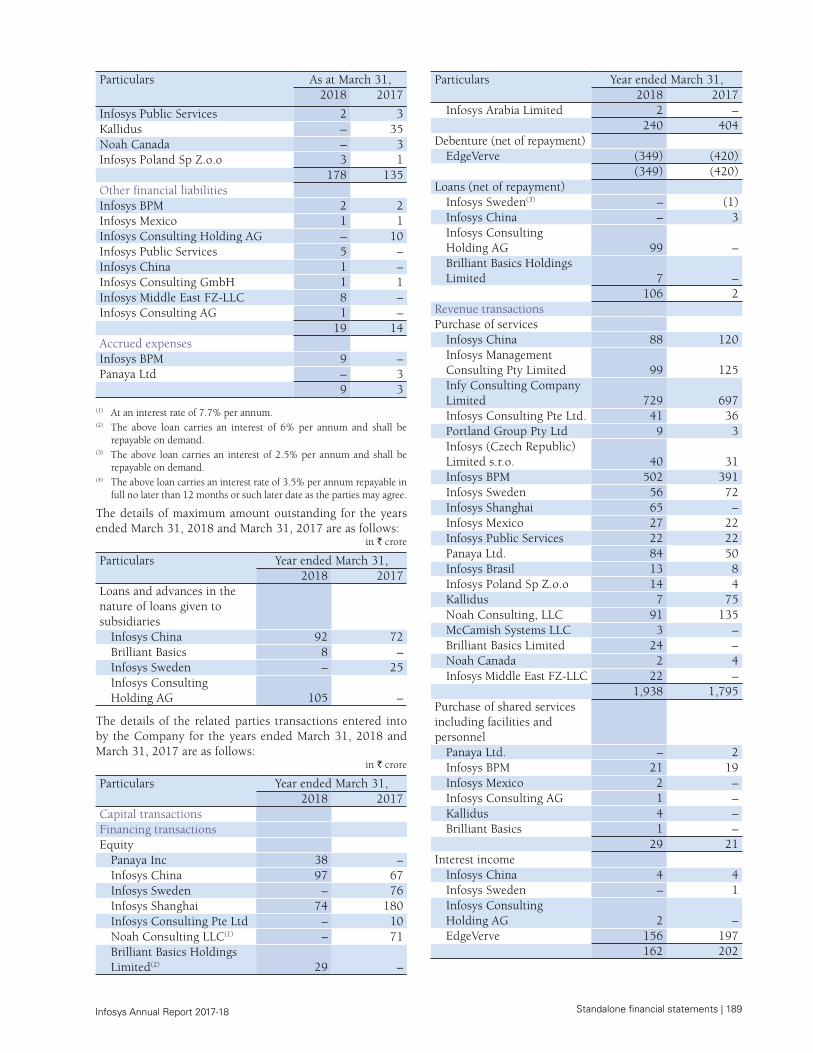
Standalone financial statements | 189 Infosys Annual Report 2017-18
Particulars
As at March 31,2018 2017
Infosys Public Services 2 3 Kallidus – 35 Noah Canada – 3 Infosys Poland Sp Z.o.o 3 1
178 135 Other financial liabilitiesInfosys BPM 2 2 Infosys Mexico 1 1 Infosys Consulting Holding AG – 10 Infosys Public Services 5 – Infosys China 1 – Infosys Consulting GmbH 1 1 Infosys Middle East FZ-LLC 8 – Infosys Consulting AG 1 –
19 14 Accrued expensesInfosys BPM 9 – Panaya Ltd – 3 9 3
(1) At an interest rate of 7.7% per annum.(2) The above loan carries an interest of 6% per annum and shall be
repayable on demand.(3) The above loan carries an interest of 2.5% per annum and shall be
repayable on demand.(4) The above loan carries an interest rate of 3.5% per annum repayable in
full no later than 12 months or such later date as the parties may agree.
The details of maximum amount outstanding for the years ended March 31, 2018 and March 31, 2017 are as follows:
in ` crore
Particulars Year ended March 31,2018 2017
Loans and advances in the nature of loans given to subsidiaries
Infosys China 92 72 Brilliant Basics 8 – Infosys Sweden – 25 Infosys Consulting Holding AG 105 –
The details of the related parties transactions entered into by the Company for the years ended March 31, 2018 and March 31, 2017 are as follows:
in ` crore
Particulars Year ended March 31,2018 2017
Capital transactions Financing transactionsEquity
Panaya Inc 38 – Infosys China 97 67 Infosys Sweden – 76 Infosys Shanghai 74 180 Infosys Consulting Pte Ltd – 10 Noah Consulting LLC(1) – 71 Brilliant Basics Holdings Limited(2) 29 –
Particulars Year ended March 31,2018 2017
Infosys Arabia Limited 2 – 240 404
Debenture (net of repayment)EdgeVerve (349) (420)
(349) (420)Loans (net of repayment)
Infosys Sweden(3) – (1)Infosys China – 3 Infosys Consulting Holding AG 99 – Brilliant Basics Holdings Limited 7 –
106 2 Revenue transactionsPurchase of services
Infosys China 88 120 Infosys Management Consulting Pty Limited 99 125 Infy Consulting Company Limited 729 697 Infosys Consulting Pte Ltd. 41 36 Portland Group Pty Ltd 9 3 Infosys (Czech Republic) Limited s.r.o. 40 31 Infosys BPM 502 391 Infosys Sweden 56 72 Infosys Shanghai 65 – Infosys Mexico 27 22 Infosys Public Services 22 22 Panaya Ltd. 84 50 Infosys Brasil 13 8 Infosys Poland Sp Z.o.o 14 4 Kallidus 7 75 Noah Consulting, LLC 91 135 McCamish Systems LLC 3 – Brilliant Basics Limited 24 – Noah Canada 2 4 Infosys Middle East FZ-LLC 22 –
1,938 1,795 Purchase of shared services including facilities and personnel
Panaya Ltd. – 2 Infosys BPM 21 19 Infosys Mexico 2 – Infosys Consulting AG 1 – Kallidus 4 – Brilliant Basics 1 –
29 21 Interest income
Infosys China 4 4 Infosys Sweden – 1 Infosys Consulting Holding AG 2 – EdgeVerve 156 197
162 202
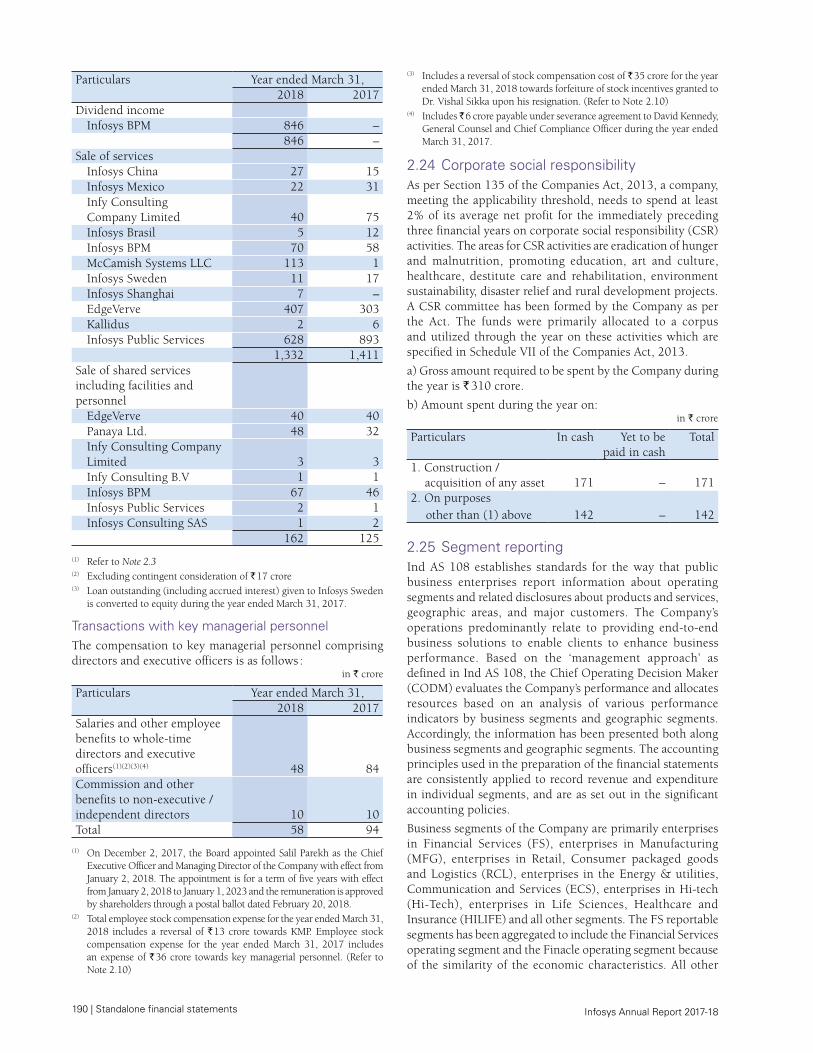
190 | Standalone financial statements Infosys Annual Report 2017-18
Particulars Year ended March 31,2018 2017
Dividend incomeInfosys BPM 846 –
846 – Sale of services
Infosys China 27 15 Infosys Mexico 22 31 Infy Consulting Company Limited 40 75 Infosys Brasil 5 12 Infosys BPM 70 58 McCamish Systems LLC 113 1 Infosys Sweden 11 17 Infosys Shanghai 7 – EdgeVerve 407 303 Kallidus 2 6 Infosys Public Services 628 893
1,332 1,411 Sale of shared services including facilities and personnel
EdgeVerve 40 40 Panaya Ltd. 48 32 Infy Consulting Company Limited 3 3 Infy Consulting B.V 1 1 Infosys BPM 67 46 Infosys Public Services 2 1 Infosys Consulting SAS 1 2
162 125
(1) Refer to Note 2.3(2) Excluding contingent consideration of ` 17 crore(3) Loan outstanding (including accrued interest) given to Infosys Sweden
is converted to equity during the year ended March 31, 2017.
Transactions with key managerial personnelThe compensation to key managerial personnel comprising directors and executive officers is as follows :
in ` crore
Particulars Year ended March 31,2018 2017
Salaries and other employee benefits to whole-time directors and executive officers(1)(2)(3)(4) 48 84 Commission and other benefits to non-executive / independent directors 10 10 Total 58 94
(1) On December 2, 2017, the Board appointed Salil Parekh as the Chief Executive Officer and Managing Director of the Company with effect from January 2, 2018. The appointment is for a term of five years with effect from January 2, 2018 to January 1, 2023 and the remuneration is approved by shareholders through a postal ballot dated February 20, 2018.
(2) Total employee stock compensation expense for the year ended March 31, 2018 includes a reversal of ` 13 crore towards KMP. Employee stock compensation expense for the year ended March 31, 2017 includes an expense of ` 36 crore towards key managerial personnel. (Refer to Note 2.10)
(3) Includes a reversal of stock compensation cost of ` 35 crore for the year ended March 31, 2018 towards forfeiture of stock incentives granted to Dr. Vishal Sikka upon his resignation. (Refer to Note 2.10)
(4) Includes ̀ 6 crore payable under severance agreement to David Kennedy, General Counsel and Chief Compliance Officer during the year ended March 31, 2017.
2.24 Corporate social responsibilityAs per Section 135 of the Companies Act, 2013, a company, meeting the applicability threshold, needs to spend at least 2% of its average net profit for the immediately preceding three financial years on corporate social responsibility (CSR) activities. The areas for CSR activities are eradication of hunger and malnutrition, promoting education, art and culture, healthcare, destitute care and rehabilitation, environment sustainability, disaster relief and rural development projects. A CSR committee has been formed by the Company as per the Act. The funds were primarily allocated to a corpus and utilized through the year on these activities which are specified in Schedule VII of the Companies Act, 2013.
a) Gross amount required to be spent by the Company during the year is ` 310 crore.
b) Amount spent during the year on:in ` crore
Particulars In cash Yet to be paid in cash
Total
1. Construction / acquisition of any asset 171 – 171 2. On purposes
other than (1) above 142 – 142
2.25 Segment reportingInd AS 108 establishes standards for the way that public business enterprises report information about operating segments and related disclosures about products and services, geographic areas, and major customers. The Company’s operations predominantly relate to providing end-to-end business solutions to enable clients to enhance business performance. Based on the ‘management approach’ as defined in Ind AS 108, the Chief Operating Decision Maker (CODM) evaluates the Company’s performance and allocates resources based on an analysis of various performance indicators by business segments and geographic segments. Accordingly, the information has been presented both along business segments and geographic segments. The accounting principles used in the preparation of the financial statements are consistently applied to record revenue and expenditure in individual segments, and are as set out in the significant accounting policies.
Business segments of the Company are primarily enterprises in Financial Services (FS), enterprises in Manufacturing (MFG), enterprises in Retail, Consumer packaged goods and Logistics (RCL), enterprises in the Energy & utilities, Communication and Services (ECS), enterprises in Hi-tech (Hi-Tech), enterprises in Life Sciences, Healthcare and Insurance (HILIFE) and all other segments. The FS reportable segments has been aggregated to include the Financial Services operating segment and the Finacle operating segment because of the similarity of the economic characteristics. All other

Standalone financial statements | 191 Infosys Annual Report 2017-18
segments represents the operating segments of businesses in India, Japan and China. Geographic segmentation is based on business sourced from that geographic region and delivered from both on site and off shore locations. North America comprises the United States of America, Canada and Mexico, Europe includes continental Europe (both the east and the west), Ireland and the United Kingdom, and the Rest of the World comprising all other places except those mentioned above and India.
Revenue and identifiable operating expenses in relation to segments are categorized based on items that are individually identifiable to that segment. Revenue for ‘all other segments’ represents revenue generated from customers located in India, Japan and China. Allocated expenses of segments include expenses incurred for rendering services from the Company’s offshore software development centres and on-site expenses, which are categorized in relation to the associated turnover of the segment. Certain expenses such as depreciation, which
form a significant component of total expenses, are not specifically allocable to specific segments as the underlying assets are used interchangeably. The Management believes that it is not practical to provide segment disclosures relating to those costs and expenses, and accordingly these expenses are separately disclosed as ‘unallocated’ and adjusted against the total income of the Company.
Assets and liabilities used in the Company’s business are not identified to any of the reportable segments, as these are used interchangeably between segments. The Management believes that it is currently not practicable to provide segment disclosures relating to total assets and liabilities since a meaningful segregation of the available data is onerous.
Geographical information on revenue and business segment revenue information is collated based on individual customers invoiced or in relation to which the revenue is otherwise recognized.
Business segments For the years ended March 31, 2018 and March 31, 2017 :
in ` crore
Particulars FS MFG ECS RCL HILIFE Hi-tech All other segments
Total
Revenue from operations 15,860 6,485 15,457 10,247 7,825 4,782 1,285 61,941 15,735 6,086 13,999 10,280 7,065 4,901 1,223 59,289
Identifiable operating expenses 8,628 3,523 7,957 5,118 3,946 2,582 659 32,413 8,408 3,136 6,931 5,127 3,607 2,595 788 30,592
Allocated expenses 2,964 1,221 2,909 1,929 1,474 901 242 11,640 3,036 1,180 2,713 1,994 1,369 952 236 11,480
Segment operating income 4,268 1,741 4,591 3,200 2,405 1,299 384 17,888 4,291 1,770 4,355 3,159 2,089 1,354 199 17,217
Unallocable expenses 1,410 1,341
Operating profit 16,478 15,876
Impairment loss on assets held for sale (Refer to Note 2.26) 589
– Other income, net 4,019
3,062 Profit before tax 19,908
18,938 Tax expense 3,753
5,120 Profit for the year 16,155
13,818 Depreciation and amortization expense 1,408
1,331 Non-cash expenses other than depreciation and amortization 713 10
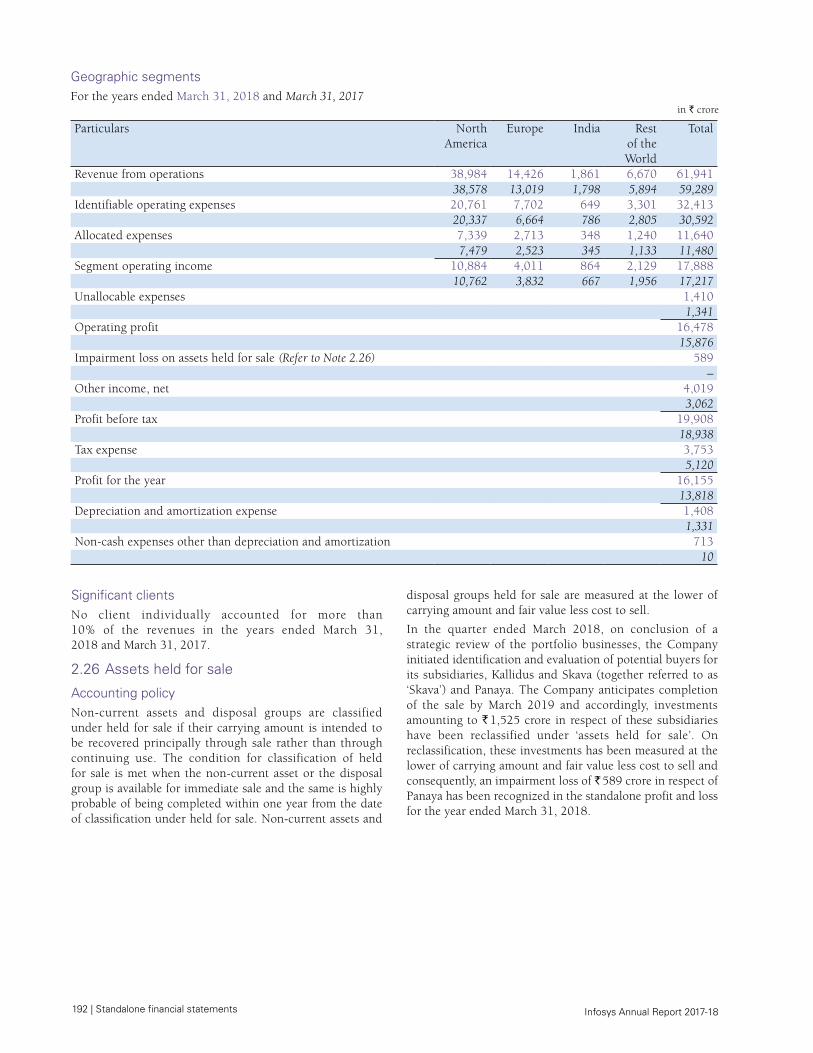
192 | Standalone financial statements Infosys Annual Report 2017-18
Geographic segmentsFor the years ended March 31, 2018 and March 31, 2017
in ` crore
Particulars North America
Europe India Rest of the World
Total
Revenue from operations 38,984 14,426 1,861 6,670 61,941 38,578 13,019 1,798 5,894 59,289
Identifiable operating expenses 20,761 7,702 649 3,301 32,413 20,337 6,664 786 2,805 30,592
Allocated expenses 7,339 2,713 348 1,240 11,640 7,479 2,523 345 1,133 11,480
Segment operating income 10,884 4,011 864 2,129 17,888 10,762 3,832 667 1,956 17,217
Unallocable expenses 1,410 1,341
Operating profit 16,478 15,876
Impairment loss on assets held for sale (Refer to Note 2.26) 589 –
Other income, net 4,019 3,062
Profit before tax 19,908 18,938
Tax expense 3,753 5,120
Profit for the year 16,155 13,818
Depreciation and amortization expense 1,408 1,331
Non-cash expenses other than depreciation and amortization 713 10
Significant clientsNo client individually accounted for more than 10% of the revenues in the years ended March 31, 2018 and March 31, 2017.
2.26 Assets held for sale
Accounting policyNon-current assets and disposal groups are classified under held for sale if their carrying amount is intended to be recovered principally through sale rather than through continuing use. The condition for classification of held for sale is met when the non-current asset or the disposal group is available for immediate sale and the same is highly probable of being completed within one year from the date of classification under held for sale. Non-current assets and
disposal groups held for sale are measured at the lower of carrying amount and fair value less cost to sell.
In the quarter ended March 2018, on conclusion of a strategic review of the portfolio businesses, the Company initiated identification and evaluation of potential buyers for its subsidiaries, Kallidus and Skava (together referred to as ‘Skava’) and Panaya. The Company anticipates completion of the sale by March 2019 and accordingly, investments amounting to ` 1,525 crore in respect of these subsidiaries have been reclassified under ‘assets held for sale’. On reclassification, these investments has been measured at the lower of carrying amount and fair value less cost to sell and consequently, an impairment loss of ` 589 crore in respect of Panaya has been recognized in the standalone profit and loss for the year ended March 31, 2018.
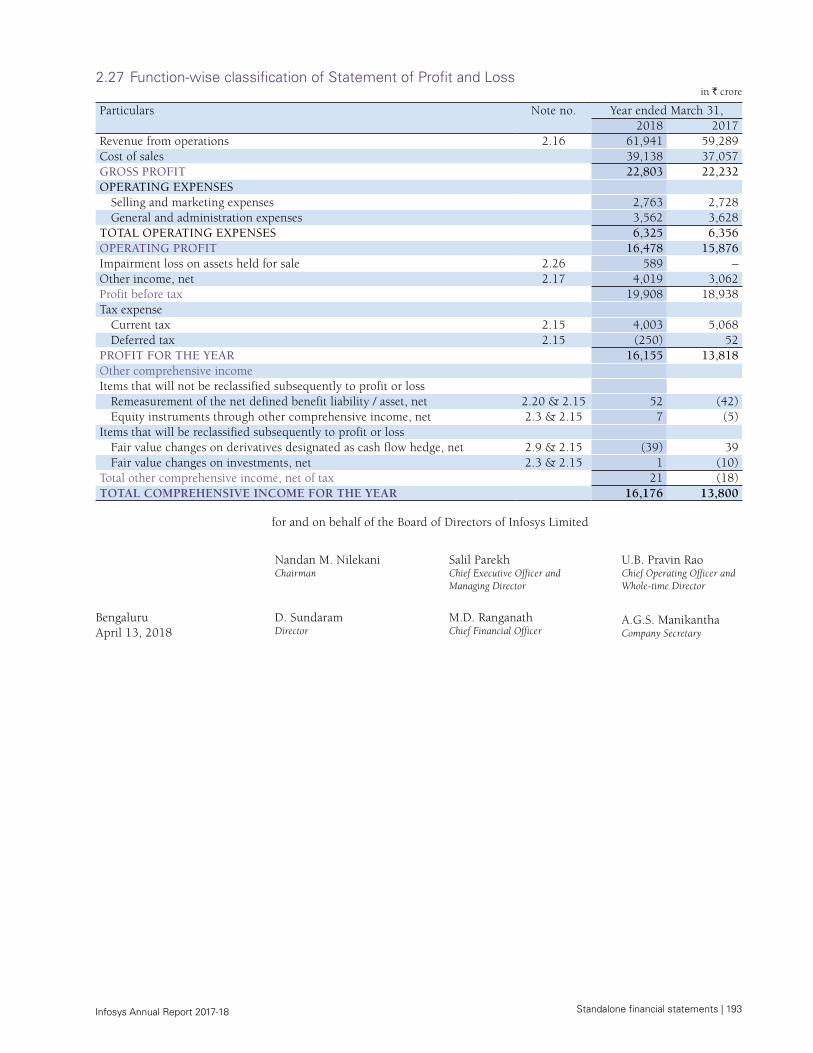
Standalone financial statements | 193 Infosys Annual Report 2017-18
2.27 Function-wise classification of Statement of Profit and Lossin ` crore
Particulars Note no. Year ended March 31,2018 2017
Revenue from operations 2.16 61,941 59,289 Cost of sales 39,138 37,057 GROSS PROFIT 22,803 22,232 OPERATING EXPENSES
Selling and marketing expenses 2,763 2,728 General and administration expenses 3,562 3,628
TOTAL OPERATING EXPENSES 6,325 6,356 OPERATING PROFIT 16,478 15,876 Impairment loss on assets held for sale 2.26 589 – Other income, net 2.17 4,019 3,062 Profit before tax 19,908 18,938 Tax expense
Current tax 2.15 4,003 5,068 Deferred tax 2.15 (250) 52
PROFIT FOR THE YEAR 16,155 13,818 Other comprehensive income Items that will not be reclassified subsequently to profit or loss
Remeasurement of the net defined benefit liability / asset, net 2.20 & 2.15 52 (42)Equity instruments through other comprehensive income, net 2.3 & 2.15 7 (5)
Items that will be reclassified subsequently to profit or lossFair value changes on derivatives designated as cash flow hedge, net 2.9 & 2.15 (39) 39 Fair value changes on investments, net 2.3 & 2.15 1 (10)
Total other comprehensive income, net of tax 21 (18)TOTAL COMPREHENSIVE INCOME FOR THE YEAR 16,176 13,800
for and on behalf of the Board of Directors of Infosys Limited
Nandan M. NilekaniChairman
Salil ParekhChief Executive Officer and Managing Director
U.B. Pravin RaoChief Operating Officer and Whole‑time Director
BengaluruApril 13, 2018
D. SundaramDirector
M.D. RanganathChief Financial Officer
A.G.S. Manikantha Company Secretary


![Standalone Statement on Impact of Audit Qualifications for the period ended March 31, 2016 [Company Update]](https://img.dokumen.tips/doc/110x75/577c78ac1a28abe05490a42d/standalone-statement-on-impact-of-audit-qualifications-for-the-period-ended.jpg)