Embed Size (px)
Citation preview

STAKEHOLDER MANAGEMENT STRATEGIES AND
FINANCIAL PERFORMANCE OF DEPOSIT TAKING
SACCOS IN KENYA
JESSE MAINA KINYUA
DOCTOR OF PHILOSOPHY
(Business Administration)
JOMO KENYATTA UNIVERSITY OF
AGRICULTURE AND TECHNOLOGY.
2016

Stakeholder Management Strategies and Financial Performance of
Deposit Taking SACCOs in Kenya
Jesse Maina Kinyua
A Thesis Submitted in Partial Fulfillment for the Degree of Doctor of
Philosophy in Business Administration in the Jomo Kenyatta
University of Agriculture and Technology.
2016

ii
DECLARATION
This thesis is my original work and has not been presented for a degree in any other
University.
Signature: …....................................... Date: ………………………………
Jesse Maina Kinyua
This thesis has been submitted for examination with our approval as University
Supervisors:
Signature: …………………………………… Date: ………………………..
Dr. Iravo Mike Amuhaya (PhD)
JKUAT, Kenya
Signature: ………………………………… Date: ………………………
Prof. Gregory S. Namusonge (PhD)
JKUAT, Kenya

iii
DEDICATION
I would like to dedicate this work to my dear wife Sabina, our sons Morris and Miguel. I
also dedicate to my dad Wilson and my mother Rose for emphasizing to me the need for
education.

iv
ACKNOWLEDGEMENT
I would like to thank the almighty God for giving me the opportunity, strength and
capability to do this study.
I wish to express my gratitude to my Supervisors, Dr Mike Iravo and Prof. G. S
Namusonge for their guidance, motivation and patience when carrying out the study.
v
TABLE OF CONTENTS
DECLARATION ............................................................................................................. ii
DEDICATION ................................................................................................................ iii
ACKNOWLEDGEMENT ............................................................................................. iv
TABLE OF CONTENTS ................................................................................................ v
LIST OF FIGURES ...................................................................................................... xii
ABBREVIATIONS AND ACRONYMS ................................................................... xiv
DEFINITIONS OF TERMS ....................................................................................... xvi
ABSTRACT ................................................................................................................. xvii
CHAPTER ONE ............................................................................................................. 1
INTRODUCTION ........................................................................................................... 1
1.1 Background of the Study ...................................................................................................... 1
1.2 Statement of the Problem .................................................................................................. 5
1.3 Objectives of the Study ........................................................................................................ 7
1.3.1 General Objective ......................................................................................................... 7
1.3.2 Specific Objectives ........................................................................................................ 7
1.4 Research Hypotheses ........................................................................................................... 8
1.5 Significance of the Study ...................................................................................................... 8
1.6 Scope of the Study ............................................................................................................. 10
1.7 Limitations of the Study ..................................................................................................... 10
CHAPTER TWO .......................................................................................................... 12
LITERATURE REVIEW ............................................................................................. 12
2.1 Introduction ....................................................................................................................... 12
2.2 Theoretical Review ............................................................................................................. 12
2.2.1 Stakeholder Theory .................................................................................................... 12
2.2.2 Corporate Social Responsibility Theory ...................................................................... 14
2.2.3 Resource-Based Theory .............................................................................................. 15

vi
2.3 Empirical Review ................................................................................................................ 17
2.3.1 Offensive Strategies .................................................................................................... 17
2.3.2 Defensive Strategy ...................................................................................................... 20
2.3.3 Swing Strategy ............................................................................................................. 22
2.3.4 Hold Strategy ............................................................................................................... 23
2.3.5 Corporate Social Responsibility Strategy .................................................................... 23
2.3.6 Financial Performance of SACCOs ............................................................................... 26
2.4 Conceptual Framework ...................................................................................................... 28
2.5 Critique of the existing Literature Relevant to the Study .................................................. 30
2.6 Research Gaps .................................................................................................................... 30
2.7 Summary ............................................................................................................................ 32
CHAPTER THREE ...................................................................................................... 32
RESEARCH METHODOLOGY ................................................................................ 33
3.1 Introduction ....................................................................................................................... 33
3.2 Research Design ................................................................................................................. 33
3.3 Target Population............................................................................................................... 34
3.4 Sampling Techniques and Sample Size .............................................................................. 35
3.4.1 Sampling Frame .......................................................................................................... 35
3.4.2 Sampling Technique and Sample Size ......................................................................... 36
3.5 Data collection Instruments ............................................................................................... 38
3.6 Data Collection Procedures ................................................................................................ 39
3.7 Pilot Study .......................................................................................................................... 39
3.7.1 Reliability ..................................................................................................................... 40
3.7.2 Validity of the Instruments ......................................................................................... 41
3.8 Data Analysis and Presentation ......................................................................................... 42
3.81 Data Analysis ................................................................................................................ 42
3.8.2 Data Presentation ....................................................................................................... 43
3.9 Hypothesis Testing ............................................................................................................. 45
CHAPTER FOUR ......................................................................................................... 47
RESEARCH FINDINGS AND DISCUSSION ........................................................... 47
4.1 Introduction ....................................................................................................................... 47
vii
4.2 Response Rate .................................................................................................................... 47
4.2.1 Reliability of the Results .............................................................................................. 47
4.2.2 Normality Tests for the Dependent Variable .............................................................. 49
4.3 Demographic Data ............................................................................................................. 52
4.3.1 Gender of the Respondent ......................................................................................... 52
4.3.2 Age Category of the Respondents .............................................................................. 53
4.3.3 Number of Years Worked ........................................................................................... 54
4.3.4 Education Level of the Respondents ........................................................................... 55
4.4 Profile of Licensed Deposit Taking SACCOs........................................................................ 56
4.4.1 Categorization on SACCO Membership ...................................................................... 56
4.4.2 Categorization Based on Source of Members............................................................. 57
4.4.3 Categorization Based on Deposit Taking SACCOs’ Assets ........................................... 58
4.5 Descriptive Statistics on Use of Stakeholder Concept ....................................................... 59
4.5.1 Involvement of Key Stakeholders in Planning ............................................................. 60
4.5.2 Employees are allowed to own Shares ....................................................................... 60
4.5.3 Categorized Stakeholders into Groups ....................................................................... 61
4.5.4 Different Strategies Used for Different Groups .......................................................... 62
4.5.5 Engagement depends Stakeholder’s Interest and Power ........................................... 62
4.5.6 Involved in CSR with Community Around ................................................................... 63
4.6 Descriptive Statistics on Offensive Strategy ...................................................................... 64
4.6.1 Changing Stakeholder Objectives or Perception ........................................................ 65
4.6.2 Adopting Stakeholder’s Position ................................................................................. 66
4.6.3 Keeping Key Stakeholders Informed and Motivated .................................................. 67
4.6.4 Involvement of Key Stakeholders in Strategy Formulation ........................................ 68
4.6.5 Involvement of Key Stakeholders in Policy Formulation ............................................ 69
4.7 Descriptive Statistics on Hold Strategy .............................................................................. 72
4.7.1 Continue with Current Strategy and Programs ........................................................... 73
4.7.2 Monitor Marginal Group for Change in Position or Attitude ...................................... 74
4.7.3 Involve Group in Strategy Formulation ....................................................................... 76
4.7.4 Reinforce Stakeholder Beliefs about the Firm ............................................................ 76
4.7.5 Change Firm’s Behavior to Address Group's Concerns ............................................... 77
4.7.6 Employment of Hold Strategy ..................................................................................... 79
4.8 Descriptive Statistics of Defensive Strategies .................................................................... 80

viii
4.8.1 Defend Firm from Competitors ................................................................................... 81
4.8.2 Prevent Competitive Threat ........................................................................................ 82
4.8.3 Reduce Dependence on Stakeholder .......................................................................... 83
4.8.4 Introducing New Products and being Innovative ....................................................... 85
4.8.5 Improvement on Quality of Product and Services ...................................................... 86
4.8.6 Make Retaliatory Attacks ............................................................................................ 88
4.8.7 Diversification ............................................................................................................. 89
4.9 Descriptive Statistics for Swing Strategy ............................................................................ 92
4.9.1 Change or Influencing the Rules of the Game ............................................................ 93
4.9.2 Collaborate with Mixed Blessing Group ...................................................................... 94
4.9.3 Engage Stakeholders to Nurture Positive Cooperation .............................................. 95
4.9.4 Maintain Communication with the Group .................................................................. 97
4.9.5 Modify Stakeholder Belief about the Firm .................................................................. 98
4.10 Descriptive Statistics on Corporate Social Responsibility Strategy ................................ 100
4.10.1 Integrate Social Concern into Business ................................................................... 101
4.10.2 Good Ethical Values ................................................................................................ 102
4.10.3 Engagement in Environmental Stewardship ........................................................... 104
4.10.4 Use of Corporate Social Responsibility Strategy ..................................................... 104
4.10.5 CSR Enhances Staff Motivation ............................................................................... 106
4.10.6 CSR Enhances DTS Image ........................................................................................ 107
4.10.7 CSR enhances Marketing of DTSs’ Products ........................................................... 108
4.10.8 CSR Improves Relationship with Communities ....................................................... 109
4.10.9 Engagement in Corporate Social Responsibility Activities ...................................... 110
4.11 Financial Performance of SACCOs .................................................................................. 110
4.11.1 Depositors’ Savings Safety ...................................................................................... 112
4.11.2 Compliance with SASRA .......................................................................................... 113
4.11.3 SACCOs’ Liquidity in the Last 5 years ...................................................................... 113
4.11.4 Stakeholder Satisfaction with Service Delivery ....................................................... 114
4.12 Test of Offensive Strategy Hypothesis ........................................................................... 114
4.13 Test of Defensive Strategy Hypothesis .......................................................................... 117
4.14 Hypothesis Testing of Swing Strategy ............................................................................ 119
4.15 Testing Hypothesis on Hold Strategy ............................................................................. 121
4.16 Testing the Corporate Social Responsibility Hypothesis ................................................ 124

ix
4.17 Test of Significance of the Overall Model ...................................................................... 126
4.17.1 Prediction Model of the Study Variables ................................................................ 134
4.17.2 Test of Multicollinearity .......................................................................................... 134
4.17.3 Overall Conceptual Framework .............................................................................. 135
4.18 Discussion....................................................................................................................... 136
CHAPTER FIVE ......................................................................................................... 140
SUMMARY, CONCLUSION AND RECOMMENDATIONS ............................... 140
5.1 Introduction ..................................................................................................................... 140
5.2 Summary of Major Findings ............................................................................................. 140
5.2.1 Relationship between Offensive Strategy and Financial Performance of DTS ......... 140
5.2.2 Relationship between Hold Strategy and Financial Performance of DTS ................. 141
5.2.3 Relationship between Defensive Strategy and Financial Performance of DTS ......... 142
5.2.4 Relationship between Swing Strategy and Financial Performance of DTS ............... 143
5.2.5 Relationship between CSR and Financial Performance of DTS ................................. 144
5.3 Conclusions ...................................................................................................................... 145
5.4 Recommendations ........................................................................................................... 146
5.5 Implications of the Study ................................................................................................. 148
5.5.1 Policy Implication ...................................................................................................... 148
5.5.2 Practical Implication .................................................................................................. 148
5.5.3 Implication on Stakeholder Management Theory .................................................... 149
5.6 Area for Further Research ................................................................................................ 150
REFERENCES ............................................................................................................ 151
APPENDICES ............................................................................................................. 165

x
LIST OF TABLES
Table 3.1: Target population ................................................................................ 35
Table 3.2: Sacco sample size............................................................................... 37
Table 3.3: Number of Respondents ...................................................................... 38
Table 3.4: Operitionalization of Variables ........................................................... 44
Table 4.1: Reliability of the Results ..................................................................... 48
Table 4.2: Normality Test for the Dependent Variable ....................................... 50
Table 4.3: Age category frequency ...................................................................... 54
Table 4.4: No of Years worked ............................................................................ 55
Table 4.5: Academic qualification of the respondent .......................................... 56
Table 4.6: SACCO Membership .......................................................................... 57
Table 4.7: Category of SACCO Membership Base ............................................. 58
Table 4.8: Category on Asset Size ....................................................................... 59
Table 4.9: Stakeholder Management Concept ..................................................... 59
Table 4.10: Offensive Strategies .......................................................................... 64
Table 4.11: Descriptive Statistics on Employment of Offensive Strategy ........... 71
Table 4.12: Descriptive statistics on Hold Strategy ............................................. 73
Table 4.13: Descriptive statistics for hold strategy .............................................. 79
Table 4.14: Defensive Strategies ......................................................................... 81
Table 4.15: Descriptive Statistics for Defensive Strategy ................................... 91
Table 4.16: Use of swing strategy ........................................................................ 93
Table 4.17: Use of Swing strategy ....................................................................... 99
Table 4.18: Corporate Social Responsibility Strategies ..................................... 101
Table 4.19: Descriptive Statistics on CSR Strategy ........................................... 105
Table 4.20: Table Whether DTSs engage in CSR .............................................. 110
Table 4.21: Descriptive Statistics on SACCO Financial Performance .............. 111
Table 4.22: Depositors‘ Savings Safety ............................................................. 113
Table 4.23: Compliance with SASRA ............................................................... 113
Table 4.24: SACCOs‘ Liquidity in the Last 5 years .......................................... 114

xi
Table 4.25: Stakeholder satisfaction with service delivery ................................ 114
Table 4.26: Model Summary .............................................................................. 115
Table 4.27: ANOVA on Offensive Strategy ...................................................... 115
Table 4.28: Residuals statistics .......................................................................... 116
Table 4.29: Model Summary .............................................................................. 117
Table 4.30: ANNOVA of Defensive Strategy ................................................... 118
Table 4.31: Residual Statistics ........................................................................... 119
Table 4.32: Model Summary .............................................................................. 120
Table 4.33: ANOVA a ....................................................................................... 121
Table 4.34: Model Summary b ........................................................................... 121
Table 4.35: ANOVAa ........................................................................................ 122
Table 4.36: Coefficients ..................................................................................... 123
Table 4.37: Residuals Statistics a ....................................................................... 123
Table 4.38: Model Summary .............................................................................. 124
Table 4.39: ANOVA .......................................................................................... 125
Table 4.40: Model Summary b ........................................................................... 127
Table 4.41: ANOVA a ....................................................................................... 127
Table 4.42: Coefficients a of the overall model ................................................. 129
Table 4.43: Residuals Statistics .......................................................................... 130
Table 4.44: Collinearity Diagnosis .................................................................... 135
Table 4.45: Hypothesis and Empirical Evidence ............................................... 136

xii
LIST OF FIGURES
Figure 2.1: Conceptual framework ...................................................................... 29
Figure 4.1: Histogram on Financial Performance ................................................ 51
Figure 4.2: Normal P-P Plot of Regression Standardized Residuals ................... 52
Figure 4.3: Gender of the respondent ................................................................... 53
Figure 4.4: Changing Stakeholder Objectives or Perception ............................... 66
Figure 4.5: Adopting stakeholder‘s position ........................................................ 67
Figure 4.6: Keeping key stakeholders informed and motivated .......................... 68
Figure 4.7: Involve key stakeholders in strategy formulation ............................. 69
Figure 4.8: Involve key stakeholders in formulating policies .............................. 71
Figure 4.9: Use of Offensive Strategy ................................................................. 72
Figure 4.10: Continue with Current Strategy and Programs ................................ 74
Figure 4.11: Monitor this marginal group for change in position or attitude ...... 75
Figure 4.12: Involve group in strategy formulation ............................................. 76
Figure 4.13: Reinforce stakeholder beliefs about the firm .................................. 77
Figure 4.14: Change Organization‘s behavior to address group's concerns ........ 78
Figure 4.15: Use of Hold Strategy ....................................................................... 80
Figure 4.16: Defend firm from competitors ......................................................... 82
Figure 4.17: Prevent competitive threat ............................................................... 83
Figure 4.18: Reduce Dependence on Stakeholder ............................................... 84
Figure 4.19: Introducing new products and being Innovative ............................. 86
Figure 4.20: Continuously Improvement on Quality of Product & Services ...... 87
Figure 4.21: Make retaliatory attacks .................................................................. 89
Figure 4.22: Diversification ................................................................................. 90
Figure 4.23: Use of defensive strategy ................................................................ 92
Figure 4.24: Change or Influencing the Rules of the Game ................................ 94
Figure 4.25: Collaborate with mixed blessing group ........................................... 95
Figure 4.26: Positively engage Stakeholders to Nurture Positive cooperation .... 96
Figure 4.27: Maintain Communication with the Group ....................................... 98

xiii
Figure 4.28: Modify this stakeholder belief about the firm ................................. 99
Figure 4.29: Use of Swing Strategy ................................................................... 100
Figure 4.30: Integrate social concern into business & contribute to a better
society ............................................................................................ 102
Figure 4.31: Good Ethical Values ...................................................................... 103
Figure 4.32: Engagement in Environmental Stewardship ................................. 104
Figure 4.33: Use of CSR Strategy ...................................................................... 105
Figure 4.34: Relationship of CSR and Staff Motivation .................................... 106
Figure 4.35: Relationship between CSR and DTSs image ................................ 107
Figure 4.36: Relationship between CRS and Marketing of DTS Products ........ 108
Figure 4.37: Relationship between CRS and Communities ............................... 109
Figure 4.38: financial performance .................................................................... 112
Figure 4.39: Partial Regression Plot for Dependent Variable and Hold Strategy
....................................................................................................... 131
Figure 4.40: Partial Regression Plot for Dependent Variable and Offensive
Strategy .......................................................................................... 131
Figure 4.41: Partial Regression Plot for Dependent Variable and Defensive
Strategy .......................................................................................... 132
Figure 4.42: Partial Regression Plot for Dependent Variable and CSR Strategy….
....................................................................................................... 133

xiv
ABBREVIATIONS AND ACRONYMS
CAK Co-operative Alliance of Kenya
CCK Co-operative College of Kenya
CIC Co-operative Insurance Company
CSR Corporate Social Responsibility
DTS Deposit Taking SACCO
FOSA Front Office Service Activities
HRM Human Resource Management
ICA International Co-operative Alliance
IMS Information Management System
IT Information Technology
KERUSSU Kenya Rural SACCO Societies
KUSCCO Kenya Union of Savings and Credit Co-operative
MOCD &M Ministry of Co-operative Development and Marketing
NACHU
COLAC
National Co-operative Housing Union
Confederation of Savings and Credit Cooperatives
ROA Return of Assets

xv
ROE
ANOVA
VIF
Return of Equity
Analysis of Variance
Variance Inflation Factor
SACCOs Saving and Credit Co-operatives
SASRA SACCO Societies Regulatory Authority
SPSS Statistical Package of Social Sciences
TQM
RDT
WBCSD
CFI
Total Quality Management
Resource Dependence Theory
World Business Council for Sustainable Development
Co-operative Financial Institutions
WBCSD World Business for Sustainable Development
WOCCU World Council of Credit Unions

xvi
DEFINITIONS OF TERMS
Stakeholder Those individuals who depend on the organization to
fulfill their own goal and on whom, in turn the
organization depends on (Johnson & Schoels, 2002).
Stakeholder
engagement
The process of effectively eliciting stakeholders‘ views on
their relationship with the organization/program/projects
(Friedman & Miles, 2006).
Corporate Social
Responsibility
How companies manage the business processes to produce
an overall positive impact on society (Baker, 2003).
Stakeholder Analysis A technique used to identify and assess the influence and
importance of key people, groups of people, or organizations
that may significantly impact the success of her activities or
project (Friedman & Miles, 2006).
Strategy The direction and scope of an organization over the long-
term which achieves advantage for the organization through
its configuration of resources within a challenging
environment, to meet the needs of markets and to fulfill
stakeholder expectations (Johnson & Schoels, 2002).
Cooperatives Autonomous association of persons united voluntarily to
meet their common economic, social and cultural needs and
aspirations through a jointly owned and democratically
controlled enterprise (ICA, 2004).
Deposit taking SACCO Credit society licensed to receive deposits from members
and extend credit facilities (MOCD&M, 2008).

xvii
ABSTRACT
This study sought to establish the relationship between stakeholder management
strategies and the financial performance of deposit taking SACCOs in Kenya. The
SACCO subsector is part of the Kenyan Co-operative sector comprising of both
financial and non financial cooperatives. Saving and credit co-operative (SACCO) are
the financial cooperatives. They are an important part of the financial sector in Kenya,
providing savings, credit and insurance services to a large portion of the population.
Stakeholder management is paramount in creating trust and confidence to key
stakeholder especially in deposit taking SACCOs and in keeping them satisfied with the
services provided. It has been argued that stakeholder management is decisive in
determining whether or not a company is or will remain successful, and that it has direct
environment and bottom line result of an organization. Panic in deposit taking financial
institutions can cause great negative repercussions and loss of customers and hence the
need for a proactive stakeholder management. Systematic attention to all parties who
affect or may be affected by the organization‘s behavior is critical to that organizations
success. Stakeholder management studies have mostly concentrated on normative
branch of stakeholder management theory. It is however important to extend the study to
member - based co-operatives. The objective of this study was to look into the
relationship between stakeholder management generic strategies and performance of
SACCO societies in Kenya. Stratified random sampling was done to determine sample
size. Data was collected from a sample of 64 Deposit taking SACCOs out of a
population of 180 licensed DTS. The sample size was 130 respondents. Descriptive
research method was used in this study. Questionnaires were used to collect primary
data. To ensure that the research instrument yields valid data, the researcher engaged
expert in the relevant field in scrutinizing it. The designed instrument was counter
checked by the supervisor and peers in the area of specialization. Pilot study was carried
out to check on the reliability and validity of the instrument and a Cronbach‘s Alpha of
0.914 was obtained. Collected data was then edited in the field to clean it up. Data was
processed using descriptive analysis and multiple regression analysis performed to

xviii
determine the relationships between the stakeholder generic strategies and performance
of SACCO societies. Data analysis was done using Statistical Package of Social Science
(SPSS). Research findings were that: there was a significant positive relationship
between offensive, defensive, swing, hold, defensive, CSR strategy and financial
performance of DTSs individually. The combined model had a significant positive
relationship with the performance of deposit taking SAACOs. The conclusion was that
stakeholder management strategies significantly influenced financial performance of
DTSs. The research contributes to stakeholder management theory by supporting
previous studies that stakeholder management strategies have positive relationship with
firms‘ performance. The study offered practical recommendations to managers to be
proactive in stakeholder management and should adopt corporate social responsibility
strategy to enhance various relationships and financial performance of their SACCOs.
These strategies should be incorporated in the strategic plans for achievement of good
results and should not be used as disjoined activities. The study has provided
instrumental contribution to stakeholder theory by finding out that, member – based
firms who employ stakeholder management strategies enhance their financial
performance, hence extending the body of knowledge.

1
CHAPTER ONE
INTRODUCTION
This chapter gives the historical background of the study on how the entire co-operative
movement started in developed countries, how it was introduced in Africa, and how it
was adopted in Kenya. It also gives the statement of the problem, the general research
objectives and the specific objectives of the study. The null and alternative research
hypotheses for the five specific objectives are formulated in this chapter. The
significance of the study to various stakeholders in both the management and scholarly
work is also given in this chapter. This chapter also gives the scope and limitation of the
study.
1.1 Background of the Study
Cooperative Financial Institutions (CFIs) or in other terms Credit Unions or Savings and
Credit Co-operatives are user owned financial co-operatives that offer savings, credit
and other financial services to their members (WOCCU, 2005). They are defined as
autonomous associations of persons united voluntarily to meet common economic,
social and cultural needs and aspirations through jointly owned and democratically
controlled enterprises (Makori et al., 2013; Wanyama et al., 2009). The definition
informs that co-operatives are different from other forms of organizations in that they
are owned by its members who directly run the organization, make decisions
democratically and use capital for mutual benefit (Kinyuira, Gathenya & Muturi, 2014).
It has been noted that co-operatives are poorly understood in most countries that
comprise the existing institutional base for financial intermediation (Cuevas & Fisher,
2006).
On a global perspective, majority of co-operatives around the world are economic
enterprises. Co-operative philosophy started in the year 1844 in Britain by Rockdale
pioneers and its principles are followed all over the world (Mwakajumilo, 2011). They

2
provide consumer services and producer services. They are formed to address economic
needs not adequately met in the conventional systems. The basis of co-operative success
is that they provide economies of scale. They provide an institutional means whereby
individual people can group themselves into self-help units. Through their support
structures at the secondary and tertiary levels, they provide common services and
generate income in a way that would not otherwise be possible. The Latin American
Confederation of Savings and Credit Co-operatives (COLAC), for instance, has been
able to obtain loans from the Inter-American Development Bank which has enabled its
seventeen national member federations to improve their lending services to their own
affiliates (ICIC, 1995).
In Africa, the first SACCO society was introduced by Father John Ncnulty in Ghana in
1959. The aim was to assist villagers improve their economic conditions (Mwikamba &
Ngombe, 2004). English speaking nations were the first to adopt SACCO. The first
entrants into SACCO community were Ghana, Uganda, Nigeria, Tanzania, and Kenya.
Most of the Non-English speaking nations in Africa started appreciating SACCO in
1960s, with major influx into SACCO community in 1970s (Mwakajumilo, 2011).
Kenya has a long history of cooperative development that has been characterized by
strong growth, thus making a significant contribution to the overall economy. The
SACCO societies were started after independence by groups that came together to save
some money and provide loans to customers as the need arose. However, these co-
operatives became dormant owing to lack of adequate steady income and poor skills in
record keeping and financial accounting as observed in Procousor (2013). SACCO
movement is geographically distributed across Kenya in all the 45 counties although
some regions have more SACCOs than others depending on the level of economic
activities and available employment opportunities.
Cooperatives are recognized by the government to be a major contributor to national
development, as cooperatives are found in almost all sectors of the economy. It is
estimated that 63 per cent of Kenya‘s population participate directly or indirectly in

3
cooperative-based enterprises (MOCD&M, 2008). Indeed, the Ministry of Cooperative
Development and Marketing (now under Ministry of trade and Industrialization)
estimated that 80 per cent of Kenya‘s population derives their income either directly or
indirectly through cooperative activities. The greatest contribution of cooperatives to
Kenya‘s social and economic development is in the financial sector where financial
cooperatives savings and credit cooperatives (SACCOs) have realized tremendous
growth in the last one decade (Wanyama, 2009). The International Cooperative Alliance
(2004) defines a cooperative as ―…an autonomous association of persons united
voluntarily to meet their common economic, social, and cultural needs and aspirations
through a jointly owned and democratically controlled enterprise‖.
The Kenya SACCO sub-sector comprises both deposit taking (FOSA operating
SACCOs) and non-deposit taking SACCOs. There were 6,007 registered SACCOs in
Kenya as at December 2013 of which 2,959 were active (active SACCOs are those
whose annual accounts have been audited and the audits registered by the commissioner
for cooperatives as well as the newly registered SACCOs during the year under review.
Of the active SACCOs 215 were deposits taking (SACCOs operating FOSAs), while
2,011 SACCOs were non-deposit taking (Non-FOSA operating SACCOs). The total
membership of SACCOs at Dec 2010 was 1,857,566 accounting for about 4.8% of the
total population according to (PROCASUR Africa, 2012). Deposit taking SACCOs have
81% of asset, 86% of deposits and 86% of loans compared with 19% assets, 12% of
deposits and 14% of loans respectively in Non deposit taking SACCOs in Kenya as
reported by (Njuguna, 2001). The SACCO movement in Kenya has been ranked number
one in Africa in membership, deposit mobilization and loan size for a number of years in
a raw (Kinyua, 2006; WOCCU, 2010).
The Kenya vision 2030 for financial services is to ―create a vibrant and globally
competitive financial services sector that will create jobs and promote high levels of
savings to finance Kenya overall investment needs.‖ The government of Kenya being
aware of co-operative sector potential in mobilizing savings and its wide geographical

4
distribution has strived to improve its management through legislation of various Acts
like the SACCO Society Act of 2008. Owing to the rapid growth of the SACCOs, the
SACCO Society Act of 2008 was enacted to provide for licensing, regulation and
supervision of deposit taking SACCOs through adoption of prudential and non-
prudential regulation as reported in SASRA (2010). The intention of this regulation is to
provide wider access to affordable financial services, to enhance efficiency and to
strengthen stability of deposit taking SACCOs. These SACCOs have diversified into
specialized bank like activities which include deposit taking, saving facilities, debit card
business (ATM) and money transfer business as reported in Procousor (2013). These
services increase business risk and call for prudent management and proactive strategic
stakeholder management.
The membership of deposit taking SACCOs has been growing fast in the last five years,
and so were their deposits that grew by 25% in the last five years. Kenya has the largest
membership in Africa followed by Senegal and Ivory Coast (WOCCU, 2005). A casual
observation in the subsector shows that many deposit taking SACCO have rebranded or
are in the process of rebranding and have opened their common membership bond. This
is done with intention of increasing their membership and their capital base.
The entire Co-operative sector thrives on eight core values namely: self-help,
democracy, equity, solidarity, openness, social responsibility and caring for others
(Ministry of Co-operative Development and Marketing, 2008). ICA (2004) identifies
seven principles that ought to guide the formation, organization and activities of
cooperatives: Voluntary and open membership; Democratic member control; Member
economic participation; Autonomy and independence; Education, training and
information; Cooperation among Cooperatives and Concern for Community. The
principals of member participation and concern for community would be expected to
entrench stakeholder management strategies.
The following benefits accrue from adherence to the above principles: entrepreneurs
achieve economies of scale, bargaining power and capacity to invest in more advanced

5
stages of the value chain including storage, processing, marketing and distribution of
products and services. As transaction costs are reduced, relationships with commercial
enterprises are built as observed by (Gunga, 2010). In co-operative management, co-
operation with other cooperative stakeholder is a key principal. SACCO societies for
instance subscribe to apex co-operative bodies like Kenya Union of Credit Co-operative
ltd (KUSCCO) and Co-operative Alliance of Kenya. These apex organizations help in
offering training to members, employee and board members, offer credit facilities to
SACCOs so as improve their liquidity in time of high demands for loans, aids in
managing risks and provides the role of advocacy to their affiliate SACCO members.
Cooperative Bank, another stakeholder in cooperative movement do also offer credit
facilities though at higher rate and also offer consultancy services in FOSA
establishment and management. Co-operative Bank can also be seen as a competitor by
virtue of the fact that it do offer loan to individual customer who could also be member
of SACCOs. How do deposits taking SACCOs manage various strategic groups? The
study looks at the main stakeholder management generic strategies postulated by
Scholars like (Freeman & McVea 2001; Galbreath 2006; Smakalova 2012) to see
whether they are applied in group stakeholder management and if this is the case,
whether they have any relationship with better financial performance of these Deposit
taking SACCOs.
1.2 Statement of the Problem
The co-operative sector and SACCO subsector in Kenya has immensely contributed to
financial industry and the entire economy at large. They are an important part of the
financial sector mobilization of savings; provision of credit facilities and insurance
services to a large population in Kenya (SASRA, 2013).The sector contributes to forty
five percent of nation‘s growth domestic product as reported by (MOCD&M, 2010).
The deposit taking SACCOs contributes the lion share of about 78% of the total deposit
and assets of the SACCO industry (SASRA, 2010). This critical role of SACCOs has
been recognized under vision 2030 as being crucial in mobilization of savings for

6
investment. Due to rapid growth of this sector, the government of Kenya established
SACCO legislation and begun supervision of SACCOs with a sole aim of providing
incentive for improvement of management, reducing risks and improving performance
(Ademba, 2011).
This key sector has however been found to be facing challenges on governance,
liquidity that leads to short term external borrowing, lack of comprehensive loan policy,
high level of non - performing loans, slow uptake of MIS (management Information
System) and political interference (Makori, Munene & Muturi, 2013). Ademba (2011)
observes that SACCOs in Kenya are faced by such problems as; poor governance and,
lack of members‘ confidence, among others, while Ndung‘u (2010), adds that the
SACCOs are encompassed by mismanagement and poor investment decisions that leave
many stakeholders dissatisfied.
Licensing of deposit taking SACCOs to receive deposits from members who are not
necessarily shareholders has increased the operation risks. Deposits taking SACCOs
have therefore become more like commercial banks offering several other services like
banks do. Demand for loans has increased with increasing membership hence
necessitating more transparency through good corporate governance and strategic
management of key stakeholders to increase the level of confidence and trust of key
stakeholders. While scholars have looked at the nexus of good corporate governance in
relation to SACCOs performance e.g. Okwee (2011), there has been no study in SACCO
sub sector that has looked at the relationship between strategic stakeholder management
in relation to financial performance of DTS.
Some empirical studies that looked at the nexus of stakeholder management and
profitability suggests that there is a correlation between the two (Galbreath, 2006).
These studies though did not look at generic strategies of stakeholder management in
relation to performance. Recent studies on DTS have emphasized on the effect of
regulation on the financial performance of SACCOs e.g. (Kioko, 2010; Chuno, 2013).
The four generic strategies namely swing, defensive; hold and offensive were selected

7
based on stakeholder strategy matrix postulated by (Polonsky 2004; Polonsky, Jay &
Don 200; Freeman 2010; Smakalova 2012) in management of different group
stakeholders. Corporate social responsibility strategy was also selected since companies
have responsibility towards their employees, supplies and local community as suggested
by (Drienikova & Sakal p. 165, 2012). On the other hand, Kakabadse, Rozuel and Lee
Davies (2005) argues that business has duties towards society and towards other
stakeholders. McElhaney 2009 also argues that CSR can be used as a strategy to open
new markets and to fight for more market shares from competitors.
1.3 Objectives of the Study
1.3.1 General Objective
The general objective of this study was to establish the relationship between stakeholder
management strategies and the financial performance of DTSs in Kenya.
1.3.2 Specific Objectives
1. To determine the relationship between swing strategy influence financial
performances of deposit taking SACCOs.
2. To establish the relationship between defensive strategy and financial
performance of deposit taking SACCOs.
3. To assess the relationship between hold strategy and financial performance of
deposit taking SACCOs
4. To determine the relationship between offensive strategy and financial
performance of deposit taking SACCOs.
5. To examine the correlation between corporate social responsibility strategy
influence financial performance of DTS.

8
1.4 Research Hypotheses
This study tested five hypotheses:
There is no significant relationship between Swing strategy in stakeholder
management and deposit taking SACCO financial performance.
: There is significant relationship between Swing strategy in stakeholder management
and deposit taking SACCO financial performance.
: There is no significant relationship between defensive strategy in stakeholder
management and deposit taking SACCO financial performance.
: There is significant relationship between defensive strategy in stakeholder
management and deposit taking SACCO financial performance.
3 : There is no significant relationship between hold strategy in stakeholder
management and Deposit taking SACCOs financial performance.
: There is significant relationship between hold strategy in stakeholder management
and Deposit taking SACCOs financial performance.
: There is no significant relationship between offensive strategy and Deposit taking
SACCOs financial Performance.
: There is significant relationship between offensive strategy and Deposit taking
SACCOs financial Performance.
: There is no significant relationship between corporate social responsibly strategy
and Deposit taking SACCOs‘ financial performance.
: There is significant relationship between corporate social responsibly strategy and
Deposit taking SACCOs‘ financial performance.
1.5 Significance of the Study
The SACCO subsector despite having been recognized as playing critical role in
provision of financial access in Kenya and being the largest in Africa have been under

9
studied according to (Njuguna, 2011). The SACCO subsector is worth sh. 210 billion in
year 2010 while deposit taking SACCOs had about sh. 171 billions of this amounts
(Njuguna, 2011). This study takes cognizance of the importance of this sub sector in
resource mobilization and extension of affordable credit facility, and will benefit various
stakeholders in the following ways:
The management of deposit taking SACCOs may benefit from the findings as they will
be well informed on how to manage the various stakeholder groups. They will know the
strategies to use for every group of stakeholders depending on the stakeholders‘ level of
power and interest and their relative level of threat or co-operations. Good management
of various stakeholders will create more confidence with the customers and shareholders
and enhance financial performance of deposit taking SACCOs.
Key stakeholders like customers, suppliers and shareholders may benefit from good
management and relations with SACCO management. Customers will for instance get
the value for their money from quality service provided by SACCO staff. Suppliers will
enjoy long term relationship with the deposit taking SACCO management that will be
beneficial to both. Shareholders may benefit from higher returns that come with good
stakeholder management. It will also increase the value of their shares hence making
them better off.
The community around may benefit from the findings and recommendation of the study
in that deposit taking SACCOs are likely to increase the appropriation for corporate
social responsibility. Communities in need are likely receive more attention and funding
from deposit taking SACCOs that will enhance their welfare. Deposit taking SACCOs
may increase their motivation to take care of the ecology like the environment and
endangered animal species.
This study may be significant to the government ministry and agencies like SASRA on
how SACCOs should relate with stakeholders to enhance their profitability and stability.
Further, since SACCO subsector is a key pillar in the economy, the study may be
important in that it will assist in mobilizing savings for investment. Therefore, the

10
study‘s findings will be important in that it will guide in policy and regulation
formulation aimed at enhancing growth of the co-operative sector.
Further, the study may be of importance to scholars and academicians alike. This study
identified gaps for further research which future researchers will seek to fill. The study
will contribute to the pool of knowledge in stakeholder management in SACCOs by
enhancing stakeholder strategies that can be used in managing various groups of
stakeholders. This will help in enhancing DTSs performance and in creating value to
those stakeholders.
1.6 Scope of the Study
This study focuses on the relationship between stakeholder management generic
strategies and the financial performance of Deposit taking SACCOs in the Kenya. The
study focused on 180 deposits taking SACCOs in Kenya that are licensed and registered
by SASRA. These are SACCOs that provide Front office services and are also registered
to receive deposits from their customers. The study focused on deposit taking SACCOs
rather than non-deposit taking because the former have large capital base to engage in
corporate social responsibility and faces more risks since they are licensed to take
customers‘ deposits. The list is given in appendix three. Deposits taking SACCOs that
are registered by the ministry of trade and industrialization but not licensed by SASRA
are omitted in this study.
1.7 Limitations of the Study
Data collection faced a number of challenges. The respondents were busy with their
work schedules and therefore time spent answering the questionnaires were considered
by some respondents as wasted. The study administered the questionnaires through drop
and pick later method to allow them fill them at their free time. Another limitation was
that financial performance is not a consequence of only three variables. There are other
variables that together with strategies would enhance financial performance of deposit

11
taking SACCOs. However, study focus was on generic stakeholder management
strategies only. Deposit taking SACCO‘s financial performance was based on three
parameters namely Return on Assets, Return of Equity and Liquidity (Liquid Assets to
Total Assets). Furthermore the study focused on only 180 deposit taking SACCOs that
are licensed. There are 215 deposit taking SACCOs some of which are not licensed by
SASRA. The reason why they are not yet licensed by SASRA was because they had not
yet fulfilled some requirements, and the researcher felt that such respondents would fear
to divulge some information. These forty five SACCOs were therefore omitted, while
they could have increased the sample size.

12
CHAPTER TWO
LITERATURE REVIEW
2.1 Introduction
This chapter looks at the theoretical background of the study. It looks at the stakeholder
management theory, corporate social responsibility and resource – base theory as
postulated by scholars. It gives the conceptual framework of the study and reviews the
variables used in the conceptual framework. It gives empirical studies done in this area,
critique of previous studies and establishes the research gap.
2.2 Theoretical Review
The theoretical underpinning of this study is enriched by three theories. These theories
informed the study variables that formed the conceptual framework. The theory includes
Stakeholder theory, Corporate Social Responsibility theory and Resource – Base theory.
Corporate Social Responsibility is postulated to be a subset of Stakeholder theory
2.2.1 Stakeholder Theory
The term stakeholder was traditionally defined as ―any group or individual who can
affect or is affected by the achievement of the organization‘s objectives‖ (Freeman,
2010). Johnson and Scholes (2002) define stakeholders as those individuals who depend
on the organization to fulfill their own goals and on whom, in turn, the organization
depends on. Freeman‘s definition is applied in this study as it is widely used. An
organization has internal and external stakeholders and the level of influence to
unilaterally determine the strategy of an organization depends on the level of power and
interest that the stakeholder holds or possibility of cooperation or threat from such
stakeholders.

13
Stakeholder Management is stakeholders‘ relationships management. The idea of
stakeholder management suggests that managers must formulate and implement process
which will satisfy all and only those groups who have a stake in the business Freeman
and Mcvea (2001). It is built on partnering mentality that involves communicating,
contracting, managing partnership and motivating as postulated by (Friedman & Miles,
2006).
There are three approaches to stakeholder management: normative, descriptive and
instrumental. Normative stakeholder theory approach identifies the moral or
philosophical guidelines linked to the activities or the management of corporation
(Fontain et al, 2006).The aim of descriptive branch is to understand how managers deal
with stakeholders and how they represent their interests. It looks at how they represent
their interests and the impact of the stakeholder approach in the achievement of various
corporate goals Galbreath (2006). Instrumental Approach on the other hand study the
organizational consequences of taking into account stakeholders in management
examining the connections between the practice of stakeholder management and the
achievement of various corporate governance goals. Polonsky, Jay and Don (2005)
observe that understanding the link between the application of given strategies to engage
stakeholders and outcomes is critical in so far as improvement in outcomes infers that
the correct strategy has been applied and these strategies have been applied successfully.
Stakeholder theory suggests that by management addressing stakeholders‘ interests, the
organization will perform better than those organizations that do not address these
groups‘ interest Post et al (2002). The instrumental perspective for instance postulates
that better stakeholder relationships result in higher profitability or increased firm value.
Organizations will need to be concerned with those stakeholders who work hard to make
strategy successfully implemented and on those who will seek to sabotage the successful
management of the strategy. ―The best way to eliminate an enemy is to make him a
friend‖ the saying goes. Stakeholder analysis and management has a utilitarian aim of
identifying stakeholders who will, or can be persuaded to support actively the strategy of

14
the organization as postulated by Eden and Ackermann (2011). Why should
organizations pay attention to stakeholders? Pragmatically, this is because it helps with
the competing demands being made on organizations by many stakeholders. It
recognizes and enables management of the interactions that exist between stakeholders.
It acknowledges the influence that both internal and external stakeholders can have and
increases the likelihood of change and realization of aspirations as noted by (Eden &
Ackermann 2011). Stakeholder management theory gives four strategies that
organizations can use to manage different categories of stakeholders namely: offensive,
swing, hold and defensive strategies. This informed our choice of four of the
independent variables in this study.
2.2.2 Corporate Social Responsibility Theory
―Corporate Social Responsibility is a concept whereby companies integrate social and
environmental concerns in their business operations and in their interaction with their
stakeholders on a voluntary basis‖ as defined by (European Commission, Green Paper
2001). Scholars have viewed CSR as a sub set of stakeholder theory. A majority of
scholar share a view that CSR should be a duty of every corporate body to protect the
interest of the society at large. Even though the main motive of business is to earn profit,
organizations should take initiative for welfare of the society and should perform its
activities within the framework of environmental and ethical norms.
Ragan, Chase and Karim (2012) have divided CSR into three categories. The first CSR
category focuses on philanthropy, either in the form of direct funding to non- profit and
community service organizations, employee community service projects, or in-kind
donations of products and services to nonprofits and underserved populations The
second category focuses in reengineering the value chain. The priority in this category of
CSR is increasing business opportunities and profitability, while also creating social and
environmental benefits, by improving operational effectiveness throughout the value
chain be it upstream in the supply chain or downstream in the distribution chain. The
third CSR category focuses on transforming the ecosystem is emblematic of wide scale

15
and disruptive change to a corporation‘s business model that puts the priority first on
crafting a solution to a societal problem, which would then lead to financial returns in
the longer run. This is a fundamental departure from the incremental and self-interested
change of Theatre 2 initiatives that are focused primarily on increasing profits.
Drienikova and Saka‘l (2012) posit that to reach the win-win or successful CSR strategy
in a company, all the stakeholders must be included into the responsible business. Every
element of the relationship (company-stakeholder) must be satisfied. Strategic
philanthropy can create new market opportunities, improve social relations and take
advantage of opportunities for innovation (Porter & Kramer, 2002). More evidence has
shed light on a positive relationship between CSR programs and (long-term) economic
performance (Post et al., 2002; Margolis & Walsh, 2003; McAdam & Leonard, 2003).
The most researched and proven financial benefit of effective CSR is found in the area
of human resource and talent management, reputation and branding, and in operational
cost savings according to (McElhaney, 2003). John G. Taft, CEO of RBC Wealth
Management-USA for instance interviewed his employees and observed that the CSR
programs helped to develop better employees. He observed that CSR helps in improving
employee morale, and deepening the firm‘s ties to the many communities in which it
operates. This theory stipulates that corporate social responsibility can be applied as a
strategy and hence the choice of CSR strategy independent variable.
2.2.3 Resource-Based Theory
One of strategic management theories is resource – base theory, the theory stipulates that
the firm is made up of resources and capabilities. These resources and capabilities are
made up of human, physical, financial, and intangible assets. Organization can translate
its resources and capabilities into a strategic advantage if they are valuable, rare, and
inimitable and if the firm is organized to exploit these resources. According to
Grants (2001), the firm‘s most important resources are those that are durable, difficult to
imitate and in which the firm possesses ownership and control. Resource – based view

16
(RBV) posits that the sustainability of a firm success depends upon the creation,
development and implementation of an organization‘s unique resources and capabilities
(Lopez-Carbarcos & Monteiro, 2005).
Strategy is the matching of the resources and activities of an organization to the
environment in which it operates (Johnson & Scholes, 2006). Strategy has been defined
as the match an organization makes between its internal resources and skills and the
opportunities and risks created by the external environment (Grant, 2001). Therefore
even with application of corporate and business strategy, for the organization to perform
well financially, it ought to develop unique capabilities for it to have competitive
advantage relative to the competition in the industry. Several authors when referring to
the resource – Based View focuses more on the strategic context, presenting resources
and capabilities as essential go gaining competitive advantage and to superior
performance and growth of organization (Janney & Dess, 2010; Teece, 2009).
Resource – Based theory describes a firm in terms of the resources that the firm
integrates. Frequently, the term resource is limited to those attributes that enhance
efficiency and effectiveness of the firm for enhanced growth. Resources can be tangible
or intangible in nature. Tangible resources include capital, access to capital and location
(among others). Intangible resources consist of knowledge, skills and reputation,
entrepreneurial orientation, among others. Resources are insufficient for obtaining a
sustained competitive advantage and a high performance (Teece, 2009; Tuan & Yoshi,
2010). Being so, firms must be able to transform resources in capabilities, and
consequently achieve good financial performance and growth. Firms reach a superior
performance, not because only they have more or better resources, but also because of
their distinctive competences (those activities that a particular firm does better than any
competing firms) allow to do better use of them.
In relation to this study, strategies cannot be implemented without the necessary
resources, for instance for management information system to be installed, the human
resource may need to be trained to acquire the necessary skills. Hillman & Keim argue

17
that building better relations through strategic stakeholder management could lead return
on assets by helping firms develop intangible assets that can be a source of competitive
advantage. The management should therefore select strategy which best exploit the
firm‘s resources and capabilities relative to the external opportunities and threats for the
intended objective to be achieved.
2.3 Empirical Review
Past studies on stakeholder management suggest that organizations that address their
stakeholders' interests will somehow perform better than firms that do not address these
groups' interests (Smakalova, 2012 & Post et al., 2002). However, very few studies have
explicitly considered the specific strategies that are applied to manage stakeholders'
interests.
2.3.1 Offensive Strategies
Firms engage in offensive strategies to enhance their own competitive position by taking
market share away from rivals. Offensive strategies include direct and indirect attacks or
moving into new markets to avoid incumbent competitors (Yonnopoulus, 2011). Firms
that possess superior resources may consider direct attack to their rival‘s market.
However, if a firm faces superior rivals, indirect attacks would be more appropriate than
direct, frontal attacks as observed by Yonnopoulus (2011). Direct attacks invite
retaliatory responses especially if they pose a serious threat to the defending firm (Lee,
2014). Indirect attacks are difficult to detect and as such, they are less likely to elicit a
competitive response, this is especially so if they are targeted towards non-core products
or segment. Offensive strategies can take many forms. This may include flanking
attacks, bypassing the competition, or frontal attacks intended to defeat the competition
with all available means at the attacker‘s disposal as observed by Yoffie and Kwak
(2001) and Polonky et al (2005).

18
Frontal attack is an offensive strategy that involves attacking a competitor head-on.
Frontal attacks can be pure frontal attacks by going after the customers of the attacked
firm with similar products, prices, promotion, and distribution. Such attacks can be very
risky; however, victory is never assured unless the aggressor has a clear competitive
advantage over the defendant (Yonnopoulus, 2011). Frontal attacks can be price-based
where the attacker matches the rival‘s product in terms of features and quality but it
offers a lower price. Frontal attacks can also be modified to a value - or quality based. It
can involve challenging rivals with products that offer superior value or quality at
competitive prices
A flanking attack is an offensive strategy used to exploit an opponent‘s weaknesses
while avoiding the risks associated with other offensive strategies such as frontal attacks.
Flank attacks are based on the principle of the path of least resistance, attacking
competitors in areas which they are least capable of defending (Yonnopoulus, 2011). For
example, a firm can attack its rival‘s in areas they do not give adequate attention
probably because they do not see them as important enough to warrant more attention, or
they are less profitable than other segments. If competitors offer poor service or
unpalatable terms to their customers, flanking firms could exploit this opportunity by
improving service and offering better terms as observed by Karakaya and Yonnopoulus
(2011). If the incumbent‘s products are offered at exorbitant prices for instance, a
flanking firm could offer its product at lower prices especially if they have managed to
keep average cost of production low.
Strategic encirclement involves targeting and surrounding a competitor with the purpose
of completely defeating it (Yonnopoulus, 2011). The strategic objective of encirclement
strategies is to dominate the market. These strategies involve for instance surrounding a
competitor with several brands and forcing it to defend itself on many fronts at the same
time Karakaya and Yonnopoulus (2011). By so doing, the defenders are most likely to
spread their resources over many products and markets, making it harder to defend all of
them successfully at the same time.

19
This strategy is often employed by a larger firm against a smaller firm that is perceived
as a threat to the larger firm or to the industry as whole.
A predatory strategy typically entails accepting lower profits for the purpose of keeping
new competitors out, or inflicting damage on existing rivals and forcing them to exit the
market (Yonnopoulus, 2011). This strategy could take the form of predatory pricing with
intention of eliminating a rival, with the expectation those prices will be raised again,
after competitors have exited the industry. A predator operating in many markets may
lower prices selectively in markets with intense competition, and use profits from less
competitive markets to finance the price cuts as postulated by Dudik (2000). If
successful, low pricing by the predator can make the rival to exit the market. However,
in order for predatory pricing to be successful, the opponent must be financially weak.
Otherwise, charging low prices against financially strong competitors could prompt
aggressive response with disastrous results for both companies. In oligopolistic markets
for instance, firms prefer employing non price strategies like promotion and aggressive
marketing, being innovative and differentiation of their products or services so as to
protect their profit margins. It is also important that the predator has some sort of cost
advantage if for instance they employ cost leadership strategy through economies of
scale, lower overhead, lower cost of capital, and extra production capacity to
accommodate the increased volume of sales.
On another different dimension, offensive strategy should be adopted when a group is
supportive as observed by Smakalova (2012). Stakeholders with a high cooperative
potential and low threatening potential were classified as offensive by Freeman and
Mcvea (2001). He suggested that the firm should adopt offensive strategies to bring
about the cooperative potential and therefore the stakeholder's positive orientation is
exploited. Galbreath (2006) focused on this stakeholder's supportive potential
(Supportive stakeholders) and suggested that by involving these stakeholders in
corporate activities their support could be leveraged. According to a case study done by
Smakalova (2012) on generic stakeholder strategy in the area of marketing, companies
should adopted offensive strategy to supportive stakeholders like customers, employees,

20
suppliers and managers. These stakeholders according to him can either help or defend
activities of companies therefore strategy for treatment with these stakeholders
(customers, suppliers) should be to lay in effort to change or at least influence decisions
according to the way company cooperate with stakeholders. The organization should try
to maximize positive influence of stakeholders and minimize their threat. The firm
should make decisions to involve stakeholders in decision making as observed by
Mishra and Suar (2010).
2.3.2 Defensive Strategy
The primary purpose of defensive strategy is to make possible attacks not attractive or to
discourage competitors from attacking the incumbent firms‘ market. It is intended to
protect market share, position and profitability enjoyed by the incumbent firms. It is a
strategy that can be used to keep up top position in local and existing market as observed
by Yonnopoulus (2011). Defensive strategy is mostly successful in keeping up the
customer‘s confidence. Defensive strategies work better when they take place before the
challenger makes an investment in the industry, or if they enter the industry before exit
barriers are raised, making it difficult for the challenger to leave the industry
(Yonnopoulus 2011). Dudik (2000) suggests organization should apply effective warfare
strategies and tactics to business for them to succeed in a competitive market structure.
Markides (2000) contends that the essence of business strategy is to allow a company to
create and exploit a unique strategic position in its industry. Pre-entry defensive
strategies are actions taken by firms intended to persuade potential entrants to believe
that market entry would be difficult or unprofitable. Such actions include signaling,
fortify and defend, covering all bases, continuous improvement, and capacity expansion
(Yonnopoulus, 2011). Organizations can use signaling to alert their competitors about
their intention to take an action in the industry. This is intended to preempt or deter
competitors from attacking their market territories and showing the commitment they
have in the particular market. Therefore, threat of retaliation can be employed by the
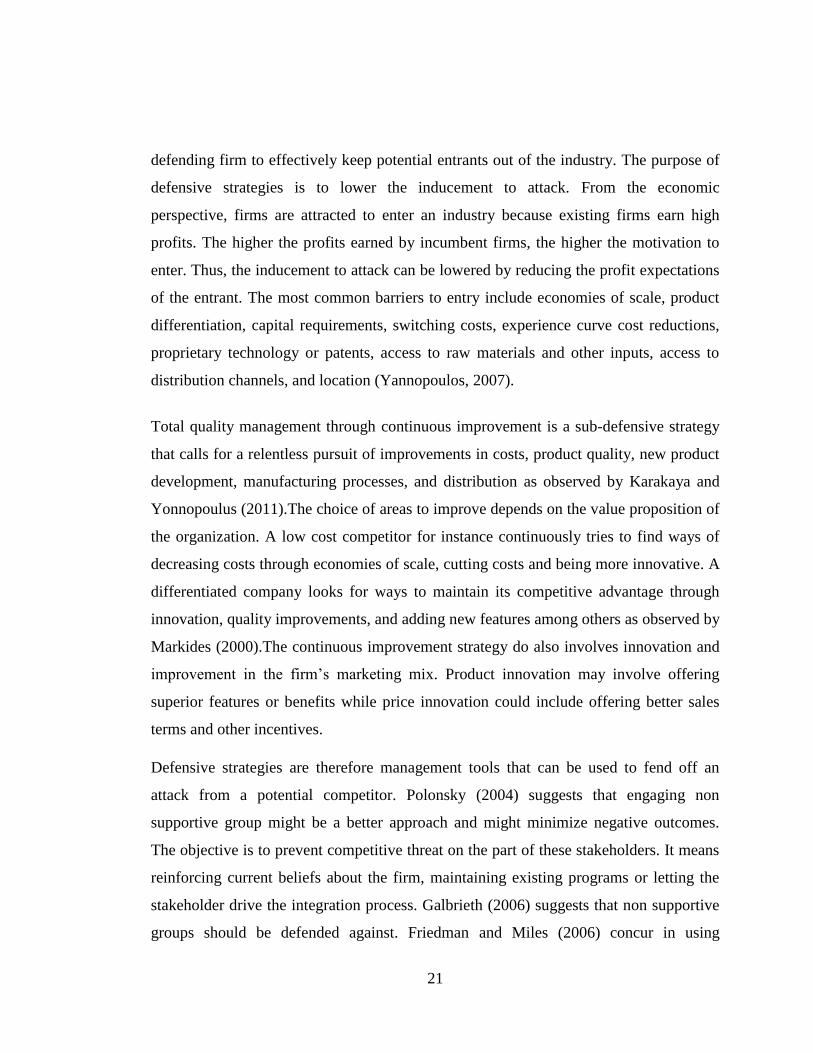
21
defending firm to effectively keep potential entrants out of the industry. The purpose of
defensive strategies is to lower the inducement to attack. From the economic
perspective, firms are attracted to enter an industry because existing firms earn high
profits. The higher the profits earned by incumbent firms, the higher the motivation to
enter. Thus, the inducement to attack can be lowered by reducing the profit expectations
of the entrant. The most common barriers to entry include economies of scale, product
differentiation, capital requirements, switching costs, experience curve cost reductions,
proprietary technology or patents, access to raw materials and other inputs, access to
distribution channels, and location (Yannopoulos, 2007).
Total quality management through continuous improvement is a sub-defensive strategy
that calls for a relentless pursuit of improvements in costs, product quality, new product
development, manufacturing processes, and distribution as observed by Karakaya and
Yonnopoulus (2011).The choice of areas to improve depends on the value proposition of
the organization. A low cost competitor for instance continuously tries to find ways of
decreasing costs through economies of scale, cutting costs and being more innovative. A
differentiated company looks for ways to maintain its competitive advantage through
innovation, quality improvements, and adding new features among others as observed by
Markides (2000).The continuous improvement strategy do also involves innovation and
improvement in the firm‘s marketing mix. Product innovation may involve offering
superior features or benefits while price innovation could include offering better sales
terms and other incentives.
Defensive strategies are therefore management tools that can be used to fend off an
attack from a potential competitor. Polonsky (2004) suggests that engaging non
supportive group might be a better approach and might minimize negative outcomes.
The objective is to prevent competitive threat on the part of these stakeholders. It means
reinforcing current beliefs about the firm, maintaining existing programs or letting the
stakeholder drive the integration process. Galbrieth (2006) suggests that non supportive
groups should be defended against. Friedman and Miles (2006) concur in using

22
defensive strategy for this group of stakeholder. Defending business strategically that the
organization is in is about knowing the market it operates in and about knowing when to
widen firm‘s appeal to enter into new markets. Defensive strategies are about holding
onto what the organization have and using competitive advantage to keep competitors at
bay (Bradley, 2014). The companies should adopt defensive strategy for competitors. In
this case it is better to keep this group of stakeholders for friends than enemies although
the company has very small benefit from them.
2.3.3 Swing Strategy
Swing strategy as provided in stakeholder management is scantly reviewed in strategic
management literature and most of what is available is about stock trading in stock
exchange. However, scholars who have looked at stakeholder management strategies by
use of stakeholder management matrix posit that these strategies should be adopted
when a group is a mixed blessing. The firm has to take decisions such as changing or
influencing the rules of the game that governs stakeholder interaction, the decision
forum and the transaction process as observed by Smakalova (2012). Freeman, the
founding father of stakeholder management theory suggests that stakeholders with high
cooperative and high threatening abilities are mixed blessing stakeholders who firms
should collaborate with to maximize their positive influencing abilities and minimizes
threatening abilities. This group of stakeholder can either assist or hinder organizational
capabilities. Freeman (2001) suggested that those with high cooperative and threatening
abilities are Swing stakeholders, as these stakeholders can either assist or hinder
organizational activities.
Strategies for dealing with Swing stakeholders should ―seek to change or influence the
rules of the game that govern stakeholder interactions‖ (Freeman, 2001, p. 144).
Polosky, Jay and Don (2005) argue that definition of this group as Mixed Blessing
stakeholders is more appropriate, and that firm should collaborate with these

23
stakeholders to maximize their positive influencing abilities and minimize threatening
abilities.
2.3.4 Hold Strategy
Hold strategies involves maintaining position or programs, it involves monitoring this
group of stakeholder for changes in their position. Hold strategy according to
Smakalova (2012) should be adopted when a group is marginal. The company should
continue with its current strategic program when managing stakeholders with low co-
operating and low threatening are less important.
The start of any stakeholder engagement process is stakeholder mapping. Stakeholder
strategy matrix model can help to inform managers on strategy to use on different
stakeholder groups. In other words, a stakeholders' position in the two‐dimensional
matrix allows the firm to determine the most appropriate strategies for managing
firm‐stakeholder relationships as postulated by Johnson and Schoels (2012).This is
arrived at after stakeholder analysis is done to determine the relative cooperative
potential and relative threatening potential of different stakeholders. The organization
can also change its behavior to address stakeholder concern and try to reinforce this
stakeholder‘s belief as postulated by Galbreath (2006) and Smakalova (2012).
Literature has scantly reviewed this strategy probably because it involves doing little
(just holding the position or program). However, as the adage in politics goes ―silence is
also a weapon‖. Your opponent may not know what you are planning by just monitoring
the situation. Again the opponent poses little threat and are not interested in
collaboration and as Smakalova 2012 observes, hold strategies should by adopted if a
stakeholder group has a relatively low competitive threat and cooperative potential.
2.3.5 Corporate Social Responsibility Strategy
Baker (2003) posits that CSR is about how companies manage the business processes to
produce an overall positive impact on society. World Business Council for Sustainable

24
Development (WBCSD, 2004), argued that CSR is the commitment of a business to
contribute to sustainable economic development, working with employees, their
families, the local community and society at large to improve their quality of life.
Reviewing various research done in CSR, Kakabdse, Ruzuel and Lee- Davies (2005)
postulates that business has duties towards society and more specifically towards
identified constituents (i.e. stakeholders).
Drienikova and Saka‘l (2012) observe that to reach the win-win or successful corporate
social responsibility strategy in a company, all the stakeholders must be included into
the responsible business. Every element of the relationship (company-stakeholder) must
be satisfied. Mc Elhaney (2003) suggests that CSR can be used as an effective strategy
to recruit and retain top talent, which has obvious positive implications to the firm‘s
bottom line. Serves and Tamay (2013) in their study shows that corporate social
responsibility and firm value are positively related for firms with high customer value.
They show that in certain circumstances, CSR enhances the value of the firm, but in
others, it could destroy value, suggesting that some firms should adhere to the
stakeholder model, and others can consider broader model as Jensen (2001) portends.
Kakabadse and Rozuel (2005) postulates that the concepts of CSR and stakeholder
approach are intertwined; they studied the two approaches together in theory and in
practice, in order to reposition their underlying principles into a broader assessment of
the relationships between business and society. CSR have evolved along two avenues
(Lee, 2008): In terms of the level of analysis, researchers have moved from a discussion
of the macro social effects to an organizational-level analysis of CSR and its impact on
organizational processes and performance. In terms of the theoretical orientation of this
field, researchers have shifted from explicitly normative and ethics-oriented arguments
to implicitly normative and performance-oriented managerial studies.
McElhaney (2009) observes in most business CSR is executed in an ad hoc and
nonintegrated fashion and in most case it is initiated from all parts of an organization
and is rarely directed to what the company knows best. She posits that organizations

25
should instead seek causes and social environmental strategies to achieve intended
objectives. On the same line of argument Browne and Nuttall (2013), think that
traditional approach to corporate social responsibility (CSR) may fail to deliver, for both
companies and society. They suggest that executives need a new approach to engaging
the external environment. They believe that the best approach is to integrate external
engagement deeply into business decision making at every level of a company. They
argue that without the active participation of the big-spending functions—typically,
production and marketing—the ambitions of a central team on CSR are difficult to
realize. Second, centralized CSR teams can easily lose touch with reality—they are
likely to take too narrow a view of the relevant external stakeholders. Third, CSR
focuses too closely on limiting the downside. Companies often see it only as an exercise
in protecting their reputations—to get away with irresponsible behavior elsewhere.
However, effective external engagement is much more than that: it can attract new
customers, motivate employees, and win over governments. Finally, CSR programs in
most cases tend to be short-lived. Because they are separate from the commercial
activity of a company, they survive on the whim of senior executives rather than the
value they deliver (Browne & Nuttal, 2013). CSR programs are therefore vulnerable
when management changes or when appropriation budget is reduced.
As a stakeholder-oriented concept, CSR holds that organizations exist within networks
of stakeholders, face the potentially conflicting demands of these stakeholders, and
translate the demands into CSR objectives and policies. In some cases, organizations
may use same strategy to change stakeholders' expectations or views as postulated by
Lamberg et al. (2003). To achieve the successful implementation of corporate social
responsibility, Andriof and Waddock (2002) posit that managers ought to build good
relationships with their stakeholders – through formal and informal dialogues and
engagement practices – in the pursuit of common goals, and convince them to support
the organization's chosen strategic course. Business leaders need to address the moral
complexities that result from the multitude of stakeholder claims and build enduring,
mutually beneficial relationships with relevant stakeholders (Mark, 2007).

26
2.3.6 Financial Performance of SACCOs
Financial performance is the dependent variable in the study. The objective of SACCO
Societies is member empowerment through saving mobilization, disbursement of credit
and ensuring SACCOs‘ long term sustainability through prudent financial practices
according to (Mudibo, 2005). According to Mwau (2013), the objective of Credit Unions
(SACCO Societies) is to provide a yard stick upon which SACCO performance can be
measured. Return on asset is an overall measure of profitability that reflects both the
profit margin and the efficiency of institutions. It gives an indication on how efficient
institutions are in utilizing their assets.
SASRA adapted CAMEL as their benchmark for rating SACCO performance. It has
proven to be an effective tool for evaluating the soundness of a financial firm (SASRA,
2013). It is an acronym for capital adequacy, asset quality, management and liquidity.
The rating of 1 to 5 is used, where 1 is strongest and 5 is weakest. Some of these
benchmarks were adapted in this study to gauge financial performance of DTS. Capital
adequacy according to SASRA is depository risk derived from the sudden and
considerably large scale of deposit withdrawals. Asset quality is measured in terms of
non – performing loans less provisions as a percentage of loans (SASRA, 2010).
According to Grier (2007), poor asset quality is the major cause of most bank failures.
The greatest risk is that of loan loss derived from delinquent loans. According to
SASRA regulation, non- performing loans are those loans that have been outstanding for
a period of over 30 day or over two installments. An increase in the percentage of non-
performing loan to total loan portfolio is an indicator of declining asset quality (SASRA,
2010)
The rating of management focuses on the capability of the Board of Directors and senior
management in respect to their responsibilities. Their ability to respond to changing
business conditions and introduction of relevant products are important factors in good
performance. Availability of internal and external audit function forms the parameter for
rating the management (SASRA, 2010). Grier (2007) suggests that the management is

27
considered to be the single most important element in the CAMEL rating system. The
rating on earning though not in the Act and regulations are measured in terms of return
on asset (ROA) expressed as surplus (Profit before interest on deposits and tax) as a
percentage of total assets (SASRA, 2010). The rating manifests adequacy of the current
and future earnings to guard against erosion of capital due to potential changes in
economic environment and even business plan. WOCCU (2005) looked at profitability
of credit unions. It stated that credit unions sought to generate profits in order to directly
benefit the owners as they (members) serve as both the owners of the credit union and
the recipients of the credit union services. Chuno (2013) observes that the most common
financial measures for performance are Return of Assets (ROA), Return on Investment
(ROI) and Return on Equity (ROE).
Liquidity gauges the ability of a SACCO to meet its obligation as they fall due. It is
measured in terms of the ratio of liquid assets to deposits and short term liabilities. The
minimum statutory ratio of 15 percent is required to be maintained (SASRA, 2010).
Liquidity is crucial for financial institutions because they are particularly vulnerable to
unexpected and immediate payment demands. To stay in business, a SACCO must be
able to pay out legitimate withdrawals and credit requests instantly (Bald, 2007).On the
other hand, Deshpande (2006) observed that excess liquidity in financial institutions
limited gives incentives to mobilize additional deposits especially poor people‘s
deposits, which tended to be perceived a priori as short term, unstable, and costly. At the
institutional level, excess liquidity may be caused by a lack of suitable lending
opportunities (real or perceived). Liquidity adopted in this study is given as liquid asset
divided by total assets. It was used in this study as a balancing mechanism where high
financial performance but law liquidity is not ideal and therefore penalized when
average of the three are taken. On the other hand, high liquidity but with poor financial
performance is also not ideal and is pulled down when averaged with the other two
parameters i.e. Returns on Equity and Returns Assets.

28
2.4 Conceptual Framework
Conceptual framework is a group of concepts that are broadly defined and
systematically organized to provide focus, a rationale, and a tool for the integration and
interpretation of information (Cooper & Schindler, 2006). It is a diagrammatic model
that explains the relationship between two sets of variables, the dependent and
independent variables. Smith (2004) defines a conceptual framework as a framework
that is structured from a set of broad ideas and theories that helps a researcher to
properly identify the problem they are looking at to frame questions and find suitable
literature. Conceptual frameworks represent an integrated understanding of issues,
within a given field of study, which enables the researcher to address a specific research
problem (Imanda, 2014). The assumption made here is that only strategic management
of stakeholder influences performance of DTSs and that other factors remain constant. It
is further assumed that there is a direct relationship between adoption of stakeholder
management strategies and financial performance of DTSs as postulated by Galbreath
(2005). Other scholars who assume direct relationship is Hillman and Keim (2001) who
posit that building relations with primary stakeholders like employees, supplies, and
communities could lead to increased shareholder wealth by developing intangible assets
that can be a source of competitive advantage. The conceptual framework shown in
Figure 2.1 is a schematic diagram which illustrates the relationship between dependent
and independent variables.

29
Figure 2.1: Conceptual framework
Independent Variables Dependent Variables
Offensive strategy
Collaboration with stakeholders
Participatory management, increase
awareness
Refocusing stakeholders‘ objectives
Hold strategy Monitor stakeholders for change of
position
Retaining current position
Retain current programs
Change organizational behavior
CSR strategy
Integration of social concerns in business
operation, open partnership.
Environmental steward ship
Engaging in voluntary programs
Swing Strategy Influence or change rules of the game
Collaborate to minimize threatening
ability and maximize their positive
ability.
Modify stakeholders belief about the
firm.
Maintain dialogue
Defensive strategy
Defending the organization
Diversify into new markets
Introduce new products, retaliate,
Reduce dependence on competitors
Financial Performance
of:
Return on Asset
(ROA)
Return on Equity
(ROE)
Liquidity

30
2.5 Critique of the existing Literature Relevant to the Study
Smakalova (2012) and Galbreath (2006) have researched in the area of stakeholder
management strategies relevant to this study. Smakalova looked at generic stakeholder
strategy as relating to marketing strategy. The research involved 14 industry companies
as a sample. However the researcher did not give us the sampling frame, or the sampling
technique used in arriving to the sample of fourteen firms. Galbrieth (2006) sought to
establish in his study whether primary stakeholder management positively affected
bottom line. However, he did look at the specific stakeholder management strategies but
the management aspect of it. He focused on corporate governance and employee
management and ignored other stakeholders and also failed to look on strategies used in
managing the stakeholders.
The central claims for an integrated approach to stakeholder engagement arguably centre
primarily on benefits to the organization – essentially on the view that ―incorporating
stakeholder views in decision-making processes enhances organizational performance
and commitment‖ (Simmons, 2003). However, despite development of this literature,
stakeholder management generic strategies as extended by Freeman (2010) from the
Porter‘s framework of generic competitive strategies is scantly explained in the literature
and little is documented as to whether they give competitive advantage to firms
practicing them or lead to better performance. The stakeholder management and CSR
concepts have not been tested in co-operative sector context where the shareholder is
also the customer and where co-operations are highly encouraged among the
stakeholders.
2.6 Research Gaps
A vast amount of empirical research has been conducted in developed countries on
strategic management and financial performance of firms and their evidence is that
effective and efficient stakeholder management is crucial for long term (financial)
business sustainability, for example: (Adriof & Wadock, 2002; Hubber, Scharioth &

31
Pallas 2004; Gabreath 2004). Evidence shows that the direct influence of customer
retention on profitability is surprisingly high at 10% – 20% (Hubber, Scharioth & Pallas,
2004). However, empirical study on relationship between stakeholder management
strategies and financial performance of firms in developing countries is lacking. As a
result, scholars have also noticed that literature on these stakeholder generic strategies is
also very scanty and need further development (Simmons, 2003; Eden & Ackermann,
2011; Smakalova, 2012).
Studies done in SACCO subsector have mainly focused on challenges facing SACCOs
for example: (Makori, Munene & Muturi, 2013) and effects of regulatory authority on
financial performance (Kioko, 2010 & Wanyoike, 2013). Okwee (2011) came closer by
studying the nexus between corporate governance and financial performance of
SACCOs in Lango sub region in Uganda. Most recent research studies on deposit taking
SACCOs focused on financial performance as an independent variable in relation to
other attributes. For example: James, Ondieki and Musiega (2014) focused on effect of
interest rates on deposit mobilization among SACCO members in Kakamega County,
Kinyuira et al (2014) looked at the Influence of strategic organizational components on
the performance of deposit taking Savings and Credit Cooperatives in Kenya while
Njeru et al (2015) looked at effect of cash management on financial performance of
deposit taking SACCOs in Mount Kenya region.
Recent studies done on stakeholder management have mainly focused on CSR and
governance of sports e.g. (Breitbarth, Walzel, Angnostopoulos & Ekeren 2015;
Giulianotti, 2015; Levermore & Moore 2015; Kolyperas, Morrow & Sparks 2015).
However, Kiric, Kuley and Uyar (2015) looked at the impact of ownership and board
structure on CSR. Their study did not look at relationship between CSR and
performance of firms. Blair (2015) study presents a stakeholder management perspective
that incorporates a classification of type of stakeholder strategies for dealing with each
type of stakeholder. His study however focused on the area of military health. In the
cooperative sector, there are no empirical studies done to look at the relationship

32
between stakeholder management strategies and performance. This study therefore
aimed to establish the relationship between stakeholder management generic strategies
on one hand and deposit taking SACCOs‘ financial performance. It examined whether
effective stakeholder management has any significant influence on financial
performance of deposit taking SACCO.
2.7 Summary
Stakeholder management theory has three main perspectives; normative, descriptive and
instrumental. The instrumental approach studies the connection between stakeholder
management and achievement of firm‘s objectives. Corporate social responsibility
theory has been categorized by Ragan, Chase and Karim (2012) into philanthropy,
reengineering the value chain and transforming the ecosystem. Resource – Base Value
theory posits organization can translate its resources and capabilities into a strategic
advantage if they are valuable, rare, and inimitable and if the firm is organized to exploit
these resources. Hilman and Keim (2001) argue that building relations with primary
stakeholders could lead to increased shareholder wealth by helping firm develop
intangible assets that can be a source of competitive advantage.
Stakeholder management is paramount in making organization management to pay
proper attention to all its stakeholders and in decision making. It acknowledges the
influence that both internal and external stakeholders can have and increases the
likelihood of change and realization of organization‘s aspiration (Eden & Ackermann,
2011). Literature study reviews five main strategies used in the management of internal
and external stakeholders in the instrumental and descriptive theory branch of
stakeholder management. They include defensive, offensive, swing, hold and corporate
social responsibility strategies as postulated by (Mishra & Suar, 2010; Eden &
Ackermann, 2011; Smakalova, 2012). This research study sought to fill the research gap
by critically looking at these stakeholder generic strategies in SACCO subsector where
shareholder is also the customer and whether they have any relationship with the
financial performance of deposit taking SACCO.

33
CHAPTER THREE
RESEARCH METHODOLOGY
3.1 Introduction
This chapter discusses the research plan used in the study. It explains the research design
used, the target population, sample size and sampling techniques. It also discusses the
research instruments, data collection procedures used. Finally, it explains how data was
collected and analyzed.
3.2 Research Design
A research design is a systematic plan to study a scientific problem. Kombo and Tromp
(2006) defined research design as the scheme outline or plan that is used to generate
answers to research problems. The design of a study defines the study type is
descriptive, analytical, correlation, semi – experimental, review, meta- analytic and sub-
types such as descriptive-longitudinal case study and experimental design and statistical
analysis plan (Creswell, 2009). This study employed descriptive design. A descriptive
study describe or define a subject, often by creating a profile of a group of problems,
people, or events, through the collection of data and tabulation of the frequencies on
research variables or their interaction (Cooper & Schindler, 2003).
The descriptive design was chosen since it describes the basic features of the data in the
study. Descriptive research design was also used since it would provide statistical
summaries about the sample and measures and provide graphic analysis which forms the
basis of virtually every quantitative analysis of data. Descriptive research design as
portended by Mugenda and Mugenda (2003) aims at producing accurate representation
of persons, events and situations. Descriptive survey design guarantees breadth of
information and accurate descriptive analysis of characteristics of a sample which can be
used to make inferences about population as observed by Orodho (2002). Descriptive

34
survey research was used to allow for gathering of information, summarizing,
presentation and interpretation of data for purpose of clarification (Orodho, 2002).
Descriptive design was employed because the study involved coming up with inferential
statistics. Inferential statistics were used in testing hypothesis and the research model. It
was also used to make inferences from the data to a more general condition through
employment of a mathematical model to determine the relationship between the generic
stakeholder management strategies and financial performance of deposit taking
SACCOs.
3.3 Target Population
Kothari (2004) defines population as the research universe. A target population is the
totality of cases conforming to the designated specifications as required by the study and
could be people, events or things of interest. It is a group of individuals, items or objects
from which a sample of study will be obtained and to which the results will be inferred
(Kombo & Tromp, 2006). He defines population as a group of individual objects or
other items from which samples are taken for measurement. The population of this study
is the 180 licensed and registered deposit taking SACCOs operating in the county from
the list provided by SASRA in their website.
Random sampling of all Deposit taking SACCOs gave 64 SACCOs out of a sampling
frame of 180 DTSs. Sampling was done per regions for equal representation as shown in
Table 3.1.

35
Table 3.1: Target population
Region Target Population (No of DTSs)
Nairobi
Central
Eastern
Western
Nyanza
Rift Valley
North Eastern
Coast
41
30
33
11
13
36
3
13
Total 180
3.4 Sampling Techniques and Sample Size
3.4.1 Sampling Frame
Sampling frame as defined by Nachmias and Nachmias (2008) is a list of all items where
a representative sample is drawn for the purpose of a study. The sampling frame in this
study is the 180 SACCOs that are licensed and registered by SASRA as deposit taking
societies in Kenya. The accuracy of statistical inference based on samples depends on
the adequacy of samples and sampling methods (Mugenda & Mugenda, 2003). Borg and
Gall (2007) define a sample as a subgroup carefully selected so as to be representative of
the whole population with the representative of the whole population with the relevant
characteristic and sampling characteristic and sampling as the process of selecting a
number of individuals in such a way that they represent the large group from which they
were selected.

36
3.4.2 Sampling Technique and Sample Size
The study used stratified random sampling to identify the subgroups in the target
population and their proportions for selecting a sample size to show the representation
within the group. According to Orodho (2009), stratified random sampling is considered
appropriate since it give all the respondents an equal chance of being selected and thus
has no bias and eases in generalization of the obtained finding.
Sampling was based on a model believed to be objective by providing a sample large
enough to reduce on random sampling errors by applying the formulae:
n =
n =
= 64
Where:
n is the sample size
N is the population
C is the coefficient of variation (0.5)
e is the level of precision (0.05)
(Nachmias & Nachmias, 2008)
The sample size of the number of Deposit taking SACCOs sampled per every region of
the country is given in table 3.2. The study used provincial administration demarcation
previously used in government administration since demarcation by counties would give
very many geographical regions. Classification by counties was also not considered
appropriate because some counties do not have deposit taking SACCOs but only non
deposit taking SACCOs. From the table, Nairobi region has the largest share of DTSs
with 41. It is followed by the Rift valley region with 36 DTSs. North Eastern region has
the least number of DTSs at 3 and therefore, only one DTS was selected from that

37
region. The sample size was randomly selected and the sample size per region related
with the number of deposit taking SACCO in that region.
Table 3.2: Sacco Sample Size
Region No of DTSs Sample Size
Nairobi
Central
Eastern
Western
Nyanza
Rift Valley
North Eastern
Coast
41
30
33
11
13
36
3
13
14
10
12
4
5
13
1
5
Total 180 64
The study targeted senior managers and executive directors from deposit taking
SACCOs since they are the one who are involved in formulating and implementing
firm‘s strategies. Other categories of human resource were omitted since they do not
formulate strategies. From a sample 64 deposit taking SACCOs, there was a population
of 512 respondents comprising of senior managers and executive directors. The total
number of executive directors was 256, while the total number of senior manager was
also 256. The sample size of the number of respondents to interview was computed
using Nachmias and Nachmias, (2008) equation. This gave a sample size of 130
respondents comprising of 65 executive directors and 65 senior managers. This is shown
in table 3.3.

38
Table 3.3: Number of Respondents
Category Population Sample
ratio
Sample Size of
Respondents
Executive Directors 256 3:3 65
Senior Managers 256 3:3 65
Total 512 3:3 130
3.5 Data collection Instruments
Scientific inquiry demands that researchers develop tools that yield accurate and
meaningful data to enable the making of a decision (Mugenda, 2008). The study used
matrix questions in the questionnaire to collect data, which incorporated qualitative and
quantitative data. The study used both secondary and primary data. Questionnaire was
however the main source of primary data because it provides detailed individual
feedback. Self administered questionnaires befit large enquiries and are free of bias
because they are respondent – only based and they enhance the rate of response
(Kothari, 2004). Interview guide was used to collect secondary data that was used to
compute financial performance of DTSs under study.
The questionnaire includes an introductory note explaining the purpose of the study. The
questionnaire was divided into sections, in line with the study objectives. A modified
five point Likert scale was used to measure interval data where ―one point‖ score meant
that the respondent strongly disagrees with the question statement while a ―five point‖
means the respondent strongly agrees with the question statement according to Kothari
(2004). Secondary data was corrected by scrutinizing the audited accounts of the deposit
taking SACCOs.

39
3.6 Data Collection Procedures
Competent research assistants who are well versed in the area of study and in various
geographical regions were recruited for the exercise. They were first briefed on the
information being gathered by thoroughly going through the questionnaire. The
researcher administered the questionnaire personally to the respondents. A total of 130
questionnaires were administered to the respondents. Field editing of the data was done.
Editing of data is the process of examining the collected raw data to detect errors and
omissions and to collect this when possible as observed by Allan and Emma (2003).
This type of editing is necessary in view of the fact that individual writing styles often
can be difficult to decipher. It should be done as soon as possible after the interview,
preferably on the same day or on the next day (Kothari, 2004). To collect secondary
information, an interview was done with either the general manager or finance manager.
Secondary data was obtained through an interview with general manager or any other
available senior managers and audited account for years under study was requested for
scrutiny to capture the data required returned. Scrutiny of the audited accounts was
paramount in ensuring that secondary data was accurate for the intended purpose.
3.7 Pilot Study
Pilot testing is the first phase in data gathering of the research process according to
(Marczyk, Dematteo & Festinger, 2005). It is a small experiment designed to test
reliability and validity and gather information prior to a large study in order to improve
the latter quality and efficiency. Muus and Baker – Demaray (2007) observes that pilot
test should draw subjects from target population and stimulate the procedures and
protocols that have been designed for data collection.
The researcher carried out a pre-testing of the instruments on 20 respondents sampled
from 10 SACCOs that were not included in the sample in a bid to ensure consistency
and comprehensiveness. The pre-testing was done to help detect weaknesses and
ambiguities for purposes of correcting the instrument before actual data collection. This

40
helped to ensure that questions are sound and in line with the study. The result of the
pilot study on all items was compiled.
3.7.1 Reliability
Reliability according to (Borg and Gall, 2003) is the degree to which a research
instrument yields consistent results or data after repeated trials. Determining reliability
and validity is called for in order to determine whether the relationships in the
conceptual frame work are stable and accurate or not, and whether they truly measure
what they set out to measure as observed by (Kemutai, Gchunga, Wanjau & Gichuhi,
2014).
Joppe (2000) defines reliability as ―the extent to which results are consistent over time
and an accurate representation of the total population under study is referred to as
reliability‘‘ If the results of a study can be reproduced under a similar methodology, then
the research instrument is considered to be reliable. Split-half reliability is estimated by
taking half of your test, instrument, or survey, and analyzing that half as if it were the
whole thing. Then, you compare the results of the analysis with your overall analysis.
There are different variations of this technique, one of the most common being called
Cronbach's alpha (a frequently reported reliability statistic) which correlates
performance on each item with overall score. Cronbach‘s Coefficient Alpha was
computed to determine how items correlate among themselves. A high coefficient would
imply that there is consistency among the items in measuring the concept of interest
(Mugenda & Mugenda, 2003).
The data collected was then coded and Statistical Package for Social Sciences (SPSS)
used to generate two key pieces of information. The output included ―Correlation
Matrix‖ and ―View alpha if item deleted column‖. The latter helped to determine if
alpha can be raised by deletion of items. Items that would substantially improve
reliability would be deleted (i.e. if their deletion help improve alpha). However after
analysis of Cronbach‘s Alpha, the result did not necessitate any item to be deleted. This

41
was the case since Alphas were all above 0.9 and was therefore considered acceptable
reliability. However, questions were reworked to improve on reliability while one
question that was omitted by 80% of the respondents in pilot study possibility because of
its sensitivity was dropped.
3.7.2 Validity of the Instruments
Mugenda and Mugenda (2003) defines validity as the accuracy and meaningfulness of
inferences which are based on the research results. Validity refers to the appropriateness,
meaningfulness and, usefulness of evidence that is used to support the interpretations
(Cooper & Schindler, 2003). Validity is the degree to which results obtained from
analysis of the data actually represent the phenomenon under study. It is correctness and
reasonability of data.
Validity refers to getting results that accurately reflect the concept being measured.
Establishing validity for a survey testing focuses on the use to which the instrument is
put, not on the survey itself (Tashakkori & Teddlie, 2003). Validity is important in
determining whether a measurement tool measures what it claims to measure. These
elements are crucial if the aims and objectives of the entire study are to be achieved
(Creswell, 2009). Validity is established using a panel of experts and a field test. The
type of validity (content, construct, criterion, and face) to use depends on the objectives
of the study. The researcher need to consider the following questions: Is the
questionnaire valid? In other words, is the questionnaire measuring what it intended to
measure? Does it represent the content? Is it appropriate for the sample/population? Is
the questionnaire comprehensive enough to collect all the information needed to address
the purpose and goals of the study? Does the instrument look like a questionnaire?
Addressing these questions coupled with carrying out a readability test enhances
questionnaire validity (Esposito, 2002).
The questionnaire was also presented to a group of five academics for feedback to
enhance content validity. Data collection was carried out within a one month period.

42
Participants were also invited to comment on the clarity of the language and logical
organization of the questionnaire items. They were encouraged to provide
recommendations and endorsements for the final version of the instrument. The Pearson
product moment correlation was used to describe the strength and direction of the linear
relationship between independent and dependent variables in the study (Kothari, 2004).
Correlation analysis studies joint variation of two or more variables. Pearson‘s
Correlation Coefficient (‗r‘) was used as a measure to determine the level of correlation
between two variables. The results were reported in the correlation tables and scatter
diagrams.
3.8 Data Analysis and Presentation
3.81 Data Analysis
Data analysis is a practice in which raw data is ordered and organized so that useful
information can be extracted (Borg & Gall, 2007). While qualitative data was analyzed
through content analysis, quantitative data was analyzed using descriptive statistics,
measure of central tendency, measure of dispersion and inferential statistics. Multiple
regression analysis was carried out to establish the relationship between the independent
and dependent variables as prescribed by various scholars (Faraway, 2002; Cohen, West
& Aiken 2003). Regression was preferred because it has ability to show whether there is
a positive or a negative relationship between independent and dependent variables
(Castillo, 2009). In addition regression would show whether the identified relationship is
significant or not. Pearson correlation was used to measure the degree of association
between variable under consideration that is, the independent and dependent variable.
The outcome was predicted by the model:
Y = α + + + + + + ε
Where Y= Financial Performance Measurement

43
α = constant (Intercept)
β = slope (gradient) showing rate dependent variable is changing for each unit
change of the independent variable.
= Offensive Strategy
= Defensive Strategy
= Swing Strategy
= Hold Strategy
= Corporate Social Responsibility Strategy
ε = Error Term
3.8.2 Data Presentation
Data was presented using summary statistics, tables and figures. Summary statistics gave
percentages, averages and the dispersion like variance or standard deviations.
Regression analysis using SPSS gave output in tables like the coefficient of
determination, ANOVA, residual statistics and other inferential statistics. Statistical
results were presented in a vivid form using charts. According to (Monga, 2007), an
appropriate chart can give a clear, truthful and easily understandable picture of the facts
contained in the data. The objectives of constructing charts is to get a quick view of the
data for understanding and remembering the nature and trend of the data; to compare
with other data and charts; to analyze data for further study; to check the accuracy of
certain computational results to make it easier to notice incompatibility from the trend in
the chart and just to present the data in an alternative form.

44
Table 3.4: Operitionalization of Variables
Variable Definition Measurement key variables
Offensive strategy
to supportive groups
A well chosen and
considered guidelines
adopted to a supportive
group of stakeholders
Changing stakeholders‘ objective or
perception
Refocusing stakeholders‘ objective
Collaborate with this stakeholder
Increase awareness
Involvement in strategy and policy
development
Hold strategy for
marginal stakeholder
A well chosen and
considered guidelines
adopted to a group that
is marginal stakeholder
Hold current position and continue their
current strategic program
Monitor them for change in their position,
beliefs, behavior and attitude
Change organizational behavior to address
stakeholder‘s concern
Reinforce this stakeholder‘s belief about the
SACCO
Defensive strategy
for
non-supportive
stakeholders
Strategy adopted when a
group is non supportive
stakeholder and is used
to fend off attacks from
potential competitors
Defend the organization against competitors
Prevent competition on the part of this
stakeholder Diversify into new market
Introduce new products
Reduce dependence from these stakeholder if
they are stronger
Swing strategy for
mixed
Blessing stakeholder
Well chosen and
considered guidelines
adapted to a group that
is a mixed blessing.
Influence or change the rule of the game that
govern the relationship
Collaborate with the group to maximize their
positive ability and minimize their
threatening abilities
Modify stakeholder‘s belief about the firm
Corporate Social
Responsibility
Is a concept whereby
companies integrate
social and
environmental concerns
in their business
operations with their
stakeholders on a
voluntary basis
The four dimensions of CSR captured by
(Dahlsrud, 2006):
Environmental stewardship and activates to
make environment cleaner
Integrating social concerns into business
operations to contribute to a better society
Engagement in voluntary programs based on
ethical values Seeking to satisfy all
stakeholders
Financial
Performance
of deposit taking
SACCOs
Level of achievement of
an organization‘s profit
objectives
Return on Assets (ROA).
Return on Equity (ROE)
Liquidity

45
3.9 Hypothesis Testing
A hypothesis is a statement or assumption concerning a population. The procedure
which, on the basis of sample results, enable us to decide whether a hypothesis is to be
accepted or rejected is called Hypothesis testing or Test of Significance (Monga, 2007).
A hypothesis has to be verified then accepted or rejected for decision making. The
hypothesis to be tested is called the Null Hypothesis and is denoted by Ho. This is tested
against other possible states of nature called alternative hypothesis (H1). The null
hypothesis implies that there is no difference between the statistic and the population
parameter. In hypothesis testing we make some inference about population parameters
like the mean, the proportion etc. An assumption is made that the sample data come
from a normal population. However, if the population is not normal or normality
assumption is not proper, then parametric tests cannot be done Mugenda and Mugenda
(2002)
Hypotheses were tested using Analysis of variance (ANOVA) which separates the
variance ascribable to one group from variance ascribable to other groups. By using this
method, we were able to test whether the difference between the mean of three or more
populations are significant or not. The ANOVA technique was also be used to test the
linearity of the regression line fitted to the data and hence its preference. The regression
output using SPSS gives a one way classification table at 1% degree of freedom. The
parameters given in the ANOVA table are the sum of squares, mean square, degree of
freedom, F statistics and significance level. The last two statistics were used to test and
decide whether to reject or fail to reject the Null hypothesis.
To address the first research hypothesis, the study checked whether the regression
coefficient of swing strategies ( ) was positive (+) and significant (p values of ‹ 0.05)
in line with theory and study expectations. Since it was positive and significant, then the
study concluded that the presence adoption of swing strategy in stakeholder management
influenced the financial performance of deposit taking SACCOs.

46
To address the second research hypothesis, the study checked whether the regression
coefficient of defensive strategies ( ) was positive (+) and significant (p value of ‹
0.05) in line with theory and study expectations. Since it was positive, then the study
concluded that adoption of defensive strategies by the management of deposit taking
SACCOs influenced the performance of these SACCOs.
To address the third research hypothesis, the study checked whether the regression
coefficient of hold strategies ( ) was positive (+) and significant (p value of ‹ 0.05) in
line with theory and study expectations. Since it was positive and significant, the study
concluded that adoption of hold strategies by the management influenced the financial
performance of deposit taking SACCOs.
To address the fourth research hypothesis, the study checked whether the regression
coefficient of offensive strategies ( ) was positive and significant (p value ‹ 0.05) in
line with regression theory and study expectations. Since it was positive and significant,
the study concluded that adoption of offensive strategies by the management positively
influenced the financial performance of deposit taking SACCOs in Kenya.
To address the fifth research hypothesis, the study checked whether the regression
coefficient of corporate social responsibility strategies ( ) was positive and significant,
(P value ‹ 0.05) in line with theory and study expectations. Since it was positive and
significant, the study concluded that adoption of corporate social responsibility strategies
by management positively influenced the financial performance of deposit taking
SACCOs in Kenya.
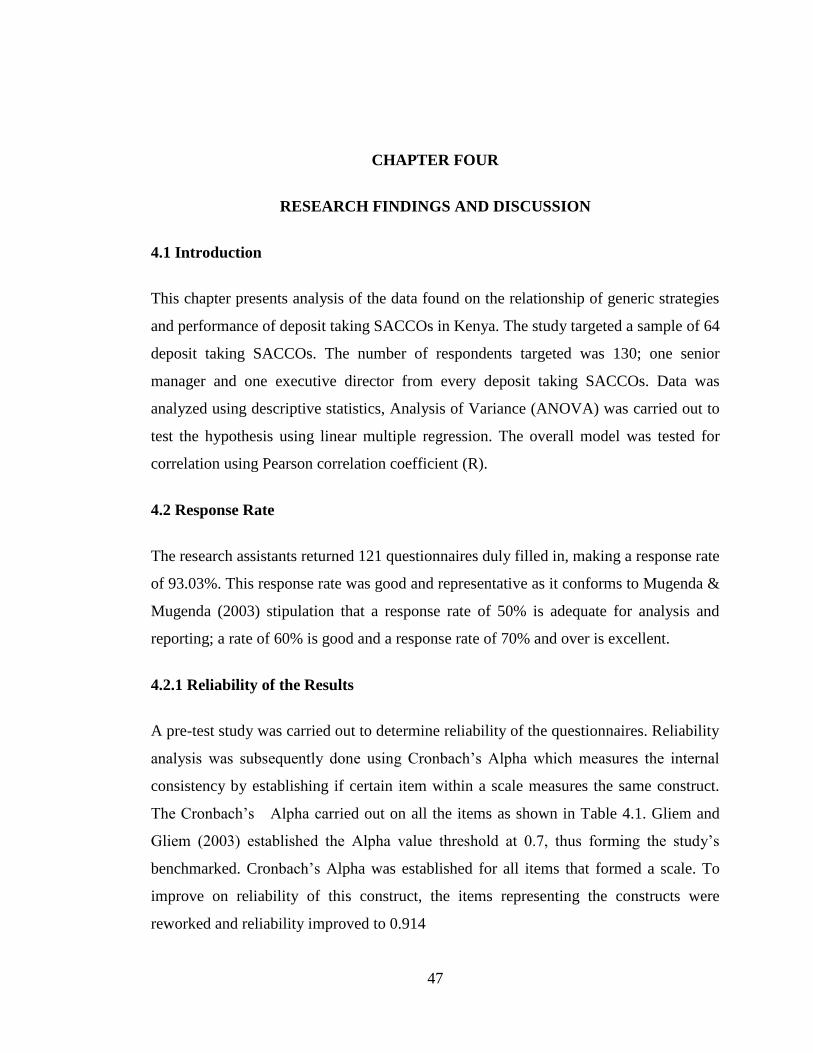
47
CHAPTER FOUR
RESEARCH FINDINGS AND DISCUSSION
4.1 Introduction
This chapter presents analysis of the data found on the relationship of generic strategies
and performance of deposit taking SACCOs in Kenya. The study targeted a sample of 64
deposit taking SACCOs. The number of respondents targeted was 130; one senior
manager and one executive director from every deposit taking SACCOs. Data was
analyzed using descriptive statistics, Analysis of Variance (ANOVA) was carried out to
test the hypothesis using linear multiple regression. The overall model was tested for
correlation using Pearson correlation coefficient (R).
4.2 Response Rate
The research assistants returned 121 questionnaires duly filled in, making a response rate
of 93.03%. This response rate was good and representative as it conforms to Mugenda &
Mugenda (2003) stipulation that a response rate of 50% is adequate for analysis and
reporting; a rate of 60% is good and a response rate of 70% and over is excellent.
4.2.1 Reliability of the Results
A pre-test study was carried out to determine reliability of the questionnaires. Reliability
analysis was subsequently done using Cronbach‘s Alpha which measures the internal
consistency by establishing if certain item within a scale measures the same construct.
The Cronbach‘s Alpha carried out on all the items as shown in Table 4.1. Gliem and
Gliem (2003) established the Alpha value threshold at 0.7, thus forming the study‘s
benchmarked. Cronbach‘s Alpha was established for all items that formed a scale. To
improve on reliability of this construct, the items representing the constructs were
reworked and reliability improved to 0.914

48
Table 4.1: Reliability of the Results
Construct No of items Cronbach’s alpha Comment
Use of stakeholder
management concept
6 .916 Reliable
Offensive strategy 6 .874 Reliable
Hold strategy
7 .934 Reliable
Defensive Strategies 8 .930 Reliable
Swing strategies 6 .924 Reliable
CSR Strategies 10 .902 Reliable
Financial performance 5 0.917 Reliable
Overall 0.914 Reliable
In order to understand whether the questions in the questionnaire were all reliably
measuring the same variable, a Cronbach's alpha was run on a sample size of 20 top
managers and executive directors. Table 4.1 shows a Cronbach‘s Alpha of 0.914 of all
items in the questionnaires. This implies that the research instrument is reliable and
collects the information that is intended for this study. Cronbach‘s alpha result of above
0.7 shows excellent internal consistency (George & Mallery 2013).
Alpha coefficient ranges in value from 0 to 1 and may be used to describe the reliability
of factors extracted from dichotomous (that is, questions with two possible answers)
and/or multi-point formatted questionnaires or scales (i.e., rating scale: 1 = poor, 5 =

49
excellent). The higher the score, the more reliable the generated scale is. Gliem & Gliem
(2003) has indicated 0.7 to be an acceptable reliability coefficient but lower thresholds
are sometimes used in the literature.
Validity on the other hand refers to whether a measurement tool measures what it claims
to measure. These elements are crucial if the aims and objectives of the entire study are
to be achieved (Creswell, 2009). The questionnaire was also presented to a group of five
academics in the same area of specialization for feedback to enhance content validity.
Data collection was carried out within a one month period. A small number of
participants in the pilot study were also invited to comment on the clarity of the
language and logical organization of the questionnaire items. They were encouraged to
provide recommendations and endorsements for the final version of the instrument.
4.2.2 Normality Tests for the Dependent Variable
Skewness refers to lack of symmetry in a distribution. In a positively skew distribution
the longer tail is usually on the right side and the mean is on the right of the median. In a
negatively skew distribution the longer tail is on the left and the mean is on the left of
the median. Results presented in Table 4.2 revealed that skewness coefficient for
financial performance was between -1 and +1 implying that the financial performance
variable had a negative skewness. Zero skewness implies that the data is perfectly
normal. Kurtosis is a measure of peakedness of distribution. It shows the degree of
convexity of a frequency curve. The Kurtosis coefficient of -1.108 (almost = 0) was
reported, implying that the distribution curve was platykurtic. The skewness and
Kurtosis coefficients indicated that the dependent variable was normally distributed and
that the possibility of outliers was minimal. Furthermore, it implied that the data was
ideal for all types of analysis, including parametric and regression analysis.

50
Table 4.2: Normality Test for the Dependent Variable
N Minimum Maximum Std.
Deviation
Skewness Kurtosis
Statistic Statistic Statistic Statistic Statistic Std.
Error
Statistic Std.
Error
average
financial
performance
121 6.493187 12.601032 1.805267877 -.494 .220 -1.108 .437
Valid N
(listwise)
121

51
A histogram of the financial performance variable was fitted with a normal distribution
curve as shown in Figure 4.1. The histogram and normal curve confirmed the skewness
statistics by revealing that the tail of distribution was longer to the left of the mean
(negative skewness). This implied that there were chances of outliers being located to
the left of the mean. However, the outliers were minimal since the tail was not very long.
Figure 4.1: Histogram on Financial Performance
The criterion for normal distribution can also be interpreted as the degree to which the
plot for the actual values coincides with the straight diagonal line of expected values.
For financial performance dependent variable, the plot of residuals fits the expected
pattern well enough to support a conclusion that the residuals (error) are normally
distributed. This is shown in Figure 4.2 that shows that the predicted values are close to
actual values. The actual is shown with a straight diagonal line. We can therefore
conclude that errors are not systematic and deviations are only random. This implies that
distribution of dependent variable is normal.

52
Figure4.2: Normal P-P Plot of Regression Standardized Residuals
4.3 Demographic Data
This section presents data on demographic information of the respondents. The study
sought to find the demographic information of the respondents which included the
gender, age, highest academic qualification and work duration of the respondents. This
was important as it formed the foundation under which the study was fairly adopted in
coming up with conclusions. The analysis relied on this information from the
respondents in categorizing the different results according to their acquaintances and
responses.
4.3.1 Gender of the Respondent
Further, the study sought to determine the gender distribution of the respondents in order
to establish if there was gender balance in the management. The findings are reported in
Figure 4.3. From the findings, the study established that the majority of respondents
were males at 72.73%, while females were 27.27% of the respondents are female. This

53
therefore implied that there are more male senior managers and executive directors in
deposit taking SACCOs than female in Kenya. The gender distribution was below the
constitutional of Kenya (2010) threshold of a one third.
Figure 4.3: Gender of the respondent
4.3.2 Age Category of the Respondents
The study further sought to establish the age distribution categorization of the
respondents. This was meant to determine how age relates with decision making related
to the type of strategy to use based on experience. The study found that the most of the
respondents were between 31 and 40 years as shown by 45.5%. Those aged 40 years and
above were represented by 42.1%. Those aged between 21 to 30 years were represented
by 11.6% while below 20 years were paltry 0.8%. This is as shown in Table 4.3. This
therefore shows that majority of the respondents were aged above 30 years. This implies

54
that most of the employees in management were experienced enough to give appropriate
answers concerning stakeholder management in their respective SACCOs.
Table 4.3: Age category frequency
Age Frequency Percent
under20 1 .8
21-30 14 11.6
31-40 55 45.5
Above40 51 42.1
Total 121 100.0
4.3.3 Number of Years Worked
Further, the study sought to establish the work duration of the respondents in their
SACCOs. This was to determine if their responses could be relied upon to make study
conclusions about variables under consideration due to their longevity in the
organization.
From the findings reported in Table 4.4, most of the respondents (42.1%) indicated that
they had worked in their SACCOs for 5 to 7 years, 38% said that they had worked in
their SACCOs for over 7 years. Further, 15.7% indicated that they had worked in their
respective organization for 3 to 5 years while 3.3% said that they had worked for less
than 3years. This therefore indicates that majority of the respondents (96.7%) had stayed
in the organization for more than 3 years and therefore were well informed on
stakeholder management strategies used in their SACCOs.

55
Table 4.4: No of Years worked
No. Years Frequency Percent
less than 3yrs 4 3.3
3-5 19 15.7
5-7 51 42.1
Above 7yrs 46 38.0
5 1 .8
Total 121 100.0
4.3.4 Education Level of the Respondents
The section sought to determine the respondents‘ level of academic qualification. The
researcher also requested the respondent to indicate their highest level of the academic
qualification. This was meant to ascertain if they were well equipped with the necessary
knowledge and skills in management of their organizations. From the findings shown in
Table 4.5, most of respondents were postgraduates as shown by 47.1% of the
respondents, 43.8% had undergraduate degree, while 9.1% had diplomas as their highest
level of academic qualification. This points towards the fact that majority of the senior
managers and executive directors were graduates (90.9%) while 9.1% had diplomas. The
findings therefore indicate that the respondents had the capacity, the skills and
management acumen to come up with the ideal strategies to manage the various groups
of stakeholders as the need arises.
56
Table 4.5: Academic qualification of the respondent
Level of Education Frequency Percent
Diploma 11 9.1
undergraduate 53 43.8
postgraduate 57 47.1
Total 121 100.0
4.4 Profile of Licensed Deposit Taking SACCOs
The profile of licensed deposit taking SACCOs that were studied is given on three
characteristic namely: category of number of members who patronize the SACCO‘s
products and services, the asset size owned by SACCOs and their membership based.
The latter are the teacher- based, government employee - based, Private Companies
employees -based, and farmers - based, community- based and open membership. The
latter captured deposit taking SACCOs that had allowed other members other than their
core members.
4.4.1 Categorization on SACCO Membership
The size of deposit taking SACCOs in relation to the number of members who patronize
SACCO‘s services as shown in Table 4.6. It shows that most of representatives SACCOs
have membership in the category of 30,001 to 45,000 at 27.2%; followed closely by
membership of 45,000 and above at 26.4%, 24.8% have members between 15001 and
30,000, while below 15,000 members were 18.4%.

57
Table 4.6: SACCO Membership
Membership Frequency Percent
0-15,000 23 18.4
15,001-30,000 31 24.8
30,001-45,000 34 27.2
45,001- Above 33 26.4
Total 121 96.8
4.4.2 Categorization Based on Source of Members
SACCO membership base is shown in Table 4.7 that show all the six categories were
represented in the study. Open membership is slightly high at 21.5% followed by teacher
based SACCOs at 18.2%, government based at 17.4%, farmer based SACCOs at 15.7%,
community base at 14.9% and private organization employees based SACCOs at 12.4%.
The study finding implied that many SACCOs have opened up their common bond with
intention of increasing membership. This shows that the study was not biased in
studying few categories and that all types of SACCOs were well represented in the
study. The study can therefore make generalization of all licensed deposit taking
SACCOs in Kenya.

58
Table 4.7: Category of SACCO Membership Base
Membership
Category
Frequency Percent
Teacher Based 22 18.2
Government Based 21 17.4
Private Based 15 12.4
Farmer Based 19 15.7
community Based 18 14.9
Open membership 26 21.5
Total 121 100.0
Table 4.7 shows that most of the deposits taking SACCOs that were picked as
representatives had open membership. This was followed by teacher based SACCO and
government based SACCOs in that order. This happens to be a new trend that is
intended to increase the Sacco‘s membership and consequently volume of business. This
would consequently increase business and enhance financial performance.
4.4.3 Categorization Based on Deposit Taking SACCOs’ Assets
A majority of SACCOs studied have asset base of below one billion in Kenya Shillings
at 54.5% Those with asset of between one billion and 3.5 billion were 33.1%, those with
above 3.5 billion in value of assets were only 12.4% . Therefore those with asset worth
one billion and below were the majority at 54.5%. This is shown in Table 4.8. This
implied that deposit taking SACCOs have played a great role in mobilization of assets in
Kenya. It also implied that virtually all deposit taking SACCOs could afford to engage
in corporate social responsibility activities for the benefit of the communities around
them and the ecological environment.

59
Table 4.8: Category on Asset Size
Assets Frequency Percent
Below 1 billions 66 54.5
1billion - 3.5 billion 40 33.1
3.5 billion and
above
15 12.4
Total 121 100.0
4.5 Descriptive Statistics on Use of Stakeholder Concept
This section sought to determine whether the management of deposit taking SACCOs
were employing stakeholder management concept in management of their stakeholders.
Management concept or philosophy was captured by asking questions to determine
whether the organizations had entrenched the concept in their management as postulated
in the stakeholder management theory. This is shown in Table 4.9.
Table 4.9: Stakeholder Management Concept
Research Statement Disagree
%
Not Sure
%
Agree
%
Strongly Agree
%
involve key stakeholders 0.8 26.4 47.1 25.6
Employees allowed to own
shares
9.1 18.2 53.7 19
Stakeholders categorized
into groups
0.8 27.3 41.3 30.6
Different strategies used
for different groups
1.7 14.0 39.7 44.6
Level of engagement
depends on stakeholders‘
interest and power
2.5 25.6 39.7 32.2
Involved in CSR with
community around
3.3 24.0 47.1 25.6

60
4.5.1 Involvement of Key Stakeholders in Planning
This question sought to establish the extent of involvement of Key stakeholders when
formulating their plans. No respondent strongly disagreed that they engage key
stakeholders in formulation of strategic plan. Those who disagreed were 0.8% while
those who agreed were 47.1%. Those who strongly agreed were 25.6% while those who
were not sure were 26.4%. Therefore, those who agreed with the statement that
management engaged key stakeholders like employee, supplier, and government agents
like the ministry official in planning were 72.7%. This implied that participatory
management concept is employed in management of key stakeholders.
The research findings agree with Greenfield (2004) who postulates that participative
management instills a sense of pride and motivates employees to increase productivity in
order to achieve their goals. Employees who for instance participate in the decisions of
the company feel like they are a part of a team with a common goal, and find their sense
of self-esteem and creative fulfillment heightened. Participation helps employees gain a
wider view of the organization. It also increases the commitment of employees to the
organization and the decisions they make.
4.5.2 Employees are allowed to own Shares
This question sought to establish whether employees are allowed to own part of firm
share where they work. Deposits taking SACCOs have been allowed to separate shares
from customers‘ deposits by SACCO Regulatory ACT of 2008. From the findings, no
respondent strongly disagreed but 9.1% disagreed with the statement that employees are
allowed to own share. Those who held middle ground were 18.2%. Those who agreed
that employees are allowed to own SACCOs equity were 53.7% while those who
strongly agreed were 19%. Therefore those who are agreed to the statement were 72.7%.
This implies that employees being organizations‘ key stakeholders are given an
opportunity to own part of the equity and are therefore motivated to work even harder.

61
Employee share ownership is viewed by some as a potential means of enhancing
industrial democracy or of bringing the employee into corporate governance Bagchi
(May, 2005). Many small businesses have trouble attracting and retaining good
employees. Using employee ownership as an employee benefit can be an important way
to address this problem. Pendleton (2001) argues that employee share ownership is one
such incentive mechanism by which organizations can reduce costs through more
closely aligning the interests of employees with those of other stakeholders in the
company. Employees can receive shares that give only voting rights, only equity rights,
or both, and with any percentage of the total voting or equity stake. Employees can be
allowed to resell their shares freely, or resale can be limited for any reasonable business
purpose. If employees buy shares, the company must obtain an exemption from
securities registration.
4.5.3 Categorized Stakeholders into Groups
The question sought to establish whether the management categorized their stakeholders
into different groups in trying to find out whether stakeholder management concept is
employed. From the finding 0.8% disagreed but no management strongly disagreed with
the statement. The percentage of those who were not sure was 27.3%. Those who agreed
were 41.3% and those who strongly agreed were 30.6%. Therefore, 71.9% of the
management categorized their stakeholders into different categories. This implied that
stakeholder management concept is employed in the deposit taking SACCOs.
This agrees with the stakeholder management strategy model as first postulated by
Freeman, the father of stakeholder management in his 1984 work and reproduced by
Polonsky, Jay and Don (2005). Their argument is that stakeholders are better managed
by first categorizing them into groups depending on the relative cooperative potential
and the relative threatening potential so as to know the specific strategy to employ.
Johnson and Shoels (2002) uses a management stakeholder matrix that segment
stakeholders on their relative power and the relative level of interest for ease of

62
management. Both of these two approaches were seen to apply by Sacco management in
management of stakeholders.
4.5.4 Different Strategies Used for Different Groups
This question sought to know whether the management used different strategies when
managing different groups of stakeholders. No management strongly disagreed with the
statement. Those who disagreed were 1.7%; those were not sure were 14% while those
who agreed were 39.7%. Those strongly agreed were 44.6%. Therefore the total
percentage of the management who agreed to employing different strategy to different
stakeholder groups was 84.3%. This implied that stakeholder management concept or
philosophy is employed in deposit taking SACCOs and that the research was necessary.
The research findings agree with Smakalova (2012) who did a research on stakeholder
management matrix. He found out that different strategies were applied by management
to manage different categories of stakeholders. Offensive strategy was used to manage
supportive stakeholders like employees, other managers and suppliers. Hold strategies
were used on stakeholders with low co-operative and competitive position like
shareholders. Defensive strategies were used on stakeholders with high competitive
threats while swing strategies were used on stakeholders with low co-operative potential
and equal law competitive threats.
4.5.5 Engagement depends Stakeholder’s Interest and Power
This question sought to know whether management were using stakeholder management
interest- power grid either consciously or unconsciously. The study findings were that
manager strongly agreed. However 2.5% of those surveyed disagreed with the statement
while 25.6% of the managements were not sure. Those who agreed were 39.7% while
32.2% strongly agreed. Therefore the management who agreed to the statement that the
level of engagement with their stakeholders depends on their relative level of interest
and power were 71.9%

63
The research findings agree with Johnson and Scholes (2002) who stipulates that
engagement of stakeholders should depend on the level of stakeholder‘s interest and
their relative power. For those who have relatively high power should, the management
should regularly engage them to get their views of certain issues and update them on the
progress of such programs. Those stakeholders who have a lot of interest should be kept
informed and changes and progress in the organization. However, those stakeholders
who have relatively low level of interest and low level of power should be ignored.
4.5.6 Involved in CSR with Community Around
This question sought to find out whether SACCO management was engaged with
community around them. The management who disagreed to engaging the community
with programs intended to improve their social welfare were 3.3%. Those who were
neutral were 24%. Those who agreed were 47.1% and those who strongly agreed were
25.6%. Therefore those who agreed to be engaged in corporate social responsibility with
the community were 72.7%. This implied that majority of the management were being
concerned with the social welfare of the community around them and that stakeholder
management concept was being applied.
Research findings agree with (Browne & Nuttall 2013) who observed that a good
relationship with Non-governmental Organizations, citizens, and governments is a key
determinant of competitiveness, and companies need to start treating it as one.
According to them, that does not mean that management has to initiate philosophical
inquiries into social responsibility and business ethics. It however requires the
management to integrate external engagement deeply into every part of the business by
defining what they contribute to society, knowing their stakeholders, engaging radically
with them, and applying world-class management. It requires the same discipline that
companies around the world apply to procurement, recruitment, strategy, and every
other area of business.

64
4.6 Descriptive Statistics on Offensive Strategy
This section sought to establish whether offensive strategy was being employed in
management of supportive stakeholder groups. The research findings are given in Table
4.10.
Table 4.10: Offensive Strategies
Research Statement Strongly
Disagree
%
Disagree
%
Not Sure
%
Agree
%
Strongly
Agree %
Seek to change
stakeholder objective
or perception if not
favorable
0 4.1 25.6 49.6 20.6
Adopt stakeholder
position
2.5 2.5 20.7 40.5 33.9
Keep key
stakeholders informed
& motivated
0 0.8 23.1 35.5 40.5
Involve key
stakeholders in
strategy formulation
0 2.5 24.8 43.0 29.8
Involve key
stakeholders in
formulating policies
0 3.3 17.4 44.6 34.7
Use of offensive
strategy
0 1.7 11.6 47.9 38.8

65
4.6.1 Changing Stakeholder Objectives or Perception
This question sought to establish whether the management would seek to change
supportive stakeholder‘s negative perception of the firm. The management who
disagreed was 4.1% while no respondent strongly disagreed. Those who were not sure
were 25.6%. Those who agreed were 49.6%, while those who strongly agreed were
20.6%. Those who agreed to at times sought to change supportive stakeholders‘
perception or objective if not favorable was totaling to 70.2%. This is shown in Figure
4.4.
This implied that if a stakeholder perception about the firm is wrong, the management
uses available channels of communication to correct it. This agrees with the findings of
Smith, Ansett and Erez (2011) in their working paper that successful stakeholder
engagement is very likely to reduce public criticism, hence contributing to a positive
view of the company in the eyes of all its stakeholders. It also helps to reduce time and
resources that would be spent in fighting negative campaigning. They also noted that
responsible public image is also beneficial for the recruitment and retention of
employees

66
Figure 4.4: Changing Stakeholder Objectives or Perception
4.6.2 Adopting Stakeholder’s Position
This question sought to determine whether the management would at times adopt
supportive stakeholders‘ positions if favorable. From the findings shown in Figure 4.5;
2.5% strongly disagreed and 2.5% disagreed. The management who were not sure or
stood middle ground was 20.7%. The number who agreed was 40.5% while 20.6%
strongly agreed. Those who agreed to adopt stakeholders‘ position were 61.1%. This
implies that the management would sometimes seek the opinion of key supportive
stakeholders like fellow employees, other managers like middle level management and
suppliers

67
Figure 4.5: Adopting stakeholder’s position
4.6.3 Keeping Key Stakeholders Informed and Motivated
This question sought to know whether the management communicated regularly with
key supportive stakeholders like employees, fellow managers, shareholders and
suppliers. The research findings were that 0.8% of the management disagreed. Those
who stood middle ground or were not sure stood at 23.1%. Those agreed were 35.5%,
while those who strongly agreed were 40.5%. Therefore percentage that agreed to
inform and motive their key stakeholders was 76%. This is shown in Figure 4.6.
The research findings agree with Monitor (2014) observation that regular
communication is paramount in ensuring everyone is kept informed and updated on the
nature and progression of the work. It helps in minimizing any annoyance or
dissatisfaction that may occur throughout the project, program or working in the

68
organization. For motivation of stakeholders, the findings agree with Robu and
Savlovschi (2011) who argue that managers need to understand the motivation strategies
of key stakeholders like the employees. They posit that management succeed or fail on
the grounds of the way in which they succeed in influencing the inner motivations of the
employees.
Figure 4.6: Keeping key stakeholders informed
4.6.4 Involvement of Key Stakeholders in Strategy Formulation
This question sought to determine whether key supportive stakeholders were being
involved in formulation of the organization strategy. From the research findings 2.5%
disagreed, 24.8% were not sure or chose to stand middle ground; 43% agreed and 29.8%
strongly agreed. Those who agreed to be involving their supportive key stakeholders in
formulation of strategy were 72.8%. This implies that the management was indeed
engaging supportive stakeholders in formulation of organization strategy. This is shown
in Figure 4.7.

69
The research findings agrees with Greenfield (2004) who argues that participative
management instills a sense of pride and motivates employees to increase productivity in
order to achieve their goals. It helps in creating a sense of ownership. Employees who
for instance participate in the decisions of the company feel like they are a part of a team
with a common goal, and find their sense of self-esteem and creative fulfillment
heightened. Participation helps employees gain a wider view of the organization. It also
increases the commitment of employees to the organization and the decisions they make.
Figure 4.7: Involve key stakeholders in strategy formulation
4.6.5 Involvement of Key Stakeholders in Policy Formulation
This question sought to determine whether key supportive stakeholders were being
involved in formulation of policy for the organization. From the research findings, none
strongly disagreed with the statement; 3.3% disagreed, 17.4% were not sure or chose to

70
stand middle ground; 44.6% agreed and 34.7% strongly agreed. Those who agreed to be
involving their supportive key stakeholders in formulation of strategy were 79.3%. This
implies that the management was indeed engaging supportive key stakeholders in policy
formulation. This is shown in Figure 4.8. This implies that offensive strategy was used
in management of key stakeholders like employees and shareholders.
The research findings agrees with Smith et al (2011) research that stakeholder
engagement in policy formulation or in any other manner helps the management to see
the future in the sense that stakeholder familiarity with operations on the ground can
help in identifying potential risks or where there are opportunities to be explored. It is
also a facilitator of trust in the sense that providing stakeholders with company
perspective on issues and being responsible in addressing their concerns can enhance
stakeholders‘ cooperation and reduce confrontational tendencies. It also helps in solving
problems of concern to the stakeholders.

71
Figure 4.8: Involve key stakeholders in formulating policies
Table 0.11: Descriptive Statistics on Use of Offensive Strategy
Strategy N Minimum Maximum Mean Std.
Deviation
Use of offensive
strategy
121 2 5 4.23 .739
Valid N (list wise) 121
A majority of senior managers and executive directors agree to be using offensive
strategy with 47.9 % agree; 38.8% strongly agree; 11.6% were neutral while only 1.7%

72
disagree. Therefore majority, 86.7% agree to adopt this strategy. The mean value is 4.23
which collaborate with the high percentage. This is shown in Figure 4.9 and Table 4.11.
Use of offensive strategy by Deposit Taking SACCOs is shown by descriptive statistics
in figure 4.15. The mean value is 4.23 as reported in table 4.11, which imply that
offensive strategy is largely employed. The research finding is supported by Smakalova
(2012) and Freeman and Mcvea (2001). They found out that offensive strategy was used
by firms to improve its competitive position by taking the market away from
competitors.
Figure 4.9: Use of Offensive Strategy
4.7 Descriptive Statistics on Hold Strategy
This set of questions sought to establish whether the organization was employing hold
strategy in management of marginal stakeholders who have relatively low cooperative
and competitive threat. These stakeholders include shareholders, consumer interest
groups and professional associations for employees. The research findings are reported
in Table 4.12.

73
Table 4.12: Descriptive statistics on Hold Strategy
Research
Statement
Strongly
Disagree %
Disagree
%
Not Sure
%
Agree
%
Strongly
Agree %
continue with current
strategies &
programs
0 5 29.89 41.3 24
Monitor this
marginal group for
change in position or
attitude
0 3.3 25.6 44.6 26.4
Ignore this marginal
group
0 3.3 25.6 44.6 26.4
Involve group in
strategy formulation
0 1.7 31.4 38 28.9
Reinforce
stakeholder beliefs
about the firm
0.8 2.5 27.3 42.1 27.3
Change firms‘
behavior to address
group's concern
0 5 25.6 46.3 23.1
Use of Hold Strategy 0 0.8 28.1 50.4 20.7
4.7.1 Continue with Current Strategy and Programs
This question sought to determine whether the management would ignore stakeholder
groups that have low co-operative and low competitive threats as stipulated in
stakeholder management theory. From the research findings, 5% disagreed while 29.8%
were not sure or stood middle ground. Those who agreed stood at 41.3% while those
who strongly agreed stood at 24%. Therefore the total percentage that agreed was
65.3%. This is shown in Table 4.12 and Figure 4.10. This implies that management put
into consideration the relative power and interest of stakeholder and whether they can
pose any competitive threat or opportunity. This collaborates with Freeman and Mcvea

74
(2001), Polonsky, Jay and Don (2005) and Johnson and Shoes (2012) who in their
stakeholder strategy matrix stipulates that this marginal group of stakeholder is ignored.
Figure 4.10: Continue with Current Strategy and Programs
4.7.2 Monitor Marginal Group for Change in Position or Attitude
This question sought to determine whether the management would monitor this
stakeholder groups that have low co-operative and low competitive threats as stipulated
in stakeholder management theory. From the research findings shown in Table 4.12 and
Figure 4.11: 3.3% disagreed while 17.4% were not sure. Those who agreed were 46.3%
while those who strongly agreed were 33.1%. Therefore those who agreed to monitor
low co-operative and low competitive stakeholder for any change in position or attitude
was 79.4%. This means that majority of top management in deposit taking SACCOs
would monitor those stakeholders who co-operated less with them and posed little threat

75
since they were low competitive. They were put on ladder to monitor any change of their
position or attitude toward the organization.
The research findings agree with the stakeholder strategy matrix model by Freeman in
his 1984 work and Savage and others in their 1991 work reproduced by Polonsky, Jay
and Don (2005). Their work was supported by Smakalova (2012) who used the matrix to
determine whether the strategies stipulated in the model were indeed being applied by
large firms. They recommended that management should just monitor those stakeholders
who have relatively low influence and low competitive threats. However if their position
change, the management can establish their new position and respond with an
appropriate strategy. Stakeholder management and appropriate engagement was also
found to create competitive advantage by Minyu (2012).
Figure 4.11: Monitor this marginal group for change in position or attitude

76
4.7.3 Involve Group in Strategy Formulation
This question sought to determine whether the management would involve this
stakeholder groups that have low co-operative and low competitive threats in strategy
formulation. From the research findings shown in Table 4.12 and Figure 4.12, 1.7%
disagreed while 31.4% were not sure. Those who agreed were 38% while those who
strongly agreed were 28.9%. Therefore those who agreed to involve marginal group in
strategy formulation are 66.9%
Figure 4.12: Involve group in strategy formulation
4.7.4 Reinforce Stakeholder Beliefs about the Firm
This question sought to determine whether the management would seek to reinforce this
group of stakeholders‘ belief about the firm. From the research findings in Table 4.12

77
and Figure 4.13: 0.8% strongly disagrees; 2.5% disagreed while 27.3% were not sure.
Those who agreed were 42.1% while those who strongly agreed were 27.3%. Therefore
those who agreed to reinforce the belief of this stakeholder group belief about the firm if
the belief is good were 69.4%.
Responsible public image by the public and other stakeholders should be reinforced. The
research findings agrees with Smith et al (2011) who found out that proactive
stakeholder engagement is a facilitator of trust with other stakeholders. They stipulate
that providing stakeholders with the organization‘s perspective on issues and being
responsive in addressing their concerns, stakeholders would be more likely to be co-
operative rather than confrontational.
Figure 4.13: Reinforce stakeholder beliefs about the firm
4.7.5 Change Firm’s Behavior to Address Group's Concerns
This question sought to determine whether the management in deposit taking SACCOs
would seek to change the employee‘s behavior, culture or attitude so as to address a key

78
stakeholder‘s concern. From the research findings, 5% disagreed, 25.6% were not sure
or chose to stand middle ground; 46.3% agreed and 23.1% strongly agreed. Those who
agreed to that statement ware 69.4%. This is shown in Figure 4.14. This implies that the
management agreed to change of their employees‘ behavior or unfavorable culture so as
to make them satisfied.
The research findings agree with the open systems school approach which stipulates that
any change on one part of the system will have an impact on other parts of the system.
The objective of the Open Systems approach is to restructure the functions of a business
in a manner that, through clearly – defined lines of coordination and interdependence,
the overall business objectives are collectively pursued so as to achieve overall strategy,
rather than on optimizing the performance of any one individual part. It stipulates that in
order for an organization to be successful, it ought to tap and direct their energy to their
work force. This requires the removal of any obstacles and provision of positive
reinforcement which promotes it Burnes (2004).
Figure 4 .14: Change Firms’s behavior to address group's concerns

79
4.7.6 Employment of Hold Strategy
Descriptive statistics shown in Table 4.13 shows a mean value of 3.66 and a standard
deviation of 0.781. They answer to the affirmative that Deposit Taking SACCOs do
adopt hold strategy when dealing with low co- operating and less threatening
stakeholders.
Table 4.13: Descriptive statistics for hold strategy
N Minimum Maximum Mean Std.
Deviation
Use of hold
strategy
121 2 5 3.66 .781
Valid N (list
wise)
121
Respondents who were neutral and those who agree that they adopt hold strategy tallied
at 28.1%. Those respondents who strongly agreed to employ hold strategy were 20.7%,
while 0.8% % disagreed. Therefore, those who agreed to have used hold strategy was
71.1%. This is shown in Figure 4.15. This agrees with Galbreath (2006) who postulated
the various types of strategy to employ on management of various stakeholder groups in
a stakeholder strategy matrix model and Polonsky and Smakalova (2012) whose findings
were that hold strategy was and employed for marginal stakeholders.

80
Figure 4.15: Use of Hold Strategy
4.8 Descriptive Statistics of Defensive Strategies
This section sought to determine the extent of employment of defensive strategies by
deposit taking SACCOs in defending the organization against competitors, reducing
dependence and responding by introducing new products, diversifying into new market
and making changing to existing products, majority of Deposit Taking SACCOs do
adopt defensive strategy. The research findings are shown in Table 4.14.

81
Table 4.14: Defensive Strategies
Research Statement Disagree
%
Not Sure
%
Agree
%
Strongly
Agree %
Defend firm from
competitors
0 3.3 55.2 40.5
Prevent competitive threat 2.5 24 42.1 31.4
Reduce dependence from
these stakeholder
4.1 19.8 41.3 34.7
Continuously improve on
quality of product &
services
0 10.7 47.9 41.3
Introduce new products
and innovate
1.7 21.5 45.5 31.4
Make retaliatory attack 1.7 21.5 45.5 31.4
Diversify into new
markets
0 15.7 47.1 37.2
Use of defensive strategies 2.5 18.2 42.1 37.2
4.8.1 Defend Firm from Competitors
This question sought to determine whether the management of deposit taking SACCOs
was actually defending their organizations from competitors. The purpose of employing
this strategy is to make possible attacks unattractive or discourage potential attacks.
From the research findings shown in Table 4.14 and Figure 4.16, no one disagreed with
this statement while 3.3% were neutral; 55.2% agreed and 40.5% strongly agreed.
Therefore, the total percentage who agreed was 95.4%. This is a high percentage and it
implies that the management was employing defensive strategies to fend off attack from
competitors.

82
This collaborates with the argument of Yonnopoulus (2011) and Markides (2000) who
stipulate that defensive strategies should be used before the challenger makes an
investment in the industry in order to protect market share, position and profitability.
Pre-entry defensive strategies are actions taken by firms intended to persuade potential
entrants to believe that market entry would be difficult or unprofitable. Such actions
include signaling, fortify and defend, covering all bases, continuous improvement, and
capacity expansion (Karakaya & Yonnopoulus, 2011).
Figure 4.16: Defend firm from competitors
4.8.2 Prevent Competitive Threat
This question sought to determine whether the management of deposit taking SACCOs
was actually employing pre- entry defensive strategies organizations from competitors.
The purpose of employing this strategy is to make possible attacks unattractive or
discourage potential attacks. From the research findings shown in Table 4.14 and
diagrammatically shown in Figure 4.17, no one strongly disagreed with this statement

83
but 2.5% disagreed. The percentage of management who were not sure was 24%. Those
who agreed was 42.1% and 31.4% strongly agreed. Therefore those who agreed to
employ preventive defensive strategies were 73.5%. This collaborates with Karakaya
and Yonnopoulus (2011) who argues that pre – entry defensive strategies are action
taken by firms intended to persuade entrant to believe that market entry would be
difficult or unprofitable. Cabral (2001) also argue that signal commitment to the industry
deter or preempt completion.
Figure 4.17: Prevent competitive threat
4.8.3 Reduce Dependence on Stakeholder
This question sought to determine whether the management of deposit taking SACCOs
was reducing their dependence of other stakeholders who are also their competitors.
From the research findings sown in Table 4.14 and Figure 4.18; 4.1% disagreed with the
statement while 19.8 % were neutral or not sure; 41.3% agreed and 34.7 strongly agreed.
Therefore those who agreed to the statement of reducing their dependence on

84
stakeholder who could be their competitor were 73.5%. This implies that majority of
DTSs management were working toward reducing their dependence of competitive
stakeholders. This means that they were employing defensive strategy towards this
category of stakeholders who are dominant in the market.
Research findings agree with Hillman et al (2009) and Davis and Cobb (2009) who
observe that too much dependence on competitive stakheholders should be reduced to
avoid the organization being held hostage. Resource dependence theory (RDT)
represents a scientific approach to explain and manage the dependence of an
organization on resources owned by other organizations in its environment, mainly
suppliers, shareholders, unions, competitors, public authorities and other stakeholders.
Resource dependence causes external control in terms of power exerted by other players.
Environment relationship like strategic alliances, diversification in supplier relationship
management and other ways of restructuring the company are scrutinized with respect to
their capacity to reduce external power.
Figure 4.18: Reduce Dependence on Stakeholder
85
4.8.4 Introducing New Products and being Innovative
This question sought to determine whether the management of deposit taking SACCOs
were introducing new product and being innovative as a way of being more competitive.
From the research findings shown in Table 4.14 and Figure 4.19: 1.7% disagreed with
the statement while 21.5 % were neutral or not sure; 45.5% agreed and 31.4% strongly
agreed. Therefore those who agreed to the statement of always seeking to introduce new
products and being more innovative were 76.9%. This means that majority of top
management would seek to defend their market territory by introducing new appealing
products and being innovative in improving quality of their products or service packages
in order to retain their customers and fend off possible attacks.
The research findings agree with Johnston (2015) who observes that product
development and innovation has some benefits in that a firm can respond to customers‘
needs as they change. Making firm‘s product development strategy customer-driven can
give the firm a strong competitive edge. The management can identify the most common
needs and develop products for those. An effective product development strategy can
create a culture of innovation in an organization. If a firm‘s strategies consistently work,
it can gain a reputation as a company that is on the leading edge of the industry. This can
help the firm capture more market share and create an expectation of exciting ideas
among its customers.

86
Figure 4.19: Introducing new products and being Innovative
4.8.5 Improvement on Quality of Product and Services
This question sought to determine whether the management of deposit taking SACCOs
was striving to improve their products and services. Continuous Improvement
philosophy on the quality features and performance of the product or service is
paramount in defensive strategies. From the research findings reported in Table 4.14
and Figure 4.20: no manager disagreed with the statement while 10.7 % were neutral or
not sure; 47.9% agreed and 41.3% strongly agreed. Therefore those who agreed to the
statement that they always strive to improve on their product and service delivery was
89.1%.
This agrees with Karakaya and Yonnopoulus (2011) who says that a low cost
competitor continuously tries to find ways of decreasing costs through economies of
scale, cutting costs and introducing new efficient processes. Total Quality Management
(TQM) enhances productivity and process efficiency by identifying and eliminating

87
problems in work processes and systems. TQM addresses key problem areas such as
mistakes in work processes, redundant processes, unnecessary tasks, and duplicate
efforts. TQM interventions also help with predicting and pre-empting such mistakes and
unproductive activities. A major long-term benefit of Total Quality Management relates
to customer satisfaction. TQM aims at improving quality, and identifies the best measure
of quality as matching customer expectations in terms of service, product, and
experience. TQM interventions quantify problems and aim to achieve the best state
defined in terms of such customer expectations. Among the major benefits of Total
Quality Management is improvement in Organizational Development. TQM brings
about a change in the work culture by educating all employees on quality and making
quality the concern of everybody.
Figure 4.20: Continuously Improvement on Quality of Product & Services

88
4.8.6 Make Retaliatory Attacks
This question sought to determine whether the management of deposit taking SACCOs
made retaliatory attacks. From the research findings shown in Table 4.14 and Figure
4.21, no manager disagreed with the statement while 1.7 % disagreed, 21.5% were
neutral or not sure; 45.5% agreed and 31.4% strongly agreed. Therefore those who
agreed to the statement that they make retaliatory attacks were 76.9%.
The research findings agree with post defensive strategies as postulated by Yonnopoulus
(2011) that fighting brands are introduced by organizations to fight a competitor‘s brand
that threatens one of their major brands. Competing brands are usually low priced
versions of the firm‘s premium brands that claim equal quality at a much lower price.
Introducing fighting brands can be an appealing strategy because they help fight off a
price-cutting brand that is threatening the core brand of the firm while preserving its
premium image and profit margins. Cross-parry strategy is employed when a firm that is
challenged by a competitor in one area chooses to challenge this competitor in another
area. For instance, if a company is attacked in one of its core markets or products,
instead of retaliating at the point of attack, it counter-attacks in the challenger's area of
strength. By attacking the challenger in its core area, the defending firm diverts attention
from its own core area and attacks the challenger where it hurts most. The objective of a
cross-parry strategy is often to avoid involving the core brand in a price war, (Karakaya
& Yannopoulos, 2011).

89
Figure 4.21: Make retaliatory attacks
4.8.7 Diversification
This question sought to determine whether the management of deposit taking SACCOs
was diversifying. From the research findings shown in Table 4.14 and Figure 4.22, no
respondent disagreed with the statement while 15.7% were neutral or not sure; 47.1%
agreed and 37.2% strongly agreed. Therefore those who agreed to the statement
diversification to introduce new products and moving to geographical regions was
84.3%.
Research findings agree with Lyon and Ferrier (2002) and Marlin and Scott (2004) who
observe that diversification strategies leads to significant increase in performance
objectives (usually sales or market share) beyond past levels of performance. Large size

90
or large market share can lead to economies of scale. Marketing or production synergies
may result from more efficient use of sales calls, reduced travel time, reduced
changeover time, and longer production runs. Learning and experience curve effects
may produce lower costs as the firm gains experience in producing and distributing its
product or service. Experience and large size may also lead to improved layout, gains in
labor efficiency, redesign of products or production processes, or larger and more
qualified staff departments for example: marketing research or research and
development. Lower average unit costs may result from a firm's ability to spread
administrative expenses and other overhead costs over a larger unit volume. The more
capital intensive a business is, the more important its ability to spread costs across a
large volume becomes.
Figure 4.22: Diversification

91
Table 4.15: Descriptive Statistics for Defensive Strategy
N Minimum Maximum Mean Std.
Deviation
Use of defensive
strategy
121 2 5 4.14 .799
Valid N (list wise) 121
This is given by a mean value of 4.14 and standard deviation of 0.799 which imply that
the majority agree to have adopted this strategy as shown in Table 4.15.
A majority of respondents agree to be adopting defensive strategy as a tool to fend off
attacks from potential competitors. Senior managers and executive directors interviewed
agreed to be adopting the strategy, with 42.1% agreeing and 37.2% strongly agree;
18.2% were neutral while 2.5% disagree. Those who use the strategy are 79.3 % which
is a big representative. A graphical representation of this is shown in Figure 4.23.
The research findings agree with Yonappoulos (2011) argument that defensive should be
employed by management to make possible attacks unattractive and to discourage
competitors. It supports the findings of Smakalova (2012) who suggests that defensive
strategies should be adopted for stakeholders group who have relatively high
competitive threat and relatively low co-operative potential.

92
Figure 4.23: Use of defensive strategy
4.9 Descriptive Statistics for Swing Strategy
This section sought to determine the use of employment of swing strategies by deposit
taking SACCOs. These strategies are adopted in management of stakeholder groups that
have relatively low competitive threat and low co-operative potential. The stakeholders
include customers and suppliers.

93
Table 4.16: Use of swing strategy
Statement Disagree% Neutral% Agree% Strongly
Agree%
Change or Influence rule of
the game
5 28.1 38.8 28.1
Collaborate with mixed
blessing group
0 9.3 41.3 49.6
Positively engage them to
nurture their positive
cooperation
1.7 16.5 43.8 38
Maintain communication to
keep them satisfied
0 18.2 43.8 38
Modify this stakeholder
belief about the firm
3.3 22.3 41.3 33.1
Use of Swing Strategy 0 18.2 50.4 31.4
4.9.1 Change or Influencing the Rules of the Game
This question sought to determine whether the management of deposit taking SACCOs
change or influence the rules of the game. From the research findings shown in Table
4.16 and Figure 4.24; 5% respondents disagreed with the statement while 28.1% were
neutral or not sure; 38.8% agreed and 28.1%strongly agreed. Therefore percentage of
those who agreed with the statement that they sometimes change or influence the rules
of the game was 66.9%.

94
Figure 4.24: Change or Influencing the Rules of the Game
4.9.2 Collaborate with Mixed Blessing Group
This statement sought to determine whether managers of deposit taking SACCOs do
collaborate with mixed blessing groups. From the research findings shown in Figure
4.25, no management disagreed while 9.3% were neutral or not sure. The number of
respondents who agreed was 41.3% while 49.6% strongly agreed. The percentage of
management who agreed to collaborate with mixed blessing stakeholder was 90.9%.
The research finding agrees with observation that strategic alliances between
organizations may be a crucial ingredient in achieving strategic advantage or in avoiding
competition (Johnson; Scholes & Whittington, 2002, p. 261). Collaborative strategy is
the synergy between the strategy of a business and the strategy of its partners to realize

95
the objectives through collaboration. This concept is being developed as the new way to
grow a business. Companies collaborate with their partners, vendors, and customers etc.
to build synergy at strategic level to grow their business. Successful business
collaboration entails cooperative strategies to achieve a common goal among groups that
are frequently not accustomed to working together. This can involve either separate
companies or internal departments within the same company.
Figure 4.25: Collaborate with mixed blessing group
4.9.3 Engage Stakeholders to Nurture Positive Cooperation
This statement sought to determine whether managers of deposit taking SACCOs
positively engage mixed blessing group of stakeholders. From the research findings

96
shown in Table 4.16 and Figure 4.26, 1.7% of the management disagreed while 16.5%
were neutral or not sure. The number of respondents who agreed was 43.8% while 38%
strongly agreed. Therefore the percentage of the management who agreed was 81.8%.
This implies that the management was positively engaging stakeholders with intention of
nurturing positive cooperation.
The research findings agrees with Smith et al (2001) who found out that stakeholder
engagement helps in improving company‘s image and trust. They stipulate that proactive
stakeholder engagements would reduce stakeholders‘ criticism and contribute to a
positive view of the company. It also helps in facilitating trust with stakeholders by
providing the firms‘ perspective on issues and being responsive to addressing
stakeholders‘ concerns. Consequently stakeholders are more likely to be co-operative
rather than be confrontational.
Figure 4.26: Engage Stakeholders to Nurture Positive cooperation

97
4.9.4 Maintain Communication with the Group
This statement sought to determine whether managers of deposit taking SACCOs
regularly communicate with mixed blessing group of stakeholders to keep them to
informed and satisfied. From the research findings in Table 4.16 and Figure 4.27, no one
disagreed while 18.2% were neutral or not sure. The number of respondents who agreed
was 43.8% while 38% strongly agreed. Therefore the percentage of the management
who agreed was 81.8%. This implies that the management was indeed engaging
stakeholder group through various communication channels.
The research findings agree with Sharma (2008) observations that awareness
communication helps in keeping stakeholders informed of the program status and
performance throughout its life cycle. Strategies for communication are proactive, which
means that they provide a solution to the problem before the issue even arises. With a
communication strategy, the solution is carefully planned out in advance. This way, the
reaction to the issue will be logical and advantageous to the company‘s overall goals,
rather than instinctive and rash. Communication strategies are used as part of a business‘
plan, detailing how to communicate with various groups of people. A single business
may have multiple strategies for different categories of people, such as clients, investors,
competitors, or employees. Some companies even have an internal communication
strategy for communicating within the business itself. These strategies are used to
determine things like what information to share with the clients or investors, as well as
how that information should be presented.

98
Figure 4.27: Maintain Communication with the Group
4.9.5 Modify Stakeholder Belief about the Firm
This statement sought to determine whether managers of deposit taking SACCOs often
modify or try to modify this mixed blessing group of stakeholders about the firm if such
belief is negative. From the research findings in Table 4.16 and Figure 4.28, 3.3%
disagreed while 22.3% were neutral or not sure. The number of respondents who agreed
was 41.3% while 33.1% strongly agreed. Therefore the percentage of the management
who agreed was 74.4%.
This means majority of DTSs management cares about their image, Image is
everything, stakeholders at times may access information about a firm that may dent
their perception (image) about the firm. This information may be true or false and the
organization should strive to ameliorate the situation through public relations. For
instance, information about corruption and any unethical behavior by firm‘s human
resource whether true or false can dent the image of that firm.

99
Figure 4.28: Modify this stakeholder belief about the firm
Table 4.17: Use of Swing strategy
N Minimum Maximum Mean Std.
Deviation
Varianc
e
Use of
swing
strategy
121 2 5 3.98 .866 .750
Valid N
(list wise)
121
The study shows that majority of senior managers and executive directors employ swing
strategy when managing a group of stakeholder that is a mixed blessing. Table 4.17
gives a mean value of 3.98 and variance of 0.75.

100
Those who agreed to adopt swing strategy amounted to 81.8% (both agree and strongly
agree) of the representatives; 18.2% were neutral while 1.7% disagree. This supports the
research findings of Smakalova (2012) who argues that swing strategies should be
adopted if stakeholder groups have a relatively low competitive threat and co-operative
potential. The graphical representation of this is shown in Figure 4.29.
Figure 4.29: Use of Swing Strategy
4.10 Descriptive Statistics on Corporate Social Responsibility Strategy
This section sought to determine the extent of engagement in corporate social
responsibility strategies by deposit taking SACCOs with the community around and the
ecological environment. The research findings are given in Table 4.18.

101
Table 4.18: Corporate Social Responsibility Strategies
Statement Strongly
Disagree%
Disagree
%
Neutral
%
Agree
%
Strongly
Agree%
Integrate social concern
into business & contribute
to a better society
2.5 5 35.5 36.5 20.7
Good ethical values
0 0 11.6 41.3 47.1
Strive to satisfy key
stakeholder plus the
community
1.7 6.6 25.6 36.4 29.8
engage in environmental
stewardship
2.5 3.3 28.1 35.5 30.6
Organization‘s use CSR
strategy
0 5.8 22.3 43.8 28.1
CSR improve staff
motivation
0 6.6 33.9 28.9 30.6
CSR improves
relationship with
communities
0 4.1 27.3 34.7 33.9
CSR improves DTS image 0 1.7 12.4 42.1 43.8
CSR enhances marketing
of DTS products
0 8.3 27.3 33.1 31.4
4.10.1 Integrate Social Concern into Business
This statement sought to determine whether managers of deposit taking SACCOs have
integrated social concerns into business and contribute to a better society. From the

102
research findings in Table 4.18 and Figure 4.30, 2.5% strongly disagreed and 5%
disagreed; 35.5% were neutral or not sure. The number of respondents who agreed was
36.5% while 20.7% strongly agreed. Therefore the percentage of the management who
agreed was 57.2%. This implies that a sizeable number of management had integrated
social concern into business and were contributing to a better society.
Figure 4.30: Integrate Social Concern into Business
4.10.2 Good Ethical Values
This statement sought to determine whether managers of deposit taking SACCOs have
engaged in good ethical values with all stakeholder groups. From the research findings
shown in Table 4.18, 11.6% were neutral or not sure. The number of respondents who
agreed was 41.3% while 47.1% strongly agreed. Therefore the percentage of the
management who agreed that they applied good ethical values was 88.4%. The graphical
representation of this is shown in Figure 4.31.

103
The research findings agree with Ahmed, Arslam and Rohail (2013) who postulates that
ethics contributes to customer satisfaction which consequently leads to improved
financial performance. Workplace ethics are significant to business and provide
numerous benefits. Ethics in work place helps in reducing business liability; it helps
employees make good decisions and assures high quality customer service. It prevents
costly administrative errors and reworks. Workplace ethics is integral in fostering
increased productivity and teamwork among firm‘s employees. It helps in aligning the
values of your business with those of your workers. A strong ethical culture is important
in safeguarding firm‘s assets. Employees who abide by organization‘s workplace ethics
would be able to protect and respect firm‘s business‘s assets.
Figure 4.31: Good Ethical Values

104
4.10.3 Engagement in Environmental Stewardship
This statement sought to determine whether managers of deposit taking SACCOs have
engaged in environmental stewardship. From the research findings shown in Table 4.18,
2.5% strongly disagreed; 3.3% disagreed; 28.1% were neutral or not sure. The number
of respondents who agreed was 35.5% while 35.8% strongly agreed. Therefore the
percentage of the management who agreed that they engaged in environmental
stewardship was 66.1%. The graphical representation is shown in Figure 4.32.
Figure 4.32: Engagement in Environmental Stewardship
4.10.4 Use of Corporate Social Responsibility Strategy
The mean score for those who agreed to use corporate social responsibility strategy is
3.94. The variance is 0.738 and no respondent strongly disagreed to using CSR as a
strategy. This is shown in Table 4.19. A high mean indicates that a big number of top
management do engage in corporate social responsibility activities. They use it as a
strategy to keep their stakeholders (both internal and external) satisfied.

105
Table 4.19: Descriptive Statistics on CSR Strategy N Minimum Maximum Mean Std.
Deviation
Variance
orgn use
CSR
strategy
121 2 5 3.94 .859 .738
Valid N
(list wise)
121
From the findings shown in Table 4.19, 43.8% of the respondents agree to adopt the
strategy; 28.1% strongly agree; 22.3% were average while 5.8% disagree to be using the
strategy. In total, 71.9% agree with the proposition that they use the CSR strategy. The
graphical representation is shown in Figure 4.33.
Figure 4.33: Use of CSR Strategy

106
Those who agree to be using the strategy are the majority. They are followed by those
who strongly agree and neutral in that order. The findings imply that true to co-operative
society‘s six core values namely: self help; democracy; equity, solidarity, openness and
social responsibility and concern for others, majority of deposit taking SACCOs have
lived true to their principals. The research findings agree with Porter and Kramer (2002)
who sees organizations developing competitive advantage for their corporate
philanthropy.
4.10.5 CSR Enhances Staff Motivation
From the research findings shown in Table 4.18, respondents who agreed that corporate
social responsibility enhances their staff motivation were 59.5%. Those who were
neutral were 33.9% while 6.6% disagree. Therefore those who think that engaging in
corporate social responsibility enhances staff motivation were above 50%. This implies
majority of top management think that corporate social responsibility strategy improves
staff motivation. The graphical representation of this is shown in Figure 4.34.
Figure 4.34: Relationship of CSR and Staff Motivation

107
4.10.6 CSR Enhances DTS Image
From the Research findings shown in Table 4.18, 42.1% agree that engaging in
corporate social responsibility activities improves their organization‘s image; 43.8%
strongly agree; 12.4% were neutral while 1.7% disagrees. This implies that 85.9%
percent agree to the assertion that CSR helps in improving firm‘s image. The graphical
representation is shown Figure 4.35.
The research findings agrees with Smith, Ansett & Erez (2011) argument that successful
stakeholder engagement helps reduce criticism from the public that may be brought
about by misunderstandings. Consequently, it helps the organization in reducing time
and resources spent on fighting negative campaigning. Proactive stakeholder
management is beneficial for the recruitment and retention of employee in the
organization.
Figure 4.35: Relationship between CSR and DTSs image

108
4.10.7 CSR enhances Marketing of DTSs’ Products
On the relationship between corporate social responsibility and marketing of deposit
taking SACCOs products, majority of senior managers and executive directors stated
when they engaging in corporate social responsibility activities, that have an opportunity
to market their products and services. From the research findings shown in Table 4.18,
those who answered in affirmative were 64.5%. Those who were neutral were 33.1%
while those who disagreed were only 8.3%. This analysis is graphically represented in
Figure 4.36.
The research findings agree with Dodd and Supa (2011) who found in their research that
there is an association between corporate social responsibility and customers‘
purchasing intentions. If a firm has a proactive engagement with customers, suppliers
and other parties that affect the organization, it is likely to have more business
opportunities. This is so because by continuously interacting with other parties, the
firm‘s management is the first to know about new business opportunities.
Figure 4.36: Relationship between CRS and Marketing of DTS Products

109
4.10.8 CSR Improves Relationship with Communities
In this section, descriptive analysis shows the relationship between corporate social
responsibility strategy and relations with communities around. From the 121
representatives interviewed 68.6% agree to the proposition that engaging in corporate
social responsibility activities help to enhance relationship with the communities who
enjoy the benefits from such activities. Those who were neutral were 27.3% while those
who disagreed were only 4.1% as shown in Table 4.18. The graphical view of that
analysis is Figure 4.37. This implies that a firm that engages in corporate social
responsibility with the communities around them helps to create good relations.
Corporate social responsibility provides the opportunity for companies to share their
positive doings in the main steam and social media. The management therefore
generates free publicity and benefit from such publicity.
Figure 4.37: Relationship between CRS and Communities

110
4.10.9 Engagement in Corporate Social Responsibility Activities
Table 4.20 reports the response on adoption of corporate social responsibility. The
research findings that top management engage in CSR activities is 82.6% of the total
121 respondents who were interviewed. However, 17.4% of top level management said
that they had not engaged in corporate social responsibility activities.
Table 4.20: Table Whether DTSs engage in CSR
Frequency Percent
Yes 100 82.6
No 21 17.4
Total 121 100.0
This finding of this section of corporate social responsibility collaborates with
McEhaney (2009) observation that more organizations have come to appreciate the
benefits of engaging in CSR. She observes that most researched and proven financial
benefits of effective strategic CSR is found in the area of human resources and talent
management, reputations and branding, and in operation cost savings. She postulates
that employees are significantly interested in, more highly satisfied with and more royal
to companies that have proven commitment to CSR.
4.11 Financial Performance of SACCOs
The financial performance of Deposit Taking SACCO was measured using ROA, ROE
and SACCO‘s liquidity for year 2013 and 2014. An average of the three measures for
the two years was computed and imputed for every SACCO whose senior managers and
executive directors were interviewed. Descriptive analysis gives a mean value of 9.98
for the two years. The best performing SACCO scored 12.60 while the worst performing
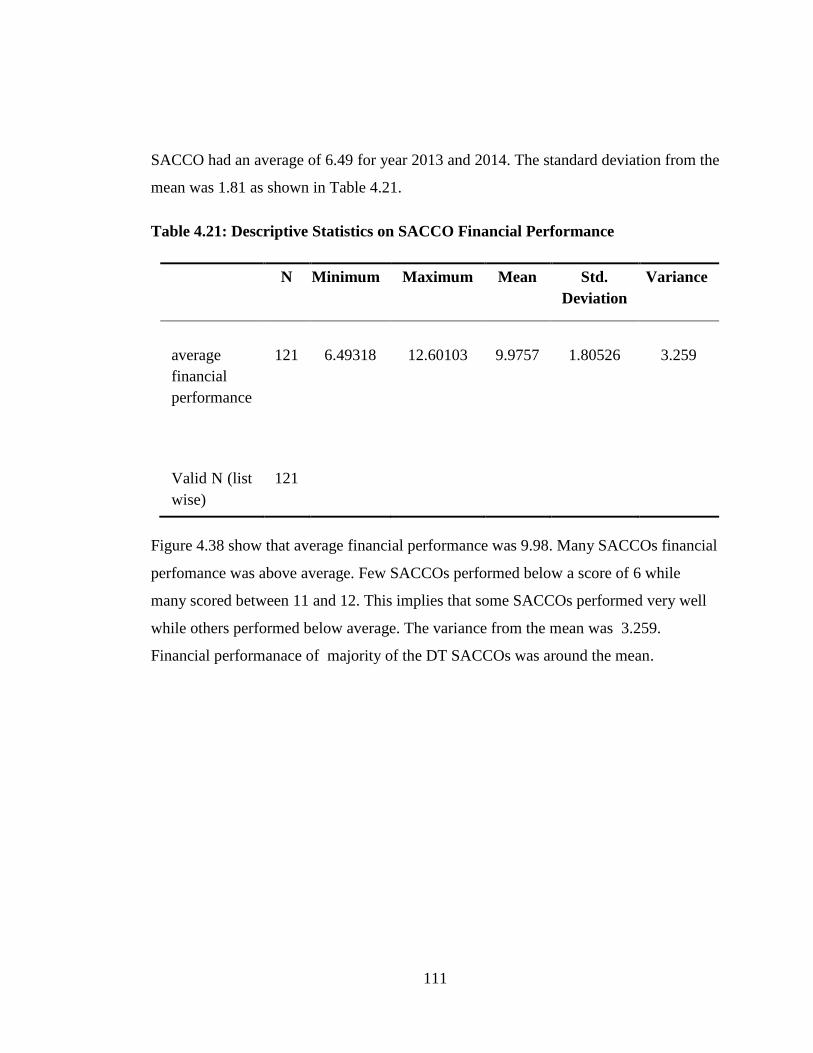
111
SACCO had an average of 6.49 for year 2013 and 2014. The standard deviation from the
mean was 1.81 as shown in Table 4.21.
Table 4.21: Descriptive Statistics on SACCO Financial Performance
N Minimum Maximum Mean Std.
Deviation
Variance
average
financial
performance
121 6.49318 12.60103 9.9757 1.80526 3.259
Valid N (list
wise)
121
Figure 4.38 show that average financial performance was 9.98. Many SACCOs financial
perfomance was above average. Few SACCOs performed below a score of 6 while
many scored between 11 and 12. This implies that some SACCOs performed very well
while others performed below average. The variance from the mean was 3.259.
Financial performanace of majority of the DT SACCOs was around the mean.

112
Figure 4.38: Financial Performance of DTSs
4.11.1 Depositors’ Savings Safety
This question sought to determine from the management whether the depositors savings
are safe in the current Regulatory ACT of 2008 where members can deposit their money
and withdraw at will just like with any other commercial banks. From the research
findings shown in Table 4.22, 5% gave an average score; 87.6% said that depositors‘
savings safety was good, while 8.3% said that it was very good. The percentage of those
who felt depositors‘ savings were safe was 95.3%. This implies that the management
had confidence with their risk management or safety gap mechanism that they have put
in place and that depositor can withdraw their deposit at will.

113
Table 4.22: Depositors’ Savings Safety
Frequency Percent
Average 5 4.1
Good 106 87.6
Very Good 10 8.3
Total 121 100.0
4.11.2 Compliance with SASRA
This question sought to determine whether the management was complying with
SASRA regulation as given under the Regulatory ACT of 2008. From the research
findings in Table 4.23, 28.1% responded that compliance was average; 66.9% said that
compliance was good, while 5.0% said that it was very good. Therefore, 71.9%
responded that their compliance with SASRA was good and was therefore given a clean
bill of financial health.
Table 4.23: Compliance with SASRA
Frequency Percent
Average 34 28.1
Good 81 66.9
Very Good 6 5.0
Total 121 100.0
4.11.3 SACCOs’ Liquidity in the Last 5 years
This question sought to determine whether the liquidity reported in the previous five
years was considered satisfactory under the Regulatory ACT of 2008. From the research
findings shown in Table 4.24, 47.1% gave an average score; 49.6% said that it was
good, while 3.3% said that it was very good. Therefore, 52.9% felt that their liquidity in
the last five years was satisfactory. The percentage on average is high. This implies that

114
some deposits taking SACCOs were struggling to maintain the ideal liquidity of 15%.
This is possibly due to the high demand for loans by members which at time surpasses
the deposits.
Table 4.24: SACCOs’ Liquidity in the Last 5 years
Frequency Percent
Average 57 47.1
Good 60 49.6
Very Good 4 3.3
Total 121 100.0
4.11.4 Stakeholder Satisfaction with Service Delivery
This question sought to determine how the management rated stakeholders‘ satisfaction
with the services they provide. From the research findings shown in Table 4.25, 27.3%
gave an average score; 63.6% said that it was good, while 9.1% said that it was very
good. Therefore, 72.7% rated satisfaction of key stakeholders high.
Table 4.25: Stakeholder Satisfaction with Service Delivery
Frequency Percent
Average 33 27.3
Good 77 63.6
Very Good 11 9.1
Total 121 100.0
4.12 Test of Offensive Strategy Hypothesis
Linear regression model is used to test the null hypothesis of offensive strategy which
states that: there is no significant relationship between offensive strategy and Deposit

115
taking SACCO financial performance. The alternative hypothesis states the opposite that
there is significant relationship between offensive strategy and financial performance of
Deposit taking SACCOs. Linear regression gives the following findings:
Table 4.26: Model Summary
Model R R Square Adjusted R
Square
Std. Error of
the Estimate
Durbin-
Watson
1 .715a .511 .507 1.267195290 2.023
a. Predictors: (Constant), Use of offensive strategy
b. Dependent Variable: average financial performance
The model summary in Table 4.26 shows Pearson‘s Correlation coefficient ―R‖ of
0.715. This implies that there is a strong relationship between adoption of offensive
strategy and financial performance of deposit taking SACCOs. The R squared is 0.511
that is equally high since it is above 0.5. It implies that 51.1% variation in financial
performance can be explained by variation in offensive strategy.
Table 4.27: ANOVA on Offensive Strategy
Model Sum of
Squares
df Mean
Square
F Sig.
1 Regression 199.991 1 199.991 124.544 .000b
Residual 191.088 119 1.606
Total 391.079 120
a. Dependent Variable: average financial performance
b. Predictors: (Constant), Use of offensive strategy

116
The ANOVA table 4.27 shows F value = 124.544, alpha (α) = 0.01 and P value = 0.000.
F value falls within the rejected region. Since α is ˃ than P value, the Null hypothesis is
therefore rejected and we fail to reject the Alternative hypothesis. The conclusion is that
offensive strategy significantly influences financial performance of DTS.
These findings collaborate with Minyu (2012) whose findings were that stakeholder
management creates competitive advantage. Smakalova (2012), in his case study of
thirteen firms found out that offensive strategies should be adopted to stakeholder
groups who have relatively high co-operative potential and relatively two competitive
threat for good performance. The findings also agree with Savage et al 1991 and
freeman‘s work of 1984 stakeholder strategy model which stipulate different strategies
for different stakeholder groups among them offensive strategy and reproduced by
Polonsky et al (2005).
Table 4.28: Residuals statistics
Minimum Maximum Mean Std. Deviation N
Predicted Value 7.26478863 12.16074181 9.97577104 1.273814449 121
Std. Predicted Value -2.128 1.715 .000 1.000 121
Standard Error of
Predicted Value
.127 .276 .160 .042 121
Adjusted Predicted Value 7.26342106 12.21707249 9.97881366 1.276443030 121
Residual -3.631021500 2.637537003 0E-9 1.279214157 121
Std. Residual -2.827 2.053 .000 .996 121
Stud. Residual -2.841 2.068 -.001 1.003 121
Deleted Residual -3.667087078 2.675648212 -.003042623 1.296959362 121
Stud. Deleted Residual -2.930 2.097 -.002 1.010 121
Mahal. Distance .188 4.529 .992 1.177 121
Cook's Distance .000 .040 .007 .008 121
Centered Leverage Value .002 .038 .008 .010 121

117
Residual statistics Table 4.28 gives predicted mean performance as 9.976. Standard
residual mean is .000 while maximum is 2.053. Cooks Distance which is the overall
measure of influence is very law with a minimum of 0.00 and maximum of 0.04. That
means that there were no many individual observations that exert undue influence of the
coefficient and therefore the outliers are not a problem in coefficient determination.
4.13 Test of Defensive Strategy Hypothesis
The Null hypothesis states that there is no significant relationship between defensive
strategy and financial performance of deposit taking SACCOs. The Alternative
hypothesis states that there is significant relationship between defensive strategy and
financial performance of deposit taking SACCOs. To test the hypothesis linear multiple
regression is done which gives outputs given in Table 4.29, 4.30 and 4.31. The value of
R = 0.700 which shows that the relationship between DTS financial performance and
defensive strategy is strong and positive. Coefficient of determination is 0.489 which
implies that 48.9% changes in financial performance can be explained by variation in
defensive strategy.
Table 4.29: Model Summary
Model R R
Square
Adjusted R
Square
Std. Error of
the Estimate
Durbin-
Watson
1 .700a .489 .485 1.295320932 2.029
a. Predictors: (Constant), Use of defensive strategy
b. Dependent Variable: average financial performance
The ANOVA Table 4.30 shows F value = 114.083, alpha (α) = 0.01 and P value = 0.000.
F value falls within the rejected region. Since α is ˃ than P value, the Null hypothesis is
therefore rejected and we fail to reject the Alternative hypothesis. The conclusion is that
defensive strategy significantly influences financial performance of DTS.

118
The findings support research done by Smakalova (2012) who suggested different
strategies to be employed for different group of stakeholders. It also supports
Yonnopoulos (2011) who looked at defensive and offensive strategies. He argues that
firms that firms should use defensive strategies as a tool to fend off attacks from
potential competitors. On the same line, (Freeman & Mcvea 2001; Cunnings & Doh
2000, P. 83) observed that paying attention to and managing specific set of stakeholders
is likely to have a positive effect on the feasibility of an organization in achieving its
strategic objectives of which one of the firm‘s performances is improving profitability of
the organization.
Table 4.30: ANOVA of Defensive Strategy
Model Sum of
Squares
df Mean
Square
F Sig.
1 Regression 191.414 1 191.414 114.083 .000b
Residual 199.665 119 1.678
Total 391.079 120
a. Dependent Variable: average financial performance.
b. Predictors: (Constant), Use of defensive strategy
The residual statistics Table 4.28 gives the financial performance statistics by use of
defensive strategy. The mean is 9.97577 with the highest financial performance being
11.33436 and the minimum performance is 6.59236. The standard deviation is 1.26298.
The Cook Distance mean is 0.008, the cut- off point is given by 4/N = 0.033. The
regression literature stipulates that outliers that are greater than 4/N may be problematic
when determining regression coefficients. This therefore means that there was no errors
in data coding that would have produced outliers.

119
Table 4.31: Residual Statistics
Minimum Maximum Mean Std.
Deviation
N
Predicted Value 6.59236431 11.33435917 9.97577104 1.262979781 121
Std. Predicted Value -2.679 1.076 .000 1.000 121
Standard Error of
Predicted Value
.120 .338 .161 .044 121
Adjusted Predicted
Value
6.46463490 11.41273022 9.97406654 1.266217421 121
Residual -4.298118114 3.405669928 0E-9 1.289912471 121
Std. Residual -3.318 2.629 .000 .996 121
Stud. Residual -3.348 2.663 .001 1.003 121
Deleted Residual -4.376489162 3.493864536 .001704500 1.309616783 121
Stud. Deleted
Residual
-3.503 2.735 -.002 1.015 121
Mahal. Distance .031 7.177 .992 1.249 121
Cook's Distance .000 .102 .008 .015 121
Centered Leverage
Value
.000 .060 .008 .010 121
4.14 Hypothesis Testing of Swing Strategy
The specific objective was to study the relationship between swing strategy and financial
performance of Deposit taking SACCOs. The Null hypothesis stated that there is no
significant relationship between swing strategy and financial performance of deposit
taking SACCOs. The Alternative hypothesis states the opposite that there is significant
relationship between swing strategy and financial performance of deposit taking
SACCOs in Kenya. Linear multiple regression gives the following results.

120
Table 4.32: Model Summary
Model R R
Square
Adjusted R
Square
Std. Error of
the Estimate
Durbin-
Watson
1 .783a .614 .610 1.127019814 2.107
a. Predictors: (Constant), Use of swing strategy
b .Dependent Variable: average financial performance
The model summary in Table 4.32 gives the relationship between use of swing strategy
and financial performance of deposit taking SACCOs gives an R value of 0.783. This
shows a strong relationship between the dependent and independent variable. The R
squared is 0.614 which means that 61.4% variations in financial performance of DTS
can be explained by variation in swing strategy. The ANOVA table 4.33 gives F value =
188.894, P value is 0.000 and α = 0.01 which mean that the F value falls within the
rejection region. Since α ˃ than P- value, we reject the Null hypothesis and adopt the
Alternative hypothesis which states that there is significant relationship between swing
strategy and the financial performance of deposit taking SACCOs.
The finding collaborates with Freeman work of 1984, Savage et al (1991) and
Smakalova (2012) who focused on stakeholder strategy matrix model and the strategies
to employ for different stakeholder groups. Smakalova (2012) for instance suggests from
his research findings that offensive strategy should be used to supportive stakeholders
like employee, managers and suppliers who help create core competency.

121
Table 4.33: ANOVA a
Model Sum of Squares df Mean
Square
F Sig.
1 Regression 239.928 1 239.928 188.894 .000b
Residual 151.151 119 1.270
Total 391.079 120
a. Dependent Variable: average financial performance
b. Predictors: (Constant), Use of swing strategy
4.15 Testing Hypothesis on Hold Strategy
Hold Null hypothesis statutes that: There are no significant relationship between hold
strategy and deposit taking SACCOs financial performance. The Alternative hypothesis
states the opposite that there is significant relationship between hold strategy and deposit
taking SACCO‘s financial performance. To test the hypothesis linear regression model
was analyzed.
Table 4.34: Model Summary b
Model R R
Square
Adjusted R
Square
Std. Error of
the Estimate
Durbin-
Watson
1 .706a .498 .494 1.284577762 2.397
a. Predictors: (Constant), Use of hold strategy
b. Dependent Variable: average financial performance
The model summary in Table 4.34 shows R = 0.706 and Durbin- Watson of 2.397. It can
therefore be implied that there is a strong relationship between hold strategy and
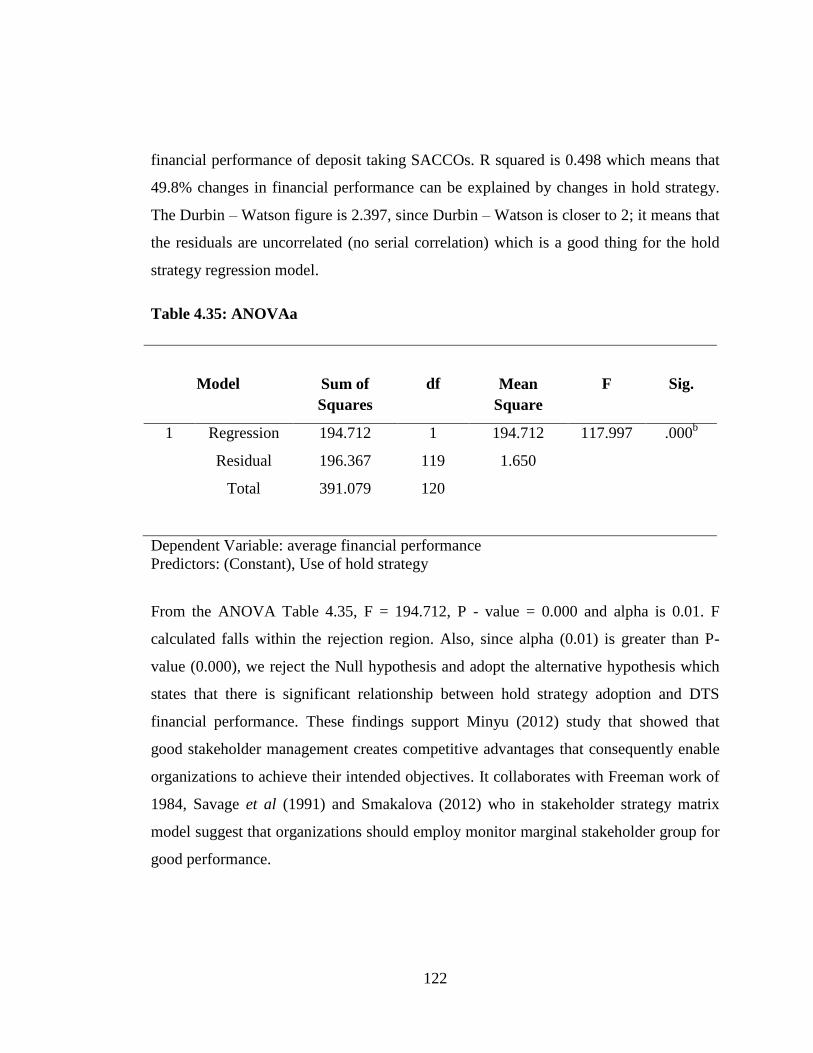
122
financial performance of deposit taking SACCOs. R squared is 0.498 which means that
49.8% changes in financial performance can be explained by changes in hold strategy.
The Durbin – Watson figure is 2.397, since Durbin – Watson is closer to 2; it means that
the residuals are uncorrelated (no serial correlation) which is a good thing for the hold
strategy regression model.
Table 4.35: ANOVAa
Model Sum of
Squares
df Mean
Square
F Sig.
1 Regression 194.712 1 194.712 117.997 .000b
Residual 196.367 119 1.650
Total 391.079 120
Dependent Variable: average financial performance
Predictors: (Constant), Use of hold strategy
From the ANOVA Table 4.35, F = 194.712, P - value = 0.000 and alpha is 0.01. F
calculated falls within the rejection region. Also, since alpha (0.01) is greater than P-
value (0.000), we reject the Null hypothesis and adopt the alternative hypothesis which
states that there is significant relationship between hold strategy adoption and DTS
financial performance. These findings support Minyu (2012) study that showed that
good stakeholder management creates competitive advantages that consequently enable
organizations to achieve their intended objectives. It collaborates with Freeman work of
1984, Savage et al (1991) and Smakalova (2012) who in stakeholder strategy matrix
model suggest that organizations should employ monitor marginal stakeholder group for
good performance.

123
Table 4.36: Coefficients
Model Unstandardized
Coefficients
Standardized
Coefficients
t Sig. Correlations
B Std.
Error
Beta Zero-
order
Partial Part
1 (Constant) 4.001 .562 7.115 .000
Use of
hold
strategy
1.632 .150 .706 10.863 .000 .706 .706 .706
a. Dependent Variable: average financial performance
The coefficient table 4.36 gives the coefficient of hold strategy as 1.63 and constant of
4.00 if the strategy is used individually.
Table 4.37: Residuals Statistics a
Predicted Value
Minimum
7.26478863
Maximum
12.16074181
Mean
9.97577104
Std
1.273814449
N
121
Std. Predicted Value -2.128 1.715 .000 1.000 121
Standard Error of
Predicted Value
.127 .276 .160 .042 121
Adjusted Predicted
Value
7.26342106 12.21707249 9.97881366 1.276443030 121
Residual -3.631021500 2.637537003 0E-9 1.279214157 121
Std. Residual -2.827 2.053 .000 .996 121
Stud. Residual -2.841 2.068 -.001 1.003 121
Mahal. Distance .188 4.529 .992 1.177 121
Cook's Distance .000 .040 .007 .008 121
Centered Leverage
Value
.002 .038 .008 .010 121
Dependent Variable: average financial performance

124
The residual Table 4.37 shows that the maximum predicted financial performance is
12.1607and the minimum is 7.2648. The mean of predicted performance is 9.9758 and
the standardized residual is 2.058. The mean Cook‘s Distance of is 0.07 while the
maximum is 0.04 compared with a conventional cut-off of 0.003. This mean that there is
very little influence of the outliers and therefore, dependent variable is relatively normal.
4.16 Testing the Corporate Social Responsibility Hypothesis
The specific objective is to study the relationship between social corporate
responsibilities with financial performance of DTS in Kenya. The Null hypothesis states
that there is no significant relationship between CRS strategy and financial performance
of DTS in Kenya. The Alternative hypothesis is that there is significant relationship
between the two variables. Analyzing the data using linear regression analysis gives the
following outputs:
Table 4.38: Model Summary
Model R R
Square
Adjusted R
Square
Std. Error of
the Estimate
Durbin-
Watson
1 .819a .671 .668 1.040370935 2.133
a. Predictors: (Constant), orgn use csr strategy
b. Dependent Variable: average financial performance
Multiple regressions using SPSS gave several outputs, one of which is the summary
model, Table 4.38. It shows that correlation coefficient R = 0.819. This implies that
there is a strong relationship between Corporate Social Responsibility strategy and
deposit taking SACCOs‘ financial performance. The R squared is 0.671 which means
that there is line of best fit between CSR strategy and financial performance because
67.1% of the financial performance can be explained by variations in CSR strategy.

125
Table 4.39: ANOVA
Model Sum of
Squares
df Mean
Square
F Sig.
1 Regression 262.277 1 262.277 242.317 .000b
Residual 128.802 119 1.082
Total 391.079 120
Dependent Variable: average financial performance
b.Predictors: (Constant), orgn use csr strategy
From the ANOVA Table 4.39, F calculated = 242.317, P- value = 0.000 and alpha is
0.01. F calculated falls within the rejection region. Also, since alpha (0.01) is greater
than P- value, we reject the Null hypothesis and adopt the alternative hypothesis which
states that there is significant relationship between corporate social responsibility
strategy and DTS financial performance.
The results support the findings of Drienikova and Sakal (2012) whose paper
emphasizes the need to focus on all stakeholders. Serves and Tomay (2009) study also
shows that corporate social responsibility and firm‘s value are positively related. Other
empirical evidence that have reported positive relationship between CSR and economic
performance are (Post et al., 2002; Margolis & Wash, 2003; Mc Acadam & Leonard,
2003). A sizable number of papers focus on the relation between CSR and firm
performance. Early studies used either the event study methodology (which is based on
analysis of short-run changes in stock prices as a proxy for firm performance in the
aftermath of a CSR-related event) or regression analysis (which uses an accounting
measure of profitability, such as return on assets, as the dependent variable in a
regression model that ‗explains‘ firm performance). These studies usually attempted to
answer the question: do firms do well by engaging in corporate social responsibility
activities? The reported results have ranged from showing a negative relation between
CSR and firm performance, to showing no relation, to showing a positive relation.

126
Baron (2001) made distinction between altruistic CSR and strategic CSR, Hillman and
Kim (2001) made an observation that empirical tests of the relation between CSR and
firm performance should disaggregate CSR activities into those that are strategic
(stakeholder management) and those that are altruistic (social issue participation). Based
on estimation of a disaggregated model, they reported that there is a positive relation
between firm performance (measured using market value added) and strategic CSR and
a negative relation between altruistic CSR and firm performance. This study therefore
collaborates with the two studies that corporate social responsibility strategy strongly
correlates with financial performance of firms.
4.17 Test of Significance of the Overall Model
The Null hypothesis is that model has not fit (not a single hypothesis has a fit). The null
hypothesis is that at least one hypothesis has a fit:
HO = = = = = = 0
H1 = At least one of the βj is not equal to Zero
The overall model is shown in Table 4.40. It is the model summary. It gives R (Pearson
correlation coefficient) = 0.904 while the R squared is 0.818. R-squared is a statistical
measure of how close the data are to the fitted regression line. It is also known as the
coefficient of determination. The regression model accounts for 81.8 % of the variance.
The more variance that is accounted for by the regression model the closer the data
points will fall to the fitted regression line. Therefore, 81.8% variation in financial
performance can be explained by variation of all predictors combined. This shows that
all the five independent Variables combined have a strong positive relationship with the
independent variable. This implies that there is a strong positive correlation between
predictors and the financial performance of deposit taking SACCOs.

127
Table 4.40: Model Summary b
Model R R
Square
Adjusted R
Square
Std. Error of
the Estimate
Durbin-
Watson
1 .904a .818 .810 .786681253 1.960
a. Predictors: (Constant), orgn use of CSR strategy, Use of offensive strategy, Use of
hold strategy, Use of defensive strategy, Use of swing strategy
b. Dependent Variable: average financial performance
When predictors are combined, there is a very strong relationship between the dependent
variable and all independent variables. The last column gives the Durbin – Watson
value. Durban- Watson is used to test the presence of serial correlation among the
residuals. The value of the statistic varies from 0 to 4. As a general rule of thumb, the
residuals are uncorrelated if the Durbin- Watson is approximately 2. A value close to
zero indicates a strong positive correlation while a value close of 4 indicates strong
negative correlation as postulated by Tabachnick and Fidel (2001). From the model
summary Table 4.40 shows a Durbin – Watson value of 1.960 that is very close to 2 that
imply that there is no serial correlation among the residuals which is good for the overall
model.
Table 4.41: ANOVA a
Model Sum of
Squares
df Mean
Square
F Sig.
1 Regression 319.909 5 63.982 103.385 .000b
Residual 71.170 115 .619
Total 391.079 120
a. Dependent Variable: average financial performance
b. Predictors: (Constant), organization use of CSR strategy, Use of offensive strategy,
Use of hold strategy, Use of defensive strategy, Use of swing strategy

128
The Null hypothesis of the overall model stated that: There is no fit for the overall
model. The Alternative hypothesis is that there is a fit in the overall model or for at least
one strategy. The ANOVA Table 4.41 tests significance of the overall model. From the
table, F value is 103.385. The p - value of the overall model is 0.000. The level of
significance (α) is 5% = 0.05. Value is given by 116 @ 5 degree of freedom
= 13.45. Conclusion is made that since P – value (0.000) is less than Alpha (0.05) we
therefore reject the Null hypothesis and conclude that there is a fit in the overall model.
This is also confirmed by the fact that F calculated = 103.385 ˃ F critical = 13.45, and
hence the null hypothesis should be rejected. This means that the entire model has a
significant positive relationship with the financial performance of deposit taking
SACCOs. Therefore, even though DTS are member based financial institutions they
strive to manage various groups of stakeholders with intention achieving their objective.
They do also engage in corporate social responsibility albeit in a small scale. They
believe that this helps in improving staff motivation, enhances SACCO‘s image and help
them in marketing their products.

129
Table 4.42: Coefficients a of the Overall Model
Model Unstandardize
d
Coefficients
Standardize
d
Coefficient
s
t Sig. 95.0%
Confidence
Interval for B
Correlations
B Std. Error
Beta Lower Bound
Upper Bound
Zero
-order
Partial Part
1 (Constant) .711 .452 1.574 .118 -.184 1.606
Use of
swing strategy
.554 .132 .266 4.207 .000 .293 .816 .783 .365 .167
Use of
offensive strategy
.340 .143 .139 2.374 .019 .056 .624 .715 .216 .094
Use of
hold
strategy
.351 .130 .152 2.708 .008 .094 .607 .706 .245 .108
Use of
defensive strategy
.253 .132 .112 1.920 .057 -.008 .514 .700 .176 .076
orgn use
csr strategy
.833 .126 .397 6.630 .000 .584 1.082 .819 .526 .264
a. Dependent Variable: average financial performance
The coefficient Table 4.42 shows the predictors coefficients. The constant (α) has a
coefficient of 0.711; Swing strategy = 0.554; Offensive strategy =0.34; Hold strategy =
0.351; defensive strategy = 0.253 while corporate social responsibility strategy = 0.833

130
Table 4.43: Residuals Statistics
Minimum Maximum Mean Std.
Deviation
N
Predicted
Value
5.96753073 12.1165657
0
9.97577104 1.632761727 121
Residual 1.738227248 2.65803480
1
0E-9 .770117687 121
Std.
Predicted
Value
-2.455 1.311 .000 1.000 121
Std.
Residual
-3.379 2.210 .000 .979 121
a. Dependent Variable: average financial performance
Table 4.43 of the entire model gives the predicted values of financial performance of the
deposit taking SACCOs. The highest performance based on the three measures was
12.12 while the minimum was 5.98. The mean financial performance of the
representative SACCOs was 9.976. The table also gives maximum and minimum errors
of estimate (the difference between the actual and the predicted value).

131
Figure 4.39: Partial Regression Plot for Dependent Variable and Hold Strategy
The scatter plot in Figure 4.39 presents a graphical relationship of the linear relationship
between adoption of hold strategy and DTS‘s financial performance. It shows that there
is a positive linear relationship between predictor and dependent variable.
Figure 4.40: Partial Regression Plot for Dependent Variable and Offensive Strategy

132
The relationship between offensive strategy predictor and financial performance is
graphically represented in Figure 4.40. The scatter plot shows a strong positive
relationship between offensive strategy adoption and deposit taking SACCOs financial
performance.
Figure 4.41: Partial Regression Plot for Dependent Variable and Defensive
Strategy
Figure 4.41 is a graphical representation that shows that the relationship between
defensive strategy and deposit taking SACCOs financial performance is a linear positive
correlation. It shows a positive relationship between corporate social responsibility
(independent variable) and financial performance (dependent variable).

133
Figure 4.42: Partial Regression Plot for Dependent Variable and CSR Strategy
Figure 4.42 show a graphical representation of the relationship between corporate social
responsibility and financial performance of deposit taking SACCOs. It shows that the
relationship between the dependent variable (financial performance) and independent
variable (CSR strategy) is a strong, positive linear one.
The overall model agrees with Kakadabse et al (2005) who observed that the concept of
corporate social responsibility and stakeholder management has been intertwined and
hence one may have to look at the two together as it was done in this study. Other
scholars like Cunning and Doh (2000) and Freeman and Mcvea (2001) have observed
managing all stakeholders can have a powerful effect in the feasibility of an organization
achieving its strategic goals. Serves and Tomay (2009) shows that corporate social
responsibility and firm‘s value are positively related.

134
4.17.1 Prediction Model of the Study Variables
From the coefficient table, the outcome can be predicted by the model:
Deposit taking SACCOs Financial Performance = α + (Offensive strategy) +
(Defensive Strategy) + (Swing Strategy) + (Hold Strategy) + (Corporate Social
Responsibility Strategy) + error term
Y = α + + + + + + ε
The output in the coefficient table gives us the parameters for model prediction. The
prediction model becomes:
Ῠ= 0.711+ 0.349 + 0.253 + 0.554 +0.351 +0.833 + ε
4.17.2 Test of Multicollinearity
The diagnostic procedure is done to check multicollinearity as shown by output in Table
4.44. The standard issue in multicollinearity is that the standard errors and variances of
the estimated coefficients are inflated when multicollinearity exist (Simon, 2004).
Variance inflation factor analysis (VIF) which is widely used measure of the degree of
multicollinearity of the independent variable in a regression model (O‘Brien, 2007) is
carried out. The variance inflation factor (VIF) indicates whether a predictor has a strong
linear relationship with other predictor (s). There are no hard and fast rules about what
value of the VIF should cause concern. However, Myers (2000) suggests that a value of
10 is high enough to cause a researcher to worry. Closely related to the VIF is the
tolerance statistics, which is the reciprocal of VIF (1/VIF). On the same line, Field
(2009) postulates that values below 0.1 indicate serious problem that should be
addressed.
VIF analysis was therefore performed to determine whether any of the predictors had a
strong linear relationship with other predictor(s). The highest VIF is 2.525 and the
lowest is 1.981.The higher the VIF, the higher the redundancy of the variable in

135
question. Only VIF of more than 10 can prompt us to drop the variable. The tolerance
figures are all above 0.1 as shown in the fourth column in Table 4.44. The independent
variables therefore have no strong multicollinearity among other independent variables
and therefore no variable was considered to be dropped.
Table 4.44: Collinearity Diagnosis
Dependent Variable: average financial performance
4.17.3 Overall Conceptual Framework
Arising from the optimal model derived from the inferential analysis an optimal
conceptual frame work corresponds with the proposed frame work shown in Figure 2.1
in chapter two. All the predicted null hypotheses were rejected as shown in Table 4.45
and the alternative hypothesis were supported.
Model 95.0% Confidence
Interval for B
Collinearity
Statistics
Lower
Bound
Upper
Bound
Tolerance VIF
1 (Constant) -.184 1.606
Use of offensive
strategy
.056 .624 .460 2.176
Use of hold strategy .094 .607 .505 1.981
Use of defensive
strategy
-.008 .514 .466 2.147
Use of swing strategy .293 .816 .396 2.525
orgn use of CSR
strategy
.584 1.082 .442 2.261

136
Table 4.45: Hypothesis and Empirical Evidence
Null Hypothesis Empirical Evidence
There is no significant relationship between Swing strategy
in stakeholder management and deposit taking SACCO
financial performance.
Not Supported
There is no significant relationship between defensive
strategy in stakeholder management and deposit taking
SACCO financial performance.
Not Supported
There is no significant relationship between hold strategy in
stakeholder management and Deposit taking SACCOs
financial performance.
Not Supported
There is no significant relationship between hold strategy in
stakeholder management and Deposit taking SACCOs
financial performance.
Not Supported
There is no significant relationship between corporate social
responsibly strategy and Deposit taking SACCOs‘ financial
performance.
Not Supported
4.18 Discussion
The result on the assessment of the relationship between generic stakeholder strategies
and financial performance of deposit taking SACCOs has shown a relatively strong
positive relationship. The overall model was found to have a fit with a high Pearson‘s
correlation coefficient. The research found that some strategies were more popular than
other but all the five strategies: offensive strategy, defensive strategy, hold strategy,
swing strategy and CSR strategy have a strong combined positive correlation. This
agrees with study done by Smakalova (2012) who looked at these strategies as
marketing strategies. It also collaborates with Hilman and Keim (2001) who argue that
key stakeholders create intangible assets which can create competitive advantage and

137
that there is need for a company to build good relationships. Other scholars like Soriano,
Torres and Rosalen (2009) observe that there is need for firms to establish stakeholders‘
need and expectations for this has strategic importance in identifying critical factors of
success that is necessary for formulation of strategy. In his study (Minyu 2011) found
that firms interviewed tended to use different strategies for managing their stakeholders.
He observes that stakeholders may have impacts of competitive advantage either on
resource advantage or positional advantages by their various influences. On the same
line of Blair (2015) carried out a study on stakeholder management perspective on
military health care and observed that there was a need to classify types of stakeholders
and to come up with strategies for dealing with each type.
This study found that majority of top management in deposit taking SACCOs were
adopting offensive strategy to manage stakeholder group that have relatively high
cooperative potential and relatively low competitive threat. There was a positive
relationship between the DTS that adopted offensive strategy and their financial
performance. Stakeholders with a high cooperative potential and low threatening
potential were classified as Offensive by Freeman and Mcvea (2001). He suggested that
the firm should adopt an offensive strategy to bring about the cooperative potential and
therefore the stakeholder's positive orientation is exploited. Savage et al (2010) and
Eskerod and Vaagaasar (2015) looked at stakeholder management strategies and
observed that the main objective of stakeholder strategy is to transform the stakeholder
relationship from a less favorable to a more favorable one especially for a mixed
blessing stakeholder group.
The study reported a positive relationship between adoption of defensive strategy and
the financial performance of deposit taking SACCOs. The strategy is being adopted by
deposit taking SACCO in wading off competition from other firms like commercial
banks and micro finance institutions. Other scholars like Lee (2014) have argued that
defensive strategies are used by market leaders in strategic management. He argues that
small-businesses that have reached a market-leading position may need to use such

138
strategies. The goal of these strategies is fighting off competitors who try to take away
the firm‘s market share. When a firm uses this strategy, it defends its market share by
diversifying into new markets and niche segments. The idea behind the strategy is that if
a firm loses its market share in the existing market it can make up for it in these new
markets. There is however a danger of the flanking defense is that it can stretch firm‘s
resources thin and pull attention away from firm‘s main focus. The counter-offensive
defense is a retaliatory strategy. When a competitor attacks the firm‘s business, it can
strike back with its own attack.
The relationship between adoption of hold strategy and the financial performance of
deposit taking SACCOs was found to be a positive relationship. Hold strategies involves
maintaining the status quo (the current position or programs), it involves monitoring this
group of stakeholder for changes in their position. Hold strategy according to
Smakalova (2012) should be adopted when a group is marginal. The company should
continue with its current strategic program when managing stakeholders with low co-
operating and low threatening as they are less important. The organization can also
changes its behavior to address stakeholder concern and try to reinforce this
stakeholder‘s belief as postulated by Galbreath (2006) and Smakalova (2012).
The research finding on the relationship between adoption of swing strategy and the
financial performance of deposit taking SACCO was equally positive. Freeman (2001)
suggested that those with high cooperative and threatening abilities were Swing
stakeholders, as these stakeholders can either assist or hinder organizational activities.
Galbreath (2006) study results suggest that some primary stakeholder groups, but not all,
positively affect firm performance. More specifically, corporate governance and
employee management were significantly and positively associated with performance.
Freeman et al (2004) came up with stakeholder strategy matrix model suggests that
firms will design strategies to address stakeholders' interests, depending on these
stakeholders' abilities to threaten and cooperate (i.e. influencing ability) with
organizations (i.e. a 2×2 matrix). Stakeholders' position in the two dimensional matrix

139
allows the firm to determine the most appropriate strategies for managing firm
stakeholder relationships. Eskerod and Vagaasar (2015) studied stakeholder
management strategies and practices during a project course and suggested use of
integrative strategies to create a win- win outcome.
Individually, the relationship between corporate social responsibility strategy and
financial performance of deposit taking SACCOs was found to be the strongest. Top
management of deposit taking SACCOs who adopted the CRS strategy were the
majority of the representatives who were interviewed. DTSs who adopted the CSR
strategy were found to be performing well compared with those who were not. A
majority of top management interviewed also believed that adopting CSR strategy also
enhanced their Sacco‘s image and reputation, improved their staff motivation, enhanced
marketing their products and services and improves their relationships with communities
around them. This concurs with Mc Elhaney (2009) who postulates that proven financial
benefits of strategic CSR can be found in the area of human resources, reputation and
branding, and operational cost saving. Drienikova and Saka‘l (2012) also observed that
to reach the win-win or successful corporate social responsibility strategy in a company,
all the stakeholders must be included into the responsible business. Serves and Tamay
(2013) in their study shows that corporate social responsibility and firm value are
positively related for firms with high customer value. Other scholars, Odetayo, Adegemi
and Sajuyigbe (2014) and Babajde and Ogundare (2015) looked at the impact of CSR on
profitability of banks. They studied banks and found out that there was a positive
relationship between CSR and financial performance of bank

140
CHAPTER FIVE
SUMMARY, CONCLUSION AND RECOMMENDATIONS
5.1 Introduction
This chapter contains the summary, conclusion and recommendations on stakeholder
generic management strategies and performance of deposit taking SACCOs in Kenya.
Presentation of the finding, conclusion and recommendations were done in line with the
study‘s specific objectives. Areas for further research were suggested and limitations of
the study were taken into consideration.
5.2 Summary of Major Findings
The purpose of the study was to examine the relationship between generic stakeholder
management strategies and the financial performance of deposit taking SACCOs in
Kenya. All independent variables showed a positive relationship with the financial
performance of deposit taking SACCOs. Descriptive and inferential statistics were used
to analyze the data from 64 deposit taking SACCOs in Kenya. Cronbach‘s Alpha was
carried out to determine reliability of the research instrument. The test gave a high
Cronbach‘s Alpha that implied high reliability of the research instruments. This implies
that there was internal consistency and that the research instrument is reliable.
Multicolliality test was carried out and an inflation factor analysis factor (VIF) was
found to be within the acceptable ranges. This implies that there was no multicolliniarity
among the predictors. The following indicate the summary of each individual objective.
5.2.1 Relationship between Offensive Strategy and Financial Performance of DTS
The first objective of the study was to examine the relationship between adoption of
swing strategy and performance of deposit taking SACCOs in Kenya. The study findings
were that top management was conscious of having different stakeholders some of

141
whom are co-operative while others pose serious threat through their actions or what
they are likely to do.
Descriptive statistics indicates that majority of senior managers and executive directors
were adopting offensive strategy. Offensive strategy was seen to be employed to
supportive stakeholders like the employee, customers, other managers in the
organization and suppliers of DT SACCOs.
Finding shows that offensive strategy adoption on its own while other factors were held
constant had a significant influence on the financial performance of DT SACCOs. When
analyzed with other predictors, the relationship becomes even stronger. This implies that
when all the suggested strategies in the conceptual frame work are used together, the
financial performance of deposit taking SACCOs is enhanced.
The finding agrees with Šmakalova (2012) observation from a case study of thirteen
industries that offensive strategies should be adopted if a stakeholder group has
relatively high cooperative potential and relatively low competitive threat. Other
scholars like Mishra and Suar (2010) suggested that firms should make decisions to
involve their key stakeholders in decision making. This according to him would create
good relationship and motivation towards achievement of firm‘s objectives. Minyu
(2012) found out that proactive management of stakeholders is a source of competitive
advantage. Strategic management literature shows that firms that have core competitive
advantage have high financial performance.
5.2.2 Relationship between Hold Strategy and Financial Performance of DTS
The second objective was to examine the relationship between the hold strategy
adoption and performance of DT SACCOs in Kenya. Results indicated that adoption of
hold strategy individually and when combined with other predictors has a significant
influence of financial performance of deposit taking SAACOs in Kenya. When used
together with other predictors, the relationship becomes even stronger. However it was

142
found that a few managers were neutral of adopting this strategy than in any other
predictors. This means that they did not give it much weight as was the case with other
strategies.
Inferential analysis indicates that there is a significant positive, relationship between
hold strategy adoption and good financial performance of deposit taking SACCOs. The
regression analysis was significant since alternative hypothesis was true β1≠ 0. This
implied that there is a significant relationship between adoption of swing strategy and
financial performance of deposit taking SACCOs in Kenya. The finding collaborates
with other scholars like Smakalova (2012) and Galbreath (2006) who suggested that
stakeholders with low co-operation and law threatening abilities should only be closely
monitored.
5.2.3 Relationship between Defensive Strategy and Financial Performance of DTS
The third objective was to examine the relationship between adoptions of defensive
strategy and the financial performance of deposit taking SACCOs. Descriptive statistics
gave a high mean value and a high percentage which implies that a big number of senior
managers are adopting defensive strategy to minimize or prevent competitive threats
from competitions.
Results indicated that adoption of defensive strategy individually and when combined
with other predictors has a significant influence of financial performance of deposit
taking SAACOs in Kenya. The research findings showed a significant positive,
relationship between defensive strategy adoption and good financial performance of
deposit taking SACCOs. The regression analysis was significant since alternative
hypothesis was true. This implied that there is a significant relationship between
adoption of defensive strategy and financial performance of deposit taking SACCOs in
Kenya.
The finding concur with other scholars like Johnson and Scholes (2002) who suggests
that stakeholder matrix can be useful in managing different groups of stakeholders. The

143
matrix suggests that strategies for dealing with stakeholders can be determined based on
stakeholder ability to cooperate and threaten organizational outcomes. It also agrees with
stakeholder theory that suggests that organizations that address stakeholder interests will
somehow perform ―better‖ than firms that do not address these group interests as noted
by Post et al, (2002). This also implies that member based firms (where members are
also the customers) should proactively manage their stakeholders for better long term
financial performance.
5.2.4 Relationship between Swing Strategy and Financial Performance of DTS
The fourth objective of this study was to examine the relationship between adoptions of
swing strategy and the financial performance of deposit taking SACCOs in Kenya. It
gave above average mean value and a high percentage of those managers employing
swing strategy. This implies that a big number of senior managers were adopting swing
strategy.
Regression analysis gave line of best fit as shown in the model summary of the predictor
Table 4.21. This indicates that there is a significant positive relationship between swing
strategy adoption and good financial performance of deposit taking SACCOs. When
analyzed among other predictors in overall model, the relationship becomes stronger and
the correlation coefficient and coefficient of determination increased. The regression
analysis was significant since alternative hypothesis was true β1≠ 0. This implied that
there is a significant relationship between adoption of swing strategy and financial
performance of deposit taking SACCOs in Kenya.
This finding agrees with Freeman (2001) who suggests that firms should collaborate
with stakeholders that are mixed blessing. Polonsky et al (2005) also argue that firm
should collaborate with these stakeholders to maximize their positive influencing
abilities and minimize threatening abilities. Smakalova (2012) in his case study of
industrial companies in the Czech Republic in two periods- in 2010 and 2011 concludes
companies should adopted swing strategy for stakeholders who can either helps or
144
defends activities of companies. Deposits taking SACCOs were for instance found to be
co-operating with some commercial banks which can be explained along the same line.
For example, Unaitas SACCO collaborates with Family Bank while many other deposit
taking SACCOs collaborate with Co- operative Bank.
5.2.5 Relationship between CSR and Financial Performance of DTS
The fifth objective was to examine the relationship between adoptions of corporate
social responsibility strategy and the financial performance of deposit taking SACCOs.
Descriptive statistics gave a high mean value and a high percentage that managers
interviewed engage in corporate social responsibility. This implies that a big number of
senior managers were adopting corporate social responsibility strategy.
Results indicated that adoption of CSR strategy individually and when combined with
other predictors has a significant influence of financial performance of deposit taking
SAACOs in Kenya. When used individually correlation coefficient was relatively lower.
When used together with other predictors, the relationship becomes even stronger.
Inferential analysis indicates that there is a significant positive, relationship between
corporate social responsibility strategy and financial performance of deposit taking
SACCOs. The regression analysis was significant since alternative hypothesis was true
β1≠ 0. This implied that there is a significant relationship between adoption of CSR
strategy and financial performance of deposit taking SACCOs in Kenya.
These finding on corporate social responsibility strategy collaborate with other scholars
who observe that strategic philanthropy can create new market opportunities, improve
social relations and take advantage of opportunities for innovation (Porter & Kramer,
2006). Other evidence has shed light on a positive relationship between CSR programs
and economic performance (Post et al., 2002; Margolis & Walsh, 2003; McWilliams,
Siegel & Wright 2006; McAdam & Leonard, 2003). Serves and Tomayo (2013)
observed that CSR and firm‘s value are positively correlated for firm with high customer
awareness.

145
5.3 Conclusions
The study findings clearly show that deposits taking SACCOs proactively engage all
stakeholder groups using offensive strategies, hold strategies, defensive strategies, swing
strategies and corporate social responsibility strategies. When these strategies are used
individually or when combined had a strong positive relationship with the financial
performance of deposit taking SACCOs.
The finding show top management has higher preference for certain strategies when
managing different stakeholder groups. Offensive strategy for instance is used when
managing internal customers and supportive stakeholders like suppliers, government
representatives. Swing strategy was used to manage mixed blessing groups of
stakeholders by collaborating with them to maximize their positive influence. Hold
strategy was the least used while defensive strategy was highly used when managing
stakeholders like competitors who pose threat to the deposit taking firms. CSR strategy
was highly adopted when managing internal employee, the community and the
ecological environment.
Although majority of deposit taking SACCOs were seen to adhere to and demonstrate
their commitment to CSR, a few were struggling to do that. DT SACCOs use CSR
activities to position their corporate brand in the eyes of consumers and other
stakeholders, such as through their member‘s education days and during their annual
general meetings when presenting reports. Managers also believed that by engaging in
CSR activities, it played a key role in motivating the staff, helped enhance their
corporate image and also improved the effect of their marketing and community
relations. This implies that even though the main motive of business is to earn profit,
organizations should take initiative for welfare of the society and should perform its
activities within the framework of environmental norms strategically.
Other strategies used by top management in deposit taking SACCOs other than those
suggested in the questionnaire are: Communication strategy - A few managers said that

146
they have a full stakeholder engagement plan for each group of stakeholder; members‘
education forum, proactive partnership management and stakeholder events that involve
partners and members to develop relationships.
5.4 Recommendations
Proactive stakeholder management is paramount in managing relationships of different
stakeholder groups in all organizations including member based firms like deposit taking
SACCOs. Top management in deposit taking SACCO and other firms should strive to
know and understand their stakeholders and their stakes. They should also seek to
understand the opportunities and challenges that different stakeholders present and the
legal, ethical and philanthropic responsibilities that the firms have. The opportunities
created should help to build good productive working relationships with the stakeholders
while challenges presented by stakeholders should be a representative of how the firm
handled the stakeholder. The managers should determine the ideal generic strategies to
use for each stakeholder group depending on the level of their power and interest in the
firm. Understanding various stakeholders is therefore critical so that the management
can know how to engage with every group.
From the research findings, offensive strategy should be used on supportive stakeholders
like employees, managers and suppliers. These stakeholders should be involved in when
developing the firm‘s strategic plans and policies. The management should seek the
views of these stakeholders and at times adopt their views. They should be kept
informed about major firm‘s plans and programs since they have high co-operative
potential and low competitive potential. When supportive stakeholders‘ perceptions or
objective towards the firm is not very good, the management should seek to correct it.
Hold strategy should be used on marginal stakeholders who have low co-operative and
cooperative potential. The management should seek to reinforce these stakeholders‘
perception about the firm. The management should monitor this stakeholder for change
in position, beliefs, behavior or attitude. The firm can hold its current position and

147
continue with its current strategic program or it can seek to change its own behavior to
address this stakeholder‘s concern. The stakeholder group can be involved in strategy
formulation if the stakeholder group has the interest or be ignored if otherwise.
Defensive strategy should be used on non- supportive stakeholders who have law
cooperative and high competitive threats like competitors. The management should
defend the firm from against such competitors so us to protect its market share, position
and profitability. The primary objective of employing this strategy is to make possible
attack unattractive and to discourage competitors from attacking. The management
should strive for continuous improvement in cost reduction, quality improvement and
new product development. The firm should also reduce dependence on such competitors
while motivating its staff to improve its existing products, be innovative and diversify
into new markets.
Corporate Social Responsibility (CSR) can be used by every corporate body to protect
the interest of the key stakeholders and the society at large. Even though the main
motive of business is to earn profit, firms should take initiative for the welfare of the
society and should perform its activities within the framework of environmental norms.
Strategic philanthropy can create new market opportunities, improve social relations and
take advantage of opportunities. Engaging in CSR has shown to be beneficial to both the
community receiving it and to the firm itself. Research has proved that engaging in CSR
activities enhances the firm‘s image; motivates the staff; creates a good forum for
marketing of firm‘s products and services while it improves the relations with the
communities within which the firm is operating. These should be enough justifications
for firms, including medium sized to use corporate social responsibility as a strategy.
However, corporate social responsibility should be used as a strategy and not as
disjoined philanthropic activities. This prevents the management misusing it for any
selfish gain. It should be incorporated in the firm‘s strategic plan for better results.
Corporate social responsibility need to be moved from strategically philanthropic
activities to an integrated business strategy linked to core business objectives and core

148
competencies. This is true because even customers and supplies are not only interested
with mere transactions but also in building good relationships. This will help to enhance
the positive financial returns for the company/firm as well as positive social or
environmental impact.
5.5 Implications of the Study
Deposit taking SACCO and indeed other for – profit firms should take stakeholder
management with the seriousness it deserve. This study has policy, practical and
theoretical implications as stipulated here below.
5.5.1 Policy Implication
Firms shall start seeing the sense of formulating policy document that will help to
enhance proactive stakeholder management. This brings numerous benefits to DT
SACCOs and other firms like: Receiving support for key strategic business
developments from stakeholders; stakeholders supporting the firm to gain influence and
to achieve its organizational objectives; increase leverage and influence within the firm;
support from stakeholders to compete effectively & improve financial stability; Improve
the reputation of DTSACCO/ firm; enable firm to define its strategies and objectives for
the future; increase employee motivation and stakeholder engagement; improve
communications and feedback with stakeholders.
5.5.2 Practical Implication
This study gives managers top management confidence that proactive stakeholder
management enhances stakeholder confidence on the management of the SACCO,
improves the image and financial performance. The study suggests that investment in
proactive stakeholder management is a means of gaining competitive advantage.
Ademba (2011) observes that SACCOs in Kenya are faced by such problems as; poor
governance and, lack of members‘ confidence, among others, while Ndung‘u (2010),

149
adds that the SACCOs are encompassed by mismanagement and poor investment
decisions that leave many stakeholders dissatisfied. This study go along in encouraging
enhancement of proactive stakeholder management of all stakeholders in DTSs, hence
improving corporate governance and members‘ confidence in the way their
organizations are managed.
Deposit taking firms and other for- profit firms will see the need for grouping their
stakeholders through stakeholder analysis. They will also see the logic of managing
different stakeholder group depending on their relative power and interest for strategies
and programs being implanted in the firms by the management. Managers will see the
sense and the need to employ different strategies for different stakeholder depending on
their categorization.
5.5.3 Implication on Stakeholder Management Theory
This study adds to the body of knowledge on stakeholder management. It contributes to
the pool of knowledge in stakeholder management in SACCOs by enhancing
stakeholder strategies that can be used in managing various groups of stakeholders. This
will help in enhancing DTSs performance and in creating value to those stakeholders.
The study confirms stakeholder theory. It also stipulates that there are particular
strategies that should be used for specific groups and that managers should not think of
using a one - suit - all strategy. The study removes any doubts on management of
stakeholders by member - based firms, where the customer is also the member. Previous
studies had not focused on member- based organizations like clubs and SACCOS and it
was not clear on the strategies they employ in management of their different categories
of stakeholders and whether they are very thrift to engage in corporate social
responsibility activities in a strategic manner.

150
5.6 Area for Further Research
The researcher focused on the instrumental approach of stakeholder management by
examining use of stakeholder management strategies and the relationship with DTS
SACCO financial performance. Instrumental theory would show that firms who consider
their stakeholders devise successful strategies. Further studies should look at normative
perspective to describe why firms should give consideration to their stakeholders. A
cross section study can be made covering a longer period.
The study looked at stakeholder management generic strategies relationship with
financial performance of deposit taking SACCOS. However, financial performance is
not a consequence of a single variable like strategies. Further studies can incorporate
other variables like advertising and good leadership. Furthermore, deposit taking
SACCO‘s financial performance was based on three parameters namely Return on
Assets, Return of Equity and Liquidity (Liquid Assets to Total Assets) for a period of
two years. A cross section study covering longer period can be undertaken to validate
the finding in this study.

151
REFERENCES
Ademba, C. (2011). Benefits of Regulated SACCO subsector: SACCO Star, p. 5-6
Ahmed, N. Arslam, M., & Rohail, H. (2013). The Importance of Business ethics in
Corporate World. Retrieved from:
http://www.slideshare.net/SyedArslan/importance-of business ethics
Alan, B., & Emma, B. (2003). Business Research Methods (3rd
ed.). London: Oxford
University Press.
Andriof, J. & Waddocks, J. (2013). Unfolding Stakeholder Engagement. Boston, Green
reef publishers. Retrieved from: htt: //www.greenleaf- publishing.com /content
/pdf.
Bagchi, A. (May 2005) Varieties of Employee Ownership: The Unintended
Consequences of Corporate Law and Labor Law, p 2.
Baker, M. (2003) Corporate Social Responsibility – What does it mean? Retrieved from
http://www.mallenbaker.net/csr/CSRfiles/definition.html.
Bal, J. (2007). Treasury Management for SACCOs, Procedure guidelines and training
Manual : Chemonics International Inc.
Baron, D. (2001). Private politics, corporate social responsibility and integrated strategy.
Journal of Economics and Management Strategy, 10(3), 7–45.
Baxter, W. (2007). Research Methodology. New Delhi: Pearson Publishers
Bayne, T., & Montague, M. (2011), Cognitive Phenomenology. Oxford and New York:
Oxford University Press.
Birch, D. (2002). Social, economic and environmental capital; corporate citizenship in
the new economy: Alternative Law Journal, 27(1), 1-23.
Blair, J.D. (2015). A Stakeholder Perspective on Military Health Care. Sage Journals,
armed Forces & Society, 18(3), 548-575.

152
Borg, W.R, Gall., M.D., & Gall, J.P. (2003). Applying Education Research: A practical
Approach (6th
ed.). Boston: Pearson Education.
Borg, W.R., Gall., M.D., & Gall, J.P. (2007). Educational Research: An introduction.
Boston: Pearson Education.
Bradley, R. (2004). Defensive Strategies in Strategic Management: Demand Media.
Retrieved from: http// www.yourbusiness.azcentral.com -4676.
Branch, B. (August, 2005) Working with savings & credit cooperatives. SACCO Star,
pp.15.
Breitbarth, T., Walze,l S., Anagnostopoulos, C. & Eekeren, F. (2015), Corporate social
responsibility and governance in sport: Oh, the things you can find, if you
don‘t stay behind! Corporate Governance, 15(2), 254 -273.
Browne, J. & Nuttal, R. (2013). Beyond corporate social responsibility: Integrated
external engagement, Insight and Publication. Retrieved from
http://www.mckinsey.com/insights/strategy/beyond_corporate_social_responsi
bility_integrated_external_engagement.
Burnes, B. (2004). Managing Change: A Strategic Approach to Organizational
Dynamics, Edinburgh gate; Hallow: Prentice Hall, Pearson Education Limited.
Cabral, L. M. (2000). Introduction to Industrial Organization, Cambridge: The MIT
Press
Chuno, J.C. (2013). The effect of Regulatory Compliance on Financial Performance of
Deposit Taking SACCOs: A case study of South Rift Region. Unpublished
MBA Research Project, Nairobi: University of Nairobi.
Cooper, D.R. & Schindler, P.S. (2006). Business Research Methods, (9th
ed.). New Delhi
– India: Mc Graw – Hill Publishing, Co. Ltd.
Commission of the European Communities. Brusel (2013). Green Paper: Promoting a
European Framework for Corporate Social Responsibility. Retrieved from:

153
Dostupnénainternete:http://eurlex.europa.eu/LexUriServ/site/en/com/2001/com
2001_0366en01.pdf
Creswell, J. W. (2009). Research design: Qualitative, quantitative, and mixed methods
approaches (3rd
ed.). Los Angeles: SAGE Publications.
Cuevas, C., & Fischer, K. (2006). Cooperative Financial Institutions: Issues in
Governance, Regulation and Supervision, World Bank Working Paper No 82.
Cummings, J.L.& Doh, J.P., (2000). Identifying who Matters: Mapping Key Players in
Multiple Environments. California Management Review 42(2), 83 -104.
Dahlsrud, A. (2006). How corporate social responsibility is defined: An analysis of 37
definitions. Corporate Social Responsibility and Environmental Management,
15(3), 1-13.
Davis, G.F. & Cobb, J.A. (2009). Resource Dependence Theory: Past and Future, in:
Sociology of Organizations 28(2), 21-42.
Deshpande, R., (2006). Safe and Accessible: Bringing Poor Savers into the Formal
Financial System, Focus Note, No 37.
Dodd, M., D & Supa, D. (2011). Understanding the Effect of Corporate Social
Responsibility on Consumer Purchase Intention, Public Relation Journal 5(3),
116-126.
Dowling, G.R. (1994). Corporate Reputations- Strategies for Developing the Corporate
Brand. Melbourne: Longman Professional.
Drienikova, K., & Sakal, P. (2012). Respecting Stakeholders and their Engagement to
Decision Making – The way of successful Corporate Social Responsibility,
Unpublished PhD thesis, Bratislava: Slovan University of Technology in
Bratislava.
Dudik, E. M. (2000). Strategic Renaissance. New York: Amacom.
Eden, C., & Ackermann (2011). Strategy as Stakeholder Management, Lecture Notes -
Strathclyde Business School

154
Esposito, J. L. (2002 November). Interactive, multiple-method questionnaire evaluation
research: A case study. Paper presented at the International Conference in
Questionnaire Development, Evaluation, and Testing (QDET) Methods.
Charleston, SC.
Fontain, C., Haarman, A. & Schmid, S. (2006). The Sakeholder Theory. Retrieved from
http//edalys.frl document/com.
Freeman, R.E. (2010). Strategic Management: a Stakeholder Approach, Cambridge:
Cambridge University Press.
Freeman, R.E & McVea, J. (2001). A Stakeholder Approach to Stakeholder
Management. Working Paper No. 01 - 02, University of Virginia. Retrieved
from :http://papers.ssrn.com/paper.taf?abstract_id=263511.
Friedman, L. & Miles, S. (2006) Stakeholders Theory and Practice. Oxford: Oxford
University Press.
Faraway (2002). Practical Regression and ANNOVA using R, Retrieved from
http.//cran.project.org/doc/contrib./Farawau-PRA.pdf >data (gala).
Field, A. (2009). Discovering Statistics using SPSS (3rd
ed.). London: SAGE
Publications Ltd.
Gabrieath, J. (2006). Does Primary Stakeholder Management Positively affect Bottom
Line? Management Decision, 44(5), 1106 -1121.
George, D., & Mallery, P. (2003). SPSS for windows step by step: A simple guide and
reference update (4th
ed.), Boston: Allyn and Bacon.
Gliem, J.A. & Gliem, R.R (2003). Calculating, Interpreting and Reporting Cronbach‘s
Alpha Reliability Coefficient for Likert - Type Scale. Midwest Research for
Practice Conference in Adult, Continuing, and Community Education.
Grant, R.M. (2001). The Resource Based Theory of Competitive Advantage. California
Management Review Journal, 4(2), 114 – 135.

155
Greenfield, W.M. (2004). Decision Making and Employee Engagement. Employment
Relations Today 31(2), 13–24.
Grier, W. A. (2007). Credit Analysis of Financial Institutions. Euromoney Institution
Investor PLC.
Gunga, S.O. (2010). The Co-operative Movement in Kenya and its Potential for
enhancement of ICT livelihoods. Unpublished PhD thesis, Nairobi: University
of Nairobi.
Herman, S. (2005). Corporate Sustainability Branding – Nachhaltigkeits- und.
Hillman, A.J. & Keim, G.D. (2001). Stakeholder Values Stakeholder Management and
Social Issues. Strategic Management Journal 22(3), 125 – 130.
Hillman, A.J., Withers, M.C. & Collins, B.J. (2009). Resource Dependence Theory: A
Review, in. Journal of Management, 56( 3), 1404–1427.
Hubber, M., Sharioth J., & Pallas, M. (2004). Putting Stakeholder Management into
Practice. Berlin/ Hidelbergg: J. Printer.
ICMA (2004). Performance Measurement in Counties. Retrieved from:
www.ICMA.org/performance.
Imanda, S. (2014). Is there a Conceptual Difference between Theoretical and Conceptual
Framework? Journal of Social Sciences, 38(2), 184-195.
International Cooperative Alliance (2004). Retrieved from :http://www.coop.org/.
International Co-operative Information Center (1995). Co-operatives and Human
Sustainable Development: Global Perspective. Retrieved from:
http://www.uwcc.wisc.edu/icic/issues/sustain/glob-pers.html.
Idre Regression Diagonistics. (2014) Retrieved from:
http://www.atc.uc/aredu/stat/spss/webbooks/reg/chapter2/spssregr.htm
James, A.K., Ondiek, A., & Musiega, D. (2014). A Comperative Study of Effect of
Interest rates of Deposit Mobilization among SACCO Members in Kakamega

156
County. International Journal of Business and Management Invention), 51(3),
28-41.
Janey, J. J., & Dess, G. (2010). When Entrepreneurs Bundle Resources: Toward an
Integration of Entrepreneurial-Orientation and the Resource-Based View of the
Firm, in M. Afzalur Rahum (eds.), Current Topics in Management, 11(4), 157-
173. New Brunswick, USA: Transaction Publishers.
Jensen, M.C. (2002). Value Maximization, Stakeholder Theory and the Corporate
Objective Function, Business Ethic Quarterly, 12(2), 235-256.
Johnson, G. & Scholes, K. (2002), Exploring Corporate Strategy, Dorling Kindersley,
Delhi
Johnson, G. S. K. & Whittington, R. (2005). Exploring Cooperative Strategy,N.Y:
Prentice Hall.
Johnston K., (2015). The Benefits and Risks of a Product Development Strategy,
Demand Media. Retrieved from http://yourbusiness.azcentral.com/benefits-risks-
product-development-strategy-21011.html.
Joppe, M. (2000). The Research Process. Retrieved from
http://www.ryerson.ca/~mjoppe/rp.htm.
Kakabadse, N.K. Rozuel, C. & Lee-Davies, L. (2005) Corporate social responsibility
and stakeholder approach: a conceptual review, Int. J. Business Governance
and Ethics, 1(4), 277–302.
Karakaya, F. & Yannopoulos, P. (2011). Impact of Market Entrant Characteristics on
Incumbent Reaction to Market Entry, Journal of Strategic Marketing, 19(2),
171-185.
Kiliç, M., Kuzey, C.& Uyar, A. (2015). The impact of ownership and board structure on
Corporate Social Responsibility(CSR) reporting in the Turkish banking
industry, Corporate Governance, 15(3), 357 – 374.

157
Kimutai, G., Gachunga, H., Wanjau., K., & Gichuhi, A.N. (2004). Role of Quality
Management System Cerfification Factors on Health Workforce Performance
in Kenyan Referal Hospitals. Unpublished PhD Thesis, Juja: Jomo Kenyatta
University of Agriculture.
Kinyua, J.M., (2006). An Investigation of the Cause of Poor Performance of KUSCCO
Education and Training Program: A Case Study of Mount Kenya Region.
Unpublished Post graduate Diploma in Business Administration, Nairobi:
Kenya Institute of Management.
Kinyuira, D., Gathenya, J. & Muturi, W. (2014). Influence of Strategic Organization
Components on the Performance of Deposit Taking Savings and Credit
Cooperatives in Kenya, Journal of Business Management, 16(6), 76-82.
Kioko, B. (2010). The impact of SASRA regulations on the financial performance of
SACCO‘s in Kenya, Nairobi: SASRA.
Kiragu, M. & Okibo, B. (2014). Financial Factors Influencing Performance of Saving
and Credit Corporation Organizations in Kenya, International Journal of
Academic Research in Accounting, Finance and Management Science, 1(2),
46-58.
Kolyperas, D., Morrow, S. & Sparks, L. (2015). Developing CSR in professional
football clubs: drivers and phases, Corporate Governance: The international
journal of business in society, 15(2), 177-195.
Kombo, D.K, & Trom, D.L.A. (2006). Proposal and Thesis Writing. Nairobi: Pauline
Publication.
Kothari, C.R. (2004). Research Methodology Methods & Techniques –New Delhi, New
Age International Publishers.
Lamberg, J., Savage, G. & Pajunen, K. (2003). Strategic stakeholder perspective to
ESOP negotiations: the case of United Airlines. Management Decision, 41(7),
383–393.

158
Lee, M.C. (2014). Defensive Strategies in Strategic Management: Demand Media.
Retrieved from: http// www.yourbusiness.azcentral.com 4676
Lee, M.-D. (2008). A review of the theories of corporate social responsibility: its
evolutionary path and the road ahead. International Journal of Management
Reviews, 14(10), 53–73.
Levermore, R. & Moore, N. (2015). The need to apply new theories to Sport CSR,
Corporate Governance: The international journal of business in society, 15(2),
249-253.
Lopez- Carbarcos, M.A., Monteiro, S.G & Rodriguez, P.V. (2015). Organization
Capabilities and Profitability: The Mediating Role of Business Strategy , Sage
Open. Retrieved from : http://www.creativecommons.org/licenses/by/3.0/
Lyon, D.W., & W.J. Ferrier (2002). Enhancing Performance with Product-Market
Innovation: The Influence of the Top Management Team. Journal of
Managerial Issues, 14(3), 452–469.
Maak, T. (2007). Responsible leadership, stakeholder engagement, and the emergence of
social capital. Journal of Business Ethics, 5(4), 329–343.
Makori, J., Munene, C. & Muturi, W. (2013). The challenges Facing Deposit – Taking
SACCOs‘ Regulatory Compliance in Kenya: A Case of the Gusii Region.
International Journal of Contemporary Research in Business, 4(2), 1015-1015.
Markides, C. (2000). All the Right Moves: A Guide to Crafting Breakthrough Strategy,
Boston, Mass: Harvard Business School Press.
Marlin, D., Bruce, T. L. & Scott, W. G. (2004). Diversification Strategy and Top
Management Team Fit. Journal of Managerial Issues, 12(4), 361.
Marczyk, G. ,Dematteo, D. & Festinger, D. (2005). Essentials of Research Design and
Methodology: Hoboken, NJ. John Willy and Son, Inc.
Margolis, J.D. & Walsh, J.P. (2003). Misery loves companies: rethinking social
initiatives by business, Administrative Science Quarterly, 48(3), 268–305.

159
Masongo, E., Gichana, I., Ithai, J., & Nguta, M. (2013). Financial Innovation and
Financial Performance: A Case of SACCOs in Nairobi. International Journal
of Research and Management, 3(15), 93-98.
McAdam, R. & Leonard, D. (2003). Corporate social responsibility in a total quality
management context: opportunities for sustainable growth, Corporate
Governance, 3(4), 36–45.
McElhaney, K. (2003). A Strategic Approach to Corporate Social Responsibility. The
Executive Forum, Dario.
McWilliams, A., Siegel, D.S., & Wright, P.M. (2006). Corporate social responsibility:
strategic implications. Journal of Management Studies, 43(5), 1–18.
Mikwamba, E. & Ng'ombe, B. W. (2004). Know More About SACCO. A Handbook for
SACCO Study Circle Porgramme. Lilongwe: Malawi Union of Savings and
Credit Cooperative [MUSCCO].
Ministry of Cooperative Development and Marketing (2008) Cooperative Development
Policy, 2008. Nairobi: Ministry of Cooperative Development and Marketing.
Minyu, W. (2012). Managing Stakeholders: An integrated Perspective on the Source of
Competitive Advantage. Asia Social Science, 8 (10), 23- 45.
Mishra, S. & Suar, D. (2010). Do stakeholder strategy and salience influence
corporate social responsibility in Indian companies?. Social Responsibility
Journal, 7(3), 306- 327.
Mizberg, R. E. (2010). Patterns in Strategy Formation: Journal of Management
Sciences, 4(2), 87 – 92.
Monitor Report (August 2014). Keeping stakeholders informed. Eurovia Contracting,
Cambridge shire,
Monga, G.S. (2007). Mathematics and Statistics for Economics (2nd
ed.). New Delhi:
Jitendra Offset Printers.

160
Moore, D.S. (2003). The Basic Principals of Statistics (3rd
ed.)W.HG: Freeman
Publishers.
Mudibo, E. K. (2005). Corporate Governance in Co-operatives the East African
Experience. In Conf. Pan-African Consultative Forum on Corporate
Governance.
Mugenda, O.M., & Mugenda, A.G. (2003). Research Methods: Quantitative and
Qualitative approaches, Nairobi: ACTS press.
Mugenda, A. (2008). Statistical Science Research: Theory and Practice. Nairobi:
Kijambe Printing Press.
Muus, K. & Baker – Demaray, T. (2007). Tips on Quantitative Research: Article
Development. New Delhi. Tata McGraw‘s Hill.
Mwakajumilo, N. (2011). Financial Practice as a Determinant of Growth of Savings and
Credit Co-Operative Societies, International Journal of Business and Social
Science, 3(24).
Mwau, M.J. (2013). Does Financing Diversification Matter? An evaluation of the
Performance of Saving and Credit Cooperative Societies: A case of Kakamega
County, Kenya. International Journal of Management and IT, 4(3), 423-445.
Nachmias, C. F & Nachmias D. (2008). Research Methods in the Social Sciences, (5th
ed.). London: Sr. Martin Press Inc.
Ndung‘u, G. (2010). Orderly Movement. Business Post, 1, 28-30.
Njeru, M.D, Njeru, A., Member, F. & Tirimba, I.O., (2015). Effect of Cash Management
on Financial Performance of Deposit Taking SACCOs in Mount Kenya
Region. International Journal of Scientific & Research Publication, 5(2), 45-
63.
Njuguna, P. (2011). Improving SACCO Performance, Capitalization & Merger. Paper
presented at ACCOSCA Regulatory Framework Workshop, Nairobi.

161
Nyasani, J.M. (1982). An introduction to traditional logic. Frankfurt am Main; Bern
Lang.
O‘Brien, M. (2007). A caution regarding rules of thumb for variance inflation factors.
Quality and Quantity, 41(5), 673-690.
Okwee, A. (2011). Corporate Governance and Financial Performance of SACCOs in
Lango Subregion. Unpublished MBA Research Project, Makerere: Makerere
University.
Orodho, A J. (2002). Essential of Educational and Social Sciences Researchers
Methods. Nairobi: Masda publishers.
Polonsky, M.J. (2004). Stakeholder management and the stakeholder matrix: potential
strategic marketing tools. Journal of Market Focused Management, 1(3), 209-
229.
Pendleton, A. (2001). Employee Ownership, Participation and Governance: A Study of
ESOPs in the UK (Vol.4). Routledge.
Polonsky, M. J., & Scott, D. (2005). An empirical examination of the stakeholder
strategy matrix. European Journal of Marketing, 39(9/10), 1199-1215.
Porter, M. & Kramer, M. (2002). The competitive advantage of corporate philanthropy.
Harvard Business Review, 80(12), 56–69.
Porter, M. E. & Kramer, M. R. (2006). Strategy and society: the link between
competitive advantage and corporate social responsibility. Harvard Business
Review, 84, 78–92.
Post, J., Preston, L., & Saschs, S. (2002). Redefining the Corporation. Stakeholder
Management and Organizational Wealth. Stanford Business Books. California:
Stanford University Press.
PROCASUR Africa (2012). An overview and of SACCOs in Kenya: In pursuit of Ideas
to develop Savings and Credit Co-operatives, Learning from Kenya SACCOs,
Nairobi: PROCASUR Africa.

162
Radhakrishna, R. B., Francisco, C. L., & Baggett. C. D. (2003). An analysis of research
designs used in agricultural and extension education. Proceedings of the 30th
National Agricultural Education Research Conference, 528-541.
Ragan, K., Chase, L., & Karim, S. (2012). Every Company needs a CSR Strategy and
How to build it. Working Paper: Harvard Business School.
Richard, G. (2015). Corporate social responsibility in sport: critical issues and future
possibilities, Corporate Governance. The international journal of business in
society, 15(2), 243-248.
Roback, P. (2003). Teaching an advanced method course to mixed audience. Journal of
Statistics Education, 11(3), 1-23.
Robu, N.R. & Savlovschi, L. I(2011). Motivating the Stakeholder, a feature of SME.
Economia. Seria Management, 14(1), 56- 71.
SASRA (2010). Developing SACCO Supervisory Regime from Ground Up. Paper
Presented at SACCO Regulatory Round Table, Malawi
SASRA (2013). Role of SASRA in the SACCO Subsector. Paper presented at
stakeholder Conference, Nairobi.
Savage, G.T., Nix, T.W., Whithead, C. J., & Blair, J. D., (1991). Strategies for Assessing
and Managing Organizational Stakeholders, Academy of Management
Executives, 5(2), 61-75.
Serves H. & Tomayo (2013). The Impact of Corporate Social Responsibility on Firm
Value: The Role of Customer Awareness, Management Science Journal, 59(5),
1045 -1061.
Sharma Raj. (2008). Supply Chain Management Review. The 6 Principals of
Stakeholder engagement, Retrieved from: www.scmr.com.

163
Simmons, J. (2003). Balancing performance, accountability and equity in stakeholder
relationships: towards more socially responsible HR practice. Corporate Social
Responsibility and Environmental Management 10(4), 129-140.
Simon, L.J, (2004).Multicollinearity. The Pennyslevania State University. Retrieved
from: http://online.stati.psu.edu.
Smakalova, P. (2012). Generic Stakeholder Strategy. Economic & Management Journal,
17(4), 2661- 2667.
Smith, N.C, Ansett S.,& Erez, L., (2011).What‘s is Stake? Stakeholder Engagement
Strategy as the Key to Sustainable Growth. Insead, Faculty & Research
Working Paper
Smith, D. W., & Thomasson, A.L., (2005). Phenomenology and Philosophy of Mind.
Oxford and New York: Oxford University Press.
Smith, R. (2004). Exploring the usefulness of a conceptual framework as a research tool:
A researcher‘s reflections. Issues in Educational Research, 14(2), 167-180.
Sokolowski, R., (2000). Introduction to Phenomenology. Cambridge and New York:
Cambridge University Press.
Soriano, R., Munoz-Torres, M.J. & Chalmeta- Rosalen, R. (2009). Methodology for
sustainability strategiy planning and management. In: Industrial management
and Data Systéme, 17(4), 249- 268.
Svendsen, AC., Boutilier R.G., Abbott, RM., & Wheeler D. (2001). Measuring the
Business Value of Stakeholder Relationships Part One. The Centre for
Innovation in Management. Retrieved from www.stakeholder360.com/C7.htm.
Tabachnick, B. G., & Fidel, L.S, (2001). Using Multivariate Statistics (4th
ed.) Boston:
Allyn and Bacon.
Tashakkori, A. & Teddlie, C. (2003). The past and future of mixed methods research:
From data triangulation to mixed model designs. In Tashakkori, A. and Teddlie, C.

164
(2003). Handbook of mixed methods in social and behavioral research. (671-701),
Thousand Oaks, CA: Sage Publications.
Tee, D.J (2009). Dynamic Capabilities and Strategic Management. Oxford: OUP
Oxford.
The SACCO Societies Deposit taking Regulation (2010).Nairobi: Government Printers.
Tuan, N.P & Yoshi, T (2010). Organization Capabilities, Competitive Advantage and
Performance in Surporting Industries in Veitnam. Asian Academy of
Management Journal, 15(1), 1-21.
Wanyama, F.O. (2009). Surviving Liberalization: The Co-operative Movement in
Kenya. Coop Africa Working Paper No. 10
Wanyoike, S.W. (2013). Effects of Compliance to SASRA Regulation on Financial
Performance of Saving and Credit Co-operative in Kenya: A survey of Deposit
Taking SACCOs in Nairobi County. Unpublished MBA Research Project,
Nakuru: Kabarak University.
World Business Council for Sustainable Development (WBCSD) (2004) Cross-
cutting themes—Corporate responsibility. Retrieved from
http://www.wbcsd.org/.5
WOCCU (World Council of Credit Unions) (2005). Statistics Report. Retrieved from
www.woccu.org.
Yannopoulos, P., (2007). Marketing Strategy, Toronto: Nelson Education.
Yannopoulos, P., (2011). Defensive and Offensive Strategies for Market Success,
International Journal of Social Science, 13(2), 1-12.
Yoffie, D. B. & Mary, K. (2001), Judo Strategy, Boston, Mass.: Harvard Business
School Press.

165
APPENDICES
Appendix I: Letter of Introduction
TO WHOM IT MAY CONCERN
The General Manager,
----------- SACCO,
Nairobi.
Dear Sir/ Madam,
RE: REQUEST FOR COLLECTION OF DATA
I am a student in the School of Human Resource Development (SHRD) in JKUAT. In
partial fulfillment of the requirement of the PhD in Business Administration degree, I
plan to do a research entitled, ―Stakeholder Generic Strategies and the Financial
Performance of D.T.SACCOS in Kenya.‖
Your institution has been selected for this study, consequently. I wish to seek your
approval to document this research. The research will involve interviewing key
personnel in management and in the board.
Any information that you might provide to make this study more revealing will indeed
be appreciated.
The information and data to be gathered is needed for academic purpose only and will be
treated in strict confidence. Your co- operation in participating in this study will be
highly appreciated.
Thank you in anticipation,
Yours Sincerely,

166
Jesse Maina Kinyua (Student) HD433-COO3-3432/12
Appendix II: Questionnaire
The research study is entitled “Stakeholder Management generic strategies and the
performance of deposit taking SACCOs in Kenya”.
The information to be gathered from this interview will be treated confidentially and will
not be used for other purpose other than academic.
Section A: Demographic information
1) Kindly state your gender? Male [ ] Female [ ]
2) Please indicate the category in which your age falls
20 years and below [ ] 21 -30 [ ]
31- 40 [ ] 40 and above [ ]
3) What is your highest academic qualification?
Certificate [ ] Diploma [ ]
Undergraduate [ ] Postgraduate [ ]
4) How long have you been working / a director in the company?
Less than 3 years [ ] 3 to 5 years [ ]
5 to 7 years [ ] Over 7 years [ ]
ii) Deposit Taking SACCO Profile
1. What is your SACCO number of members?
0 -15000 [ ] 15001- 30000 [ ]
30001 – 45000 [ ] 45001 – Above [ ]
2. What is your membership base?
Teachers [ ] Government Employee [ ]
Private Based [ ] Farmer Based [ ]

167
Community Based [ ] Open Membership [ ]
3. What is your SACCO total assets value?
Below I billion [ ] Between I billion & 3.5 billion [ ]
Above 3.5 billion [ ]
B Use of stakeholder management concept/ philosophy
To what extent do you agree or disagree with the following statements on a scale of 1-5,
where 1- stands for Strongly Disagree, 2 -Disagree, 3- Neutral, 4 Agree ; 5 Strongly
Agree
Statements 1 2 3 4 5
We do involve our members, supplier, customer, and the ministry of
co-op development & marketing in our planning process
Our employee are allowed to own shares
We have categorized our stakeholder into groups to effectively
manage them
Different strategies are used for various stakeholder groups
depending on their potential co-operation or threat or interest &
power
We communicate with different stakeholders depending on their
interest and relative powers to keep them satisfied
We are involved in corporate social responsibility to the community
around us
C) Supportive stakeholder - Offensive strategy
For supportive stakeholders like employees, managers, suppliers, board of trustees and
not for profit organizations.

168
To what extent would you agree or disagree with the following statements on a scale of
1-5? Where: (1- Strongly Disagree; 2- Disagree; 3-Neutral; 4- Agree and 5- Strongly
Agree)
Statements 1 2 3 4 5
We change stakeholder objectives or perceptions of these
stakeholders towards us if not very good
Adopt the stakeholder position
Keep them informed and motivated
Include this stakeholder when developing strategy
Involve key stakeholder when establishing policy
D) Marginal stakeholders - Hold strategies:
Low cooperative and low competitive threat stakeholder groups like shareholders,
consumer interest groups, professional association for employees etc?
To what extent would you agree or disagree with the following statements on a scale of
1-5? Where: (1- Strongly Disagree; 2- Disagree; 3-Neutral; 4- Agree and 5- Strongly
Agree)
Statements 1 2 3 4 5
Hold your current position and continue with your current strategic
program.
Monitor this stakeholder for change in their position, beliefs/
behavior / attitudes
Continue with existing activities ( i.e. ignore this group)
Involvement in strategy formulation
Reinforce this stakeholder‘s beliefs about the firm
Change organizational behavior to address this stakeholder‘s
concerns

169
How do you manage this category of stakeholder? ---------------------------------------------
------------------------------------------------------------------------------------------
E) Non-supportive stakeholders - Defensive strategy
For stakeholder group who has law cooperative potential and high competitive threats
like competitors (e.g. Commercial banks, Micro finance institutions, Shylocks?), media
and government?
To what extent would you agree or disagree with the following statements? Raking is as
follows: (1- Strongly Disagree; 2- Disagree; 3-Neutral; 4- Agree and 5- Strongly Agree
Statements 1 2 3 4 5
Defend the organization against competitors
Prevent competitive threat on the part of these stakeholders
Reduce dependence from these stakeholder
Introduce new products
Make changes into existing products and continuously improve on
them
Make retaliation to any competitors‘ attack
Diversify into new markets to increase number of customers
What strategy or strategies do you use to manage this category of stakeholder? -----------
-----------------------------------------------------------------------------------------------------------
-------------------------------------------------------------------------------

170
F) Mixed Blessing stakeholders - Swing strategy
This is for organizations and clients with complementary products or services
To what extent would you agree or disagree with the following statements? (1- Strongly
Disagree; 2- Disagree; 3-Neutral; 4- Agree and 5- Strongly Agree
Statements 1 2 3 4 5
Collaborate with them to maximize their positive influencing abilities
and minimize their threatening abilities.
Positively engage with them to nurture their positive co-operative
potential
Maintain communication with to keep them satisfied
Modify this stakeholders beliefs about the firm
Change the formal or informal rule under which this stakeholder
operates
What strategy or strategies do you use to manage this category of stakeholder? -----------
-----------------------------------------------------------------------------------------------------------
------------------------------------------------------------------------------
G) Corporate Social Responsibility
1. Does your SACCO engage in any corporate social responsibility
activities?
Tick where appropriate
2. If your answer above is yes, in your opinion, to what extent would you agree or
disagree with the following statements. (1- Strongly Disagree; 2- Disagree; 3-
Neutral; 4- Agree and 5- Strongly Agree)
YES NO

171
Statements 1 2 3 4 5
SACCO engages in environmental stewardship and activities to make
our environment cleaner.
Our SACCO has integrated social concerns into business operation and
contributes to a better society.
Our SACCO does interact and create good relationship with both
internal and external stakeholders.
Our SACCO does engage in activities or undertake programs on
voluntary bases based on our ethical values that go beyond legal
obligation.
Our SACCO does strive to satisfy all stakeholders including the
community around us.
Engaging in CSR leads to:
i. Improving workers‘ motivation
ii. Help deepen ties with communities in which it operates in
iii. Help improve relations and SACCO image
iv. It helps in marketing our products/services
3. What other comment would like to make about corporate social responsibility in
your organization?---------------------------------------------------------------------------
--------------------------------------------------------------------------------------------------
--------------------------------------------------------------------------------------------------
----
4. What other strategies/plan do you use that you think are critical to successful
stakeholder engagement
i. --------------------------------------------------------------------------------------------------
----------------------------------------------------------------------------------

172
ii. --------------------------------------------------------------------------------------------------
----------------------------------------------------------------------------------
iii. --------------------------------------------------------------------------------------------------
----------------------------------------------------------------------------------
iv. --------------------------------------------------------------------------------------------------
----------------------------------------------------------------------------------
H) Measuring SACCO Financial Performance
How would you rate the following statement in a scale of 1-5 (where 1= Very Poor, 2 -
Poor; 3- Neutral, 4- Good, 5 -Very good)
Statement 1 2 3 4 5
Safety of depositors savings in the last 5 years
Liquidity of the SACCO in the last 5 years
Depositor‘s return in the last 5 years
I) To be filled by Senior Management
How would you rate the following statement in a scale of 1-5 (where 1= Very Poor, 2 -
Poor; 3- Neutral, 4- Good, 5 -Very good).
Statements 1 2 3 4 5
Stakeholder satisfaction in the last 5 years in service delivery and
time taken to get the loan applied for?
SACCO financial liquidity in last 5 years?
SACCO compliance with SASRA and the ministry of cooperative
development and marketing in the last 5 years?
1. How would rate that performance on a scale of 1-5(where 1= Very Poor, 2 -Poor;
3- Not sure, 4- Good, 5 -Very good)

173
1 2 3 4 5
Tick where appropriate
2. Have you integrated stakeholder management into strategic planning?
YES
NO
If your answer is yes, please explain-------------------------------------------------
---------------------------------------------------------------------------------------------
---------------------------------------------------------------------------------------------
---------------------------------------------------------------------------------------------
---------------------------------------------------------------------------------------------
---------------------------------------------
Thank you very much for participating

174
Appendix III: Interview Schedule
The information to be gathered from this interview will be treated confidentially and
will not be used for other purpose other than academic.
Assessment of the DTSs Financial Performance
1. What was the SACCO return on asset (ROA) in the following 2 years?
Year 2013 --------------------
Year 2014---------------------
2. What was your return on equity (ROE) in the following two years?
Year 2013-------------------------
Year2014---------------------------
3. What was your SACCO Liquidity ratio ( Liquid asset/ Total Asset ) in the
following two years:
Year 2013 ----------------------
Year 2014 ----------------------
4. What is your SACCO membership? ----------------------------------------
5. Kindly provide the audited Accounts for Year 2013 and 2014 for close scrutiny.

175
Appendix IV: List of Licensed Deposit Taking SACCOs
1 Afya SACCO 30 Elgon SACCO
2 Agro Chem SACCO 31 Elimu SACCO
3 All Christian SACCO 32 Fundilima SACCO
4 Ainabkoi SACCO 33 Gastameco SACCO
5 Airport SACCO 34 Githunguri Dairy SACCO
6 Ardhi SACCO 35 Good Faith SACCO
7 Asili SACCO 36 Goodway SACCO
8 Banana Hill SACCO 37 Gusii SACCO
9 Baraka SACCO 38 Green Hill SACCO
10 Baraton University SACCO 39 Harambee SACCO
11 Biashara SACCO 40 Hazina SACCO
12 Bingwa SACCO 41 Ilikisonko SACCO
13 Boresha SACCO 42 Imarika SACCO
14 Capital SACCO 43 Imarisha SACCO
15 Centemary SACCO 44 Imenti SACCO
16 Chai SACCO 45 Jacaranda SACCO
17 Chuna SACCO 46 Jammii SACCO
18 Comoco SACCO 47 Jitegemee SACCO
19 County SACCO 48 Jumuika SACCO
20 Eco-Pilla SACCO 49 Kaimosi SACCO
21 Dumisha SACCO 50 Kakamega Trs SACCO
22 Dimkes SACCO 51 Kathera Rura SACCO
176
23 Dhabiti SACCO 52 Keiyo SACCO
24 Daima SACCO 53 Kenpipe SACCO
25 Egerton SACCO 54 Kenversity SACCO
26 Faridi SACCO 55 Kenya Achivers SACCO
27 Enea SACCO 56 Kenya Bankers SACCO
28 Farinji SACCO 57 Kenya Canners SACCO
29 Fortune SACCO 58 Kenya Highland SACCO
59 Kenya Police Staff SACCO 86 Mua SACCO
59 Kiambaa Dairy Rural SACCO 87 Murata SACCO
60 Kimbilio Daima SACCO 88 Mwalimu National SACCO
61 Kingdom SACCO 89 Mwietheri SACCO
62 Kipsigis Edis SACCO 90 Mwingi MwalimuSACCO
63 Kise SACCO 91 Muki SACCO
64 Kitui Trs SACCO 92 2NK SACCO
65 Kmfri SACCO 93 Nafaka SACCO
66 Kolenge Tea SACCO 94 Naku SACCO
67 Konoin SACCO 95 Nandi Farmers SACCO
68 Koru SACCO 96 Nanyuki Equitor SACCO
69 Kwale SACCO 97 Narok Teacher SACCO
70 Kwetu SACCO 98 Nassefu SACCO
71 K- Unity 99 Nation SACCO
72 Lamu Trs SACCO 100 Nawin SACCO
73 Lainisha SACCO 101 Ndege Chai SACCO

177
74 Lengo SACCO 102 Nest SACCO
75 Mafanikio SACCO 103 Nga‘risha SACCO
76 Magadi SACCO 104 Ndosha SACCO
77 Magereza SACCO 105 Nitunze SACCO
78 Maisha Bora 106 Nrs SACCO
79 Marsabit Trs SACCO 107 Nufaika SACCO
80 Mentor SACCO 108 Nyahururu Umoja SACCO
81 Mombasa Port SACCO 109 Nyala Vision SACCO
82 Mudete SACCO 110 Nyamnbene Arimi SACCO
83 MuhigiaSACCO 112 Nyeri Trs SACCO
84 Safaricom SACCO 113 Quetu SACCO
84 Sheria SACCO 114 Yachuonyo Trs SACCO
85 Orient SACCO 115 Patmas SACCO
116 Puani SACCO 144 Times U SACCO
117 Shiriki SACCO 145 Towers SACCO
118 Simba Chai SACCO 146 Transcom SACCO
119 Siraji SACCO 147 Trans- Elite County SACCO
120 Skyline SACCO 148 Ufanisi SACCO
121 Smart Champion SACCO 149 Uchonganji SACCO
122 Smart Life SACCO 150 Ufundi SACCO
123 Solution SACCO 151 Ukristo SACCO
124 Sotico SACCO 152 Ukristo Anglicana SACCO
125 SouthernStar SACCO 153 Ukulima SACCO

178
126 Stake Kenya SACCO 154 Unaitas SACCO
127 Sukari SACCO 155 Uni- County SACCO
128 Stima SACCO 156 United Nation SACCO
129 Stegro SACCO 157 Unison SACCO
130 Suba Trs SACCO 158 Universal Traders SACC
131 Supa SACCO 159 Vihiga County SACCO
132 Tai SACCO 160 Vision Point SACCO
132 Taifa SACCO 161 Wakenya Pamoja SACCO
134 Taraji SACCO 162 Wakulima Commerce
SACCO
135 Telepost SACCO 163 Wanaanga SACCO
136 Tembo SACCO 164 Wanaishi SACCO
137 Tenhos SACCO 165 Wanandege SACCO
138 Thamani SACCO 166 Winas SACCO
139 Transcounties SACCO 167 Wareng SACCO
140 Trans National Times SACCO 168 Washa SACCO
141 Trans Nation SACCO 169 Wevarsity SACCO
142 Yetu SACCO 170 Miliki SACCO
143 Nyamira SACCO 171 Maonao Daima SACCO
172 Moi University SACCO 177 Nandi Hekima SACCO
173 Mentor SACCO 178 Mudete SACCO
174 Mombasa Port SACCO 179 Aembu SACCO
175 Metropolitant SACCO 180 Kenya Midland SACCO

179