Embed Size (px)
Citation preview

Project UH
Staffing Structure of the
University of Hawai‘i at Manoa:A Comparative Analysis
July 18, 2012
UHERO.HAWAII.EDU ©2012July 18, 2012
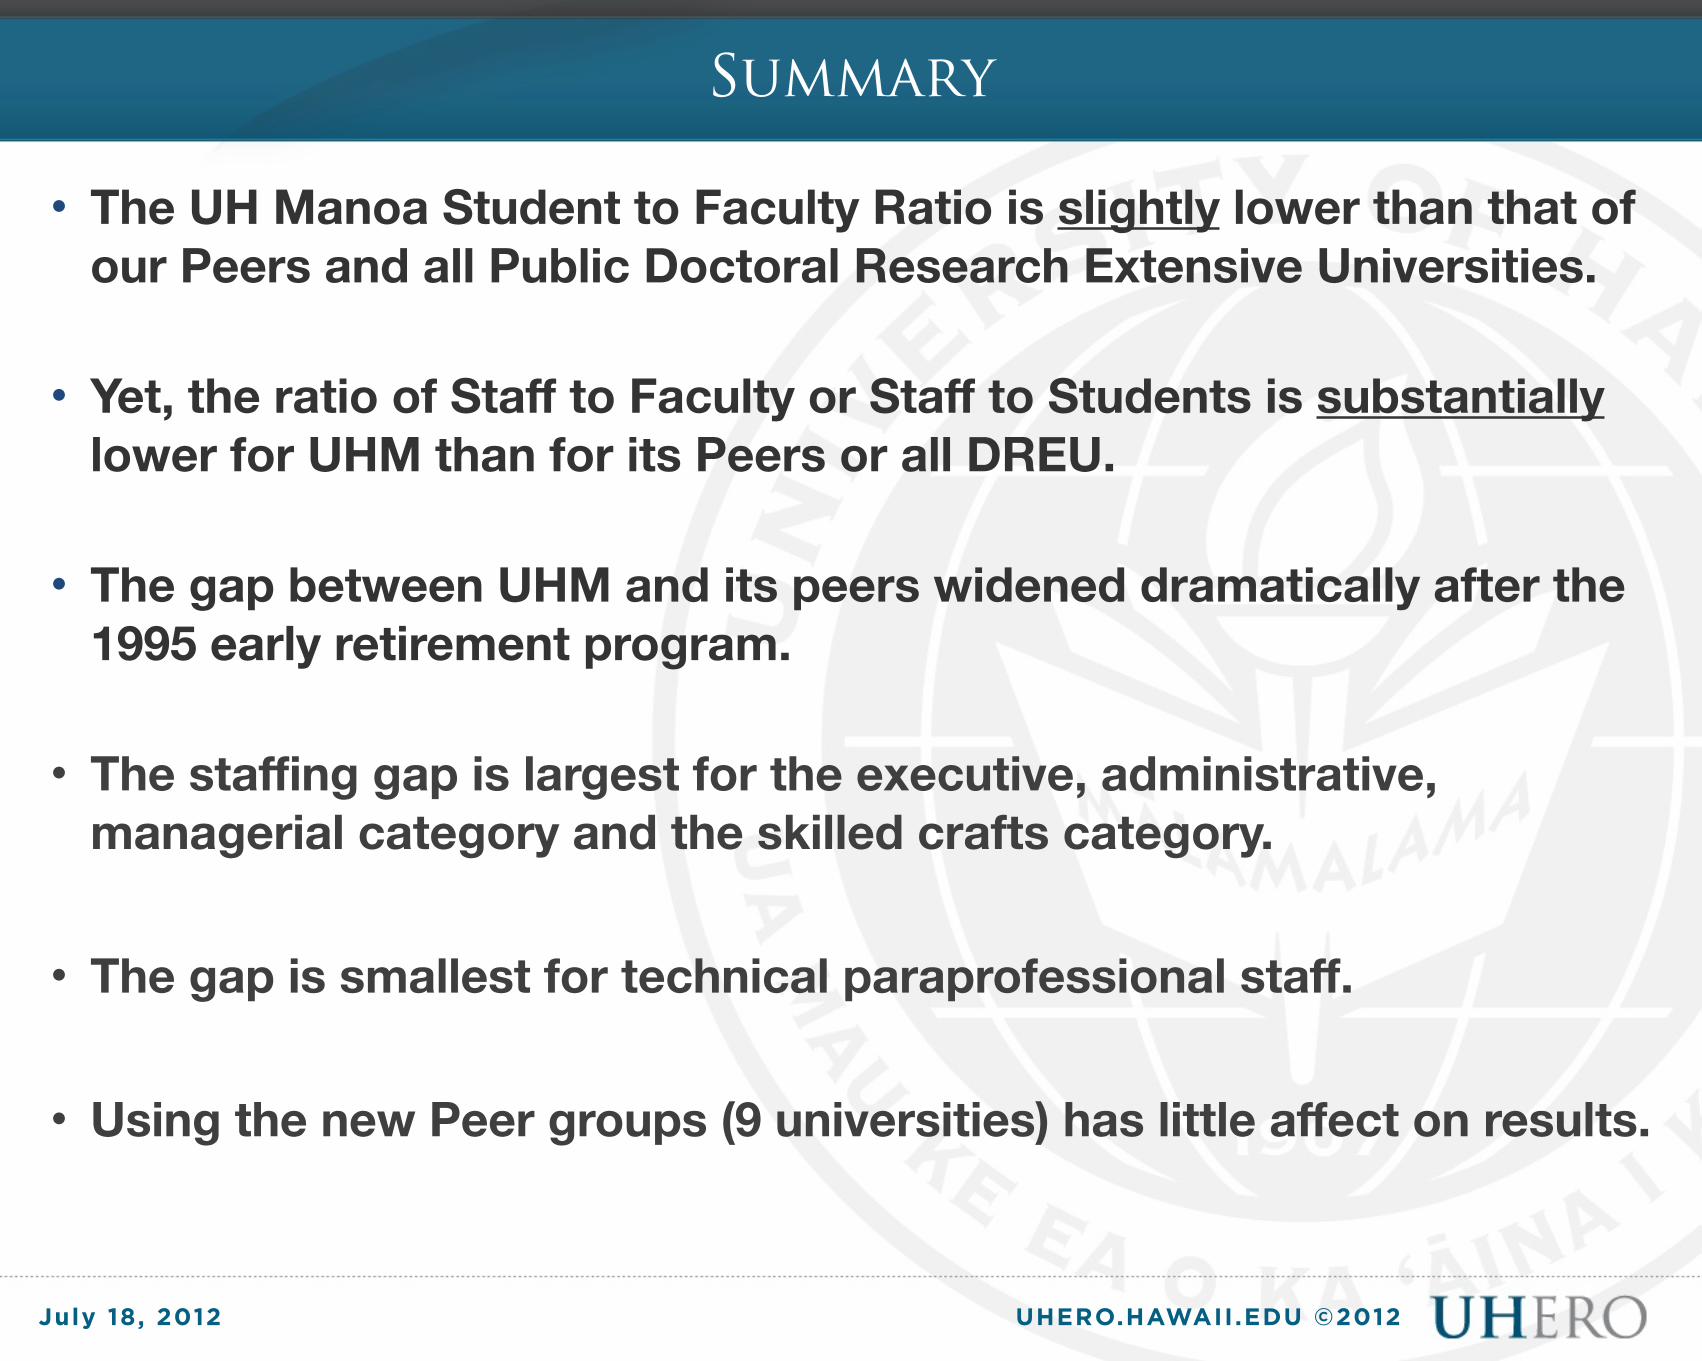
Summary
• The UH Manoa Student to Faculty Ratio is slightly lower than that of our Peers and all Public Doctoral Research Extensive Universities.
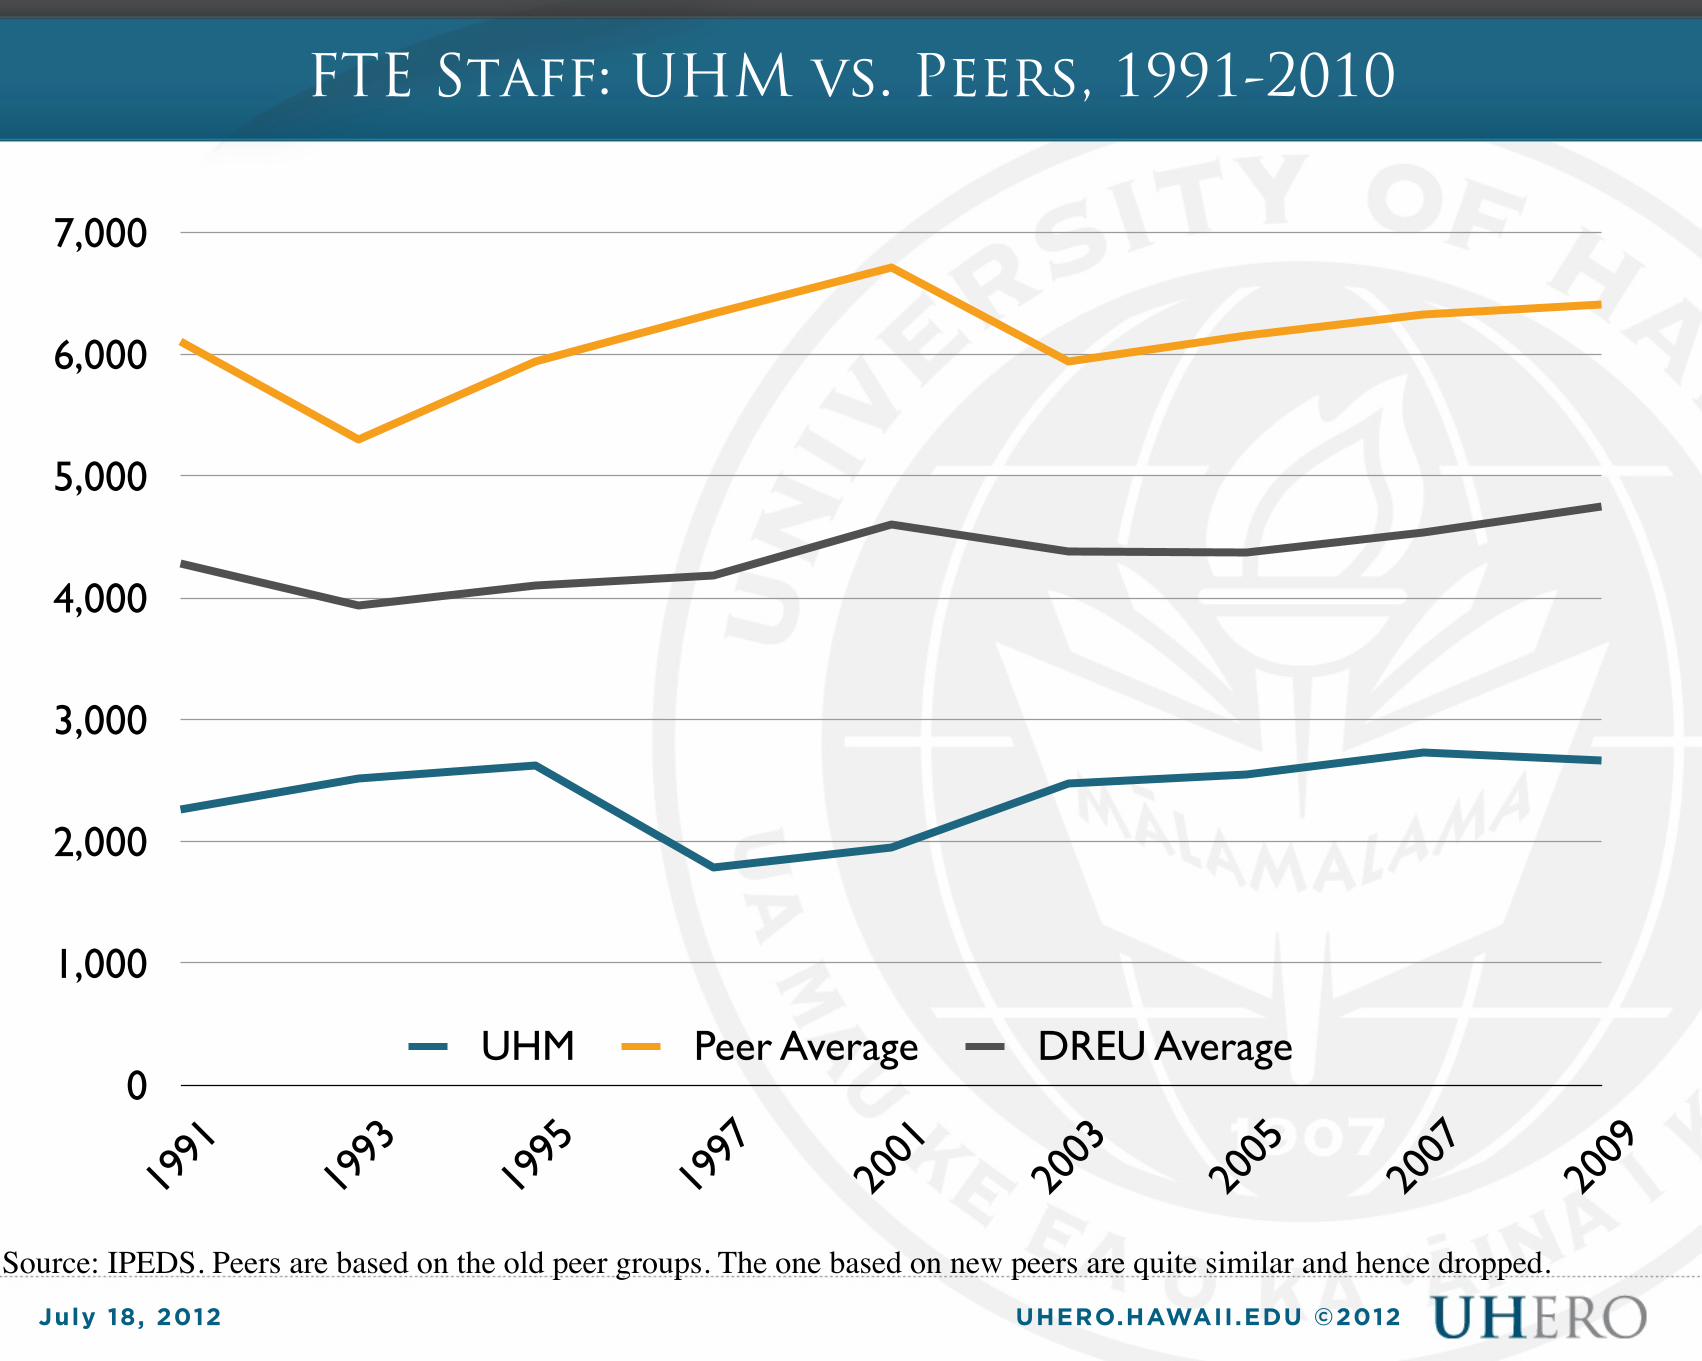
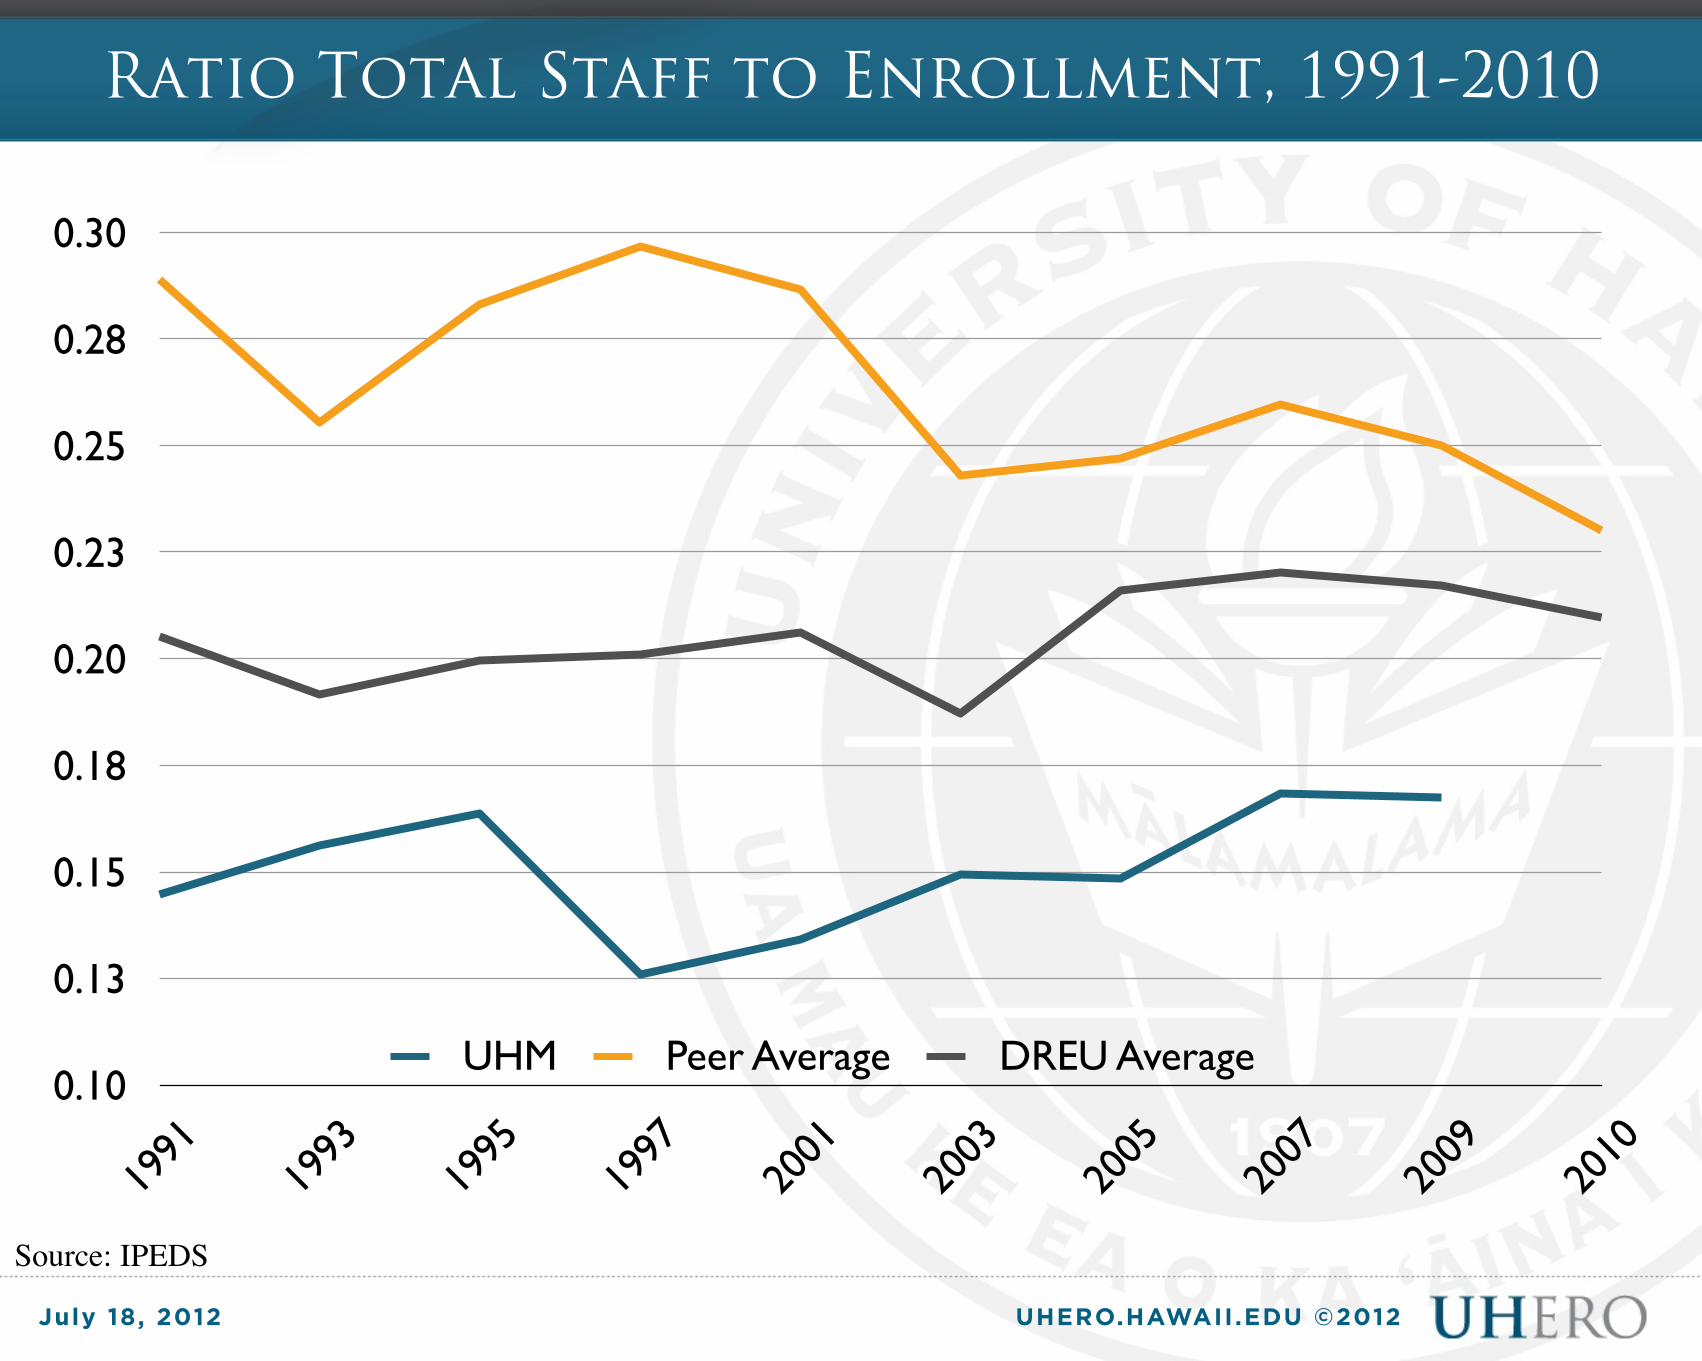
• Yet, the ratio of Staff to Faculty or Staff to Students is substantially lower for UHM than for its Peers or all DREU.
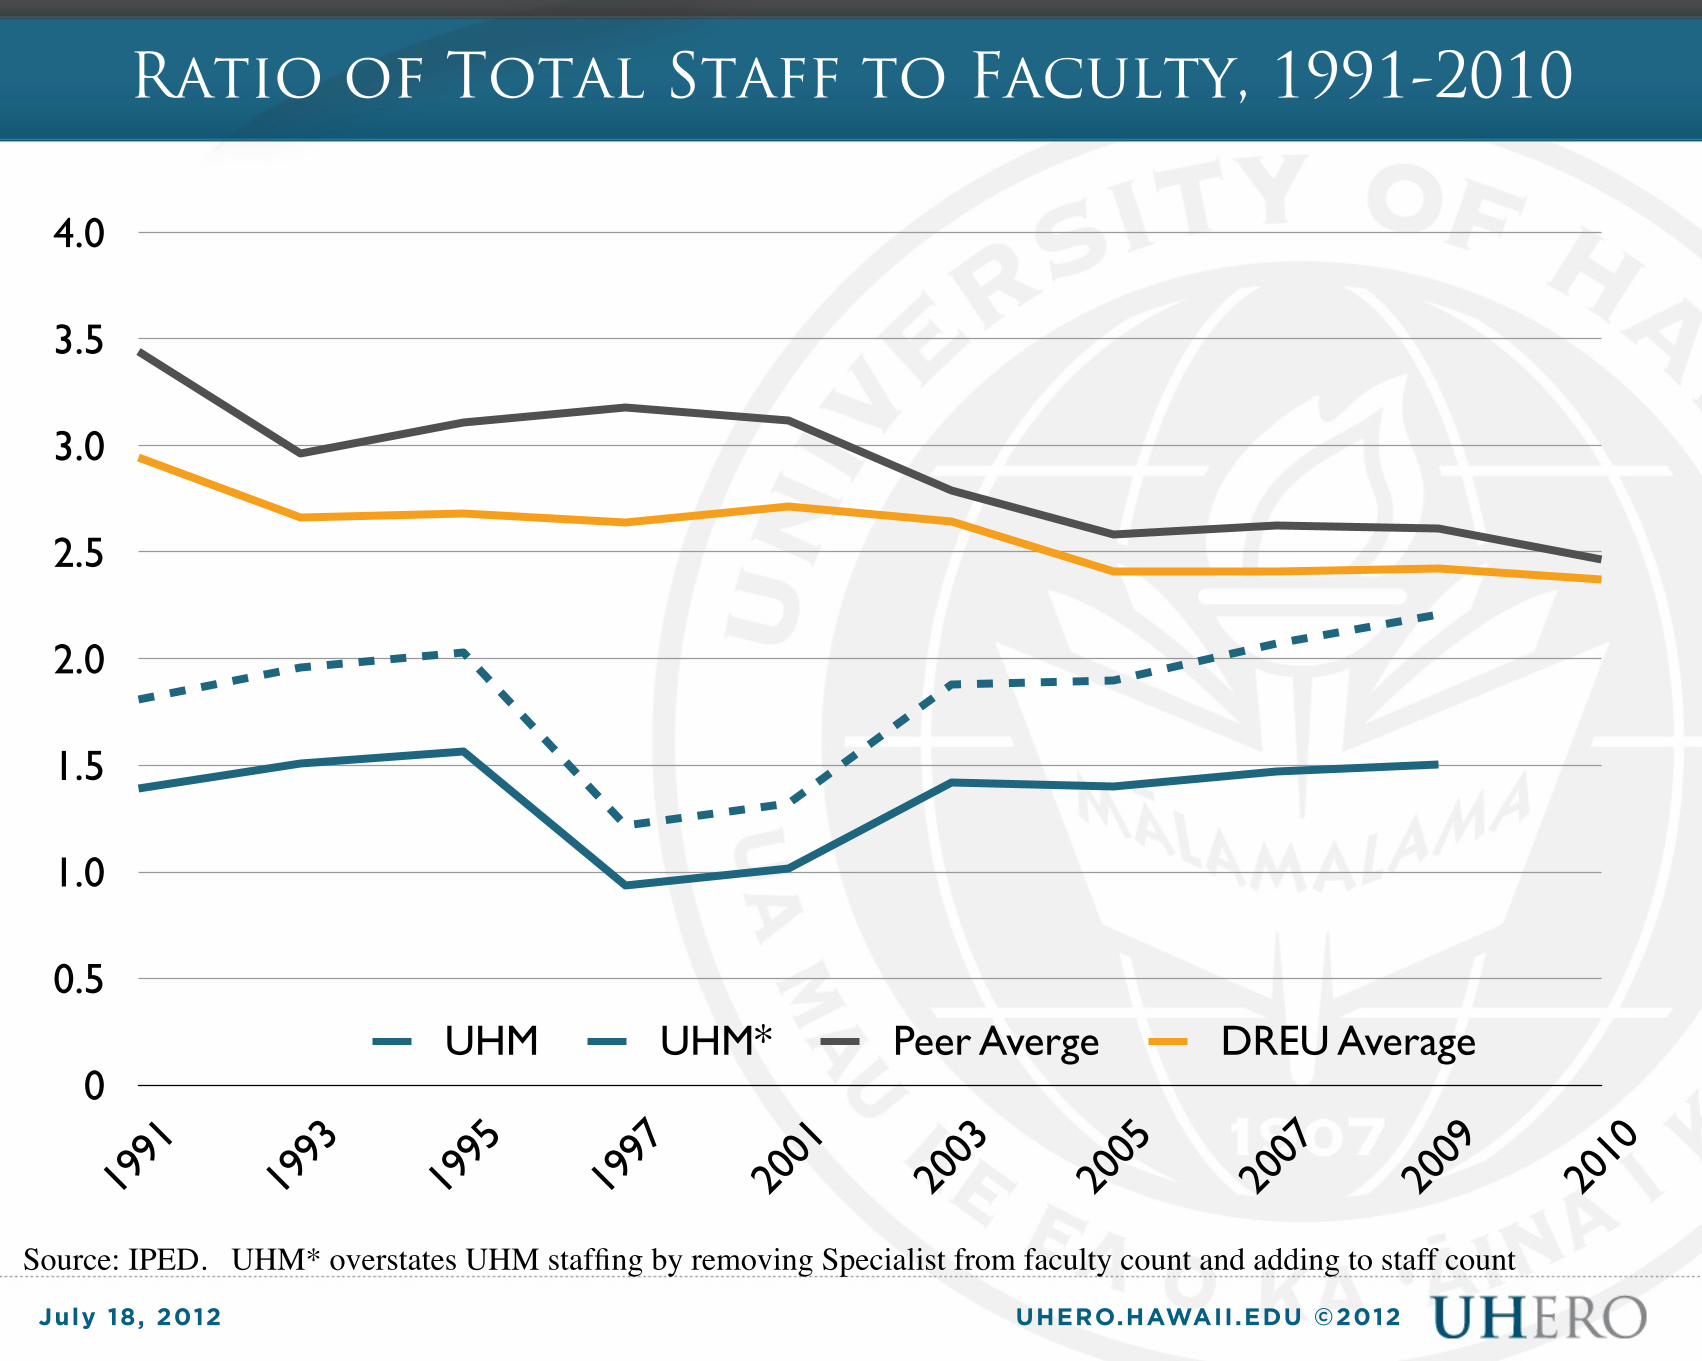
• The gap between UHM and its peers widened dramatically after the 1995 early retirement program.
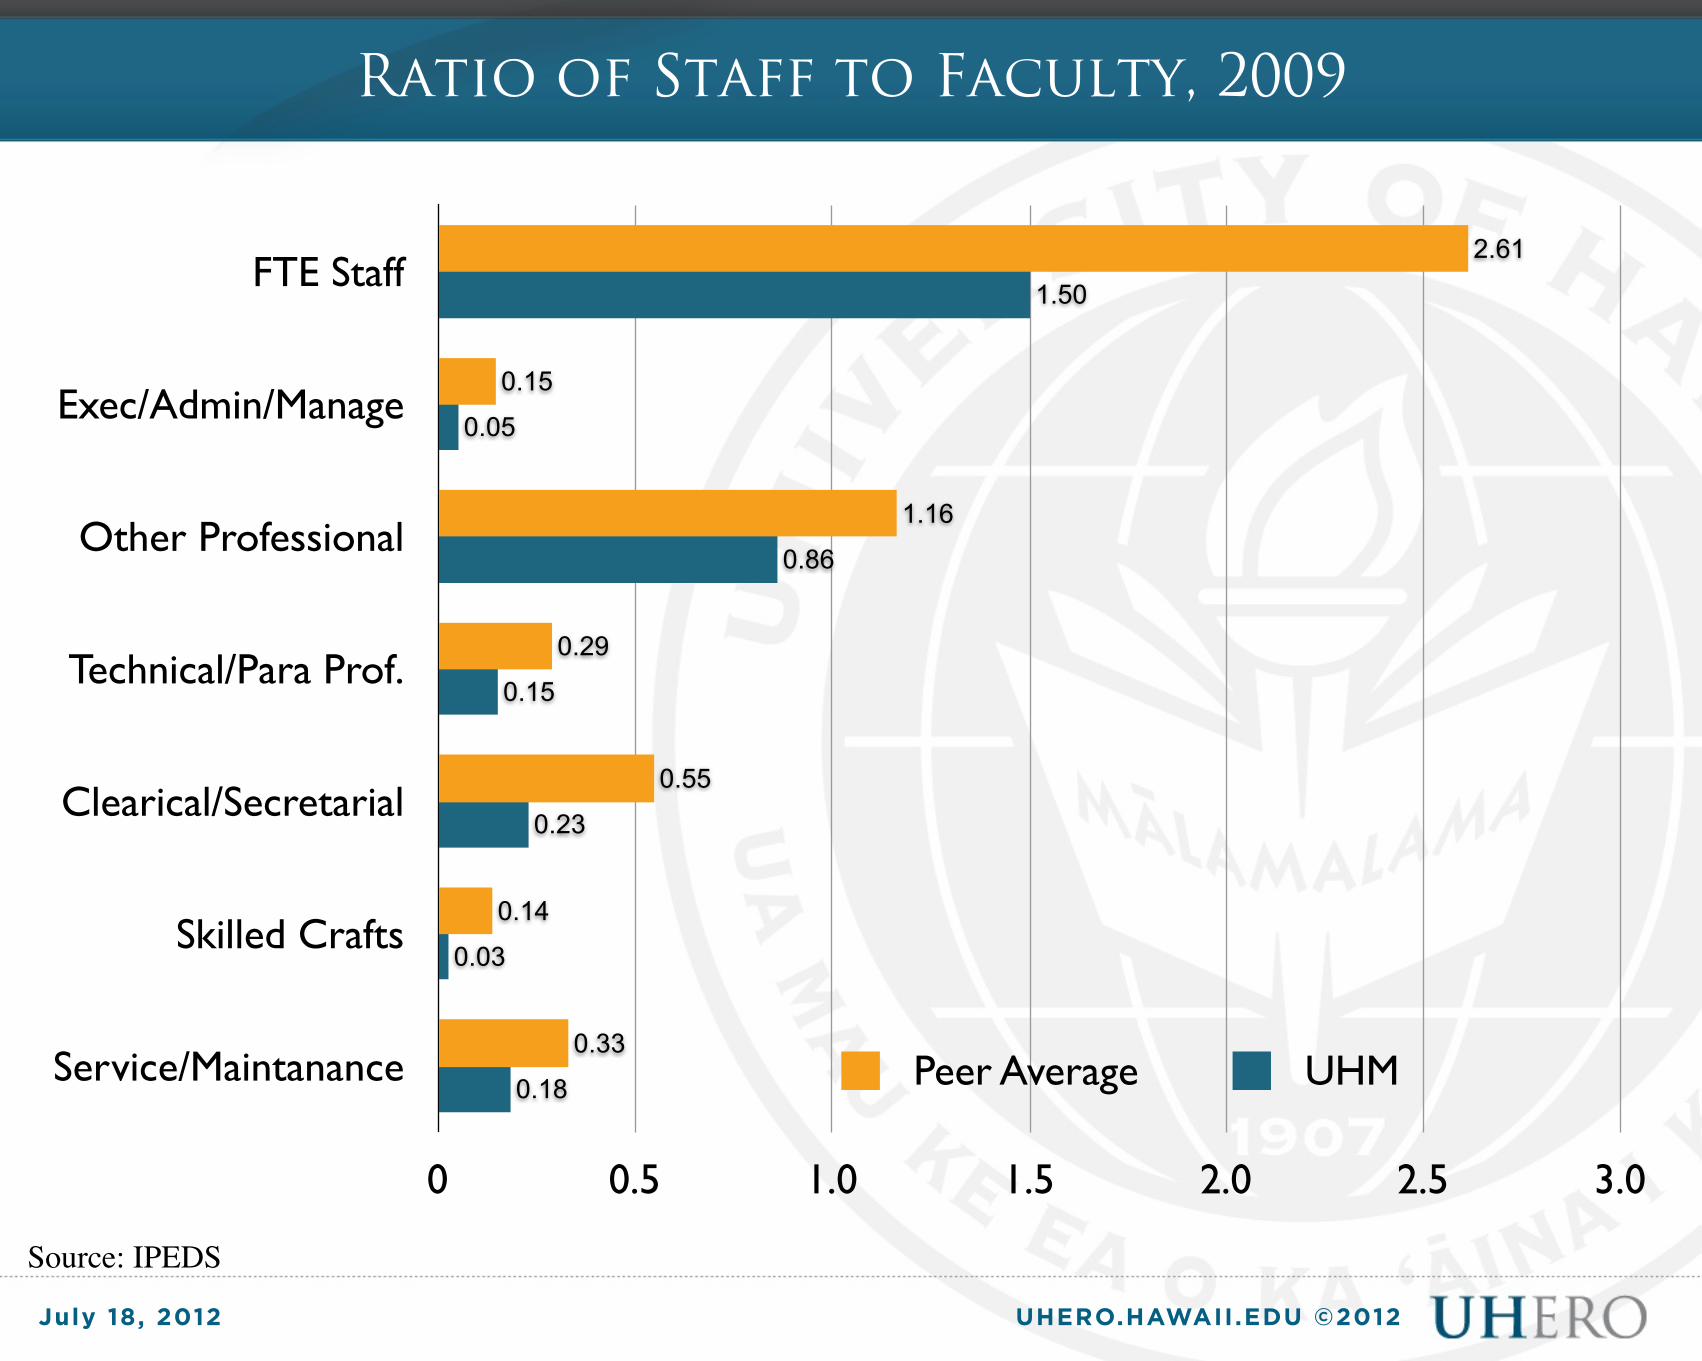
• The staffing gap is largest for the executive, administrative, managerial category and the skilled crafts category.
• The gap is smallest for technical paraprofessional staff.
• Using the new Peer groups (9 universities) has little affect on results.
UHERO.HAWAII.EDU ©2012July 18, 2012
Peer Groups
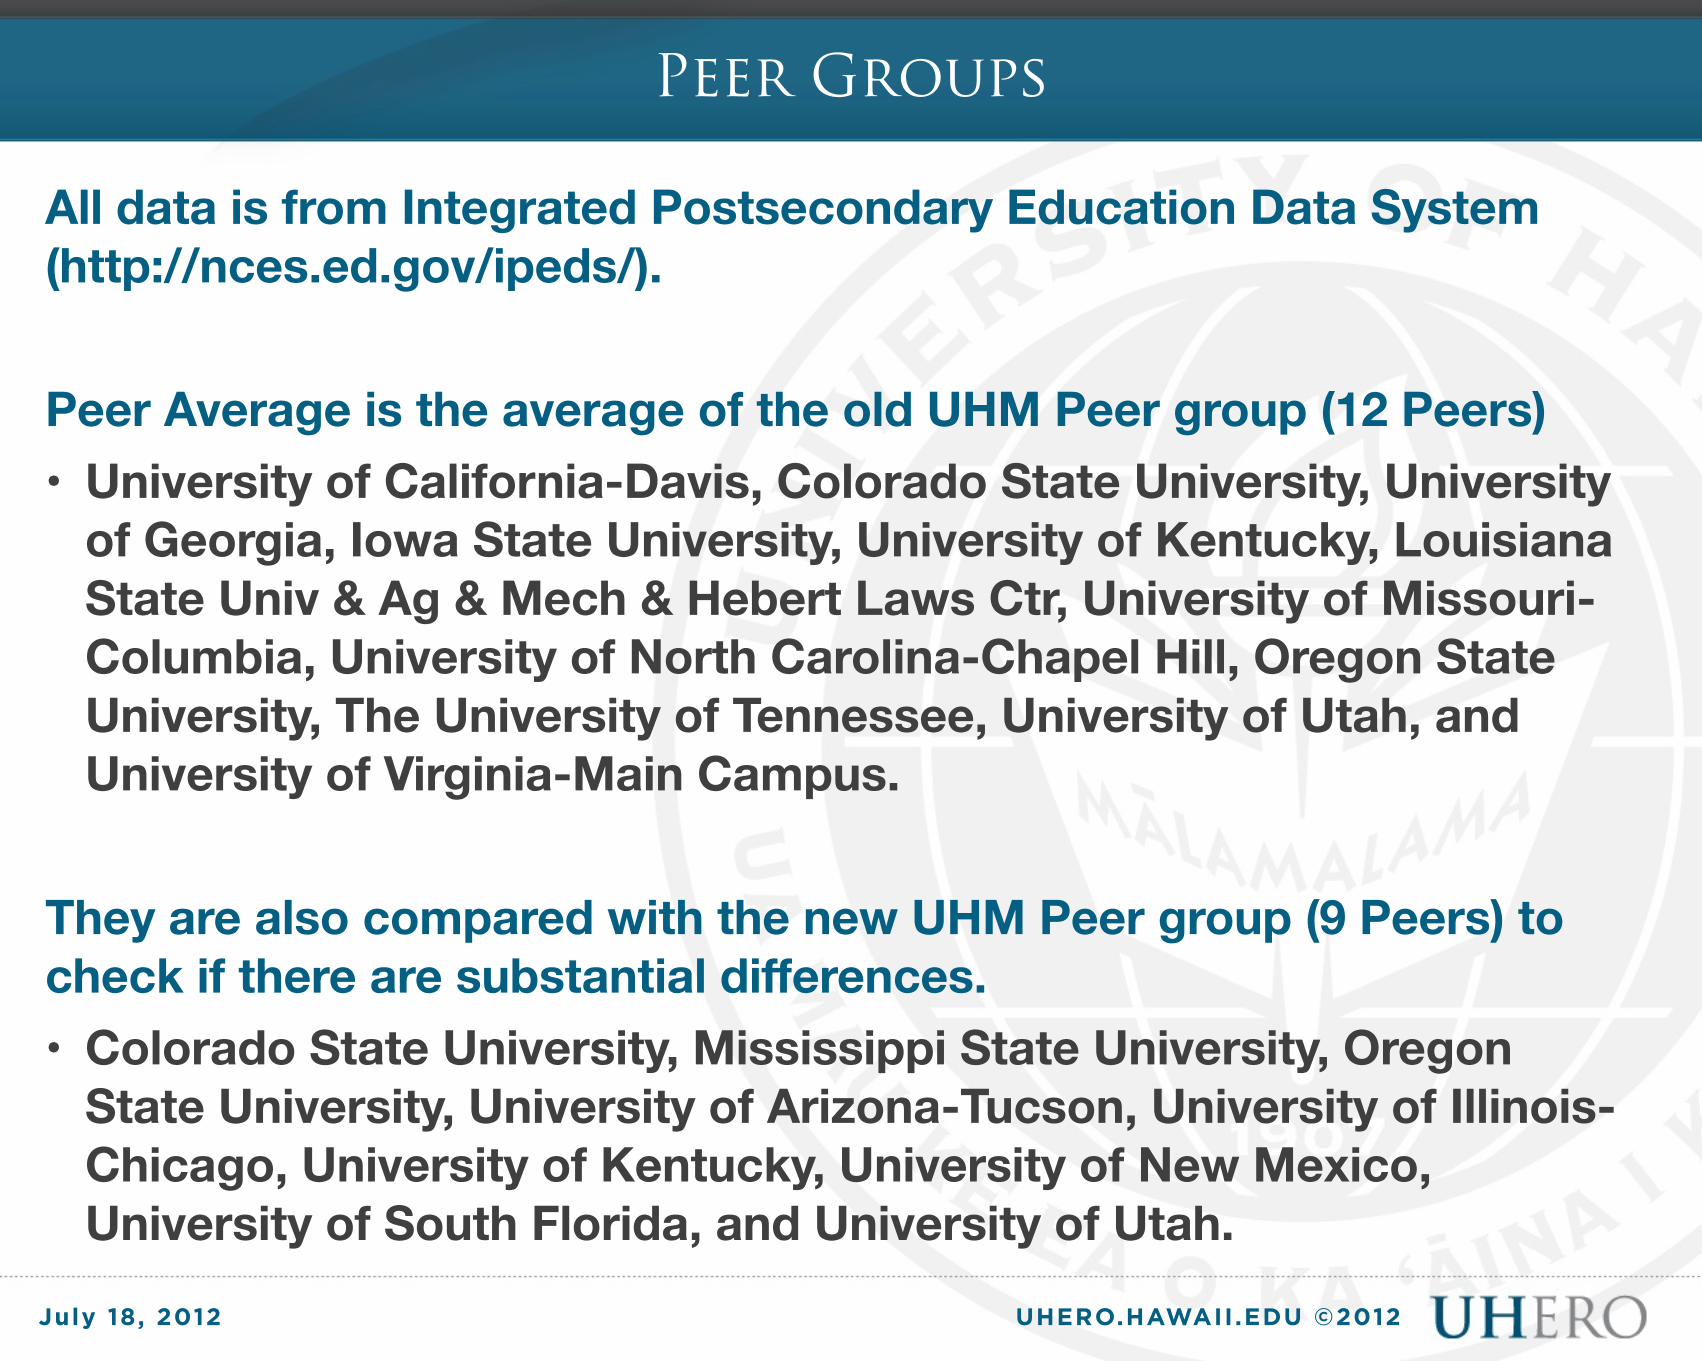
All data is from Integrated Postsecondary Education Data System (http://nces.ed.gov/ipeds/).
Peer Average is the average of the old UHM Peer group (12 Peers)• University of California-Davis, Colorado State University, University
of Georgia, Iowa State University, University of Kentucky, Louisiana State Univ & Ag & Mech & Hebert Laws Ctr, University of Missouri-Columbia, University of North Carolina-Chapel Hill, Oregon State University, The University of Tennessee, University of Utah, and University of Virginia-Main Campus.
They are also compared with the new UHM Peer group (9 Peers) to check if there are substantial differences.• Colorado State University, Mississippi State University, Oregon
State University, University of Arizona-Tucson, University of Illinois-Chicago, University of Kentucky, University of New Mexico, University of South Florida, and University of Utah.
UHERO.HAWAII.EDU ©2012July 18, 2012
DREU Groups
DREU Average is the average of all 4-year public universities classified as Doctoral/Research-Extensive Universities (DREU) by the Carnegie Foundation.
DREU institutions are defined as• Institutions that typically offer a wide range of baccalaureate
programs, and are committed to graduate education through the doctorate degree
• They award 50 or more doctoral degrees per year across at least 15 disciplines.
UHERO.HAWAII.EDU ©2012July 18, 2012
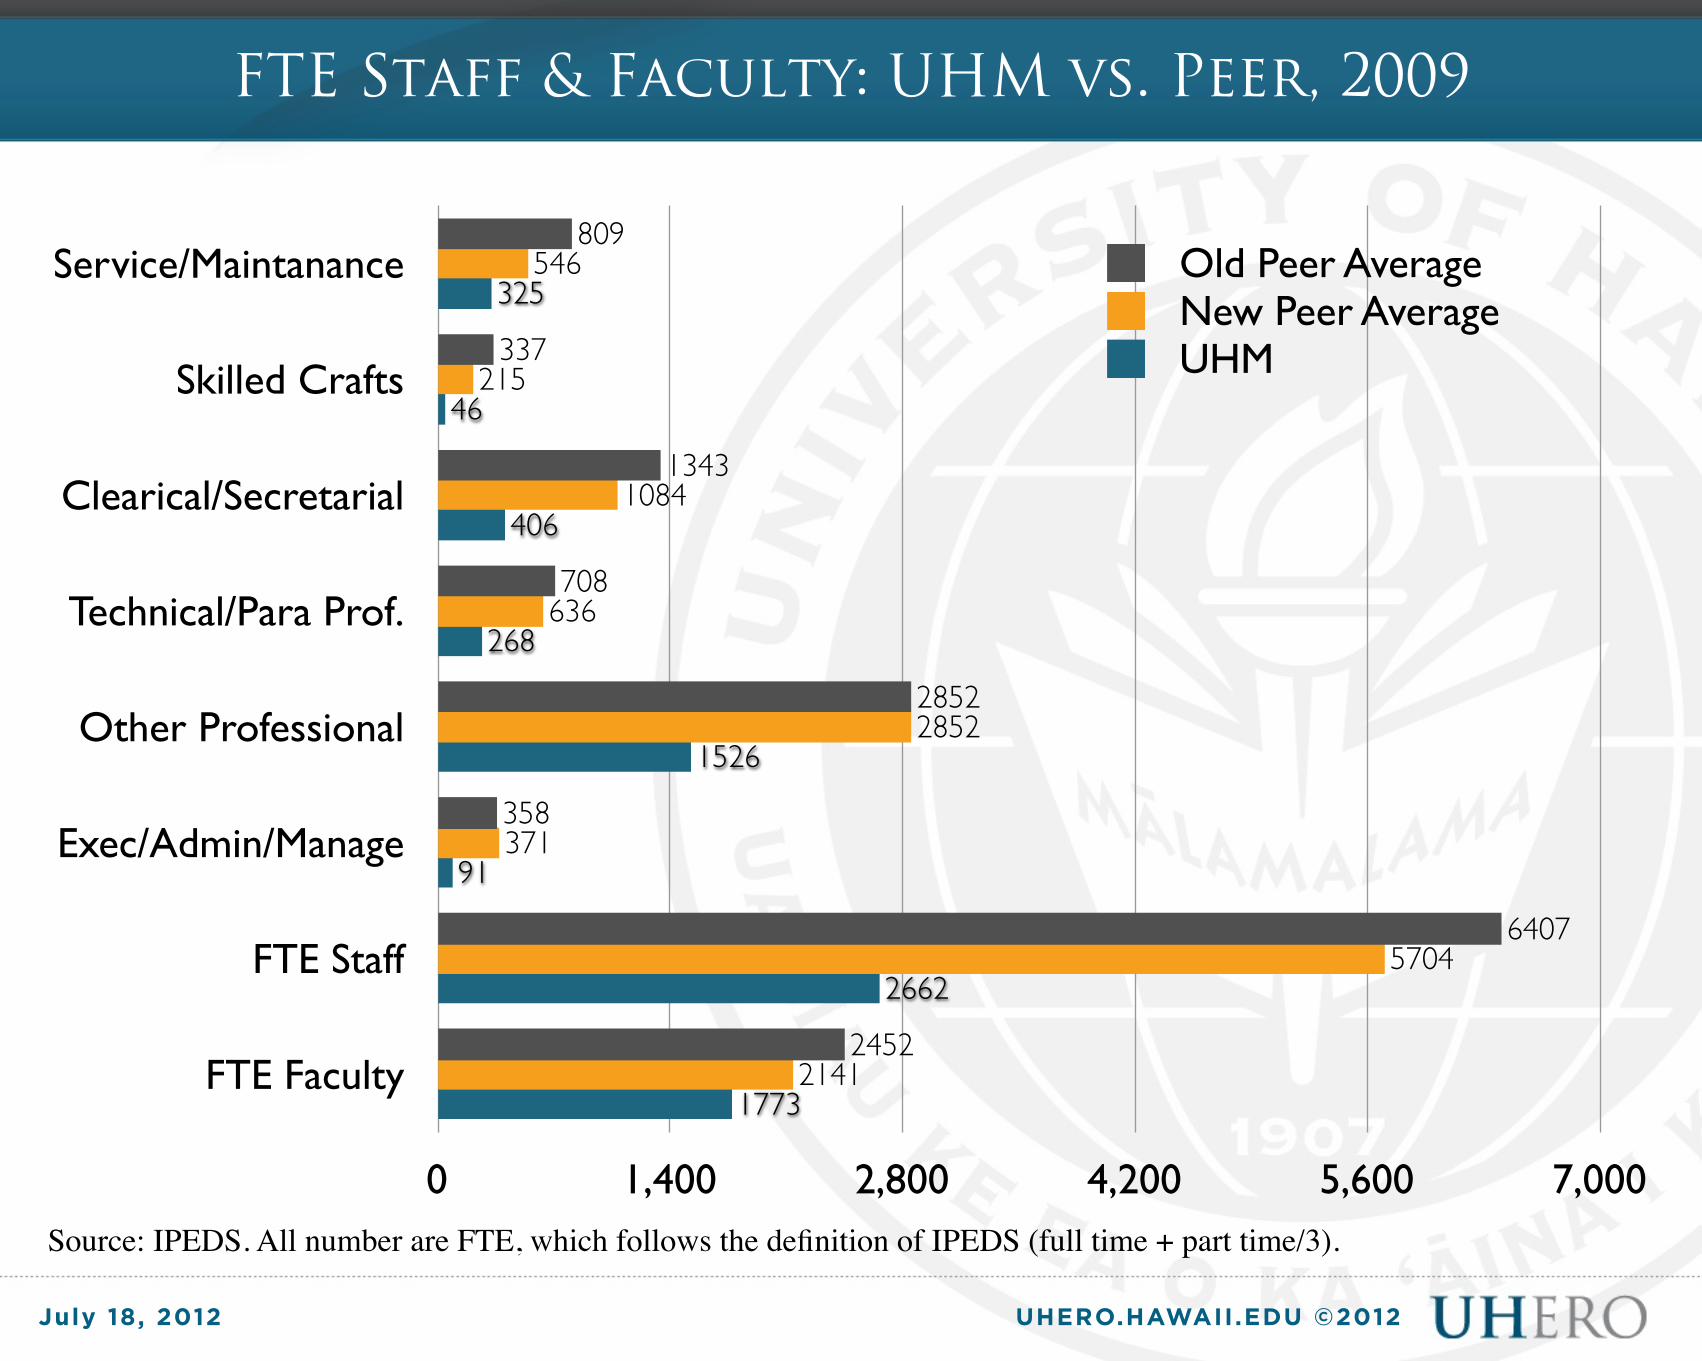
FTE Staff & Faculty: UHM vs. Peer, 2009
Source: IPEDS. All number are FTE, which follows the definition of IPEDS (full time + part time/3).
Service/Maintanance
Skilled Crafts
Clearical/Secretarial
Technical/Para Prof.
Other Professional
Exec/Admin/Manage
FTE Staff
FTE Faculty
0 1,400 2,800 4,200 5,600 7,000
1773
2662
91
1526
268
406
46
325
2141
5704
371
2852
636
1084
215
546
2452
6407
358
2852
708
1343
337
809Old Peer AverageNew Peer AverageUHM
UHERO.HAWAII.EDU ©2012July 18, 2012
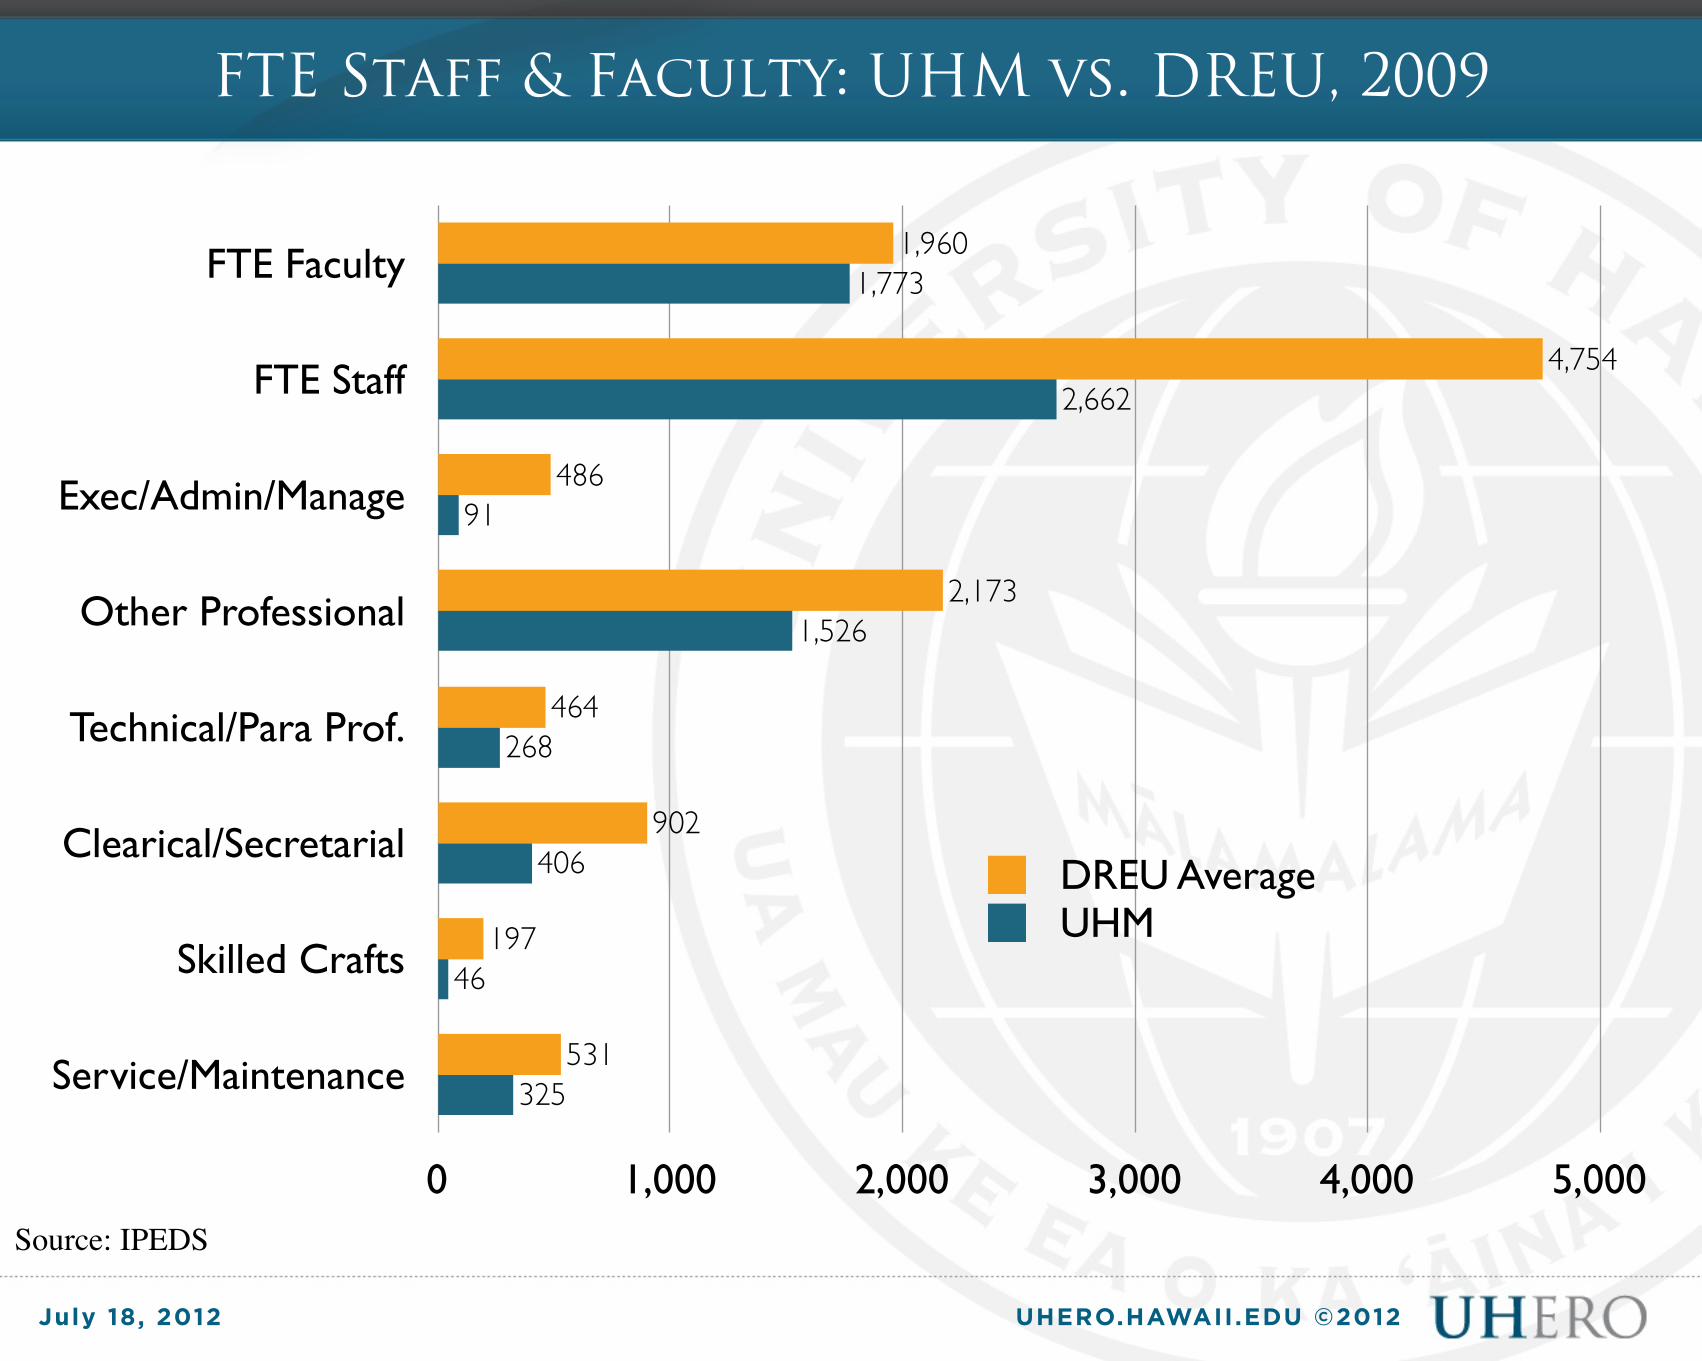
FTE Faculty
FTE Staff
Exec/Admin/Manage
Other Professional
Technical/Para Prof.
Clearical/Secretarial
Skilled Crafts
Service/Maintenance
0 1,000 2,000 3,000 4,000 5,000
325
46
406
268
1,526
91
2,662
1,773
531
197
902
464
2,173
486
4,754
1,960
DREU AverageUHM
Source: IPEDS
FTE Staff & Faculty: UHM vs. DREU, 2009

UHERO.HAWAII.EDU ©2012July 18, 2012
FTE Faculty: UHM vs. Peers, 1991-2010
1,000
1,292
1,583
1,875
2,167
2,458
2,750
1991
1993
1995
1997
2001
2003
2005
2007
2009
2010
UHM Peer Average DREU Average
Source: IPEDS. Peers are based on the old peer groups. The one based on new peers are quite similar and hence dropped.
UHERO.HAWAII.EDU ©2012July 18, 2012
0
1,000
2,000
3,000
4,000
5,000
6,000
7,000
1991
1993
1995
1997
2001
2003
2005
2007
2009
UHM Peer Average DREU Average
Source: IPEDS. Peers are based on the old peer groups. The one based on new peers are quite similar and hence dropped.
FTE Staff: UHM vs. Peers, 1991-2010
UHERO.HAWAII.EDU ©2012July 18, 2012
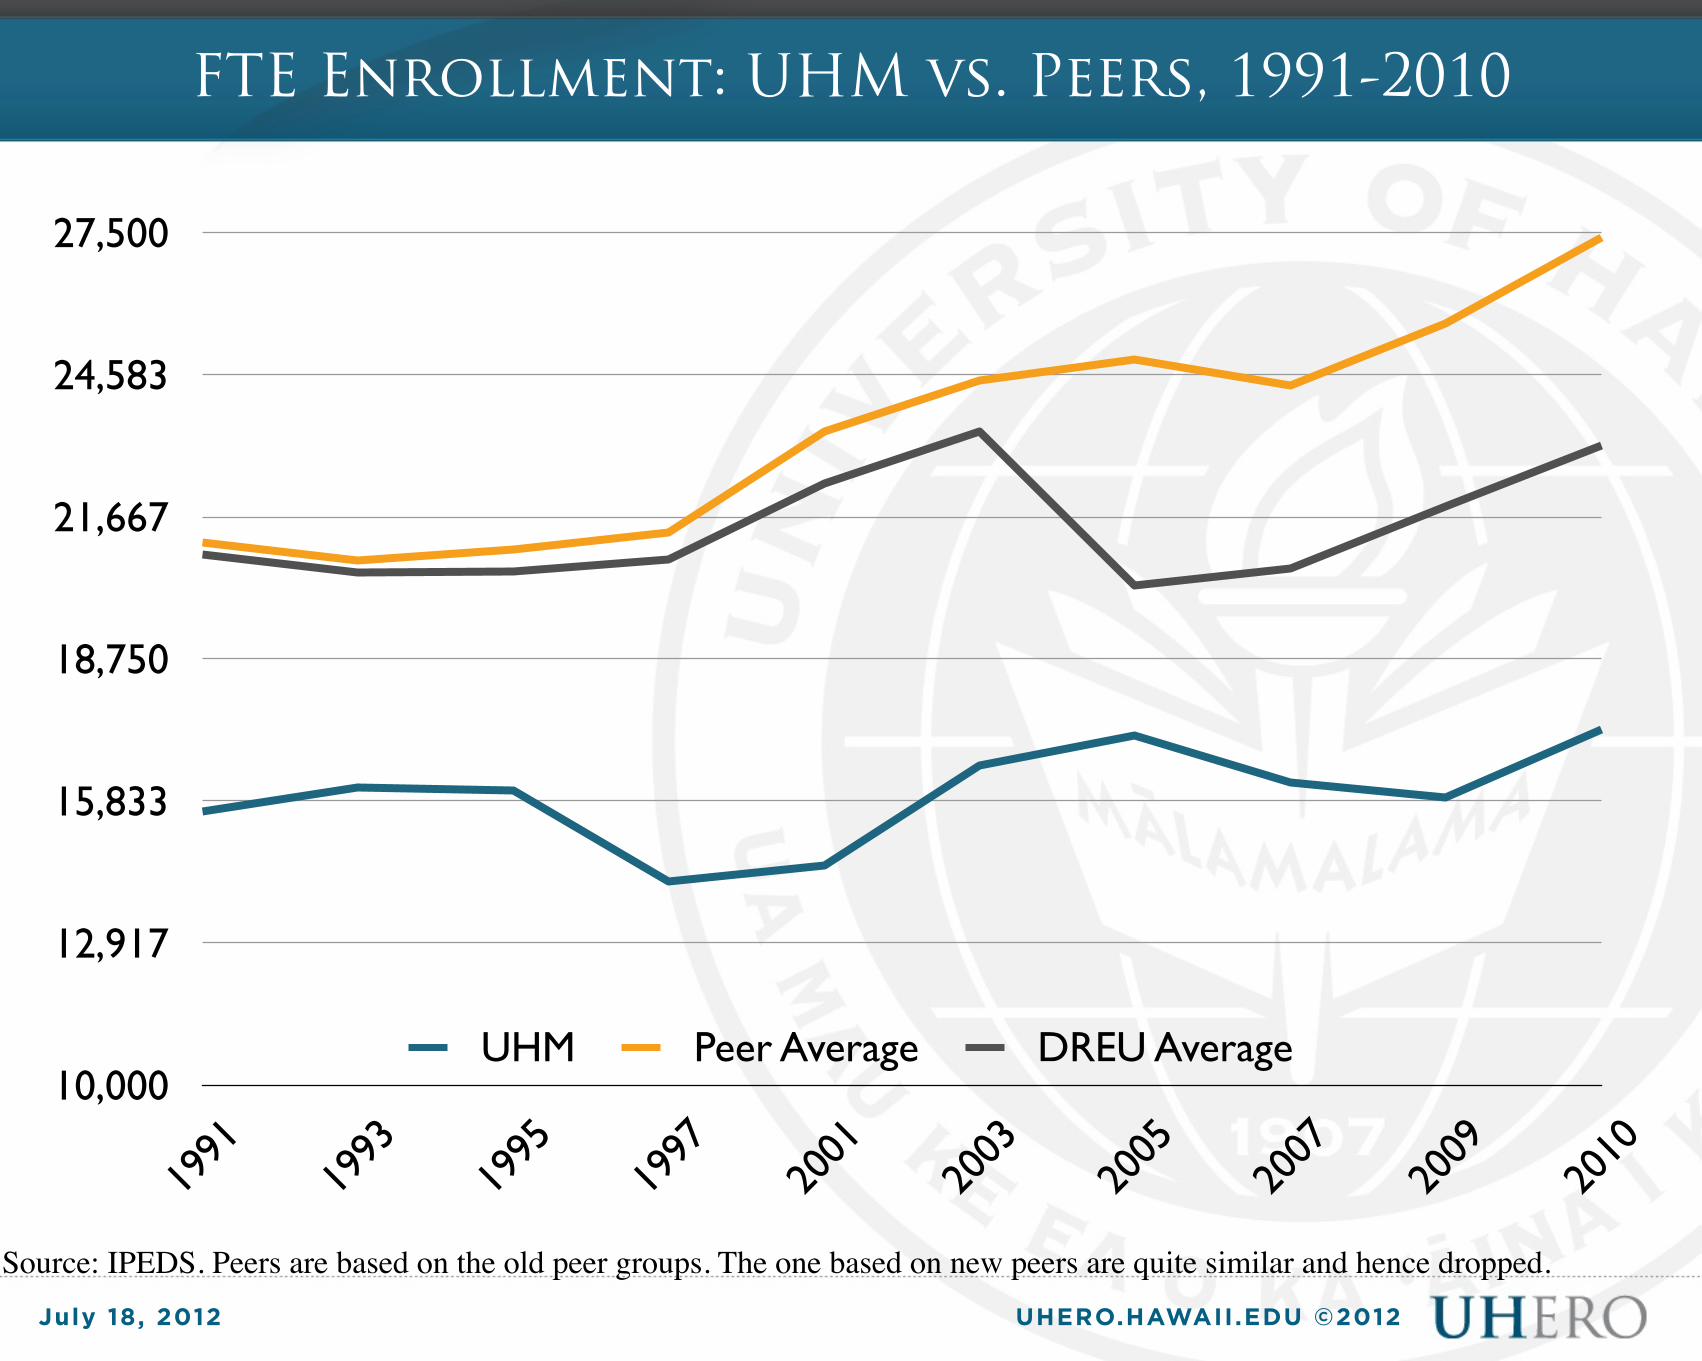
10,000
12,917
15,833
18,750
21,667
24,583
27,500
1991
1993
1995
1997
2001
2003
2005
2007
2009
2010
UHM Peer Average DREU Average
Source: IPEDS. Peers are based on the old peer groups. The one based on new peers are quite similar and hence dropped.
FTE Enrollment: UHM vs. Peers, 1991-2010
UHERO.HAWAII.EDU ©2012July 18, 2012
Ratio of Staff to Faculty, 2009
FTE Staff
Exec/Admin/Manage
Other Professional
Technical/Para Prof.
Clearical/Secretarial
Skilled Crafts
Service/Maintanance
0 0.5 1.0 1.5 2.0 2.5 3.0
0.18
0.03
0.23
0.15
0.86
0.05
1.50
0.33
0.14
0.55
0.29
1.16
0.15
2.61
Peer Average UHM
Source: IPEDS

UHERO.HAWAII.EDU ©2012July 18, 2012
Ratio of Staff to Enrollment, 2009
FTE Faculty
FTE Staff
Exec/Admin/Manage
Other Professional
Technical/Para Prof.
Clearical/Secretarial
Skilled Crafts
Service/Maintanance
0 0.06 0.12 0.18 0.24 0.30
0.02
0.00
0.03
0.02
0.10
0.01
0.17
0.11
0.03
0.01
0.05
0.03
0.11
0.01
0.25
0.10
Peer Average UHM
Source: IPEDS
UHERO.HAWAII.EDU ©2012July 18, 2012
Ratio of Total Staff to Faculty, 1991-2010
0
0.5
1.0
1.5
2.0
2.5
3.0
3.5
4.0
1991
1993
1995
1997
2001
2003
2005
2007
2009
2010
UHM UHM* Peer Averge DREU Average
Source: IPED. UHM* overstates UHM staffing by removing Specialist from faculty count and adding to staff count
UHERO.HAWAII.EDU ©2012July 18, 2012
Ratio Total Staff to Enrollment, 1991-2010
0.10
0.13
0.15
0.18
0.20
0.23
0.25
0.28
0.30
1991
1993
1995
1997
2001
2003
2005
2007
2009
2010
UHM Peer Average DREU Average
Source: IPEDS
UHERO.HAWAII.EDU ©2012July 18, 2012
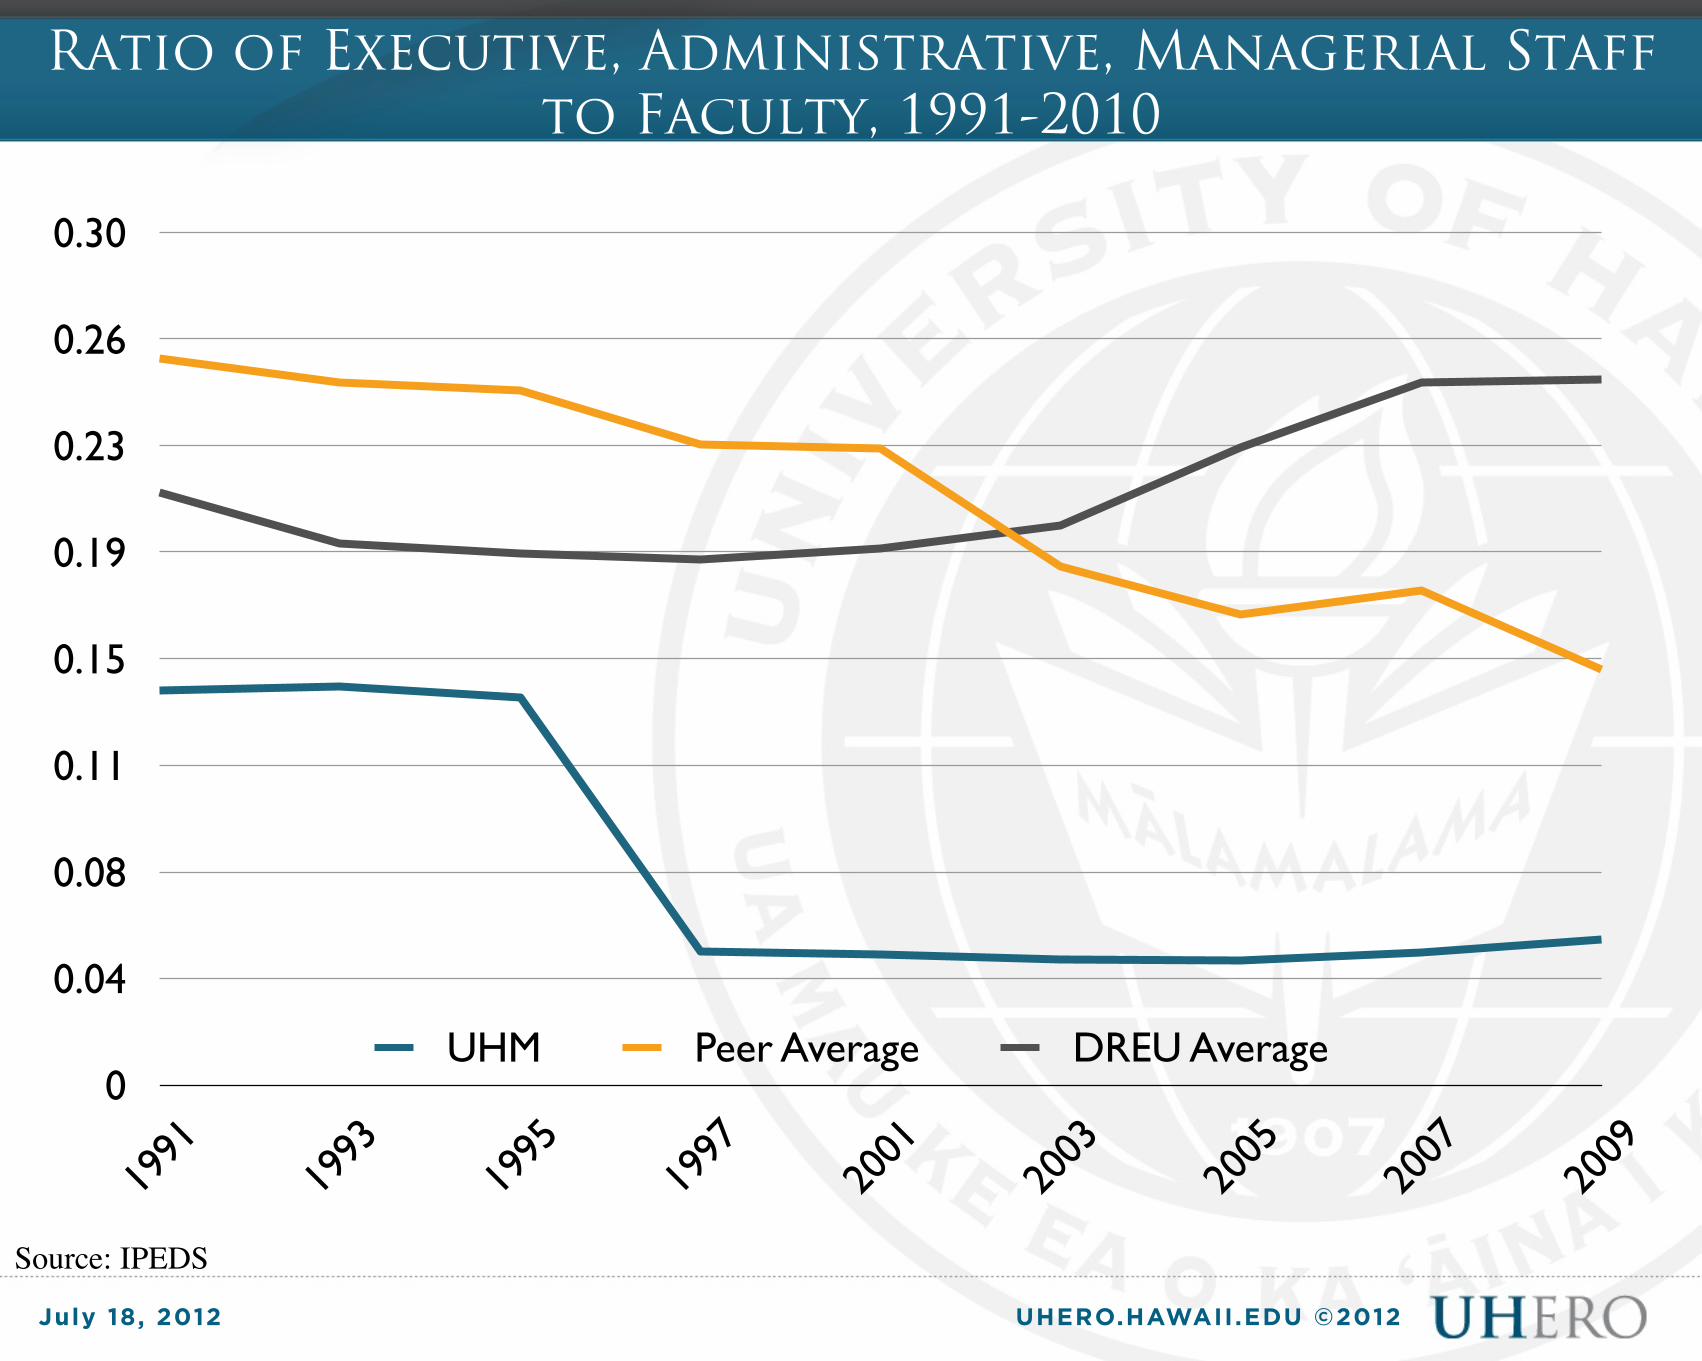
Ratio of Executive, Administrative, Managerial Staff to Faculty, 1991-2010
0
0.04
0.08
0.11
0.15
0.19
0.23
0.26
0.30
1991
1993
1995
1997
2001
2003
2005
2007
2009
UHM Peer Average DREU Average
Source: IPEDS
UHERO.HAWAII.EDU ©2012July 18, 2012
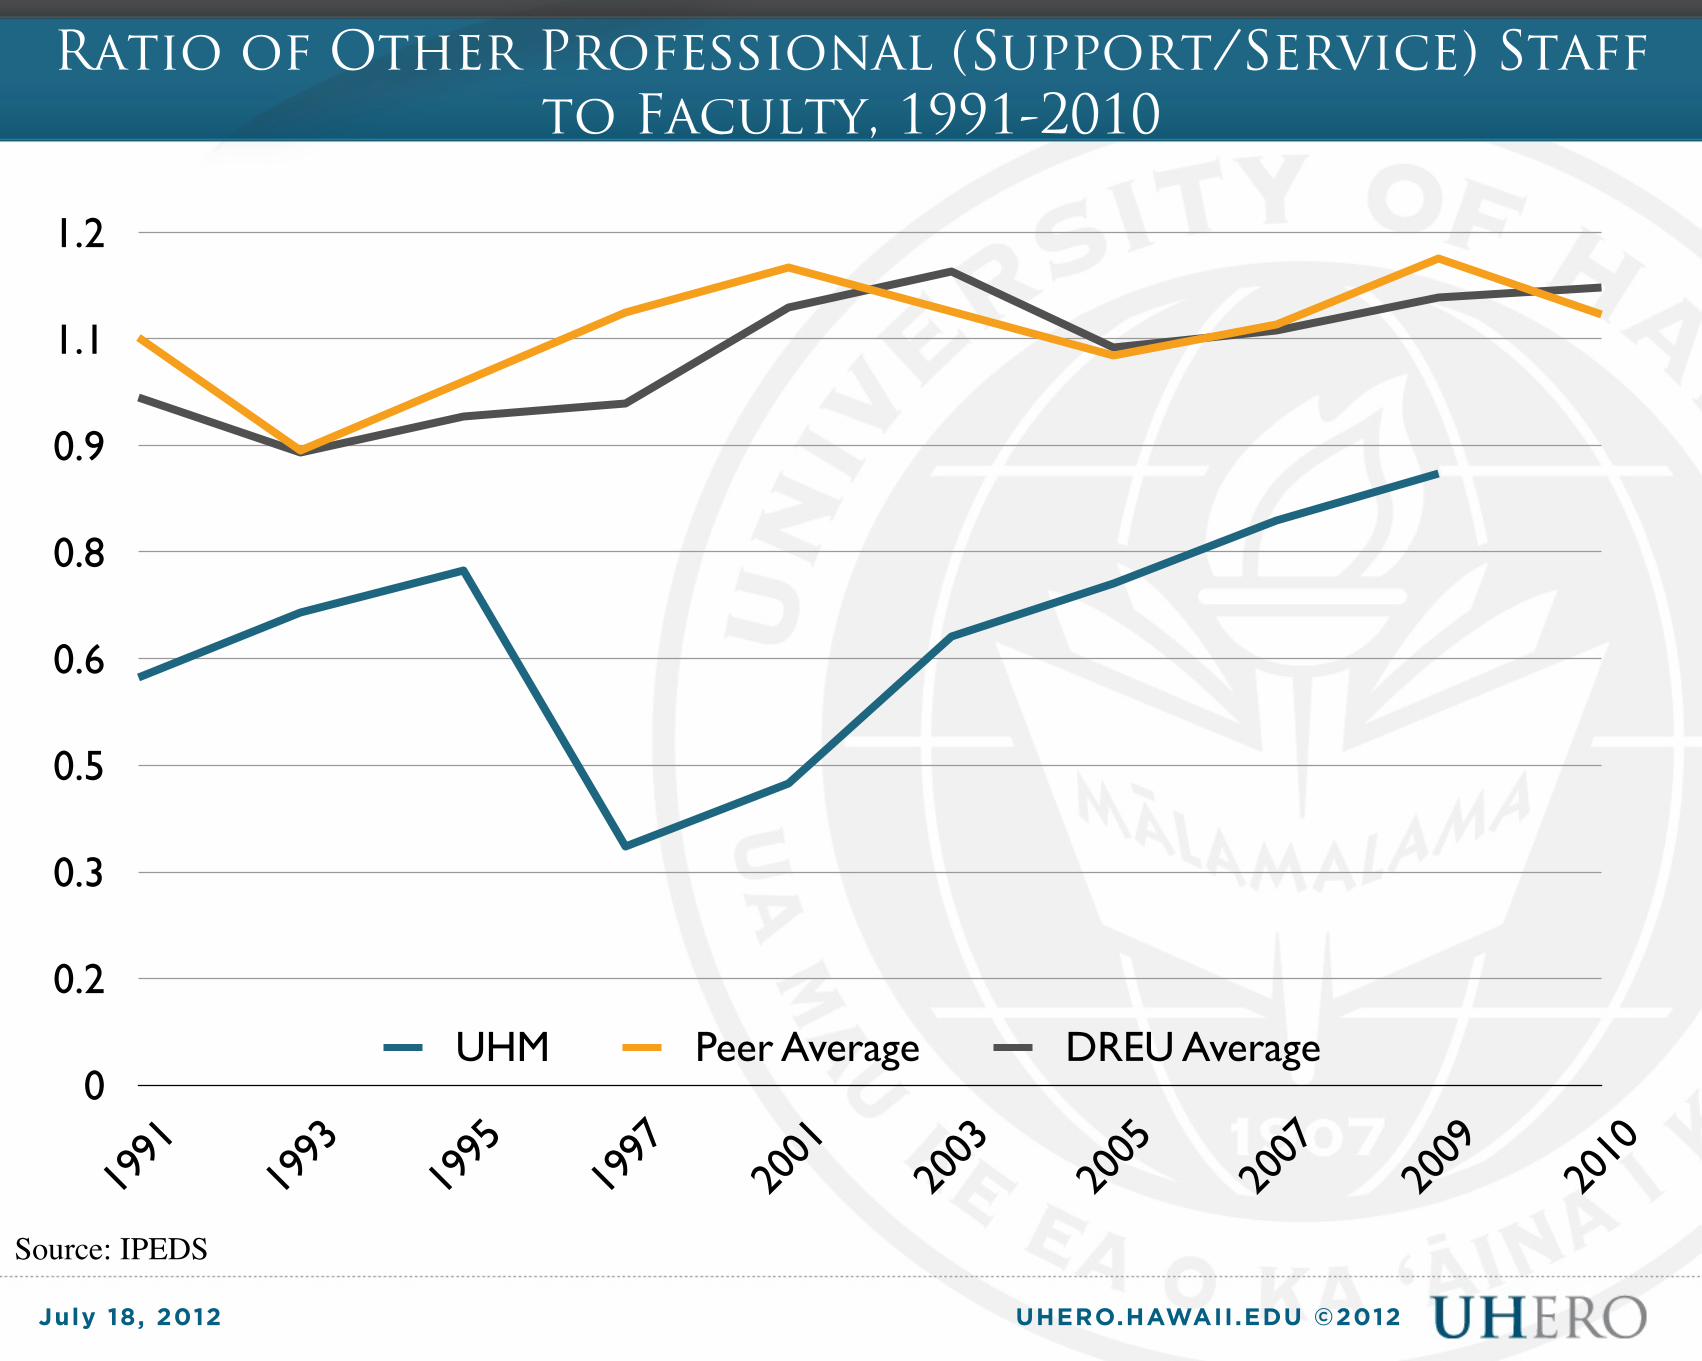
Ratio of Other Professional (Support/Service) Staff to Faculty, 1991-2010
0
0.2
0.3
0.5
0.6
0.8
0.9
1.1
1.2
1991
1993
1995
1997
2001
2003
2005
2007
2009
2010
UHM Peer Average DREU Average
Source: IPEDS
UHERO.HAWAII.EDU ©2012July 18, 2012
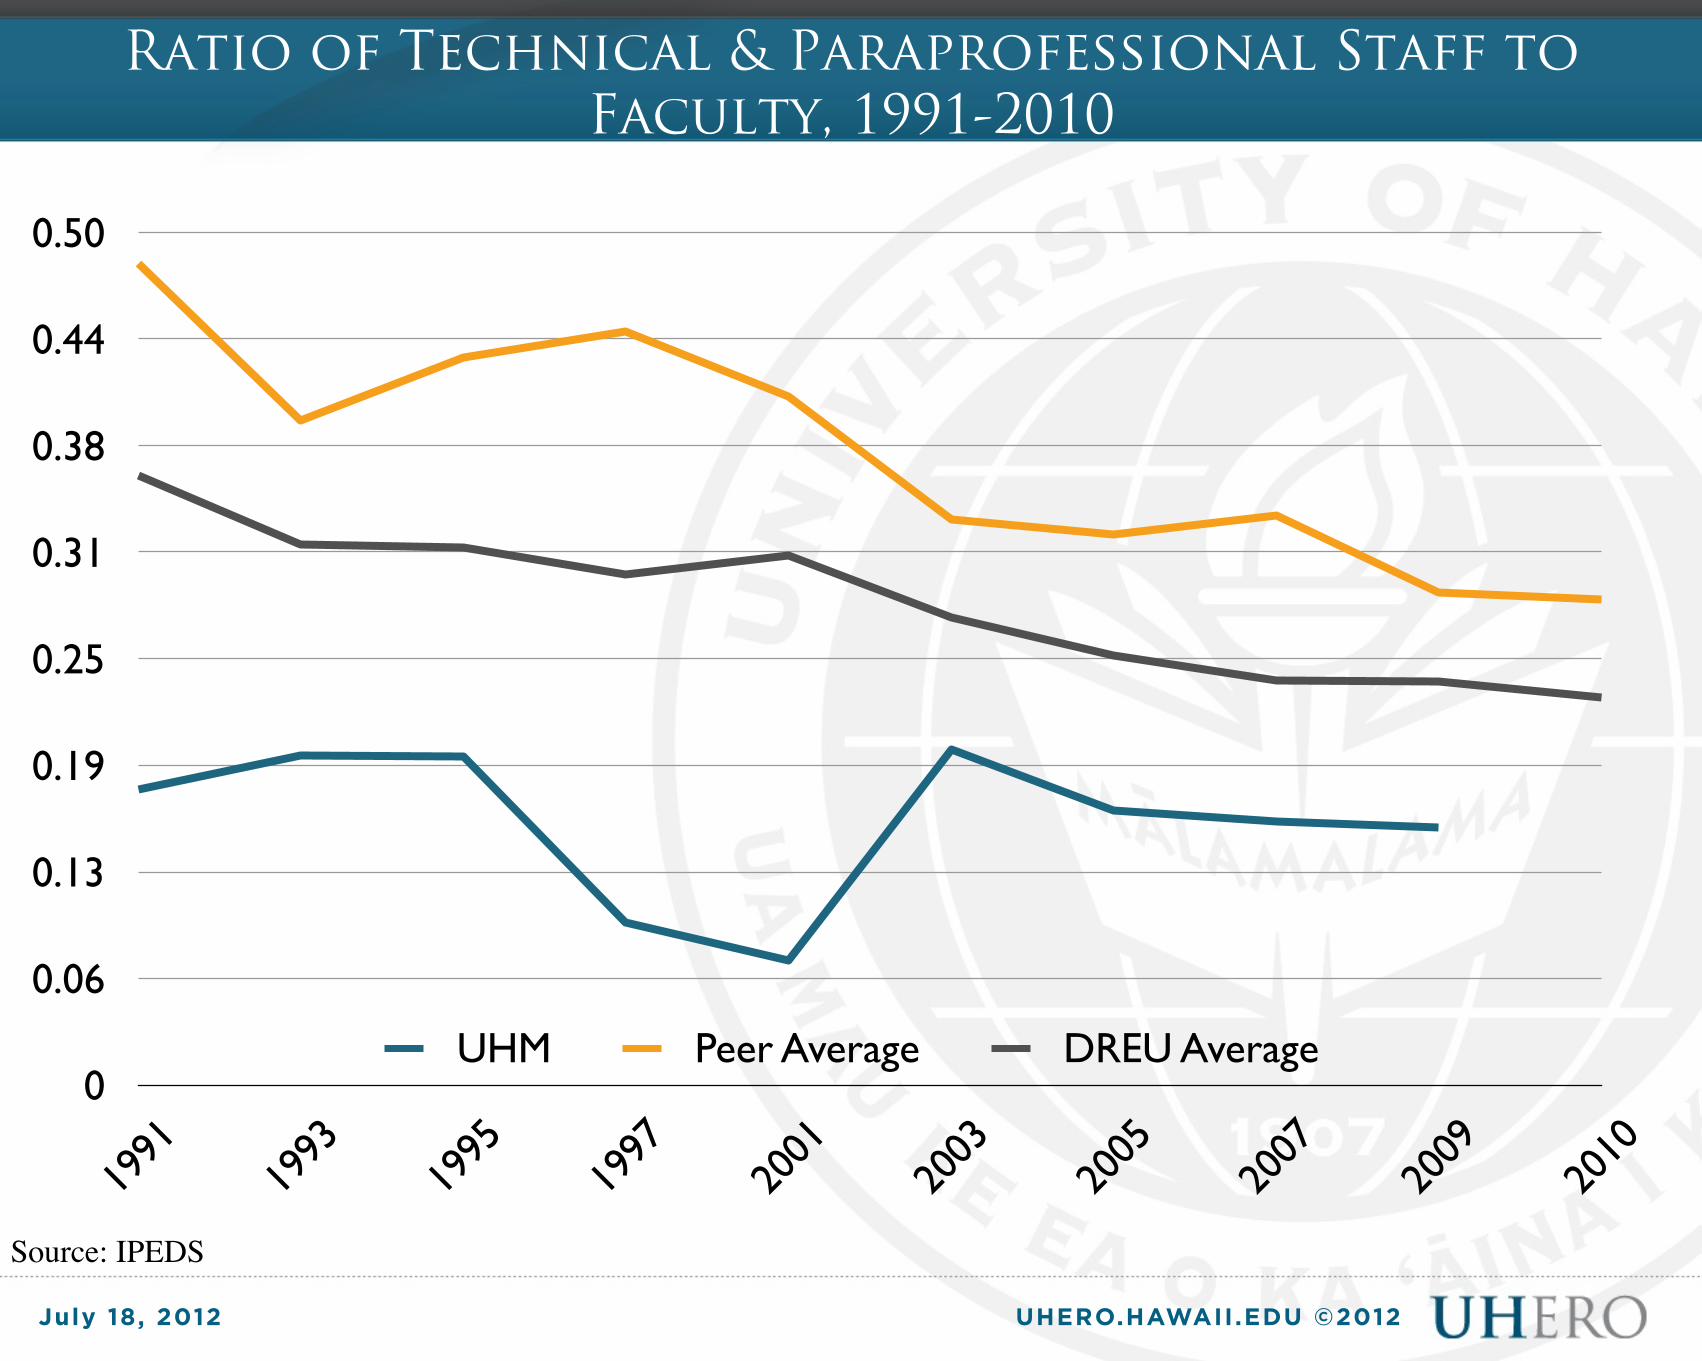
Ratio of Technical & Paraprofessional Staff to Faculty, 1991-2010
0
0.06
0.13
0.19
0.25
0.31
0.38
0.44
0.50
1991
1993
1995
1997
2001
2003
2005
2007
2009
2010
UHM Peer Average DREU Average
Source: IPEDS
UHERO.HAWAII.EDU ©2012July 18, 2012
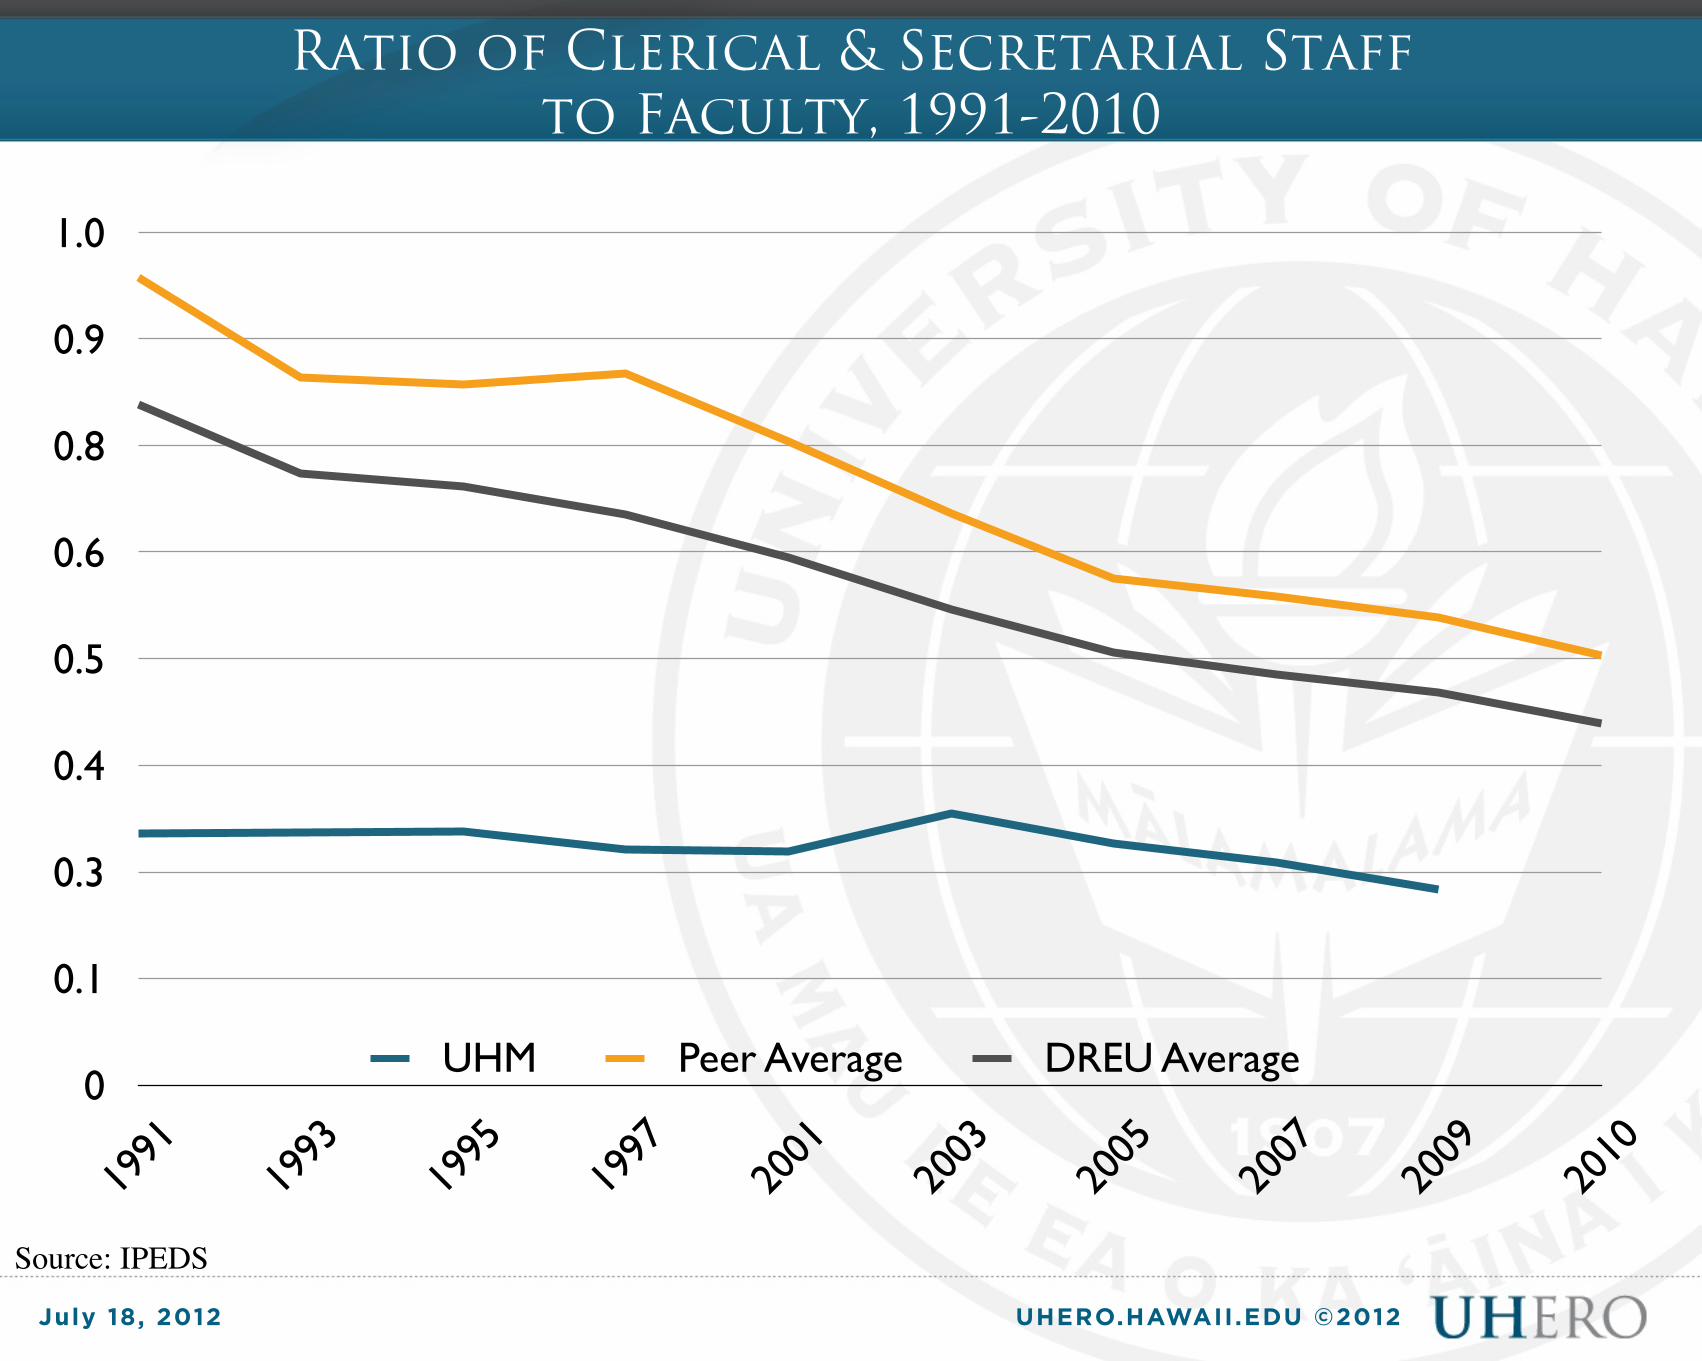
Ratio of Clerical & Secretarial Staff to Faculty, 1991-2010
0
0.1
0.3
0.4
0.5
0.6
0.8
0.9
1.0
1991
1993
1995
1997
2001
2003
2005
2007
2009
2010
UHM Peer Average DREU Average
Source: IPEDS
UHERO.HAWAII.EDU ©2012July 18, 2012
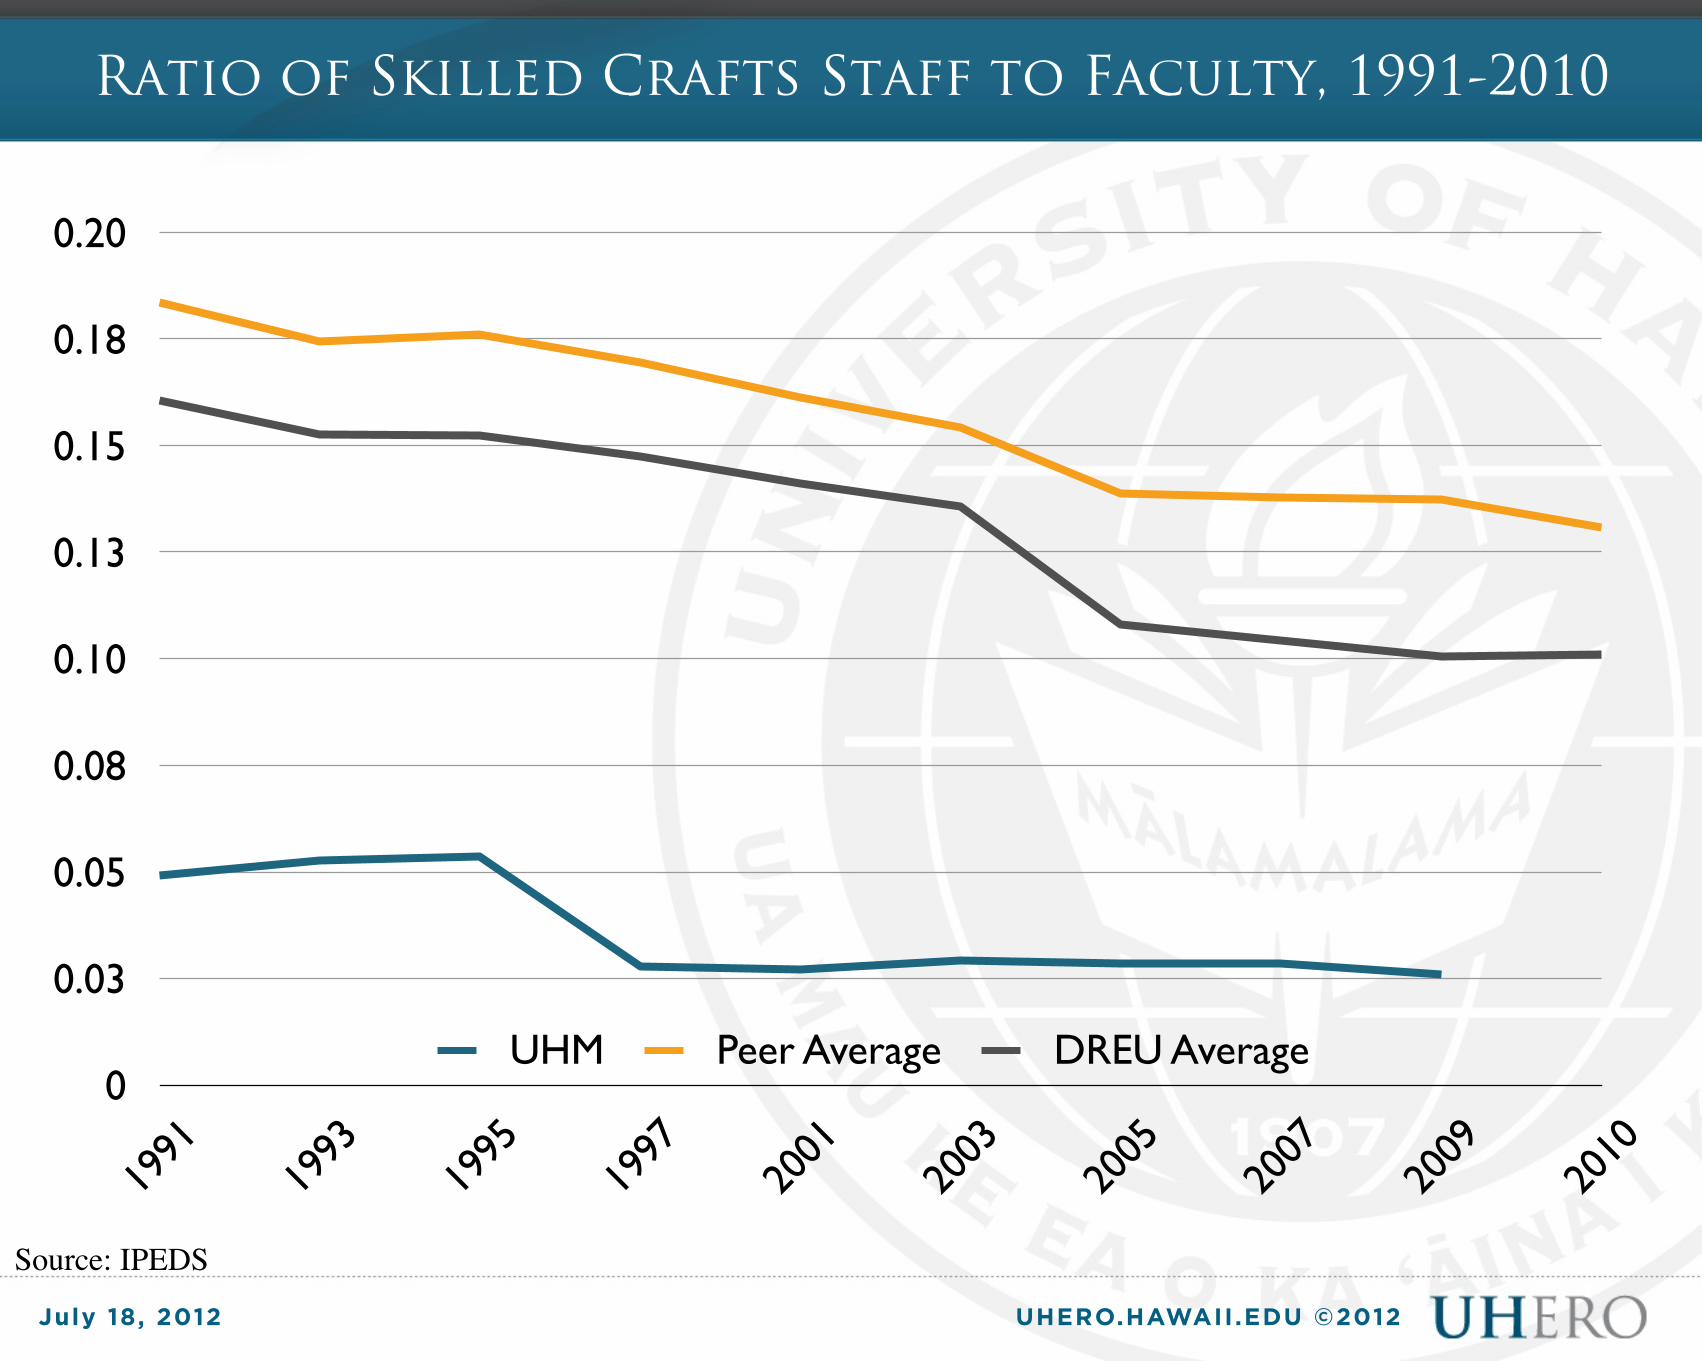
Ratio of Skilled Crafts Staff to Faculty, 1991-2010
0
0.03
0.05
0.08
0.10
0.13
0.15
0.18
0.20
1991
1993
1995
1997
2001
2003
2005
2007
2009
2010
UHM Peer Average DREU Average
Source: IPEDS
UHERO.HAWAII.EDU ©2012July 18, 2012
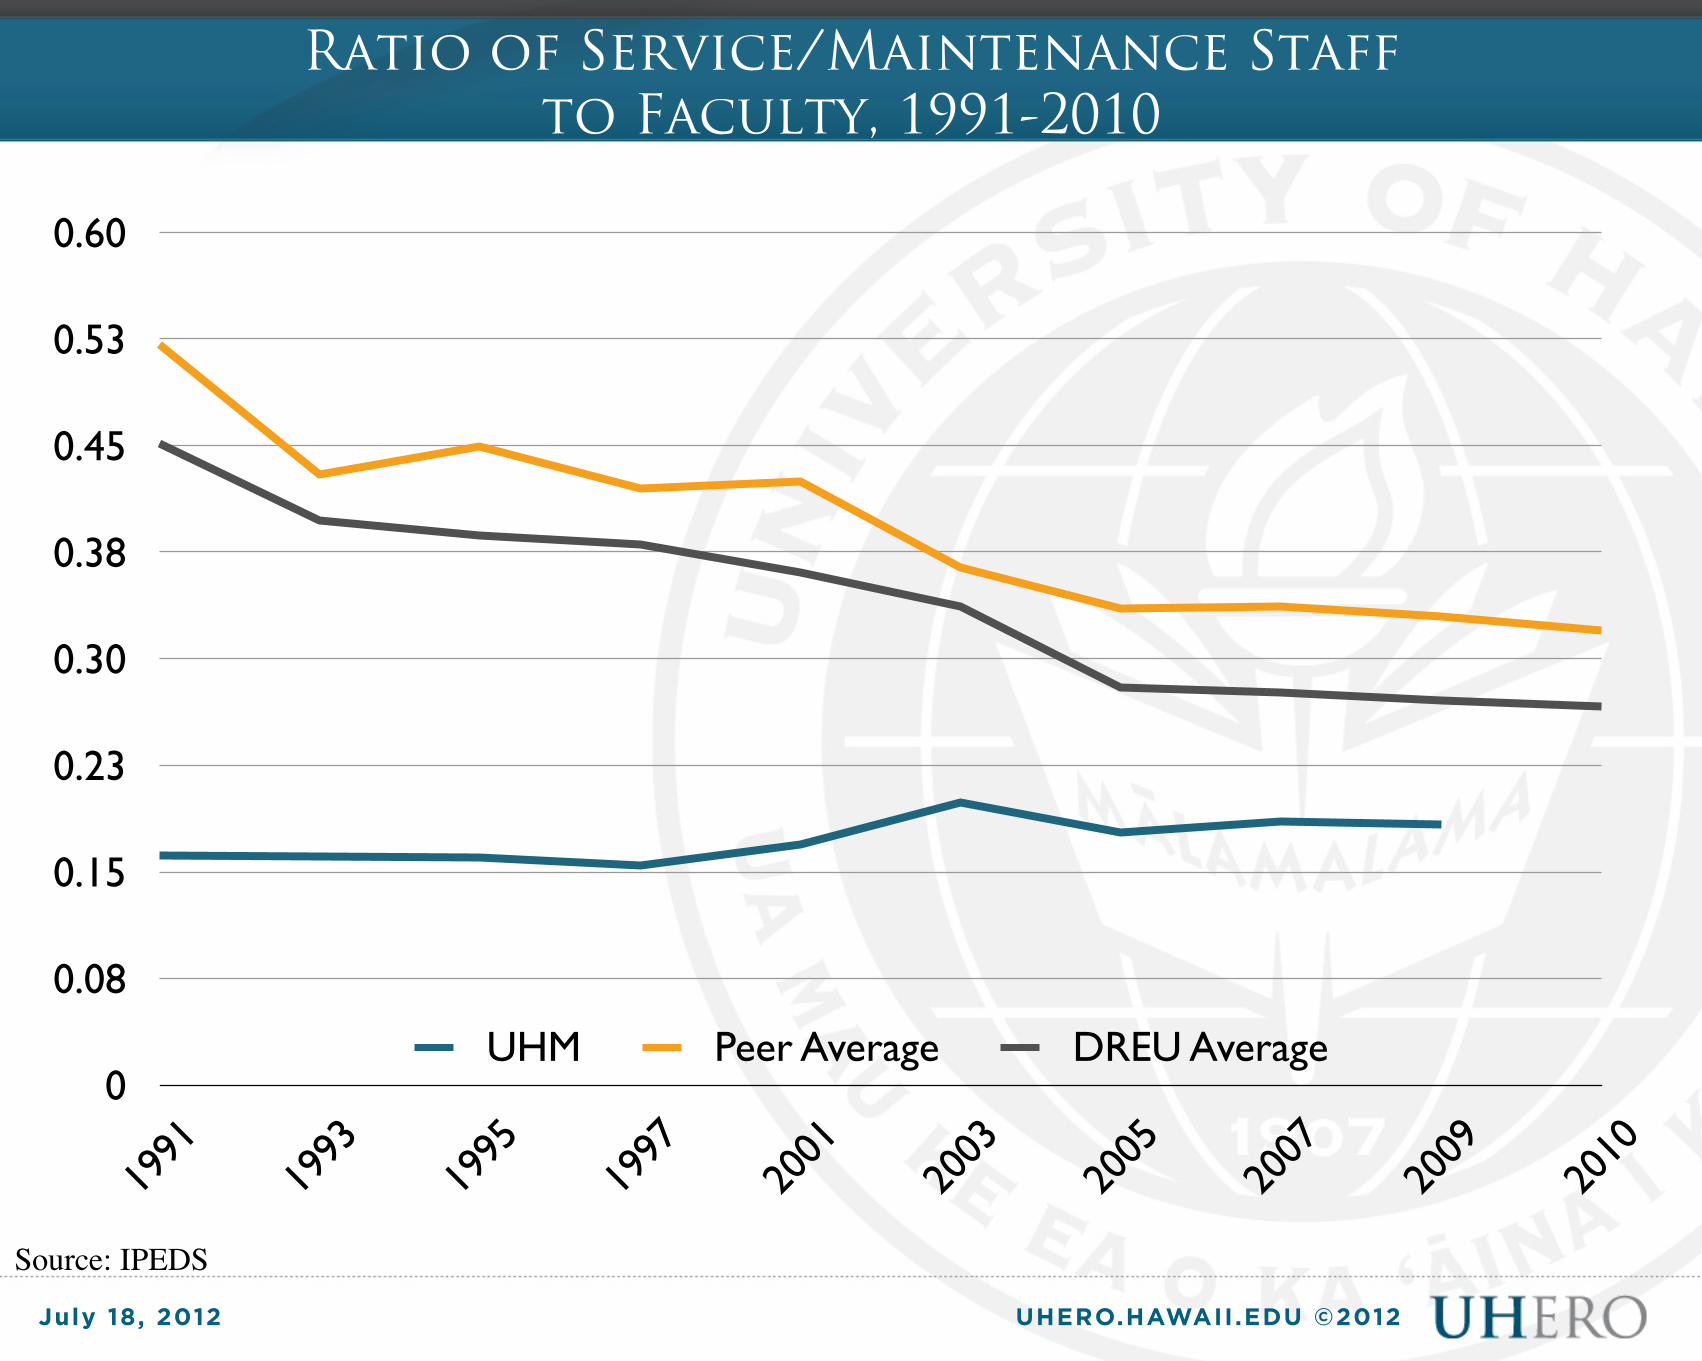
Ratio of Service/Maintenance Staff to Faculty, 1991-2010
0
0.08
0.15
0.23
0.30
0.38
0.45
0.53
0.60
1991
1993
1995
1997
2001
2003
2005
2007
2009
2010
UHM Peer Average DREU Average
Source: IPEDS
UHERO.HAWAII.EDU ©2012July 18, 2012
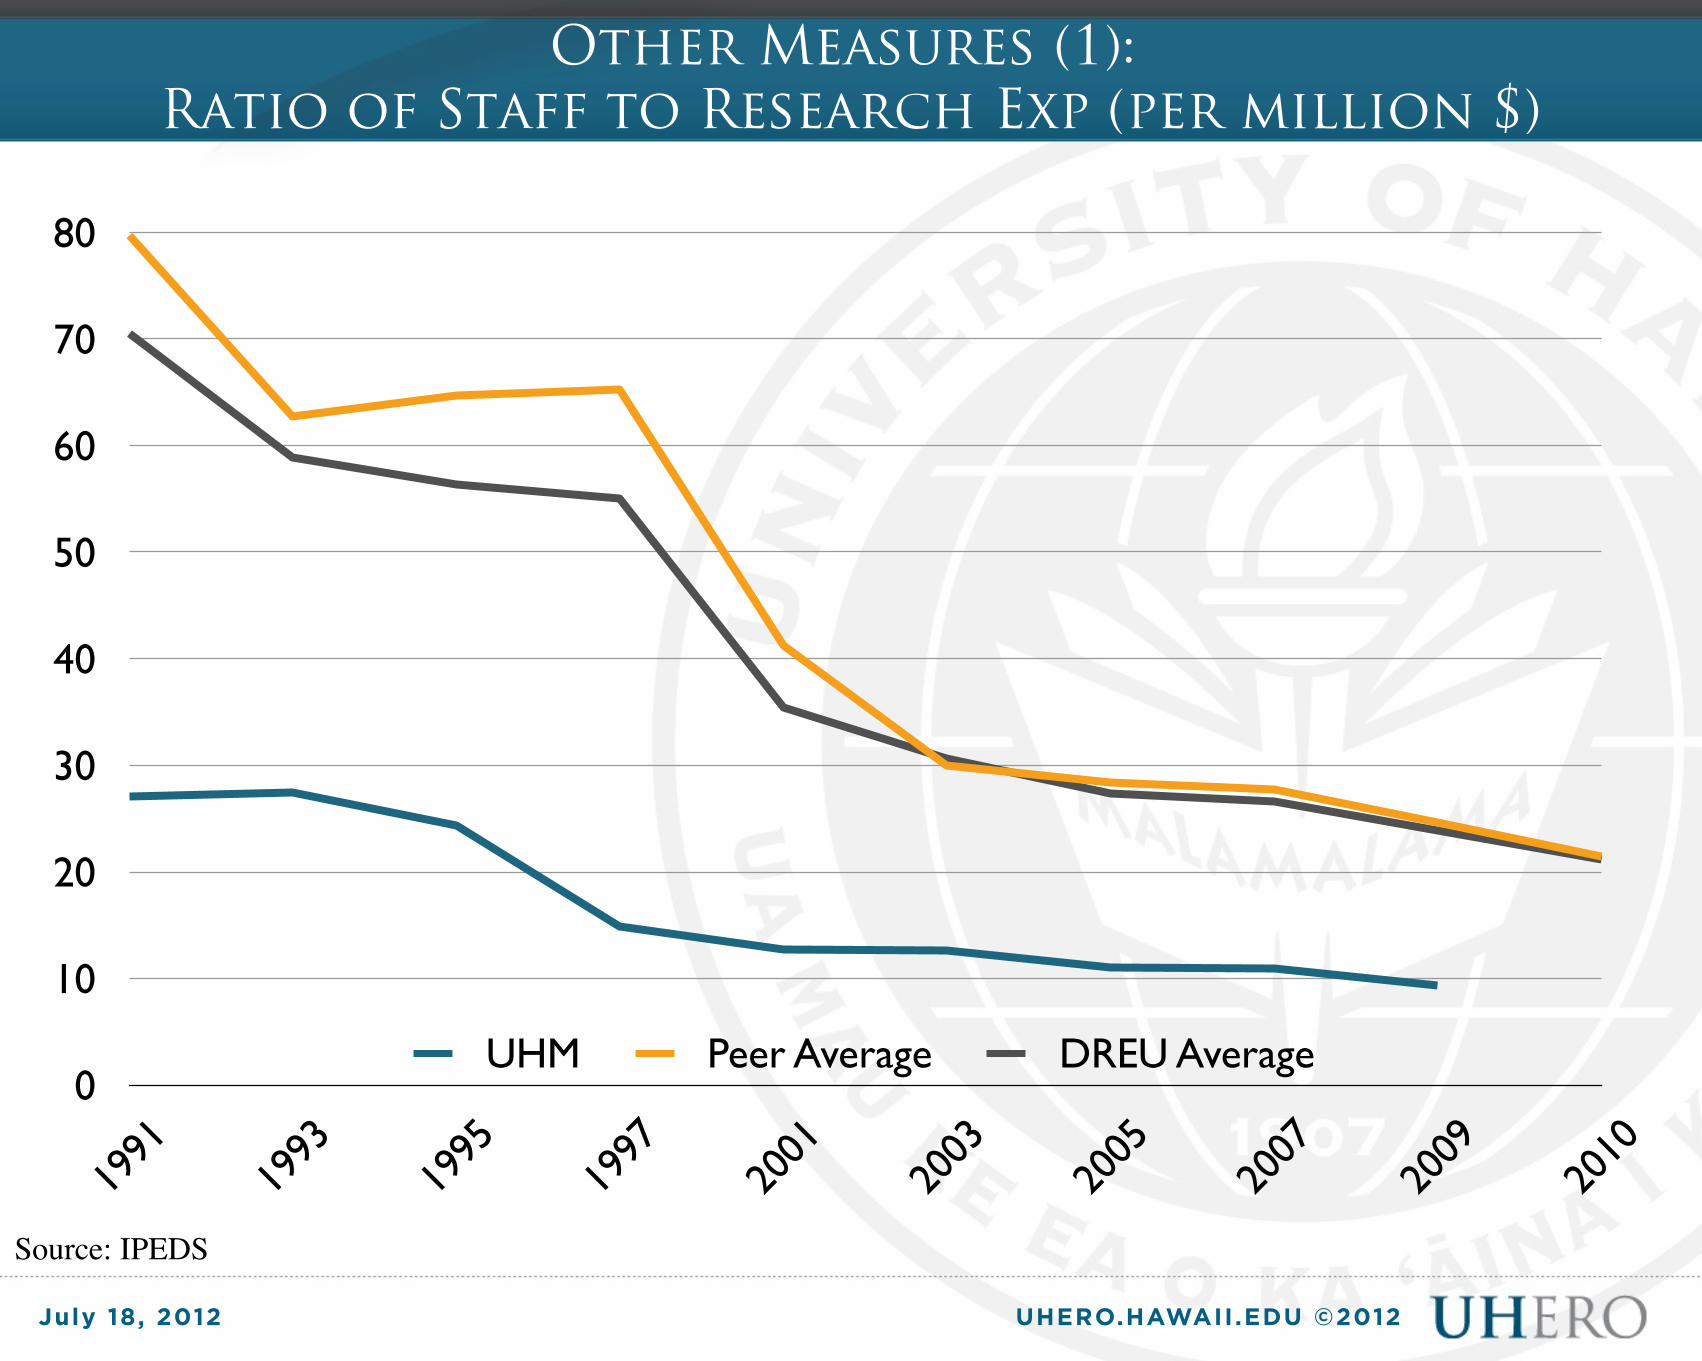
Other Measures (1): Ratio of Staff to Research Exp (per million $)
0
10
20
30
40
50
60
70
80
1991
1993
1995
1997
2001
2003
2005
2007
2009
2010
UHM Peer Average DREU Average
Source: IPEDS
UHERO.HAWAII.EDU ©2012July 18, 2012
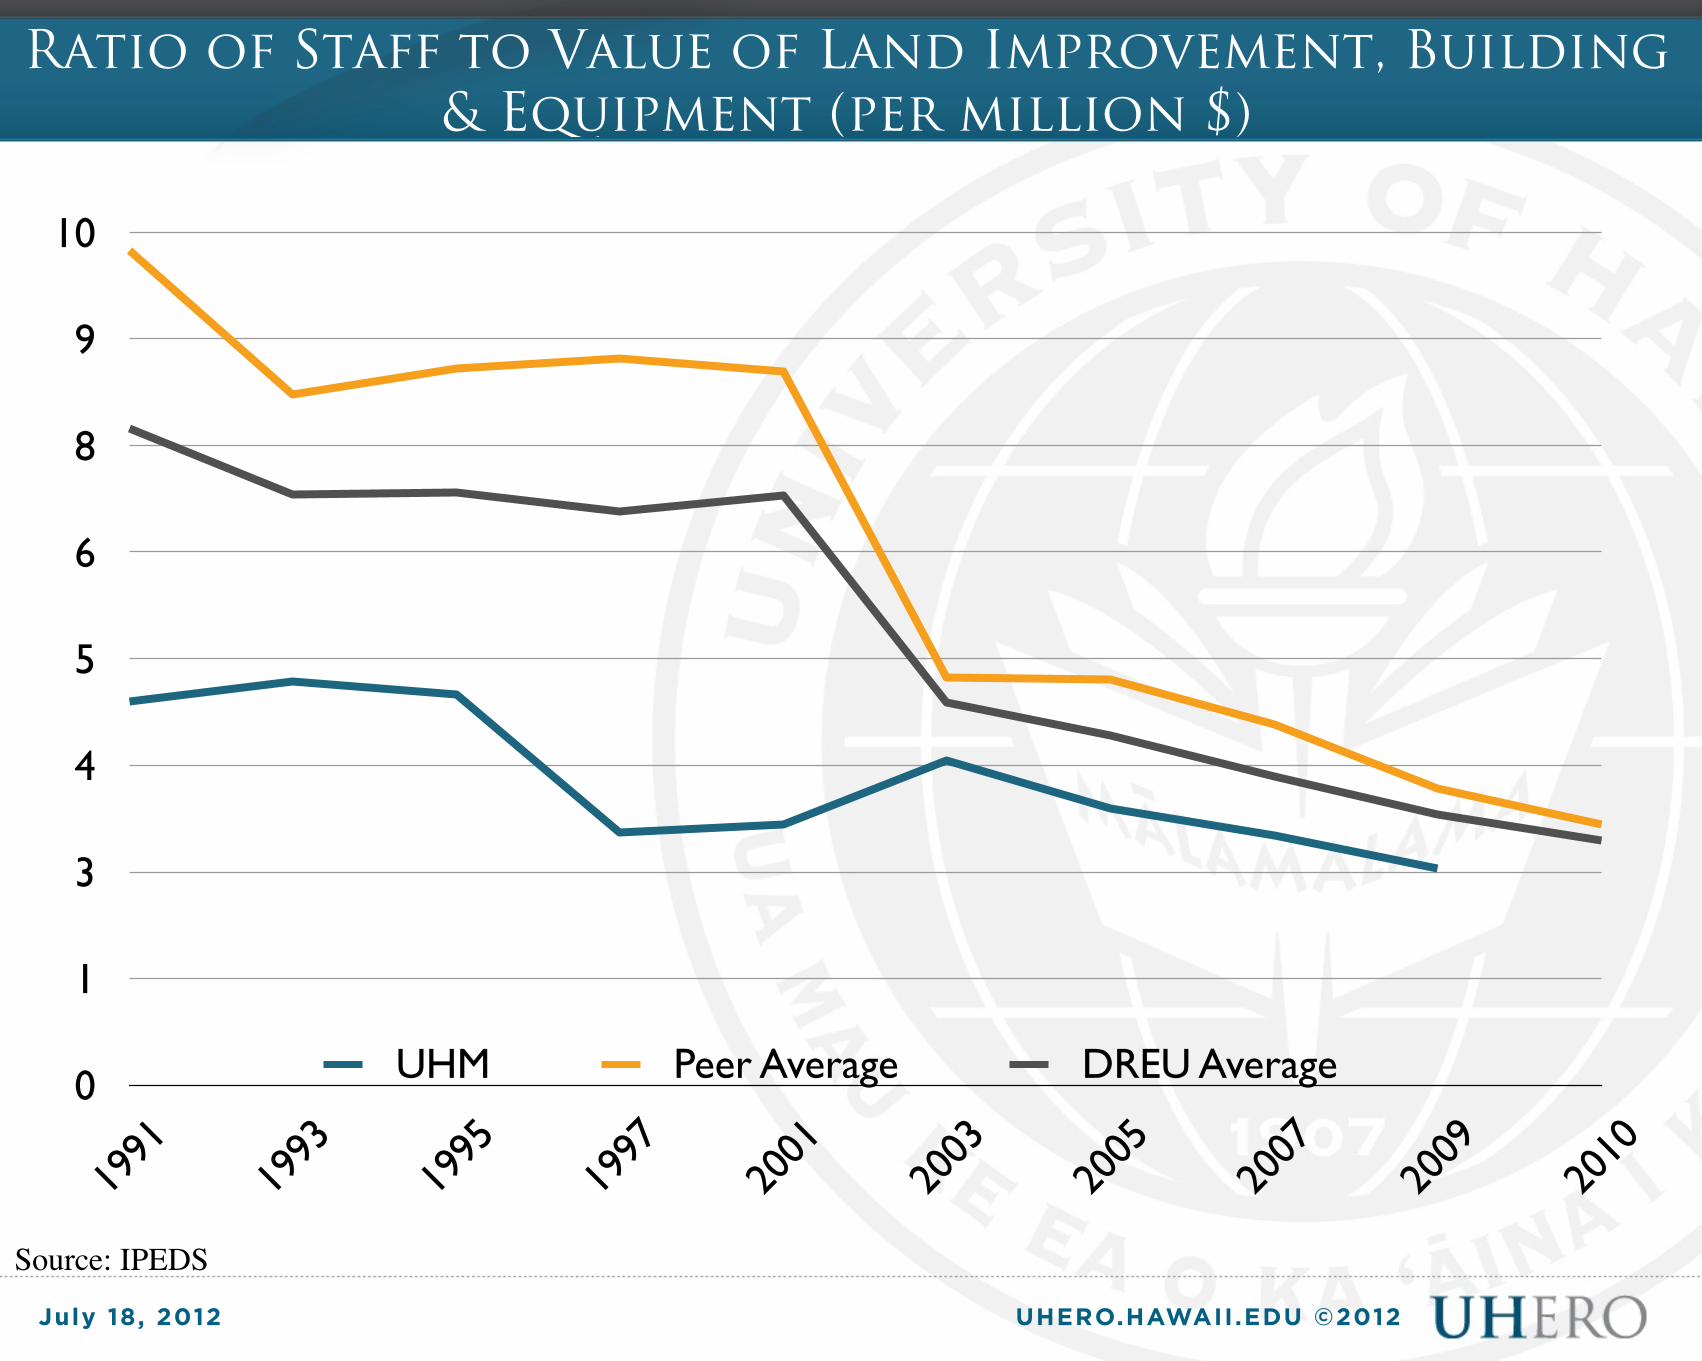
Ratio of Staff to Value of Land Improvement, Building & Equipment (per million $)
0
1
3
4
5
6
8
9
10
1991
1993
1995
1997
2001
2003
2005
2007
2009
2010
UHM Peer Average DREU Average
Source: IPEDS
UHERO.HAWAII.EDU ©2012July 18, 2012
Appendix: Definitions

UHERO.HAWAII.EDU ©2012July 18, 2012
Executive, Admin, Managerial
• Included in this category are employees holding titles such as: top executives; chief executives; general and operations managers; computer and information systems managers; financial managers; human resources managers; purchasing managers; presidents, vice presidents (including assistants and associates); deans, directors and dept. heads (including assistants and associates) if their principal activity is administrative and not primarily instruction, research or public service…
UHERO.HAWAII.EDU ©2012July 18, 2012
Other Professional Staff
• Persons employed for the primary purpose of performing academic support, student service, and institutional support, whose assignments would require either a baccalaureate degree or higher or experience of such kind and amount as to provide a comparable background.
• Included in this category are all employees holding titles such as business operations specialists; human resources, training, and labor relations specialists; management analysts; accountants and auditors; budget analysts; computer specialists; computer programmers; computer software engineers; computer support specialists; database administrators; network and computer systems administrators …; counselors, social workers, and other community and social service specialists; librarians, curators, and archivists; museum technicians and conservators; athletes,
UHERO.HAWAII.EDU ©2012July 18, 2012
Technical & Paraprofessional
• Persons whose assignments require specialized knowledge or skills which may be acquired through experience, apprenticeship, on-the-job-training, or academic work in occupationally specific programs that result in a 2-year degree or other certificate or diploma.
• Includes persons who perform some of the duties of a professional in a supportive role, which usually requires less formal training and/or experience than normally required for professional status. Included in this category are among others: mathematical technicians; agricultural and food science technicians; geological and petroleum technicians; paralegals and legal assistants; health technologists and technicians; licensed practical and licensed vocational nurses; healthcare support occupations …
UHERO.HAWAII.EDU ©2012July 18, 2012
Clerical & Secretarial
• A primary function or occupational activity category used to classify persons whose assignments typically are associated with clerical activities or are specifically of a secretarial nature.
• Includes personnel who are responsible for internal and external communications, recording and retrieval of data (other than computer programmer) and/or information and other paperwork required in an office. Also includes such occupational titles such as bill and account collectors;bookkeeping, accounting, and auditing clerks; payroll and timekeeping clerks; procurement clerks; file clerks; clerical library assistants;human resources assistants, except payroll and timekeeping; secretaries and administrative assistants; computer operators; data entry and information processing workers; desktop publishers; mail clerks and mail machine operators(except postal service); office clerks (general);

UHERO.HAWAII.EDU ©2012July 18, 2012
Skilled Crafts
• A primary function or occupational activity category used to classify persons whose assignments typically require special manual skills and a thorough and comprehensive knowledge of the processes involved in the work, acquired through on-the-job-training and experience or through apprenticeship or other formal training programs.
• Includes occupational titles such as welders, cutters, solderers and brazers; printers; cabinetmakers and bench carpenters; plant and system operators; stationary engineers and boiler operators; medical, dental, and ophthalmic laboratory technicians; painting workers; photographic process workers and processing machine operators; and etchers and engravers….
UHERO.HAWAII.EDU ©2012July 18, 2012
Service/Maintenance
• A primary function or occupational activity category used to classify persons whose assignments require limited degrees of previously acquired skills and knowledge and in which workers perform duties that result in or contribute to the comfort, convenience, and hygiene of personnel and the student body or that contribute to the upkeep of the institutional property.
• Includes titles such as law enforcement workers; parking enforcement workers; police officers; security guards; lifeguards; cooks and food preparation workers; food and beverage serving workers; other food preparation and serving related workers; building cleaning and pest control workers; grounds maintenance workers; electrical and electronic equipment mechanics; installers and repairers; electric motor, power tool, and related repairers; vehicle and mobile equipment mechanics, installers, and repairers; heating, air conditioning, and refrigeration mechanics and installers; motor vehicle operators; and parking lot attendants. …