Embed Size (px)
Citation preview

Staffing for Success: Linking Teacher Evaluation and
School Personnel Management in Practice
Benjamin Master ([email protected])
Stanford University

1
Abstract
Teacher evaluation is at the center of current education policy reform. Most evaluation systems
rely at least in part on principals’ assessments of teachers, and their discretionary judgments carry
substantial weight. However, we know relatively little about what they value when determining
evaluations and high stakes personnel decisions. Using unique data from an independently managed
public charter school district, I explore the extent to which autonomous school administrators’
formative evaluations of teachers predict a variety of future personnel decisions. I also assess the
extent to which their evaluations predict alternative measures of teacher performance, including
student and parent evaluations of individual teachers in the same and future school years. I find that
formative mid-year ratings – shared by administrators with teachers – clearly differentiate between
teachers and are strongly associated with end-of-year dismissal and promotion decisions. I use an
exploratory factor analysis to identify four distinct components of administrators’ feedback to
teachers and show that different components predict different types of personnel decisions in
schools. In addition, different components predict different teacher performance measures. The
results suggest the importance of accounting for multiple aspects of teachers’ work in evaluation
systems that are meant to inform multiple types of personnel decisions.

2
1. Background
The Federal Race to the Top Initiative has spurred development and implementation of new
teacher evaluation systems as a key lever for improving school effectiveness and raising student
achievement. Evaluation systems may improve the quality of teaching via two key mechanisms.
First, they may identify and promote effective teaching practices that help teachers to improve
(Taylor & Tyler, 2011). Second, they may facilitate personnel practices and policies that support the
retention of more effective teachers and the dismissal of less effective teachers, as well as more
optimal assignment of teachers to jobs in which they can have the most positive effect (Boyd,
Lankford, Loeb, & Wyckoff, 2011; Rockoff, Staiger, Kane, & Taylor, 2012).
To accomplish either of these aims, educators must leverage measures of teacher effectiveness
without inadvertently neglecting important contributions that occur outside the scope of
measurement. That is, evaluation systems will not be as effective if the evaluation measures used
miss important components of teaching that could aid in teacher improvement or more effective
personnel practices. Thus far, most emphasis in current reforms has been devoted to value-added
measures of teacher effectiveness based on student test performance. While these measures address
central aspects of teachers’ work, they provide little formative information and may do a poor job of
accounting for teacher impacts on valued student outcomes other than annual tested achievement,
such as motivation, character development, or achievement outside the scope of standardized tests.
They may also miss valuable teacher contributions that occur outside of regular classroom practice,
such as organizational leadership, relationships with students and families, or collaboration with
peers.
In response to these and other limitations of value added measures, schools have begun to
employ a range of alternative instrumental measures as tools for assessing teacher performance.
These include various observational protocols of teaching practices, such as the Framework for

3
Effective Teaching (FFT) or the Classroom Assessment Scoring System (CLASS), as well as survey
instruments assessing students’ and parents’ feedback about individual teachers. Researchers
studying teacher evaluation have primarily focused on developing these instruments based on
conceptions of good teaching and assessed the relationship between the measures from these
evaluation tools and value added measures of teachers’ impact on student achievement growth
(Kane & Staiger, 2012; Kane, Taylor, Tyler, & Wooten, 2011; Hamre & Pianta, 2005).
Prior to the recent wave of new measures, and even today, most teacher evaluation is based on
principals’ assessment of teachers. These evaluations are far less specific than either the value added
or instrumental measures but this lack of specificity may allow for a fuller view of teaching. Both
value-added measures and instrumental measures may fail to measure important teacher
contributions. If this oversight is the case, teachers may receive the wrong signals about how best to
improve their own performance. Similarly, personnel policies that are determined by these measures
may misapply high stakes consequences such as teacher promotions, role assignments and
dismissals.
One way of exploring the diversity of teacher contributions and better understanding the extent
to which value-added and other measures are capturing quality teaching is to investigate the
priorities of local school administrators who engage in subjective or standards-based teacher
evaluation. Subjective teacher evaluation refers to holistic administrator judgments based on flexible
criteria. Standard-based teacher evaluations link those judgments to a more fixed set of standards
that define a competency model of effective teaching (Heneman, Milanowski, Kimball, & Odden,
2006). Many emerging teacher evaluation systems leverage administrator perspectives of one or both
types, at least in part (e.g. Denver’s ProComp, New Haven Public Schools’ TEVAL).
Administrators’ more holistic judgments about teachers are valued in part because they can capture

4
aspects of job performance that may be missed by formal evaluation instruments. Administrators
are also essential actors because they play a critical role as mentors in formative evaluation systems.
Research on administrators’ evaluations of teachers has generally focused on whether they
predict value added measures of teacher effectiveness. For instance, Jacob and Lefgren (2008) use
survey measures to find that principals can directly identify very high and low value added teachers.
A substantial body of research has also linked subjective and standards-based principal evaluations
with objective teacher value added measures in practice (e.g. Holtzapple, 2003; Gallagher, 2004;
Milanowski, 2004; Rockoff & Speroni, 2011). In addition, Rockoff and colleagues (2012) find
evidence that principals make use of new information about teachers’ value added effectiveness to
inform their personnel decisions. Collectively, these studies indicate that principals are concerned
with, and are capable of partially identifying, teachers’ value added performance, but they provide
limited information about principals’ personnel priorities more broadly.
A few studies explore additional teacher characteristics that may be valued by administrators.
Harris and Sass (2009) survey principals in order to identify a variety of teacher traits that they
believe are important to teaching. Among these traits, they find that principals’ assessments of
teachers’ subject knowledge, teaching skill, and intelligence are associated with value added
effectiveness, while their assessment of teachers’ interpersonal skills are not. In a related vein, Jacob
and Lefgren (2008) find that survey-reported principal ratings of teachers are substantially better
predictors of parent requests for teachers than value added measures. Finally, Jacob and Walsh
(2011) identify associations between subjective evaluations determined in practice by administrators
and observable teacher characteristics, including attendance, experience, and credentials. These
studies do not, however, examine the import of explicit evaluation criteria in contexts where local
administrators have unrestricted autonomy over personnel decisions. This is important because we

5
may learn more about the relative priorities administrators ascribe to different evaluation criteria in
contexts where they are fully responsible for making tradeoffs between them.
In current practice, administrators’ subjective evaluations tend to do a poor job of distinguishing
between effective and ineffective teachers (Weisberg, Sexton, Mulhern, & Keeling., 2009). However,
this may be a product of the nature of existing evaluations systems. Rules surrounding
administrators’ capacity to conduct evaluations or implement high stakes differentiation are often
complex, ambiguous, and limiting — either overall or in particular aspects of evaluation (Hess &
Loup, 2008; Price, 2009; Ballou, 2000). Under these circumstances, they may have little incentive to
provide honest feedback as part of formal teacher assessments.
Administrators do take action to dismiss less effective teachers and promote more effective
teachers when they are empowered to do so (Jacob 2010; Chingos & West, 2011; Rockoff et al.,
2012). Thus, it seems likely that both subjective evaluations and personnel decisions made by
administrators who have greater autonomy will yield more credible insights into what they actually
value. Moreover, because emerging evaluation reforms are providing schools greater discretion in
teacher personnel management, it is increasingly important to understand administrators’
perspectives in this regard.
A better understanding of the teacher contributions that administrators consider in their
personnel decisions may improve the design of emerging evaluation systems. Investigations of
administrator practices can help to illuminate not only what they care about, but what they can
observe and how they act upon those observations. While the measures utilized in teacher evaluation
system are ultimately discretionary, additional insights into administrators’ perspectives and
professional judgments offer two key benefits. First, they can inform the selection of measures and
professional standards considered in evaluations. Second, they may identify common disconnects

6
between desirable standards and the priorities of local school leaders who will be responsible for
their implementation.
Contribution
In this study, I relate administrators’ mid-year, formative evaluations of teachers to a variety of
subsequent personnel decisions, including teacher dismissals, voluntary teacher resignations,
administrators’ identification of likely candidates for future promotions, and administrators’ actual
promotion of teachers to different school leadership roles. I investigate these administrator practices
in an urban charter school district that is characterized by a high degree of local autonomy over
personnel management decisions, and where administrators structured their formative evaluations
around an unusually detailed set of standards regarding key desired teacher skills and behaviors.
Moreover, while some previous research has linked principals’ subjective evaluations of teachers to
dismissal decisions, this is the first study to relate subjective evaluations to teacher promotions to
distinct roles in schools. Due to data and sample size limitations, I am unable to provide a robust
test for associations between individual teachers’ ratings and their value added to student
achievement. However, I provide additional corroboration of the information contained in
administrators’ evaluations of staff by relating them to alternative teacher performance measures
collected after the evaluations occurred. These characteristics of the study facilitate a particularly
credible and informative investigation into administrators’ enacted personnel management priorities.
I specifically address the following questions of interest:
1. Do formative mid-year teacher evaluations in this charter district meaningfully differentiate
teacher performance, both within and across individual schools?
2. Do overall ratings on the formative mid-year teacher evaluations predict subsequent
dismissal and promotion decisions by administrators?

7
3. Are there coherent and distinct factors within administrators’ evaluations of teachers that
reflect different aspects of teachers’ performance?
4. Do different factors from the evaluations predict different types of personnel decisions or
anticipated personnel decisions?
5. Do the formative evaluations predict alternative measures of teacher performance –
including student and parent ratings of teachers – either in the same school year or in a
future school year?
I find that formative mid-year ratings in this charter district clearly differentiate between teachers
and are strongly associated with administrators’ end-of-year dismissal and promotion decisions.
Evaluation ratings also predict alternative teacher performance measures in the same and future
school years. I use an exploratory factor analysis to identify four distinct components of
administrators’ feedback to teachers and show that different components predict different types of
personnel decisions and teacher performance measures in schools. The results offer new insight into
administrator decision-making, and suggest the importance of accounting for multiple aspects of
teachers’ work in evaluation systems that are meant to inform multiple types of personnel decisions.
The remainder of the paper proceeds as follows. Section 2 provides relevant background
information about the district, and details my data. Section 3 specifies my methods and section 4
presents results corresponding to each of my research questions. Section 5 concludes with a
discussion of implications and potential limitations.
2. District Context and Data
Charter District Context
My data come from a network of highly effective1 public charter schools that operate alongside
state public schools under a single centralized district management team. The charter district serves

8
approximately 5,000-10,000 students, and consists of a mix of elementary, middle, and high schools
that students attend sequentially. In order to preserve district anonymity, I do not include precise
details about the size or number of schools examined in this study.2 District educators serve an over-
subscribed, lottery-selected population of predominantly poor and minority students. Approximately
75% qualify for free or reduced price lunch, and the student population is made up of 80% African
American students and 19% Hispanic students. Qualitatively, educators in the district espouse some
key practices associated in prior research with effective urban and charter school organizations,
including a “No Excuses” culture of high behavioral and academic standards for students, a focus
on in-house coaching and mentoring of new staff, significant attention to parental engagement, and
increased instructional time in the school day and year (Dobbie & Fryer, 2011; Angrist, Pathak &
Walters, 2011; Fryer, 2011).
*** INSERT TABLE 1 ***
The charter district’s human resource practices are distinct from typical public schools in
important ways. In particular, teacher dismissals and promotions represent the autonomous
decisions of local school and district administrators – unrestricted by any external contracts or
policies. Teachers’ employment contracts are negotiated individually, and do not stipulate any fixed
teacher tenure. As detailed in Table 1, the rate of dismissals among evaluated teachers (7.2 percent)
in this district is high relative to typical public school dismissal rates. The dismissal rate among
teachers in their first or second year in the district is somewhat higher, at 8.1 percent.
Charter district schools also operate in a distinct accountability context. Individual schools are
awarded charters for a period of between three to five years, after which they must demonstrate
success relative to specific performance criteria in order to renew their license. In addition to
adhering to basic regulations (e.g. safe, hygienic facilities), the criteria assessed consist primarily of
explicit goals for student academic performance on state standardized tests, and the successful

9
enrollment and retention of a full cohort of students, including a sufficient proportion of students
who are economically or academically disadvantaged.
Charter district data – including teacher characteristics, personnel decisions, and teachers’
evaluative ratings – are available over three years, from school year (SY) 2008-2009 through SY
2010-2011. During this period, most district schools participated for one or more years in a
common, formative teacher evaluation system. The number of participating schools increased over
time. Through this system, a total of 506 individual teachers received one or more evaluations during
this period and are included in the study. In addition, alternative teacher performance measures –
including student and parent ratings of individual teachers – were collected in the spring of SY 2010-
2011 and SY 2011-2012, and are available for a subset of the teachers considered in this study.
Details about each category of data provided by the district are provided in the following sub-
sections.
Mid-Year Formative Teacher Evaluations
In January or February of each school year, administrators in participating schools documented
formal mid-year teacher evaluations for the majority of their full-time teachers. These evaluations
reflect principal or assistant principal judgments about teachers using a loosely defined rubric that
covers 47 different indicators of performance so far that year. Each indicator is rated on either a 5-
or-4-point Likert scale with ratings ranging from “Role Model” to “Needs Development.”
Table 2 includes a complete list of the individual evaluation indicators used by the charter
district, paraphrased for brevity. It also shows the conceptual structure district actors used as a
framework for evaluation. Each indicator is grouped into one of 7 dimensions of professional
excellence: Achievement, Character, Instruction, Classroom Culture, Systems and Planning, Student
and Family Relationships, and Personal Effectiveness. District leaders developed the rubric criteria
“in-house,” after an extended process of engaging school leaders and teachers in conversation about
10
what they considered to be the most important aspects of teaching. These standards were further
reinforced during each school year as part of school leader and teacher professional development
activities. Administrator rating practices were not systematically normed or calibrated across schools.
Nevertheless, as I discuss in my results, the relative ratings of teachers within and across schools
proved to be highly correlated.
School leaders rated their staff autonomously, based on their holistic impressions from the first
half of the school year. School leaders who conducted evaluations held roles explicitly focused on
instructional leadership, and their perspectives were informed by frequent formal and informal
classroom observations and other coaching interactions with staff throughout the school year.
Evaluation ratings were shared with each teacher as part of a formal mid-year review meeting, and
teachers also completed a separate self-evaluation of the same criteria in preparation for that
discussion. The entire activity was intended to be formative in nature, and was not systematically tied
to any specific high stakes pay or personnel decisions.
As detailed in Table 1, a total of 747 teacher-ratings were documented over the three year period
of the study, representing ratings of a total of 506 individual teachers by 45 individual administrator
evaluators. 77% of full time teachers in participating schools received at least one fully documented
mid-year review, with increasing within-school participation rates over time.3 56% of documented
teacher ratings had either one (29%) or more than one (27%) missing score across the 47 indicators.
Charter district records indicate that this primarily occurred when evaluators felt they did not have
enough information to determine a rating on a particular dimension. In order to avoid dropping the
entire evaluative record for these teachers, I employ an Iterative Chained Equations (ICE) approach
to impute the missing indicators, using data from non-missing indicators to arrive at predicted
values.
Staff Demographic Data

11
Available staff demographic data include teachers’ gender, age, race, and the length of their
tenure within the charter district in each school year. The average within-district tenure for teachers
was 2.3 years. For most teachers, data were also available on their total years of teaching experience,
including years outside of the district. However, because lifetime teaching experience data was
missing in substantially non-random ways for 142 teachers, and in patterns that were correlated with
some outcomes of interest, I do not use this data in the study. Nevertheless, it is notable that
teachers who were in their first year of teaching in the district possessed an average prior teaching
experience of 2.4 years. This reflects district policies of primarily recruiting teachers with at least
some prior teaching experience, and is an important consideration when interpreting associations
with local teacher experience.
Personnel Decisions
Dismissals and Resignations. Charter district records distinguish formal dismissals from teachers’
voluntary resignations. There were no formal criteria linked to teacher dismissals during the time of
this study, but anecdotal feedback from administrators suggests that concerns with teachers’ impacts
on student achievement, with the various performance standards considered in the mid-year
formative evaluations, and with teachers’ potential for improvement in the future all may have been
considerations. As in other school districts, administrators may have also influenced teachers’
voluntary resignations, albeit indirectly (Rockoff et al., 2012; Balu, Beteille, & Loeb, 2010).
Promotions to School Leadership. The charter district tracked formal teacher promotions to principal
and assistant principal roles in each school year. Assistant principal responsibilities can vary
substantially within schools, and in this district are bifurcated between “academic leadership” and
“school culture” designations. Based on district-provided role descriptions, promotions to
“academic leadership” positions are primarily linked to teachers’ ability to manage instructional
practice at the school and to improve student achievement outcomes. School culture leadership

12
promotions appear to reflect a more specialized skill set for managing student-facing norms and
behavior, as well as relationships with students’ parents.
Anticipated Promotions. In a separate category, the charter district also conducted a one-time
internal census of school administrators’ perspectives in SY 2009-2010. The purpose of this census
was to identify the pipeline of teachers who were plausible candidates for promotion in future
school years. Specifically, school leaders identified teachers that they thought had the potential to be
effective school leaders (of any type) within the next 2 years, teachers that they thought might be
effective school leaders within the next 3 to 5 years, and candidate teachers for promotion to a new
“Expert Teacher” role. The Expert Teacher role had not yet been instituted by the district, but was a
hypothesized new role meant to recognize and reward teachers with strong instructional and
coaching skills who were nevertheless not ideal candidates for school leadership. This internal
census of administrators’ perspectives was non-binding, and was not discussed at teachers’ formative
evaluation meetings.
Teacher Descriptives. Table 1 details the frequency of each type of anticipated and actual personnel
decision in each school year. Internal teacher promotion rates varied substantially from year to year,
as a function of leadership turnover and external hiring, while teacher dismissal and resignation rates
were more consistent over time.
Alternative Teacher Performance Measures
In the spring of SY 2010-2011, the charter district piloted new parent and student surveys about
individual teachers in 5 schools to explore their potential as evaluation measures. Survey data was
managed by the district central office, and, the pilot results were treated as low stakes and
exploratory. After this pilot phase, the district expanded the use of parent and student survey
ratings of teachers to include all schools in SY 2011-2012. Parent surveys were administered for
teachers in grades K-12, while student surveys were administered in grades 3-12. For each

13
participating teacher, parent surveys were sent to a random sample of up to 32 families, with a
response rate of 80 percent. Student surveys were administered in-school to a random sample of up
to 24 students per teacher, with a response rate of 90 percent. Individual items from both student
and parent surveys are detailed in Appendix A. All items were rated on a five point Likert scale.
A few student survey questions were changed between the two years of survey administration.
However, in this study I consider only nine student survey questions that were asked in both SY
2010-2011 and SY 2011-2012. Charter district administrators selected the questions on the student
survey, and borrowed partially from existing instruments used in the Measures of Effective Teaching
(MET) project (Kane & Staiger, 2012) to do so. Of the 9 items, 3 are identical to survey questions
from the MET work, while 3 others are very similar. These 6 questions address multiple aspects of
students’ experience with their teachers, and are drawn from the areas labeled as “Challenge,”
“Care,” and “Clarify” in the MET research. That work has also identified these questions as effective
predictors of teachers’ value added effectiveness. Other questions from the district survey address
areas related to teachers’ expectations for students, their recognition of students’ good work, and
students’ overall view of their teacher.
Charter district administrators also selected the questions on the parent survey, which address a
range of parent perspectives about their child’s teacher. These include the quality of
communications between parents and the teacher, the teacher’s professionalism in interactions with
parents, the perceived treatment of the parents’ child by the teacher, and parents’ assessment of the
teacher’s positive impact on their child, both academically and socially.
3. Empirical Strategy
Evaluation Ratings and Teacher Differentiation

14
I address my first research question regarding differentiation in teacher ratings by examining the
distribution of teacher ratings according to an overall evaluation score. To generate this overall
score I standardize each of my individual indicators, and conduct a principal component factor
analysis4 across all of the individual indicators to identify a single heavily-loaded factor, which I then
standardize. The resulting single factor explains 36% of the total variance in individual indicator
ratings, and reflects a very high correlation (0.992) with a simple un-weighted mean score of the
indicator ratings. Using this measure, I also explore the distribution of school-wide averages of
teacher ratings, by year, to identify whether some schools’ teachers were rated higher or lower as a
group.5
It is plausible that school administrators primarily operate within their local frame of reference
when determining teacher rating and personnel decisions. If this were the case, an individual
teacher’s rating relative to other teachers at the same school and in the same school year might be
more informative and relevant to administrator personnel decisions than an absolute rating. To
account for this possibility, in preliminary analysis I examined school-and-year-centered teacher
ratings across each of my research questions. I also examined teacher ratings centered at the level of
individual evaluators-and-years, for all evaluators who rated at least 5 teachers. However, as I
describe in my results, centered teacher ratings in this charter district are very similar to un-centered
ratings, and as a result they yield nearly identical findings in all cases.
Single-Factor Predictions of Personnel Decisions
Next, I test a single-factor evaluation rating as a predictor of the likelihood of each of my four
enacted personnel decisions later in the same school year: dismissals, resignations, promotion to
Assistant Principal of School Culture roles and promotion to Academic Assistant Principal and
Principal roles. For each of these outcomes, I run two separate logistic regression models, one with
both the single evaluation factor and a vector of teacher demographic characteristics, and one with

15
just a vector of teacher demographic characteristics. My demographic variables of interest include an
indicator if a teacher’s gender is female, a teacher’s age in years in that school year, an indicator if a
teacher is black, and separate indicators for whether this is their first or second year of teaching in
the charter district. I also include indicators for the individual school years.
1 ln1
Here, the log likelihood of personnel decision is a function of a vector X of teacher i’s
characteristics in year t, that teacher’s rating δ in year t, and fixed effects for individual years, . I
report model results as odds ratios corresponding to my dependent variables of interest, and cluster
my errors at the level of the individual teacher.
Exploratory Factor Analysis
In order to examine whether a multiple-factor interpretation of the evaluation indicators better
represents the feedback that administrators provided teachers, I conduct an exploratory factor
analysis on teachers’ indicator scores to identify patterns in the individual ratings. Using the standard
approach of consulting a scree plot and retaining factors with eigenvalues greater than 1.0, four
constructs emerge from the data that explain 81% of the cumulative variance.6 I use a varimax
rotation to aid in the identification of patterns of loadings across factors. One consequence of this
rotation is that the rotated factors are uncorrelated with one another by construction, which affects
how I interpret the results.
*** INSERT TABLE 2 ***
Across the 47 indicators, I identify and label four distinct dimensions, based on the pattern of
high factor loadings detailed in Table 2. Each of these dimensions reflects a coherent interpretation,
and is fairly consistent with the charter district’s intended conceptual grouping of indicators in their
evaluation rubric. Not all of the district-defined evaluation dimensions were identified as separate

16
factors in the teacher ratings. However, indicators within each dimension were for the most part
highly loaded onto a single factor. I standardize each of these four factors across my sample.
Multiple-Factor Prediction of Personnel Decisions
I test the predictive power of all four evaluation factors across several model variations. As in
the single factor analysis, I predict the likelihood of each type of personnel decision in a separate
model. I also, separately, predict the contemporaneous likelihood of each of the three anticipated
personnel decisions – Expert Teacher, school leader within 1-2 years, and school leader within 3-5
years – using a sub-sample of teacher evaluation ratings from just SY 2009-2010. In each case, the
models include all four of the orthogonally rotated factors simultaneously as independent variables.
Half of my model runs include demographic controls, and the other half do not. The models also
include indicator variables for each of the individual school years in the sample, as in Equation 1
above. The modification to Equation 1 is that here a teacher’s rating δ in year t represents a vector
of rating factors rather than a single rating score. Also, when predicting anticipated personnel
decisions in SY 2009-2010 no year fixed effect is included.
Predicting Alternative Teacher Performance Measures
Predicting same-year measures. In order to provide some external corroboration of the information
administrators’ include in their teacher evaluations, I next examine the extent to which formative
evaluation ratings predict parent and student ratings of teachers in the same school year. In each
case, I use a linear regression model to predict each teacher’s SY 2010-2011 performance rating, first
with the single-factor and then with the multiple-factor subjective evaluation ratings that teachers
received. To improve model precision, I also consider model specifications that control for
teachers’ age and gender, characteristics that are associated with student and parent ratings.
To generate overall student or parent survey ratings of teachers, I calculate a respondent-level
average score for each survey item, and average student-or-parent item scores for each teacher. I

17
then standardize overall scores across all teachers that received a survey rating in the same school
year. As detailed in Appendix A, teacher ratings on the individual parent and student survey items
are highly correlated with these average survey scores. Finally, because parent ratings vary as a
function of teachers’ school, I generate and use within-school centered parent ratings in all of my
analyses. Eliminating school effects in this way allows me to more precisely relate parents’ relative
ratings of individual teachers to the subjective evaluations those teachers received.
Future-year measures. While associations between subjective evaluations and teacher performance
measures in the same-year assess their alignment given the same classroom context, associations
with future-year performance measures can better assess the extent to which subjective evaluations
capture teacher attributes that are stable over time and across different classroom contexts. I
examine the latter by using student and parent ratings from SY 2011-2012 as my dependent
variables, and predicting each with both single and multiple factor evaluation ratings from SY 2010-
2011. I assess this relationship both for the full sample of previously evaluated teachers who were
rated by students or parents in SY 2011-2012, and in a restricted sample that includes only those
teachers who also received parent or student ratings SY 2010-2011.
4. Results
Do Mid-Year Formative Evaluations Meaningfully Differentiate Between Teachers?
As shown in Figure 1, individual teachers’ evaluation ratings in this charter district reflect a fairly
normal distribution of high and low scores. Individual within-school rating distributions are
similarly distributed. In addition, as illustrated in Figure 2, individual school-and-year averages of
teacher ratings range from -0.83 to 0.86, with a standard deviation of 0.39. These results indicate that
administrators did not hold back from offering critical feedback to teachers or from evaluating their
school staff overall as either low or high performing. The evaluation patterns in this district contrast

18
with typical public school subjective evaluations in current practice, which tend to be
overwhelmingly positive (Weisberg et al., 2009). The specificity of the indicators employed and the
use of the evaluations for low stakes, formative mentoring may have encouraged frank appraisals.
*** INSERT FIGURE 1 ***
*** INSERT FIGURE 2 ***
In addition to providing clear differentiation between teachers, administrators in the charter
district appear to have implemented consistent rating practices and performance standards across
schools and raters. I find that school-and-year centered ratings are highly correlated (0.92) with un-
centered teacher ratings, as are ratings centered at the level of individual rater-and-year (0.87). The
consistency of teacher ratings measured within and across raters in this district contrasts with some
prior examples of subjective teacher evaluations in which within-rater variation provided distinct
information about teacher performance (Rockoff & Speroni, 2011). Overall, these results provide
some indication of the potential of sufficiently normed subjective evaluators to provide feedback to
teachers that is consistent across different school contexts.7
Do Overall Teacher Evaluation Ratings Predict Subsequent Dismissals and Promotions?
Administrators’ overall formative teacher evaluation ratings are significant and substantial
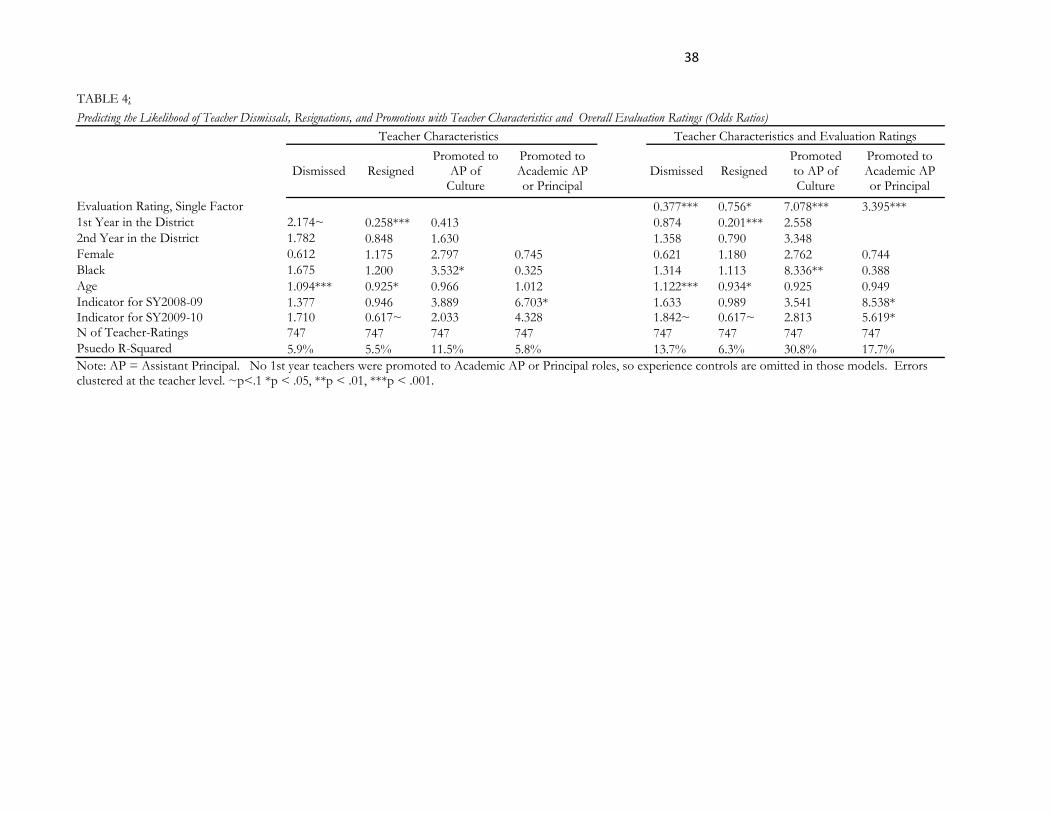
predictors of future personnel decisions. Table 3 provides a descriptive summary of personnel
decisions corresponding to evaluation rating quintiles, while Table 4 includes results from models
that formally test the relationship between ratings and enacted personnel decisions. I find that a one
standard deviation increase in a teacher’s mid-year rating – using an overall evaluation measure – is
associated with a 62% reduction in the likelihood of being dismissed, and a 24% reduction in the
likelihood of resigning voluntarily. The same standard deviation increase in overall ratings predicts a
seven-fold increase in the likelihood of promotion to a school culture leadership role, and a more
than three-fold increase in the likelihood of promotion to a school academic leadership role. Results
19
for both dismissals and promotions are highly significant, and explain a substantial portion of the
log likelihood of personnel outcomes. Descriptively, rates of dismissal appear particularly low for
teachers rated in the top 4th or 5th evaluation quintiles, while promotions (although limited in
number) occur almost exclusively among teachers in those top-performing quintiles.
*** INSERT TABLE 3 ***
*** INSERT TABLE 4 ***
Some demographic variables are also associated with particular personnel decisions. In
particular, teachers are substantially less likely to resign after their first year in the charter district,
perhaps opting to give the job more time. First-year teachers are somewhat more likely to be
dismissed, but only in a specification that does not control for evaluation ratings. Older teachers are
less likely to resign and are more likely to be dismissed. Finally, black teachers are more likely to be
promoted to school culture leadership roles. Racial homophily with the majority of students at the
school may be perceived to be a positive trait for that role’s student and parent-facing
responsibilities, or race may simply be correlated with other unobserved teacher skills or affinities
that administrators believe to be important to the role.
Are There Distinct Factors Within Evaluative Ratings that Reflect Different Aspects of Teacher Performance?
As previously described, I identify four coherent and distinct factors that reflect additional
differentiation in the evaluative ratings provided by administrators. Table 2 summarizes the factor
loadings of individual indicators onto the four factors. Based on the pattern of loadings, I label and
briefly interpret each factor here, in sequence.
“Student Engagement and Behavior” primarily reflects a teacher’s observed classroom
interactions with students. High behavioral and character expectations for students and success in
actively engaging students in learning are central. This factor also reflects how well the teacher
reinforces shared school-wide cultural and behavioral norms.

20
“Instructional Specifics” reflects a teacher’s skill at instructional execution as observed in
classroom practice. It emphasizes specific common charter district practices related to instruction,
including a high quantity of scaffolded practice by students. It also reflects a teacher’s knowledge of
curriculum, as reflected in both classroom practice and long term instructional planning.
“Personal Organization and Planning” appears to capture a teacher’s basic organizational and
planning skills. Some of the traits it includes may be observed in classroom practice, but most would
be observed in other interactions with the teacher. The ability to create daily and long term
instructional plans, as well as systematic tracking and use of student achievement data are
emphasized. Interpersonal interactions with other staff and teachers’ attention to continuous
improvement of their practice are also relevant.
“Parent and Student Relationships” corresponds to a teacher’s management of relationships with
students’ parents, including their engagement on the topics of students’ goals and progress. This
factor also reflects a teacher’s development of relationships with students outside of the classroom.
Indicators in this factor would for the most part be observed outside of teachers’ classroom practice.
Are Different Types of Personnel Decisions Predicted by Different Factors from the Evaluative Ratings?
Collectively, the four distinct factor ratings of a teacher explain substantially more variation in
subsequent personnel decisions about that teacher than a single principal component factor.
Moreover, the factors that administrators weigh in their decisions vary in accordance with the
particular personnel decision in question. Table 5 provides results from models using all four
orthogonally-rotated evaluation factors to predict personnel decisions.
*** INSERT TABLE 5 ***
A teacher’s rating in the category of Student Engagement and Behavior appears to be a major
consideration in dismissal decisions, as well as in either type of school leadership promotion. A
teacher who scores one standard deviation higher in this factor is less than half as likely to be

21
dismissed, and two and half times as likely to be promoted to academic school leadership roles. In
addition, the teacher is more than eight times as likely to be promoted to a school culture leadership
role. Administrators’ judgments about a teacher’s skills at engaging with students in their classroom
and reinforcing the school-wide culture appear to be important across a variety of personnel
decisions. These results also suggest that observations of student and teacher interactions are a key
source of information for administrators evaluating teacher performance.
A high rating in Personal Organization and Planning is another major factor associated with a
reduced likelihood of teacher dismissal. A one standard deviation increase in Personal Organization
and Planning corresponds to a 46% reduction in the likelihood of dismissal. In addition, this factor
predicts a smaller, but significant reduced likelihood of a teacher’s voluntary resignation. Personal
Organization and Planning also predicts decisions to promote teachers to academic leadership roles,
but to a lesser degree than the factor for Student Engagement and Behavior. Administrators appear
to value foundational planning and organizational skills highly in their determination of whether to
dismiss a teacher. They may also consider a baseline level of skill in this area relevant to academic
leadership roles, as evidenced by a very low rate (0.35%) of teacher promotion for individuals in the
lowest two quintiles of ratings in this factor.
The factor reflecting Parent and Student Relationships strongly predicts promotion to school
culture leadership roles, but is not a significant consideration in other personnel decisions. A one
standard deviation increase in this factor rating corresponds to a nearly six-fold increase in the
likelihood of promotion to school culture leadership. It appears that administrators consider this
factor important for some teachers in specific school leadership roles, but value it less when
considering teacher dismissals or promotions to academic leadership.

22
Instructional Specifics is not as predictive of personnel decisions as the other three factors,
although it is a significant predictor of the likelihood of promotion to either school culture or
academic leadership roles, with odds ratios of 1.939 and 1.553, respectively.
Are Different Types of Anticipated Personnel Decisions Associated with Different Evaluation Factors?
Models predicting administrators’ internal assessment of teachers’ potential for future promotion
are detailed in Table 6. In general, anticipated teacher promotions to school leadership roles
correspond with slightly reduced effect sizes relative to actual promotions, and reflect a broad range
of skills. In particular, anticipated candidates for long term promotion (within 3-5 years) rate high
across all rating categories, perhaps due to administrators’ uncertainty about long term staffing needs
or teachers’ future potential. Interestingly, effect sizes associated with Personal Organization and
Planning are about as large for teachers identified as potential school leaders in either 1-2 or 3-5
years as they are for those who are actually promoted. This foundational skill set may be considered
an important indicator of future potential.
*** INSERT TABLE 6 ***
Administrators’ identification of potential “Expert Teachers” corresponds to high teacher
ratings in Student Engagement and Behavior and in Instructional Specifics. They are twice as likely
to identify a teacher as a potential Expert Teacher if that teacher scored one standard deviation
higher in Instructional Specifics. A one standard deviation increase in Student Achievement and
Behavior predicts nearly triple (2.815) the likelihood of Expert Teacher identification. Both of these
factors appear relevant to administrators’ evaluation of classroom teaching skills. It is notable that
Instructional Specifics is a significant predictor of Expert Teacher identification, but not of reduced
likelihood of dismissals, which suggests that this factor may reflect advanced skills that are not a
central focus of formative feedback provided to struggling teachers.
Do Formative Evaluation Ratings Predict Alternative Teacher Performance Measures?

23
Administrator ratings of teachers are a significant predictor of future parent and student ratings
of teachers, both later in the same school year and in a subsequent school year. Same-year results are
detailed in Table 7, and future-year results in Table 8. Same-year evaluations predict substantial
variation in parent and student ratings in the same year, with adjusted R-squared of 28.2% and
19.5%, respectively, in models that include all four evaluation factors and no additional controls.
Not surprisingly, the factor for Parent and Student Relationships is the strongest predictor of parent
ratings, and is also a significant predictor of student ratings. A one standard deviation increase in this
factor corresponds to a 0.362 standard deviation higher parent rating of a teacher, and a 0.276 higher
student rating of a teacher in models that include teacher demographic controls. The factor for
Student Engagement and Behavior, which reflects teacher and student classroom interactions, is the
strongest predictor of student ratings of a teacher in the same year, with a coefficient of 0.407. The
factor for Personal Organization and Planning also significantly predicts parent ratings of teachers.
These results suggest that administrators refer to some of the same information as parents and
students when evaluating teachers, including their observable interactions with parents and students,
and – for parents –impressions regarding the teacher’s organizational skills or professionalism.
*** INSERT TABLE 7 ***
Teacher evaluation ratings predict future-year parent and student ratings to a significant, but
lesser degree, with adjusted R-squared of 6.8% and 7.0%, respectively, in models that include all four
evaluation factors and no additional controls. This indicates that administrator evaluations may not
only rely on some of the same information as parents and students to assess teacher performance,
but also identify teacher abilities that are stable across classrooms and school years. However, the
specific evaluation factors most strongly associated with parent and student ratings differ somewhat
from those that predict same-year ratings, both in the full sample and in a restricted sample
consisting only of teachers rated in both school years. Future-year parent ratings are most strongly

24
associated with the factors for Parent and Student Relationships and Student Engagement and
Behavior, while future-year student ratings are most strongly associated with Instructional Specifics
and Parent and Student Relationships. It may be that the differences in relative factor effect sizes
reflect differences in the information that different evaluation factors provide regarding stable –
versus contemporaneous – teacher performance.
*** INSERT TABLE 8 ***
5. Conclusions and Discussion
This study offers new insights into the diversity of teacher contributions that administrators may
value in their management of school staff. Prior studies have explored principals’ management
priorities by relating their subjective evaluations or their personnel decisions to generic teacher
characteristics and behaviors, such as demographic characteristics, attendance, or their value added
to student achievement (Jacob & Walsh, 2011; Harris and Sass, 2009; Jacob, 2010; Chingos & West,
2010). In contrast, I consider unusually rich and specific data about administrators’ views of
teachers’ performance, and link this to a range of explicit school staffing decisions. I find that
administrators distinguish between various aspects of teaching when providing feedback to teachers,
and that their formative evaluations predict their future personnel decisions. Moreover,
administrators appear to weigh different, distinct evaluative criteria when staffing different teacher
roles at their schools. The results suggest the importance of accounting for multiple aspects of
teacher performance in evaluation systems that are meant to inform multiple types of personnel
decisions in schools. Attention to multiple measures of performance may be particularly relevant in
contexts where teachers’ roles are more differentiated and reflect a mix of leadership, mentoring,
family relations, and instructional responsibilities.
25
Some notable patterns in the results highlight the complexity and diversity of teacher
contributions that administrators may value, with potential implications for the design of teacher
evaluation systems. First, I observe that some teaching practices are valued across multiple personnel
decisions, while others are prioritized in relation to specific teacher roles. For example, teachers’
abilities in the area of managing “Student Engagement and Behavior” are weighed heavily in every
kind of personnel decision in this charter district. The emphasis placed on this factor may partially
reflect the high visibility of students’ classroom behavior, and aligns with research showing that
educators believe classroom management skills to be foundational to teaching (Stoughton, 2007). In
addition, this factor corresponds to the district’s stated emphasis on setting high behavioral and
academic expectations for students, and this may explain why it appears to be non-negotiable for all
school staff. In contrast, teacher contributions to “Parent and Student Relationships” are clearly
valued, but primarily for specific role-players in schools. This particular division of labor is not
uncommon. Many assistant principals allocate substantial time to managing student behavior and
relations with families (Hausman, Nebeker, McCreary, & Donaldson, 2001). Overall, the pattern of
administrators’ attention to both universal and role-specific teacher skills suggests that they weigh
contributions to both individual and organizational effectiveness in their personnel management
decisions. Evaluation systems that focus only on individual effectiveness might overlook
interdependencies among school staff that administrators believe to be important.
Second, some of the criteria valued by administrators in this charter district could be observed in
teachers’ daily instructional practice, while others reflect the quality of teachers’ planning, their
interactions with peers, or their interactions with students and families that are likely to be observed
outside of the classroom. In particular, various skills outside of instructional execution are reflected
in the factor for “Personal Organization and Planning,” which was valued highly in dismissal
decisions and in teacher promotions to academic leadership. Attention to teacher practices other

26
than instructional execution is common in emerging teacher evaluation systems, and is also
emphasized in professional frameworks such as the Framework for Effective Teaching (Danielson,
2007). The priorities of these administrators provide further indication that evaluation systems may
be more accurate if at least some of the multiple measures used to evaluate teachers address their
contributions and competencies outside of instructional execution.
A final notable pattern in the school administrators’ enacted priorities is their apparent
distinction between skills that are foundational to teacher practice (i.e. those inversely associated
with dismissals) versus those that are weighed primarily in “expert” or school leader promotions. In
particular, a teacher’s lack of expertise in various “Instructional Specifics” articulated in the charter
district’s rubric does not predict a greater likelihood of dismissal. These skills may not be viewed as
essential for teachers who are on the low end of the performance distribution. However, teachers
are less likely to be promoted if they rate poorly these skills, perhaps because individuals in more
senior roles would be expected to be exemplars of the district’s core instructional model. Overall,
this pattern suggests that appraisal standards may vary usefully in evaluation systems, as a function
of either teachers’ degree of expertise or the particular personnel decision in question.
The subjective evaluation ratings considered in this study not only differentiate between
individual teachers and predict administrator personnel decisions, but also predict alternative teacher
performance measures, including student and parent ratings of teachers in the same and subsequent
school years. This indicates that the formative feedback that these administrators provide to staff
relates to actual teacher skills and behaviors, and not just to administrators’ perceptions. Moreover,
this finding suggests that administrators observe and value some of the same teacher contributions
as parents and students – both key constituents for schools. While informative, these results provide
only partial evidence of the utility of these administrators’ personnel management priorities.
Additional research is needed that can clarify the extent to which administrators’ attention to

27
particular teacher contributions relate to a range of valued school outcomes, including teacher and
school effects on student achievement, student retention, and students’ social and emotional
development.
As a high-performing urban charter school network, this district is in many ways not
representative of typical public school practice, and this provides both some of the contributions
and limitations of this study. One critical difference between this charter district and other public
schools is in the area of administrator autonomy in personnel management. Previous studies of
administrator evaluation and personnel management practices reflect contexts characterized by more
limited administrator autonomy (Weisberg et al., 2009; Rockoff et al., 2012; Jacob, 2010). Research
in contexts with less principal autonomy may better reflect the current state of school management,
as well as the near term implications of specific reforms to personnel management policies. In
contrast, this study provides a useful look into the potential “future-state” practices of schools with
an established culture of administrator autonomy over personnel management decisions. The results
that I observe in this district should not be interpreted as representative of current or near-term
management patterns in typical public schools. Instead, this study provides valuable new
information regarding the potential behavior and priorities of more practiced, engaged, and
uninhibited administrator evaluators. In addition to highlighting their personnel management
priorities, this study also demonstrates the potential for sufficiently normed administrators to
articulate highly differentiated teacher ratings according to consistent rating criteria.
In addition to differences related to administrator autonomy, this charter district is also distinct
from many public school districts in its organizational practices and accountability context. As a
consequence, the specific administrator priorities that I identify may or may not be the same as
administrator priorities in other districts. In particular, this district recruits few full-time teachers
who are new to teaching, a potentially important distinction since untenured “rookie” teachers are

28
likely to be a central focus in evaluation system reforms in many public schools. Principals who are
managing more novice staff may focus on additional teacher behaviors not emphasized in this study,
particularly with regard to their dismissal decisions. In addition, these schools’ charters hold them
accountable both for near-term student achievement gains as well as for robust student enrollment
and retention, priorities that may differ from those emphasized in some other school districts, and
this may have influenced administrators’ practices. Relations with parents may also be particularly
important in a charter context where parental choice is a factor. Finally, in addition to these specific
concerns, the particular teacher roles and professional standards observed in different organizations
are likely to vary as a function of local school and community characteristics.
Nevertheless, this study provides some key insights about teacher evaluation that are relevant
across a broad range of contexts. The complexity involved in assessing teacher contributions in this
charter district is likely to be common in many school settings, particularly with regard to teacher
promotions and role distinctions. For example, even schools with little formal differentiation in
teacher roles may distribute important responsibilities across informal teacher roles, such as subject
and grade level chairs or co-teacher mentors. Similarly, diverse teacher contributions, such as
supporting school-wide effectiveness or peer learning, are likely to be important in many public
schools (Jackson & Bruegmann, 2009; Ronfeldt, Lankford, Loeb, & Wyckoff, 2013). Evaluation
systems that account for the potential complexity and diversity of teachers’ contributions by
including more holistic and flexible measures of their performance may be more responsive and
ultimately more effective at improving student outcomes. Local administrators are likely to play key
roles in this regard, and their perspectives may be critical to the evolution and improvement of
emerging teacher evaluation systems.
Although it is unique, this charter district’s example usefully demonstrates the practices of a
group of highly autonomous local administrators in high performing schools. They were afforded a
29
substantial degree of discretion in their personnel management decisions. To support their work,
they leveraged a standards-based evaluation instrument that is similar to other emerging teacher
evaluation measures. In these respects, their experience provides an important test case for other
public school districts as they embark on evaluation system reforms. Such reforms will likely result
in greater discretion and responsibility for the local school administrators who manage their
implementation. This district’s example suggests some of the tradeoffs that those administrators may
face, and how they may respond to them in practice.
30
Notes
1 Charter district schools have been shown to be demonstrably highly effective at raising student
achievement, in comparison to lottery-randomized comparison students attending nearby schools.
2 Interested parties may contact me directly regarding additional contextual information that is
pertinent to the study.
3According to charter district leaders, most teachers who lack evaluation data did participate in a
mid-year review meeting of some kind. However, their formal evaluation forms were either not
completed or were not successfully saved and shared with the central office. Teachers with missing
evaluation data are not significantly different from other teachers according to observable
characteristics. Nevertheless, the study sample may be biased towards administrators who were more
motivated to consistently use the evaluation rubric to frame their feedback.
4 Because the evaluation data is ordinal, I use a polychoric correlation matrix in all factor analyses.
5 In preliminary analysis, I also examined whether the classroom average characteristics of teachers’
students, including their race, gender, free lunch status, English language proficiency, special
education status, or prior test scores predict significant differences in teacher evaluation ratings.
They do not.
6 Eigenvalues of these four factors were 17.668, 2.218, 1.511, and 1.036. The next highest was 0.938
and an investigation of the scree plot and its factor loadings did not support its inclusion as a
coherent, distinct factor.
7 Teachers’ individual ratings are also fairly consistent over time, with an average within-teacher
rating correlation of 0.682 between one year and the next. Year-to-year within-teacher correlations
for each of the four distinct rating factors ranged from 0.438 to 0.533 and are not significantly
different from each other.

31
Figure Captions
FIGURE 1. Distribution of the Average of Teachers’ Standardized Indicator Ratings FIGURE 2. Distribution of the School‐by‐Year Means of Standardized Teacher Evaluation Ratings

32
References
Angrist, J., Pathak, P., and Walters, C. (2011). Explaining Charter School Effectiveness (No. w17332).
National Bureau of Economic Research.
Ballou, D. (2000). Teacher Contracts in Massachusetts. Boston, MA: Pioneer Institute for Public Policy.
Balu, R., Beteille, T., and Loeb, S. (2010). Examining teacher turnover: The role of school
leadership. Politique Americaine (3), 55-79.
Boyd, D., Lankford, H., Loeb, S., and Wyckoff, J (2011). Teacher layoffs: An empirical illustration of
seniority v. measures of effectiveness. Education, 6 (3), 439-454.
Chingos, M., & West, M. R. (2011). Promotion and reassignment in public school districts: How do
schools respond to differences in teacher effectiveness? Economics of Education Review, 30(3), 419–
433.
Danielson, C. (2007). Enhancing professional practice: A framework for teaching. Alexandria, VA:
Association for Supervision and Curriculum Development.
Dobbie, W., and Fryer, R. (2011b). Getting Beneath the Veil of Effective Schools: Evidence from New York
City (No. w17632). National Bureau of Economic Research.
Fryer, R. (2011). Creating “No Excuses” (Traditional) Public Schools: Preliminary Evidence from an Experiment
in Houston (No. w17494). National Bureau of Economic Research.
Gallagher, H. A. (2004) Vaughn Elementary's innovative teacher evaluation system: are teacher
evaluation scores related to growth in student achievement? Peabody Journal of Education 79 (4),
79–107.
Hamre, B. K., & Pianta, R. C. (2005). Can instructional and emotional support in the first grade
classroom make a difference for children at risk of school failure? Child Development, 76, 949–967.
Harris, D. N., & Sass, T. R. (2009). What makes for a good teacher and who can tell? CALDER
Working Paper. Washington, DC: National Center for Analysis of Longitudinal Data in

33
Education Research. Available at http://www.caldercenter.org/upload/CALDER-Working-
Paper-30_FINAL.pdf
Hausman C., Nebeker A., McCreary J. and Donaldson G. (2002). The work life of the assistant
principal. Journal of Educational Administration, 40(2): 136-157.
Heneman, H.G. III., Milanowski, A., Kimball, S. M., & Odden, A. (2006). Standards-based teacher
evaluation as a foundation for knowledge- and skill-based pay. CPRE Policy Brief, RB-45. Philadelphia:
University of Pennsylvania, Consortium for Policy Research in Education.
Hess, F. M., and Loup, C. (2008). The leadership limbo: Teacher labor agreements in America’s fifty
largest school districts. Thomas B. Fordham Institute.
Holtzapple, E. (2003) Criterion-related validity evidence for a standards-based teacher evaluation
system. Journal of Personnel Evaluation in Education, 17(3): 207- 219.
Jackson, C. K, and Bruegmann, E. (2009). Teaching students and teaching each other: The
importance of peer learning for teachers. American Economic Journal: Applied Economics 1:85-108.
Jacob, B. A. (2010). Do principals fire the worst teachers? (No. w15715). National Bureau of Economic
Research.
Jacob, B. and Lefgren, L. (2008). Can principals identify effective teachers? Evidence on subjective
performance evaluation in education. Journal of Labor Economics. 26(1), 101-36.
Jacob, B. A. and Walsh, E. (2011) What’s in a rating? Economics of Education Review, 30, 434-448.
Kane, T. J., & Staiger, D. O. (2012). Gathering feedback for teaching: Combining high-quality
observations with student surveys and achievement gains. MET Project. Bill & Melinda Gates
Foundation.
Kane, T. J.,Taylor E. S., Tyler J. H., and Wooten, A. L. (2011). Identifying effective classroom
practices using student achievement data, Journal of Human Resources, 587-613.

34
Milanowski, A. T. (2004). The relationship between teacher performance evaluation scores and
student achievement: Evidence from Cincinnati. Peabody Journal of Education, 79(4), 33–53.
Price, M. (2009). Teacher union contracts and high school reform. Center on Reinventing Public
Education, University of Washington.
Rockoff, J. E. and Speroni, C. (2011). Subjective and objective evaluations of teacher effectiveness:
evidence from New York City. Labour Economics 18: 687.696
Rockoff, J. E., Staiger D. O., Kane, T. K., and Taylor, E. S. (2012). Information and employee
evaluation: evidence from a randomized intervention in public schools. American Economic
Review, 102(7): 3184-3213.
Ronfeldt, M., Lankford, H., Loeb, S., Wyckoff, J. (2013). How teacher turnover harms student
achievement. American Educational Research Journal, 50(1), 4-36.
Stoughton, E. H. 2007. “How will I get them to behave?”: preservice teachers reflect on classroom
management. Teaching and Teacher Education, 23 (7) (2007), pp. 1024-137.
Taylor, E.S., & Tyler, J.H. (2011). The effect of evaluation on performance: Evidence from longitudinal student
achievement data of mid-career teachers (No. w16877). National Bureau of Economic Research.
Weisberg, D., Sexton, S., Mulhern, J., and Keeling, D. (2009). The widget effect. Education Digest,
75(2), 31–35.

35
TABLE 1 Descriptive Statistics for Charter District Teachers, Personnel Decisions, and Students, by School Year
SY 2008-2009 SY 2009-2010 SY 2010-2011 All Years
# of Teacher Evaluations 178 263 306 747 Average Within-School Evaluation Rate 64% 78% 83% 77%
Personnel Decisions % Promoted to Academic School Leadership 3.9 2.7 0.7 2.1 % Promoted to School Culture Leadership 2.8 1.5 0.7 1.5 % Resigned 11.2 9.1 12.7 11.1 % Dismissed 7.9 8.7 5.6 7.2 % with Expert Teacher potential 14.4 % with Leadership potential, next 1-2 years 4.6% with Leadership potential, next 3-5 years 8.4
Teacher Demographic Characteristics % Female 77.5 74.5 71.2 73.9 % White 65.2 64.3 66.3 65.3 % Black 18.5 16.3 13.1 15.5 % Hispanic 8.4 8.4 10.1 9.1 % Asian 3.4 4.9 4.9 4.6 % Other/ Unknown 4.5 6.1 5.6 5.5
Student Demographic Characteristics % Female 50.6 50.8 50.4 50.6 % Black 81.9 79.8 78.7 79.9 % Hispanic 17.1 19.1 20.2 19.0 % Other races 1.0 1.1 1.1 1.1 % Receiving Free or Reduced Price Lunch 71.4 75.3 76.7 74.8 % Special Education Students 7.6 8.7 9.0 8.5 % English Language Learners n/a 5.9 5.4 5.6
Note: Student-level English language learner status data unavailable for SY 2008-09.

36
TABLE 2 Conceptual Structure and Factor Loadings of Mid-Year Formative Teacher Evaluation Indicators
Evaluation Dimension
Evaluation Indicator
Factors Student
Engagement and Behavior
Instructional Specifics
Personal Organization and Planning
Parent & Student
Relationships Achievement Achievement relative to goals
Character
Students respectful 0.77
Students enthusiastic 0.77
Students do their best 0.52
Students’ citizenship 0.62
Students present/prepared 0.54
Instruction
Clear goals for each lesson 0.53
Daily assessment 0.45
Accurate content 0.56
Well-planned lesson 0.64
Clear lesson sequence
Guided practice 0.61
Checks for understanding 0.57
Independent practice 0.49
Support during ind. practice
Student work time 0.57
Quality responses 0.41
Quality questions 0.43
Differentiation 0.41
Classroom Culture
All Students on-task 0.67
Engagement strategies 0.62
Classroom routines 0.75
High behavioral standards 0.72
Positive classroom environment 0.62
Positive student interactions 0.54
Character building 0.53
Tie character to lessons 0.44
Neat / orderly classroom
Support school culture system 0.44
Proper use of incentives 0.49
Systems and Planning
Goal-setting 0.48
Investing students in goals
Knowledge of curriculum 0.50
Year-long instructional plan 0.44 0.49
Unit plans 0.44 0.48
Lesson plans 0.53
Weekly/informal data use 0.48
Organized data tracking 0.44
Periodic/formal data use 0.52
Student and Family
Relationships
Cares about students 0.41 0.40
Relationships outside of class 0.50
Relationships with families 0.73
Sharing goals with parents 0.53
Communication with parents 0.66
Personal Effectiveness
Constantly learning 0.41
Organized 0.52
Attendance Communication with peers 0.41
Note: Indicators that are not highly loaded (>0.40) on any single factor are left blank

37
TABLE 3:
Distribution of the likelihood of enacted and anticipated personnel decisions corresponding to overall evaluation rating quintiles
Mid-Year Rating Quintiles
Dismissal Resignation Promotion to Academic AP or Principal
Promotion to AP of Culture
Potential School Leader (1-2yrs)
Potential School Leader (3-5yrs)
Potential “Expert Teacher”
1 (low) 13.3% 9.3% 0.7% 0.0% 0.0% 0.0% 1.9%2 8.7% 12.1% 0.7% 0.0% 2.1% 4.2% 2.1%3 9.3% 15.3% 0.0% 0.0% 0.0% 4.9% 7.3%4 2.0% 11.4% 3.4% 2.0% 8.2% 16.4% 19.7%5 (high) 2.7% 7.4% 6.0% 5.4% 12.0% 16.0% 42.0%N of decisions 54 83 16 11 12 22 38N of staff 747 253
Note: AP = Assistant Principal. Enacted personnel decisions from SY 2008-09 to SY 2010-11. Anticipated decisions from SY 2009-10 only.
38
TABLE 4:
Predicting the Likelihood of Teacher Dismissals, Resignations, and Promotions with Teacher Characteristics and Overall Evaluation Ratings (Odds Ratios) Teacher Characteristics Teacher Characteristics and Evaluation Ratings
Dismissed Resigned
Promoted to AP of
Culture
Promoted to Academic AP or Principal
Dismissed Resigned Promoted to AP of Culture
Promoted to Academic AP or Principal
Evaluation Rating, Single Factor 0.377*** 0.756* 7.078*** 3.395*** 1st Year in the District 2.174~ 0.258*** 0.413 0.874 0.201*** 2.558 2nd Year in the District 1.782 0.848 1.630 1.358 0.790 3.348 Female 0.612 1.175 2.797 0.745 0.621 1.180 2.762 0.744 Black 1.675 1.200 3.532* 0.325 1.314 1.113 8.336** 0.388 Age 1.094*** 0.925* 0.966 1.012 1.122*** 0.934* 0.925 0.949 Indicator for SY2008-09 1.377 0.946 3.889 6.703* 1.633 0.989 3.541 8.538* Indicator for SY2009-10 1.710 0.617~ 2.033 4.328 1.842~ 0.617~ 2.813 5.619*N of Teacher-Ratings 747 747 747 747 747 747 747 747 Psuedo R-Squared 5.9% 5.5% 11.5% 5.8% 13.7% 6.3% 30.8% 17.7% Note: AP = Assistant Principal. No 1st year teachers were promoted to Academic AP or Principal roles, so experience controls are omitted in those models. Errors clustered at the teacher level. ~p<.1 *p < .05, **p < .01, ***p < .001.

39
TABLE 5
Predicting the Likelihood of Teacher Dismissals, Resignations, and Promotions with Multiple Evaluation Factors (Odds Ratios)
Dismissed Resigned Promoted To AP of Culture Promoted to Academic
AP or Principal
Demographic Controls Y Y Y Y
Student Engagement and Behavior 0.443*** 0.373*** 0.931 0.788~ 3.518*** 8.386*** 2.628*** 2.664***
Instructional Specifics 1.171 0.935 1.019 0.992 1.354 1.939* 1.482* 1.553*
Personal Organization and Planning 0.533*** 0.541*** 0.809~ 0.764* 0.943 1.204 1.916* 1.834*
Parent and Student Relationships 1.013 0.954 1.151 1.044 3.857** 5.852*** 0.970 0.994
N of Teacher-Ratings 747 747 747 747 747 747 747 747
Psuedo R-Squared 11.7% 17.6% 1.3% 7.1% 32.3% 45.7% 19.1% 20.0%
Note: AP = Assistant Principal. Demographic controls include years of experience in the charter district, age, race, and gender. Errors clustered at the teacher level. All models include controls for individual school year fixed effects. ~p<.1 *p < .05, **p < .01, ***p < .001.

40
TABLE 6
Predicting the Likelihood of Teacher Identification for Future Promotions with Multiple Evaluation Factors (Odds Ratios)
"Master Teacher" Potential School Leadership Potential within
1-2 Years School Leadership Potential within
3-5 years
Demographic Controls Y Y Y
Student Engagement and Behavior 2.641*** 2.492*** 2.358*** 2.073* 1.429 1.721*
Instructional Specifics 2.050*** 1.943*** 1.360 1.198 1.332 1.453~
Personal Organization and Planning 1.393 1.352 1.998* 1.978* 1.780* 1.830*
Parent and Student Relationships 1.394 1.329 1.017 0.893 1.516~ 1.789*
N of Teacher-Ratings 253 253 253 253 253 253
Psuedo R-Squared 20.0% 20.8% 14.1% 17.4% 8.8% 12.8%
Note: Demographic controls include years of experience in the charter district, age, race, and gender. Errors clustered at the teacher level. ~p<.1 *p < .05, **p < .01, ***p < .001.

41
TABLE 7:
Predicting Student and Parent Ratings of Teachers with Evaluations from the Same School YearParent Ratings Student Ratings
Single Factor Multiple Factors
Additional Controls Single Factor
Multiple Factors
Additional Controls
Evaluation Rating, Single Factor
0.309*** 0.358***
(0.088) (0.085)
Student Engagement and Behavior
0.122 0.111 0.361** 0.407***
(0.093) (0.096) (0.108) (0.101)
Instructional Specifics -0.129 -0.167~ 0.028 0.146
(0.082) (0.089) (0.095) (0.092)
Personal Organization and Planning
0.265** 0.275** -0.031 -0.062
(0.092) (0.093) (0.092) (0.085)
Parent and Student Relationships
0.364*** 0.362*** 0.276** 0.353***
(0.082) (0.083) (0.091) (0.087)
Teacher Demographics Y Y
N of Teachers 93 93 93 98 98 98
Adjusted R-Squared 10.9% 28.2% 27.6% 14.8% 19.5% 31.1%
Note: Performance measures and ratings from SY 2010-11. Parent ratings are centered within-school to account for school-wide effects. Teacher demographic controls include age and gender. ~p<.1 *p < .05, **p < .01, ***p < .001.

42
TABLE 8: Predicting Student and Parent Ratings of Teachers with Evaluations from the Prior School Year
Parent Ratings Student Ratings
Single Factor
Multiple Factors
Additional Controls
Matched Sample
Single Factor
Multiple Factors
Additional Controls
Matched Sample
Evaluation Rating, Single Factor
0.234*** 0.262***
(0.076) (0.077)
Student Engagement and Behavior
0.204* 0.235** 0.188 0.093 0.157~ 0.138
(0.080) (0.082) (0.176) (0.091) (0.090) (0.138)
Instructional Specifics 0.016 0.032 0.038 0.223** 0.276*** 0.320*
(0.079) (0.080) (0.161) (0.081) (0.079) (0.122)
Personal Organization and Planning
-0.027 -0.016 0.095 -0.015 -0.046 -0.031
(0.076) (0.077) (0.176) (0.079) (0.078) (0.115)
Parent and Student Relationships
0.225** 0.257*** 0.343* 0.159~ 0.219** 0.366**
(0.073) (0.074) (0.143) (0.084) (0.083) (0.114)
Teacher Demographics Y Y
Y Y
N of Teachers 196 196 196 67 150 150 150 81
Adjusted R-Squared 4.2% 6.8% 7.5% 4.8% 6.6% 7.0% 14.1% 18.6% Note: Performance measures from SY 2011-12, evaluation ratings from SY 2010-11. Parent ratings are centered within-school to account for school-wide effects. Teacher demographic controls include age and gender. Matched sample includes only teachers who received parent or student ratings in both SY 2010-11 and SY 2011-12. ~p<.1 *p < .05, **p < .01, ***p < .001.

43
Appendix A – Survey Instruments TABLE A1 Student Survey Instrument Questions and Correlations Between Teacher-level Overall and Individual Item Scores
Correlation with Average Survey Rating
1. This teacher makes me feel that he/she really cares about me. 0.884
2. This teacher encourages me to do my best. 0.947
3. In this teacher’s class we learn a lot almost every day. 0.885
4. How often does this teacher recognize your good work? 0.894
5. When you don’t understand something, does this teacher work with you until you do understand it?
0.900
6. How clearly does this teacher explain things? 0.817
7. How well respected do you feel in this class? 0.904
8. This teacher believes that each and every student in my class will succeed. 0.886
9. I look forward to coming to this teacher’s class. 0.916 Note: Survey questions listed are those included in both SY 2010-2011 and SY 2011-2012 versions of the student surveys. Correlations between overall average and item survey ratings are shown for the SY 2011-2012 sample.

44
TABLE A2 Parent Survey Instrument Questions and Correlations Between Teacher-level Overall and Individual Item Scores
Correlation with Average Survey
Rating 1. How comfortable do you feel talking with this teacher about your child? 0.942
2. How well informed are you about the progress your child is making in this teacher's class? 0.954
3. How clearly has this teacher communicated the learning goals he/she has for your child in this class?
0.949
4. How professional is this teacher in your interactions with him or her? 0.935
5. How often does this teacher return your phone calls or emails within 24 hours (not including weekends)?
0.910
6. How respectful is this teacher towards your child? 0.913
7. This teacher notifies me of the positive work my child has done in his/her class. 0.958
8. How helpful has this teacher been in improving your child's academic performance? 0.959
9. This teacher has a positive impact on my child's character. 0.943
10. This teacher motivates my child to work hard and to do his/her best work for this class. 0.919
11. Overall, how would you grade this teacher (A+, A, B, C, D)? 0.953 Note: Correlations between overall average and item survey ratings are shown for the SY 2011-2012 sample.