Embed Size (px)
Citation preview

Productivity CommissionStaff Working PaperForms of Work in Australia
Anthony ShomosErin TurnerLou Will
The views expressed in
this paper are those of the
staff involved and do not
necessarily reflect the views of the
Productivity Commission.
April 2013

Commonwealth of Australia 2013
ISBN 978-1-74037-431-6
This work is copyright. Apart from any use as permitted under the Copyright Act 1968, the work may be reproduced in whole or in part for study or training purposes, subject to the inclusion of an acknowledgment of the source. Reproduction for commercial use or sale requires prior written permission from the Productivity Commission. Requests and inquiries concerning reproduction and rights should be addressed to Media and Publications (see below).
This publication is available from the Productivity Commission website at www.pc.gov.au. If you require part or all of this publication in a different format, please contact Media and Publications.
Publications Inquiries: Media and Publications Productivity Commission Locked Bag 2 Collins Street East Melbourne VIC 8003
Tel: (03) 9653 2244 Fax: (03) 9653 2303 Email: [email protected]
General Inquiries: Tel: (03) 9653 2100 or (02) 6240 3200
An appropriate citation for this paper is:
Shomos, A., Turner, E. and Will, L. 2013, Forms of Work in Australia, Productivity Commission Staff Working Paper, Canberra.
JEL code: J210
The Productivity Commission
The Productivity Commission is the Australian Government’s independent research and advisory body on a range of economic, social and environmental issues affecting the welfare of Australians. Its role, expressed most simply, is to help governments make better policies, in the long term interest of the Australian community.
The Commission’s independence is underpinned by an Act of Parliament. Its processes and outputs are open to public scrutiny and are driven by concern for the wellbeing of the community as a whole.
Further information on the Productivity Commission can be obtained from the Commission’s website (www.pc.gov.au) or by contacting Media and Publications on (03) 9653 2244 or email: [email protected]

CONTENTS iii
Contents
Acknowledgments v
Abbreviations vi Glossary vii
Concepts vii ABS measures ix
Key points xii 1 Introduction 1
1.1 Why are different forms of work of interest? 2
1.2 Forms of work analysed in this paper 5
1.3 Research questions addressed in this paper 8
2 Determinants of forms of work 9
2.1 Labour markets 9
2.2 Demand for different FOWs 10
2.3 Supply of labour to different FOWs 23
2.4 Summary 29
3 The prevalence of forms of work 31
3.1 Changes in forms of work over the 30 years to 2011 33
3.2 Changes in forms of work over the decade to 2011 34
3.3 Summary 39
4 Why might the prevalence of different forms of work have changed? 41
4.1 Changes in the labour market over the 2000s 42
4.2 Some hypotheses about the determinants of changes in the prevalence of different FOWs 50
4.3 Decomposing changes in each form of work 53
4.4 The evidence on factors that effect changes in the prevalence of FOWs 56
4.5 What could explain the observed shift effects? 64
iv CONTENTS
4.6 Some directions for future research 67
A Data sources 69
A.1 Data that might be used in estimating changes in prevalence 70
A.2 Data used in the shift–share analysis 74
B Changes in the prevalence of forms of work 77
B.1 Prevalence changes in broad forms of work, 1982 to 2011 77
B.2 Prevalence changes in forms of work between 2001 and 2011 78
C Evidence for independent contractors and other business operators 87
C.1 Definitions and measurement of contractors 87
C.2 Changes in the prevalence of independent contractors and other business operators 88
D Shift–share decomposition 91
E Employment changes at a state level 93
E.1 Employment growth by state was uneven 93
E.2 Changes in forms of work by state 97
E.3 Patterns in FOW shift effects across the decade 101
F Employment changes at an industry level 105
F.1 Industry growth was far from uniform 105
F.2 Changes in forms of work by industry 107
G Employment changes at an occupation level 115
G.1 Job growth favoured more highly skilled workers 115
G.2 Changes in forms of work by occupation 116
H Employment changes by gender and full- and part-time work 125
H.1 The profile of employment by gender and full- and part-time work 125
H.2 Changes in forms of work by gender and full- and part-time hours 126
I Employment change by age cohort 131
I.1 The profile of employment by age cohort 131
I.2 Changes in forms of work by age cohort 132
References 137
Appendix J is referred to in parts of this paper. It is not reproduced in the report, but is available at: http://www.pc.gov.au/research/staff-working/forms-of-work
J Data used in constructing 30-year time series

ACKNOWLEDGMENTS v
Acknowledgments
A number of staff from the Productivity Commission provided valuable help and advice. The authors would particularly like to thank Noel Gaston, Lisa Gropp, Patrick Jomini, Patrick Laplagne and Angela MacRae for their guidance and feedback; as well as Matt Forbes and Geoff Gilfillan for helpful comments.
The authors also wish to thank the external referees Mark Wooden (Melbourne Institute of Applied Economic and Social Research, University of Melbourne) and John Buchanan (Workplace Research Centre, University of Sydney) for their helpful feedback.
This paper used data from a number of Australian Bureau of Statistics (ABS) collections and a confidentialised unit record file from the Household, Income and Labour Dynamics in Australia (HILDA) survey. The HILDA project was initiated and is funded by the Australian Government Department of Families, Housing, Community Services and Indigenous Affairs (FaHCSIA), and is managed by the Melbourne Institute of Applied Economic and Social Research (the Melbourne Institute).
The findings and views reported in this paper are those of the authors and should not be attributed to the ABS, FaHCSIA, the Melbourne Institute, external referees or the Productivity Commission.

vi ABBREVIATIONS AND EXPLANATIONS
Abbreviations and explanations
ABS Australian Bureau of Statistics
ACTU Australian Council of Trade Unions
AIRC Australian Industrial Relations Commission
ALMS Australian Labour Market Statistics
ANZSCO Australian and New Zealand Standard Classification of Occupations
ANZSIC Australian and New Zealand Standard Industrial Classification
ATO Australian Taxation Office
EEBTUM Employee Earnings, Benefits and Trade Union Membership (survey)
EWLE Employees with paid leave entitlements
EWOLE Employees without paid leave entitlements
FOE Forms of Employment (survey)
FOW(s) Form(s) of work
GFC Global financial crisis
HILDA Household Income and Labour Dynamics in Australia (survey)
IC(s) Independent contractor(s)
LFS Labour Force Survey
NES National Employment Standards
OBO(s) Other business operator(s)
OECD Organisation for Economic Co-operation and Development
OMIE(s) Owner manager(s) of incorporated enterprise(s)
OMUE(s) Owner manager(s) of unincorporated enterprise(s)
PC Productivity Commission

GLOSSARY vii
Glossary
This glossary has two sections –– the first is for concepts used in the paper, and the second for ABS measures of the concepts described in the first section. When the concepts in the first section are equivalent to those that the ABS has used, the reader is referred to the ABS measure in the second section.
Concepts
Casual employee Based on FWO (2011, 2012d) and ACTU (nd), a casual employee typically does not accumulate paid leave and is not usually entitled to a set number of hours of work. He or she does not receive redundancy and termination entitlements, and his or her employment is not guaranteed to be ongoing. A casual tends to work irregular hours. Casual employees are paid a higher hourly rate of pay to compensate them for not receiving all of the entitlements of permanent employees.
In practice, some casual employees may have an expectation of continuing work with the same employer, and can work regular hours.
Employee An employee is a person who works in someone else’s business under a contract of service. Employees are defined to include all permanent employees, casual employees and fixed-term employees. In addition, some labour hire workers are also employees (typically they are employed as casual employees).
Fixed-term employee
Based on FWO (2011), a fixed-term employee has a contract of service that specifies that his or her employment will end on a particular date, or with a particular event. Fixed-term employees’ conditions of employment tend to be similar to those of permanent employees, but they do not qualify for termination or redundancy benefits at the end of their contract.

viii GLOSSARY
Form of work A form of work is the type of employment arrangement under which a person works. Terms for FOWs used in this paper include permanent employees, casual employees, fixed-term employees, independent contractors, other business operators, owner managers and labour hire workers.
Incorporated enterprise
See ABS measure.
Independent contractor
See ABS measure.
Labour hire firm See ABS measure.
Labour hire worker
A worker paid by a labour hire or employment (recruitment) agency while working in another business. Although typically employed as casual employees, labour hire workers can also be employed as fixed-term employees or independent contractors.
Occupation See ABS measure.
Permanent employee
Based on FWO (2011, 2012c, 2012d), a permanent employee is engaged under a contract of service for an indefinite period and is not a labour hire employee. Permanent employees typically receive paid leave and termination and redundancy entitlements. They are sometimes referred to as ‘ongoing’ employees –– although they may leave a job after giving notice (if notice is required).
Other business operator
See ABS measure.
Owner manager See ABS measure.
Owner manager of incorporated enterprise
See ABS measure.
Owner manager of unincorporated enterprise
See ABS measure.

GLOSSARY ix
Prevalence The share that one group represents of a larger group. For example, the percentage of permanent employees in total employment.
Self-employed A self-employed person is someone who works in his or her own business. Forms of work discussed in the context of self-employed workers include: independent contractors, other business operators and owner managers (of incorporated or unincorporated enterprises). In addition, some labour hire workers are also self-employed as independent contractors.
Unincorporated enterprise
See ABS measure.
Work arrangements
The conditions, entitlements or characteristics of work, such as the number and timing of hours worked and leave provisions.
Worker Any employee or self-employed person.
ABS measures
Employee Based on ABS (2012g), an employee is a person who works for a public or private employer and receives remuneration in wages or salary. Employees are engaged under a contract of service (employment contract) and take directions from their employer/supervisor/manager/foreman on how the work is performed.
Employees with paid leave entitlements
Based on ABS (2012g), these are employees who are entitled to either paid holiday leave or paid sick leave (or both) in their main job.
Employees without paid leave entitlements
Based on ABS (2012g), these are employees who are entitled to neither paid holiday or sick leave, or do not know whether they are entitled to paid holiday leave or paid sick leave in their main job.
Fixed-term contract
‘A contract of employment which specifies that the employment will be terminated on a particular date/event’ (ABS 2012g, p. 73).

x GLOSSARY
Incorporated enterprise
Based on ABS (2012g), an enterprise that is registered as a legal entity separate from its owners (also known as a limited liability company).
Independent contractor
Based on ABS (2012g), an independent contractor is a person who operates his or her own business and who contracts to perform services for others without having the legal status of an employee (an independent contractor is engaged by a client, rather than an employer). Independent contractors are engaged under a contract for services (a commercial contract), whereas employees are engaged under a contract of service (an employment contract). Independent contractors’ may have a direct relationship with a client or work through an intermediary. Independent contractors may have employees, however they spend most of their time directly engaged with clients or on client tasks, rather than managing their staff.
Labour hire firm Based on ABS (2012g, p. 74), a ‘labour hire firm is an organisation which is engaged in personnel search, or selection and placement of people for an employing organisation. The agency or firm may also be engaged in supply of their own employees to other employers, usually on a short-term basis’.
Labour hire worker
Based on ABS (2012g), a labour hire worker is a person who found his or her job through a labour hire/employment agency and is paid by the labour hire firm/employment agency.
Main job Based on ABS (2012g), the job in which a person with multiple jobs worked the most hours.
Occupation Based on ABS (2012g), an occupation is a collection of jobs that are sufficiently similar in their title, tasks, skill level and skill specialisation, which are grouped together for the purposes of classification. In this paper, occupation refers to the Major Group category within the Australia and New Zealand Standard Classification of Occupations (ANZSCO).

GLOSSARY xi
Other business operator
Based on ABS (2012g), a person who operates his or her own business, with or without employees, but does not operate as an independent contractor. Other business operators are distinguished from independent contractors in that they tend to generate their income from managing their staff or from selling goods or services to the public, rather than providing a labour service directly to a client. Other business operators spend little time working on client tasks with most of their time spent on managing their employees and/or business.
Owner manager Based on ABS (2012g), a person who works in his or her own incorporated or unincorporated enterprise
Owner managers of incorporated enterprises
Based on ABS (2007b, section 4.46), ‘persons who work in their own incorporated enterprise. This group includes persons who draw a wage or salary for their work in their own incorporated enterprise’.
Owner managers of unincorporated enterprises
Based on ABS (2007b, section 4.46), ‘persons who operate their own unincorporated enterprise, including those engaged independently in a trade or profession’.
Unincorporated enterprise
Based on ABS (2012g, p. 55), ‘a business entity in which the owner and the business are legally inseparable, so that the owner is liable for any business debts incurred’.

xii KEY POINTS
Key points • While employment in most forms of work (FOWs) grew in absolute terms over the
decade to 2011, only permanent employees became more ‘prevalent’ (increased as a share of employment). – Owner managers of unincorporated enterprises (OMUEs) fell in prevalence by
2 to 3 percentage points, offsetting the increase for permanent employees. – Casuals and fixed-term employees were no more prevalent at the end of the
decade than at the start. Labour hire workers probably became less prevalent, and it is likely that the workforce share of independent contractors also fell.
• Relatively rapid growth of casual and independent contractor employment from the 1980s, and labour hire workers from the 1990s, did not continue through the 2000s.
• In 2011, permanent full-time and part-time employees accounted for about 60 per cent of the workforce. Casual employees and self-employment accounted for a little under 20 per cent each. Fixed-term employees accounted for the small residual and labour hire workers (who are employed under a mix of FOWs) represented about 1 per cent of employment.
• Over the decade to 2011: – Increases in the prevalence of permanent employees were particularly strong in
the mining states (Queensland, Western Australia and the Northern Territory). – Structural change at a broad industry level appears to have played little role in
prevalence changes. – An increase in the employment share of higher-skilled jobs was associated with
the increased prevalence of permanent employees. – Falls in the numbers of farmers and farm managers explain about half of the
decline in the prevalence of OMUEs in the non-mining states. – The increased prevalence of permanent employees occurred disproportionately
in part-time jobs and among workers aged 50 to 69. • More pronounced prevalence changes in the mining states could have been related
to: – strong competition for workers encouraging greater job mobility. Hiring of
permanent employees can mitigate costly turnover – greater confidence in business viability. A fall in the risk of layoffs, and associated
redundancy costs, might have encouraged employers to offer more permanent employee roles.
• At a national level, a preference for permanent employee roles rather than self-employment among some workers — accommodated by relatively strong labour markets — might have played a role in the fall in the prevalence of OMUEs.

INTRODUCTION 1
1 Introduction
There have been many changes in labour markets in industrialised countries over the past 30–40 years. Changes include increases in the participation rates of women, the prevalence of part-time work and the skill content of jobs. There have also been changes in the employment arrangements under which people work. A number of forms of work (FOWs) including casual, labour hire and self-employment began to grow relatively quickly in the 1980s (Richardson, Lester and Zhang 2012).
There has been much research on different FOWs in Australia.1 Studies of casual, fixed-term and labour hire employees and self-employed contractors, have generally concluded that the prevalence of these FOWs increased during the 1990s and early 2000s, and then abated. For example, Richardson and Law (2009) concluded that Australia had one of the fastest growth rates of casual employment among OECD countries in the 1990s, but that growth in this FOW had moderated from 2001.2 More generally, these authors concluded that the prevalence of casual, fixed-term, labour hire and self-employed contract workers did not increase much in the early part of the 2000s. Similarly, the Commission (2006, p. 23) concluded that:
Without exception, the workforce shares of the major forms of non-traditional work [defined to include casual, fixed-term and labour hire employees and self-employed contractors] have either levelled off or declined since 2001.
Evans and Sikora (2004), in a study of self-employment (including both contractors and other business operators), found that the prevalence of this FOW increased in Australia between the mid-1980s and late 1990s. More recent research (Atalay, Kim and Whelan 2013; OECD 2011) suggests that the prevalence of self-employment in Australia declined in the 2000s.3
1 The Australian literature, for example, includes: Burgess and Campbell (1998), Murtough and
Waite (2000) and Simpson, Dawkins and Madden (1997) on casual employment; Hall (2000) and Waite and Will (2002) on fixed-term employees; Hall (2002) and Laplagne, Glover and Fry (2005) on labour hire employment; and Vandenheuvel and Wooden (1995) and Waite and Will (2001) on contracting.
2 Differences in the prevalence of casuals across countries could be due to differences in definitions. 3 Both Atalay, Kim and Whelan (2013) and the OECD (2011), however, only drew on data for
owner managers of unincorporated enterprises. These analyses, therefore, exclude the self-employed who were owner managers of incorporated enterprises.

2 FORMS OF WORK
Since the mid-2000s, it is possible that structural change (such as the increase in the mining industry’s share of output), changes in regulatory settings and the global financial crisis have influenced the prevalence of different FOWs in Australia. This paper presents an analysis of changes in the prevalence of different FOWs between 2001 and 2011, and discussion of possible explanations for observed changes. With the exception of the recent study of self-employment by Atalay et al. (2013), the authors have been unable to find any paper that both documents changes in the prevalence of FOWs in Australia over the decade to 2011 and explains why those changes might have occurred.
The remainder of this chapter includes: discussion of why different FOWs are of interest (section 1.1), definitions of the FOWs analysed in this paper (section 1.2), and a description of the research questions that are addressed (section 1.3).
1.1 Why are different forms of work of interest?
The pros and cons of different FOWs have been the subject of public debate. It is not the goal of this paper to comment on those debates. A brief discussion of some of the arguments is provided below as context for the analysis of prevalence changes in the past decade.
The effects of the greater flexibility associated with some FOWs (and casual work in particular) have been one subject of discussion. On the one hand, advocates highlight the benefits of flexibility for workers, employers and the economy more broadly. On the other hand, more flexible FOWs work have been criticised for their potentially adverse effects on workers, their families and the community — for example, in a recent inquiry commissioned by the Australian Council of Trade Unions (box 1.1).
Proponents of more flexible FOWs argue that they can be used to meet varying levels of demand (Houseman 2001). For example, in the retail industry, Campbell and Chalmers (2008) note that compared to permanent part-time work, casual employment offers employers more scope to match hours with demand as casual arrangements have fewer restrictions on hours than part-time arrangements. For workers, the greater flexibility in hours associated with some FOWs (particularly casual and self-employment) is potentially valued by people with parenting or caring duties, or those who prefer hours outside of the traditional norm (Buddelmeyer et al. 2006; Budig 2006).

INTRODUCTION 3
Box 1.1 Recent views on the pros and cons of different forms of work The Australian Council of Trade Unions (ACTU) commissioned an inquiry to investigate the extent of what it terms ‘insecure work’ in Australia and its impact on workers, their families and the community. The resulting report, Lives on Hold: Unlocking the potential of Australia’s workforce (Howe et al. 2012) described insecure work arrangements as those including:
… unpredictable and fluctuating pay; inferior rights and entitlements; limited or no access to paid leave; irregular and unpredictable working hours; a lack of security and/or uncertainty over the length of the job; and a lack of any say at work over wages, conditions and work organisation. (Howe et al. 2012, p. 14)
The authors observed that these characteristics: … are most often associated with non-permanent forms of employment like casual work, fixed-term contracts, independent contracting and labour hire — all of which are growing. (Howe et al. 2012, p. 14)
Forty per cent of Australian workers were deemed to be in insecure employment — equating to all workers not in permanent employee roles, such as independent contractors, other business operators and casual employees.
The ACTU has also highlighted other concerns about these forms of work: Evidence also suggests that many workers in insecure work, such as those engaged in casual employment and labour hire workers, are less likely to have access to skill and career development opportunities and are at greater risk of occupational injuries and illnesses. (ACTU 2011, p. 11.)
The Australian Industry Group (Willox 2012) has countered that the prevalence of casual work is not growing, noting that many casuals do not choose to convert to permanent employment, even though numerous industrial awards since 2000 have permitted this:
… employers report that whenever they give employees the option to convert to permanent employment, almost none (less than 1 per cent) want to. Casuals do not want to lose their flexibility or their casual loading.
Critics point to a range of negative consequences of some FOWs, including for workers’ health, access to training and job satisfaction. However, the empirical evidence on some of these consequences is mixed:
• In a review of the literature examining health and FOWs, Virtanen et al. (2005) found an association between temporary employment and psychological morbidity, but noted that more evidence was needed to explain that association. More recently, however, Richardson, Lester and Zhang (2012) found no evidence of negative mental health consequences for casual and contract employees in Australia.

4 FORMS OF WORK
• With regard to training opportunities, Richardson and Law (2009) found that casuals were less likely to undertake employment-based training, and received fewer hours of instruction when they did train, than permanent employees.4
• Some studies of the relationship between FOWs and job satisfaction have found that job satisfaction is lower for more flexible FOWs than for permanent employees. Others have reached the opposite conclusion. A recent meta-analysis of 72 studies (Wilkin 2013), concluded that self-employed contractors and permanent employees had similar levels of job satisfaction. Workers in temporary positions (for example, casual and labour hire workers), however, were slightly less satisfied than permanent employees.
Researchers have also come to differing conclusions about the extent to which casual work can act as a stepping stone to a permanent employee role. For example, Buddelmeyer and Wooden (2011) found that, for men, casuals were more likely to move into non-casual employment than were the unemployed. In contrast, women were slightly more likely to move to a permanent employee role from unemployment than from casual employment. Chalmers and Waddoups (2007) found that about 40 per cent of workers who were casual employees in 2001 remained in this FOW for at least four years, but that 50 per cent of people who entered casual employment in 2002 became permanent employees within a few years. Watson (2013) concluded that the likelihood of a worker transitioning from a casual to a permanent employee role was influenced by a number of factors including their age, years in employment and location.
Notwithstanding that some workers who want to move from casual to permanent employment might find that transition difficult, a casual job might be preferable to unemployment. As Buddelmeyer and Wooden (2011, p. 113) note ‘… even seemingly pessimistic findings indicating that most temporary workers will not obtain permanent jobs is not necessarily evidence of an adverse outcome if the alternative is unemployment’.
There is also a debate related to the self-employed that focuses on the contribution of small businesses to job creation. Some research on some industrialised economies has concluded that small firms make a disproportionately large contribution to net job creation (for example, Neumark, Wall and Zhang 2011), although other studies have found no systematic relationship between firm size and employment growth (for example, Haltiwanger, Jarmin and Miranda 2010).
4 This association does not imply causality from casual work to training opportunities. There may
be a range of high- and low-skill jobs and casual workers could tend to be employed in lower-skilled jobs that require little training.

INTRODUCTION 5
1.2 Forms of work analysed in this paper
A number of FOWs are analysed in this paper (figure 1.1). Definitions of these FOWs are presented in table 1.1.
Figure 1.1 Forms of work analysed in this papera
a All FOWs in the figure include both people who work on a full-time and a part-time basis.
The workforce is defined to include people who work as employees in someone else’s business and the self-employed. Labour hire workers can either be employees (typically on a casual or fixed-term basis) or self-employed (as independent contractors).
Characteristics of available data sets led to the use of two different classifications of the self-employed. Data on independent contractors and other business operators are available only from 2008 onwards. Much longer time series are available for owner managers of incorporated and of unincorporated enterprises (OMIEs and OMUEs, respectively). In 2011, just over one-third of OMIEs and about 60 per cent of OMUEs were independent contractors. Conversely, about two-thirds of OMIEs and 40 per cent of OMUEs were other business operators (table C.1).
Information about OMIEs and OMUEs provides insight into small business employment. In 2008, just over 75 per cent of OMUEs had no employees, and a further 20 per cent had fewer than 10 employees. For OMIEs, the shares were 40

6 FORMS OF WORK
and 45 per cent, respectively. (Authors’ estimates based on unpublished data from ABS 2010).
Table 1.1 Definitions of forms of work examined in this paper Form of work Definition
Employees An employee works under a contract of service in someone else’s business. Permanent employees
A permanent employee is one who is engaged to work indefinitely and is not a labour hire worker. According to the Fair Work Ombudsman, a permanent employee: • ‘… is hired on a part-time or full-time basis. Permanent employees get paid
leave and usually have a regular set of hours of work’ (FWO 2012e, p. 1) • is entitled to termination and redundancy payments (FWO 2011) • can be required to give notice (FWO 2012d). Although permanent employees are engaged to work indefinitely, they are not bonded to their employers, and are free to leave a job at any tenure after giving notice (if required). These workers are also referred to as ‘ongoing employees’.
Casual employees
There is no standard definition of a casual employee, and the Fair Work Act 2009 (Cwlth) does not define this FOW. Modern awards and enterprise agreements often describe casuals as employees who are engaged and paid as such. This FOW is, therefore, defined through reference to the typical working arrangements of people engaged as casuals. According to the Fair Work Ombudsman, casual employees: • ‘… aren’t usually entitled to a set amount of hours of work and don’t usually
accumulate paid leave. Instead, casuals are paid a higher hourly rate of pay to compensate them for not getting these entitlements. Casuals can work regular hours, but that doesn’t mean they are permanent employees’ (FWO 2012e, p. 1)
• are not entitled to termination and redundancy payments (FWO 2011). Casuals usually work in jobs ‘that are temporary, have irregular hours and are not guaranteed to be ongoing’ (ACTU nd, p. 1). In practice, some casuals have an expectation of continuing work with the same employer and a small proportion receives paid leave entitlements.
Fixed-term employees
A fixed-term employee is one who has a contract that specifies that his or her employment will end on a particular date, or with a particular event. In other respects, fixed-term employees’ conditions of employment tend to be similar to those of permanent employees, but they do not qualify for termination or redundancy benefits at the end of their contract (FWO 2011).
(Continued next page)

INTRODUCTION 7
Table 1.1 (continued)
Form of work Definition
Self-employed A self-employed person works in his or her own business.
Of incorporated enterprises
Owner managers of incorporated enterprises run companies formed under the Corporations Act 2001 (Cwlth), and can work alone, or employ others. In terms of the nature of their work, they can be independent contractors or other business operators.
Of unincorporated enterprises
Owner managers of unincorporated enterprises work as either sole traders or in a partnership, and can work alone, or employ others. In terms of the nature of their work, they can be independent contractors or other business operators.
Independent contractors
Independent contractors run ‘their own business [either incorporated or unincorporated] and … contract to perform services for others without having the legal status of an employee … [they are] engaged under a contract for services (a commercial contract), whereas employees are engaged under a contract of service (an employment contract’ (ABS 2012f, p. 74). Some contractors have employees, but typically spend most of their time directly engaged in work for clients rather than managing staff. As self-employed workers, contractors are responsible for their own recreation and personal leave, and termination and redundancy provisions do not apply to them. Researchers have identified a number of sub-categories of independent contractor, variously labelled self-employed, dependent and sham contractors. These groups are not a focus of the paper, but are discussed in appendix C.
Other business operators
Other business operators run ‘their own business [either incorporated or unincorporated], with or without employees … [and] tend to generate their income from managing their staff or selling goods and services to the public, rather than providing a labour service directly to a client (ABS 2012f, p. 75).
Labour hire workers
Labour hire workers are paid by a labour hire or employment (recruitment) agency while working in another business. They are typically employed by the agency as casual employees, but can also be fixed-term employees or independent contractors.
Prevalence estimates illustrate the relative shares of different FOWs in Australian employment (table 1.2). In 2011, the large majority (more than 80 per cent) of Australians worked as employees. Among employees, permanent employment was the most common FOW. Casual employees also accounted for a significant share of employment, and fixed-term employees were much less prevalent.
Turning to the self-employed, OMUEs were more prevalent than OMIEs. Using the alternative disaggregation, independent contractors and other business operators accounted for approximately equal shares of the self-employed. Labour hire workers represent a very small share of the workforce.

8 FORMS OF WORK
Table 1.2 Prevalence of different forms of work, 2011a Number Share of workforce
’000 % Employees 9 352.7 82.4 Permanentb 7 093.2 62.5 Casualc 2 259.5 19.9 Fixed-termd 389.5 3.4 Self-employed 2 000.8 18.2 Independent contractorse 1 026.9 9.0
Other business operatorse 1 040.3 9.2 Owner managers Of incorporated enterprisesf 785.0 6.9 Of unincorporated enterprisesg 1 215.8 10.7 Total employed 11 353.4 100.0 Labour hire workersh 141.7 1.2 a Data exclude contributing family workers. b Proxied using data on employees with leave entitlements (chapter 3). c Proxied using data on employees without leave entitlements (chapter 3). d Fixed-term employees are included in the totals for both permanent and casual employees according to whether they received paid leave entitlements. e The estimate includes people who identified as employees but were reclassified by the ABS as independent contractors. As a consequence, the estimates for independent contractors and other business operators add to a total slightly higher than the self-employed total. f The estimate includes people who identified as OMIEs but were reclassified by the ABS as employees (21 200). g The estimate includes people who identified as OMUEs but were reclassified by the ABS as employees (29 000). h Estimate is for workers who were paid by a labour hire firm. These workers overlap with other FOWs.
Source: Tables B.2 to B.9.
1.3 Research questions addressed in this paper
As noted above, this paper analyses how the prevalence of different FOWs has changed in Australia, with a particular focus on the decade to 2011, and considers why those changes might have occurred.
The following research questions are addressed in this paper:
• From a theoretical perspective, what are the demand-side, supply-side and institutional factors that influence the prevalence of different FOWs (chapter 2)?
• How has the prevalence of different FOWs changed in the past 30 years, and more specifically over the past decade (chapter 3)?
• What might have caused the observed changes in prevalence of FOWs over the past decade (chapter 4)?
Supporting analysis is presented in appendices.
DETERMINANTS OF FORMS OF WORK
9
2 Determinants of forms of work
As discussed in chapter 1, employment in Australia is characterised by a number of forms of work (FOWs). Some people work in their own business, supplying labour to others under contracts for service (as independent contractors), or producing and/or selling goods and services (as other business operators). These owner managers tend to have discretion over the terms and conditions under which they work. Others work as employees, supplying labour under contracts of service on a permanent, fixed-term or casual basis. Labour market regulations set many of the terms and conditions governing their employment.
The prevalence of different FOWs, and changes therein over time, are determined by the interaction of demand, supply and institutional factors within labour markets. On the demand side, an employer’s choice of a FOW is influenced by the relative costs and productivity (benefits) of different arrangements. On the supply side, a worker’s choices are influenced by the relative financial and non-pecuniary benefits associated with different FOWs. The institutional and regulatory environment influence both demand and supply, and include labour market regulation and the industrial relations system, the tax and transfer system and organisation-specific factors — for example, temporary restrictions on the hiring of permanent employees in the public sector.
This chapter provides a theoretical framework to help explain the factors that might lead employers and workers to prefer different FOWs. This framework is also used in the analysis of changes in the prevalence of those FOWs in chapter 4. Section 2.1 provides a brief overview of labour markets. Section 2.2 describes factors that might affect the demand for labour in different FOWs, and section 2.3 considers those factors that might affect the labour supply in each FOW. Institutional factors are covered where relevant in the discussion of demand and supply. Section 2.4 concludes the chapter.
2.1 Labour markets
In a labour market, employers are buyers and workers are sellers of labour services. Hours worked by people in employment is a measure of the quantity of labour

10 FORMS OF WORK
services provided,5 and the remuneration paid to workers (or fee, in the case of independent contractors) reflects the ‘price’ of labour. The cost of labour to employers includes wages and other costs, for example, superannuation and payroll tax. Institutional factors determine the ‘rules’ within which trade can occur.
In practice, there are multiple labour markets — defined, for example, in terms of geographic areas, occupations, qualifications, skills and FOWs. Employers and workers often participate in more than one market. For example, many employers engage different workers through a variety of FOWs, and some workers have multiple jobs, sometimes in different labour markets. Different FOWs can also be substitutes or complements. As a result, labour markets interact — the activities in one affect demand and supply in others.
Labour markets also interact with other markets. Combinations of labour, capital and technology are used to produce goods and services. As a result, changes in capital, technology and product markets affect the demand for, and supply of, labour — and therefore, the prevalence of different FOWs.
2.2 Demand for different FOWs
What might motivate an employer to choose one FOW over another?
A profit-maximising firm will seek to produce output at the least possible cost. This does not mean that the cheapest inputs will necessarily be used — rather the firm will use the combination of inputs (capital, labour, technology and intermediate inputs) that delivers the lowest unit cost of producing a good or service of the required quality. This means that the productivity of input factors (output relative to the amounts used) must also be taken into account. Thus, a firm will compare the value of production and costs associated with hiring labour under alternative FOWs. All else equal, if the cost of employing a person is lower or firm productivity higher (that is, unit labour costs are lower) under a particular FOW, profit-maximising firms will have an incentive to use more of that FOW.6
The ways in which the different elements of labour costs and productivity can shape an employer’s choice of FOWs are discussed below. The discussion assumes ‘other things equal’. That is, in considering the potential effects of any factor on a firm’s choice of FOW, other potential influences are ignored. In practice, a firm will weigh
5 The quality of those labour services reflects the effort by workers. 6 Unit labour costs are defined, broadly, as the ratio of average labour costs to average labour
productivity.

DETERMINANTS OF FORMS OF WORK
11
multiple factors when determining which FOW addresses a labour need most cost-effectively.
Costs
Differences in labour costs by FOW can be categorised into those that:
• reflect the institutional environment, including:
– minimum award wages and other conditions
– termination and redundancy provisions
– payroll tax
• are a function of the process of engaging a worker rather than the number of hours worked for the employer (quasi-fixed costs (Oi 1962)). For example:
– recruitment and selection
– training
• are due to other characteristics of the production process, such as:
– administration of the employment relationship
– equipment and specialist skills.
Costs that reflect the institutional environment
Wages and other conditions
Wages and other conditions will often be negotiated between an employer and a worker. However, institutional factors, such as those under the industrial relations system (box 2.1), set minimum standards and influence what can be bargained over. Some characteristics of the institutional environment that can lead to variation in the wages and other conditions received by workers employed under different FOWs of similar productivity (that is, workers who perform the same task and produce output of equal value to the firm) are discussed in this section.
One key characteristic is the wage loading payable to casual employees in lieu of a number of the employment conditions that permanent and fixed-term employees receive. In designing modern awards, the Australian Industrial Relations Commission (AIRC) set the standard loading from 1 January 2010 at 25 per cent (box 2.2). Although the loading was already at this level in some awards, the

12 FORMS OF WORK
decision represented an increase or decrease in others (AIRC 2008).7 Modern awards include transitional arrangements for situations where the loading was not 25 per cent before 2010. Employers facing an increase (decrease) in the cost of casual employees as a consequence of this decision might have substituted away from (towards) casual employees.
Box 2.1 Australia’s industrial relations system Australia moved to a predominantly national industrial relations system in 2009 with the introduction of the Fair Work Act 2009 (Cwlth) and associated reforms. Under this system, wages and other conditions are influenced by the National Employment Standards (NES) in the Fair Work Act and industrial instruments, including awards, individual arrangements and collective agreements.
• NES — established minimum conditions for employment for everyone covered by the national industrial relations system. They comprise ten minimum standards of employment covering maximum work hours, flexible working arrangements, leave, public holidays and termination and redundancy provisions. Some of the standards do not apply to all FOWs.
• Modern awards — set industry- or occupation-based minimum pay and conditions in addition to the NES. The 122 modern awards commenced 1 January 2010. A number of older federal and state awards are yet to be modernised or are still being transitioned into the national system (FWO 2012c).
• Enterprise agreements — collective agreements made at the enterprise level between employers and employees that cover the terms and conditions of employment for the employees involved. An enterprise agreement must not be less beneficial that the NES and overall must be better than the relevant modern award (Fair Work Commission (2013).
• Individual arrangements — those allowed under the Fair Work Act include individual flexibility arrangements, common law contracts and above-award payments. Individual flexibility arrangements allow for variations to modern awards and enterprise agreements while ensuring minimum entitlements and protections are not undermined (FWO 2013).
In May 2010, nearly 90 per cent of employees were covered by the federal workplace relations system (ABS 2011).
Sources: FWO (2012b); PC (2012).
7 Watson (2005) reported that casual loadings ranged between 15 and 331/3 per cent (in the early
2000s). Interestingly, Watson concluded that, when other characteristics were taken into account, part-time casuals earned a much lower premium relative to permanent part-time employees than these loadings would suggest should have been the case.

DETERMINANTS OF FORMS OF WORK
13
Box 2.2 Determination of the casual loading With the introduction of modern awards, a standard 25 per cent wage loading was adopted for casual employees (AIRC 2008). Set by the AIRC, this came into effect on 1 January 2010. The choice of loading was based on previous AIRC decisions including the 2000 ‘Casuals Case’ (a decision to vary the Metal, Engineering and Associated Industries Award 1998), and the 2003 variation to the Pastoral Industry Award 1998.
Each of these decisions took a range of factors into account in determining the level of the wage loading received by casual employees, including personal, annual and long service leave, and termination and redundancy provisions. The pastoral industry calculation (reproduced in the following table) illustrates how the 25 per cent loading is arrived at.
Comparison of permanent versus casual employment by entitlement to payment, in days (Pastoral Industry Award)a, b
Permanent employee Days Total days (5 days * 52 weeks) 260 Plus accrued entitlements Annual leave 20 Leave loading (17.5 per cent of annual leave) 3.5 Long service leave 4.3 Equivalent in days for which an entitlement accrues after one year 287.8 Casual employee Total days (5 days * 52 weeks) 260 Less days allowed for benefits not received Payment for public holidays 10 Allowance for short time (time lost due to travel between engagements) 10 Allowance for sick/personal leave 5 Allowance re notice of termination/redundancy 5 Equivalent in days for which an entitlement accrues after one year 230 Ratio of equivalent in days for which an entitlement accrues after one year 1.25 a Assuming 1 year of work with 5 day weeks but with no work on public holidays. b Figures presented for station hands.
Source: AIRC (2003), table 1.
As the AIRC (2008) noted: Although the decisions in these cases were based on the circumstances of the industries concerned, we consider that the reasoning … is generally sound and that the 25 per cent loading is sufficiently common to qualify as a minimum standard. (para. 49)
(Continued next page)

14 FORMS OF WORK
Box 2.2 (continued) Although the reasoning was clear in each case, both decisions acknowledged that the calculation of the loading was not straightforward and involved an element of judgment, for example:
… we are not persuaded that all components for calculating a fair loading can be specified with precision or individually valued … In our view, such other components as may be identified can only be a guide to an overall quantification of the loading. No component can be the determinant of a precise level to be applied. Arbitral judgment is likely to be necessary in making an assessment of what is fair and reasonable. (AIRC 2000, para. 157)
In some circumstances, the loading might mean that a casual employee is less cost-effective than a permanent employee. For example, the loading includes a payment in lieu of long service leave. This leave type accrues with years of continuous employment and can be taken by eligible workers after a defined tenure (often 10 years). In many jurisdictions, a worker who leaves a job after a shorter period (often seven years), is entitled to a payout of accrued long service leave entitlements. Casual employees are entitled to long service leave in several jurisdictions (including Victoria, New South Wales and Queensland).8 A casual employee who works in a role long enough to qualify for long service leave, therefore, effectively benefits from this entitlement twice — once as part of the casual loading and once as paid time off (or payment of accrued entitlements). Furthermore, employees who leave a role before completing the qualifying period forgo accumulated benefits. Inclusion of an allowance for forgone long service leave in the loading means that casual employees receive compensation for this entitlement from their first hour worked. Thus, all else equal, it is possible that a casual employee could be less cost-effective than a permanent employee who leaves before he or she becomes eligible for the entitlement.
Variation in eligibility for termination and redundancy provisions constitutes another potential source of difference in the relative costs of FOWs faced by employers relating to the loading. This is discussed further in the next section.
Requirements relating to overtime payments are another potential source of variation in the cost of different FOWs. Overtime is due when a permanent employee works outside his or her agreed standard hours.9 Rates tend to be paid at time and a half for
8 Provided they meet a requirement for continuous service — where continuity is defined to
include limited breaks in employment of two to three months, but generally only those initiated by the employer.
9 Under at least some industrial instruments such as modern awards, part-time permanent employees can agree in writing to a variation in their ordinary hours of work. A part-time

DETERMINANTS OF FORMS OF WORK
15
the first two or three hours on a weekday, and double time for subsequent, and all weekend, hours (for example, these terms apply under the General Retail Industry Award 2010 and the Restaurant Industry Award 2010). As a result, it might be more cost-effective to use casual employees or labour hire workers to cover fluctuations in labour demand. These FOWs might be expected to be more prevalent in industries where such fluctuations are more common, for example, retail and accommodation. To the extent that this is the case, sustained or long-run changes in the share of such industries in employment, as a consequence of structural change for example, would be associated with changes in the prevalence of these FOWs.
Penalty rates for work during ‘unsociable hours’, weekends or public holidays could also affect the cost of casual, permanent and fixed-term employees differently. Although many modern awards set the same wage premiums for different FOWs, there are exceptions. For example, under the General Retail Industry Award 2010, permanent employees receive a 25 per cent loading for ordinary hours worked after 6:00 pm on a weekday; casual employees receive no additional loading. In contrast, under the Restaurant Industry Award 2010, all employees (including casual employees) must be paid 110 per cent of their standard ordinary rate for hours worked between 10 pm and midnight, Monday to Friday.
Variation in hours requirements under some awards and agreements can also influence the costs of different FOWs. For example, many modern awards set similar minimum hours for casual and permanent employees but, again, there are exceptions. Permanent part-time employees whose pay and conditions are governed by the Restaurant Industry Award 2010 must be rostered for a minimum of three consecutive hours per shift. Casual employees must be paid for a minimum of two hours on each occasion that they are required to work. An employer with a very short-term labour need (for example, to staff a bar during the interval of a play or to cope with peak demand in a restaurant) may, therefore, find it more cost-effective to engage a casual employee rather than a part-time permanent employee.
Casual employees, therefore, are more likely to be used in those industries in which lower penalty rates and less restrictive hours clauses mean that they are more cost-effective than other FOWs. Growth in the employment shares of these industries would be expected to increase the prevalence of casual employees.
Another potential source of difference in the wages and other conditions received by FOWs is the all-in-fee paid to independent contractors. In theory, the fee negotiated between an employer and an independent contractor would compensate for the pecuniary and non-pecuniary remuneration that the independent contractor
worker might, therefore, agree to increase his or her hours at ordinary rates of pay to cover a temporary vacancy.

16 FORMS OF WORK
could otherwise receive as an employee. This includes (where applicable) workers’ compensation, leave provisions and superannuation (along with returns to the independent contractor’s capital and business acumen). If an equivalent employee role is not available, or not preferred,10 in competing for work, an independent contractor might not seek to recover these conditions fully. However, under the unfair contract provisions of the Independent Contractors Act 2006 (Cwlth), a contract can be judged unfair if, among other things, a contractor’s total remuneration is less than that of an employee doing a similar job (Australian Government 2012).11
Termination and redundancy
Under the National Employment Standards and modern awards, permanent employees are generally eligible for a minimum period of notice, or payment in lieu of this, before their employment is terminated.12 They may also be entitled to redundancy pay (box 2.3). (Enterprise agreements often contain termination and redundancy provisions more generous than those in the National Employment Standards and modern awards.) As a result, a permanent position is more likely to be offered where there is an expectation of a relatively stable and long-term need for labour. Casual employees do not qualify for either benefit, but the loading notionally provides some compensation for this. Therefore, a casual employee may be a lower-cost, less risky option for a business that faces uncertainty about future demand for its output (particularly one with fifteen or more employees), as permanent employees are entitled to redundancy pay in the event of being laid off (box 2.3). Labour hire workers are also likely to be preferred for roles of this type as employers are not required to give notice or pay any termination or redundancy costs for these workers.
Improvements in employer confidence and certainty about business conditions during the recovery phase of the business cycle may, therefore, be associated with an increase in the prevalence of permanent employees. Conversely, declines in
10 To the extent that contractors value self-employment they may accept a fee (net of returns to
their capital and business acumen) below the wage that they could earn as an employee. 11 Other key factors taken into account by courts in assessing the fairness of a contract include the
relative strengths of the parties’ bargaining positions, and whether unfair tactics or undue influence were used against a party.
12 Provisions in the Fair Work Act 2009 (Cwlth) also permit employers to stand down employees without pay if the business’ ability to operate is limited by a range of factors beyond the employer’s control. These provisions apply to all employees. Employers and independent contractors can include similar ‘force majeure’ provisions in contracts. Stand-down provisions should not, therefore, affect an employer’s choice of FOW.

DETERMINANTS OF FORMS OF WORK
17
confidence and certainty during the recession phase of the cycle may be associated with an increase in the prevalence of casual employees and labour hire workers.
Box 2.3 Who qualifies for termination provisions and redundancy pay? Before terminating an employee, an employer is required to give a period of notice, or payment in lieu thereof, based on an employee’s tenure (ranging from one week for workers with less than one year of service to four weeks for those with more than five years). A number of exceptions to this requirement apply, including for:
• an employee terminated because of serious misconduct
• casual employees
• a person at completion of a fixed-term contract.
Employees terminated because an employer no longer needs their role performed, or because their employer becomes insolvent or bankrupt, might be entitled to redundancy pay based on their period of continuous service. A range of exceptions apply, including for:
• employees of small businesses (defined as businesses with fewer than 15 employees, excluding casual employees engaged on an irregular basis)
• employees with less than 12 months continuous service
• casual employees
• fixed-term employees.
An employee’s minimum level of redundancy pay depends on his or her period of continuous service. A qualifying employee with between one and two years of service, for example, would be entitled to redundancy pay equivalent to four weeks’ pay. This increases to 16 weeks for an employee with between nine and ten years of service, and then falls to 12 weeks for employees with at least 10 years of service (to avoid double counting of long service leave entitlements payable after 10 years of service (AIRC 2004)).
The preceding information applies to entitlements under the National Employment Standards, reflected in modern awards. Some workers employed under older industrial instruments might have different terms and conditions, and be transitioning to the modern award entitlements. Enterprise agreements might have more generous termination provisions.
Source: FWO (2011).
Fixed-term employees are not eligible for termination and redundancy at the completion of their contract, but otherwise tend to be entitled to similar conditions of employment to permanent employees. Fixed-term employees, therefore, are likely to be less costly than other FOWs for tasks with a known end date or event. Examples of situations where this may arise include projects funded for a given

18 FORMS OF WORK
period, services that are provided for only part of the year (for example, some types of education) and a need to cover temporary absences (for example, due to permanent employees taking long service or parental leave). If industries where these conditions are more common grow faster than the national average, due to structural change for example, it could be expected that the prevalence of fixed-term employment would also rise.
Independent contractors, like fixed-term employees, are also likely to be preferred for projects involving a specific output, as they do not receive termination and redundancy provisions. However, costs can arise if an employer wishes to terminate a contract for services prior to the agreed termination date.
The ability to be able to require permanent employees to provide notice before terminating their employment contract may also lead an employer to prefer this FOW (for example, in situations where a role is critical to the output of the firm). Such a requirement opens up the potential for a handover period. Difficulties in replacing staff are likely to be more acute in a strong labour market. This phenomenon, therefore, could also mean that permanent employment becomes more prevalent during periods of buoyant economic conditions and low unemployment (and vice versa).
Under the Fair Work Act 2009 (Cwlth), permanent and fixed-term employees are covered by unfair dismissal legislation if they have completed the minimum qualifying period of employment — 6 months where the firm has 15 or more employees and 12 months where the firm has fewer than 15 employees — and are covered by an award or enterprise agreement, or earnings do not exceed a high income threshold. Casual employees are also covered if they had been employed on a regular and systematic basis for the minimum qualifying period and had a reasonable expectation of continuing on that basis (Creighton and Stewart 2010). Therefore, where the employer has the option of employing a permanent or casual employee, in theory, unfair dismissal legislation should not influence the FOW chosen.
Independent contractors are not covered by unfair dismissal, but as mentioned above, employers can incur costs if they terminate a contract early.
Payroll tax
Payroll tax might factor into a firm’s choice between using an employee or an independent contractor. Payroll tax is paid once an employer’s total wage bill reaches a certain threshold. Independent contractor payments are included in the calculation of that wage bill in several jurisdictions, although payments to some

DETERMINANTS OF FORMS OF WORK
19
independent contractors are exempt. Conditions under which exemptions apply vary by jurisdiction, and can include situations where (Australian Government 2012, pp. 52–3):
• the supply or use of goods owned by the contractor is the main object of the contract
• the contractor is engaged to provide a service not normally required, which the contractor also provides to the general public
• the contractor’s services are required for less than 180 days in a financial year
• the contractor works for less than 90 days in a year
• the contractor is an owner-driver, whose main role is to deliver goods or services in a vehicle he or she owns
• the contractor engages others to provide the services he or she is contracted for.
Therefore, an independent contractor may be engaged in preference to a fixed-term employee, for example, where a job is short term and the independent contractor owns the required equipment, because the employer is not liable for payroll tax. If short-term jobs or jobs that require equipment became more common, for example, because of an expansion in an industry like construction, contract employment may become more prevalent.
Quasi-fixed costs
Recruitment and selection
The process of identifying potential workers, selecting the preferred candidate for a role and negotiating to engage his or her services involves costs that have to be borne whether a person then works with a firm for a few hours or many years. These costs are smaller per unit of output the longer a person works for a firm — as hiring costs increase, firms are likely to look to longer-term arrangements.
Hiring costs are likely to be larger where it is difficult to observe a person’s skills before they have started work and/or where the costs of a poor choice are higher —for example, where underperformance imposes large costs on a business. Firms are likely to invest more in filling roles with these characteristics, which are typically for jobs that are highly specialised or require a highly skilled candidate, and where the worker is important to the running of the business. Permanent employees are likely to be preferred for these roles as firms are more likely to recoup hiring costs over the employment relationship, as permanent employees are more likely to stay in their role for a relatively long duration (Dawkins and Norris 1990). This

20 FORMS OF WORK
reasoning also suggests that if higher-skilled employment became more prevalent, then permanent employment would become more prevalent too (other things equal).
Recruitment and selection costs are also likely to be higher where candidates have greater bargaining power, for example, due to a shortage of qualified workers. Firms might have to invest more in identifying suitable candidates and, potentially, spend more time and effort negotiating to attract them to a role. Again, this is more likely to be the case for higher-skilled candidates, and longer-term employment arrangements might be preferred as a result. A prolonged period of low unemployment, for example, during the peak phase of the business cycle, might be associated with an increased prevalence of permanent employees.
Labour hire workers could be preferred in some circumstances because their agencies benefit from economies of scale in recruitment and selection (Laplagne, Glover and Fry 2005). Competition between agencies will ensure that lower costs are passed on to client firms. The services of a labour hire company are likely to be more cost-effective for smaller firms without in-house human resources capacity or for temporary ‘relief’ roles.
The converse of these arguments is that non-permanent arrangements are likely to be more common where recruitment and selection costs are low — for example, for lower-skilled, routine or easily defined roles.
The costs of recruiting and selecting an independent contractor can vary from those associated with an employee due to the expense of contractual negotiations. For employees, many of the financial entitlements are set out in awards and enterprise agreements. However, these entitlements need to be negotiated for an independent contractor. These costs are likely to be lower, and independent contractors preferred, where the independent contractor’s output and timeframe are easily specified, and the parties have experience negotiating these types of contracts.
Firm-specific training
All workers bring knowledge, skills and abilities to a new role, but some aspects of a job can be very specific to it or to the firm and a new worker needs to learn specific skills before he or she can be fully productive. These might include, for example, the idiosyncrasies of a firm’s machinery and equipment, or its processes and key stakeholders. It is likely that a new worker’s learning curve is steeper and longer for more highly skilled jobs.
In theory, the costs of this firm-specific training are primarily borne by the firm, because workers are unlikely to make an investment in skills that have little or no

DETERMINANTS OF FORMS OF WORK
21
value to them outside the firm (Becker 1962). As firm-specific training costs increase, permanent employees are more likely to be preferred. A business that invests in firm-specific training is exposed to the risk that a worker will leave, and that it will not see a return on its training investment. Firms are likely to seek longer-term arrangements to give them time to recoup the investment (Richardson and Law 2009). Empirically, permanent employee roles are of longer tenure. In 2008, nearly 60 per cent of permanent employees had been with their employer for more than 2 years, in contrast with 26 and 30 per cent of casual and fixed-term employees, respectively (authors’ estimates based on unpublished data from ABS 2010).
That said, although firms may prefer long-term employment relationships in some circumstances, in the absence of arrangements that bond employees for at least a certain duration, there is no reason why a permanent employee could not choose to leave a firm after a very short tenure. As tenure increases, deferred rewards like long service leave probably discourage some employees from moving to another employer.
Any change that increased the skill demands of jobs (for example, skill-biased technical change) might, therefore, be associated with a rise in the prevalence of permanent employees.
Other characteristics of the production process
Administration costs
Administration of employment arrangements is a cost to firms. All else equal, for jobs with more irregular hours, independent contractors, casual employees and labour hire workers are likely to be more cost-effective. The firm does not have to administer holiday and sick leave and other conditions (such as superannuation in some cases) for independent contractors and casual employees, and the labour hire agency looks after labour hire workers. Labour hire agencies administer conditions for labour hire workers, and as with recruitment and selection costs, economies of scale will be passed on in the form of lower fees to the firm. Firms with larger human resource departments may be more likely to employ permanent employees, due to potential economies of scale, similar to labour hire agencies. Larger firms may also use a greater variety of FOWs than smaller firms due to the complexity of administering different arrangements. Larger firms may also find it easier than smaller firms to incur the costs of maintaining and rostering a pool of non-permanent workers.

22 FORMS OF WORK
Equipment and specialist skills
A firm’s equipment needs could also influence the working arrangement chosen. Although firms usually provide the equipment that employees use, independent contractors often provide their own. Outsourcing to independent contractors is likely to be preferred where the equipment needed is not firm-specific and/or is required irregularly or for a short period. A firm’s unit costs are likely to be lower if it does not have to pay for equipment that sits idle. Tradespeople, machinery operators and drivers and labourers are examples of occupations where workers often provide their own equipment. Increases in the share of these occupations in employment could, therefore, be expected to be associated with an increase in independent contractor employment.
Similarly, a firm that has an irregular or short-term need for specialist skills might access them through a contracting or fixed-term arrangement. The former is more likely where the desired output can be easily specified.
Productivity
Labour productivity is measured by the output that workers produce per hour of employment. It will vary by FOW to the extent that different:
• arrangements enable employers to engage workers more flexibly
• characteristics for each FOW influence workers’ levels of effort.
Flexibility for employers
Although many firms require labour for a standard 38-hour work week, many others operate for longer hours, some have labour needs that fluctuate reasonably predictably across the course of the week, month or year, and others have irregular labour needs. Employers also experience both anticipated and unanticipated worker absences.
In any business, productivity is likely to be higher if workers are only employed for the time when they are needed. Industrial instruments usually require that the ordinary hours worked by permanent employees, whether full- or part-time, are agreed in advance between employers and employees. Permanent employees, therefore, are best suited to situations where labour demand is predictable and regular. Non-permanent FOWs will be preferred where demand is unpredictable. For example, casual employees and labour hire workers can be engaged to cover unexpected absences or peaks in demand. These FOWs would be expected to be

DETERMINANTS OF FORMS OF WORK
23
more common in industries such as retail and accommodation, and thus to become more prevalent if employment in these industries grew faster than the national average.
Firms may also use different FOWs to mitigate institutional impediments to flexibility. For example, freezes on hiring permanent employees in the public sector could result in public sector organisations using non-permanent FOWs instead.
Workers’ effort
The characteristics of different FOWs may influence the effort that a worker invests in a role and hence unit labour costs of the firm. Non-permanent workers, for example, could be motivated by a lack of job security to put in more effort than permanent employees to increase their chances of continuing employment with their current employer or obtaining employment with another one.
On the other hand, the relative job security enjoyed by permanent employees could encourage greater morale and loyalty, and through that, higher effort levels. Employees’ reputations in their organisation and their potential for promotion could also be motivating factors — and are potentially less important for non-permanent workers. Where internal incentives such as promotions are not available, however, the relatively greater job security of permanent employees could perversely discourage effort.
Independent contractors may be motivated to work harder than other workers as, unlike individuals in other FOWs, they are contractually liable for the output they produce. In addition, being paid only once the contract is completed might provide independent contractors with an incentive to finish the job in a timely manner so they can move onto new work or be re-hired.
Finally, the use of non-permanent workers might adversely affect the productivity of permanent employees if it has negative repercussions on the commitment, loyalty and trust of permanent employees, due to them feeling that their job is less secure (Gryst 1999). In addition, a mix of non-permanent and permanent employees might make work continuity and teamwork more difficult, potentially reducing productivity.
2.3 Supply of labour to different FOWs
What motivates a worker to prefer one FOW over another? Economic theory posits that a person seeks to maximise wellbeing by allocating his or her time across paid

24 FORMS OF WORK
and unpaid activities (Becker 1965). When making this decision a person will take into account:
• household or family wealth and income
• the amount of time that he or she would like to spend in unpaid activities (the ‘opportunity cost’ of paid work)
• other intrinsic motivations, such as ‘doing something rewarding’.
A person will prefer the working arrangement that enables him or her to achieve the highest possible level of wellbeing. Alternative FOWs differ in terms of:
• the extent to which they help people combine paid and unpaid activities
• the total remuneration (wage or fee, entitlements and pecuniary and non-pecuniary conditions) offered
• how easily people are able to achieve other work-related preferences, such as a desire to ‘be your own boss’, to change jobs frequently for variety, to gain experience across a range of positions, to take advantage of other job-related opportunities such as overseas travel, study or training opportunities or to achieve relative job security.
Whether a worker is able to work in his or her preferred working arrangement will depend on the availability of roles of that type and the relative negotiating strength of the worker and employer. A worker’s capacity to command higher remuneration will be greater the scarcer his or her particular skills. The working arrangement preferred could be an employee role or self-employment (box 2.4).
What might affect a worker’s preferences for different FOWs?
Alternative FOWs provide different levels of security, flexibility and autonomy across job characteristics such as the number and timing of hours worked, employment duration and how a job is performed.
Although individuals’ preferences across these characteristics will differ, it is also likely that individuals’ preferences for different FOWs will change over their lifetime. Furthermore, people who share similar characteristics, which are not necessarily related to the life cycle (such as having a disability), might prefer similar FOWs.
The following discussion assumes ‘other things equal’. That is, in considering the potential effects of any factor on a person’s preferred FOW, other potential influences are ignored. Furthermore, a mix of factors influence an individual’s

DETERMINANTS OF FORMS OF WORK
25
preferences (and, of course, as noted above, a person’s ability to achieve his or her preferred outcome might well be constrained).
Box 2.4 Decision to be self-employed or an employee In choosing the work arrangement that maximises wellbeing, people make the decision of whether to work for someone else or be self-employed. Douglas and Shepherd (2000) argue that a person is likely to choose a career path as either self-employed, as an employee, or a career based on a combination of the two, according to a range of factors, including his or her:
• income (which depends on his or her ability)
• working conditions, such as decision-making control, risk exposure, required work effort and other occupation-related conditions.
Other things equal, people are more likely to prefer self-employment:
• the higher their managerial and entrepreneurial ability
• the lower their aversion to work effort — as the self-employed are likely to have to work harder, on average
• the lower their level of risk aversion — as self-employment is likely to be riskier than being employed
• the higher their preference for autonomy and decision-making control (Douglas and Shepherd 2000).
Life cycle influences
Young people in education are likely to prefer roles that enable them to balance study and work commitments. As mentioned above, permanent employee roles usually involve agreed, regular hours. Students might, therefore, prefer casual employment or labour hire work as these FOWs provide the option of declining work, and working irregular or unsocial hours, such as weekends, that complement their class schedule.
Non-permanent FOWs and part-time permanent work might also be preferred by students, and young people generally, looking to transition from study and part-time work into full-time permanent work. Some students take on casual employment or labour hire work, for example, to gain the experience and skills required to gain permanent work in the future (Gaston and Timcke 1999). Hence, increases in participation in education among young people could be associated with an increase in the supply of workers to these FOWs.

26 FORMS OF WORK
For adults aged 25–54 years, financial commitments (such as mortgage repayments) and the need to balance work and non-work commitments (associated with caring for children, for example), are likely to influence their FOW preferences. Where financial commitments are more important, FOWs that provide relatively greater income security, such as full-time permanent work, are likely to be preferred. Permanent work (full-time and part-time) may also be preferred where a need to balance work and other commitments requires predictable and stable hours. Where flexibility to work around non-work commitments is more important, self-employment, such as contracting roles, might be preferred as the worker has relatively more control over his or her hours of work. Casual employment and labour hire work could also be preferred due to the relative flexibility of hours, including greater opportunity to turn down shifts. These FOWs might also be important for helping people with families to transition in or out of full-time permanent work (Romeyn 1992). Preferences for flexibility and security are likely to vary as children age (Watson et al. 2003). For example, the costs of raising children increase as they age (Drago, Wooden and Black 2009), possibly meaning that parents’ preferences for income security also change as children age. In addition, younger children require more care. Parents might, therefore, require relatively more flexibility (Watson et al. 2003), and prefer part-time permanent or casual employee roles, to manage care outside of child care and school hours.
Some studies suggest that older people nearing retirement tend to favour non-permanent FOWs, such as fixed-term, casual, labour hire and contracting, or part-time permanent work, in the course of transitioning out of the workforce (Borland 2005; Buddelmeyer, Wooden and Ghantous 2006). Shorter-term (and perhaps part-time) work assignments such as casual fixed-term employment, or labour hire work, can allow a person to combine paid and unpaid activities more flexibly. If this is the case, an increasing employment share of older workers would be associated with an increase in these FOWs.
Other influences
People’s preferences for autonomy vary. Some place a high value on being their own boss, while others prefer to avoid the responsibility and risks that it entails. For the former, FOWs such as contracting roles and other self-employment are likely to be preferred.
People also vary in their preferences for changing jobs. Some place a high value on variety and might, as a result, be more attracted to contracting, fixed-term or labour hire roles.

DETERMINANTS OF FORMS OF WORK
27
Cultural and family influences can also influence the FOW chosen. For example, workers whose family members are self-employed might be more likely to consider self-employment over other FOWs (Evans and Sikora 2004).
People with a disability or with other health issues might prefer FOWs that provide greater levels of flexibility, such as casual employment, or alternatively, the predictability of part-time permanent employee roles (Schur 2003).
Labour market conditions are also likely to play a role in workers’ preferences over FOWs. Job mobility involves costs — for example, in searching for a new role and, potentially, lower remuneration (if job change is involuntary). These costs of locating a job are likely to be lower when unemployment rates are low and labour markets strong. Workers might, therefore, have a weaker preference for permanent employee roles when labour markets are strong.
The risks in establishing a small business are also likely to be lower when the economy is stronger. Workers might, therefore, be more willing to take on the risks associated with self-employment when the economy is buoyant (Rampini 2004). On the other hand, faced with a weak labour market and higher levels of unemployment, workers might establish a small business rather than not work at all. In this case, as the economy improves some of these workers might opt for employee roles (Meager 1992). These competing influences can make it difficult to determine the relationship between the strength of the economy and entry into self-employment.
How do the financial benefits of employment differ by FOW?
Regulatory settings mean that the remuneration (wages and other conditions) and the tax treatment of income and expenses received by workers can differ across FOWs.
Wages and other conditions
Awards and agreements set, among other things, a base hourly rate of pay for all employees of a given type. In addition, permanent and fixed-term employee roles are associated with a range of non-wage benefits, while casual employees receive a wage loading (box 2.2).
The casual loading could lead some people to prefer casual employment over other FOWs. Whether or not this is the case depends on how a person values the various conditions attached to permanent and fixed-term employee roles relative to the

28 FORMS OF WORK
casual loading paid in lieu of other entitlements. For example, where people value extra income over access to leave they might prefer casual employment, as it provides higher current income, all else equal. Where people place a higher value on non-pecuniary employment conditions, such as job security and predictable hours, they are likely to prefer permanent and fixed-term employee roles.
As discussed in section 2.2, in theory, contractors’ fees (net of the returns to their capital and business acumen, and the value that they place on self-employment over working as an employee) should reflect the wages and conditions that they would receive if engaged in an equivalent role as an employee.
Taxes
Where a person has a family, the decision to work will be influenced by the impact of his or her potential earnings on his or her family’s income net of taxes and transfers. For example, second-income earners in Australia can face high effective marginal tax rates (Apps and Rees 2005). But income taxes apply regardless of whether income is earned, for example, in a permanent employee role or through self-employment. The impact on family income, net of taxes and transfers, should be similar.
That said, independent contractors who satisfy certain requirements are taxed as businesses and are, therefore, able to claim a range of tax deductions that are not available to employees. Under the New Business Tax System (Alienation of Personal Services Income) Act 2000 (Cwlth), to be classified as a personal services business for tax purposes a person must either satisfy the ‘results test’,13 or show that he or she does not receive 80 per cent or more of his or her income from one client, and either:
• receives income from two or more unrelated clients
• has employees or apprentices
• has business premises separate from those of his or her employers (The Board of Taxation 2009).
13 To satisfy this test, a worker must produce a contracted outcome before being paid, provide
plant and equipment or tools of the trade, and be liable for rectification of any defects in work performed (ATO 2008).

DETERMINANTS OF FORMS OF WORK
29
The personal services income of an independent contractor who does not meet these requirements is taxed in accordance with the personal services income rules.14 These rules, introduced through the Alienation of Personal Services Income Act:
… are designed to improve the integrity of the tax system by addressing both the capacity of individuals and interposed entities providing the personal services of an individual to claim higher deductions than employees providing the same or similar services. (Australian Government 2000, p. 3)
In theory, therefore, tax arrangements should not provide an incentive for a person earning personal services income in a manner similar to an employee to prefer employment as an independent contractor. However, a review of the Alienation of Personal Services Income Act found that it had gone some way towards improving the tax system, but had not been successful in ensuring equity in tax treatment of personal services income, and that there was evidence of a low level of compliance with the personal services income rules (The Board of Taxation 2009, pp. 1–2).
Tax considerations might have led some workers to prefer employment as independent contractors rather than as employees. However, the extent of the problem is contested, with varying views put to The Board of Taxation as to how effective the tax rules are, and how much tax issues impact on the number of contractors (The Board of Taxation 2009, pp. 19-20). The ATO considers that personal services income is a low risk to revenue (The Board of Taxation 2009, p. 7). The Henry Tax Review (Australian Government 2010) recommended tightening and broadening the rules relating to personal services income, but the proposed changes have not been implemented.
2.4 Summary
The prevalence of different FOWs observed in a labour market reflects the interaction of demand and supply for each type of working arrangement, mediated by institutional factors. The outcome is the result of firms seeking the most cost-effective means of producing output, and workers maximising their own wellbeing. Many factors influence employer and worker decisions. The relative bargaining strengths of employers and workers, which may vary across FOWs, can influence whether a FOW is driven more by demand or supply side factors (PC 2006). That said, it is possible to identify the circumstances under which certain FOWs are more likely to be observed.
14 Personal services income ‘is income that is mainly (more than 50%) a reward for the skills,
knowledge, expertise or efforts of the individuals who performed the services’ (ATO 2010).

30 FORMS OF WORK
Other things equal:
• employers are likely to prefer independent contractors for roles where the labour need is irregular or short-term, especially if the independent contractors supply equipment and/or specialist skills that a firm does not need on an ongoing basis. People with a preference for autonomous work might prefer to work as an independent contractor rather than as an employee
• permanent employees are likely to be preferred by firms for roles where the demand for labour services is predictable, especially if higher-level skills are required. People who place a high value on stability in hours worked and job security might prefer permanent employee roles to other FOWs
• fixed-term employees are likely to be preferred by employers for roles similar to those for which permanent employees are preferred, but with the distinction that the task for which labour is needed is limited by a definable period or event. People are likely to prefer a fixed-term employee role if they enjoy the certainty of a known end date for a job, or they prefer changing jobs reasonably frequently, but do not want to be self-employed
• employers are likely to prefer casual employees where labour demand is irregular or short term, skill and training requirements are low and where future labour needs are uncertain. Casual employees are more likely to be employed in smaller enterprises. People who prefer more flexible hours, with the option to decline working, might prefer casual work to other FOWs
• labour hire workers are likely to be preferred by employers for similar roles to casual employees, and especially in firms that do not have a pool of casual employees to call on or are too small to warrant having their own human resources department. People who require flexibility in the hours they work and/or prefer variety in the jobs that they undertake might prefer labour hire work
• workers are likely to prefer self-employment: the higher their managerial and entrepreneurial ability; the lower their aversion to work effort and risk; and the higher their preference for autonomy.
Possible linkages between changes in demand, supply and institutional factors and the prevalence of different FOWs are summarised in the course of analysing prevalence changes (chapter 4).

PREVALENCE OF FORMS OF WORK
31
3 The prevalence of forms of work
In the twenty years to 2001, the prevalence of different forms of work (FOWs) in Australia changed markedly. But as the data presented in this chapter show, the trends over that period did not continue into the 2000s. The most notable change in the decade to 2011 was a small increase in the prevalence of permanent employees — offset by a decline in the share of the workforce that was self-employed in unincorporated enterprises.
Changes in the prevalence of the following FOWs are described in this chapter:
• permanent employees
• casual employees
• fixed-term employees
• labour hire workers
• owner managers, including independent contractors, other business operators and owner managers of incorporated enterprises (OMIEs) and of unincorporated enterprises (OMUEs).15
In some instances, data used in the analysis do not precisely represent the FOWs of interest, and proxy measures are adopted. In particular, the ABS measures of employees with and without leave entitlements are used as proxies for permanent and casual employees, respectively (box 3.1).
Section 3.1 describes the longer-run (30 year) changes in FOWs. Prevalence changes over the decade to 2011 are then described in more detail (section 3.2) and a summary of the main findings concludes the chapter (section 3.3). Information on the data sources underlying the estimates presented is located in appendix A, and appendix B contains more detailed information about the prevalence changes presented in this chapter.
15 A distinction is not drawn between part- and full-time work in describing prevalence changes
because the focus of the study is on the conditions and entitlements for each FOW, not hours worked. Changes in the patterns of hours worked by FOW are discussed in chapter 4.
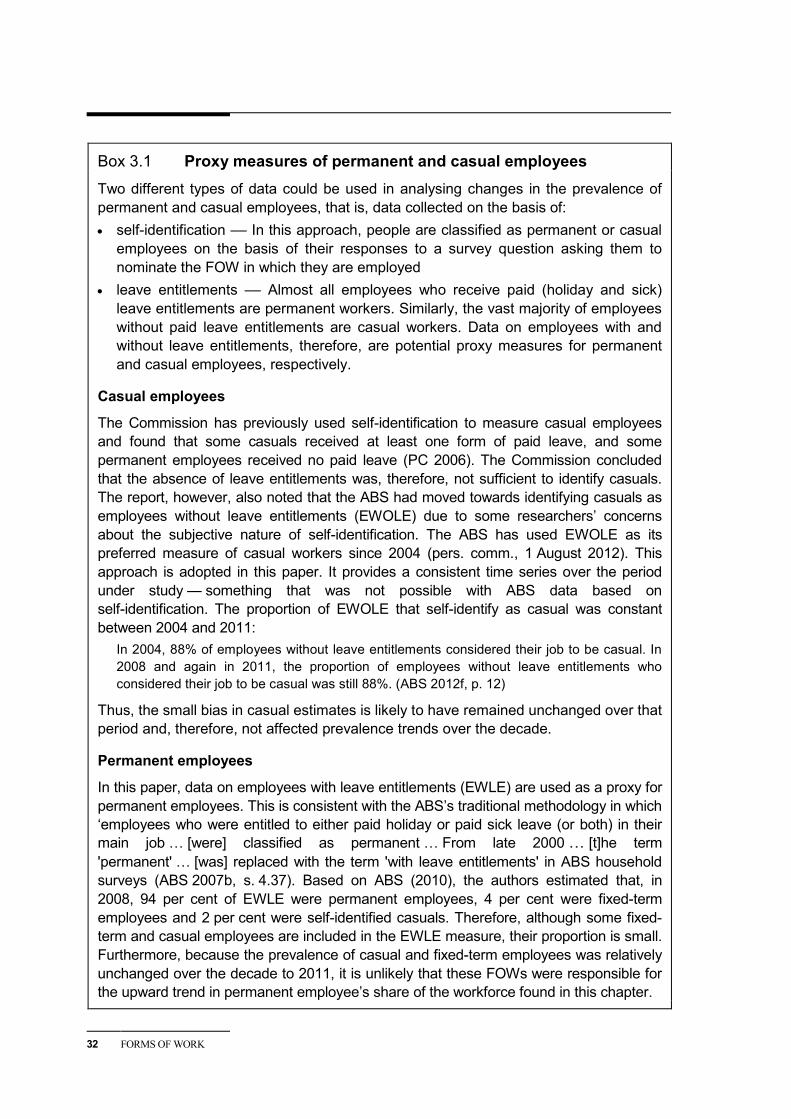
32 FORMS OF WORK
Box 3.1 Proxy measures of permanent and casual employees Two different types of data could be used in analysing changes in the prevalence of permanent and casual employees, that is, data collected on the basis of: • self-identification –– In this approach, people are classified as permanent or casual
employees on the basis of their responses to a survey question asking them to nominate the FOW in which they are employed
• leave entitlements –– Almost all employees who receive paid (holiday and sick) leave entitlements are permanent workers. Similarly, the vast majority of employees without paid leave entitlements are casual workers. Data on employees with and without leave entitlements, therefore, are potential proxy measures for permanent and casual employees, respectively.
Casual employees
The Commission has previously used self-identification to measure casual employees and found that some casuals received at least one form of paid leave, and some permanent employees received no paid leave (PC 2006). The Commission concluded that the absence of leave entitlements was, therefore, not sufficient to identify casuals. The report, however, also noted that the ABS had moved towards identifying casuals as employees without leave entitlements (EWOLE) due to some researchers’ concerns about the subjective nature of self-identification. The ABS has used EWOLE as its preferred measure of casual workers since 2004 (pers. comm., 1 August 2012). This approach is adopted in this paper. It provides a consistent time series over the period under study — something that was not possible with ABS data based on self-identification. The proportion of EWOLE that self-identify as casual was constant between 2004 and 2011:
In 2004, 88% of employees without leave entitlements considered their job to be casual. In 2008 and again in 2011, the proportion of employees without leave entitlements who considered their job to be casual was still 88%. (ABS 2012f, p. 12)
Thus, the small bias in casual estimates is likely to have remained unchanged over that period and, therefore, not affected prevalence trends over the decade.
Permanent employees
In this paper, data on employees with leave entitlements (EWLE) are used as a proxy for permanent employees. This is consistent with the ABS’s traditional methodology in which ‘employees who were entitled to either paid holiday or paid sick leave (or both) in their main job … [were] classified as permanent … From late 2000 … [t]he term 'permanent' … [was] replaced with the term 'with leave entitlements' in ABS household surveys (ABS 2007b, s. 4.37). Based on ABS (2010), the authors estimated that, in 2008, 94 per cent of EWLE were permanent employees, 4 per cent were fixed-term employees and 2 per cent were self-identified casuals. Therefore, although some fixed-term and casual employees are included in the EWLE measure, their proportion is small. Furthermore, because the prevalence of casual and fixed-term employees was relatively unchanged over the decade to 2011, it is unlikely that these FOWs were responsible for the upward trend in permanent employee’s share of the workforce found in this chapter.

PREVALENCE OF FORMS OF WORK
33
3.1 Changes in forms of work over the 30 years to 2011
Data are not available for all of the FOWs analysed in this report over a thirty-year time frame, but series for broad FOWs can be derived. These series reveal marked changes in the mix of FOWs in the three decades to 2011 (figure 3.1). Between 1982 and 2011 the share of casuals in employment doubled and that of permanent employees decreased. Among owner managers, the likelihood of running an incorporated enterprise rose, while self-employment in unincorporated enterprises became less prevalent. (As discussed in chapter 1, it is likely that the shares in employment of labour hire workers and independent contractors were also higher in 2011 than in 1982.)
Figure 3.1 Major types of employment, 1982 to 2011a, b Share of workforce
a Data are for a worker’s main job. Employee data exclude OMIEs. b A number of assumptions underlie the derivation of these time series (for more detail refer to appendix J, which is only available on the Commission’s website for this paper). The data should be viewed as indicative of changes in these FOWs over the past 30 years.
Source: Table B.1.
However, most of these changes in the structure of employment by broad FOW occurred prior to 2001. Over the decade to 2011, there was a relatively small increase in the prevalence of permanent employees, mirrored by a decline in the employment share of small business operators (OMUEs).16 Casual employees and
16 About half of the change in the prevalence of OMUEs was attributable to those who employ
others, and the other half attributable to those who work alone. However, because the latter group
0
10
20
30
40
50
60
70
80
Permanent Casual OMIE OMUE
1982 1986 1991 1996 2001 2006 2011
Per c
ent

34 FORMS OF WORK
self-employment in incorporated enterprises (OMIEs) were no more prevalent in 2011 than they were in 2001. That said, the number of people employed in each of the FOWs represented in figure 3.1 increased (although for OMUEs, the change was very small).
The relatively small changes over the decade to 2011 were not a reflection of a static labour market (figure 3.2). Employment grew by 25 per cent, and the level of net job creation (2.3 million additional workers) was almost as large as in the preceding two decades (2.6 million). Possible explanations for the patterns of change in employment by FOW during the 2000s are discussed in chapter 4.
Figure 3.2 Employment by form of work, 2001 and 2011 Thousands
Sources: ABS (2001: Australian Labour Market Statistics, Cat. no. 6105.0; 2011: Employee Earnings, Benefits and Trade Union Membership, Cat. no. 6310.0, Labour Force, Australia, Detailed, Cat. no. 6291.0.55.001)
3.2 Changes in forms of work over the decade to 2011
A number of data sources were used to gain insights into changes in the prevalence of different FOWs over the decade to 2011.17
is a larger share of OMUEs, the prevalence decline was relatively smaller for this group (appendix B).
17 A comparison of estimates from alternative sources is presented in appendix B. Each source yields similar conclusions about the directions of change in the prevalence of different FOWs.
1 240
610
1 790 5 360
2001
OMUE OMIE Casual Permanent
1 290
720
2 250 7 020
2011
OMUE OMIE Casual Permanent

PREVALENCE OF FORMS OF WORK
35
Permanent employees
The prevalence of permanent employees increased between 2001 and 2011 (by about 3 percentage points), but the growth path was not smooth (figure 3.3). While the prevalence of permanent employees was unchanged in the early years of the decade, it increased from about 2004 onwards.
Figure 3.3 Prevalence of permanent employees, 2001 to 2011a, b, c Share of workforce
a Data from the Forms of Employment (FOE) survey are not available for all workers pre-2004. Data from the Employee Earnings, Benefits and Trade Union Membership (EEBTUM) survey are, therefore, used to illustrate prevalence in this period. b It is unclear why the 2008 and 2009 estimates from the EEBTUM survey are statistically different from those from the FOE survey. Inspection of the EEBTUM data for 2008 and 2009, however, suggests that the estimates in these years might be less reliable than the FOE survey estimates. c Error bars indicate the 95 per cent confidence intervals.
Source: Table B.2.
Casual employees
The prevalence of casual employees was similar in 2001 and 2011, although it was not constant across the decade (figure 3.4). As noted above, the prevalence of casuals grew rapidly in the two decades to 2001. In the early 2000s the prevalence of casuals employees continued to rise, albeit much more slowly. The small increases in the earlier part of the decade were reversed in the latter, with some authors (for example, Howe et al. 2012) suggesting that casual employees’ share of the workforce might have peaked during the 2000s.
57
58
59
60
61
62
63
64
2001 2002 2003 2004 2005 2006 2007 2008 2009 2010 2011
Per c
ent
EEBTUM FOES

36 FORMS OF WORK
Figure 3.4 Prevalence of casual employees, 2001 to 2011a, b, c, d
Share of workforce
a To create a consistent time series, data from the Forms of Employment (FOE) survey for 2008 to 2011 include employees reclassified by the ABS as independent contractors. b Data from the FOE survey are not available for all workers pre-2004. Data from the Employee Earnings, Benefits and Trade Union Membership (EEBTUM) survey are, therefore, used to illustrate prevalence in this period. c The ABS was unable to explain the differences between prevalence estimates from the two surveys. d Error bars indicate the 95 per cent confidence intervals.
Source: Table B.3.
Just when the prevalence of casual employees peaked depends on the data source used. Based on the ABS Employee Earnings, Benefits and Trade Union Membership survey, Howe et al. (2012) find that the proportion of employees working as casuals increased to 2004, before declining slightly. In contrast, using data from its Forms of Employment survey, the ABS (2012f, p. 11) reported a peak in 2007:18,19
The proportion of casuals reached a peak of 21% of all employed persons (2.2 million casuals and 10.4 million employed persons) in 2007, and now sits at 19% of all employed persons (2.2 million casuals and 11.4 million employed persons) in 2011.
Given the small changes in the prevalence of casual employees across years (and for estimates across different surveys) since 2001, it is difficult to nominate a particular year that casual employee’s share of total employment might have peaked. When the 10 years to 2011 are considered in the context of earlier periods of growth, what is apparent is that the rapid growth in casual employment in the 1980s and 1990s did 18 There are small differences between the estimates of casuals presented in figure 3.2 (using ABS
data) and those reported by the ABS. This arises because of a different treatment for some workers. See appendix B for more details on estimates presented in this chapter.
19 Data from the HILDA survey suggests a different peak again, occurring in 2002 (table B.3).
17.5
18.0
18.5
19.0
19.5
20.0
20.5
21.0
21.5
2001 2002 2003 2004 2005 2006 2007 2008 2009 2010 2011
Per c
ent
EEBTUM FOES

PREVALENCE OF FORMS OF WORK
37
not continue in the 2000s. In the decade to 2011 casual employment grew at a rate broadly similar to that of the workforce.
Owner managers
The number of OMIEs expanded at about the same rate as employment during the 2000s, keeping the prevalence of this FOW reasonably stable at about 6.5 per cent (figure 3.5).
Figure 3.5 Prevalence of OMIEs, 2001 to 2011a, b Share of workforce
a Error bars represent the 95 per cent confidence interval. b Prior to 2008, OMIE estimates in the ABS catalogue Australian Labour Market Statistics were sourced from a combination of the Employee Earnings, Benefits and Trade Union Membership (EEBTUM) survey and the Labour Force Survey (LFS) in August of each year. Post 2007, they were sourced from the Forms of Employment (FOE) survey, which is collected in November. To retain a series based on the August LFS, OMIE estimates from the EEBTUM survey are used for years post 2007.
Source: Table B.6.
5.6
5.8
6.0
6.2
6.4
6.6
6.8
7.0
7.2
2001 2002 2003 2004 2005 2006 2007 2008 2009 2010 2011
Per c
ent

38 FORMS OF WORK
In contrast, there was a marked decrease in the prevalence of OMUEs across the decade to 2011 (figure 3.6). This trend continued in 2012 and amounted to a fall in prevalence of 3 percentage points in the ten years to August 2012.20 Possible explanations for this outcome are considered in chapter 4.
Figure 3.6 Prevalence of OMUEs, 2001 to 2012a
Share of workforce
a Error bars represent the 95 per cent confidence interval.
Source: Table B.7.
Other forms of work
There was no trend in the prevalence of fixed-term employees between 2001 and 2011 (table B.4).
The proportion of workers who reported receiving their pay from a labour hire firm or employment agency remained low across the decade (1 to 2 per cent of employment), and the evidence suggests a slight fall in the prevalence of this FOW (table B.5). Other studies report a higher rate of labour hire employment when measured as the percentage of workers who obtained their jobs through labour hire firms or employment agencies (about 5 per cent according to Howe et al. (2012)). In this study, however, the focus is on workers’ current FOW, not the pathway through
20 Data for 2012 are presented for OMUEs, but not other FOWs in this chapter, because 2012 data
were only available for OMUEs.
10.0
10.5
11.0
11.5
12.0
12.5
13.0
13.5
14.0
14.5
2001 2002 2003 2004 2005 2006 2007 2008 2009 2010 2011 2012
Per c
ent

PREVALENCE OF FORMS OF WORK
39
which they were recruited. The preferred measure of labour hire workers, therefore, is based on where the responsibility for paying a worker lies.
Available data on independent contracting indicate that this FOW made up 9 to 10 per cent of the workforce between 2008 and 2011 (table B.8), with no particular trend in prevalence over this period. The share of other business operators in employment fell slightly between 2008 and 2009 (from 10 to 9 per cent) and was then stable to 2011. Is it likely that the decline in the prevalence of OMUEs over the decade to 2011 reflected prevalence falls for both independent contractors and other business operators. More detail on this point is presented in appendix C.
3.3 Summary
Australians work under many arrangements, and the mix of these FOWs has changed over time.
The prevalence of a number of FOWs that were less common at the start of the 1980s increased over the following 20 years. Most significantly, the share of casual employees in the workforce doubled to 20 per cent over this period. Although the historical prevalence of some FOWs (including labour hire workers and independent contractors) is not easily measured, it is likely that these FOWs also expanded at a faster rate than overall employment. Evidence suggests that this was certainly the case for labour hire workers and independent contractors during the 1990s. Conversely, the employment of permanent employees grew more slowly.
In contrast with earlier periods, the share of the workforce not in permanent employee roles declined somewhat in the decade to 2011 — primarily because of a decrease in the prevalence of OMUEs. Although not large, the increased prevalence of permanent employees that accompanied the 2.5 to 3 percentage point fall in the prevalence of OMUEs, signalled a noticeable change in work trends.
The findings indicate that the relatively rapid growth in a number of FOWs –– including casual employees, labour hire workers and independent contractors –– in previous decades has not continued in recent years. The share of workers in these FOWs (and fixed-term employees) was relatively stable between 2001 and 2011. Although employment in most FOWs grew in absolute terms over the decade to 2011, only the prevalence of permanent employees was higher at the end of the decade than at the start. Chapter 4 outlines possible reasons for the observed changes in the prevalence of FOWs over the decade to 2011.


EXPLAINING PREVALENCE CHANGES
41
4 Why might the prevalence of different forms of work have changed?
The 2000s have been described as a ‘quiet’ decade for the Australian labour market: [Labour market] [o]utcomes … were not sufficiently strong to excite great interest or attention, nor sufficiently weak to arouse major concern. No substantial increase in unemployment occurred, there were no big disputes about the appropriate theory for understanding labour market activity, and changes to labour market policy for the most part involved tinkering rather than rebuilding. In all these ways, the 2000s were very different to the decades that came before. (Borland 2011, p. 165)
As discussed in chapter 3, the 2000s were also a relatively quiet time for different forms of work (FOWs). But the relatively small change that did occur — a rise in the prevalence of permanent employees — reversed an earlier trend.
Notwithstanding this relative quiet, the labour market in the 2000s was not static. Employment grew more rapidly than in the preceding 20 years — a reflection of the strength of the economy over much of the decade — and the profile of net jobs created was quite different from the profile of employment in 2001. (Throughout this chapter, the term ‘jobs’ is used synonymously with employment.21)
A range of institutional changes over the decade potentially affected the labour market, including the introduction of:
• the Workplace Relations Amendment Act 2005 (Cwlth) and Fair Work Act 2009 (Cwlth)
• transition-to-retirement arrangements (Superannuation Industry (Supervision) Amendment Regulations 2005)
• measures to increase labour force participation, for example, changes in pension age eligibility and the right to request part-time work for parents returning from parental leave
21 In practice, the number of jobs in the economy differs from the level of employment to the
extent that people work in multiple jobs. Data presented in this report relate to ‘main job’ only, that is, the job in which a person works the most hours.

42 FORMS OF WORK
• strategies to increase education levels, for example, the Our Universities — Backing Australia’s Future (2003–04 Commonwealth budget) and Education Revolution (2008-09 Commonwealth budget) initiatives.
Results from quantitative analysis of possible links between changes in economic and labour market conditions and the prevalence of different FOWs are presented in this chapter. Possible effects of changes in institutional settings on the results are discussed where relevant.
A description of economic conditions and changes in the labour market over the decade to 2011 opens discussion (section 4.1). Drawing on the framework presented in chapter 2, hypotheses about how the prevalence of different FOWs might have changed given developments in the economy and labour market are advanced (section 4.2). The technique used to test those hypotheses is then described (section 4.3), and results from the analysis are presented (section 4.4). Possible explanations for observations from this research (section 4.5) and directions for future research (section 4.6) close the chapter.
4.1 Changes in the labour market over the 2000s
A strong economy and labour market
Reflecting the mining boom and strong terms of trade, the Australian economy grew more rapidly, on average, during the 2000s than in the preceding two decades (figure 4.1).
Although average annual growth in real gross domestic product was lower than during the 1990s, this measure of economic activity only captures changes in the volume of output produced in Australia. During the mid-2000s and post the global financial crisis (GFC) (from late 2009 to late 2011), export prices rose substantially relative to import prices (that is, the terms of trade increased), meaning that, for any given volume of exports, the income earned by Australian producers, and the volume of imports that could be purchased, also rose. The real purchasing power of the Australian economy increased. This increase in the strength of the economy is captured in real gross domestic income, a measure that reflects gross domestic product adjusted for terms of trade changes (Zhang et al. 2006).
Growth as measured by changes in real gross domestic income was particularly strong between 2003 and 2008, fell substantially during the GFC, and rebounded in 2011.

EXPLAINING PREVALENCE CHANGES
43
Figure 4.1 Growth in real gross domestic income, 1981-82 to 2010-11
Source: ABS (Australian System of National Accounts, Cat. no. 5204.0).
In addition to strong growth in real gross domestic income, the cost of labour to producers (real unit labour costs) fell across much of the decade (until 2009) (ABS 2012b).22,23 This supported annual average increases in employment substantially above the levels of the preceding two decades:
The above-average growth of employment through most of the past decade was assisted by falling real unit labour costs, which boost the share of national income going to profits and thereby increase the profitability of expanding and employing more labour. (Mitchell 2012, p. 1)
Unemployment rates also fell markedly (figure 4.2).
Consistent with the trends in economic growth, business sentiment was positive for much of the decade, and was particularly strong between 2003 and 2008 (ACCI 2013; NAB 2013). Furthermore, the long spell of strong employment growth and low unemployment rates contributed to increases in labour scarcity. The availability of suitably qualified staff remained the first or second most binding constraint on business investment in quarterly surveys of firms between the middle of 2004 and early 2009 (ACCI, various dates). Another indicator of labour market strength — job vacancies — reached record levels during the decade, and the ratio of vacancies to
22 Unit labour costs capture the average labour cost to producers of producing a unit of output.
They are defined as average labour costs divided by average labour productivity (ABS 2012b). 23 Although real labour costs fell, real wages did not (Parham forthcoming). This outcome
reflected more rapid growth in producer prices (used to calculate real unit labour costs) than consumer prices (used to calculate real wages).
-4
-2
0
2
4
6
8
Per c
ent p
er a
nnum
Real gross domestic income
Annual average real gross domesticincome

44 FORMS OF WORK
employment increased sharply from the middle of 2003, and remained well above the average of the preceding two decades for the rest of the 2000s (ABS 2012h, 2013a).
Figure 4.2 Employment growth and the unemployment rate, 1981 to 2011
Source: ABS (Labour Force, Australia, Detailed, Cat. no. 6291.0.55.001).
Overall, employment grew by 25 per cent, or 2.3 million people, between 2001 and 2011 (ABS 2012h).
The profile of net jobs added to the economy
Job growth by state
Due to the mining boom, the mining states (Queensland, Western Australia and the Northern Territory) accounted for a disproportionate share of the increase in employment. Accounting for about 30 per cent of Australian workers in 2001, these states were responsible for 40 per cent of the increase in employment over the decade to 2011 (figure 4.3).24 The relatively rapid employment growth in the mining states that drove this outcome occurred consistently across the decade (with the exception of 2009).
24 The term ‘states’ is used throughout as shorthand for states and territories.
0.0
0.5
1.0
1.5
2.0
2.5
3.0
0
2
4
6
8
10
12
Per c
ent
Per c
ent
Unemployment rate (LHS)Average annual employment growth 1981–01 (RHS) Average annual employment growth 2001–11 (RHS)

EXPLAINING PREVALENCE CHANGES
45
Figure 4.3 Shares of employment in 2001 and net job growth between 2001 and 2011, mining and non-mining statesa Per cent
a The mining states are defined to include Queensland, Western Australia and the Northern Territory. Other states make up the non-mining group.
Source: ABS (Labour Force, Australia, Cat. no. 6202.0).
Job growth by industry
The construction; professional, scientific and technical services; and health care and social assistance industries accounted for about one quarter of employment in 2001, but were the source of nearly half (46 per cent) of all net jobs created (figure 4.4). Manufacturing and retail, the two largest employers in 2001 (11.6 and 11.4 per cent of employment, respectively), contributed only 5 per cent to net jobs created. Retail accounted for 8.5 per cent of net jobs created, and manufacturing employment shrank by close to 8 per cent. Mining had an employment share of about 1 per cent in 2001 and was the source, directly, of 6 per cent of job growth. (Indirectly, the contribution of the mining sector to employment growth through other industries like construction, was higher again (Rayner and Bishop 2013). Employment fell in absolute terms in agriculture.
30
70
Mining statesNon-mining states
Employment shares, 2001
42
58
Mining statesNon-mining states
Shares of net job growth, 2001 to 2011

46 FORMS OF WORK
Figure 4.4 Shares of employment in 2001 and net job growth between 2001 and 2011, by industrya Per cent
a The top three industries are defined as those that were the largest contributors to net job creation over the decade to 2011 — construction; professional, scientific and technical services; and health care and social assistance.
Source: ABS (Labour Force Australia, Detailed, Cat. no. 6291.0.55.003).
Job growth by occupation
Job growth also favoured the more skilled workers. Nearly half of the jobs added to the economy were in managerial or professional roles (occupational groups that accounted for about one third of 2001 employment) (figure 4.5).25 Lower-skilled jobs in sales, machinery operator and driver, and labouring occupations accounted for less than 20 per cent of net job growth in contrast with nearly 30 per cent of employment in 2001. The relatively fast growth of higher-skilled occupations occurred reasonably consistently across the decade.
25 In the data underlying the figure, an individual is assigned to an occupational category within
the Australian and New Zealand Standard Classification of Occupations (ANZSCO) on the basis of the characteristics of his or her job, not his or her skills, per se. However, given the nature of the classification, the correlation between an individual’s skills and the occupation in which he or she works is likely to be strong. ANZSCO is a skill-based classification of occupations (ABS 2009), in which both the skill level and specialisation required to competently perform a job are taken into account in determining its location within the classification.
24
76
Top three industriesOther industries
Employment shares, 2001
46 54
Top three industriesOther industries
Shares of net job growth, 2001 to 2011

EXPLAINING PREVALENCE CHANGES
47
Figure 4.5 Shares of employment in 2001 and net job growth between 2001 and 2011, by occupationa Per cent
a Skill groups are defined to include Australian and New Zealand Standard Classification of Occupations (ANZSCO) categories as follows: higher skilled — managers and professionals; middle skilled — technicians and trade workers; community and personal services workers; and clerical and administrative workers; and lower skilled — sales workers; machinery operators and drivers; and labourers.
Source: ABS (Labour Force Australia, Detailed, Cat. no. 6291.0.55.003).
Job growth by gender and full- and part-time hours worked
Net jobs created were more likely to be part time than was the case before 2001. Part-time workers made up nearly 30 per cent of the workforce in 2001, but nearly 40 per cent of the net jobs added to the economy over the decade were performed by people who worked part time in 2011 (figure 4.6). Relatively fast growth of part-time employment was much more a characteristic of non-mining state labour markets.
Employment of females grew slightly more quickly than that of males. Accordingly, in 2011, females occupied 50 per cent of the jobs added to the economy, in contrast with an employment share in 2001 of about 45 per cent.
32
40
29
Higher skilledMiddle skilledLower skilled
Employment shares, 2001
46
37
18
Higher skilledMiddle skilledLower skilled
Shares of net job growth, 2001 to 2011

48 FORMS OF WORK
Figure 4.6 Shares of employment in 2001 and net job growth between 2001 and 2011, by hours workeda Per cent
a Part-time workers are defined as those who usually work less than 35 hours per week (ABS 2007b).
Source: ABS (Labour Force Australia, Detailed, Cat. no. 6291.0.55.001).
Job growth by workers’ age
Although workers aged 50 to 69 years made up just over 20 per cent of the workforce in 2001, half of the net jobs added to the economy were filled by people who were in this age cohort (figure 4.7). The share of workers aged 50 to 69 years in employment increased reasonably steadily from 21 to 27 per cent over the decade.
Relatively rapid employment growth among older workers partly reflected demographic change. The number of people aged 50 to 69 years grew roughly twice as quickly as the number aged 15 to 49 years. But labour force participation rates also rose more rapidly among Australians aged 50 to 69 years (up by about 9 percentage points to 62 per cent across the decade to 2011) (ABS 2012i). In contrast, participation rose much less among people aged 25 to 49 years (by about 2 percentage points to 83 per cent), and fell among people aged 15 to 24 years (by about 3 percentage points to 66 per cent). The latter outcome may have been a function of increases in education participation by younger Australians. Between 2001 and 2011, the share of people aged 15 to 19 years engaged in formal learning grew by 2 percentage points (to 79 per cent), and among people aged 20 to 24 years by 7 percentage points (to 41 per cent) (ABS 2012e).
20
8
25
48
Part-time female Part-time maleFull-time female Full-time male
Employment shares, 2001
25
13 25
37
Part-time female Part-time maleFull-time female Full-time male
Shares of net job growth, 2001 to 2011

EXPLAINING PREVALENCE CHANGES
49
Figure 4.7 Shares of employment in 2001 and net job growth between 2001 and 2011, by workers’ age cohort Per cent
Source: ABS (Labour Force Australia, Detailed, Cat. no. 6291.0.55.001).
Other characteristics of net job growth
Public sector employee numbers grew more slowly than employment overall across the decade. As a consequence, although public sector employees accounted for about 16 per cent of employment in 2001, they accounted for about 11 per cent of jobs added to the economy over the decade (ABS 2012a, 2012f).
There is some evidence that smaller firms made a disproportionate contribution to job creation across the decade. Available data suggest that the proportion of employing businesses with fewer than 20 employees rose slightly between 2003-04 and 2006-07 and did not change much between that year and 2010-11 (ABS 2007a, 2012d).
Finally, reflecting increases in migration over the decade to 2011, overseas born people were disproportionately represented in job creation, accounting for 40 per cent of net jobs added to the economy, significantly higher than their employment share in 2001 of 24 per cent (ABS 2012i).
21
61
18
50 to 6925 to 4915 to 24
Employment shares, 2001
49 39
12
50 to 6925 to 4915 to 24
Shares of net job growth, 2001 to 2011

50 FORMS OF WORK
4.2 Some hypotheses about the determinants of changes in the prevalence of different FOWs
In light of the framework presented in chapter 2, the data presented above support a range of hypotheses about how the prevalence of different FOWs might have changed between 2001 and 2011. (The following discussion assumes ‘other things equal’. That is, in discussion of each hypothesis, other potential explanations for observed prevalence changes are ignored.)
Positive business sentiment and reduced uncertainty about future economic conditions, particularly between 2003 and 2008, might have increased the likelihood of firms offering permanent employee roles. The strength of the economy meant that the probability of having to lay off workers, which would necessitate termination and redundancy payments, was lower.
Labour scarcity, reflected in the prolonged spell of low unemployment and relatively high job vacancies, might have raised the probability of firms offering permanent employee roles (and, conversely, decreased the likelihood that they hired workers on a casual basis):
• with the expectation that employees would have to give notice — avoiding the costs of:
– reduced production (or overtime for existing staff) associated with hard-to-fill vacancies
– induction of new hires (because departing employees could do a ‘handover’, potentially reducing the time taken for new hires to become fully productive)
• to increase the horizon over which they could recoup the higher costs of hiring in a strong labour market.
From the perspective of workers, more buoyant economic conditions might have made some non-permanent employee roles, for example self-employment, more attractive. For example, the risks of business failure were possibly lower and the chances of finding employment in the case of failure higher. Conversely, to the extent that self-employment provides an alternative to unemployment during periods of slower economic growth, as economic conditions improved, the prevalence of self-employment would have been expected to fall. The relative weights and hence net impact of these two effects are difficult to ascertain.
Changes in the industry mix of employment (that is, structural change) would tend to increase (decrease) the prevalence of FOWs that were more prevalent in fast (slow) growing industries.

EXPLAINING PREVALENCE CHANGES
51
For example:
• relatively rapid net job creation in health care and social assistance — an industry in which permanent employees are relatively concentrated (table F.2), would have increased the prevalence of permanent employees
• relatively slow employment growth in industries in which consumer demand, and therefore, labour demand, is less predictable or regular (for example, retail), would have led to a decline in the prevalence of casual employment
• relatively fast growth in employment in industries with irregular labour demand, or which are characterised by a lot of project work and where workers often provide their own equipment (for example, construction), would have likely increased the prevalence of contractors
• the decline in employment in agriculture, an industry in which the self-employed are relatively concentrated, would have led to a decline in the prevalence of self-employment.
That said, although each FOW tends to be concentrated in particular industries (for example, casuals are relatively concentrated in retail and accommodation (table F.2)), each FOW appears in all industries. It is, therefore, difficult to determine, a priori, how structural change might have affected the overall prevalence of any FOW. The empirical analysis presented in section 4.4 provides some insight into this question.
In a similar vein to industries, changes in the distribution of employment between the public and privates sectors would alter the prevalence of FOWs that were relatively concentrated in each sector. As permanent employees tend to be relatively concentrated in the public sector, relatively slow employment growth in this sector would have contributed to a decline in the prevalence of this FOW.
Relatively fast growth of higher-skilled occupations (for example, due to technical change), could have led to an increase in the prevalence of permanent employees as firms sought to recoup the higher hiring and training costs associated with higher skilled positions. Conversely, FOWs that are more commonly used for roles with lower recruitment and training costs (for example, casuals), might have been expected to decline in prevalence as employment in lower-skilled occupations grew relatively slowly.
Relatively fast growth of part-time employment might have been due to people seeking to balance work and family commitments. To the extent that these workers were looking for predictable hours, an increase in the prevalence of part-time permanent employees might have been expected. Alternatively, if suitable part-time permanent hours were not available, or flexibility in working hours to accommodate caring responsibilities was more important to workers, an increase in the prevalence

52 FORMS OF WORK
of FOWs including casual arrangements and self-employment might have been expected. The stronger correlation between part-time employment and both casual roles and self-employment (table H.2) suggests that the latter outcome would be more likely.
The increasing prevalence of older workers might have been associated with a larger pool of workers employed in more flexible FOWs, including casual, self-employment, or part-time permanent employee roles, as part of a transition-to-retirement strategy. However, evidence suggests that older casual and self-employed workers are more likely than older permanent employees to report that their current job is part of a transition-to-retirement strategy (Buddelmeyer et al. 2006). These authors conclude that ‘[c]learly, both casual and self-employment lend themselves much more to being used as a vehicle for transiting gradually into retirement’ (p. 75). It might, therefore, be expected that these FOWs would have been more likely to increase in prevalence, compared with part-time permanent employees, due to the relatively rapid employment growth of older workers.
Also, as older workers are relatively concentrated in self-employment (table I.2), this FOW might have been expected to increase in prevalence with the ageing of the workforce.
If the employment share of smaller firms increased, it may have been expected to have led to an increase in the prevalence of casual, labour hire and independent contractor employment if these FOWs were associated with lower costs of administering employment arrangements.
It is difficult to hypothesise about the potential effects on FOWs from the disproportionate contribution of immigrants to net job creation. Although there is evidence that recently arrived immigrants in 2001 were more likely than the Australian-born population to be in casual employment, and less likely to work as permanent employees or OMUEs (box A.1), it is not clear that this would have been the case for immigrants in the decade to 2011. The share of permanent migrants entering Australia under the skilled migration program increased markedly over the decade, and there was relatively rapid growth in temporary entry under business long stay (subclass 457) visas (DIAC 2012). A priori, the impacts of immigration on FOWs are difficult to predict.
Possible effects of economic conditions and the characteristics of net job creation on the prevalence of different FOWs are summarised in table 4.1.

EXPLAINING PREVALENCE CHANGES
53
Table 4.1 Summary — possible effects of economic growth and the characteristics of net jobs created on FOWs
Permanent employees
Casual employees
Self-employed
Strong economy and labour market Change in the industry mix of employment, for example: relatively rapid job creation in health care and social assistance
relatively slow net job creation in retail relatively rapid net job creation in construction a fall in employment in agriculture Relatively rapid private sector job growth Increase in the skill profile of employment Relatively rapid part-time employment growtha
Increase in the employment share of older workersa Increase in the proportion of small employing businesses Relatively large representation of immigrants in job growth a As discussed in the preceding text, increases in the prevalence of casual work and self-employment were identified as the most likely outcomes of these characteristics of net job creation. If these outcomes did occur, the prevalence of permanent employees would fall.
4.3 Decomposing changes in each form of work
Ideally, analysis of possible explanations for changes in the prevalence of different FOWs would use multivariate techniques, which would allow for the potential effects of one factor to be tested while taking others into account. Unfortunately, the available data did not support this approach.26
Instead, shift–share analysis was adopted. This technique has the advantage that it permits assessment of the extent that the characteristics of net job creation, and associated changes in the profile of employment, contributed to changes in the prevalence different FOWs. On the other hand, it has the disadvantage that only one or two possible correlates of change in a FOW can be assessed at a time. Possible relationships between multiple correlates, and the relative contributions of different correlates to an outcome, cannot be tested. Although results from the shift–share analysis may be consistent with hypotheses about why prevalence changes occurred, they cannot be used to draw definitive conclusions. The results also provide an 26 For example, data on permanent employees were available only on an annual basis — providing
ten observations over the decade at a national level. Data on industry and occupation were available on a consistent basis for this FOW only until 2009, reducing the potential time series to eight observations. Even if the national data were disaggregated by state, the smaller jurisdictions would have had to have been aggregated — leading at most to a panel dataset with 40 observations.

54 FORMS OF WORK
indication of the types of variables that might be included if multivariate hypothesis testing could be done.
Using the shift-share technique, changes in the number of people employed under each FOW are decomposed into three components:
• A growth effect — which measures the extent to which employment in a FOW would have increased if job growth across the economy had simply replicated the profile of employment in 2001. If this had been the case, each FOW would simply have grown in step with employment overall, and its prevalence would not have changed.
• A share effect — which captures the effect of changes in the profile of employment driven by the characteristics of net job creation. This component reflects the extent to which employment in a FOW changed because a dimension of employment with which it was associated (for example, a particular industry or occupation) grew relatively quickly or slowly.
• A shift effect — which reveals how much of the change in a FOW occurred because it grew more rapidly or slowly than other FOWs within, for example, states, industries or occupations. Growth of this type would reflect broadly-based influences on employment, for example, the effects of changes in institutional settings, technological change or greater competition for labour during periods of rapid economic growth.
A more technical description of this analytical tool is presented in appendix D.
Reflecting the distinctive patterns in job creation over the decade to 2011, shift–share decompositions were undertaken for changes in FOWs by state, industry, occupation, age group and full- or part-time status (the latter by gender because women are much more likely to work part-time).
Analyses were not conducted by public and private sector employment, firm size or by workers’ country of birth. The relative concentration of permanent employees in the public sector, in tandem with disproportionately rapid job creation in the private sector, suggests that changes in the structure of employment of this type would not have been a factor in the increased prevalence of permanent employees.
In terms of firm size, evidence suggests that permanent employees are relatively more prevalent in larger firms (van Wanrooy et al. 2008). Evidence that smaller firms increased as a share of Australian business over the decade, therefore, leads to a tentative conclusion that an explanation for the increased prevalence of permanent employees does not lie in changes in employment by firm size.

EXPLAINING PREVALENCE CHANGES
55
In terms of immigrants, if recent arrivals were more likely than Australian-born workers to be employed in casual roles, and less likely to work as permanent employees or as owner-managers of unincorporated enterprises (box A.1), the over-representation of the overseas born in net job creation might have been expected to result in prevalence changes for casual and permanent employees different from those observed in chapter 3. However, the likely distribution of recent immigrants by FOW is unclear, particularly because of an increased emphasis on immigrants’ skills in the migration program over the 2000s. Further research could look more closely at possible links between immigration and changes in the prevalence of FOWs.
FOWs included in the analysis
Decompositions were performed for four FOWs — permanent employees, casual employees, owner-managers of incorporated enterprises (OMIEs) and OMUEs.27 The latter two categories capture the self-employed. Fixed-term and labour hire employment, independent contracting and other business operators were not separately analysed due to data constraints. Results for OMIEs are not discussed because the prevalence changes recorded for this FOW (and estimated share and shift effects) were very small.
A focus on the ‘mining states’
Preliminary analysis revealed that Queensland and Western Australia played a disproportionately large role in the increased prevalence of permanent employees. Along with the Northern Territory, job creation in these states differed from the experience of others in a number of ways. For example, service industries, white collar occupations28 and older workers (aged 50 years and over) were smaller contributors to employment change relative to the non-mining states’ experience (appendices E and H). As a result, where possible, the analysis was conducted separately for the ‘mining’ states (Queensland, Western Australia and the Northern Territory) and the ‘non-mining’ states (rest of the country).
The predominance of Queensland and Western Australia in mining state employment (96 per cent in 2001), and New South Wales and Victoria in the
27 As discussed in chapter 3, insights for permanent and casual employees are drawn from data for
employees with and without leave entitlements, respectively. 28 White collar occupations are defined to include the Australian and New Zealand Standard
Classification of Occupations (ANZSCO) categories of: managers; professionals; community and personal services workers; clerical and administrative workers; and sales workers.

56 FORMS OF WORK
non-mining states (83 per cent), means that these labour markets drive conclusions for the two state groupings.
Data caveats
None of the data sources available for the shift–share analysis was ideal and, therefore, a number of sources were used (appendix A). Reported conclusions draw on the multiple sources, and take the strengths and weaknesses of each into account. In many instances, data limitations constrained the quantitative conclusions that could be drawn, but did, however, support qualitative conclusions.
4.4 The evidence on factors that effect changes in the prevalence of FOWs
At a state level
Over the decade to 2011, employment in the mining states grew much more rapidly than in the rest of the country (35 per cent versus 20 per cent) (table E.1), but the fact that net job creation occurred disproportionately in the mining states played little role in FOW prevalence changes. That is, share effects in the state-level analysis were small (tables E.5 to E.8). The changes observed in the prevalence of different FOWs reflected factors at work within states (shift effects).
In every state, permanent employee numbers grew more rapidly than employment overall. Nationwide, about 350 000 more permanent employee roles were created than would have been the case had this FOW grown in line with national employment (table E.5). Mining states were responsible for a disproportionately large share of this increase (63 per cent, in contrast with a 28 per cent share of permanent employees in 2001) (table E.5). New South Wales and Victoria (with a share of permanent employees in 2001 of 61 per cent) accounted for less than a quarter (23 per cent) of this increase. The shift towards permanent employees, therefore, represented a much larger change in mining state labour markets — the prevalence of permanent employees increased by 5 to 6 percentage points, compared with about 2 percentage points for the rest of the country.29,30
29 Over the period to 2010, the mining states accounted for 80 to 85 per cent of the increased
prevalence of permanent employees. The fall in their share in 2011 reflected an unusually rapid increase in permanent employees in the non-mining states between 2010 and 2011. The possibility that this was an artefact of the data (and not a reflection of what actually happened) cannot be dismissed (appendix E). Over the period 2001 to 2010, the increase in permanent

EXPLAINING PREVALENCE CHANGES
57
Much of the relatively rapid growth of permanent employee numbers in the mining states occurred between 2001 and 2008 (figure E.1). In contrast, there was not a lot of difference between permanent employee and total employment growth in the non-mining states until the very end of the decade.31
Although the prevalence of OMUE employment fell in every state across the decade, the decline was relatively pronounced in the mining states. About one third of OMUEs worked in the mining states in 2001, but these states accounted for nearly 50 per cent of the shift away from this FOW. Consequently, the prevalence of OMUEs fell by 4 to 5 percentage points within the mining states, but only 1 to 2 percentage points in the rest of the country.
The increased prevalence of permanent employees in the mining states reflected relatively slow growth of both OMUE and casual employment (figure 4.8). In the non-mining states, the shift was more from OMUEs to permanent employees and, perhaps, slightly to casuals.32
These observations are consistent with a hypothesis that relatively buoyant economic conditions in the mining state labour markets, high business confidence and low levels of unemployment, led employers to take on more permanent employees. However, it is possible that other factors at play within the state groups, for example structural change, were responsible for observed prevalence changes. To test this, shift–share analyses of FOW changes by industry, occupation and workers’ gender, age and hours worked were conducted for mining and non-mining states separately.
employees translated into a prevalence gain of only about 0.5 percentage points in the non-mining states.
30 In New South Wales and Victoria, the increases to 2011 were 1 and 1.7 percentage points, respectively. The data point to faster increases in South Australia, Tasmania and the Australian Capital Territory (3.1, 5.3 and 4.9 percentage points, respectively). However, the relatively small size of these states means that these estimates have larger standard errors and are considered less reliable.
31 As noted in footnote 28, the validity of this apparent change on the trend is questionable. 32 The positive shift effect for casuals in non-mining states was primarily a function of factors at play
in the New South Wales labour market, although across much of the decade, a similar positive, albeit smaller, effect was apparent in Victoria. These conclusions are tentative. Data from an alternative source suggest that the prevalence of casuals fell slightly in the non-mining states over the decade. It is unclear why the two sources suggest different conclusions, but an error in the alternative source is one possibility. The alternative estimates, and possible explanations for differences between the two sources, are presented in appendix E.

58 FORMS OF WORK
Figure 4.8 Shift effects from the state-level analysis, 2001 to 2011, mining and non-mining states
Source: Authors’ estimates based on ABS (Australian Labour Market Statistics, Cat. no. 6105.0).
At an industry level
Characteristics of net job change by industry (that is, structural change at an industry level) did not have a major effect on the prevalence of permanent employees or OMUEs in either the mining or non-mining states (appendix F).33 Although some industries in which permanent employees and OMUEs were relatively concentrated grew more slowly than others, contributing to falls in the number of people in these FOWs, others grew relatively quickly, offsetting these declines. For example, in both the mining and non-mining states, the declining share of agriculture, forestry and fishing in employment (a sector of relatively high OMUE employment) contributed to falls in this FOW (tables F.11 and F.12). Ignoring changes in other parts of the economy, this structural change was responsible for about 30 per cent of the decline in the prevalence of OMUEs in mining states, and 55 per cent in the rest of the country. However, the impact of this structural change was offset by the effects of growth in other industries — in particular, construction (also a large employer of OMUEs). Overall, structural change (reflected in share effects), was a relatively small contributor to changes in the prevalence of both OMUEs and permanent employees.
33 Analysis in this section mainly focuses on permanent employees and OMUEs because these
were the FOWs for which the largest changes were recorded, and because of concerns about the data underlying results for casual employees in the non-mining states.
-200
-150
-100
-50
0
50
100
150
200
250
Permanentemployees
Casual employees OMIEs OMUEs
Thou
sand
s
Mining states Non-mining states

EXPLAINING PREVALENCE CHANGES
59
For both mining and non-mining states, relatively slow growth of OMUE employment within industries (that is, shift effects) was the major contributor to changes in the prevalence of this FOW. Although shifts were apparent in all industries (except producer services in the non-mining states), they were disproportionately strong in construction, retail and transport, postal and warehousing.
Within the mining states, these shifts away from OMUE employment within industries were coupled with increased numbers of permanent employees in all of these industries. In the non-mining states, a shift away from OMUE employment in construction was coupled with relatively fast growth in permanent employee numbers. However, in the case of retail and transport the evidence suggests a shift into casual employment.
These results support a hypothesis that the decline in the prevalence of OMUEs reflected lower rates of small business formation, or increased exits from this FOW, not the effects of structural change at an industry level. In other words, on their own, the results suggest that workers became less likely to establish unincorporated enterprises (at least as their main source of employment), and more likely to work for someone else, over the decade. Possible reasons for this are discussed in section 4.5.
At an occupation level
Share effects emerged as a more important explanation of prevalence changes in decompositions of growth in FOWs by occupation. Permanent employees are more prevalent in higher-skilled occupations, with casuals more prevalent in lower-skilled occupations (table G.2). Relatively fast growth in higher-skilled jobs across the decade, therefore, translated into increases in the prevalence of permanent employees. Conversely, slower growth in lower-skilled jobs was associated with declines in the prevalence of casual employment.
In the mining states, these effects accounted for about half of the relatively slow growth of casual employment. Relatively fast growth of permanent employees within occupations (coupled with relatively slow growth of OMUEs), however, remained the more important factor in changes in the prevalence of permanent employees. (That is, shift effects were a more important source of prevalence changes.) Relatively large shifts of this type were recorded for professionals and tradespersons.
In the non-mining states, although slower growth of lower-skilled occupations acted to reduce the prevalence of casual employment, the evidence suggests that this

60 FORMS OF WORK
(share) effect was offset somewhat by a shift towards casual workers (primarily driven by activity in the New South Wales labour market).34,35
Share effects played little role in changes in the prevalence of OMUEs within mining states. However, contraction of employment in the occupation farmers and farm managers in the non-mining states (down by 29 per cent), meant that share effects accounted for about 45 per cent of the change in the prevalence of OMUE employment in these states between 2001 and 2011.
At a gender and full-time, part-time hours level
In the mining states, full- and part-time employment grew at close to the same rate in the decade to 2011, as did male and female employment. In the non-mining states, part-time work grew much more rapidly than full-time employment (38 versus 12 per cent), and female employment grew more rapidly than male employment (23 versus 16 per cent) (appendix H). The observation that net job creation was disproportionately part-time and female at a national level (section 4.1), therefore, reflects the experiences of the non-mining states.
Because full- and part-time, as well as male and female, employment grew at similar rates in the mining states across the decade, share effects for each FOW were very small for this group of states (tables H.3 to H.6). In contrast, in the non-mining states, because permanent employees were much more likely to work full-time and casuals part-time (table H.2), the differential rates of growth in full-time and part-time work, other things equal, would have been associated with a decline in the prevalence of permanent employees and an increase in that of casuals. Particularly strong shift effects meant that these outcomes were not observed. Although OMUEs were more likely to work full-time, part-time employment was sufficiently common that relatively fast growth in part-time employment in the non-mining states did not have an effect on the prevalence of OMUEs. Again, shift effects were the key.
In summary, shift effects were responsible for the prevalence changes recorded for permanent employees and OMUEs within both mining and non-mining states when changes in FOWs were decomposed by workers’ gender and full- or part-time work status.
34 Refer to previous footnote. 35 Data concerns preclude a conclusion about the relative contributions of share and shift effects at
an occupation level to changes in the prevalence of permanent employees in the non-mining states.

EXPLAINING PREVALENCE CHANGES
61
In the case of permanent employees, shift effects were positive for all groups of workers (that is, male and female full- and part-time workers in mining and non-mining states) (table H.3). Relatively rapid growth of permanent employees, however, was particularly strong among part-time workers (especially women), and was mirrored in relatively slow growth of casual employment among part-time workers (table H.4). As a result, the likelihood that a part-time worker was a permanent employee increased over the decade. Overall, part-time workers accounted for 32 per cent of the net increase in permanent employee roles, in contrast with an employment share in this FOW of about 14 per cent in 2001.
In contrast, shifts away from OMUE employment occurred disproportionately among full-time workers (and were reflected in shifts towards permanent employee roles within this group) (table H.6). Nationally, the data suggest a very small increase in the prevalence of OMUE employment among part-time workers. This is consistent with a theory that part-time workers seeking flexibility might opt for self-employment (but it was a very small change).
The hypothesis advanced in section 4.2 — that relatively fast growth in part-time employment would most likely have been associated with an increased prevalence of casuals — is not borne out by the analysis. Instead, the alternative hypothesis that workers primarily looked to balance work and family commitments via part-time permanent employee roles, and that this was facilitated by employers, is supported. Possible explanations for the relatively strong increase in the prevalence of part-time permanent employees are discussed in section 4.5.
At an age cohort level
As discussed above, relatively rapid employment growth among people aged 50 to 69 years might have been expected to translate into an increased prevalence of self-employment and casual work. The fact that this did not occur reflects the impact of relatively rapid employment growth among permanent employees in both the mining and non-mining states (appendix I). This phenomenon was observed among all age cohorts (with the exception of workers aged 15 to 24 years in the non-mining states), but was particularly strong among older workers. For example, nationally, workers aged 50 to 69 years accounted for 41 per cent of the shift effect for permanent employees, in contrast to an employment share in 2001 of 19 per cent. In other words, as older Australians increasingly remained at work, rather than retiring, they were increasingly likely to do so in permanent employee roles and were less likely to be self-employed — contrary to the hypothesis advanced in section 4.2.

62 FORMS OF WORK
Relatively slow growth in OMUE employment across age cohorts might have been due to either (or both) a decline in the rate at which workers entered self-employment, or an increase in the rate at which they exited that FOW. Atalay et al. (2013) analyse entry and exit rates and conclude that ‘it appears to be the case that entry to, rather than exit from, self-employment has decreased, especially for older people’ (p. 10).
Although the increase in permanent employee roles was relatively rapid among part-time workers, and among workers aged 50 to 69 years, part-time roles accounted for only about 40 per cent of the shift effect for older workers (appendix I). In other words, it was not the case that the majority of the shift towards permanent employees was accounted for by older workers employed on a part-time basis in 2011.
These indicate that older workers became increasingly likely to be employed in permanent employee roles over the decade. Possible explanations for this conclusion are discussed below.
Summary of the shift–share results
This summary, and the subsequent discussion, focus on permanent employees and OMUEs as these were the FOWs that displayed marked prevalence changes.
In the state-level analysis, the increased prevalence of permanent employees and the decline in the share of OMUEs in employment between 2001 and 2011 were due entirely to factors at work within states (shift effects). The mining states accounted for a disproportionate share of these shift effects and, as a result, prevalence changes were much more pronounced within this state grouping (table 4.2).36
Table 4.2 Changes in the prevalence of different FOWs over the decade to 2011, by state grouping Percentage points
Permanent employees Casuals OMIEs OMUEs
Mining 6.0 -1.5 0.2 -4.7 Non-mining 1.7 0.5 0.1 -2.4 Australia 3.0 – 0.1 -3.0
– Nil
Source: Authors’ estimates based on ABS (Australian Labour Market Statistics, Cat. no. 6105.0).
36 Slightly different prevalence estimates for the two state groupings were obtained from an
alternative data source. These are presented and discussed in appendix E.

EXPLAINING PREVALENCE CHANGES
63
The fact that relatively large prevalence changes occurred in the mining states suggests that state-level factors, and not national-level changes, were the primary contributor to changing employment shares of different FOWs.
Structural change at an industry level (share effects) explained little of the changes in the prevalence of permanent and OMUE employment within either mining or non-mining states; shift effects were key, indicating that prevalence changes did not have an industry-specific source (table 4.3). Increases in the prevalence of permanent employees occurred in all industries in the mining states, and in most industries in the non-mining states. Similarly, OMUEs became less prevalent in all industries (except producer services in the non-mining states), but particularly in construction, retail and transport, postal and warehousing. Across the decade, the likelihood that a worker was an employee, and not in self-employment, increased.
Table 4.3 Indicators of contributions of shift effects to the increased prevalence of permanent employees and decreased prevalence of OMUEs over the decade to 2011a, b Per cent
Permanent employees OMUEs State-level analysis 100 100 Industry-level analysis Mining states 99 78 Non-mining states 88 78 Occupation-level analysis Mining states 79 89 Non-mining states 36 55 Full- and part-time employment by gender analysis
Mining states 100 97 Non-mining states 100 98 Age cohort analysis Mining states 100 100 Non-mining states 100 100 a Share effects account for the remaining percentage of prevalence changes. b Confidence intervals cannot be attached to these indicators. That said, results from different time points and datasets support these indicators, with the exception of the figure presented for permanent employees from the occupation level analysis for the non-mining states.
Sources: Appendices E through I.
Changes in the profile of employment at an occupation level (share effects) played a more important role in observed prevalence changes. Relatively rapid employment growth in higher-skilled occupations — jobs in which permanent employees are concentrated — contributed to prevalence increases for this FOW. In the non-mining states, declines in employment of farmers and farm managers meant that changes in the profile of employment at an occupation level (share effects)

64 FORMS OF WORK
accounted for about one half of the change in the prevalence of OMUEs. In the mining states, however, shift effects remained the major factor in prevalence changes for both permanent employees and OMUEs.
Since the majority of permanent employees work on a full-time basis, and the majority of casuals work on a part-time basis, relatively rapid growth in part-time work over the decade to 2011 might have been expected to have been associated with a fall in the prevalence of permanent employees. Relatively rapid growth of employment in permanent employee roles among both full- and part-time workers (shift effects), however, explain why this outcome did not emerge. The shift towards permanent employee roles was particularly strong among part-time workers (especially women). In contrast, shifts away from OMUE employment occurred primarily among full-time workers. The results might suggest that workers seeking to balance work and family commitments were increasingly likely to do so in part-time permanent employee roles.
The large contribution of older workers (aged 50 to 69 years) to net job creation over the decade to 2011 might have been expected to result in an increase in the prevalence of OMUEs, because older workers are relatively concentrated in this FOW. Instead, relatively slow growth of OMUE employment among workers of all ages (shift effects) meant that this expected prevalence increase did not occur. The shift away from OMUE employment was particularly pronounced among workers aged 50 to 69 years. It is possible that older workers transitioning to retirement became increasingly likely to do so as permanent employees.
Overall, explanations for changes in the prevalence of permanent employees and OMUEs over the decade to 2011 lie in potential causes of the observed shift effects, not in the characteristics of net job creation (that is, in share effects).
4.5 What could explain the observed shift effects?
The fact that increases in the prevalence of permanent employees and declines for OMUEs were much larger in the mining states suggests that changes at a national level (for example, in tax settings, business regulation and superannuation rules) were not the main driver of observed prevalence changes. Measures to support part-time permanent work for parents returning from parental leave, however, might have played some role in the increased prevalence of permanent employees nationally.
Across both full-and part-time workers, the increased prevalence of permanent employees, in the mining states in particular, is consistent with relatively buoyant economic conditions, low rates of unemployment and higher business confidence.

EXPLAINING PREVALENCE CHANGES
65
The mining states recorded considerably stronger economic growth and labour market strength than the non-mining states during the decade to 2011 (table 4.4). Unemployment, for example, was higher in the mining states in 2001, but fell more markedly, reaching a low in 2008, before ending the decade at about the same level as that recorded in the non-mining states. Employers may have used permanent employment as a strategy to reduce the costs associated with turnover (for example, recruitment and induction) in a tight labour market.
Falls in the prevalence of casuals and OMUEs during the middle years of the decade, when increases in the prevalence of permanent employees were most rapid (figures 3.2, 3.3 and 3.5), fit with this hypothesis.
Table 4.4 Relative economic strength of the mining states Per cent
Real state gross domestic product
2001 to 2011a
Employment growth
2001 to 2011a
Unemployment rateb
2001 2008 2011
Mining states 6.7 3.1 7.8 3.5 5.0 Non-mining states 3.3 1.9 6.3 4.6 5.1 a Average growth per annum. b Annual average monthly unemployment rate.
Sources: ABS (Australian National Accounts: State Accounts 2011–12, Cat. no. 5220.0; and Labour Force, Australia, Detailed, Cat. no. 6291.0.55.001).
Turning to OMUEs, beyond the effect of declines in farmer and farm manager numbers in the non-mining states, it is not clear why the prevalence of this FOW fell. If the decline was due to fewer people entering this FOW and not to an increase in the number leaving (Atalay et al. 2013), it suggests that workers increasingly viewed OMUE employment as less attractive than other FOWs. Perhaps workers who otherwise might have entered self-employment if labour market conditions had been weaker obtained employee roles instead as unemployment rates fell.
The enactment of the Alienation of Personal Services Income Act 2000 (Cwlth) might have reduced the attractiveness of self-employment to some workers. If that had been the case, however, relatively slow growth of OMUE employment should have occurred more evenly across the labour market. Instead, shift effects for OMUEs varied between industries, full-and part-time workers and different age cohorts, indicating that this national-level change was not a major factor in the decline in the prevalence of OMUEs. (A similar argument could be applied to the potential effects of national-level changes in regulation relevant to small business ownership.)
The Australian Industrial Relations Commission reached a determination in August 2005 that workers returning from parental leave could request part-time work until their children reached school age, and published a model award clause consistent

66 FORMS OF WORK
with its decision (AIRC 2005). Employers were only permitted to refuse a request on ‘reasonable grounds’. Evidence on the number of awards (and then agreements) modified as a result of this determination, and the number of people who then requested part-time hours, has not been located. That said, according to the Australian Government (2008), 43 per cent of federal collective agreements in 2008 included provisions for flexible working arrangements related to hours of work. The right to ask for flexible work arrangements, including reduced hours of work, was extended to all permanent employees and long-term casuals with young children with the introduction of the National Employment Standards (FWO 2012b). This standard, however, only took effect from 1 January 2010.
These changes are likely to have made it easier for workers (particularly women) to return to work on a part-time permanent basis with their pre-parental leave employer rather than, perhaps, resigning and working part-time in casual or self-employment.
It is also possible, however, that, in seeking to attract and retain employees in a strong labour market, employers increasingly offered permanent part-time arrangements to employees (including, but not only, parents with young children). The Western Australian government, for example, has advocated the use of flexible work arrangements to address labour shortages (WADOC 2010, p. 1):
Long term business success … depends on putting strategies in place to ensure a reliable source of employees going into the future … workplace flexibility can be a valuable tool for attracting and retaining employees — particularly women, those with family responsibilities, and mature age workers.
Relatively fast growth in part-time permanent roles among workers aged 50 to 69, for example, is consistent with this hypothesis. This growth also indicates that part-time work provisions for parents with young children are only one possible explanation for the relatively fast growth of part-time permanent roles overall. On this point, although transition-to-retirement arrangements introduced in 2005 might have given older workers an incentive to move to part-time employment, those arrangements are applicable to both employees and the self-employed. They should not have disproportionately affected workers’ preferences between different FOWs.
Finally, businesses might have been more accommodating of employee requests for part-time work, and perhaps sought reductions in hours, during the GFC. However, the relatively rapid growth of part-time permanent employee roles was occurring well before the GFC, and most of the increased prevalence of permanent employees occurred prior to the onset of the GFC.
Overall, the extent to which the particularly rapid growth of permanent roles among part-time workers reflected increased use of part-time work provisions by parents with young children, employers’ hiring strategies or other factors, is unclear.

EXPLAINING PREVALENCE CHANGES
67
Looking at older workers more generally, the drivers of the disproportionately rapid growth in permanent employee roles (and slow growth of self-employment) among this cohort are unclear. The effect was apparent among both men and women, and for full- and part-time workers. Although the GFC, and resulting fall in superannuation balances, probably led to delayed retirement and/or reduced hours among some older workers, it is not clear why this phenomenon would have affected permanent employees more, for example, than the self-employed. Similarly, increases in the pension age for women might have encouraged greater workforce participation among older women, but it is unclear why this would have affected FOWs in different ways. Atalay et al. (2013) hypothesised that the introduction of the Age Discrimination Act 2004 (Cwlth) could have played a role on the grounds that older workers experiencing discrimination might have entered self-employment. However, as Atalay et al. (2013) noted, the decline in the prevalence of older workers in self-employment pre-dated the introduction of the Act.
4.6 Some directions for future research
Longitudinal analysis could be used to further investigate the characteristics of people who enter and exit permanent employee and OMUE roles. In the case of OMUEs, the Longitudinal Labour Force confidentialised unit record file (ABS 2013b) could be used to look at why the prevalence of OMUEs varies seasonally (appendix A).
The feasibility of assessing the contribution of immigration to changes in the prevalence of different FOWs could be explored. It is unclear whether data that would support research of this type are available.
The puzzling finding reached by Watson (2005) that the wage premium earned by part-time casuals relative to part-time permanent employees was markedly lower than the casual loadings then in force in awards and agreements (chapter 2) also merits investigation using more recent data.


DATA SOURCES 69
A Data sources
A number of data sets can be used to analyse changes in the prevalence of different forms of work (FOWs) in Australia. The key ones covering the period of research interest are the:
• Household, Income and Labour Dynamics in Australia (HILDA) survey (with data available annually from 2001 to 2011 at the time of publication37)
• Australian Bureau of Statistics (ABS) collections, including the:
– Labour Force Survey (LFS) (a quarterly collection from at least 1978), and relevant supplementary surveys:
Forms of Employment (FOE) survey (collected in 1998, and subsequently in 2001, 2004 and annually from 2006)
Employee Earnings, Benefits and Trade Union Membership (EEBTUM) survey (collected annually from 1975 (under the title Weekly Earnings of Employees prior to 1999)).
Given the research focus of the report, an ideal source would:
• include information on each FOW
• include a range of other variables relating to the characteristics of individuals and their employment — for example, demographic information, hours, industry and occupation of work, and employer (that is, firm-level) characteristics
• be collected regularly with consistent definitions, over a number of years, and at the same point in each year (to avoid seasonality issues)
• enable the calculation of population representative estimates
• contain sufficient observations to support the derivation of reliable estimates of concepts of interest.
In this appendix, strengths and weaknesses of the available sources for estimating changes in prevalence (section A.1) and for estimating shift–share decompositions of those changes (section A.2) are described taking into account the criteria listed above. 37 At the time that prevalence changes were estimated for this paper, only HILDA data up to 2010
were available.

70 FORMS OF WORK
A.1 Data that might be used in estimating changes in prevalence
The HILDA survey
The HILDA survey has been run annually since 2001. Questions relating to survey respondents’ FOWs, and many characteristics of their employment, have been asked on a consistent basis, and in the same months, of each year. Furthermore, data are collected directly from each individual in the sample.38
The HILDA survey also has a number of drawbacks:
• Data are not available before 2001.
• The sample size is relatively small (8665 employed persons in 2010) — as a result cross tabulations for some variables have high standard errors.
• Information on independent contractors has been collected only since 2008 and only one question is asked about this FOW.
• A question on labour hire employment is asked only of people who identify as employees.
• Professionals were over-represented in the initial sample and employment of professionals and labourers grew more slowly between 2001 and 2010 than ABS sources suggest, and clerical and administrative workers more rapidly — raising a question mark over the population representativeness of the data.
• The sample in waves 1 to 10 was not topped up with new immigrants, or residents returning from overseas who were not included in the initial sample. This means that the HILDA data potentially became less representative of the population over this period (box A.1).
Given these characteristics, data from ABS sources were preferred for much of the analysis, with HILDA survey data used to cross-check conclusions.
38 In contrast, in many ABS surveys, information on all members of a household included in the
sample is collected from one person using the ‘any responsible adult’ method. This difference might mean that the HILDA survey provides a more accurate view of the characteristics of an individual’s work.

DATA SOURCES 71
Box A.1 Under-representation of recent arrivals in the HILDA survey No new households were added to the HILDA survey sample in the first ten waves of the survey. (The sample was replenished with 2153 additional households in the 11th wave. A lack of recent immigrants was one motivation for topping up the sample (Watson (2012)). During waves one to ten, immigrants could only enter the sample if they formed a household with a ‘continuing sample member’ — defined to include all members of households included in wave 1, their children born or adopted post-wave 1 and any new entrant to a household who has a child with a continuing sample member.
Recently arrived immigrants were increasingly under-represented across waves one to ten of the survey (Watson 2012). On a weighted basis, the 10th wave of the HILDA survey contains 355 000 immigrants who arrived between 2001 and 2009 (Commission estimates based on the HILDA survey, release 10). In contrast, in 2009-10 alone, permanent and long-term arrivals (excluding returning Australian residents) numbered around 500 000 (DIAC 2011). To the extent that recent arrivals are different from the population that they join, their under-representation in the HILDA survey means that it became less representative of the population between 2001 and 2010.
For example, a comparison of the working arrangements of immigrants who arrived in Australia in the 10 years to 2001 with the rest of the population reveals that the immigrants were more likely to be employed as casuals, and less likely to work in permanent employee roles or run unincorporated businesses. Assuming that arrivals between 2001 and 2010 entered similar forms of work to those of immigrants who arrived in the preceding decade, HILDA is likely to have increasingly understated the number of casual employees as the decade progressed, and overstated the numbers of permanent employees and owner managers of unincorporated enterprises. The magnitude of the biases will depend on the share of the recent immigrant cohort in the workforce. This share appears to have been significant. In 2011, the overseas born occupied 40 per cent of net jobs added to the economy in the preceding decade, in contrast with an employment share in 2001 of 24 per cent.
The assumption of similarity between immigrant cohorts before and after 2001 merits testing in future research. A greater focus on skilled migration in recent years, and on the English language ability of arrivals, suggests that this assumption might not be appropriate.
ABS sources
For changes over the past 30 years
Publications based on two ABS sources, the EEBTUM survey (and predecessor surveys)39 and the LFS, support the derivation of time series for broad work
39 Data from the EEBTUM survey (and its predecessors) have been published, for example, in the
catalogues Employment Benefits (Cat. no. 6334.0), Weekly Earnings of Employees

72 FORMS OF WORK
arrangements in Australia — but do not contain information about all the FOWs of interest in this report.
Both have the advantages of having been collected at the same time of the year each year (that is, seasonality that might arise if data from different months were compared is not a concern), and with the intention of supporting the production of estimates that are representative of the resident population.40 Data on a range of characteristics of individuals, including their employment, are collected.
Slightly different classifications of working arrangements — status in employment and employment type are used in the EEBTUM survey and the LFS (box A.2). The EEBTUM survey is collected only from employees, so excludes owner managers of unincorporated enterprises (OMUEs).41 The LFS includes all workers.
Box A.2 The three ABS classifications of different types of work Status in employment — based on standards developed by the International Labor Organization (and used, for example, in ABS publications based on the Labour Force Survey going back to at least the late 1970s). Categories are employees (including owner managers of incorporated enterprises (OMIEs)), employers and own account workers.
Employment type — based on the nature of a person’s employment relationship or contract. Categories are employees (excluding OMIEs) with and without leave entitlements, OMIEs and owner managers of unincorporated enterprises (OMUEs). This classification is used, for example, in publications based on the Employee Earnings Benefits and Trade Union Membership survey (although OMUEs are not included in this collection).
Form of employment — a more detailed classification based on the nature of a person’s employment relationship or contract (used in the Forms of Employment survey). From 2008 onwards, key categories are employees with and without leave entitlements, independent contractors and other business operators. Data are also available on casual and fixed-term employees, and labour hire workers.
Sources: ABS (‘Fact sheet: employment classifications’, Australian Labour Market Statistics, Cat. no. 6105.0, Forms of Employment, November 2008, Cat. no. 6359.0).
(Cat. no. 6310.0) and Australian Labour Market Statistics (Cat. no. 6105.0), in addition to Employee Earnings, Benefits and Trade Union Membership (Cat. no. 6310.0) from 1999).
40 ‘Residents’ are defined as people living in Australia for at least 12 of the 16 months preceding a survey, irrespective of citizenship or visa status. People who are not residents are excluded from both surveys. This means that estimates of the workforce are understated to the extent that people in Australia on a temporary basis, or those who have not yet been here for 12/16 months, are working.
41 Owner managers of incorporated enterprises are treated as employees of those enterprises.

DATA SOURCES 73
Because the EEBTUM survey is collected as a supplement to the LFS, it is possible to merge data from the two collections and derive time series of a number of broad working arrangements (table A.1):
• Employees with and without leave entitlements
• Owner managers of incorporated enterprises (OMIEs)
• OMUEs with and without employees (labelled employers and own account workers respectively)
• Contributing family workers.
This approach was adopted in describing changes in the prevalence of these FOWs between 1982 and 2011 (chapter 3, appendix B).
Table A.1 Employment classifications used in the EEBTUM survey and the LFS
Status in employment variables in the LFS Employment by type variables in the EEBTUM survey
Employees (excluding OMIEs) Employees (including OMIEs) With leave entitlements Without leave entitlements OMIEs OMUEs Employers Own account workers Contributing family workers
Sources: ABS (‘Fact sheet: employment classifications’, Australian Labour Market Statistics, Cat. no. 6105.0; Employee Earnings, Benefits and Trade Union Membership, Cat. no. 6310.0).
Changes in questionnaires and collection methods complicated the derivation of time series covering the past 30 years. Merging data from the two sources, over this time frame, required a number of assumptions, and raised a number of issues — including the treatment of potential breaks in series. Information about the assumptions made in deriving the series is in the electronic appendix to this report (available at www.pc.gov.au). The data presented in figure 3.1 and table B.1 can be regarded as indicative of the broad changes that have occurred in the Australian labour market since the early 1980s.
For changes over the past decade
The ABS has collected relatively detailed information for most FOWs in the FOE surveys since 1998. These data have a number of advantages, including that they:
• contain information on many characteristics of individuals and their employment

74 FORMS OF WORK
• provide insights into independent contracting, particularly from 2008 onwards when a number of questions pertaining to this FOW have been asked
• have been collected in the same month of each year (November)
• support the derivation of population representative estimates
• are based on a larger sample size than the HILDA survey (for example, interviews were completed for 29 763 workers in the 2011 FOE survey).
Changes to this survey over time, however, complicate its use:
• In 2001, data were collected only for people aged 15 to 69 years. Subsequent surveys covered the whole workforce.
• Since 2008, data have been collected and presented against an employment classification that differs from that used previously. Information on independent contractors and other business operators has only been collected since 2008.
• Classifications of two key variables of interest, occupation and industry of employment, changed in 2006. (Data coded to the old classification are available on request for each year between 2006 and 2009.)
Steps taken to deal with the possible effects of these changes on the prevalence analysis presented in the report are detailed where relevant.
A.2 Data used in the shift–share analysis
Unfortunately, none of the available datasets are sufficiently large to support shift–share analysis of the less common FOWs — in particular, labour hire workers and fixed-term employees. Data on independent contractors and other business operators are not available across the decade, ruling out the decomposition of changes in these FOWs. Reflecting the characteristics of available data, therefore, the analysis focused on permanent and casual employees (proxied by employees with and without leave entitlements, respectively), and OMIEs and OMUEs. This focus was supported by the fact that the prevalence changes that did occur in the decade to 2011 were driven mainly by these FOWs (chapter 3).
Because the HILDA survey is relatively small, ABS collections were preferred. Data from a combination of the EEBTUM survey and the LFS (for 1992 to 2007) and the FOE survey (from 2008 onwards) are published annually in the Australian Labour Market Statistics (ALMS) catalogue (ABS 2012a). Information on the key FOWs is available across time, cross-tabulated with a range of variables including workers’ state or territory of residence, industry and occupation of employment, age and full- or part-time hours status. This source, therefore, contains the most suitable

DATA SOURCES 75
publicly available data for shift–share analysis. It does, however, have a number of drawbacks:
• The EEBTUM survey is collected in August, and the FOE survey in November. The break in series with the move to use of the FOE survey from 2008 raises the possibility that shift–share results are influenced by seasonality in the data. For example, the prevalence of OMUEs was lower in November than in August in most years in the decade to 2011, often by a statistically significant amount. (The drivers of this seasonality are unclear.)
• The approach used by the ABS to classify workers into industries and occupations changed in 2006, and consistent data are available from the ALMS only between 2001 and 2007.42 (Information classified on a consistent basis is available for OMUEs from the LFS (ABS 2012i) for the decade, and is used to decompose employment changes for this FOW.43)
• The definition of part-time employment in the ALMS changed with the shift to the FOE survey in 2008, from part-time in all jobs, to part-time in main job.
Some of these issues were addressed through the use of unpublished data from the ABS, grouped by mining and non-mining states.
The state grouping was driven by preliminary shift–share analysis that indicated that the experiences of the mining states44 (Queensland, Western Australia and the Northern Territory) and non-mining states (the rest of the country) were reasonably different over the decade to 2011 (appendix E). Because data on FOWs at a state and territory level were only cross-tabulated with workers’ gender and hours status, unpublished data were requested to enable comparisons between mining and non-mining states for other variables — industry, occupation and age cohort.
Unfortunately, the ABS was unable to supply a state breakdown for these variables from the ALMS catalogue. Information from this source would have been preferred because it would have facilitated comparisons with data in the public domain. Instead, data were drawn from the FOE survey. In 2001, the FOE survey was restricted to people aged 15 to 69 years, and a similar constraint was applied to the data from later years. This feature of the data complicates comparisons with shift–share results from the ALMS.
42 Data on the older industry and occupation classifications were published in the ALMS for 2008,
but imply an increase in the prevalence of permanent employees that was not apparent in later publications. Therefore, these data were deemed inappropriate for the analysis in this report.
43 Use of this survey enables a cross-check with results from other sources. 44 The term ‘states’ is used throughout as shorthand for states and territories.

76 FORMS OF WORK
Use of unpublished data from the FOE survey did confer some benefits:
• The survey is collected in November of each year. Use of this source, therefore, overcomes concerns about seasonality.
• Access to the FOE survey presented an opportunity to address the change in the definition of part-time work that occurred in the ALMS in 2008. Data on workers’ hours status in their main job would have been preferred for consistency with information on their FOW. This was not available across time. Data on hours worked are for all jobs — some workers who are part-time in their main job will be recorded as working full-time.
• Data on a consistent industry and occupation classification were provided for 2001 and each of 2007, 2008 and 2009.

CHANGES IN THE PREVALENCE OF FORMS OF WORK
77
B Changes in the prevalence of forms of work
As discussed in appendix A, a number of data sets potentially support analysis of changes in the prevalence of different forms of work (FOWs) including the:
• Household, Income and Labour Dynamics in Australia (HILDA) survey
• Labour Force Survey (LFS)
• Forms of Employment (FOE) survey
• Employee Earnings, Benefits and Trade Union Membership (EEBTUM) survey.
Prevalence estimates from sources deemed to provide the most accurate picture of changes over time were presented in chapter 3. The existence of multiple sources permits a cross-check of those conclusions — presented in this appendix. For some FOWs, these sources yield somewhat different level and prevalence estimates, but the prevalence trends for each FOW reported in chapter 3 are evident in each cross-check.
B.1 Prevalence changes in broad forms of work, 1982 to 2011
To provide a sense of changes in the levels of different FOWs over time, the series underlying figure 3.1 in chapter 3 are presented in table B.1. Although most of the broad FOWs increased over the period (only owner managers of unincorporated enterprises (OMUEs) who employ others did not grow), some grew more quickly than others, leading to prevalence changes.
As noted in appendix A, derivation of series for each broad FOW back to 1982 required a merger of data from two ABS sources —the LFS and the EEBTUM survey (and its predecessor surveys). Slightly different employment totals were present in each survey. Prevalence estimates presented in table B.1 were derived using the LFS total. As a result, in some years, the prevalence estimates do not sum to 100.

78 FORMS OF WORK
Table B.1 Changes in the level and prevalence of broad forms of work, 1982 to 2011a, b, c
1982 1986 1991 1996 2001 2006 2011
’000 ’000 ’000 ’000 ’000 ’000 ’000 Employees 5 011 5 445 5 969 6 662 7 153 8 183 9 270 With leave entitlements 4 420 4 597 4 880 5 036 5 359 6 180 7 024 Without leave entitlements 591 848 1088 1 627 1 794 2 003 2 245
Owner managers 1 142 1 299 1 440 1602 1 848 1 963 2 015 Incorporated enterprises 177 238 349 478 609 687 724 Unincorporated enterprises (employer) 318 311 311 304 326 312 286 Unincorporated enterprises (own account worker) 647 750 780 820 912 964 1005
Total 6 354 6 853 7 559 8 233 9 005 10 214 11 323 % % % % % % % Employees 78.9 79.5 79.0 80.9 79.4 80.1 81.9 With leave entitlements 69.6 67.1 64.6 61.2 59.5 60.5 62.0 Without leave entitlements 9.3 12.4 14.4 19.8 19.9 19.6 19.8
Owner managers 18.0 19.0 19.0 19.5 20.5 19.2 17.8 Incorporated enterprises 2.8 3.5 4.6 5.8 6.8 6.7 6.4 Unincorporated enterprises (employer) 5.0 4.5 4.1 3.7 3.6 3.0 2.5 Unincorporated enterprises (own account worker)
10.2 10.9 10.3 10.0 10.1 9.4 8.9
Totald 96.8 98.4 98.0 100.4 100.0 99.3 99.7 a A description of the sources on which the table is based is provided in appendix J, which is available only at the Commission’s website. b Employment type is for a worker’s main job. Employee data exclude owner managers of incorporated enterprises. c A number of assumptions underlie the derivation of these time series. The data are indicative of changes in these FOWs over the past 30 years. Information about the construction of these series can be found in appendix J. d Prevalence estimates for each FOW were calculated using data on total employment from the Labour Force Survey. Data for different FOWs were drawn from different sources. In some instances, even though data in those sources were collected simultaneously, the catalogues in which they were published reported slightly different total labour force numbers. The sum of workers by FOW, therefore, does not equal the total in some cases. See appendix J for more details.
Sources: ABS (The Labour Force, Cat. no. 6204.0; Labour Force, Australia, Cat. no. 6203.0; Australian Labour Market Statistics, Cat. no. 6105.0; Employee Earnings, Benefits and Trade Union Membership, Cat. no. 6310.0).
B.2 Prevalence changes in forms of work between 2001 and 2011
Permanent employees
The HILDA, FOE and EEBTUM surveys all suggest that the prevalence of permanent employees increased by between 3 and 4 percentage points over the

CHANGES IN THE PREVALENCE OF FORMS OF WORK
79
decade to 2011 (table B.2).45 The shift towards permanent employees when estimated with HILDA data was more pronounced than when using ABS data. Differences in the estimates might be due to differences in collection methods and questions between the surveys (appendix A).
Table B.2 Prevalence of permanent employees, 2001 to 2011a
Per cent
2001 2002 2003 2004 2005 2006 2007 2008 2009 2010 2011
FOE 2001b, c 58.2 61.3 HILDAd 54.5 53.7 56.1 56.5 57.1 57.2 59.6 60.0 58.2 58.6 Estimates of employees with leave entitlements EEBTUMe 59.5 59.6 59.8 59.5 60.3 60.5 60.5 60.2 60.4 61.2 62.0 FOEf 59.6 60.8 60.9 61.8 61.4 61.7 62.5 FOE (15 to 69)b, f 60.0 61.2 62.2 61.8 62.1 62.9 a Contributing family workers and unpaid workers are excluded from the estimates. The HILDA survey also excludes employees who answered ‘other’ to a question about their contract of employment. b Estimates are for employed people aged 15 to 69 years. Estimates were derived as all employees less self-identified casuals and fixed-term employees. c Employees recoded by the ABS as independent contractors in the 2008 FOE survey, were redistributed to the employee categories of permanent, casual or fixed-term in deriving this estimate. Owner managers (of incorporated and of unincorporated enterprises) recoded as employees by the ABS in the 2008 FOE survey have been excluded from the employee estimate for 2008 on the grounds that a redistribution of this type was not undertaken by the ABS in 2001. d HILDA estimates are for persons who identify as working in permanent (ongoing) employment. e The difference between the EBBTUM estimate and FOE estimate in 2008 and 2009 could be due to less reliable EEBTUM data for those years. The EEBTUM data imply total employment figures that are about 2 per cent lower than those published in the LFS in 2008 and 2009. In contrast, between 1992 and 2006 the average difference in total employment between these sources was zero. f To create a consistent time series, data for 2008 to 2011 include employees with leave entitlements who were redistributed by the ABS in those four years to the measure of independent contractors.
Sources: EEBTUM: Employees with leave entitlements, 2001–07, ABS (Australian Labour Market Statistics, Cat. no. 6105.0), 2008–11, ABS (Employee Earnings, Benefits and Trade Union Membership, Cat. no. 6310.0), Total employment, ABS (Labour Force, Australia, Cat. no 6202.0); FOE: ABS (Forms of Employment, Cat. no. 6359.0); FOE (15 to 69): Unpublished data from ABS (Forms of Employment Survey Cat. no. 6359.0) (except for 2001, where data are available from the published catalogue); HILDA: Authors’ estimates based on unpublished data from the HILDA survey, release 10.
Casual employees
Two measures of casual employees are presented in table B.3 –– for ‘self-identified’ casuals and employees without leave entitlements, respectively.
Each of the HILDA, FOE and EEBTUM surveys contain information on employees without leave entitlements — used in this paper as a proxy for casual employees (chapter 3 and appendix A).
45 Data on employees with paid leave entitlements from the EEBTUM and FOE surveys are used
as a proxy for permanent employees (chapter 3).

80 FORMS OF WORK
The HILDA and FOE surveys also contain variables on workers who self-identify as being casual employees. In the FOE survey, the ‘any responsible adult’ collection approach is used which means that the notion of self-identification is only relevant for the survey respondent. The status of other employed people within a household reflects the responding adult’s opinion. Despite this difference, the HILDA and FOE surveys return very similar estimates of the prevalence of self-identified casual employees.
Derivation of estimates of self-identified casuals across time from the FOE survey is complicated by changes in the definitions and sample used (box B.1). To give a picture of changes over time, estimates based on the FOE survey approaches of both 2001 and 2004 are presented.
Table B.3 Prevalence of casual employees, 2001 to 2011a
Per cent
2001 2002 2003 2004 2005 2006 2007 2008 2009 2010 2011
Self-identified casuals FOE 2001b, c 20.0 18.0
FOE 2004c, d 20.1 19.9 19.8 19.0
HILDA 20.4 21.3 20.5 20.0 18.8 19.2 18.0 18.1 18.1 18.0 Employees without leave entitlements
EEBTUMe 19.9 20.0 20.4 20.6 19.6 19.6 19.9 19.1 19.5 19.7 19.8 FOEf 20.6 20.4 20.9 19.6 20.4 19.8 19.9 FOE (15–69)g 20.6 20.9 19.6 20.4 19.8 19.9
a Contributing family workers and unpaid workers are excluded from the estimates. The HILDA survey also excludes employees who answered ‘other’ to a question about their contract of employment. b Estimates based on the FOE survey 2001 methodology are for employed people aged 15 to 69 years, and exclude self-identified casuals among people who have both paid holiday and sick leave. c Estimates based on the FOE survey 2004 methodology are for all employed people, and include self-identified casuals among people who received both paid holiday and sick leave. d Employees recoded by the ABS as independent contractors in 2008, have also been recoded here as casual employees in line with the proportions of casuals among employees with leave entitlements (2.9 per cent) and without leave entitlements (86.5 per cent) in 2007. Owner managers (of incorporated and of unincorporated enterprises) recoded as employees by the ABS in FOE survey 2008 have been excluded from the employee estimate for 2008 on the grounds that a redistribution of this type was not undertaken by the ABS in 2001. e Data on the number of employees without leave entitlements drawn from the EEBTUM survey, as a share of total employment as measured in the LFS. f To create a consistent time series, data for 2008 to 2011 include employees without leave entitlements who were redistributed by the ABS in those four years to the measure of independent contractors. g Based on data for workers aged 15 to 69 years.
Sources: FOE: ABS (Forms of Employment, Cat. no. 6359.0) and Authors’ estimates based on unpublished data from ABS (Labour Force and Forms of Employment Survey 2008); HILDA: Authors’ estimates based on unpublished data from the HILDA survey, release 10; EEBTUM: Employees without leave entitlements, 2001–07, ABS (Australian Labour Market Statistics, Cat. no. 6105.0), 2008–11, ABS (Employee Earnings, Benefits and Trade Union Membership, Cat. no. 6310.0), Total employment, 2001–11, ABS (Labour Force, Australia, Cat. no 6202.0); FOE (15 to 69): Unpublished data from ABS (Forms of Employment Survey, Cat. no. 6359.0) (except for 2001, where data are available from the published catalogue).

CHANGES IN THE PREVALENCE OF FORMS OF WORK
81
Box B.1 Self-identified casual employees in the FOE and HILDA
surveys Changes in both the measure and sample across time complicate estimation of the prevalence of self-identified casual employees using the FOE survey:
• In 2001, employees (excluding owner managers of incorporated enterprises (OMIEs)) who received either or neither paid holiday or sick leave and self-identified as casual were added to the count. The sample was restricted to employed people aged 15 to 69 years.
• In 2004, the measure was further broadened to all employees (excluding OMIEs) who self-identified. All employed people were included in the sample.
• From 2008, the measure was similar to that used since 2004, but the ABS recoded some employees (excluding OMIEs) as independent contractors, and some owner managers of unincorporated enterprises and OMIEs as employees.
The HILDA survey adopts a different approach. Employees (excluding OMIEs) are asked to nominate a category that best describes their contract of employment —fixed-term contract, casual, permanent (or ongoing), or other.
Sources: ABS (Forms of Employment, various issues, Cat. no. 6359.0); HILDA (2010).
Fixed-term employees
Estimates of the prevalence of fixed-term employees from the HILDA survey were higher than those derived using the FOE survey. In 2010, there were approximately 970 000 fixed-term employees in Australia according to the HILDA survey, compared with about 360 000 according to the FOE survey. After canvassing possible explanations for this difference, the Commission (PC 2006, p. 132) concluded that:
On balance, it is likely that the HILDA approach to identifying fixed-term employees allows for better estimates than those obtained by FOES. The FOES survey embodies known sources of underestimation of the number of fixed-term employees … By contrast, possible biases in the HILDA survey may lead to an under- or overestimation.
Although the differences in level estimates are important for some research questions, they are less relevant for an analysis of prevalence changes over time. Neither dataset points to a clear trend in the prevalence of this FOW over the decade to 2011 (table B.4). (As for most other FOWs (section B.1), however, the absolute number of fixed-term employees did increase over the decade.)

82 FORMS OF WORK
Table B.4 Prevalence of fixed-term employees, 2001 to 2011a, b
Per cent
2001 2002 2003 2004 2005 2006 2007 2008 2009 2010 2011
FOE 2001c 3.2 3.0 FOE 2004d 2.9 3.7 3.5 3.0 FOE 2008e 3.0 3.1 3.1 3.4 HILDA 7.4 7.8 7.4 6.9 8.0 7.7 7.6 7.3 8.2 8.6 a Contributing family workers and unpaid workers are excluded from the estimates. The latter also exclude employees who answered ‘other’ to a question about their contract of employment. b FOE survey estimates of fixed-term employees include people who also nominate as casuals. This is not the case for the HILDA survey. c Estimates based on the 2001 FOE survey methodology are for employed people aged 15 to 69 years. d Estimates based on the 2004 FOE survey methodology are for all employed people. e Estimates based on the 2008 FOE survey methodology have not been adjusted for employees reclassified by the ABS as independent contractors. An adjustment has been made to the 2008 estimates reported for the FOE 2001 and 2004 survey methodologies. Employees recoded in this way in 2008 were recoded as fixed-term employees in line with the proportions of fixed-term employees among employees with leave entitlements (4.3 per cent) and without leave entitlements (4.2 per cent) in 2007. OMIEs and OMUEs recoded as employees by the ABS in the 2008 FOE survey have been excluded from estimates reported for the FOE 2001 and 2004 methodologies on the grounds that they were not coded this way in years prior to 2008.
Sources: FOE: ABS (Forms of Employment, Cat. no. 6359.0) and Authors’ estimates based on unpublished data from ABS (Labour Force and Forms of Employment Survey 2008); HILDA: Authors’ estimates based on unpublished data from the HILDA survey, release 10.
Labour hire workers
The HILDA and FOE surveys also return different estimates of the level of labour hire workers. In 2010, there were about 260 000 labour hire workers according to the HILDA survey, compared with about 140 000 in 2011 using the FOE survey. One possible reason for this difference is the collection method used in the FOE survey, where responses for all adults in a household are from only one person (the any responsible adult collection method) (Laplagne and Glover 2005). The responsible adult might not be aware of the FOW status of some household members, leading to underestimation of labour hire worker numbers. On the other hand, it is also possible, given differences in the questions used in the two surveys, that some direct employees of employment and labour hire agencies are included in the HILDA measure of labour hire workers (leading to overestimation of the measure), and that this is less likely to occur in the FOE survey. The Commission (PC 2006, p. 139), noted the conclusion that Laplagne and Glover (2005) made was that ‘… on balance, the HILDA survey allows the most reliable and consistent estimate of the prevalence of labour hire employment’.
Whichever source is consulted, the prevalence of workers who report being paid by labour hire or employment agencies is very low (table B.5), and probably fell slightly across the decade to 2011. It is also likely that the absolute number of labour hire workers fell.

CHANGES IN THE PREVALENCE OF FORMS OF WORK
83
Table B.5 Prevalence of labour hire workers, 2001 to 2011a, b
Per cent
2001 2002 2003 2004 2005 2006 2007 2008 2009 2010 2011
FOE 2001c 1.8 1.2 FOE 2008d 1.2 1.2 HILDA 3.1 3.1 3.1 3.0 2.7 2.5 2.2 2.6 2.4 2.3
a Contributing family workers and unpaid workers are excluded from the estimates. The latter also exclude employees who answered ‘other’ to a question about their contract of employment. b HILDA survey data are based on the response to the question ‘Are you employed through a labour-hire firm or temporary employment agency? That is, the agency pays your wage?’ FOE survey estimates relate to people who report that they are paid by a labour hire firm or employment agency. c Estimates based on the 2001 FOE survey methodology are for employed people aged 15 to 69 years. The estimate for 2008 has been adjusted for employees reclassified in that year by the ABS as independent contractors. For comparability with 2001, estimates are for labour hire employees only (that is, they do not include labour hire workers among independent contractors). d Estimates based on the 2008 FOE survey methodology are for all employed people. These estimates have not been adjusted for employees reclassified in that year, and subsequent years, by the ABS as independent contractors. These estimates include labour hire workers within all categories of employment.
Sources: ABS (Forms of Employment, Cat. no. 6359.0); Authors’ estimates based on unpublished data from ABS (Labour Force and Forms of Employment Survey 2008) and the HILDA survey, release 10.
Owner managers of incorporated enterprises (OMIEs)
Similar estimates of the prevalence of OMIEs in employment are derived from the FOE, EEBTUM and HILDA surveys (table B.6). These sources show evidence of no trend in the prevalence of this type of work over the period 2001 to 2011.
Table B.6 Prevalence of OMIEs, 2001 to 2011a
Per cent
2001 2002 2003 2004 2005 2006 2007 2008 2009 2010 2011
FOEb 7.1 6.6 6.5 7.0 6.5 7.1 6.9 FOE (15 to 69)c 6.9 6.4 7.0 6.4 7.0 6.8 EEBTUMd 6.8 6.5 6.7 6.4 6.7 6.7 6.3 6.4 6.1 6.5 6.4 HILDA 6.0 6.6 5.8 5.8 5.8 6.0 5.4 5.9 6.0 5.6 a Contributing family workers and unpaid workers are excluded from the estimates. The HILDA survey also excludes employees who answered ‘other’ to a question about their contract of employment. b To create a consistent time series, data for 2008 to 2011 include OMIEs who were redistributed by the ABS in those four years to measures of employees. c Based on data for workers aged 15 to 69 years. d Prior to 2008, OMIE estimates in the ABS catalogue Australian Labour Market Statistics (Cat. no. 6105.0) were sourced from the EEBTUM survey in August of each year. Post 2007, they were sourced from the FOE survey, which is collected in November. To retain a series collected in August, OMIE estimates from the EEBTUM survey catalogue underlie figures post-2007 for that series.
Sources: FOE: ABS (Forms of Employment Survey, Cat. no. 6359.0); FOE (15 to 69): Unpublished data from ABS (Forms of Employment Survey, Cat. no. 6359.0); EEBTUM: OMIEs 2001–07, ABS (Australian Labour Market Statistics, Cat. no. 6105.0); OMIEs 2008–11, ABS (Employee Earnings, Benefits and Trade Union Membership, Cat. no. 6310.0), Total employment 2001–11, ABS (Labour Force, Australia, Cat. no 6202.0); HILDA: Authors’ estimates based on unpublished data from the HILDA survey, release 10.

84 FORMS OF WORK
Owner managers of unincorporated enterprises (OMUEs)
Similar estimates of the prevalence of OMUEs with employees (labelled employers) were derived from the FOE survey, LFS and HILDA survey data, but the latter source suggested a slightly lower prevalence of non-employing OMUEs (own account workers) (table B.7). All three sources, however, indicate that the prevalence of these two FOWs trended down over the decade to 2011 (2012 using LFS data46).
Table B.7 Prevalence of OMUEs, 2001 to 2012a, b, c
Per cent
2001 2002 2003 2004 2005 2006 2007 2008 2009 2010 2011 2012
Employersd
FOE (15 to 69) 3.7 2.7
LFS 3.6 3.4 3.1 3.5 3.3 3.0 2.9 2.8 2.8 2.9 2.5 2.2
HILDA 3.7 3.0 3.0 3.1 3.0 2.7 2.5 2.2 2.5 2.5
Own account workerse
FOE (15 to 69)f 8.7 8.5
LFS 10.1 10.5 9.9 10.1 9.9 9.4 9.4 9.2 9.5 9.3 8.9 8.6
HILDA 8.0 7.6 7.1 7.7 7.3 7.4 6.9 6.5 7.1 6.7
All OMUEs
FOEg 12.7 12.1 11.8 11.5 11.6 11.4 10.7
FOE (15 to 69) 12.5 11.5 11.2 11.4 11.1 10.4
LFS 13.8 13.9 13.0 13.6 13.2 12.5 12.3 12.0 12.3 12.2 11.4 10.8
HILDA 11.8 10.6 10.2 10.8 10.3 10.0 9.4 8.7 9.5 9.2
a Contributing family workers and unpaid workers are excluded from both the LFS and the HILDA survey estimates. HILDA survey total employment data also exclude employees who answered ‘other’ to a question about their contract of employment. b FOE (15 to 69) estimates are for people aged 15 to 69 years. c Some numbers do not add due to rounding. d An employer is a person who operates his or her own unincorporated economic enterprise or engages independently in a profession or trade, and hires one or more employees. e An own account worker is a person who operates his or her own unincorporated economic enterprise or engages independently in a profession or trade, and hires no employees. f The FOE survey estimate from 2001 is at odds with the LFS figure, and suggests that nearly 15 per cent of own account workers at that time were aged 70 years and over. A cross–check with EEBTUM survey data indicates that the level of employment implied in this comparison is larger than the total number of OMUEs aged 65 years and over in 2001. It is possible that the FOE survey estimate is too low. g To create a consistent time series, data for 2008 to 2011 include OMUEs who were redistributed by the ABS in those four years to measures of employees.
Sources: FOE: ABS (Forms of Employment Survey, Cat. no. 6359.0); FOE (15 to 69): Unpublished data from ABS (Forms of Employment Survey Cat. no. 6359.0); LFS: Authors’ estimates based on ABS (Labour Force Australia, Cat. no. 6203.0); HILDA: Authors’ estimates based on unpublished data from the HILDA survey, release 10.
The three sources suggest that the prevalence of OMUEs declined by about 2 to 3 percentage points between 2001 and 2011. In absolute terms, employers and own account workers contributed almost equally to this change. In relative terms, the
46 Unfortunately, 2012 data were not available for other FOWs.

CHANGES IN THE PREVALENCE OF FORMS OF WORK
85
decline for employers was much more marked. The similarity in the trends between the HILDA survey and ABS sources suggests that the effect of under-representation of recent arrivals in the HILDA survey on estimates of changes in this FOW is negligible.
Independent contractors
Data on independent contractors are available from the HILDA and FOE surveys only from 2008 onwards. The two sources suggest a reasonably similar prevalence for this FOW, with no clear trend across the years for which data are available (table B.8). (The FOE survey data indicate that the absolute number of independent contractors increased by about 6 per cent between 2008 and 2011.) Discussion of whether the prevalence of independent contractors might have changed between 2001 and 2008 is presented in appendix C.
Table B.8 Prevalence of independent contractors, 2008 to 2011a
Per cent
2008 2009 2010 2011
FOE 9.1 9.6 9.8 9.0
HILDA 11.4 12.6 10.9
a Data exclude contributing family workers and unpaid workers. HILDA survey data also exclude employees who answered ‘other’ to a question about their contract of employment.
Sources: ABS (Forms of Employment, Cat. no. 6359.0); Authors’ estimates based on unpublished data from the HILDA survey, release 10.
Other business operators
Data on other business operators are only available from the FOE survey, and from 2008 onwards. The prevalence of this FOW fell between 2008 and 2009 (a statistically significant fall), and was then stable (table B.9). (In absolute terms, the number of other business operators changed little between 2008 and 2011.) Further discussion of possible longer-term changes in the prevalence of this FOW is in appendix C.
Table B.9 Prevalence of other business operators, 2008 to 2011a
Per cent
2008 2009 2010 2011
FOE 10.0 9.1 9.2 9.2
a Data excludes contributing family workers and unpaid workers.
Source: ABS (Forms of Employment, Cat. no. 6359.0).


CONTRACTORS AND OTHER BUSINESS OPERATORS
87
C Evidence for independent contractors and other business operators
As discussed in chapter 1, a distinction can be drawn between owner-managers who primarily provide labour services directly to clients under commercial contracts, and those who, in the main, sell goods and services, or manage staff. Following the ABS, these two groups are labelled independent contractors (ICs) and other business operators (OBOs), respectively. This appendix examines whether changes in owner manager of unincorporated enterprise (OMUE) employment as a share of total employment over the decade from 2001 can be attributed to changes in the prevalence of one (or both) of these forms of work.
C.1 Definitions and measurement of contractors
The term ‘independent contractor’ is used in Australian law to denote workers who provide labour services under a contract for services rather than as employees (under a contract of service) (Creighton and Stewart 2010).
Some studies have focused on a group labelled ‘self-employed contractors’ (PC 2006; VandenHeuvel and Wooden 1995; Waite and Will 2001). This group is conceptually equivalent to ICs without employees. Unfortunately, changes in data collections over time meant that it was not possible to update previous estimates of self-employed contractors. In each of the four years for which data on ICs were available (2008–2011), the share with no employees was about 79 per cent, indicating that over that period, trends in the prevalence of ICs were indicative of trends for self-employed contractors.
Previous research has also examined ‘dependent contracting’. Some authors have used this term to refer to arrangements where the characteristics of a contractor’s employment are more akin to those of an employee than an IC (PC 2006; VandenHeuvel and Wooden 1995; Waite and Will 2001). Others use it to refer to ICs who are economically dependent on one client, and use the term ‘sham’ contractors for those whose employment arrangements are consistent with those of employees (FWO 2012a).

88 FORMS OF WORK
Estimating the prevalence of these working arrangements is difficult. In 2011, over three quarters of ICs were usually able to simultaneously work on more than one active contract — suggesting that they were not economically dependent on a single client (ABS 2012g). Among those who did not have this characteristic, some were possibly limited to one client at a time by the nature of their work, but were employed by multiple clients across time. More precise estimation of the extent to which ICs are economically dependent on one client is not possible with available data sources.
In terms of sham contracting, one characteristic that differentiates contractors and employees is freedom in the way work is performed (Australian Government 2012). In 2008, nearly 40 per cent of ICs did not have authority over their own working procedures. However, nearly 20 per cent of this group had employees and 56 per cent were able to sub-contract their work, suggesting that a lack of authority over working procedures is consistent with many genuine contracting arrangements (authors’ estimates based on ABS 2010). The extent to which ICs should really be classified as employees is unclear.
Given the limitations of available data relating to ICs, and the observation of prevalence changes for OMUEs, the analysis of non-employees in this report focuses particularly on OMUEs.
C.2 Changes in the prevalence of independent contractors and other business operators
Between 2008 and 2011 there was no trend in the prevalence of owner managers of incorporated enterprises (OMIEs) and OMUEs working as ICs, nor in OMIEs working as OBOs (table C.1). There was a small decline, however, in the prevalence of OMUEs working as OBOs. Constraints on access to credit for the self-employed during the worst of the global financial crisis during 2008–09 could account for some of the decline in that period.

CONTRACTORS AND OTHER BUSINESS OPERATORS
89
Table C.1 Shares in total employment of OMIEs and OMUEs working as ICs or OBOs, 2008 to 2011a
Per cent
OMIEs OMUEs
ICs OBOs ICs OBOs
2008 2.5 4.3 5.5 5.6 2009 2.5 3.9 6.1 5.3 2010 2.7 4.2 6.1 5.0 2011 2.4 4.3 5.6 4.9 a Estimates for ICs are smaller than those presented in table B.8, appendix B because table B.8 includes employees coded as contractors.
Source: Authors’ estimates based on ABS (Forms of Employment, Cat. no. 6359.0).
Is it likely that the decline in the prevalence of OMUEs between 2001 and 2008 was due entirely to declines in OBO employment? Insight into this question can be gained by looking at the industries and occupations in which the two types of OMUEs worked. In 2008, although over three-quarters of OMUEs worked in eight (of nineteen) industries (table C.2), the industries in which ICs and OBOs were relatively concentrated were quite different. For example, one-third of ICs worked in construction (but only 9 per cent of OBOs), and one-quarter of OBOs worked in agriculture, forestry and fishing (but only 5 per cent of ICs).
Table C.2 Disaggregation of OMUE employment by industry and IC/OBO status, 2008 Per cent
As a share of all OMUEs As a share of OMUEs in each industry
ICs OBOs ICs OBOs Agriculture, forestry and fishing 4.8 23.7
16.6 83.4
Construction 34.9 9.1 78.9 21.1 Retail trade 2.9 12.2 19.1 80.9 Accommodation and food services 0.8 6.1
11.3 88.7
Transport, postal and warehousing 8.6 3.2
72.3 27.7
Professional, scientific and technical services 14.6 7.6
65.2 34.8
Administrative and support services 7.1 3.4
67.1 32.9
Other services 6.0 11.1 34.4 65.6 Total 79.7 76.5 49.5 50.5
Source: Authors’ estimates based on ABS (Microdata: LFS and FOE Survey CURF, Cat. no. 6202.0.30.007).

90 FORMS OF WORK
Similarly, although one-half of all OMUEs worked as ICs and the other half as OBOs, within industries there were marked differences in the proportions of OMUEs working as ICs or OBOs. For example, about 80 per cent of OMUEs in agriculture and retail were OBOs. In contrast, the vast majority in construction and transport were ICs.
The concentrations of OMUE ICs and OBOs also varied both across and within occupations (table C.3). Over 90 per cent of OMUEs worked within six (of eight) occupations. The majority employed as managers were OBOs and the majority of technicians and trades workers and machinery operators and drivers were ICs.
Table C.3 Disaggregation of OMUE employment by occupation and IC/OBO status, 2008 Per cent
As a share of all OMUEs As a share of OMUEs in each
occupation
ICs OBOs ICs OBOs
Managers 11.3 39.1 22.1 77.9 Professionals 21.5 16.5 56.0 44.0 Technicians and trades workers 32.0 16.3
65.8 34.2
Clerical and administrative workers 6.9 9.2
42.3 57.7
Machinery operators and drivers 8.1 2.5
76.1 23.9
Labourers 13.8 7.8 63.3 36.7 Total 93.7 91.4 49.5 50.5
Source: Authors’ estimates based on ABS (Microdata: LFS and FOE Survey CURF, Cat. no. 6202.0.30.007).
In combination with the shift-share results presented for OMUEs by industry (appendix F) and occupation (appendix G), these data support a hypothesis that the decline in the prevalence of OMUEs between 2001 and 2010 was due to changes in both IC and OBO employment. Those analyses indicate that declines in the prevalence of OMUEs were particularly due to factors that affected:
• agriculture and retail — industries in which OBOs are relatively concentrated
• construction and transport — industries of relatively high IC employment
• managers and clerical and administrative workers — occupations in which OBOs are relatively concentrated
• technicians and trades workers and machinery operators and drivers —occupations in which OMUE ICs are more prevalent than OBOs.

SHIFT-SHARE DECOMPOSITION
91
D Shift–share decomposition
To shed light on the factors that might have influenced changes in the prevalence of different forms of work (FOWs) in the decade to 2011, changes in employment in each FOW are decomposed into three components — termed, in this report, growth, share and shift effects.47
The growth effect measures the extent to which employment in a FOW would have increased if job growth had simply replicated the profile of employment in 2001. In this case, the FOW would have grown at the same rate as employment overall, and its prevalence would have been constant over time. Observation of prevalence changes means that one or both of the other two effects were at work.
The share effect reflects the impact of changes in the mix of employment, for example, between states, industries or occupations. Relatively rapid job growth in occupations in which permanent employees were concentrated, for example, would have translated into employment growth above the national average for this FOW (other things equal). The prevalence of permanent employees would have increased as a result.
The shift effect picks up changes in a FOW due to relatively fast or slow growth of that employment type within sectors of the workforce. For example, if casual employment expanded more rapidly than other FOWs within a number of industries, the prevalence of this FOW would have increased (other things equal).
A characteristic of the decomposition is that the sum of each of the aggregate share and shift effects must be zero. This condition also holds for the shift effects (but not the share) for each element of a decomposition. For example, shift effects for agriculture must sum to zero across FOWs, as must the aggregate of each of the share and shift effects in the industry-level analysis.
47 Authors use a range of terms for these effects. For example, in decomposing regional growth
rates, Econsearch (2012) refers to share (or state growth), proportionality shift (or industry mix) and differential shift (or regional) components. Simpson, Dawkins and Madden (1997) use the terms growth, structural and share effects, respectively. Gilfillan and Andrews (2010) labelled the components of a shift–share analysis of changes in mature women’s employment as change in total employment, change in industry structure and within industry change.

92 FORMS OF WORK
Shift–share decompositions are undertaken for changes in FOW employment by state, industry, occupation, age cohort and full-time and part-time status by gender.
More formally, let:
• 𝑖 = 1 … 𝐼 represent I states, industries, occupations etc
• 𝑓 represent a form of work
• 𝑁 represent Australia
• 𝐸 𝑟𝑒𝑝𝑟𝑒𝑠𝑒𝑛𝑡 𝑒𝑚𝑝𝑙𝑜𝑦𝑚𝑒𝑛𝑡
• 𝑡0 represent 2001
• 𝑡1 represent 2011 • 𝐺𝑅𝑓 represent the growth effect for FOW f • 𝑆𝐻𝑓 represent the share effect for FOW f
• 𝐹𝑇𝑓 represent the shift effect for FOW f
Then, the change in FOW f between 2001 and 2011 can be described as:
𝐸𝑓𝑡1 − 𝐸𝑓𝑡0 = 𝐸𝑓𝑡0 ∗ �𝐸𝑓𝑡1
𝐸𝑓𝑡0− 1� = �𝐸𝑓𝑖𝑡0 ∗
𝐼
𝑖
�𝐸𝑓𝑖𝑡1
𝐸𝑓𝑖𝑡0− 1�
The final term in this expression can be decomposed as follows:
�𝐸𝑓𝑖𝑡0 ∗𝐼
𝑖
�𝐸𝑓𝑖𝑡1
𝐸𝑓𝑖𝑡0− 1� = �𝐸𝑓𝑖𝑡0 ∗
𝐼
𝑖
��𝐸𝑁𝑡1
𝐸𝑁𝑡0− 1� + �
𝐸𝑖𝑡1
𝐸𝑖𝑡0−𝐸𝑁𝑡1
𝐸𝑁𝑡0� + �
𝐸𝑖𝑓𝑡1
𝐸𝑖𝑓𝑡0−𝐸𝑖𝑡1
𝐸𝑖𝑡0��
The three elements of this decomposition represent the growth, share and shift effects:
𝐺𝑅𝑓 = �𝐸𝑓𝑖𝑡0 ∗𝐼
𝑖
�𝐸𝑁𝑡1
𝐸𝑁𝑡0− 1�
𝑆𝐻𝑓 = �𝐸𝑓𝑖𝑡0 ∗𝐼
𝑖
�𝐸𝑖𝑡1
𝐸𝑖𝑡0−𝐸𝑁𝑡1
𝐸𝑁𝑡0�
𝐹𝑇𝑓 = �𝐸𝑓𝑖𝑡0 ∗𝐼
𝑖
�𝐸𝑖𝑓𝑡1
𝐸𝑖𝑓𝑡0−𝐸𝑖𝑡1
𝐸𝑖𝑡0�

EMPLOYMENT CHANGES AT A STATE LEVEL
93
E Employment changes at a state level
The contributions of different states to changes in the prevalence of each form of work (FOW) are described in this appendix using insights from shift–share analysis.48
E.1 Employment growth by state was uneven
Employment growth in Australia averaged 25 per cent between 2001 and 2011, but varied markedly between states (table E.1). Three states — Queensland, Western Australia and the Northern Territory — grew faster than the average. Reflecting this, these states accounted for a disproportionate share of job creation (42 per cent, in contrast with an employment share of 30 per cent in 2001). Another 1.1 million net new jobs were created in New South Wales and Victoria, or 49 per cent of the total, whereas these states accounted for 58 per cent of employment in 2001.
Table E.1 Employment growth around the country was uneven between 2001 and 2011
Employment share 2001
Growth 2001–2011
Growth 2001–2011
Contribution to growth
% % ’000 % New South Wales 33.3 18.3 556 24.1 Victoria 25.1 25.2 577 25.0 Queensland 18.8 37.0 633 27.4 South Australia 7.5 20.3 139 6.0 Western Australia 10.2 32.9 308 13.3 Tasmania 2.2 17.7 36 1.5 Northern Territory 1.1 28.2 27 1.2 Australian Capital Territory 1.9 19.6 33 1.4 Australia 100.0 25.3 2 309 100.0
Source: ABS (Labour Force, Australia, Cat. no. 6202.0).
The profile of job creation within states by industry and occupation also varied markedly. Each state’s experience was different. But within that variation, there were some commonalities.
48 The term ‘states’ is used throughout as shorthand for states and territories.

94 FORMS OF WORK
Following Borland (2011), and to simplify the discussion, the label ‘mining’ states is used for Queensland, Western Australia and the Northern Territory, and ‘non-mining’ states for the rest of the country. Other authors have used the term mining states to refer only to Queensland and Western Australia (RBA 2008), and Queensland, Western Australia and South Australia (Hughes 2008). However, broad characteristics of job growth by industry and occupation support the grouping adopted in this paper. For example, tables E.2 and E.3 show that, in comparison with the rest of the country, job creation in the mining states as a group was relatively:
• concentrated in mining
• strong in manufacturing — employment in this industry did not shrink in the mining states, although it did shrink nationwide.
• slow in producer, social and personal services — these industries accounted for 56 per cent of net new jobs in the mining states, 76 per cent in non-mining states
• rapid in blue collar and lower skill occupations — for example, nearly one-third of jobs added to the mining state workforce were blue collar, in contrast with about 20 per cent in the non-mining states.

95
Tabl
e E.
2 C
ontr
ibut
ions
of d
iffer
ent i
ndus
trie
s to
em
ploy
men
t gro
wth
bet
wee
n 20
01 to
201
1, b
y st
atea
Pe
r cen
t
N
SW
V
IC
QLD
S
A
WA
TAS
N
T A
CT
Aus
t. M
inin
g N
on-m
inin
g
Agr
icul
ture
, for
estry
and
fish
ing
-7.0
-2
.8
-4.1
-5
.9
-3.0
-1
0.0
-3.8
-1
.5
-4.5
-3
.7
-5.0
M
inin
g 4.
3 1.
3 6.
6 3.
6 19
.7
5.3
12.3
0.
0 6.
2 10
.9
2.8
Man
ufac
turin
g -6
.7
-6.7
1.
3 -6
.8
0.6
-6.0
0.
9 -4
.4
-3.5
1.
0 -6
.6
Ele
ctric
ity, g
as, w
ater
and
was
te s
ervi
ces
2.3
2.8
3.7
3.7
2.3
5.3
4.7
2.2
3.0
3.3
2.8
Con
stru
ctio
n 11
.4
17.5
15
.5
20.0
17
.1
26.7
24
.5
19.3
15
.8
16.3
15
.5
Dis
trib
utio
n se
rvic
es
15.1
16
.6
17.8
14
.4
14.8
3.
3 7.
5 -1
2.6
15.4
16
.6
14.6
W
hole
sale
trad
e 2.
6 4.
2 1.
1 3.
2 2.
3 0.
0 1.
9 0.
0 2.
5 1.
5 3.
2 R
etai
l tra
de
8.0
9.2
9.5
9.4
8.4
4.0
3.8
-7.4
8.
5 9.
0 8.
2 T
rans
port,
pos
tal a
nd w
areh
ousi
ng
5.8
4.4
6.1
2.1
4.8
0.7
4.7
-0.7
5.
0 5.
7 4.
5 I
nfor
mat
ion
med
ia a
nd te
leco
mm
unic
atio
ns
-1.3
-1
.2
1.0
-0.4
-0
.7
-1.3
-2
.8
-4.4
-0
.6
0.4
-1.3
Pr
oduc
er s
ervi
ces
21
.6
25.2
18
.0
18.5
13
.5
14.0
18
.9
2.2
19.8
16
.6
22.2
F
inan
cial
and
insu
ranc
e se
rvic
es
5.5
5.1
1.7
3.2
0.2
4.7
0.9
-3.0
3.
3 1.
2 4.
9 R
enta
l, hi
ring
and
real
est
ate
serv
ices
1.
7 3.
2 2.
8 0.
9 1.
1 1.
3 3.
8 -1
.5
2.2
2.3
2.2
Pro
fess
iona
l, sc
ient
ific
and
tech
nica
l ser
vice
s 13
.2
12.5
9.
6 12
.3
9.8
6.0
9.4
5.2
11.3
9.
6 12
.4
Adm
inis
trativ
e an
d su
ppor
t ser
vice
s 1.
1 4.
4 4.
0 2.
1 2.
5 2.
0 4.
7 1.
5 3.
0 3.
5 2.
7 So
cial
ser
vice
s 42
.5
33.5
34
.2
41.2
28
.6
45.3
16
.0
81.5
36
.4
32.0
39
.5
Pub
lic a
dmin
istra
tion
and
safe
ty
11.6
4.
1 9.
0 11
.2
8.4
8.7
-4.7
65
.9
9.1
8.4
9.6
Edu
catio
n an
d tra
inin
g 9.
6 9.
5 7.
3 9.
6 8.
2 18
.0
3.8
8.9
8.8
7.5
9.8
Hea
lth c
are
and
soci
al a
ssis
tanc
e 21
.3
19.9
18
.0
20.3
12
.0
18.7
17
.0
6.7
18.5
16
.1
20.1
Pe
rson
al s
ervi
ces
16.4
12
.7
7.0
11.4
6.
6 16
.7
19.8
13
.3
11.3
7.
2 14
.2
Acc
omm
odat
ion
and
food
ser
vice
s 9.
1 7.
3 4.
8 8.
4 2.
2 12
.7
5.7
12.6
6.
6 4.
0 8.
4 A
rts a
nd re
crea
tion
serv
ices
3.
8 4.
0 1.
9 3.
0 2.
8 4.
0 8.
5 2.
2 3.
2 2.
4 3.
8 O
ther
ser
vice
s 3.
5 1.
5 0.
3 0.
0 1.
6 0.
0 5.
7 -1
.5
1.6
0.9
2.1
Tota
l 10
0.0
100.
0 10
0.0
100.
0 10
0.0
100.
0 10
0.0
100.
0 10
0.0
100.
0 10
0.0
Prod
ucer
, Soc
ial a
nd P
erso
nal s
ervi
ces
80.5
71
.5
59.3
71
.1
48.6
76
.0
54.7
97
.0
67.6
55
.8
75.9
a
Tota
ls m
ight
not
add
to 1
00 b
ecau
se o
f rou
ndin
g.
Sou
rce:
AB
S (L
abou
r For
ce A
ustra
lia, D
etai
led,
Cat
. no.
629
1.0.
55.0
03).

96
Tabl
e E.
3 C
ontr
ibut
ions
of d
iffer
ent o
ccup
atio
ns to
em
ploy
men
t gro
wth
bet
wee
n 20
01 to
201
1, b
y st
atea
Pe
r cen
t
N
SW
V
IC
QLD
S
A
WA
TAS
N
T A
CT
Aus
t. M
inin
g N
on-m
inin
g
Man
ager
s 15
.1
12.9
14
.6
16.8
15
.9
12.7
14
.8
30.6
14
.8
15.0
14
.6
Far
mer
s an
d fa
rm m
anag
ers
-3.9
-3
.0
-2.2
-2
.7
-0.2
-7
.3
0.9
-1.5
-2
.6
-1.5
-3
.4
Oth
er m
anag
ers
19.0
15
.9
16.8
19
.5
16.1
20
.0
13.9
32
.1
17.4
16
.5
18.0
Pr
ofes
sion
als
38.8
30
.4
27.0
28
.6
24.3
37
.3
30.6
35
.1
30.8
26
.3
34.0
Te
chni
cian
s an
d tra
des
wor
kers
11
.1
12.7
15
.1
12.7
19
.8
10.0
20
.4
12.7
14
.0
16.7
11
.9
Com
mun
ity a
nd p
erso
nal s
ervi
ce w
orke
rs
17.0
16
.6
11.7
15
.9
9.5
21.3
12
.0
17.9
14
.4
11.0
16
.8
Cle
rical
and
adm
inis
trativ
e w
orke
rs
3.3
8.9
10.9
11
.6
8.4
3.3
15.7
9.
0 8.
2 10
.3
6.7
Sale
s w
orke
rs
6.9
8.5
7.1
5.9
2.3
4.7
5.6
-7.5
6.
4 5.
6 7.
1 M
achi
nery
ope
rato
rs a
nd d
river
s 5.
7 2.
7 7.
8 2.
3 11
.4
1.3
8.3
1.5
6.0
9.0
3.9
Labo
urer
s 2.
1 7.
4 5.
6 6.
3 8.
4 9.
3 -7
.4
0.7
5.5
6.1
5.0
Tota
l 10
0.0
100.
0 10
0.0
100.
0 10
0.0
100.
0 10
0.0
100.
0 10
0.0
100.
0 10
0.0
Whi
te c
olla
rb
81.0
77
.3
71.4
78
.8
60.4
79
.3
78.7
85
.1
74.6
68
.1
79.2
Blue
col
larb
19
.0
22.7
28
.6
21.3
39
.6
20.7
21
.3
14.9
25
.4
31.9
20
.8
Hig
her s
kill
excl
udin
g fa
rmer
sc
57.8
46
.3
43.8
48
.0
40.3
57
.3
44.4
67
.2
48.2
42
.7
52.0
Low
er s
killd
14
.7
18.5
20
.6
14.4
22
.1
15.3
6.
6 -5
.2
17.9
20
.7
15.9
a To
tals
mig
ht n
ot a
dd t
o 10
0 be
caus
e of
rou
ndin
g.
b W
hite
col
lar
occu
patio
ns a
re d
efin
ed t
o in
clud
e m
anag
ers,
pro
fess
iona
ls,
com
mun
ity a
nd p
erso
nal s
ervi
ce
wor
kers
, cl
eric
al a
nd a
dmin
istra
tive
wor
kers
and
sal
es w
orke
rs.
Blu
e co
llar
incl
ude
tech
nici
ans
and
trade
wor
kers
, m
achi
nery
ope
rato
rs a
nd d
river
s an
d la
bour
ers.
c
Hig
her
skill
exc
ludi
ng fa
rmer
s is
def
ined
to in
clud
e ot
her
man
ager
s an
d pr
ofes
sion
als.
d
Low
er s
kill
is d
efin
ed t
o in
clud
e sa
les
wor
kers
, mac
hine
ry o
pera
tors
and
dr
iver
s an
d la
bour
ers.
S
ourc
e: A
BS
(Lab
our F
orce
Aus
tralia
, Det
aile
d, C
at. n
o. 6
291.
0.55
.003
).

EMPLOYMENT CHANGES AT A STATE LEVEL
97
E.2 Changes in forms of work by state
The distributions of employment by FOW and by state were reasonably similar in 2001 (table E.4). For example, the mining states accounted for 28 per cent of permanent employees and 30 per cent of employment overall.
Table E.4 Distribution of employment within states by FOW, 2001a Per cent
Permanent employees Casuals OMIEsb OMUEsc
Total
Mining 27.6 33.4 28.5 33.2 29.6 Queensland 16.8 22.2 18.0 20.9 18.5 Western Australia 9.9 10.4 9.7 11.7 10.2 Northern Territory 1.0 0.8 0.9 0.7 0.9
Non-mining 72.4 66.6 71.5 66.8 70.4 New South Wales 34.9 30.2 36.6 32.4 33.7 Victoria 26.4 23.6 26.7 22.2 25.3 South Australia 6.9 8.7 5.1 8.6 7.4 Tasmania 2.0 2.3 1.7 2.5 2.1 Australian Capital Territory 2.1 1.8 1.3 1.1 1.8
Australia 100.0 100.0 100.0 100.0 100.0 a Totals might not add due to rounding. b Owner managers of incorporated enterprises. c Owner managers of unincorporated enterprises. Source: ABS (Australian Labour Market Statistics, Cat. no. 6105.0).
Given the relatively rapid employment growth recorded by the mining states, these differences in prevalence in 2001 might have been expected to translate into a smaller share of permanent employees, and increases for casuals and owner managers of unincorporated enterprises (OMUEs), nationwide, in 2011. However, slower growth in the non-mining states, in which permanent employees were relatively concentrated (and casuals and OMUEs less so), offset the effects of faster mining state expansion. As a result, share effects were very small contributors to employment change for each FOW (tables E.5 to E.8). Shift effects are the key to understanding changes in the prevalence of different FOWs from the perspective of state-level employment growth.

98 FORMS OF WORK
Table E.5 Shift–share analysis for permanent employees Change Decomposition Share of:
2001 to 2011 Growth Share Shift 2001 emp. Shift effect
’000 ’000 ’000 ’000 % %
Mining 785.2 387.0 176.8 221.4 27.6 62.9 Queensland 504.3 235.4 122.8 146.1 16.8 41.5 Western Australia 251.4 138.2 41.3 71.9 9.9 20.4 Northern Territory 29.4 13.4 12.6 3.4 1.0 1.0
Non-mining 949.2 1 013.9 -195.0 130.3 72.4 37.1 New South Wales 369.2 488.8 -153.7 34.1 34.9 9.7 Victoria 398.1 370.3 -20.2 48.0 26.4 13.6 South Australia 109.5 97.2 -13.4 25.7 6.9 7.3 Tasmania 36.8 28.4 -4.1 12.5 2.0 3.5 Australian Capital Territory 35.6
29.2 -3.7 10.1
2.1 2.9
Australia 1 734.4 1 400.9 -18.3 351.8 100.0 100.0 a The source data contain a break in series. Estimates for 2001 are for August, and 2011 estimates are for November. The effect of this break is discussed at footnote 49.
Source: Authors’ estimates based on ABS (Australian Labour Market Statistics, Cat. no. 6105.0).
Table E.6 Shift–share analysis for casual employees Change Decomposition Share of:
2001 to 2011 Growth Share Shift 2001 emp. Shift effect
’000 ’000 ’000 ’000 % %
Mining 171.5 156.6 72.4 -57.5 33.4 332.2 Queensland 109.1 103.9 54.2 -49.0 22.2 283.3 Western Australia 52.2 48.9 14.6 -11.3 10.4 65.1 Northern Territory 10.1 3.8 3.6 2.8 0.8 -16.2
Non-mining 293.8 312.5 -58.9 40.2 66.6 -232.2 New South Wales 169.0 141.9 -44.6 71.7 30.2 -414.8 Victoria 83.0 110.5 -6.0 -21.5 23.6 124.5 South Australia 32.8 41.0 -5.7 -2.5 8.7 14.6 Tasmania 7.8 10.7 -1.5 -1.4 2.3 8.2 Australian Capital Territory 1.2
8.4 -1.0 -6.1
1.8 35.3
Australia 465.3 469.1 13.5 -17.3 100.0 100.0 a The source data contain a break in series. Estimates for 2001 are for August, and 2011 estimates are for November. The effect of this break is discussed at footnote 49.
Source: Authors’ estimates based on ABS (Australian Labour Market Statistics, Cat. no. 6105.0).
.

EMPLOYMENT CHANGES AT A STATE LEVEL
99
Table E.7 Shift–share analysis for OMIEs by jurisdictiona
Change Decomposition Share of:
2001 to 2011 Growth Share Shift 2001 emp. Shift effect
’000 ’000 ’000 ’000 % %
Mining 73.9 45.5 20.9 7.5 28.5 41.9 Queensland 63.7 28.6 14.9 20.1 18.0 111.7 Western Australia 9.8 15.4 4.6 -10.2 9.7 -56.9 Northern Territory 0.4 1.4 1.3 -2.3 0.9 -12.9
Non-mining 101.8 113.8 -22.4 10.4 71.5 58.1 New South Wales 19.3 58.2 -18.3 -20.7 36.6 -114.8 Victoria 63.9 42.6 -2.3 23.6 26.7 131.3 South Australia 17.0 8.1 -1.1 10.1 5.1 56.0 Tasmania -0.6 2.8 -0.4 -2.9 1.7 -16.4 Australian Capital Territory 2.2 2.1 -0.3 0.4 1.3 2.0
Australia 175.7 159.3 -1.5 18.0 100.0 100.0 a The source data contain a break in series. Estimates for 2001 are for August, and 2011 estimates are for November. The effect of this break is discussed at footnote 49.
Source: Authors’ estimates based on ABS (Australian Labour Market Statistics, Cat. no. 6105.0).
Table E.8 Shift–share analysis for OMUEs by jurisdictiona Change Decomposition Share of:
2001 to 2011 Growth Share Shift 2001 emp. Shift effect
’000 ’000 ’000 ’000 % %
Mining -15.4 107.5 48.6 -171.5 33.2 48.7 Queensland -14.3 67.6 35.3 -117.2 20.9 33.2 Western Australia -1.4 37.7 11.3 -50.4 11.7 14.3 Northern Territory 0.3 2.2 2.1 -3.9 0.7 1.1
Non-mining -7.1 216.2 -42.3 -181.0 66.8 51.3 New South Wales -13.4 104.8 -33.0 -85.2 32.4 24.2 Victoria 17.9 71.9 -3.9 -50.1 22.2 14.2 South Australia -9.2 27.9 -3.9 -33.2 8.6 9.4 Tasmania -1.3 8.0 -1.1 -8.1 2.5 2.3 Australian Capital Territory -1.2 3.6 -0.4 -4.3 1.1 1.2
Australia -22.5 323.7 6.3 -352.5 100.0 100.0 a The source data contain a break in series. Estimates for 2001 are for August and 2011 are for November. The effect of this break is discussed at footnote 49.
Source: Authors’ estimates based on ABS (Australian Labour Market Statistics, Cat. no. 6105.0).

100 FORMS OF WORK
In the decade to 2011, permanent employee numbers expanded by 1.73 million (table E.5). If this FOW had grown in line with employment overall, an additional 1.4 million permanent roles would have been created. Beyond this, an increase of 352 000 occurred because this FOW grew more rapidly than others. This shift towards permanent employees was disproportionately a mining state phenomenon. If it had occurred evenly across the country, mining states’ contribution to the total would have been in line with their share of permanent employees in 2001 — 28 per cent. Instead, it was 63 per cent.
The shift towards permanent employees was mirrored in a similar sized shift (353 000) away from OMUEs (table E.8). As a result, the overall level of OMUE employment changed very little between 2001 and 2011.49 Although mining and non-mining states each accounted for about 50 per cent of the shift, it was a more marked phenomenon in the relatively smaller mining-state labour markets (discussed below).
Looking at casuals, the negative shift effect in mining states is in contrast to the positive effect for non-mining states (driven by New South Wales).50 Although these shifts were relatively small, the difference in sign for the two state groups is important, and will be discussed further in the context of shift–share analysis of employment changes by occupation in appendix G.
The different experiences of the mining and non-mining states are seen most clearly in their respective prevalence estimates. Two sets of estimates are presented. The first, from the Australian Labour Market Statistics (ALMS) collection, reflects the changes in FOWs presented in the preceding tables. The second set of estimates is based on data from the Forms of Employment (FOE) Survey for people aged 15 to 69 years. These estimates are presented as a cross-check because there is a break in series in the ALMS in 2008 (appendix A). Both sources support a similar conclusion. Considerably larger prevalence changes for permanent employees and OMUEs were recorded in the mining states. For example, the prevalence of permanent employees (among people aged 15 to 69 years) increased by
49 OMUE employment increased by about 4 per cent (or 50 000) and the shift effect was about
275 000. The difference in figures presented arises because of a break in series in the source data and seasonality in OMUE employment. As discussed in appendix A, data for 2001 are for August, and 2011 data are for November. The break in series slightly overstates the extent to which OMUE employment grew more slowly than other FOWs. Conversely, growth for the other FOWs is likely to be slightly overstated.
50 Until 2011, the shift effect for Victoria for casuals was also positive.

EMPLOYMENT CHANGES AT A STATE LEVEL
101
5 percentage points between 2001 and 2011, much more than the 2 percentage points in the rest of the country (table E.9).51
At a national level, the mining states were responsible for all of the increased prevalence of permanent employees. Although employment in this FOW increased within the non-mining states in the decade to 2011, it did so at a slower rate than employment overall. As a result, permanent employees in the non-mining states fell as a share of national employment.
Table E.9 Changes in the prevalence of different FOWs, 2001 to 2011, mining and non-mining statesa, b Percentage points
Permanent employees Casuals OMIEs OMUEs
ALMS FOE ALMS FOE ALMS FOE ALMS FOE
Mining 6.0 5.2 -1.5 -1.9 0.2 0.3 -4.7 -3.7 Non-mining 1.7 2.0 0.5 -0.2 0.1 -0.3 -2.4 -1.4 a ALMS — Australian Labour Market Statistics; FOE — Forms of Employment Survey. b ALMS estimates are for all workers. FOE estimates for workers aged 15 to 69 years.
Sources: Authors’ estimates based on ABS (Australian Labour Market Statistics, Cat. no. 6105.0) and unpublished data from ABS (Forms of Employment, Cat. no. 6359.0).
In summary, changes in the distribution of economic activity across the country were not a factor in the increased prevalence of permanent employees or decreased prevalence of OMUEs. An explanation for those prevalence changes must be sought in factors at work within states and, in particular, within the mining states.
E.3 Patterns in FOW shift effects across the decade
The shift towards permanent employees did not occur smoothly over the decade, but was consistently dominated by changes in the mining states (figure E.1). An increase in the shift effect from one year to the next indicates that permanent employee numbers grew more rapidly than employment overall within a state grouping between those years. Conversely, a decrease reflects the opposite relationship between the two growth rates.
Much of the relatively rapid growth in mining states occurred between 2001 and 2008. However, after a dip in 2009, permanent employee numbers again expanded 51 It is unclear whether the small decline in the prevalence of casual employment in the
non-mining states in the FOE survey estimates is due to: the fact that this survey only covers people aged 15 to 69 years; estimates from the FOE survey being too low (as discussed in the notes to table B.7); or some other factor.

102 FORMS OF WORK
more quickly than employment overall in those labour markets between 2009 and 2010. In contrast, there was not much difference between permanent employee and total employment growth in the non-mining states after 2006, with the exception of growth between 2010 and 2011. It is unclear whether this change was an artefact of the data, or a change in non-mining state labour markets. More years of data would help determine whether this change marked the start of a trend.52
The pattern of shift effects over the decade for casual employment in the mining states reveals no trend (figure E.2). For the non-mining states (dominated by New South Wales and Victoria), the shift effect peaked in 2009 and then diminished. In other words, casual employment grew less rapidly than employment overall in those states post-2009.53
Employment of OMIEs within each of the state groupings grew at a similar rate to employment overall (figure E.3). For OMUEs, relatively slow growth occurred quite steadily across the decade (figure E.4).
Figure E.1 Shift effects for permanent employees over the decade to 2011a
a The shift–share decompositions underlying this figure are available on request.
Source: Authors’ estimates based on ABS (Australian Labour Market Statistics, Cat. no. 6105.0).
52 If the result for non-mining states was an artefact of the data, and assuming the shift to 2010
was a more accurate reflection of what happened around the country, the mining states’ contribution to the shift effect increases to 84 per cent.
53 Shift effects for casuals in Victoria were positive prior to 2011. In other words, the negative effect in 2011 reported in table E.6 represents a change on the experience of previous years.
0
50
100
150
200
250
2005 2006 2007 2008 2009 2010 2011
Thou
sand
s
Shift from 2001 to
Mining
Non-mining

EMPLOYMENT CHANGES AT A STATE LEVEL
103
Figure E.2 Shift effects for casual employees over the decade to 2011a
a The shift–share decompositions underlying this figure are available on request.
Source: Authors’ estimates based on ABS (Australian Labour Market Statistics, Cat. no. 6105.0).
Figure E.3 Shift effects for OMIEs over the decade to 2011a
a The shift–share decompositions underlying this figure are available on request.
Source: Authors’ estimates based on ABS (Australian Labour Market Statistics, Cat. no. 6105.0).
-250
-200
-150
-100
-50
0
50
100
150
200
250
2005 2006 2007 2008 2009 2010 2011
Thou
sand
s
Shift from 2001 to
MiningNon-mining
-250-200-150-100
-500
50100150200250
2005 2006 2007 2008 2009 2010 2011
Thou
sand
s
Shift from 2001 to
Mining
Non-mining

104 FORMS OF WORK
Figure E.4 Shift effects for OMUEs over the decade to 2011a
a The shift–share decompositions underlying this figure are available on request.
Source: Authors’ estimates based on ABS (Australian Labour Market Statistics, Cat. no. 6105.0).
-250
-200
-150
-100
-50
0
2005 2006 2007 2008 2009 2010 2011
Thou
sand
s
Shift from 2001 to
Mining
Non-mining

EMPLOYMENT CHANGES AT AN INDUSTRY LEVEL
105
F Employment changes at an industry level
The contributions of different industries to changes in the prevalence of each form of work (FOW) are described in this appendix.
F.1 Industry growth was far from uniform
The structure of employment by industry was reasonably similar in the mining and non-mining states in 2001 (table F.1).54,55 Agriculture, mining and personal services accounted for a larger share of employment in the mining states (22 versus 17 per cent) and manufacturing and producer services accounted for a larger share in the non-mining states (29 versus 24 per cent).
Over the decade to 2011, sectoral contributions to job growth in the two state groupings had points of both difference and similarity. For example, as noted in appendix E, mining was a larger contributor in the mining states, and producer, social and personal services played a smaller role (accounting for 56 per cent of new jobs in the mining states, and 76 per cent in non-mining states). Although manufacturing employment grew slightly in the mining states, it shrank in the rest of the country.
The state groupings had in common an absolute fall in the number of people employed in agriculture, forestry and fishing, and relatively large contributions to employment growth from construction, health care and social assistance, and professional, scientific and technical services.
54 The term ‘states’ is used throughout as shorthand for states and territories. 55 Data are based on a worker’s industry of employment in his or her main job.

10
6
Tabl
e F.
1 Em
ploy
men
t gro
wth
by
indu
stry
, min
ing
and
non-
min
ing
stat
es, 2
001–
2011
Min
ing
N
on-m
inin
g
Em
ploy
men
t sh
are
2001
G
row
th
2001
–11
Gro
wth
20
01–1
1 C
ontri
butio
n to
gro
wth
Em
ploy
men
t sh
are
2001
G
row
th
2001
–11
Gro
wth
20
01–1
1 C
ontri
butio
n to
gr
owth
%
%
’0
00
%
%
%
’0
00
%
Agr
icul
ture
, min
ing
7.4
34.2
69
7.
1
4.9
-9.7
-3
0 -2
.2
Agr
icul
ture
, for
estry
and
fish
ing
5.5
-24.
1 -3
6 -3
.7
4.
5 -2
4.3
-69
-5.0
M
inin
g 1.
9 20
4.4
105
10.9
0.4
143.
5 39
2.
8 M
anuf
actu
ring
9.7
3.8
10
1.0
12
.4
-11.
6 -9
1 -6
.6
Util
ities
, con
stru
ctio
n 9.
1 76
.8
189
19.5
7.9
49.8
25
1 18
.3
Ele
ctric
ity, g
as, w
ater
and
was
te s
ervi
ces
0.9
126.
0 32
3.
3
0.9
66.4
38
2.
8 C
onst
ruct
ion
8.2
71.3
15
8 16
.3
7.
0 47
.6
213
15.5
D
istr
ibut
ion
serv
ices
22
.3
26.6
16
1 16
.6
23
.3
13.6
20
1 14
.6
Who
lesa
le tr
ade
3.9
13.8
15
1.
5
4.0
17.4
44
3.
2 R
etai
l tra
de
11.4
28
.2
87
9.0
11
.4
15.5
11
2 8.
2 T
rans
port,
pos
tal a
nd w
areh
ousi
ng
5.2
38.9
55
5.
7
5.2
18.9
62
4.
5 I
nfor
mat
ion
med
ia a
nd te
leco
mm
unic
atio
ns
1.7
7.6
4 0.
4
2.8
-9.7
-1
7 -1
.3
Prod
ucer
ser
vice
s
14.1
42
.2
161
16.6
16.5
28
.9
304
22.2
F
inan
cial
and
insu
ranc
e se
rvic
es
2.7
15.9
12
1.
2
4.3
24.5
67
4.
9 R
enta
l, hi
ring
and
real
est
ate
serv
ices
2.
0 40
.4
22
2.3
1.
5 32
.5
30
2.2
Pro
fess
iona
l, sc
ient
ific
and
tech
nica
l ser
vice
s 5.
9 58
.7
93
9.6
7.
1 38
.0
170
12.4
A
dmin
istra
tive
and
supp
ort s
ervi
ces
3.5
35.7
34
3.
5
3.7
15.4
37
2.
7 So
cial
ser
vice
s 23
.0
49.6
31
0 32
.0
22
.4
38.0
54
2 39
.5
Pub
lic a
dmin
istra
tion
and
safe
ty
5.9
51.0
82
8.
4
5.5
37.6
13
2 9.
6 E
duca
tion
and
train
ing
7.6
35.2
72
7.
5
7.0
30.0
13
4 9.
8 H
ealth
car
e an
d so
cial
ass
ista
nce
9.5
60.3
15
6 16
.1
9.
9 43
.9
276
20.1
Pe
rson
al s
ervi
ces
14.4
17
.9
70
7.2
12
.5
24.6
19
5 14
.2
Acc
omm
odat
ion
and
food
ser
vice
s 7.
8 18
.5
39
4.0
6.
6 27
.4
115
8.4
Arts
and
recr
eatio
n se
rvic
es
1.6
51.4
23
2.
4
1.5
55.1
52
3.
8 O
ther
ser
vice
s 5.
0 6.
1 8
0.9
4.
4 10
.2
29
2.1
Tota
l 10
0.0
35.7
96
8 10
0.0
10
0.0
21.6
13
71
100.
0
Sou
rce:
AB
S (L
abou
r For
ce, A
ustra
lia, D
etai
led,
Cat
. no.
629
1.0.
55.0
03).

EMPLOYMENT CHANGES AT AN INDUSTRY LEVEL
107
F.2 Changes in forms of work by industry
The distribution of FOWs by industry varies markedly (table F.2). For example, in 2011, about one-third of permanent employees worked in social services, and over one-half of casual employees worked in either distribution or personal services. Self-employment was relatively concentrated in construction, agriculture, forestry and fishing, and professional, scientific and technical services.
Table F.2 Distribution of employment within FOWs by industry, 2011a Per cent
Permanent employees
Casual employees OMIEsb OMUEsc
Agriculture, mining 3.9 4.5 7.1 11.2 Agriculture, forestry and fishing 1.0 3.1 6.5 11.0 Mining 2.9 1.4 0.7 0.2 Manufacturing 9.6 6.3 8.8 5.0 Utilities, construction 8.7 7.3 18.6 21.8 Electricity, gas, water and waste services 1.9 0.8 0.5 0.3 Construction 6.8 6.5 18.1 21.5 Distribution services 20.3 27.0 22.4 15.9 Wholesale trade 4.4 2.4 6.5 2.4 Retail trade 8.9 18.6 8.4 7.2 Transport, postal and warehousing 4.9 4.7 6.5 5.5 Information media and telecommunications 2.1 1.4 1.0 0.9 Producer services 16.6 10.6 25.3 20.0 Financial and insurance services 4.8 1.2 3.4 1.3 Rental, hiring and real estate services 1.5 1.4 4.1 1.2 Professional, scientific and technical services 7.6 3.9 12.8 11.0 Administrative and support services 2.6 4.1 4.9 6.6 Social services 32.7 19.0 8.1 10.9 Public administration and safety 9.3 2.9 0.6 0.6 Education and training 9.3 6.2 2.2 3.5 Health care and social assistance 14.1 9.8 5.3 6.8 Personal services 8.1 25.4 9.6 15.2 Accommodation and food services 3.4 19.1 4.0 4.2 Arts and recreation services 1.5 3.0 0.4 2.3 Other services 3.3 3.3 5.2 8.7 Total 100.0 100.0 100.0 100.0 a Data on the distribution of FOW employment by industry were not separately available for mining and non-mining states in 2011. Nor were data available for this industry classification in 2001. National data for 2011 are instead used to illustrate how the distribution of FOWs by industry varies. b Owner managers of incorporated enterprises. c Owner managers of unincorporated enterprises.
Source: ABS (Australian Labour Market Statistics, Cat. no. 6105.0).

108 FORMS OF WORK
Decompositions are presented for each FOW using unpublished data from the ABS Forms of Employment (FOE) survey in tables F.3 to F.10. Results are based on data for people aged 15 to 69 years, for the years 2001 to 2008 and for industries aggregated according to the 1993 Australian and New Zealand Standard Industrial Classification.56 For comparison, and to shed light on what happened across the whole decade, results for owner managers of unincorporated enterprises (OMUEs) based on the ABS Labour Force Survey (LFS) data for the period 2001 to 2011 are presented in tables F.11 and F.12.57 These results are for all workers aged 15 years and over, and for industries classified using the 2006 Australian and New Zealand Standard Industrial Classification. Given these differences, the results from each source are not directly comparable.
In all of the presented tables, the share and shift effects represent a decomposition of the shift effect that would be obtained in a state-level analysis. The growth effect is equivalent to the growth and share effect that would emerge from that analysis.58
The concentration of FOWs in industries that made relatively large contributions to employment growth over the decade to 2011 (for example, agriculture, construction and professional, scientific and technical services for OMUEs) suggests that structural change was potentially a factor in changes in the prevalence of FOWs. However, shift–share analysis reveals that this was not the case. Shifts within industries were the key driver of prevalence changes in both mining and non-mining states.
Results of shift–share analysis
As discussed in appendix E, the share effect in the state-level decomposition is a small contributor to changes in the prevalence of different FOWs between 2001 and 2011 at a state level. Shift effects are the key. But that analysis left open the question of whether the relatively fast growth of permanent employees and slow
56 Similar qualitative results were obtained for analyses of 2001 and each of 2007 and 2009. Data
are presented for the period 2001 to 2008 because the analysis at a state level (appendix E) indicated that this period accounted for much of the growth in the mining states.
57 Results for each FOW at a national level based on data for 2001 and 2007 from the ABS Australian Labour Market Statistics catalogue are available on request.
58 This occurs because the growth effect for a state grouping in the industry-level analysis reflects two components: growth consistent with the expansion in employment across the economy plus growth that occurred because employment in that grouping grew more or less rapidly than in the rest of the country. In the state-level analysis, the first component is the growth effect, and the second component is the share effect.

EMPLOYMENT CHANGES AT AN INDUSTRY LEVEL
109
growth of OMUEs within states was a reflection of structural change or shifts towards permanent employees and away from OMUEs.
Shift–share analysis of changes in FOW employment by industry for mining and non-mining states sheds some light on this question.
Qualitative insights from analysis of the FOE survey and LFS data include that:
• changes in the mix of employment by industry (structural change) were a small contributor to FOW prevalence changes in both mining and non-mining states
• relatively rapid growth of permanent employee roles within industries was the major contributor to changes in the prevalence of this FOW. This was mirrored in relatively slow entry into OMUE employment within industries
• shrinking employment in agriculture — a sector of relatively high OMUE employment — was offset by growth in other areas of relatively high OMUE employment, in particular construction
• shifts away from OMUE employment were concentrated in construction and distribution services, in particular, retail and transport, postal and warehousing services.
It is not clear why there are differences in level estimates from the two sources.59 The FOE survey suggests a considerably smaller fall in OMUE employment in the non-mining states and a somewhat larger fall in the mining states, than does the LFS. One possible explanation for this outcome lies in the different age coverage of the two sources (15 to 69 years for the FOE survey, 15 years and over for the LFS), but if that was the case, it might be expected that the direction of difference would be similar for the two state groupings. The more likely explanation is that the FOE survey data for 2001 are too low (as discussed in footnote f to appendix table B.7). In the absence of a definitive explanation for the differences, only broad conclusions can be drawn from the analysis.
Looking more closely at the mining states, relatively rapid growth of permanent employee numbers, and slow growth of casual employees and OMUEs, occurred across all industries between 2001 and 2008, suggesting that the forces behind the changes in FOW prevalence in mining states were broadly based. This point is discussed further in chapter 4.
The analysis also sheds light on the role of agriculture in OMUE employment. When the share and shift effects are summed, agriculture accounts for 50 per cent of the decline in OMUE employment across the economy. Without the information
59 Similar differences are apparent in estimates for 2001 and 2008 from LFS data.

110 FORMS OF WORK
that the expansion of other industries offset the effects of relatively slow growth in agricultural employment, a conclusion might be drawn that structural change was a more important factor in the declining prevalence of OMUEs than was actually the case.
Table F.3 Shift–share analysis for permanent employees, 2001 to 2008, mining states, people aged 15 to 69 years, FOE survey dataa
Change Decomposition Share of:
2001–2008 Growth Share Shift 2001 emp. Shift effect
’000 ’000 ’000 ’000 % % Agriculture, mining 75.0 20.0 38.8 16.2 4.7 10.0 Manufacturing 39.7 53.2 -28.8 15.3 12.4 9.5 Utilities, construction 92.9 30.1 39.2 23.6 7.1 14.6 Distribution services 123.3 104.1 -27.7 46.9 24.3 29.1 Producer services 88.3 54.5 14.2 19.7 12.8 12.2 Social services 129.1 129.0 -21.1 21.2 30.2 13.2 Personal services 41.8 36.6 -13.0 18.3 8.6 11.3 Total 590.2 427.5 1.5 161.1 100.0 100.0 a The effects for agriculture and mining are almost entirely attributable to agriculture, and those for utilities and construction, to construction. Detailed results are available on request.
Source: Authors’ estimates based on unpublished data from ABS (Forms of Employment, Cat. no. 6359.0).
Table F.4 Shift–share analysis for permanent employees, 2001 to 2008, non-mining states, people aged 15 to 69 years, FOE survey dataa
Change Decomposition Share of:
2001–2008 Growth Share Shift 2001 emp. Shift effect
’000 ’000 ’000 ’000 % % Agriculture, mining 27.2 9.1 5.8 12.3 1.9 15.6 Manufacturing -56.7 76.1 -123.7 -9.1 16.4 -11.4 Utilities, construction 109.8 26.6 44.7 38.5 5.7 48.5 Distribution services 32.6 112.0 -74.0 -5.4 24.1 -6.8 Producer services 149.1 75.4 38.8 34.9 16.2 43.9 Social services 228.0 125.8 86.5 15.8 27.1 19.9 Personal services 58.4 39.8 26.3 -7.6 8.6 -9.6 Total 548.4 464.7 4.4 79.3 100.0 100.0 a The effects for agriculture and mining are almost entirely attributable to agriculture, and those for utilities and construction, to construction. Detailed results are available on request.
Source: Authors’ estimates based on unpublished data from ABS (Forms of Employment, Cat. no. 6359.0).

EMPLOYMENT CHANGES AT AN INDUSTRY LEVEL
111
Table F.5 Shift–share analysis for casual employees, 2001 to 2008, mining states, people aged 15 to 69 years, FOE survey dataa
Change Decomposition Share of:
2001–2008 Growth Share Shift 2001 emp. Shift effect
’000 ’000 ’000 ’000 % % Agriculture, mining -0.8 11.2 0.3 -12.3 6.5 17.7 Manufacturing 1.7 11.2 -6.1 -3.5 6.5 5.0 Utilities, construction 17.4 10.5 14.5 -7.7 6.1 11.0 Distribution services 35.8 60.8 -14.2 -10.7 35.4 15.4 Producer services 11.3 15.8 7.4 -11.9 9.2 17.0 Social services 3.7 25.5 -4.7 -17.2 14.9 24.6 Personal services 13.6 36.8 -16.7 -6.5 21.4 9.3 Total 82.6 171.8 -19.5 -69.8 100.0 100.0 a The effects for agriculture and mining are almost entirely attributable to agriculture, and those for utilities and construction, to construction. Detailed results are available on request.
Source: Authors’ estimates based on unpublished data from ABS (Forms of Employment, Cat. no. 6359.0).
Table F.6 Shift–share analysis for casual employees, 2001 to 2008, non-mining states, people aged 15 to 69 years, FOE survey dataa
Change Decomposition Share of:
2001–2008 Growth Share Shift 2001 emp. Shift effect
’000 ’000 ’000 ’000 % % Agriculture, mining -5.6 5.5 -8.3 -2.8 3.7 15.2 Manufacturing -0.5 11.5 -18.7 6.7 7.7 -35.8 Utilities, construction 21.9 6.9 10.3 4.7 4.7 -25.3 Distribution services 43.1 52.3 -37.1 27.9 35.2 -149.9 Producer services -1.5 17.7 16.1 -35.4 11.9 190.1 Social services 12.0 26.5 17.0 -31.6 17.9 169.5 Personal services 54.4 28.1 14.4 11.9 18.9 -63.7 Total 123.7 148.6 -6.2 -18.6 100.0 100.0 a The effects for agriculture and mining are almost entirely attributable to agriculture, and those for utilities and construction, to construction. Detailed results are available on request.
Source: Authors’ estimates based on unpublished data from ABS (Forms of Employment, Cat. no. 6359.0).

112 FORMS OF WORK
Table F.7 Shift–share analysis for OMIEs, 2001 to 2008, mining states, people aged 15 to 69 years, FOE survey dataa, b
Change Decomposition Share of:
2001–2008 Growth Share Shift 2001 emp. Shift effect
’000 ’000 ’000 ’000 % % Agriculture, mining 4.8 4.4 -3.7 4.1 9.3 17.2 Manufacturing -0.7 4.6 -2.5 -2.8 9.8 -11.8 Utilities, construction 26.9 7.0 9.8 10.1 14.8 42.6 Distribution services 8.0 14.5 -3.7 -2.8 30.7 -11.7 Producer services 23.4 10.8 4.3 8.4 22.8 35.3 Social services 1.6 2.9 -0.3 -1.1 6.2 -4.7 Personal services 9.8 3.0 -1.0 7.9 6.3 33.2 Total 73.8 47.2 2.9 23.7 100.0 100.0 a The effects for agriculture and mining are almost entirely attributable to agriculture, and those for utilities and construction, to construction. Detailed results are available on request. b OMIEs — owner managers of incorporated enterprises.
Source: Authors’ estimates based on unpublished data from ABS (Forms of Employment, Cat. no. 6359.0).
Table F.8 Shift–share analysis for OMIEs, 2001 to 2008, non-mining states, people aged 15 to 69 years, FOE survey dataa
Change Decomposition Share of:
2001–2008 Growth Share Shift 2001 emp. Shift effect
’000 ’000 ’000 ’000 % % Agriculture, mining -12.7 3.7 -8.4 -8.0 6.8 35.4 Manufacturing 2.4 4.6 -7.4 5.3 8.5 -23.7 Utilities, construction 25.0 9.7 13.7 1.6 17.9 -7.0 Distribution services -4.9 15.4 -10.7 -9.7 28.5 43.1 Producer services 15.2 12.8 12.5 -10.1 23.5 45.1 Social services 5.6 3.6 2.8 -0.8 6.6 3.7 Personal services 6.6 4.5 2.9 -0.8 8.2 3.4 Total 37.1 54.2 5.4 -22.5 100.0 100.0 a The effects for agriculture and mining are almost entirely attributable to agriculture, and those for utilities and construction, to construction. Detailed results are available on request. b OMIEs — owner managers of incorporated enterprises.
Source: Authors’ estimates based on unpublished data from ABS (Forms of Employment, Cat. no. 6359.0).

EMPLOYMENT CHANGES AT AN INDUSTRY LEVEL
113
Table F.9 Shift–share analysis for OMUEs, 2001 to 2008, mining states, people aged 15 to 69 years, FOE survey dataa
Change Decomposition Share of:
2001–2008 Growth Share Shift 2001 emp. Shift effect
’000 ’000 ’000 ’000 % % Agriculture, mining -4.5 14.5 -12.2 -6.7 13.6 5.9 Manufacturing -5.7 7.4 -4.0 -9.1 6.9 8.0 Utilities, construction 27.0 22.0 30.9 -25.9 20.6 22.7 Distribution services -10.1 26.1 -2.9 -33.4 24.5 29.3 Producer services 8.1 16.9 7.3 -16.1 15.9 14.1 Social services 1.8 6.2 -1.2 -3.2 5.8 2.8 Personal services -10.4 13.5 -4.3 -19.6 12.7 17.2 Total 6.1 106.6 13.6 -114.1 100.0 100.0 a The effects for agriculture and mining are almost entirely attributable to agriculture, and those for utilities and construction, to construction. Detailed results are available on request.
Source: Authors’ estimates based on unpublished data from ABS (Forms of Employment, Cat. no. 6359.0).
Table F.10 Shift–share analysis for OMUEs, 2001 to 2008, non-mining states, people aged 15 to 69 years, FOE survey dataa
Change Decomposition Share of:
2001–2008 Growth Share Shift 2001 emp. Shift effect
’000 ’000 ’000 ’000 % % Agriculture, mining -18.6 14.7 -33.7 0.4 16.6 -1.2 Manufacturing -6.2 5.3 -8.6 -2.9 5.9 8.2 Utilities, construction 2.4 18.5 26.2 -42.2 20.9 118.4 Distribution services -5.1 20.9 -13.2 -12.9 23.6 36.1 Producer services 35.5 12.6 12.2 10.7 14.2 -29.9 Social services 25.5 6.3 4.5 14.7 7.1 -41.3 Personal services 13.8 10.3 7.0 -3.5 11.6 9.7 Total 47.3 88.6 -5.6 -35.7 100.0 100.0 a The effects for agriculture and mining are almost entirely attributable to agriculture, and those for utilities and construction, to construction. Detailed results are available on request.
Source: Authors’ estimates based on unpublished data from ABS (Forms of Employment, Cat. no. 6359.0).

114 FORMS OF WORK
Table F.11 Shift–share analysis for OMUEs, 2001 to 2011, mining states, LFS dataa
Change Decomposition Share of:
2001–2011 Growth Share Shift 2001 emp. Shift effect
’000 ’000 ’000 ’000 % % Agriculture, mining -17.0 24.7 -40.0 -1.7 16.7 1.6 Manufacturing -3.0 10.7 -8.9 -4.9 7.3 4.6 Utilities, construction 9.0 30.7 26.9 -48.6 20.9 45.9 Distribution services -10.0 27.2 -4.1 -33.1 18.4 31.2 Producer services 27.0 22.9 4.8 -0.7 15.5 0.7 Social services 12.0 9.7 4.4 -2.0 6.6 1.9 Personal services -6.0 21.5 -12.6 -14.9 14.6 14.1 Total 12.0 147.3 -29.4 -105.9 100.0 100.0 a The effects for agriculture and mining are almost entirely attributable to agriculture, and those for utilities and construction, to construction. Detailed results are available on request.
Source: Authors’ estimates based on ABS (Labour Force, Australia, Detailed, Cat. no. 6291.0.55.001).
Table F.12 Shift–share analysis for OMUEs, 2001 to 2011, non-mining states, LFS dataa
Change Decomposition Share of:
2001–2011 Growth Share Shift 2001 emp. Shift effect
’000 ’000 ’000 ’000 % % Agriculture, mining -62.0 32.7 -76.8 -18.0 18.4 16.8 Manufacturing -13.0 10.3 -16.7 -6.7 5.8 6.2 Utilities, construction 41.5 32.8 42.7 -34.0 18.5 31.9 Distribution services -24.0 33.4 -7.6 -49.8 18.8 46.7 Producer services 52.0 26.9 13.8 11.3 15.1 -10.6 Social services 24.0 14.6 12.9 -3.5 8.2 3.3 Personal services 22.0 27.1 0.8 -6.0 15.2 5.6 Total 40.5 178 -30.8 -106.7 100.0 100.0 a The effects for agriculture and mining are almost entirely attributable to agriculture, and those for utilities and construction, to construction. Detailed results are available on request.
Source: Authors’ estimates based on ABS (Labour Force, Australia, Detailed, Cat. no. 6291.0.55.001).

EMPLOYMENT CHANGES AT AN OCCUPATION LEVEL
115
G Employment changes at an occupation level
The contributions of different occupations to changes in the prevalence of each form of work (FOW) are described in this appendix.
G.1 Job growth favoured more highly skilled workers
The share of employment by occupation in the mining and non-mining states were reasonably similar in 2001 (table G.1).60,61 That said, higher-skilled occupations (managerial and professional roles) accounted for a slightly larger employment share in the non-mining states (33 versus 29 per cent), and blue collar work (technicians and trades, machinery operators and drivers, and labourers) was more common in the mining states (36 versus 32 per cent of employment).62
Around the country, lower-skilled occupations grew more slowly than employment overall.63 For example, in the non-mining states, employment in the four lower-skilled occupations (clerical and administrative workers, sales workers, machinery operators and drivers, and labourers) grew half as quickly (by only 11 per cent). As a result, these occupations accounted for a relatively small share of net new jobs. In the non-mining states, they accounted for 45 per cent of employment in 2001, but only 23 per cent of the net jobs added to the economy. The employment share of these occupations fell to 41 per cent in 2011.
As discussed in appendix E, blue collar occupations were a larger source of new jobs in the mining states (32 versus 21 per cent), but this contribution was still below their employment share in 2001. Over half of new jobs in the non-mining states (and 40 per cent in the mining states) were in two types of occupation — 60 The term ‘states’ is used throughout as shorthand for states and territories. 61 Data are based on a worker’s occupation in his or her main job. 62 Preliminary shift–share analysis revealed a large negative shift effect for managers. Given the
industry analysis, it was suspected that this result was driven by a decline in the employment of farmers. To get a clearer picture of how managerial employment might have changed, this occupational category was split into farmers and farm managers, and other managers.
63 With the exception of machinery operators and drivers in the mining states.

116 FORMS OF WORK
other manager and professional roles. Job growth strongly favoured higher-skilled occupations.
Table G.1 Employment growth by occupation, mining and non-mining states, 2001–2011
Mining Non-mining
Employ’t share 2001
Growth 2001–11
Growth 2001–11
Cont’n to
growth
Employ’t share 2001
Growth 2001–11
Growth 2001–11
Cont’n to
growth
% % ’000 % % % ’000 % Farmers, farm managers
2.7 -19.5 -14 -1.5 2.5 -29.0 -47 -3.4
Other managers 8.7 67.9 160 16.5 10.2 38.3 247 18.0 Professionals 17.2 54.8 255 26.3 20.2 36.3 465 33.9 Technicians, trades workers
15.8 37.8 162 16.8 14.5 17.7 164 11.9
Community and personal service workers
8.9 44.2 107 11.0 7.9 46.0 231 16.8
Clerical and administrative workers
16.0 22.9 100 10.3 16.8 8.6 92 6.7
Sales workers 10.8 18.5 54 5.6 10.0 15.2 97 7.1 Machinery operators and drivers
7.2 44.9 87 9.0 6.8 12.3 53 3.8
Labourers 12.7 17.2 60 6.1 11.1 9.7 68 5.0 Total 100.0 35.7 968 100.0 100.0 21.6 1371 100.0
Source: ABS (Labour Force, Australia, Detailed, Cat. no. 6291.0.55.003).
G.2 Changes in forms of work by occupation
The occupations in which different FOWs were concentrated varied markedly in 2011 (table G.2). As predicted in chapter 2, permanent employees were relatively concentrated in higher-skilled occupations (managerial and professional roles), and casual employees in lower-skilled, with nearly 40 per cent working in sales or labouring roles. Over one-third of owner managers of incorporated enterprises (OMIEs) were employed in managerial roles, and a quarter of owner managers of unincorporated enterprises (OMUEs) worked as technicians and tradespeople.

EMPLOYMENT CHANGES AT AN OCCUPATION LEVEL
117
Table G.2 Distribution of employment within FOWs by occupation, 2011a Per cent
Permanent employees
Casual employees OMIEs OMUEs
Managers 12.3 2.9 34.9 21.7 Professionals 25.5 9.8 19.7 18.7 Technicians and trades workers 14.8 10.5 14.9 25.6 Community and personal service workers 8.3 18.1 2.1 6.0 Clerical and administrative workers 17.6 11.1 13.1 7.2 Sales workers 7.1 20.4 5.2 4.4 Machinery operators and drivers 7.2 7.8 5.2 5.3 Labourers 7.2 19.5 4.8 11.1 Total 100.0 100.0 100.0 100.0 a Data on the distribution of FOW employment by occupation are not separately available for mining and non-mining states in 2011. Nor are data available for this occupational classification in 2001. National data for 2011 are instead used to illustrate how the distribution of FOWs by occupation varies.
Source: ABS (Australian Labour Market Statistics, Cat. no. 6105.0).
The relatively rapid growth of occupations in which permanent employees were concentrated, in tandem with slower growth of occupations in which casual employees were more common, could have been expected to have led to an increase in the prevalence of permanent employees, and a decrease in the prevalence of casual employees. Shift–share analysis confirms that this was the case.64
Results from shift–share analysis
Decompositions are presented for each FOW using unpublished data from the Forms of Employment (FOE) survey (tables G.3 to G.6). Decompositions of the change in permanent and casual employee numbers between 2001 and 2008 reveal more pronounced share effects than was the case in the industry analysis.65,66
In the mining states, about one-fifth of the increased prevalence of permanent employees was attributable to the share effect, and about half of the decline for casual employees. Although the analysis uses an older classification of occupations than that used in tables G.1 and G.2, the effects of faster growth of higher-skilled
64 As discussed in appendix F, the share and shift effects in this analysis are equivalent to the shift
effects that would be obtained in a state-level analysis. 65 Data are presented for the period 2001 to 2008 because the analysis at a state level (appendix E)
indicated that this period accounted for much of the growth in the prevalence of permanent employees in the mining states.
66 Results for each FOW at a national level based on data for 2001 and 2007 from the ABS Australian Labour Market Statistics catalogue are available on request.

118 FORMS OF WORK
occupations on permanent employment and slower growth of lower-skilled on casual employment are clear.67 Share effects were an even more important explanation of prevalence changes in analysis of data for 2007 and 2009.68 Nonetheless, the majority of the increased prevalence of permanent employees was attributable to a shift towards this FOW, particularly associated with slower growth within occupations of people becoming small business owners (table G.9). Slower growth of OMUE employment was most pronounced among associated professionals, tradespersons and related workers, and intermediate production and transport workers. Shifts away from OMUE employment, however, were recorded across the majority of occupations, suggesting an economywide explanation. Possible causes of this phenomenon are discussed in chapter 4.
Share effects were an even more important explanator of prevalence changes between 2001 and 2008 in the non-mining states. The large difference in results for OMUEs between data from the FOE survey and the Labour Force Survey (LFS), however, places a question mark over these results (tables G.10 and G.12).69 As discussed in appendix F, the source of these differences is unclear. As a result, only broad qualitative conclusions are drawn from the analysis, both below and in chapter 4.
As noted above, share effects were a more important source of prevalence changes for permanent and casual employees than was the case in the industry level analysis. For casuals, the results suggest that these effects would have contributed to a small fall in prevalence. However, decompositions of employment changes between 2001 and 2007 and 2001 and 2009 suggest that there might have been shifts from permanent to casual employment over this period that were even larger in magnitude than the negative share effect for casual employees obtained in those analyses.70 As a consequence, those data suggest that the prevalence of casual employees would have increased slightly. This observation is consistent with results from the state-level analysis (appendix E) based on data from the Australian Labour Market Statistics catalogue (ABS 2012a). As noted in appendix E, that analysis indicated that casual employment grew slightly more quickly than employment
67 Data underlying the shift–share results are coded to the Australian Standard Classification of
Occupations. Data used in tables G.1 and G.2 are coded to the Australian and New Zealand Standard Classification of Occupations adopted by the ABS in 2006 (ABS 2009).
68 Between 2001 and 2009, for example, the results suggest that about one-third of the increased prevalence of permanent employees, and nearly three-quarters of the decline of casual employees, was attributable to changes in the mix of employment by occupation (results available on request).
69 Similar differences are apparent in estimates for 2001 and 2008 from LFS data. 70 Results available on request.

EMPLOYMENT CHANGES AT AN OCCUPATION LEVEL
119
overall in New South Wales between 2001 and 2011 (and that Victoria had recorded a similar outcome up until 2010). In other words, it is possible that the decrease in casual employment that would have accompanied an increasing employment share of higher-skilled jobs was offset to some extent by relatively rapid growth of casual employment within occupations in the non-mining states. The fall in the size of the shift effect for casual employees between 2009 and 2011 (figure E.2) might indicate that the share effect was playing a larger role in prevalence changes for casual employees. If that is the case, it is possible that any future increase in the proportion of the workforce employed in higher-skilled jobs will be associated with a decline in the prevalence of casual employment.
Shift–share decompositions for OMUEs also suggest that share effects played a greater role in prevalence changes for this FOW in the non-mining states (tables G.10 and G.12). In particular, relatively slow growth of farmer, and technician and tradespeople employment (occupations in which OMUEs are relatively concentrated) was not offset by the effects of faster growth in other occupations. That said, shifts away from this FOW were at least as important as share effects as a cause of observed prevalence changes.
Table G.3 Shift–share analysis for permanent employees, 2001 to 2008, mining states, people aged 15 to 69 years, FOE survey data
Change Decomposition Share of:
2001–2008 Growth Share Shift 2001 emp. Shift effect
’000 ’000 ’000 ’000 % % Farmers and farm managers 2.5 1.2 -1.5 2.7 0.3 2.1 Other managers and administrators 63.1 20.4 34.3 8.3 4.8 6.5 Professionals 137.2 89.5 21.3 26.4 20.9 20.6 Associate professionals 86.2 56.3 9.8 20.2 13.2 15.7 Tradespersons and related workers 114.4 55.3 21.4 37.8 12.9 29.4 Advanced clerical and service workers 3.7
16.3 -12.0 -0.6
3.8 -0.5
Intermediate clerical, sales and service workers 80.7
87.1 -12.6 6.3
20.4 4.9
Intermediate production and transport workers 63.6
38.8 13.4 11.5
9.1 9.0
Elementary clerical, sales and service workers 24.8
30.0 -21.2 16.1
7.0 12.5
Labourers and related workers 13.9 32.8 -18.7 -0.2 7.7 -0.1 Total 590.2 427.5 34.2 128.4 100.0 100.0
Source: Authors’ estimates based on unpublished data from ABS (Forms of Employment, Cat. no. 6359.0).

120 FORMS OF WORK
Table G.4 Shift–share analysis for permanent employees, 2001 to 2008, non-mining states, people aged 15 to 69 years, FOE survey data
Change Decomposition Share of:
2001–2008 Growth Share Shift 2001 emp. Shift effect
’000 ’000 ’000 ’000 % % Farmers and farm managers 4.3 1.5 -3.5 6.3 0.3 20.8 Other managers and administrators 69.6 32.8 45.7 -8.9 7.1 -29.3 Professionals 249.1 106.3 119.0 23.8 22.9 78.6 Associate professionals 98.6 55.8 17.2 25.7 12.0 84.6 Tradespersons and related workers 45.1 56.5 -17.7 6.3 12.2 20.8 Advanced clerical and service workers -0.8 19.3 -25.5 5.3 4.2 17.6 Intermediate clerical, sales and service workers 45.2
88.7 -50.5 7.0
19.1 23.2
Intermediate production and transport workers 28.5
40.1 -4.4 -7.2
8.6 -23.7
Elementary clerical, sales and service workers -8.8
33.2 -28.0 -14.0
7.2 -46.2
Labourers and related workers 17.6 30.4 1.2 -14.1 6.6 -46.4 Total 548.4 464.7 53.4 30.3 100.0 100.0
Source: Authors’ estimates based on unpublished data from ABS (Forms of Employment, Cat. no. 6359.0).
Table G.5 Shift–share analysis for casual employees, 2001 to 2008, mining states, people aged 15 to 69 years, FOE survey data
Change Decomposition Share of:
2001–2008 Growth Share Shift 2001 emp. Shift effect
’000 ’000 ’000 ’000 % % Farmers and farm managers 0.1 0.5 -0.6 0.1 0.3 -0.3 Other managers and administrators 2.4 0.8 1.4 0.3 0.5 -0.5 Professionals 10.1 13.1 3.1 -6.1 7.6 13.3 Associate professionals 12.1 8.9 1.6 1.6 5.2 -3.5 Tradespersons and related workers 3.8 14.8 5.7 -16.8 8.6 36.3 Advanced clerical and service workers -0.7 4.5 -3.3 -1.9 2.6 4.0 Intermediate clerical, sales and service workers 24.9
33.6 -4.9 -3.8
19.6 8.3
Intermediate production and transport workers 25.7
16.2 5.6 3.8
9.5 -8.2
Elementary clerical, sales and service workers -0.9
46.2 -32.7 -14.4
26.9 31.2
Labourers and related workers 5.1 33.2 -19.0 -9.1 19.3 19.6 Total 82.6 171.8 -43.0 -46.3 100.0 100.0
Source: Authors’ estimates based on unpublished data from ABS (Forms of Employment, Cat. no. 6359.0).

EMPLOYMENT CHANGES AT AN OCCUPATION LEVEL
121
Table G.6 Shift–share analysis for casual employees, 2001 to 2008, non-mining states, people aged 15 to 69 years, FOE survey data
Change Decomposition Share of:
2001–2008 Growth Share Shift 2001 emp. Shift effect
’000 ’000 ’000 ’000 % % Farmers and farm managers -1.4 0.3 -0.8 -0.9 0.2 -5.6 Other managers and administrators 6.6 0.8 1.2 4.6 0.6 27.2 Professionals 6.1 15.1 17.0 -26.0 10.2 -154.3 Associate professionals 34.9 6.1 1.9 27.0 4.1 160.4 Tradespersons and related workers 11.7 10.6 -3.3 4.4 7.2 26.2 Advanced clerical and service workers -10.4 4.3 -5.7 -9.1 2.9 -53.9 Intermediate clerical, sales and service workers 18.2
32.5 -18.5 4.2
21.9 25.1
Intermediate production and transport workers 22.0
15.0 -1.7 8.6
10.1 51.2
Elementary clerical, sales and service workers 16.7
38.8 -32.7 10.6
26.1 63.0
Labourers and related workers 19.3 24.9 1.0 -6.6 16.8 -39.4 Total 123.7 148.6 -41.7 16.8 100.0 100.0
Source: Authors’ estimates based on unpublished data from ABS (Forms of Employment, Cat. no. 6359.0).
Table G.7 Shift–share analysis for OMIEs, 2001 to 2008, mining states, people aged 15 to 69 years, FOE survey data
Change Decomposition Share of:
2001–2008 Growth Share Shift 2001 emp. Shift effect
’000 ’000 ’000 ’000 % % Farmers and farm managers 3.0 3.1 -3.7 3.7 6.5 20.4 Other managers and administrators 14.4 6.8 11.5 -4.0 14.4 -22.1 Professionals 2.7 8.2 2.0 -7.5 17.4 -41.8 Associate professionals 23.4 12.5 2.2 8.8 26.4 48.7 Tradespersons and related workers 9.8 5.1 2.0 2.8 10.7 15.5 Advanced clerical and service workers 2.5 4.5 -3.3 1.2 9.5 6.9 Intermediate clerical, sales and service workers 9.5
2.7 -0.4 7.2
5.7 40.2
Intermediate production and transport workers 6.3
2.3 0.8 3.2
4.9 17.6
Elementary clerical, sales and service workers 1.6
0.6 -0.5 1.4
1.4 7.7
Labourers and related workers 1.9 1.5 -0.9 1.2 3.2 6.9 Total 75.0 47.4 9.6 18.0 100.0 100.0
Source: Authors’ estimates based on unpublished data from ABS (Forms of Employment, Cat. no. 6359.0).

122 FORMS OF WORK
Table G.8 Shift–share analysis for OMIEs, 2001 to 2008, non-mining states, people aged 15 to 69 years, FOE survey data
Change Decomposition Share of:
2001–2008 Growth Share Shift 2001 emp. Shift effect
’000 ’000 ’000 ’000 % % Farmers and farm managers -7.9 2.8 -6.6 -4.2 5.2 15.3 Other managers and administrators 22.8 8.0 11.1 3.7 14.7 -13.7 Professionals 2.7 11.1 12.4 -20.8 20.3 76.4 Associate professionals -6.8 11.8 3.6 -22.2 21.8 81.9 Tradespersons and related workers 12.3 7.6 -2.4 7.1 14.0 -26.0 Advanced clerical and service workers -2.5 4.1 -5.4 -1.2 7.5 4.4 Intermediate clerical, sales and service workers 0.2
3.7 -2.1 -1.4
6.8 5.2
Intermediate production and transport workers 9.3
3.2 -0.4 6.4
5.9 -23.6
Elementary clerical, sales and service workers 0.9
0.9 -0.7 0.8
1.6 -2.9
Labourers and related workers 6.0 1.3 0.1 4.7 2.3 -17.2 Total 37.0 54.5 9.7 -27.2 100.0 100.0
Source: Authors’ estimates based on unpublished data from ABS (Forms of Employment, Cat. no. 6359.0).
Table G.9 Shift–share analysis for OMUEs, 2001 to 2008, mining states, people aged 15 to 69 years, FOE survey data
Change Decomposition Share of:
2001–2008 Growth Share Shift 2001 emp. Shift effect
’000 ’000 ’000 ’000 % % Farmers and farm managers -9.0 11.9 -14.4 -6.5 11.1 6.5 Other managers and administrators 4.5 3.4 5.7 -4.6 3.2 4.6 Professionals 3.7 13.3 3.2 -12.8 12.5 12.8 Associate professionals -8.0 19.2 3.3 -30.5 18.0 30.5 Tradespersons and related workers 11.6 25.5 9.9 -23.7 23.8 23.7 Advanced clerical and service workers 3.0 6.3 -4.6 1.3 5.9 -1.3 Intermediate clerical, sales and service workers -3.4
7.3 -1.1 -9.7
6.8 9.7
Intermediate production and transport workers -5.3
9.8 3.4 -18.5
9.2 18.5
Elementary clerical, sales and service workers -2.0
3.6 -2.5 -3.0
3.3 3.0
Labourers and related workers 10.8 6.6 -3.8 8.0 6.2 -8.0 Total 5.9 106.9 -0.9 -100.1 100.0 100.0
Source: Authors’ estimates based on unpublished data from ABS (Forms of Employment, Cat. no. 6359.0).

EMPLOYMENT CHANGES AT AN OCCUPATION LEVEL
123
Table G.10 Shift–share analysis for OMUEs, 2001 to 2008, non-mining states, people aged 15 to 69 years, FOE survey data
Change Decomposition Share of:
2001–2008 Growth Share Shift 2001 emp. Shift effect
’000 ’000 ’000 ’000 % % Farmers and farm managers -17.8 12.7 -29.3 -1.2 14.2 6.0 Other managers and administrators 9.7 3.8 5.3 0.6 4.3 -2.9 Professionals 50.7 13.1 14.7 22.9 14.8 -114.7 Associate professionals -12.0 14.1 4.3 -30.4 15.9 152.1 Tradespersons and related workers -3.5 20.9 -6.6 -17.8 23.5 89.0 Advanced clerical and service workers 3.9 3.1 -4.0 4.9 3.5 -24.6 Intermediate clerical, sales and service workers -7.2
6.0 -3.4 -9.8
6.8 49.2
Intermediate production and transport workers -1.5
7.1 -0.8 -7.8
8.0 39.3
Elementary clerical, sales and service workers 3.0
2.3 -1.9 2.6
2.6 -13.1
Labourers and related workers 22.0 5.7 0.2 16.0 6.4 -80.2 Total 47.4 88.8 -21.4 -20.0 100.0 100.0
Source: Authors’ estimates based on unpublished data from ABS (Forms of Employment, Cat. no. 6359.0).
Table G.11 Shift–share analysis for OMUEs, 2001 to 2011, mining states, LFS data
Change Decomposition Share of:
2001–2011 Growth Share Shift 2001 emp. Shift effect
’000 ’000 ’000 ’000 % % Farmers and farm managers -12.0 18.9 -24.6 -6.3 12.9 5.3 Other managers 5.0 17.8 15.0 -27.8 12.2 23.7 Professionals 15.0 17.5 8.3 -10.8 11.9 9.2 Technicians and trades workers 2.0 36.4 -4.2 -30.2 24.8 25.7 Community and personal service workers 7.0 6.1 1.3 -0.4 4.1 0.3 Clerical and administrative workers -12.0 18.2 -6.1 -24.0 12.4 20.5 Sales workers 3.0 7.8 -3.0 -1.8 5.4 1.5 Machinery operators and drivers -3.0 10.7 3.9 -17.6 7.3 15.0 Labourers 9.0 13.2 -5.6 1.4 9.0 -1.2 Total 14.0 146.5 -15.0 -117.5 100.0 100.0
Source: Authors’ estimates based on ABS (Labour Force, Australia, Detailed, Cat. no. 6291.0.55.001).

124 FORMS OF WORK
Table G.12 Shift–share analysis for OMUEs, 2001 to 2011, non-mining states, LFS data
Change Decomposition Share of:
2001–2011 Growth Share Shift 2001 emp. Shift effect
’000 ’000 ’000 ’000 % % Farmers and farm managers -55.0 27.1 -72.0 -10.1 15.3 13.5 Other managers 10.0 24.1 23.9 -37.9 13.6 50.5 Professionals 27.0 29.2 17.0 -19.2 16.5 25.5 Technicians and trades workers 12.0 41.3 -14.8 -14.4 23.2 19.2 Community and personal service workers 28.0 6.4 8.3 13.3 3.6 -17.7 Clerical and administrative workers -9.0 16.5 -8.7 -16.9 9.3 22.4 Sales workers 4.0 6.2 -1.6 -0.6 3.5 0.8 Machinery operators and drivers -12.0 12.7 -6.1 -18.5 7.1 24.7 Labourers 36.0 14.0 -7.1 29.2 7.9 -38.8 Total 41.0 177.5 -61.3 -75.2 100.0 100.0
Source: Authors’ estimates based on ABS (Labour Force, Australia, Detailed, Cat. no. 6291.0.55.001).

EMPLOYMENT CHANGES: GENDER AND HOURS WORKED
125
H Employment changes by gender and full- and part-time work
The relationship between changes in the prevalence of each form of work (FOW) and workers’ gender and full- or part-time status is described in this appendix. This relationship is of interest because:
• men and women have different profiles of employment — women are much more likely than men to work part-time and in casual roles
• full-time workers are relatively concentrated in permanent employee roles, with relatively more part-time workers in casual roles
• part-time jobs accounted for a disproportionately large share of jobs added to the economy in the decade to 2011.
These observations raise the question of what, if any, role female and part-time employment played in the increased prevalence of permanent employees.
H.1 The profile of employment by gender and full- and part-time work
In 2001, the vast majority of men in both the mining and non-mining states worked full time (table H.1).71,72 Women were much more likely to work part time, although women working full time made up nearly a quarter of the workforce.
The distribution of employment across men and women and full- and part-time work was similar in the mining and non-mining states. In the decade to 2011, however, full-time employment grew much more quickly in the mining states — possibly a reflection of the strength of labour demand. As a result, a much higher proportion of jobs created in those states was full time (69 versus 47 per cent in the rest of the
71 The term ‘states’ is used throughout as shorthand for states and territories. 72 Full- or part-time status is defined according to hours worked across all jobs. Characteristics of
the available data dictated this approach. Very similar figures are obtained for the whole workforce when a worker’s status is defined on hours worked in main job (ABS 2012h).

126 FORMS OF WORK
country). That said, the growth in full-time work was consistent with the employment share of this work type in 2001.
Table H.1 Employment growth by gender and full- or part-time work, mining and non-mining states, 2001–2011, people aged 15–69a
Shares, 2001, of:
Male or female emp.
Total employment
Growth 2001–2011
Growth 2001–2011
Contribution to growth
% % % ’000 % Mining Male full-time 86.6 48.0 31.2 401.3 41.7 Male part-time 13.4 7.5 48.8 97.6 10.1 Female full-time 53.6 23.9 41.2 263.8 27.4 Female part-time 46.4 20.7 36.0 200.0 20.8 Total 100.0 35.9 962.7 100.0 Non-mining Male full-time 86.6 48.2 11.2 344.4 28.2 Male part-time 13.4 7.5 47.7 226.7 18.5 Female full-time 56.2 24.9 14.6 231.7 18.9 Female part-time 43.8 19.4 33.9 420.2 34.4 Total 100.0 19.2 1 223.1 100.0 a Full-time or part-time status is defined on hours worked in all jobs.
Source: Authors’ estimates based on unpublished data from ABS (Forms of Employment, Cat. no. 6359.0).
Because full- and part-time work grew at reasonably similar rates in the mining states, the observation (in chapter 4) that part-time employment accounted for a disproportionate share of new work nationwide is attributable to changes in the non-mining states. Over half of the workers who joined the labour force in those states (53 per cent) worked part-time hours in 2011. In contrast, the employment share for this work type in 2001 was 27 per cent. As a result, the prevalence of part-time work rose in the non-mining states (by 3.5 percentage points), but was little changed in the mining states.
H.2 Changes in forms of work by gender and full- and part-time hours
At a FOW level, in 2001, permanent employees and owner-managers were much more likely to work full-time hours than were casuals (table H.2). For example, in the mining states, 86 per cent of permanent employees were full-time. Conversely, the majority of casuals worked part-time hours (close to 70 per cent). That said, about

EMPLOYMENT CHANGES: GENDER AND HOURS WORKED
127
25 per cent of small business owners (owner managers of unincorporated enterprises (OMUEs)) worked part-time hours.
Table H.2 Distribution of employment within FOWs by gender and hours worked, mining and non-mining states, people aged 15–69, 2001
Employment type shares within FOWs, 2001
Employment type Units Permanent
employees Casuals OMIEsa OMUEsb Mining Male full-time % 53.9 21.8 64.5 59.2 Male part-time % 2.1 21.2 4.9 7.9 Female full-time % 32.4 10.6 15.0 15.2 Female part-time % 11.7 46.4 15.6 17.8 Total % 100.0 100.0 100.0 100.0 Employment ’000s 1 522.9 612.1 169.0 380.9 Non-mining Male full-time % 52.9 20.2 68.2 58.1 Male part-time % 2.5 22.6 4.3 10.0 Female full-time % 32.4 10.8 13.3 16.7 Female part-time % 12.2 46.4 14.1 15.2 Total % 100.0 100.0 100.0 100.0 Employment ’000s 3 914.8 1 251.5 458.8 748.5 a Owner managers of incorporated enterprises. b Owner managers of unincorporated enterprises. Source: Authors’ estimates based on unpublished data from ABS (Forms of Employment, Cat. no. 6359.0).
How did these differences in the distribution of employment by gender and hours worked across FOWs translate into changes in the profile of employment over time?
The combination of relatively slow growth of full-time employment in the non-mining states, and the concentration of casuals in part-time employment, other things equal, might have been expected to have been associated with increases in the prevalence of casuals and decreases in the prevalence of permanent employees. A decomposition of the changes in these two FOWs reveals that this share effect was strong (tables H.3 and H.4). In the absence of shift effects, ‘structural’ changes in the distribution of employment by gender and hours worked would have led to a decline in the prevalence of permanent employees and an increase in the prevalence of casuals.
Part-time work was sufficiently common among owner managers in the non-mining states that the share effects for these FOWs were very small — slower growth of full-time work among owner managers was offset by faster growth of part-time work (tables H.5 and H.6).

128 FORMS OF WORK
In both the mining and non-mining states, shift effects were the key factor in changes in the prevalence of different FOWs.
Employment in permanent employee roles grew more rapidly among full- and part-time males and females than employment overall for each of these groups. In other words, shift effects were positive for each group. That said, part-time workers accounted for about half of the overall shift effect for permanent employees in both the mining and non-mining states — in contrast with an employment share in this FOW in 2001 of about 14 per cent. That is, the shift towards permanent employee roles occurred disproportionately among part-time workers.
The relatively rapid growth of permanent employee roles for part-time workers was accompanied by relatively slow growth of casual employment. In other words, among part-time workers, permanent employee roles grew more rapidly than casual jobs over the decade to 2011. In contrast, for full-time workers, the relatively fast growth of permanent employee roles was accompanied by relatively slow employment of OMUEs.
Table H.3 Shift–share analysis for permanent employees aged 15 to 69, mining and non-mining states, 2001 to 2011
Change Decomposition Share of:
2001 to 2011 Growth Share Shift 2001 emp. Shift effect
’000 ’000 ’000 ’000 % % Mining Male full-time 333.6 294.1 -38.6 78.1 53.9 39.2 Male part-time 34.1 11.6 4.2 18.3 2.1 9.2 Female full-time 221.2 176.7 26.1 18.3 32.4 9.2 Female part-time 148.4 63.7 0.2 84.5 11.7 42.4 Total 737.3 546.1 -8.0 199.2 100.0 100.0 Non-mining Male full-time 340.7 397.3 -165.1 108.4 52.9 39.3 Male part-time 74.9 18.7 27.8 28.4 2.5 10.3 Female full-time 221.1 243.4 -58.5 36.2 32.4 13.1 Female part-time 265.1 91.8 70.6 102.7 12.2 37.3 Total 901.9 751.3 -125.2 275.8 100.0 100.0
Source: Authors’ estimates based on unpublished data from ABS (Forms of Employment, Cat. no. 6359.0).

EMPLOYMENT CHANGES: GENDER AND HOURS WORKED
129
Table H.4 Shift–share analysis for casual employees aged 15 to 69, mining and non-mining states, 2001 to 2011
Change Decomposition Share of:
2001 to 2011 Growth Share Shift 2001 emp. Shift effect
’000 ’000 ’000 ’000 % % Mining Male full-time 57.0 47.9 -6.3 15.4 21.8 -18.5 Male part-time 34.0 46.4 16.7 -29.2 21.2 35.2 Female full-time 22.3 23.3 3.5 -4.5 10.6 5.5 Female part-time 37.5 101.8 0.4 -64.6 46.4 77.9 Total 150.8 219.5 14.3 -83.0 100.0 100.0 Non-mining Male full-time 29.3 48.5 -20.1 1.0 20.2 -0.6 Male part-time 95.1 54.3 80.6 -39.9 22.6 25.3 Female full-time 9.6 25.9 -6.2 -10.1 10.8 6.4 Female part-time 88.4 111.5 85.8 -108.9 46.4 69.0 Total 222.4 240.2 140.1 -157.8 100.0 100.0
Source: Authors’ estimates based on unpublished data from ABS (Forms of Employment, Cat. no. 6359.0).
Table H.5 Shift–share analysis for OMIEs aged 15 to 69, mining and non-mining states, 2001 to 2011
Change Decomposition Share of:
2001 to 2011 Growth Share Shift 2001 emp. Shift effect
’000 ’000 ’000 ’000 % % Mining Male full-time 39.8 39.1 -5.1 5.9 64.5 40.6 Male part-time 9.3 3.0 1.1 5.3 4.9 36.5 Female full-time 16.6 9.1 1.3 6.2 15.0 42.6 Female part-time 6.7 9.5 0.0 -2.8 15.6 -19.7 Total 72.4 60.6 -2.7 14.5 100.0 100.0 Non-mining Male full-time 24.0 60.1 -25.0 -11.1 68.2 82.6 Male part-time 20.6 3.8 5.7 11.1 4.3 -81.9 Female full-time 10.2 11.7 -2.8 1.3 13.3 -9.3 Female part-time 7.3 12.4 9.5 -14.7 14.1 108.6 Total 62.0 88.0 -12.6 -13.5 100.0 100.0
Source: Authors’ estimates based on unpublished data from ABS (Forms of Employment, Cat. no. 6359.0).

130 FORMS OF WORK
Table H.6 Shift–share analysis for OMUEs aged 15 to 69, mining and non-mining states, 2001 to 2011
Change Decomposition Share of:
2001 to 2011 Growth Share Shift 2001 emp. Shift effect
’000 ’000 ’000 ’000 % % Mining Male full-time -29.2 80.8 -10.6 -99.4 59.2 76.0 Male part-time 20.2 10.7 3.9 5.6 7.9 -4.3 Female full-time 3.8 20.7 3.1 -20.0 15.2 15.3 Female part-time 7.4 24.3 0.1 -17.0 17.8 13.0 Total 2.3 136.6 -3.6 -130.7 100.0 100.0 Non-mining Male full-time -49.5 83.4 -34.7 -98.3 58.1 94.1 Male part-time 36.1 14.4 21.3 0.4 10.0 -0.4 Female full-time -9.2 24.0 -5.8 -27.4 16.7 26.2 Female part-time 59.4 21.8 16.8 20.8 15.2 -19.9 Total 36.8 143.6 -2.3 -104.5 100.0 100.0
Source: Authors’ estimates based on unpublished data from ABS (Forms of Employment, Cat. no. 6359.0).

EMPLOYMENT CHANGE BY AGE COHORT
131
I Employment change by age cohort
The relationship between changes in the prevalence of each form of work (FOW) and the age of workers is described in this appendix. This relationship is of interest because:
• the age profile of employment within FOWs varies — casuals are more likely to be young (aged less than 25 years); owner managers tend to be older
• employment growth was particularly rapid among older workers (aged 50 to 69) between 2001 and 2011.
I.1 The profile of employment by age cohort
Employment of older workers (aged 50 to 69) grew twice as quickly as employment overall in the mining states between 2001 and 2011 (table I.1).73 Differences in employment growth rates between age cohorts were even more pronounced in the non-mining states.
In part, these variations reflected population ageing. The number of people aged 50 to 69 grew roughly twice as quickly as the population aged 15 to 49 in the decade to 2011 (by about 40 per cent in the mining states, and 30 per cent in the rest of the country) (ABS 2012i). But they also reflected a marked increase in labour force participation among older Australians (up about 9 percentage points to 62 per cent nationwide across the decade).74,75 In contrast, participation fell among younger Australians (by 3 percentage points) as engagement in education increased, and rose slightly (by 2 percentage points) for other workers (those aged 25 to 49).76
73 The term ‘states’ is used throughout as shorthand for states and territories. 74 Similar-sized increases were recorded in mining and non-mining states, but mining state
participation rates for older workers were slightly higher in both 2001 and 2011. 75 Reflecting social trends, larger increases were recorded for older women (about 12 percentage
points nationwide, versus 7 percentage points for men). 76 As these relatively small changes in participation rates indicate, faster growth in employment of
workers aged 15 to 49 in the mining states was primarily attributable to faster population growth in those states.

132 FORMS OF WORK
Reflecting the strength of the mining state labour markets, youth employment grew more strongly than in the rest of the country.
Demographic change and increases in participation rates among older workers meant that, by 2011, they occupied half of the jobs added to the economy in the preceding decade. These trends led to an ageing of the workforce — the share of older workers in employment increased from 21 to 27 per cent over the 10 years to 2011.
Table I.1 Employment growth by age cohort, mining and non-mining states, 2001–2011, people aged 15–69
Age cohort Share of
employment, 2001 Growth
2001–11 Growth
2001–11 Contributions
to growth
% % ’000 % Mining 15 to 24 19.2 24.8 127.7 13.3 25 to 49 59.8 27.5 441.6 45.9 50 to 69 21.0 69.9 393.5 40.9 Total 100.0 35.9 962.7 100.0 Non-mining
15 to 24 17.9 6.5 74.2 6.1 25 to 49 61.2 11.1 434.1 35.5 50 to 69 20.9 53.6 714.8 58.4 Total 100.0 19.2 1223.1 100.0
Source: Authors’ estimates based on unpublished data from ABS (Forms of Employment, Cat. no. 6359.0).
I.2 Changes in forms of work by age cohort
The age profiles of employment in each FOW were very similar in the mining and non-mining states in 2001 (table I.2).77 Young people represented a disproportionately large share of casual workers (just over 40 per cent) in contrast to an overall employment share of 18–19 per cent (table I.1). Conversely, very few owner managers were aged less than 25, and older workers were over-represented in this FOW (relative to their share of total employment).
77 Unfortunately, due to concerns about confidentiality, the ABS was unable to provide data for
owner managers of incorporated and unincorporated enterprises for younger and older workers. Results from analysis for these FOWs using national data from the Australian Labour Market Statistics (ALMS) collection (ABS 2012a) are included in the discussion of conclusions from shift–share decompositions.

EMPLOYMENT CHANGE BY AGE COHORT
133
Table I.2 Distribution of employment within FOWs by age cohort, mining and non-mining states, people aged 15–69, 2001a
Per cent
Age cohort shares of FOW employment
Age cohort Permanent Casual OMIEsb OMUEsc
Mining 15 to 24 16.1 41.6 na na
25 to 49 65.1 45.2 60.8 62.0 50 to 69 18.9 13.2 na na Total 100.0 100.0 100.0 100.0 Non-mining
15 to 24 14.9 41.4 na na 25 to 49 66.0 44.5 60.8 64.2 50 to 69 19.1 14.0 na na Total 100.0 100.0 100.0 100.0 Australia
15 to 24 15.2 41.5 1.1 4.2 25 to 49 65.7 44.8 60.8 63.4 50 to 69 19.0 13.8 38.1 32.3 Total 100.0 100.0 100.0 100.0 a Concerns about confidentiality meant that the ABS was unable to provide data for OMIEs and OMUEs for younger and older workers by state. National data are, therefore, presented to illustrate the distribution of employment in these FOWs by age group. b Owner managers of incorporated enterprises. c Owner managers of unincorporated enterprises. na Not available.
Source: Authors’ estimates based on unpublished data from ABS (Forms of Employment, Cat. no. 6359.0).
Given the association between self-employment and age, it might be expected that the relatively rapid expansion of employment among older workers would have translated into an increase in this FOW. Shift–share analysis is used to analyse how the profile of employment by age interacted with changes in FOWs.
Other things equal, relatively slow growth in employment of people aged 15 to 49, and the fact this age group represented the majority of permanent and casual employees, that is, share effects, acted to reduce the number of people employed in these FOWs (tables I.3 and I.4). However, these share effects were offset by increases in older worker employment in these FOWs78 — particularly for permanent employees. Overall, the ageing of the workforce was not associated with large
78 The share effect for casuals in the non-mining state is an exception. However, as mentioned in
previous appendices, because of data concerns these results are not considered to be robust and are not discussed further.

134 FORMS OF WORK
changes in the prevalence of permanent or casual employees. Nor was it the key factor in changes in the prevalence of owner managers.79
Shifts within age cohorts in the FOWs in which workers were engaged were more strongly associated with changes in the prevalence of permanent employees and owner managers of unincorporated enterprises (OMUEs) than workforce ageing.
In both the mining and non-mining states, both the relatively fast growth of permanent employee roles, and relatively slow growth of OMUE employment, were more pronounced among older workers.80 The relatively strong growth of permanent employee numbers among older workers meant that the increased prevalence of this FOW was more marked in this age cohort. For example, in the mining states, permanent employees increased in prevalence by 5.2 percentage points overall (appendix E), but among older workers, the increase was 7 percentage points (51 to 58 per cent of the cohort). Similarly, declines in the prevalence of OMUEs were more pronounced among older workers.
In summary, other things equal, the ageing of the workforce might have been expected to have led to an increase in the prevalence of OMUEs, given that older workers were more likely than younger workers to be engaged in this FOW in 2001. That this was not the case reflects shifts away from this FOW. These occurred within each age cohort, but were stronger among older workers.
It is unclear why shifts away from OMUE to permanent employment were stronger for older workers. One possibility — that the trend only reflects the combination of a relatively strong increase in participation among older women and a lower prevalence of owner manager employment among this group — is not supported by shift–share analysis by gender.81 Shifts occurred for both men and women. That said, the effect was stronger for older women (a conclusion that is consistent with the findings of Atalay et al. (2013)).
In supplementary analysis, the possibility that relatively rapid growth in permanent employee roles among older workers was dominated by part-time roles was tested.82 About 40 per cent of the shift towards permanent employee status among older workers was in part-time roles. This was higher than the percentage of part-time employment among the cohort in 2001 (17 per cent), but full-time roles accounted for 79 This result is drawn from an analysis of all workers (that is, including those aged 70 and over),
at a national level using data from the ALMS collection (ABS 2012a). These results are available on request.
80 This conclusion is based on the analysis of the ALMS. Results are available on request. 81 Results available on request. 82 Results available on request.

EMPLOYMENT CHANGE BY AGE COHORT
135
the majority of the shift. As for the rest of the workforce, part-time work was disproportionately represented in the shift towards permanent employee roles for older workers.
Table I.3 Shift–share analysis for permanent employees aged 15 to 69, mining and non-mining states, 2001 to 2011
Change Decomposition Share of:
2001 to 2011 Growth Share Shift 2001 emp. Shift effect
’000 ’000 ’000 ’000 % %
Mining 15 to 24 78.3 87.7 -27.1 17.7 16.1 8.7 25 to 49 388.7 355.4 -83.0 116.3 65.1 57.1 50 to 69 270.3 102.9 97.8 69.6 18.9 34.2 Total 737.3 546.1 -12.4 203.6 100.0 100.0 Non-mining 15 to 24 5.2 112.1 -74.1 -32.8 14.9 -18.7 25 to 49 411.3 495.6 -208.1 123.8 66.0 70.6 50 to 69 485.4 143.5 257.6 84.3 19.1 48.1 Total 901.9 751.3 -24.7 175.3 100.0 100.0
Source: Authors’ estimates based on unpublished data from ABS (Forms of Employment, Cat. no. 6359.0).
Table I.4 Shift–share analysis for casual employees aged 15 to 69, mining and non-mining states, 2001 to 2011
Change Decomposition Share of:
2001 to 2011 Growth Share Shift 2001 emp. Shift effect
’000 ’000 ’000 ’000 % %
Mining 15 to 24 47.9 91.4 -28.2 -15.2 41.6 33.9 25 to 49 47.2 99.2 -23.2 -28.8 45.2 64.3 50 to 69 55.6 28.9 27.5 -0.8 13.2 1.7 Total 150.8 219.5 -23.9 -44.8 100.0 100.0 Non-mining 15 to 24 76.2 99.4 -65.8 42.5 41.4 131.5 25 to 49 42.6 107.0 -44.9 -19.5 44.5 -60.2 50 to 69 103.6 33.7 60.6 9.3 14.0 28.7 Total 222.4 240.2 -50.1 32.3 100.0 100.0
Source: Authors’ estimates based on unpublished data from ABS (Forms of Employment, Cat. no. 6359.0).


REFERENCES 137
References
ABS (Australian Bureau of Statistics) 1997, ‘Owner managers of incorporated enterprises’, Feature article, Labour Force, Australia, Cat. no. 6203.0, July, ABS, Canberra.
–––– 2000, The Labour Force, Australia, Cat. no. 6203.0, ABS, Canberra.
–––– 2004, ‘Changes in types of employment, Appendix 2: Data sources and methodology’, Feature article, Australian Labour Market Statistics, October, Cat. no. 6105.0.
—— 2007a, Counts of Australian Businesses, Including Entries and Exits, June 2003 to June 2007, Cat. no. 8165.0, ABS, Canberra.
—— 2007b, Labour Statistics: Concepts, Sources and Methods, Apr 2007, Cat. no. 6102.0.55.001, ABS, Canberra.
—— 2009, Australian and New Zealand Standard Classification of Occupations, First Edition, Revision 1, Cat. no. 1220.0, ABS, Canberra.
—— 2010, Microdata: Labour Force Survey and Forms of Employment Survey, Basic and Expanded CURF, Australia, Nov 2008, Cat. no. 6202.0.30.007, ABS, Canberra.
—— 2011, ‘Trends in employee methods of setting pay and jurisdictional coverage’, Feature article, Australian Labour Market Statistics, July,
—— 2012a, Australian Labour Market Statistics, Cat. no. 6105.0, ABS, Canberra.
—— 2012b, Australian System of National Accounts, Cat. no. 5204.0, ABS, Canberra.
—— 2012c, Australian System of National Accounts: Concepts, Sources and Methods, Cat. no. 5216.0, ABS, Canberra.
—— 2012d, Counts of Australian Businesses, Including Entries and Exits, June 2007 to June 2011, Cat. no. 8165.0, ABS, Canberra.
—— 2012e, Education and Work, May 2012, Cat. no. 6227.0, Canberra.
—— 2012f, Employee Earnings, Benefits and Trade Union Membership, Cat. no. 6310.0, ABS, Canberra.
—— 2012g, Forms of Employment, November 2011, Cat. no. 6359.0, ABS, Canberra.

138 FORMS OF WORK
—— 2012h, Labour Force, Australia, Cat. no. 6202.0, ABS, Canberra.
—— 2012i, Labour Force, Australia, Detailed, Cat. no. 6291.0.55.001, ABS, Canberra.
—— 2013a, Job Vacancies, Australia, November 2012, Cat. no. 6354.0, ABS, Canberra
—— 2013b, Microdata: Longitudinal Labour Force, Australia, 2008-10, Cat. no. 6602.0, ABS, Canberra.
—— various years, Underemployed Workers, Cat. no. 6265.0, ABS, Canberra.
ACCI (Australian Chamber of Commerce and Industry) 2013, ACCI Business Expectations Survey, Issue 71, December Quarter 2012, ACCI.
—— various dates, ACCI Survey of Investor Confidence, ACCI.
ACTU (Australian Council of Trade Unions) 2011, The Future of Work in Australia: Dealing with Insecurity and Risk, Working Australia Paper 13/2011.
—— nd, Casual Workers, Factsheet, http://www.actu.org.au/HelpDesk/ YourRightsfactsheets/CasualWorkers.aspx (accessed 2 March 2013).
AIRC (Australian Industrial Relations Commission) 2000, Workplace Relations Act 1996, s.113 application for variation, s.107 reference to Full Bench, Automotive, Food, Metals, Engineering, Printing and Kindred Industries Union (C No. 22704 of 1999), Metal, Engineering and Associated Industries Award, 1998 — Part I (ODN C No. 02567 of 1984), www.fwa.gov.au/decisionssigned/html/ T4991.htm (accessed 11 October 2012).
—— 2003, Workplace Relations Act 1996, s.113 application for variation, s.107 reference to Full Bench, The Australian Workers' Union (C2002/4817), Pastoral Industry Award 1998 (ODN C No. 04948 of 1986), www.fwa.gov.au/ alldocuments/PR930781.htm (accessed 11 October 2012).
—— 2004, 2004 Redundancy Case, http://www.airc.gov.au/alldocuments/ PR032004.htm#P856_104281 (accessed 13 March 2013).
–––– 2005, Family Provisions Case, http://www.airc.gov.au/fullbench/ PR082005.htm (accessed 21 February 2013).
—— 2008, Decision, Workplace Relations Act 1996, s.576E—Procedure for carrying out award modernisation process, www.fwa.gov.au/awardmod/ databases/general/decisions/2008aircfb1000.htm (accessed 11 October 2012).
Apps, P. and Rees, R. 2005, ‘Gender, time use, and public policy over the life cycle’, Oxford Review of Economic Policy, vol. 21, no. 3, pp. 439–61.
Atalay, K., Kim, W. and Whelan, S. 2013, The Decline of the Self-Employment Rate in Australia, Economics Working Paper Series, University of Sydney, February.

REFERENCES 139
ATO (Australian Tax Office) 2008, Personal Services Income — Basic Information You Need to Know, http://www.ato.gov.au/businesses/content.aspx?doc=/ content/00162435.htm&page=3 (accessed 7 March 2013).
—— 2010, Personal Services Income Terms Explained, http://www.ato.gov.au/ content/00162438.htm (accessed 7 March 2013).
Australian Government 2000, New Business Tax System (Alienation Of Personal Services Income) Bill 2000 Explanatory Memorandum, House of Representatives, Commonwealth of Australia.
—— 2008, Fair Work Bill Explanatory Memorandum, House of Representatives, Commonwealth of Australia.
—— 2010, Australia’s Future Tax System, http://www.taxreview.treasury.gov.au/ content/Content.aspx?doc=html/pubs_reports.htm (accessed 14 March 2013).
—— 2012, Independent Contractors: The Essential Handbook, www.business.gov.au/BusinessTopics/Independentcontractors/Documents/Independentcontractorstheessentialhandbook.pdf (accessed 12 October 2012).
Becker, G. 1962, ‘Investment in human capital: a theoretical analysis’, The Journal of Political Economy, vol. 70, no. 5, pp. 9–49.
—— 1965, ‘A theory of the allocation of time’, The Economic Journal, vol. 75, no. 299, pp. 493–517.
Borland, J. 2005, Transitions to Retirement: A Review, Melbourne Institute Working Paper Series.
—— 2011, ‘The Australian labour market in the 2000s: the quiet decade’, in Gerard, H. and Kearns, J. (eds), The Australian Economy in the 2000s, Proceedings of the Reserve Bank of Australia Conference, Sydney, August.
Buddelmeyer, H. and Wooden, M. 2011, ‘Transitions out of casual employment: the Australian experience’, Industrial Relations, vol. 50, no. 1, January, pp. 109–30.
––––, –––– and Ghantous, S. 2006, Transitions from Casual Employment in Australia, Report prepared for the Australian Government Department of Employment and Workplace Relations under the Social Policy Research Services Agreement.
Budig, M. 2006, ‘Gender, self-employment, and earnings: the interlocking structures of family and professional status’, Gender & Society, vol. 20, no. 6, December, pp. 725–53.
Burgess, J. and Campbell, I. 1998, ‘The nature and dimensions of precarious employment in Australia’, Labour & Industry, vol. 8, no. 3, pp. 5–21.

140 FORMS OF WORK
Campbell, I. and Chalmers, J. 2008, ‘Job quality and part-time work in the retail industry: An Australian case study’, The International Journal of Human Resource Management, vol. 19, no. 3, pp. 487–500.
Chalmers, J. and Waddoups, V. 2007, ‘Is casual employment a ‘bridge’ or a ‘trap’?’, Paper presented to the HILDA Survey Research Conference, University of Melbourne, 19-20 July, melbourneinstitute.com/downloads/hilda/ Bibliography/HILDA_Conference_Papers/2007_papers/Waddoups,%20Jeff_final%20paper.pdf (accessed 12 December 2012).
Creighton, B. and Stewart, A. 2010, Labour Law: An introduction, 5th edition, The Federation Press, Sydney.
Dawkins, P. and Norris, K. 1990, ‘Casual employment in Australia’, Australian Bulletin of Labour, vol. 16, no. 3, pp. 156–73.
DIAC (Department of Immigration and Citizenship) 2011, Immigration Update 2010-11, Canberra.
—— 2012, Trends in Migration, Australia 2010-11, http://www.immi.gov.au/media /publications/statistics/trends-in-migration/trends-in-migration-2010-11.pdf (accessed 27 March 2013).
Douglas, E. and Shepherd, D. 2000, ‘Entrepreneurship as a utility maximising response’, Journal of Business Venturing, vol. 15, no. 3, pp. 231–51.
Drago, R., Wooden, M. and Black, D. 2009, ‘Who wants and gets flexibility? Changing work hours preferences and life events’, Industrial and Labor Relations Review, vol. 62, no. 3, pp. 394–414.
Econsearch (2012), Shift–share Analysis, http://www.econsearch.com.au/pages/ services/regional-analysis/shift-share-analysis.php (accessed 19 December 2012).
Evans, M. and Sikora, J. 2004, ‘Self-employment in Australia, 1980–1999’, in Arum, R. and Műller, W. (eds), The Reemergence of Self-Employment: A comparative study of self-employment dynamics and social inequality, Princeton University Press, Princeton and Oxford, pp. 203–44.
Fair Work Commission 2013, Making An Enterprise Agreement, www.fwc.gov.au/ documents/factsheets/making_agreements_guide.pdf (accessed 29 January 2013).
FWO (Fair Work Ombudsman) 2011, Notice of Termination and Redundancy Pay and the National Employment Standards, www.fairwork.gov.au/factsheets/ FWO-Fact-sheet-Notice-of-termination-and-redundancy-pay.pdf (accessed 10 October 2012).

REFERENCES 141
—— 2012a, Contractor or Employee, http://www.fairwork.gov.au/employment/ independent-contractors/contractor-or-employee/pages/default.aspx (accessed 21 March 2013).
—— 2012b, Introduction to the National Employment Standards, www.fairwork.gov.au/factsheets/FWO-Fact-sheet-Introduction-to-the-NES.pdf (accessed 29 January 2013).
—— 2012c, Modern Awards, www.fairwork.gov.au/awards/modern-awards/pages/ default.aspx (accessed 13 December 2012).
—— 2012d, What Notice Should You Give if You Resign? http://www.fairwork. gov.au/termination/notice-periods/pages/what-notice-should-you-give-if-you-resign.aspx (accessed 2 March 2013).
—— 2012e, Workplace Myths, http://www.fairwork.gov.au/media-centre/ enewsletter/fwo-enewsletter-issue-3/pages/workplace-myths.aspx (accessed 2 March 2013).
—— 2013, Best Practice Guide: Use of individual flexibility arrangements, www.fairwork.gov.au/BestPracticeGuides/03-Use-of-individual-flexibility-arrangements.pdf (accessed 29 January 2013).
Gaston, N. and Timcke, D. 1999, ‘Do Casual Workers Find Permanent Full-Time Employment? Evidence from the Australian Youth Survey’, The Economic Record, vol. 75, no. 231, pp. 333–47.
Gilfillan, G. and Andrews, L. 2010, Labour Force Participation of Women Over 45, Productivity Commission Staff Working Paper, Canberra.
Gryst, R. 1999, “Contracting Employment”: A case study of how the use of agency workers in the SA Power Industry is reshaping the employment relationship, ACIRRT working paper.
Hall, R. 2000, ‘Outsourcing, contracting-out and labour hire: implications for human resource development in Australian organizations’, Asia Pacific Journal of Human Resources, vol. 38, no. 2, pp. 23–41.
–––– 2002, Labour Hire in Australia: Motivation, dynamics and prospects, ACCIRT Working Paper no. 76, University of Sydney, April.
Haltiwanger, J. C., Jarmin, R. S. and Miranda, J. 2010, Who Creates Jobs? Small vs. Large vs. Young, NBER Working Paper 16300.
HILDA (Household Income and Labour Dynamics in Australia survey) 2010, Online Data Dictionary Release 10.0, http://www.melbourneinstitute.com/ hildaddictionary/onlinedd/Default.aspx (accessed 20 August 2012).

142 FORMS OF WORK
Houseman, S. 2001, ‘Why employers use flexible staffing arrangements: Evidence from an establishment survey’, Industrial and Labor Relations Review, vol. 55, no. 1, pp. 149–70.
Howe, B., Munro, P., Biddington, J. and Charlesworth, S. 2012, Lives on Hold: Unlocking the potential of Australia’s workforce, The report of the Independent Inquiry into Insecure Work in Australia, Melbourne.
Hughes, B. 2008, ‘What do state occupational data say about macro wage equations?’, Australian Economic Review, vol. 41, no. 3, pp. 298–309.
Laplagne, P. and Glover, M. 2005, Importance and Characteristics of Labour Hire Employment, Productivity Commission Research Memorandum, Cat. no. GA 520, Productivity Commission, Melbourne.
——, —— and Fry, T. 2005, The Growth of Labour Hire Employment in Australia, Productivity Commission Staff Working Paper, Melbourne, February.
Meager, N. 1992, ‘Does unemployment lead to self-employment?’, Small Business Economics, vol. 4, no. 2, pp. 87–103.
Mitchell, A. 2012, ‘The real jobs challenge’, Australian Financial Review, 18 February 2012, http://www.afr.com/p/personal_finance/smart_money/the_real_ jobs_challenge_LfXatYBdEQxKSRKgkSFI8L (accessed 12 February 2013).
Murtough, G. and Waite, M. 2000, The Diversity of Casual Contract Employment, Productivity Commission Staff Research Paper, AusInfo, Canberra.
NAB (National Australia Bank) 2013, Monthly Business Survey, January 2013, NAB, Melbourne.
Neumark, D., Wall, B. and Zhang, J. 2011, ‘Do small businesses create more jobs? New evidence for the United States from the national establishment time series’, Review of Economics and Statistics, vol. 93, no. 1, pp. 16–29.
OECD (Organisation for Economic Co-operation and Development) 2011, ‘Self-employment’, OECD Factbook 2011-2012: Economic, Environmental and Social Statistics, http://dx.doi.org/10.1787/factbook-2011-61-en (accessed 12 March 2013).
Oi, W. 1962, ‘Labour as a quasi-fixed factor’, The Journal of Political Economy, vol. 70, no. 6, pp. 538–55.
Parham, D. forthcoming, Labour’s Share of Growth in Income and Prosperity, Productivity Commission Staff Working Paper, Canberra.
PC (Productivity Commission) 2006, The Role of Non-Traditional Work in the Australian Labour Market, Commission Research Paper, Melbourne, May.

REFERENCES 143
–––– 2012, Default Superannuation Funds in Modern Awards, Report No. 60, Final Inquiry Report, Canberra.
Rampini, A. 2004, ‘Entrepreneurial activity, risk, and the business cycle’, Journal of Monetary Economics, vol. 51, no. 3, pp. 555–73.
Rayner, V. and Bishop, J. 2013, Industry Dimensions of the Resource Boom: An input–output analysis, Research Discussion Paper 2013–02.
RBA (Reserve Bank of Australia) 2008, Statement on Monetary Policy — May 2008, RBA, Sydney.
Richardson, S. and Law, V. 2009, ‘Changing forms of employment and their implications for the development of skills’, Australian Bulletin of Labour, vol. 35, no. 3, pp. 355–92.
–––– Lester, L. and Zhang, G. 2012, ‘Are casual and contract terms of employment hazardous for mental health in Australia?’, Journal of Industrial Relations, vol. 54, no. 5, pp. 557–78.
Romeyn, J. 1992, Flexible Working Time: Part-time and casual employment, Industrial Relations Research Monograph, no. 1, Canberra.
Schur, L. 2003, ‘Barriers or opportunities? The causes of contingent and part-time work among people with disabilities’, Industrial Relations, vol. 42, no. 4, pp. 589–622.
Simpson, M., Dawkins, P. and Madden, G. 1997, ‘Casual employment in Australia: incidence and determinants’, Australian Economic Papers, vol. 36, no. 69, pp. 194–204.
The Board of Taxation 2009, Post Implementation Review into the Alienation of Personal Services Income Rules, Canberra.
van Wanrooy, B., Jakubauskas, M., Buchanan, J., Wilson, S. and Scalmer, S. 2008, Australia at Work. Working lives — statistics and stories, University of Sydney.
VandenHeuvel, A. and Wooden, M. 1995, ‘Self-employed contractors in Australia, how many and who are they?’, Journal of Industrial Relations, vol. 37, no. 2, pp. 263–80.
Virtanen, M., Kivimaki, M., Joensuu, M., Virtanen, P., Elovainio, M. and Vahtera, J. 2005, ‘Temporary employment and health: a review’, International Journal of Epidemiology, vol. 34, pp. 610–22.
WADOC (Government of Western Australia Department of Commerce) 2010, The Business Imperative for Flexible Work, http://www.commerce.wa.gov.au/ labourrelations/PDF/FlexibleWorkplaces/WLBBusinessImperative.pdf (accessed 19 February 2013).

144 FORMS OF WORK
Waite, M. and Will, L. 2001, Self-Employed Contractors in Australia: Incidence and characteristics, Productivity Commission Staff Research Paper, AusInfo, Canberra.
–––– 2002, Fixed-term Employees in Australia: Incidence and characteristics, Productivity Commission Staff Research Paper, AusInfo.
Watson, I. 2005, ‘Contented workers in inferior jobs? Reassessing casual employment in Australia’, The Journal of Industrial Relations, vol. 47, no. 4, pp 371–92.
—— 2013, ‘Bridges or traps? Casualisation and labour market transitions in Australia’, Journal of Industrial Relations, vol. 55, no. 1, pp. 6-37.
—— , Buchanan, J., Campbell, I. and Briggs, C. 2003, Fragmented Futures: New challenges in working life, The Federation Press, New South Wales.
Watson, N. 2012, Longitudinal and Cross-sectional Weighting Methodology for the HILDA Survey, HILDA Project Technical Paper Series No. 2/12, Melbourne Institute of Applied Economic and Social Research, University of Melbourne.
Wilkin, C. 2013, ‘I can’t get no job satisfaction: meta-analysis comparing permanent and contingent workers’, Journal of Organizational Behaviour, vol. 34, no. 1, pp. 47–64.
Willox, I. 2012, ‘Insecure work claim a union beat-up’, Australian Financial Review, 4 December, p. 47.
Zhang, M., Gourley, S. and Soriano, F. 2006, Analysing the Terms of Trade Effect on GDP and Employment in the Presence of Low Real Unit Labour Costs, Research Paper, ABS, Cat. no. 1351.0.55.014, Canberra.

DATA USED IN CONSTRUCTING 30-YEAR TIME SERIES
J.1
J Data used in constructing 30-year time series
Publications based on two ABS sources, the Employee Earnings, Benefits and Trade Union Membership (EEBTUM) survey (and its predecessor surveys) and the Labour Force Survey (LFS), support the derivation of time series for broad work arrangements in Australia — but do not contain information about all of the forms of work (FOWs) of interest in this report.
Estimates of the prevalence of major FOWs over the past 30 years (presented in figure 3.1 and table B.1) were compiled from these publications. Use of these data over such a long time frame required a number of assumptions and raised a variety of issues — including the treatment of potential breaks in series. These are discussed in this appendix. The data can be regarded as indicative of some of the broad changes that have occurred in the Australian labour market over the 30 years to 2011.
Classifications of employment used by the ABS, and in deriving data, are described in section J.1. Sources for data coded to these classifications are described in section J.2. Assumptions made in response to changes in data collections over time are detailed in section J.3.
J.1 ABS classifications of employment
A combination of data from two ABS classifications of employment — status in employment and employment by type — were used to derive time series for the following FOWs:
• employees (excluding owner managers of incorporated enterprises (OMIEs))
– with leave entitlements
– without leave entitlements
• OMIEs
• owner managers of unincorporated enterprises (OMUEs)
– employers
– own account workers

J.2 FORMS OF WORK
• contributing family workers.
As discussed in chapter 3, data on employees with and without leave entitlements are used as proxies for permanent and casual employees. The terms ‘permanent’ and ‘casual’ are used in the subsequent discussion when referring to employees with and without leave entitlements, respectively.
J.2 Sources for the time series for each FOW
The sources used for the series presented in figure 3.1 and table B.1 are summarised in table J.1. For reasons detailed in section J.3, data on contributing family workers were not included in this figure and table. Data on employees excluding OMIEs were not published prior to 1992. The method used to derive series for permanent and casual employees excluding OMIEs between 1982 and 1991 is described in box J.1.
Box J.1 Derivation of estimates of permanent and casual employees
estimates excluding OMIEs for 1982 to 1991 Between 1982 and 1991, data for permanent and casual employees were only available including OMIEs. ABS (2004) contains the information that, in 2003, 45 per cent of OMIEs had paid leave entitlements. It is assumed that this percentage was constant across time. Estimates of OMIEs for the period 1982 to 1991 were apportioned to permanent and casual employees using this percentage. These estimates were then subtracted from total permanent and casual employee numbers to derive estimates excluding OMIEs. The sensitivity of the estimates to this assumption was tested. The estimates were not materially affected by setting the percentage of OMIEs with paid leave entitlements at 30 or 60 per cent.

DATA USED IN CONSTRUCTING 30-YEAR TIME SERIES
J.3
Table J.1 Sources for data used in figure 3.1 and table B.1 Series and time period Source
Employees including OMIEs (permanent and casual employees)
1982a ABS (Alternative Working Arrangements, March to May 1982, Cat. no. 6341.0)
1984–1987b ABS (Employment Benefits, Australia, Cat. no. 6334.0)
1988–1991b ABS (Weekly Earnings of Employees, Cat. no. 6310.0)
Employees excluding OMIEs (permanent and casual employees)c
1982–1991d Estimated from data on employees including OMIEs (above) and OMIEs (below).
1992–2007 ABS (Australian Labour Market Statistics, Cat. no. 6105.0)
2008–2011 ABS (Employee Earnings, Benefits and Trade Union Membership, Cat. no. 6310.0)
OMIEs 1978–1991e ABS (Labour Force, Australia, Cat. no. 6203.0) 1992–2011 ABS (Australian Labour Market Statistics,
Cat. no. 6105.0) 2008–2011 ABS (Employee Earnings, Benefits and Trade
Union Membership, Cat. no. 6310.0) OMUEs (including employers and own account workers)
1978–1984 ABS (The Labour Force, Australia 1978–95, Cat. no. 6204.0)
1985–2011 Downloaded from DX table 6203-E.3 a Following Dawkins and Norris (1990), in addition to people identified as casuals working more than 10 hours a week, all people working less than 10 hours a week were classified as casuals. The figure for casuals for 1982 is, therefore, an upper bound estimate. b Casual employees were defined as people who did not receive paid holiday or sick leave. Permanent employees were defined as people who received paid holiday or sick leave (or both). c As discussed in chapter 3, data on employees with and without leave entitlements were used as a proxy for permanent and casual employees, respectively. d Estimates were derived following the approach documented in box J.1. e The July 1997 edition of the catalogue contained a feature article on OMIEs (ABS 1997). Figure 2 of the catalogue presented an index of OMIE employment between 1978 and 1997. This was used to derive annual data for this series between 1978 and 1991.
J.3 Other assumptions adopted
Presentation of data collected on a consistent basis over three decades was complicated by changes in questionnaires and collection methods. Key changes, and the actions taken to address them, are described below.

J.4 FORMS OF WORK
Status in employment series
Three key changes to data relating to the status in employment series are discussed in this section.
1. Revisions were made to the LFS questionnaire in April 1986 to include in the definition of the employed, people who worked 1 to 14 hours per week as unpaid family helpers. There is a clear break in series in data from dX.1
Action: Because of the break in series, the effect detailed at point 3 (below), and the small proportion of employment that this category represents, contributing family workers were excluded from the presentation of data.
2. Until February 2000, the ABS cross-checked information provided for individuals to the LFS status in employment question with information on the ABS business register.2 From February 2000, only information provided by survey respondents was used. The effect of this change in approach can be seen in a comparison of data for the last two-quarters under the old regime (August and November 1999) and the first two-quarters under the new regime (February and March 2000) (table J.2). The effect of the change was most pronounced for the category of employers. Estimates of employees were 0.6 per cent higher using the new method, and estimates for employers and own account workers were 10 per cent and 0.8 per cent lower, respectively (ABS 2000).
Action: Estimates for employers pre-February 2000 were reduced by 10 per cent. Given the small effect on the series for employees and own account workers, they were not adjusted.
Table J.2 Effect of dropping reference to business register in February 2000 on status in employment variables Per cent
Employees Employers Own account workers Contributing family
workers Total
Aug-99 84.4 4.1 10.5 0.9 100 Nov-99 85.7 4.0 9.5 0.8 100 Feb-00 85.9 3.6 9.6 0.8 100 May-00 86.5 3.6 9.2 0.7 100
Source: ABS (Labour Force, Australia, Cat. no. 6203.0).
1 dX is a web application that supports the manipulation of time series data. It is regularly updated
with ABS data series. 2 The business register is a database maintained by the ABS of all Australian businesses with an
active Australian Business Number. The main purpose of the register is to provide the list from which firms are selected into some ABS firm-level collections.

DATA USED IN CONSTRUCTING 30-YEAR TIME SERIES
J.5
3. A new LFS questionnaire, with questions designed to more accurately collect status in employment information, was introduced in April 2001. It had little impact on the time series for employment status, with the exception of that for contributing family workers (table J.3).
Table J.3 Effect of new LFS questionnaire in April 2001 on status in employment variable Per cent
Employees Employers Own account workers Contributing family
workers Total
Nov-00 85.7 3.7 9.7 0.8 100 Feb-01 86.3 3.7 9.2 0.8 100 May-01 86.3 3.5 9.7 0.4 100 Aug-01 85.9 3.6 10.1 0.4 100
Source: ABS (Labour Force, Australia, Cat. no. 6203.0).
Action: See point 1.
Employment by type data
Three key changes to data relating to employment by type data are discussed in this section.
4. To construct a time series on employment by type back to 1992 (published in ABS (2012a)), the ABS used only an individual’s self-reported status in employment (ABS 2004). Counts of employees and OMUEs therefore differed from the LFS status in employment counts prior to February 2000.
Action: None needed. As discussed at point 2, the change in methodology when adopted for the LFS had only a very small effect on employees, and an adjustment was made for the employer component of OMUEs.
5. The questions in the LFS were not explicitly designed to identify OMIEs and ‘[t]he questions used prior to April 2001 were thought to identify around 90% of owner managers of incorporated enterprises’ (ABS 2004, p. 1).
This leads to a concern over the reliability of data for OMIEs from this source. With the introduction of the new LFS questionnaire in April 2001, the ABS thought it possible that 95 per cent of OMIEs were identified. Given the small effect of the introduction of the questionnaire on status in employment categories (table J.3), it might be assumed that the effects on OMIEs were similarly small.

J.6 FORMS OF WORK
From 2004, the ABS anticipated that questions in the Forms of Employment (FOE) survey would permit even more accurate identification of OMIEs (ABS 2004). A comparison of the estimates from the LFS/EEBTUM approach and FOE survey suggests the former were reasonably accurate (point 6).
The implication of the possible 10 per cent underestimate prior to 2001 is to understate this category, and overstate both employee categories (because an estimated 55 per cent of OMIEs do not have paid leave entitlements (ABS 2004)). If the OMIE estimates are adjusted up by 10 per cent, and the difference between the old and new OMIE estimates is deducted from figures for permanent and casual employees in the proportion 45/55 per cent respectively, estimates for permanent employees fall by about 0.6 per cent and for casuals by 1.5 per cent.
Action: It could be assumed that OMIE estimates from 1978 to 2001 were understated by 10 per cent — and the series adjusted accordingly. However, as the above quote illustrates, the ABS is uncertain about the extent of underestimation. It is assumed that the changes introduced with the new LFS questionnaire in April 2001 led to improved, and reasonably accurate, measurement of OMIEs, but it is unclear by how much. Given this lack of certainty, and the relatively small potential effect on estimates for permanent and casual employees, no adjustments are made for possible underestimation of OMIEs.
6. The ABS changed the methodology used to compile data on employment type from 2008. Prior to that point, estimates were produced by combining data from the LFS and EEBTUM survey (ABS 2012a). From 2008 onwards, estimates come from the FOE survey. It is possible to compare the FOE survey data for 2004, 2006, 2007 and 2008 (collected in November), with LFS/EEBTUM estimates (collected in August) (table J.4). As the ABS notes:
While this change in methodology has resulted in a break in series, the impact on the estimates is minimal. (ABS 2012a, p. 1)

DATA USED IN CONSTRUCTING 30-YEAR TIME SERIES
J.7
Table J.4 Estimates of shares of employment by type — the FOE survey and LFS/EEBTUM survey measurement approaches Per cent
2004 2006 2007 2008
FOE survey estimates Permanent employees 59.6 60.8 60.9 61.8 Casual employees 20.6 20.4 20.9 19.6 OMIEs 7.1 6.6 6.5 7.0 OMUEs 12.7 12.1 11.8 11.5 LFS/EEBTUM estimates Permanent employeesa 59.4 61.0 61.1 63.3 Casual employees 20.6 19.8 20.1 20.1 OMIEs 6.4 6.8 6.3 5.7 OMUEs 13.6 12.5 12.4 10.9 a The relatively large increase in the prevalence of this FOW between 2007 and 2008 (and the fall of OMIEs) is assumed to reflect something odd in the source data.
Sources: ABS (Forms of Employment, Cat. no. 6359.0; Australian Labour Market Statistics, Cat. no. 6105.0).
Action: No adjustments are made. The changes will have minimal impact on the time series.
Which total?
Weights used in the EEBTUM survey are not adjusted for population rebenchmarking, unlike the LFS (ABS 2004). Estimates from the LFS are weighted to accord with the civilian population aged 15 years and over. These weights are adjusted every 5 years on the basis of Census data. The totals from the two surveys usually differ by about 1 per cent or less. (An exception to this conclusion arises in 2008 and 2009, where the differences are 2.0 and 2.7 per cent respectively.) Given data from both surveys are used in this analysis, the question of which total to use arises.
Action: Because the LFS total is available consistently since 1978, it is used (excluding continuing family workers) in calculating the shares of each FOW in total employment.