Embed Size (px)
Citation preview

Staff Working Paper ERSD-2010-12 Date: June 2010
World Trade Organization Economic Research and Statistics Division
Globalization and trade flows: what you see is not what you get!
Andreas Maurer and Christophe Degain
WTO
Manuscript date: 22 June 2010 Disclaimer: This is a working paper, and hence it represents research in progress. This paper represents the opinions of the authors, and is the product of professional research. It is not meant to represent the position or opinions of the WTO or its Members, nor the official position of any staff members. Any errors are the fault of the authors. Copies of working papers can be requested from the divisional secretariat by writing to: Economic Research and Statistics Division, World Trade Organization, Rue de Lausanne 154, CH 1211 Geneva 21, Switzerland. Please request papers by number and title.

Globalization and trade flows: what you see is not what you get!
Andreas Maurer and Christophe Degain1 Abstract: The trade collapse that followed the recent financial crisis has led to a renewed interest on the measurement issues affecting international merchandise trade statistics in the new globalized economy. The international fragmentation of industrial production blurs the concept of country of origin and calls for the production of new statistics on the domestic content of exports, with a view of estimating trade in value added. Alongside, the international statistical community has revised in 2010 the concepts and definitions on both, international merchandise trade and trade in services statistics. This paper discusses the various issues related to the concepts of "goods for processing" and "intra-firm trade" in trade statistics, and provides an overview of the method of analysing the impact of the fragmentation of production in international value chains. Keywords: trade statistics, goods for processing, intra-firm trade, trade in intermediate products,
trade in value added JEL Classification: C49, F13, F23, F49
1 With contributions from Florian Eberth, Hubert Escaith, Andreas Lindner and Yann Marcus.

Page 2
A. Introduction The 2008 financial crisis, which translated into a global economic crisis, impacted on trade in a harsh manner. As of the fourth quarter of 2008, trade flows started to deteriorate, although unevenly across regions. While Europe recorded a 16 per cent year-on-year decline of its merchandise exports, comparable rates in North America and Asia were only 7 and 5 per cent respectively. Estimates of 2009 point towards a merchandise trade to GDP elasticity of up to 5 at world level while a long-term world average of annual values between 1960 and 2008 indicates an elasticity of 1.6. However, for manufactured goods this value is slightly higher (2.1), that is, manufactures respond more to changes in GDP than non-manufactures. Several explanations have been advanced to explain this over-shooting of trade in relation to GDP movements, amongst them global production chains and vertical specialization, decline of transport costs and tariffs, and improved infrastructure services. Merchandise trade statistics record trade flows on a "gross basis" whereas the gross domestic product (GDP) aggregate measures the value added created during the production of goods and services (i.e. output less intermediate consumption). Thus, trade in intermediate products is only taken into account in GDP through the additional value produced at each step of the production process.2 In merchandise trade statistics, in contrast, intermediate goods are counted at full value each time they cross the border. The share of intermediate manufactured products in non-fuel world trade was around 40 per cent in 2008.3 This proportion can vary among countries depending on their export specialization: for Brazil, China or India the share of intermediate goods in total flows in the manufacturing sector was about 70 per cent in 2005.4 Through the phenomenon of international supply chains, "multiple gross counting" is amplified. Indeed, the increase in trade elasticity observed after the late 1980s (see Chart 1) is probably due to a change in business model, where specific segments of manufacturing production have been progressively outsourced to other countries. Escaith et al. (2010) concludes that the related increase in trade elasticity observed at global level is only temporary, with a progressive return to long term average. The trade overshooting observed during the run-up to the 2008-2009 crisis is mainly due to short-term composition and inventory effects.
2 WTO (2009), "International Trade Statistics 2009", p. 1 3 WTO (2009), "International Trade Statistics 2009", p. 2 4 Miroudot, S., Lanz, R., Ragoussis, A. (2009)

Page 3
Chart 1: World GDP Elasticity of Imports, 10-year-average (GDP weighted at market exchange rates)
1.0
1.5
2.0
2.5
3.0
3.5
1990 1995 2000 2005 2009
Note: each year on the graph indicates the last year of the ten years' data sample. Source: Escaith, H., Lindenberg, N., Miroudot, S. (2010) The following paper tries to shed light on the relevance of official trade statistics in the face of these economic transformations, focusing on "goods for processing", "intra-firm trade", and "trade in value added". B. Trade statistics Trade statistics of economies are available and used in different statistical frameworks: national accounts, balance of payments, customs (national or international concepts), input-output tables, etc. The objective of official merchandise trade statistics is to describe adequately economic phenomena and provide decision makers with relevant indicators. Yet, the structural changes linked to globalization are challenging the relevance of these traditional trade statistics. As mentioned in Escaith (2008), what you see in these statistics is no more what you get. The issue is also important for trade in services statistics, as these registered flows may also misrepresent current economic phenomena. Indeed, international supply chains that characterise global manufacturing, particularly since the 1990s, are also affecting trade in services, as firms in industrialised countries look beyond the boundaries of the developed world to lower costs and access new talents. 5 In addition, users of trade statistics often face issues of consistency and interpretation, especially when numbers are taken from different statistical frameworks.6 This happens mainly for conceptual
5 According to Gereffi and Fernandez-Stark (2010), firms are attracted to developing countries as offshore destinations for their competitive advantages, such as low human resources costs, technological skills, language proficiency, similar time zones, and geographic and cultural proximity to major markets. As more sophisticated work and knowledge-intensive activities are performed abroad, the supply of scientific, engineering and analytical talent offered by developing countries also become key in attracting firms. 6 To identify "best values" of a country's merchandise trade, international agencies developed an inter-agency "Common Data Set", available online, that displays officially reported data and "best values" according to international concepts specified by the United Nations for international
Page 4
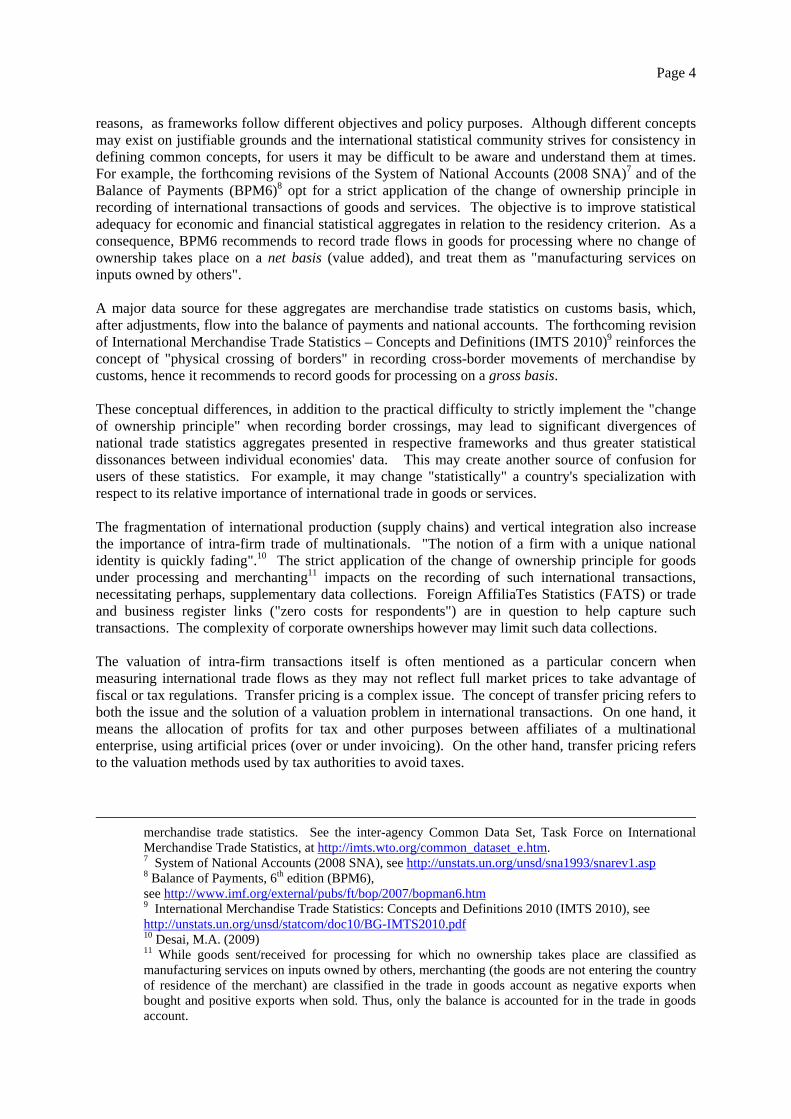
reasons, as frameworks follow different objectives and policy purposes. Although different concepts may exist on justifiable grounds and the international statistical community strives for consistency in defining common concepts, for users it may be difficult to be aware and understand them at times. For example, the forthcoming revisions of the System of National Accounts (2008 SNA)7 and of the Balance of Payments (BPM6)8 opt for a strict application of the change of ownership principle in recording of international transactions of goods and services. The objective is to improve statistical adequacy for economic and financial statistical aggregates in relation to the residency criterion. As a consequence, BPM6 recommends to record trade flows in goods for processing where no change of ownership takes place on a net basis (value added), and treat them as "manufacturing services on inputs owned by others". A major data source for these aggregates are merchandise trade statistics on customs basis, which, after adjustments, flow into the balance of payments and national accounts. The forthcoming revision of International Merchandise Trade Statistics – Concepts and Definitions (IMTS 2010)9 reinforces the concept of "physical crossing of borders" in recording cross-border movements of merchandise by customs, hence it recommends to record goods for processing on a gross basis. These conceptual differences, in addition to the practical difficulty to strictly implement the "change of ownership principle" when recording border crossings, may lead to significant divergences of national trade statistics aggregates presented in respective frameworks and thus greater statistical dissonances between individual economies' data. This may create another source of confusion for users of these statistics. For example, it may change "statistically" a country's specialization with respect to its relative importance of international trade in goods or services. The fragmentation of international production (supply chains) and vertical integration also increase the importance of intra-firm trade of multinationals. "The notion of a firm with a unique national identity is quickly fading".10 The strict application of the change of ownership principle for goods under processing and merchanting11 impacts on the recording of such international transactions, necessitating perhaps, supplementary data collections. Foreign AffiliaTes Statistics (FATS) or trade and business register links ("zero costs for respondents") are in question to help capture such transactions. The complexity of corporate ownerships however may limit such data collections. The valuation of intra-firm transactions itself is often mentioned as a particular concern when measuring international trade flows as they may not reflect full market prices to take advantage of fiscal or tax regulations. Transfer pricing is a complex issue. The concept of transfer pricing refers to both the issue and the solution of a valuation problem in international transactions. On one hand, it means the allocation of profits for tax and other purposes between affiliates of a multinational enterprise, using artificial prices (over or under invoicing). On the other hand, transfer pricing refers to the valuation methods used by tax authorities to avoid taxes.
merchandise trade statistics. See the inter-agency Common Data Set, Task Force on International Merchandise Trade Statistics, at http://imts.wto.org/common_dataset_e.htm. 7 System of National Accounts (2008 SNA), see http://unstats.un.org/unsd/sna1993/snarev1.asp 8 Balance of Payments, 6th edition (BPM6), see http://www.imf.org/external/pubs/ft/bop/2007/bopman6.htm 9 International Merchandise Trade Statistics: Concepts and Definitions 2010 (IMTS 2010), see http://unstats.un.org/unsd/statcom/doc10/BG-IMTS2010.pdf 10 Desai, M.A. (2009) 11 While goods sent/received for processing for which no ownership takes place are classified as manufacturing services on inputs owned by others, merchanting (the goods are not entering the country of residence of the merchant) are classified in the trade in goods account as negative exports when bought and positive exports when sold. Thus, only the balance is accounted for in the trade in goods account.

Page 5
However, it is difficult for statisticians to correct these distortions which arise from the companies' shifting assets, income and profits for reducing tax burdens. International guidelines on such transactions are available from either the OECD or the WCO, the question being to which extent these are implemented, for example, outside the OECD region.12 Goods shipped for processing, increased intra-firm trade of multinationals or transfer pricing are inter-related phenomena which are growing with an increasing fragmentation of production chains. This adds to the difficulty to determine a product's origin and to reply to the question of "Who produces for whom in the world economy?"13. Vertical fragmentation of production is a phenomenon of globalization that affects both goods and services-producing industries. It leads to an increase of trade flows in intermediate products (parts and components) in the manufacturing sector and also to an increased services content in goods ("trade in tasks"). Industrial supply chains may blur the country of origin concept as part of the commercial value of an imported good may not originate in the "country of origin" mentioned in the custom documents. Consequently, what part of value is a country adding to an exported product and which part is coming from an earlier imported product? Users turn to international trade statistics for replying to such questions. The remainder of this paper describes the decomposition of trade flows for analyzing the effects of goods for processing, intra-firm trade and trade in value added. C. Goods for processing – is gross reporting reflecting economic reality? 1. Economic importance With multinational corporations fragmenting international production, sales of goods between firms or multinational companies has increased. This is reflected in an increase of trade in intermediate goods. Outsourcing is often used to describe this phenomenon, shifting production either to another domestic company or a foreign firm abroad (offshore-outsourcing).14 When the company abroad is an affiliate, involving foreign direct investment to establish it, trade between the two entities is considered intra-firm. Merchandise trade receives a "continued interest...due to its crucial role in economic development as it binds producers and consumers located in different countries into a global economic system".15 The underlying principle for it is to measure trade flows gross. Users are interested to analyse these trade flows at global level as well as for trade in intermediate goods, shipments for processing, or intra-firm trade. Goods sent abroad for processing in particularly defined zones are usually benefiting special tariff and tax treatments. Often, these activities are taking place in Export Processing Zones (EPZs) of developing economies, where imported materials and other intermediate goods are processed or assembled for export.16
12 OECD Transfer Pricing Guidelines for Multinational Enterprises and Tax Administrations, see also Transfer Pricing and Customs Valuation, edited by A. Bakker and B. Obuoforibo, IBFD, 2009. 13 Daudin, G., Rifflart, C., Schweisguth, D. (2009) 14 Krugman, P., Obstfeld, M. (2005), p. 20 15 Draft IMTS 2010, see http://unstats.un.org/unsd/statcom/doc10/BG-IMTS2010.pdf 16 Tax concessions and subsidies offered to firms operating in EPZs are covered by the WTO Agreement on Subsidies and Countervailing Measures.

Page 6
In addition to contributing decisively to a country's export diversification strategy, EPZs have also been an increasing source of employment and income for developing economies.17 Based on balance of payments (BOP) statistics, it is estimated that around a fifth of developing country exports are out of export processing zones while the share on the import side is about 13 per cent. A number of economies identify within their balance of payments data on goods for processing in the compiling economy. This allows a partial (lower) approximation of imports of intermediate input for processing, and the subsequent (re-) exports of finished products.18 Statistics available from developing economies hint that the share of their exports resulting from their participation in global supply chains have accounted for not less than 18 per cent of their total exports since 2000, probably considerably more. Over the 2000-2008 period, China alone accounted for about 67 per cent of all reported exports of "compensating products" resulting from inward processing, while Mexico represented another 18 per cent. Chart 2: The importance of goods for inward processing in developing economies total exports and imports (minimum approximation), 2000-2008 (Billion dollars) Source: IMF Balance of Payments statistics and WTO estimates. The overall impact on economies in which these processing operations take place appears to be substantial, as the resulting value added (approximated by the difference between exports of processed products and imports of intermediate inputs) represents some 30 to 35 per cent of the exported products. EPZs are an important development factor, for example, China's processing exports account for nearly half of its total export value19, but smaller economies also benefit from such zones (see Box 1 below).
17 See Milberg (2007) for a survey on EPZs prepared for the International Labour Organization. 18 Conceptually goods for processing include both processing in the compiling economy (inflows of goods received from abroad for processing and their subsequent re-exports to the initial shipper) and processing abroad (outward processing). At present, compilation of information on outward processing is marginal among developing economies: such goods are generally not identified separately from general merchandise trade. Thus statistics available on goods for processing for some 30 developing economies widely reflect imports into and exports from their processing zone, which is an approximation for inward processing. 19 Ma, A.C., Van Assche, A. & Hong, C. (2008)
Exports, BOP basis
0100020003000400050006000
2000 01 02 03 04 05 06 07 2008
Goods resulting from inward processing Other goods
Imports, BOP basis
0100020003000400050006000
2000 01 02 03 04 05 06 07 2008
Goods for inward processing Other goods

Page 7
While China's trade numbers indicate that in 2009 nearly half of its exports came out of an EPZ, and one third of its imports were contracted in such zones, China further distinguishes domestic from foreign-owned enterprises (FOE) in these zones. For example, in 2008/09, two thirds of China’s EPZ trade were actually performed by foreign-owned enterprises. Table 1: China's trade by customs regime and type of enterprise, 2008-09 (Billion dollars and percentage)
2008 2009Exports Imports Exports Imports
Value1. Total 1429 1133 1202 10062. Processing and assembling 111 90 93 763. Procesing with imported material 565 288 494 246
of which FOE:4. Processing and assembling 46 46 40 385. Procesing with imported material 388 207 341 179ShareTotal processing trade / Total trade (2+3)/1 47.3 33.4 48.8 32.0Processing trade (FOE) / Total trade (4+5)/1 30.4 22.3 31.7 21.6
Processing trade (FOE) / Total processing trade (4+5)/(2+3) 64.2 66.9 64.9 67.4 Source: China's Customs Statistics Dec. 2008-2009, Tables 5-7
Box 1: INTERVIEW - Special Kenyan export zones increase sales -regulator Sales by factories in Kenya's special Export Processing Zones (EPZs) have increased nine fold since the first such zone was set up 15 years ago, the regulator of the sector said on Wednesday. Total sales from the zones have grown over 800 per cent to 28 billion shillings ($365.8 million) last year from just three billion shillings in 1994. "The experience has been a success story. Since we started the EPZ program, things have never been the same in the manufacturing sector," said Joseph Kosure, acting chief executive of the Export Processing Zones Authority. The exclusive zones were created to attract investment by giving incentives such as a 10 year tax holiday on both corporate and income tax for foreign directors. Factories in the special regions also have continuous supplies of power and water that normal industries are not assured of. "We attempt to maintain world class standards for the operators," Kosure said. "We give them investor support they don't have to suffer immigration, labour, customs issues." The zones, for example, have custom officers and will soon enjoy the services of labour and immigration officers on site. "We do not want fiscal incentives only. We are attempting to depend on procedural incentives also." The introduction of the African Growth and Opportunity Act (AGOA), a programme by the United States to encourage exports from the continent through duty and quota free trade has also boosted EPZ output. "When AGOA came in 2001, there were leaps and bounds in terms of attraction of investors from outside and from the technology transfer. Kenyan entrepreneurs also believed that yes, there is something here that they could try," Kosure said. (By Helen Nyambura-Mwaura NAIROBI, Aug 5, 2009 (Reuters))

Page 8
2. Statistical measurement International merchandise trade statistics record international transactions when goods physically cross borders. The forthcoming IMTS 2010 is reinforcing this principle, in that it says that "in all cases goods for processing, as well as goods resulting from the processing (compensating products in customs terminology) are to be included in merchandise exports and imports of the countries, as applicable, at their full value".20 Goods sent abroad for processing can either be (i) returned to the sending company (no change of ownership), (ii) cleared for home use in the processing country, or (iii) exported further to a third country. For the second and third case, a change of ownership usually takes place which should result in a consistent treatment between IMTS and the Balance of Payments (BPM) when recording these transactions. The forthcoming BPM6, to be consistent with 2008 SNA, excludes from the goods account transactions in "goods sent abroad for processing" for which no change of ownership is taking place. The new Manual recommends that in that case a processing fee is recorded under "manufacturing services on physical inputs owned by others". However, both inward and outward movements of such goods should be tracked to assist in identifying the necessary processing fee.21 These values should help identify cases where the goods are subsequently sold, rather than returned, in which case they are identified as an export from the owner's economy at the time of sale. Also under 2008 SNA, the processing fees by the outward processing economy would be recorded as imports of services, while the value of goods for processing would be excluded from exports/imports of goods in the goods account. Depending on the size and nature of a country's processing activities, the application of the new BPM6 recommendations can lead to a significant shift in the goods-services split of an economy's trade, while customs-based merchandise trade statistics still show goods for processing as trade in goods. Thus, differences in published trade aggregates of a country may increase in future due to conceptual differences between statistical frameworks and the [in] ability of measuring and allocating properly the processing fee. In the course of preparing the BPM6 decision on the treatment of goods for processing, a fictive example (see table below) was calculated by the IMF for China's current account balance of 2007. It argues that the new treatment is not changing the current account; it changes only an economy's split into goods and services in favour of the services position.
20 Draft IMTS 2010, see http://unstats.un.org/unsd/statcom/doc10/BG-IMTS2010.pdf, p. 15. 21 Keeping track of the gross values may also prove useful when deriving price indices, or conciliating SNA indicators with basic economic statistics, for example in the industrial sector.

Page 9
Table 2: Potential impact of the new BPM6 treatment of processing trade on China's current account balance, 2007 (Billion dollars) BPM5 Adjustment BPM6 Exports of goods 1220 -618 602 Imports of goods 905 -352 553 Goods trade balance 315 -266 49 Exports of services 122 266 388 Imports of services 130 130 Services balance -8 266 258 Balance on goods and services 307 307 Current account balance 372 372
Source: IMF, BOPCOM,-08/11 Although this example shows an identical current account balance before and after implementation of BPM6 changes would only offset each other when the processing fee would be equal to the difference between goods received for processing and goods returned after processing -- in practice, this does not hold. In fact, the value of the assembled product may be greater than the cost of the intermediate inputs plus the processing fee in that it includes for example additional costs for services (e.g., research and development, etc).22 Large exchange rate variations between the import and re-export dates may also introduce significant doses of statistical noise. 3. Measuring the processing fee The processing fee recorded in BPM6 as manufacturing services may include materials purchased by the processor.23 For most cases, the value of the manufacturing services or the processing fee is not simply the difference of the value of goods before and after processing. Some reasons for such a difference may be the reliability of the customs value of goods as it may include profit margins or be subject to other factors of pricing in respect of intra-firm trade; cross-period movements (goods are supplied in one period but returned in another); price effects through holding gains/losses; no reporting of exports if goods are destroyed during processing; inclusion of overheads such as research, patents, finance, and marketing, etc. For compilers, who use the merchandise trade values in developing estimates of processing services, above factors may be a source of concern. For compilers, who decide to use data from enterprise surveys or an International Transactions Reporting System, above factors may help explain differences to values derived from merchandise trade.
22 2008 SNA, chapter 28, para 28.14 23 IMF, Balance of Payments 6th edition, chapter 10, p. 161

Page 10
4. Data collection, gaps and dissemination For the implementation of the new statistical standards for goods for processing, the following variables will be needed:
Value of the processing fees; Value of raw materials/semi-manufactures used for processing (that were not imported from
the declaring country or that were imported from a third country); Information on ownership status (with/without change of ownership).
Possible options for the data collection could consist of following methods:
Expanding the trade declaration documents accordingly (sub-categories for imports and exports);
Survey on processing activities; Applying new data models and imputations; Other models, e.g. combinations of the methods above.
Each of the methods would come with advantages and disadvantages (trade declarations could deliver most details and all additional data required but are the one with the highest burden for traders). Under the new statistical standards, the value of external trade in goods shown under National Accounts and Balance of Payments frameworks will be significantly different from that shown under merchandise trade statistics since the latter statistics are not compiled based on the "change of ownership" principle. In dissemination of the respective trade aggregates, users need to be provided with the respective metadata to interpret the numbers in the respective context. For example, releasing two different figures on trade in goods will require appropriate bridge tables to explain the differences between the numbers. In this context it might be interesting to mention that the OECD is experimenting a different presentation of trade figures in a consolidated manner, e.g. a merged view of goods and services trade through a product-oriented scope combining the ISIC, CPC and EBOPS classifications. First exploratory steps have been undertaken by the OECD Statistics Department to produce such a list.24 D. Intra-firm trade – trade flows and ownership 1. Economic importance Multinational Enterprises (MNE) can move goods and services across borders without a change of ownership; the choice is often linked to tax considerations. Fragmentation of production across countries and vertical integration of multinationals have increased the importance of intra-firm trade. For the US, these trade flows are estimated at between 45 and 48 per cent on the import side, and 31 to 32 per cent on the export side for the period 1992 to 2004.25 Multinationals may relocate parts of their production processes to countries with a relative comparative advantage. Anecdotal evidence reports that "one-third of all [merchandise] trade" is within companies (for individual sectors it might be even higher), for example, a multinational shipping raw or intermediate goods to an affiliate abroad for assembly. The country assembling the final product may then export it to a third country. For
24 Wistrom, B. (2010) 25 Akram, T., Khan, H.A., Holladay, J.S. (2007)

Page 11
example, Japanese multinationals shifted their production base to the East Asian region which in turn exported final products to third countries. In 2006, intra-firm trade of US multinationals with their majority-owned affiliates amounted to between 37 and 38 per cent of their total trade.26 The complexity of corporate ownerships however makes it often difficult to identify intra-firm trade in practice. Moreover, the national definition of related firms differ from country to country, in some instances, only partial ownership of the affiliate is sufficient to qualify, while in other places, controlling participation or full ownership is required. Chart 3: Intra-firm trade in US total private services exports, 1997-2007 (Billion dollars)
050
100
150
200250
300
350
400450
500
1997 1998 1999 2000 2001 2002 2003 2004 2005 2006 2007
Total private servicesIntra-firm
Source: Bureau of Economic analysis, US Department of Commerce While the globalization of business and firms' increasing fragmentation of different stages of the production process has dramatically increased the role of intermediate goods in merchandise trade over the last decade, a similar pattern has been emerging in the field of services. The bulk of this increase is not represented in cross-border transactions, but in the activity of foreign affiliates installed closer to their customers. Based on Foreign Affiliates Statistics (FATS), the United States has recorded an increasing share of trade between multinationals and their majority-owned foreign affiliates, growing from 21.5 per cent to more than a quarter of its total trade (27.5 per cent) in 2007 (covering only non-bank affiliates, and excluding transportation services and travel).27 2. Statistical measurement IMTS 2010 emphasizes the inclusion of trade transactions between related parties (whatever the definition of "related"). These transactions should be "included in international merchandise trade statistics the same way as if these transactions would take place between unrelated parties..." These transactions should be valued at arm's-length prices; however, if both trading partners belong to the same multinational enterprise, risks and profits may be transferred in such a way to benefit of tax regimes. "Transfer" prices may be used which would in principle require adjustments to reflect arm's length prices. Such adjustments are however not easy.
26 Akram, T. et al. (2007) 27 WTO (2009), "International Trade Statistics 2009", p. 6

Page 12
The collection of data on intra-firm trade could theoretically also be implemented by respective modifications (extensions) of the trade declaration documents (additional variable). Again, this would involve a high burden on respondents and the necessity of the respective knowledge whether traders concerned are affiliated or not (definition of affiliation?). Collecting these data via the FATS framework or in particular via data linkages (combining trade and business registers) might be more appropriate alternatives. As a consequence, transfer prices could be better recognized as such and be adjusted (e.g. towards "arm's length" prices). The BPM6 recognizes the importance of exchanges of goods and services between affiliated enterprises. Many cross-border movements in goods are between affiliated enterprises. The goods may be moved for processing, resale, and other purposes. The question may arise as to whether there has been a change of economic ownership, especially when EPZs are involved. Whether there has been a change in economic ownership is determined according to the usual principle that the economic owner is the party that bears the risks and rewards of ownership. In cases where there has been a change of possession of goods between affiliated enterprises, but it is not known whether there has been a change in ownership, the following factors should be considered: When affiliated enterprises28 are separate legal entities, their transactions should be treated
according to the parties' own arrangements as to whether there is a change of ownership or not. Between a quasi-corporation29 and its owner, legal title is not usually available as evidence of the
nature of the movement of goods. The preferred treatment in this case is to identify which part of the legal entity assumes the risks and rewards of ownership, based on evidence such as which location has the goods recorded in its accounts and is responsible for the sale of the goods. The treatment should be consistent with reporting by the branch in business accounts and enterprise or establishment surveys.
In some cases an estimate of a market-equivalent price may need to be made. For example, barter trade, aid goods, provision of goods and services between affiliated enterprises, under or over-invoicing, goods on consignment or for auction, or where goods change ownership but a final price is determined later may require adjustment to the goods value. Such adjustments may also require corresponding financial account items, such as trade credit; in the case of goods supplied by direct investors to their direct investment enterprise below cost or without charge, the corresponding entry is direct investment equity. On the services side, a direct investor may temporarily provide equipment to its direct investment enterprise, which would be recorded as an operating lease. Management and ancillary services may also be provided. (BPM6, para.10.150): services for the general management of a branch, subsidiary, or associate provided by a parent enterprise or other affiliated enterprise are included in other business services, often under professional and management consulting services. However, reimbursements of ancillary services supplied by affiliated enterprises, such as transport, purchasing, sales and marketing, or computing, should be shown under the relevant specific heading. Management fees are included in other business services. However, disproportionately large values of services between affiliated enterprises should be examined for signs that they are disguised dividends, for example, indicated by large fluctuations that do not reflect actual changes in the services provided. Compilers in each of the economies involved are encouraged to cooperate and exchange information in order to avoid asymmetrical recordings of bilateral data.
28 Affiliated enterprises are enterprises related through direct investment ownership structures, such as branches, subsidiaries, associates, and joint ventures. 29 A quasi-corporation is an unincorporated business that operates as if it were an entity separate from its owner(s).
Page 13
E. Trade in value added: what is the country of origin in an interconnected world? 1. Economic importance International production sharing through supply chains is a phenomenon of globalization in both goods and services-producing industries. It leads to an increase of trade flows in intermediate products (parts and components), especially in the manufacturing sector. In parallel, the services content of manufactured goods is increasing, due to the need of linking the global production chain and to guarantee increased product diversity and customization of products.30 Today, for advanced industrial countries, services (R&D, transportation and insurance) and intellectual property rights may take a much larger share in the domestic content of a manufactured product than manufacturing per se. In addition, the distinction between providers of services and providers of intermediate goods in the productive chain is increasingly blurred. Indeed, "services provide the mortar that holds international supply chains together".31 Traditional trade-related services such as transportation are gaining importance in the final price of merchandise, and research has shown that the rate of protection due to transport costs is higher than due to tariffs.32 The often-quoted iPod example shows this increased service content: an iPod retails for $299 while its production costs are $144 resulting in a makeup of $155.33 This difference is due to retailers and Apple's costs for design, research, development, etc. However, the production costs of the iPod manufactured abroad enter into the trade balance of the countries' bilateral exchanges as traditional merchandise trade statistics measure cross-border trade flows gross. If the iPod's assembling country receives further inputs from other countries to assemble their product, it imports intermediate goods. Depending on the size of fragmentation, these intermediate goods may cross frontiers several times. Traditional trade statistics may therefore "overstate the degree of import competition that comes from one's trading partners."34. Industrial supply chains add to the "blurriness" of the country of origin concept as the value of an imported good does not necessarily fully originate from the "country of origin" mentioned in custom documents. For example, if the value of an iPod imported by the US from China is about $150, "the value added to the product through assembly in China is probably a few dollars at most".35 Indeed, when strictly analyzing country of origin, i.e., combining the value added content with the country in which it was produced, bilateral trade balances may be altered (see Table 5). Again, the Apple iPod example is a model case as only a small fraction is value added originating from China – the remainder stems from the US, Japan and other countries where conception and production of critical components, as well as marketing efforts are located. The electronics sector is an industry particularly concerned. "It is characterized by a high value to weight ratio and production of parts and components can easily be separated in time and space".36 Comparing trade in value added instead of gross flows in trade may change the analysis of trade. For example, intra-regional trade flows and trade of regional blocs such as NAFTA or ASEAN show a higher growth than trade with third countries. Analysing trade in value added may change this trend and reveal that intra-trade growth may mainly be based on flows of intermediate goods within
30 Nordas, H. K. (2005) 31 Nordas, H. K. (2005) 32 Limao, N., Venables, A. J. (1999) 33 Ikenson, D. (2010) 34 Lamy, P. (2010) 35 Linden, G., Kraemer, L., Dedrick, J. (2007) 36 Nordas, H. K. (2005)

Page 14
increasingly integrated productive networks. It is therefore important to develop trade measures that complement gross recording with the value added analysis. 2. Statistical measurement To be able to quantify the part of imported inputs in an economy's exports, different statistical approaches are used. The most accurate results are achieved through tracing value added in individual case studies. Well known examples are the analysis of iPod's supply chain or Mattel's Barbie dolls. However, these samples were chosen more for their illustrative potential than for their statistical representativeness.37 Another data source available is foreign trade statistics. While trade in intermediate goods might deliver an estimate at product level, the main issue is to define what to consider intermediate. For example, is software an intermediate product or is it for final use? The third approach is to link foreign trade with production statistics, through the input-output (I-O) statistical framework. International input-output (II-O) tables extend this concept to present linkages between several countries and allow compiling estimates on the value added content of trade flows. 2.1 Case studies – can links of trade and business registers help to derive microeconomic data? Some examples of such case studies date back to 1998, when a WTO Annual Report described that only 37 per cent of the production value of a typical American car is generated in the US.38 The recent release of Apple's iPad, also produced through a global supply chain, was taken up by press in very much the same way as earlier examples of Apple's iPod or Mattel's Barbie doll, referring to an increase of the US-China trade gap through imports of iPad parts manufactured in China and priced at $287 while in fact only some $12 value was added in China.39 Ideally, to trace intermediate consumption of enterprises for measuring value added produced by individual sectors of an economy, one would need micro data to determine for each enterprise input, output and how much of the output is bound for domestic use or exportation. While there are of course access and confidentiality issues to these data, there is a new, promising data source that statistical offices experiment with – the linkage of trade and business registers, that is, the use of administrative data. Micro data may actually help get around some of the assumptions that are inherently used in input-output analysis. For example, all firms within a sector are homogenous...in "that the intensity in the use of imported inputs is the same between production of exports and production for domestic sales."40 Thus, input-output analysis to date focuses on aggregated, industry level data under the assumption of homogeneity. This is a typical assumption applied in I-O analysis as well. However, companies are specializing (trade in tasks), that is, diversifying their production and related tasks such as accounting, marketing, etc. through offshore outsourcing around the globe. Enterprises may specialize in export markets while others do not export but produce for the domestic market only, thus eventually providing inputs to other companies that trade abroad. Through linking the registers, a Canadian approach for example attempts to identify "who is engaged in international trade".41 Linking both importer and exporter registers allows to identify the throughput, that is, the import content of exports at firm level. Such, linking registers is an ideal addition to analyse trade in value added measures at micro level to verify results received from input-output analysis for the macro level. Such measures at case level have the advantage of being very precise. But they probably remain reserved for large statistical institutes in developed countries
37 Escaith, H. (2008) 38 Grossmann, G.M., Rossi-Hansberg, E. (2006) 39 Corcoran, T. (2010) 40 Koopmann et al. (2008), p.3 41 Armstrong, Ph. (2009), p. 4

Page 15
and are still at the stage of pilot projects. An alternative is to work from existing trade statistics to disentangle trade in final goods and trade in intermediate inputs, on both the export and the import sides. 2.2 Trade in intermediate products Trade in intermediate goods is generally measured through a breakdown of trade statistics according to the UN classification of Broad Economic Categories (BEC)42. A rough measure of trade in intermediate goods based on existing trade statistics is the sum of trade in classification headings having the words "part" or "components" in their descriptors (BEC 22+42+53) as a share in world trade. Some example results show that in the case of the US and China, the share of intermediate goods in non-fuel merchandise is 54 and 38 per cent respectively.43 Other studies prove that the share of trade in intermediate goods in world manufacturing exports increased from 18.5 to 22 per cent during the period 1992-2003.44 The WTO estimated the share of intermediate goods in non-fuel merchandise trade at around 40 per cent in 2008, with wide differences for individual countries.45 Chart 4: Share of intermediate goods in non-fuel merchandise trade, 2008 (Percentage)
0% 10% 20% 30% 40% 50% 60% 70% 80%
World
China
China, Hong Kong
Costa Rica
Czech Rep.
Germany
Indonesia
Malaysia
Taipei, Chinese
Imports
Exports
Source: UNSD Comtrade database However, trade statistics remain arbitrary as product definitions do not always allow to distinguish between intermediate and final use, for example, is packaged software included in IMTS serving as an
42 This product classification helps to define classes of goods, for example, intermediate, capital or consumption goods. From a national account perspective, capital and consumption goods are for final use. 43 Nordas, H. K. (2005) 44 Athukorala, P. C., Yamashita, N. (2006) 45 WTO (2009), "International Trade Statistics 2009", p. 2

Page 16
intermediate or as a final product? This difficulty can eventually be solved when working at disaggregated level. Another limitation is that the methodology is limited to goods (trade in "parts and components"). There is no similar classification for services, and current statistics on trade in services are not detailed enough to allow a distribution of services according to their final or intermediate use. In the context of offshoring, computer and information services as well as other business services are often used as proxies of intermediate services. 2.3. International input-output approach Another method for estimating trade in value added relies on the use of international input-output (II-O) tables which gather national accounts and bilateral trade data on goods and services into a consistent statistical framework. This approach is often referred to as indirect measurement resulting in estimates while case studies or analysing trade in intermediate goods is more considered a direct measurement. International input-output tables are commonly used for the analysis of global supply chains when assessing the import content of exports. The measure of imported inputs that are embedded in exports for a typical industry is also known as vertical specialization46. The rationale behind vertical specialization is for companies to benefit from comparative and productivity advantages at different stages of the production process. It is clearly associated to trade in inputs, caused by international production chains and the development of outsourcing and offshoring strategies from multinational enterprises. The domestic content of exports is a measure of exports net of imported inputs47. It corresponds to the accumulation of the value added incorporated by each of the various domestic sectors that contributed to the supply chain. One of the most effective components of the II-O table is the intermediate demand matrix which enables to identify the origin and use of intermediate goods and services produced and traded amongst countries and industries covered by the table. The II-O analysis is often associated with the application of the Leontief inverse matrix.48 The input-output model created by Wassily Leontief is demand-driven and the elements of the Leontief inverse matrix enable to estimate both direct and indirect impacts of a change in final use. This is of high interest for trade in value added analysis as the Leontief approach enables to take into account all backward linkages between countries and
46 Hummels, D., Ishii, J., Yi, K-M. (2001) 47 Economic literature uses “domestic content of exports” and “domestic value added” interchangeably. 48 Leontief, W. (1951)
Box 2: Trade in services -- anecdotic data to show evidence Estimating the size of offshore outsourcing is suffering of definitional and statistical challenges, and existing classifications do not allow distinguishing the supply of services to end-use clients or, in the context here, intermediate, or business-to-business services. Consequently, estimates vary according to the kind of services included. For example, accounting all IT-enabled services, the OECD estimated a total value of US$836 billion in 2005. A recent report from NASSCOM asserts that the global sourcing market has increased threefold over the period 2004 to 2008 and estimates that the addressable market is more than five times the current market size. Business Process Outsourcing, the report affirmed, has become an integral part of the global delivery chain and a market in which outsourcing is a key driver. Regional shifts in spending were observed, such as the increasing shares of emerging markets such as CEMA (Central and Eastern Europe, Middle East and Africa), Latin America, and Asia Pacific (excluding Japan). Healthcare was predicted to present emerging opportunities for the future, according to another NASSCOM report. It estimated that outsourced healthcare may represent approximately US$17 billion in market opportunity in the US alone. Source: (WTO document S/C/W/304)

Page 17
sectors present in the II-O table and to capture the value of imported inputs used directly and indirectly (at all the stages of a country's production) in the manufacturing of exported goods. The use of II-O tables presents some constraints and limitations which need to be considered when compiling the data or interpreting the results obtained. A strong assumption when dealing with II-O tables is that of the homogeneity of firms working for the domestic or the export sector. In other words, the intensity in the use of imported inputs is assumed to be the same between production for exports or for domestic consumption. While such a hypothesis may be suitable for a majority of developed economies, this is not a valid one for economies with pervasive processing trade. Indeed, the value added content of processing exports is likely to be lower than that of similar goods produced for the domestic market -- see for example the estimate later on including a preliminary adjustment for China's processing trade. Additionally, the construction of national I-O tables and their inter-country version is highly resource-demanding and involves multiple methodological and compilation issues. For instance, linking product-based trade data (HS, SITC) and activity-based industrial classifications (ISIC), or setting up conversion procedures for price valuation (e.g. from FOB to producers' price or from CIF to customs' price...) involve complex data processing. Also II-O tables' compilers, whose goal is to integrate trade data and domestic production structures, have to face numerous issues related to international trade statistics (e.g. non-matching mirror statistics, unallocated (confidential) trade, treatment of re-exports...). As a result of this, they can opt for assumptions or estimations techniques which may distort the original information. Another consequence of the tremendous effort required to compile national I-O tables and to reconcile them within a common framework, is that the publication of II-O tables is seriously delayed. Practically, II-O tables are usually compiled for benchmark years, having year N table released year N+5... Thus, given the changes in production and trade structures, II-O data may not always be appropriate for the analysis of current trade flows in value-added. However, to overcome this weakness, procedures were developed to estimate II-O tables or related multipliers between benchmark years.49 Finally, II-Os are only available at a relatively aggregated sectoral level (76 sectors maximum for the Asian input-output (AIO) tables from IDE-JETRO) and thus are not suited for research on trade in value added at product level. Moreover heterogeneity is too important. As mentioned by a US-NRC report "Even with the most finely disaggregated import and export data, there are large differences in unit values of exports and imports across countries, suggesting quality differences that cannot be eliminated by disaggregation".50
The above remarks confirm that the evaluation of trade in value added through II-Os is indirect. Therefore it is important to underline that obtained figures are estimates rather than actual measures. While looking at the various studies and economic literature on the estimation of trade in value added, one can briefly observe that results obtained vary widely depending on the database used or the methodology applied and related assumptions or adjustments. A review of the studies on the domestic value added of Chinese exports from the US Congressional Budget Office51 illustrates this remark. Indeed, the report highlights that the value added share in Chinese exports can vary roughly from 65 per cent to 95 per cent depending on the studies carried out on standard I-O data (assuming homogeneity of final production for domestic market and for export). Whereas studies that attempt to
49 The "RAS" method is commonly applied to update the technical coefficients in input-output analysis. This procedure has been recently used and further developed by the Bank of Japan (Mori, T., Saski, H., 2007), the ECB (Pula, G., Peltonen, T., 2009) or IDE-JETRO. 50 National Research Council (2006) 51 See http://www.cbo.gov/ftpdocs/95xx/doc9506/AppendixA.pdf

Page 18
distinguish firms whose output is bound for domestic consumption or for export estimate the domestic value added share in Chinese exports at 35 per cent to 55 per cent. Data used by the authors stem from IDE-JETRO AIO tables and provisional estimates which cover nine Asian economies (China, Indonesia, Japan, Malaysia, Philippines, Singapore, South Korea, Taipei Chinese and Thailand) as well as the United States. The current methodology (see Appendix for a detailed description) focuses on the estimation of the import content of exports, or vertical specialization, by economy and sector. It corresponds to the measure of the share of imported inputs used directly and indirectly (through the use of the Leontief inverse matrix) to produce exports, including not only the value of inputs imported but also the foreign content of inputs domestically purchased. The schematic presentation of the formula retained to compute the vector of sectoral import contents is the following: Import content of exports = M * (I-A)-1 * X M is the import coefficients vector, I is the identity matrix, A is the matrix of technical coefficients and X is the vector of exports. (I-A)-1 represents the Leontief inverse matrix which captures the intermediate inputs used at any stage of the production process. Once the vertical specialization is compiled, the domestic (value added) content of sectoral exports is derived from: Domestic content = Total exports – Import content of exports Domestic content = [ I – M * (I-A)-1 ] * X Averaging over all sectors, the average domestic content of total exports is: Average domestic content = u * [ I – M * (I-A)-1 ] * X / [u*X] Where u is the summation unit vector. The table below presents the 2000 and 2008 estimates of the average import content and the domestic content of exports for the ten AIO countries. The results obtained for 2000 are comparable to OECD estimates52 or figures obtained through the application of the Hummels' formula53 to AIO 2000 data.
52 Araujo, S., 2009 53 See Hummels, D., Ishii, J., Yi, K-M. (2001)

Page 19
Table 3: Import content and domestic content of total exports, 2000 and 200854 (Percentage)
China Indonesia Japan Korea Malaysia2000 2008 2000 2008 2000 2008 2000 2008 2000 2008
Import content of exports 19.0 19.7 15.9 13.5 11.3 16.9 32.3 37.4 49.2 41.0
Domestic content of exports 81.0 80.3 84.1 86.5 88.7 83.1 67.7 62.6 50.8 59.0
Philippines Singapore Taipei, Chinese Thailand USA2000 2008 2000 2008 2000 2008 2000 2008 2000 2008
Import content of exports 34.8 17.5 53.2 57.9 38.4 46.7 36.6 35.0 11.6 15.2
Domestic content of exports 65.2 82.5 46.8 42.1 61.6 53.3 63.4 65.0 88.4 84.8 Source: WTO estimates based on IDE-JETRO AIO tables The developed economies of Japan and the US present comparable shares of imported inputs in exports for 2008 (16.9 per cent and 15.2 per cent). Those shares increased significantly between 2000 and 2008, most probably due to the expansion of off-shoring and intra-firm activities of Japanese and US multinational companies. The derived domestic value added content of these economies' exports is inversely high, respectively 83.1 per cent and 84.8 per cent in 2008, reflecting the high content of national inputs and services embedded in their manufacturing exports as well as the increasing weight of commercial services exports. Surprisingly, the vertical specialization observed in 2008 for Indonesia (13.5 per cent) is lower than that of Japan and the US. The reason for this low figure lies with Indonesia's export structure which is mainly composed of primary products that do not require intensive use of foreign inputs (agricultural and oil exports of Indonesia amounted to 61 per cent of total exports in 2008). Conversely, the exports of goods and services originating from Singapore, Taipei Chinese and Malaysia are the most intensive in imported content amongst the AIO countries (respectively 57.9 per cent, 46.7 per cent and 41 per cent in 2008), thus leading to a low magnitude of their trade in value added. The estimates for China's import content of exports turn out to be low (around 20 per cent). As previously mentioned, this is because standard II-Os do not apply specific treatment for processing zones trade. For some economies, such as China, the share of exports from processing zones in total exports is high (see Table 1), and the prior measure of import content of exports is obviously underestimated as China's export processing zones employ much more imported inputs than exports stemming from non-processing zone trade. Assuming that all products imported in China's processing zones are embedded in the exports of these zones, the import content of exports from Chinese processing zones can be estimated at 56 per cent in 2008 (see Table 4 below). The revised estimate for China's vertical specialization can then be calculated through a weighted average combining the two types of trade. It amounts to 37 per cent instead of 19.7 per cent with standard AIO data. This rough estimate confirms that any adjustment for export processing zone trade may have a significant impact.55
54 2000 data for Indonesia and Philippines exclude the "Construction" and the "Electricity, gas and water" sectors. Japan figures exclude the "Construction" sector. 2008 AIO estimates exclude the "Construction" sector. The "Electricity, gas and water" sector is only partially covered. 55 Koopman et al. (2008), by decomposing Chinese trade into processed and non-processed trade, estimates that the import content of Chinese exports is about 50 per cent.
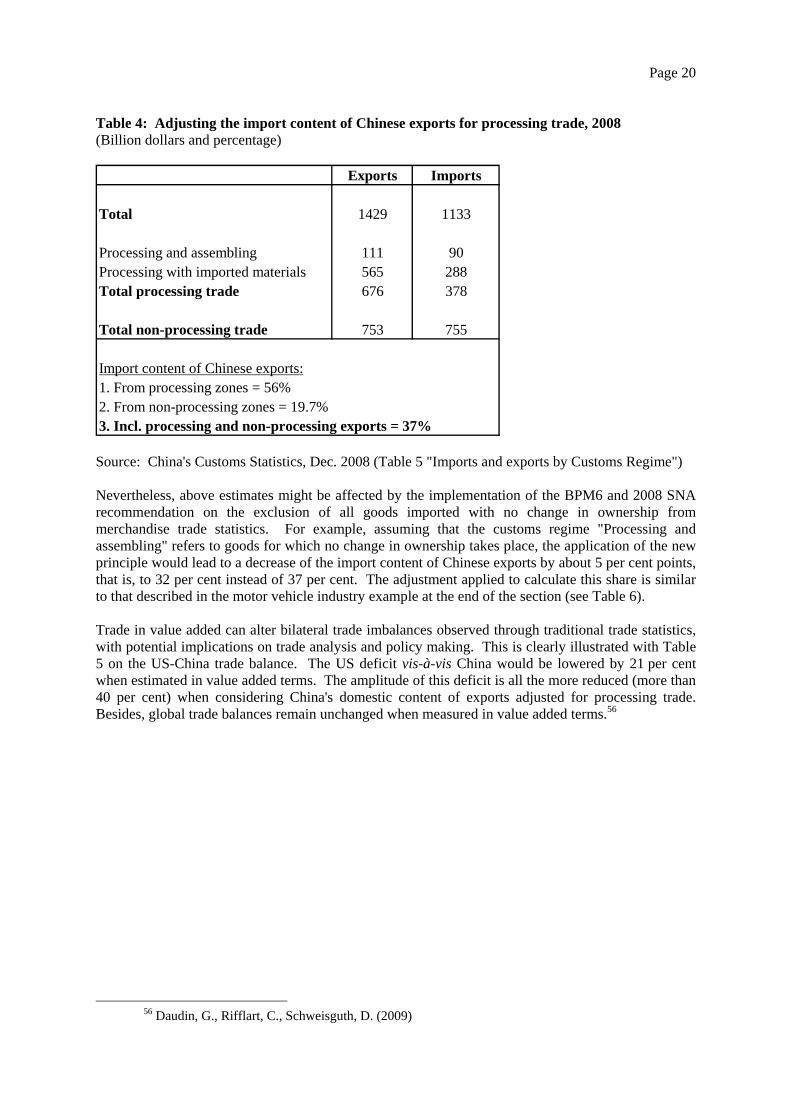
Page 20
Table 4: Adjusting the import content of Chinese exports for processing trade, 2008 (Billion dollars and percentage)
Exports Imports
Total 1429 1133
Processing and assembling 111 90Processing with imported materials 565 288Total processing trade 676 378
Total non-processing trade 753 755
Import content of Chinese exports:1. From processing zones = 56%2. From non-processing zones = 19.7%3. Incl. processing and non-processing exports = 37% Source: China's Customs Statistics, Dec. 2008 (Table 5 "Imports and exports by Customs Regime") Nevertheless, above estimates might be affected by the implementation of the BPM6 and 2008 SNA recommendation on the exclusion of all goods imported with no change in ownership from merchandise trade statistics. For example, assuming that the customs regime "Processing and assembling" refers to goods for which no change in ownership takes place, the application of the new principle would lead to a decrease of the import content of Chinese exports by about 5 per cent points, that is, to 32 per cent instead of 37 per cent. The adjustment applied to calculate this share is similar to that described in the motor vehicle industry example at the end of the section (see Table 6). Trade in value added can alter bilateral trade imbalances observed through traditional trade statistics, with potential implications on trade analysis and policy making. This is clearly illustrated with Table 5 on the US-China trade balance. The US deficit vis-à-vis China would be lowered by 21 per cent when estimated in value added terms. The amplitude of this deficit is all the more reduced (more than 40 per cent) when considering China's domestic content of exports adjusted for processing trade. Besides, global trade balances remain unchanged when measured in value added terms.56
56 Daudin, G., Rifflart, C., Schweisguth, D. (2009)

Page 21
Table 5: US-China trade balance, 2008 - Comparison between traditional and value added measurement, incl. adjustment for processing trade (Billion dollars and percentage)
No adjustment for China processing trade
Adjusted for China processing trade
2008 * 2008 *
USA exports to China (traditional statistics) 71 71USA's share of domestic content in exports (%) 84 84USA exports to China (in value added terms) 60 60
USA imports from China (traditional statistics) 356 356China's share of domestic content in exports (%) 80 63USA imports from China (in value added terms) 285 224
Trade balance (traditional statistics ) -285 -285Trade balance (in value added terms) -225 -165Ratio trade balance (value added / traditional) (%) 79 58
* Excluding the "Construction" sector. Source: WTO estimates These estimates are based upon standard II-O tables. However, as described below, the strict implementation of the criteria of change of ownership, which is contemplated in the new 2008 SNA for the compilation of input-output tables, could lead to a bias in the compilation of trade in value added multipliers. Recent studies indicate that intermediate inputs occur in particular in high technology sectors such as transport equipment or electronics..."the automobile industry is one of many that transcend national boundaries and is only one example...".57 When aligning the treatment of goods for processing with the "change of ownership" principle in 2008 SNA, the fear is that information for the construction of input output tables is lost. For example, Hummels et al. (2001) defines vertical specialization (VS) indices for country k and industry i as: VSki = (imported intermediateski / gross outputki) * exportski Ideally, VS would be calculated for individual products. As these data do not readily exist, input-output tables are used as these provide industry level data on imported inputs, gross output, and exports. The example of a motor vehicle industry producing two types of cars, one for domestic use and one for exports, may illustrate a possible impact of the change of the statistical treatment of goods for processing for which no change of ownership takes place. In this case, an international supply chain uses a US affiliate installed in Mexico to produce a car which is sold domestically but also exported to the US. The cars' electronic parts are imported from the US parent company (ownership of these parts
57 Ikensen, D. (2009)

Page 22
is not transferred from the US parent to the US affiliate in Mexico). The exported car contains a 50 per cent higher share of electronic equipment than the car produced for domestic consumption. The table below recaps the different values of the car depending on its destination (domestic market or export) and its recording ("average car") in the respective national accounts frameworks of 1993 and 2008. Table 6: Simulation of the new treatment of goods for processing – 1993 and 2008 SNA comparison
1993 SNA 2008 SNA
Domestic car Exported car Average car Domestic car Exported car Average car
Output (in dollars) 10000 12000 11000 10000 9000 9500
of which:Domestic inputs 2000 2000 2000 2000 2000 2000Imported inputs 2000 3000 2500 2000 0 * 1000Value added 6000 7000 6500 6000 7000 6500
* No change in ownership Source: WTO At aggregate level ("average car"), the 1993 SNA would show imported inputs at 2500, while the 2008 SNA would only show imported inputs at 1000. The new treatment of goods for processing would abandon the registration of the 3000 imported inputs for the exported car as in 1993 SNA, however, input-output tables would have to include a processor's export of a service (processing fee) (provided national authorities are able to record these flows). It is here where there is a doubt as to which countries can implement the 2008 SNA goods for processing treatment across all involved statistical frameworks. Thus, although attempting to increase transparency of economic relationships of an economy with the rest of the world, it may actually impede the calculation of the domestic value added content of exports.58 The 2008 SNA therefore suggests in its para. 28.20 that for reasons of continuity with past practices the 1993 SNA treatment could be presented as a supplementary item. F. Conclusion In the past decades, increased vertical integration of multinational enterprises and the expansion of processing zones, mostly in developing economies, led to significant changes in trade patterns. One of the most noticeable features of this evolution is the increasing trade in intermediate goods in the manufacturing sector. Intermediate inputs are intensively exchanged within international production chains and imported in processing zones for the production of goods to be exported. The boundary between goods and services is not always apparent, the magnitude of trade flows therefore at times misleading. In short, current trade recording systems struggle with the adequate reporting of globalisation phenomena in respect to goods for processing, merchanting, intra-firm trade, valuation (transfer pricing) which may introduce some bias in these aggregates. Revisions of international statistical standards were approved for correcting some of these aspects and to account for new driving forces observed in international exchanges. But the application of new
58 Escaith, H. (2010)

Page 23
recommendations such as on goods for processing will raise challenges regarding trade data collection and compilation (e.g. processing fees). Therefore, it is important for international organizations to setup compilation guidance to ensure a proper application of new BPM6 and IMTS 2010 recommendations at national level. In addition to changing statistical concepts, the notion of trade in value added receives an increasing attention as it raises the question of who produces for whom? Analysing trade according to value added may resize trade imbalances and thus impact on trade policy strategies as indicated recently in a speech of WTO's Deputy Director General A. Jara..."the design of national policies needs also to be adapted. Old “mercantilist” policies, based on the vision that trade is a competition between “us” and “them”, becomes not only sub-optimal...but also a complete anachronism".59 Estimating trade in value added provides complementary tools for the analysis of production and trade linkages. However, each of the three methods to estimate value added trade flows, as described in Section E, has its own advantages and limitations. While firm surveys provide a single-case evaluation, their availability and scope is still limited. Trade flows of intermediates goods provide a rough estimate without linking up trade and production. II-O tables are most widely used to link trade and production for deriving estimates on the import content of exports. However, these contain a number of technical restrictions and are based on assumptions which impact on the estimate of the share of imported inputs that are used for the production of exports. The improvement of II-O data quality is therefore important but constitutes a time-consuming task.60
59 DDG Jara urges another way of looking at trade statistics, see http://www.wto.org/english/news_e/news10_e/devel_26may10_e.htm 60Currently, a consortium of research institutes, funded by the European Commission in its 7th Framework Programme, is developing a world input output database (WIOD). It aims at constructing an internationally harmonized database that integrates detailed data on national production structures, international trade, socio-economic issues, and environmental pressures. This database will be used for empirical analysis, scenario studies and simulation of a wide range of policy measures (from WIOD Conference: Industry-Level Analyses of Globalization and its Consequences, Vienna, May 26-28, 2010).

Page 24
Bibliography AKRAM, T., KHAN, H.A., HOLLADAY, J.S. (2007), "US Intra-firm International Trade", Working paper, SSRN ARAUJO, S. (2009), "Vertical specialization and global value chains", OECD, OECD/STD/SES/WPTGS(2009)16 ARMSTRONG, PH. (2009), "Policy Applications of Linked Trade Data – the Canadian Experience Using the Exporter/Importer register Databases", OECD STD/SES/WPTGS (2009) 17, p. 3 and p. 4 ATHUKORALA, P. C., YAMASHITA, N. (2006), "Production fragmentation and Trade Integration: East Asia in a Global Context", North American Journal of Economics and Finance, 173, pp. 233-56 BALANCE OF PAYMENTS, 6th edition (BPM6), see http://www.imf.org/external/pubs/ft/bop/2007/bopman6.htm BRUNO, G., ESPOSITO, G., IANDOLI, L., RAFFA, M. (2004), "The ICT service industry in North Africa and role of partnerships in Morocco", Journal of Global Information Technology Management, vol. 7, no. 3, pp.5–26 CAVE, W. (2008), "Summary of cross-cutting issues", OECD, OECD/STD/SES/WPTGS(2008)20 CENSUS AND STATISTICS DEPARTMENT HONG KONG SAR (2008), "Implementing the new statistical standardsfor goods for processing and merchanting in Hong Kong, China", IMF BOPCOM 08/12 CORCORAN, T. (2010), "The iPad lesson for China trade", in: Financial Post, Tuesday, April 6, 2010 DAUDIN, G., RIFFLART, C., SCHWEISGUTH, D. (2009), "Who produces for whom in the world economy?", OFCE, No. 2009-18 DEAN, J., FUNG, K.C., WANG, Z. (2007), "Measuring the vertical specialization in Chinese trade", US International Trade Commission DESAI, M.A. (2009), "The decentring of the global firm", Working Paper, 09-054, Harvard Business School ENGMAN, M. (2007), "Expanding International Supply Chains: The Role of Emerging Economies In Providing IT and Business Process Services", OECD Work Paper No. 52 ESCAITH, H. (2008), "Measuring trade in value added in the new industrial economy: statistical implications," Actes du 12ème colloque de l'Association française de Comptabilité nationale, INSEE Méthodes N°122 and MPRA Paper 14454, Munich ESCAITH, H. "Communication to the Working Group on the Impact of Globalisation on National Accounts" (unpublished, January 2010) ESCAITH, H., LINDENBERG, N., MIROUDOT, S. (2010), "International Supply Chains and Trade Elasticity in Times of Global Crisis", WTO Working Paper ERSD-2010-08, February FREUND, C. (2009), "The Trade Response to Global Downturns: Historical Evidence"

Page 25
GEREFFI, G., FERNANDEZ-STARK, K. (2010), "The Offshore Services Global Value Chain" CORFO and the Center on Globalization, Governance & Competitiveness, Duke University. GIRARD, M. (2008), "The treatment of goods sent abroad for processing in the context of the input-output framework: work in progress", Statistics Canada, IMF BOPCOM 08/13 GROSSMANN, G.M., ROSSI-HANSBERG, E. (2006), "The Rise of Offshoring: It's Not Wine for Cloth Anymore, Princeton University HUMMELS, D., ISHII, J., YI, K-M. (2001), "The nature and growth of vertical specialization in world trade " IKENSEN, D. (2009), "Made on Earth – How Global Economic Integration Renders Trade Policy Obsolete", December 2009, No. 42, CATO Institute IDE-JETRO (2006) "How to make the Asian input-output Tables", Institute of Developing Economies, March IMF STATISTICS DEPARTMENT (2008), "Impact on BOP data of changes in international standards for processing and merchanting", BOPCOM 08/11 INTERNATIONAL MERCHANDISE TRADE STATISTICS: Concepts and Definitions 2010 (IMTS 2010), see http://unstats.un.org/unsd/statcom/doc10/BG-IMTS2010.pdf ISAKSON, H. (2007), "Adding value to the European economy", Swedish National Board of Trade JANSEN, R. (2008), "Goods for processing and the world-wide consultation for IMTS, revision 3", UNSD, OECD/STD/SES/WPTGS(2008)18 JOHNSON, R. C., NOGUERA, G. (2009), "Accounting for intermediate production sharing and trade in value added" KOOPMAN, R., WANG, Z. WEI, S.J. (2008), "How much of Chinese exports is really made in China? Assessing domestic value added when processing trade is pervasive" KRUGMAN, P., OBSTFELD, M. (2005), "International Economics: Theory and Policy", 7th edition, p. 20 LAMY, P. (2010), "Facts and Fictions in International Trade Economics", Conference of Trade and Inclusive Globalization, Paris School of Economics LEONTIEF, W. (1951), "Input-Output Economics", Scientific American LIMAO, N., VENABLES, A.J. (1999), "Infrastructure, geographical disadvantage and transport costs", World Bank Policy Research Working Paper No 2257 LINDEN, G., KRAEMER, L., DEDRICK, J. (2007), "Who captures value in a global innovation system? The case of Apple's iPod"
MA, A.C., VAN ASSCHE, A., HONG, C. (2008), "Global Production networks and China's Processing Trade", Journal of Asian Economics MILBERG, W. (2007), "Export Processing Zones, Industrial Upgrading and Economic Development: A Survey", New School for Social Research

Page 26
MIROUDOT, S., LANZ, R., RAGOUSSIS, A. (2009), "Trade in intermediate goods and services", OECD, TAD/TC/WP(2009)1 MORI, T., SASAKI, H. (2007), "Interdependence of production and income in Asia-Pacific economies: an international input-output approach", Bank of Japan Working Paper Series
NASSCOM (2009), "The IT-BPO Sector in India" Strategic Review NATIONAL RESEARCH COUNCIL (2006), "Analyzing the US Content of Imports and the Foreign Content of Exports", The National Academies Press, Washington DC NORDAS, H. K. (2005), " International Production Sharing: a case for a coherent policy framework", WTO Discussion Papers No.11 OU-YANG, L. (2008), "The changed treatment of goods for processing and merchanting in the revised system of national accounts (2008 SNA) and BPM6", Census and Statistics Department, Hong Kong SAR, OECD/STD/SES/WPTGS (2008)19 PULA, G., PELTONEN, T. (2009), "Has emerging Asia decoupled? An analysis of production and trade linkages using the Asian international input-output table", ECB SYSTEM OF NATIONAL ACCOUNTS (2008 SNA), see http://unstats.un.org/unsd/sna1993/snarev1.asp WILLCOCKS, L., GRIFFITHS, C., KOTLARSKY, J. (2009), "Beyond BRIC: Offshoring in non-BRIC countries: Egypt – a new growth market", LSE Outsourcing Unit report
WISTROM, B. (2010), "Trade by Product and Industry: An estimated example with actual data", OECD (inter-agency Task Forces on Statistics of International Trade in Services and International Merchandise Trade Statistics) YI, K.M. (2003), "Can Vertical Specialization Explain the Growth of World Trade?", Journal of Political Economy, 111(1), 52–102

Page 27
ANNEXES Annex 1 Preliminary WTO process for estimating the import content and the domestic content of exports. Data source: IDE-JETRO Asian input-output (AIO) table. Calculation step Fomula Unit Definition/Meaning 1. Total exports by country/sector
Total exports (X) = exports to AIO partner countries + exports to the rest of the world (ROW) Derived from the AIO table
values in thousands $ Total exports in goods and services by reporting country/sector
2. Leontief inverse (I-A)-1 I is the identity matrix A corresponds to the whole intermediate demand matrix from the AIO table
coefficient Each coefficient from the Leontief inverse matrix measures the production of direct/indirect/induced inputs in goods and services needed in supply country to produce one unit of output in the demand country
3. Multiplication of the Leontief inverse matrix by the exports vector
(I-A)-1 * X values in thousands $ Amount of inputs (domestic and imported) required from each country/sector to produce the exported goods and services
4. Imports coefficients from ROW and AIO partners, by country/sector
MROW+AIO Sum of total imports from ROW and AIO partners divided by output Sourced from the AIO table
coefficient Share of goods and services imported from ROW and AIO partners in total output Imports include "Freight and insurance" as well as "Duties and import commodity taxes"
5. Total import content of exports by country/sector
MROW+AIO * (I-A)-1 * X
values in thousands $ Amount of imported inputs required from ROW and AIO partners to produce the exported goods and services
6. Domestic content of exports by country/sector
reported exports (see 1.) - imported content of exports (see 5.)
values in thousands $ Amount of domestic goods and services required to produce the exported goods and services
7. Shares of import content and domestic value added content in total exports by country/sector
Ratio of "Import content" (see 5.) or "Domestic value added content" (see 6.) on reported total exports (see 1.)
coefficient

Page 28
Annex 2 The IDE-JETRO Asian input-output (AIO) table