Embed Size (px)
Citation preview

Stacked Benefits:
Comprehensively Valuing Battery Storage in California
PREPARED FOR
Eos Energy Storage
PREPARED BY
Ryan Hledik
Roger Lueken
Colin McIntyre
Heidi Bishop
September 2017

This report was prepared for Eos Energy Storage through funding from the California Energy
Commission. All results and any errors are the responsibility of the authors and do not represent
the opinion of The Brattle Group or its clients.
The authors would like to thank Chip Russell of Eos Energy Storage for valuable intellectual
contributions and project leadership throughout the development of this study. We are also
grateful to Brattle colleagues Peter Fox-Penner and Ahmad Faruqui for their early contributions
to the project scope, and to Bruce Tsuchida, Judy Chang, Hannes Pfeifenberger, Sam Newell, and
Frank Graves for peer review.
Please direct any questions or comments to Ryan Hledik: [email protected].
Copyright © 2017 The Brattle Group, Inc.

| brattle.com
Table of Contents Executive Summary ............................................................................................................................... i
I. Introduction ................................................................................................................................. 1
Distinguishing Features of the Study ......................................................................................... 1
Scope of the Study ....................................................................................................................... 2
Organization of the Report ......................................................................................................... 4
II. Methodology ................................................................................................................................ 5
Sources of Value .......................................................................................................................... 5
Analytical Framework ................................................................................................................ 6
Establishing Marginal Costs ........................................................................................................ 9
III. Key Findings .............................................................................................................................. 17
Base Case .................................................................................................................................... 17
Sensitivity Cases ........................................................................................................................ 20
Comparison to Other Studies .................................................................................................... 24
Summary .................................................................................................................................... 25
IV. Policy Considerations ................................................................................................................ 27
Barriers ....................................................................................................................................... 27
Addressing Barriers at the Retail Level .................................................................................... 29
The State of Rate Design for Storage in California .................................................................. 30
Two New Rate Designs for Capturing Storage Value .............................................................. 31
Conclusion ................................................................................................................................. 34
References ........................................................................................................................................... 35
i | brattle.com
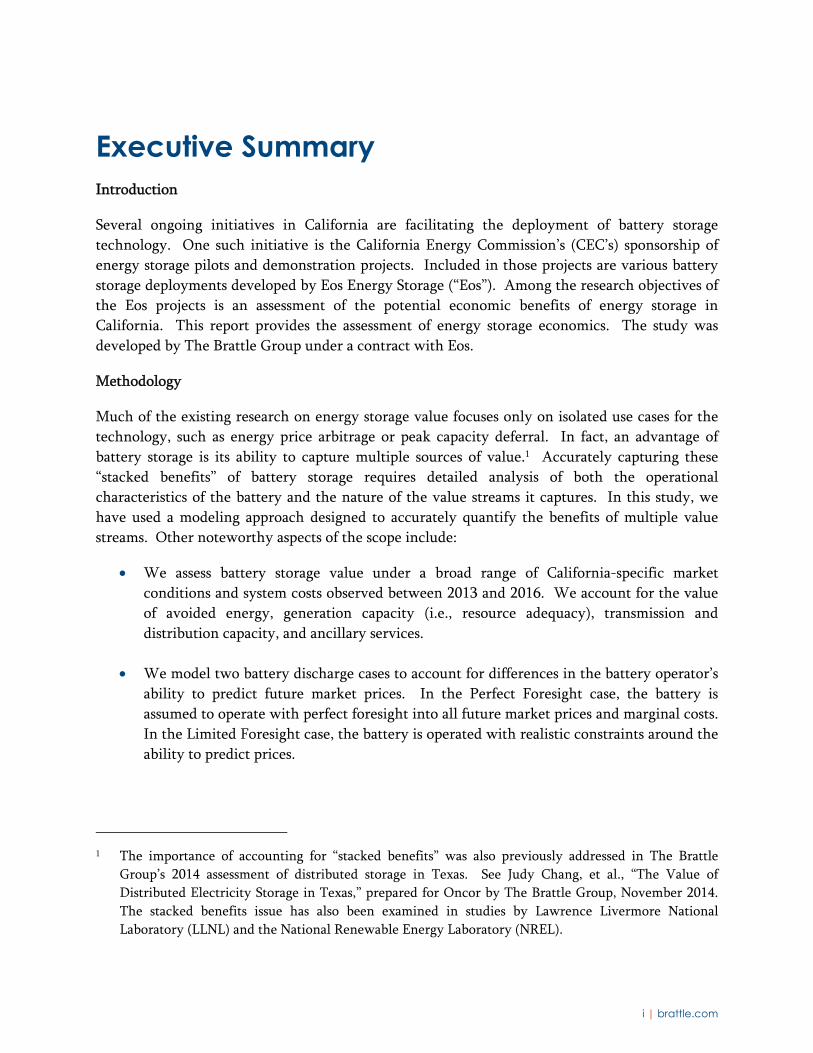
Executive Summary Introduction
Several ongoing initiatives in California are facilitating the deployment of battery storage
technology. One such initiative is the California Energy Commission’s (CEC’s) sponsorship of
energy storage pilots and demonstration projects. Included in those projects are various battery
storage deployments developed by Eos Energy Storage (“Eos”). Among the research objectives of
the Eos projects is an assessment of the potential economic benefits of energy storage in
California. This report provides the assessment of energy storage economics. The study was
developed by The Brattle Group under a contract with Eos.
Methodology
Much of the existing research on energy storage value focuses only on isolated use cases for the
technology, such as energy price arbitrage or peak capacity deferral. In fact, an advantage of
battery storage is its ability to capture multiple sources of value.1 Accurately capturing these
“stacked benefits” of battery storage requires detailed analysis of both the operational
characteristics of the battery and the nature of the value streams it captures. In this study, we
have used a modeling approach designed to accurately quantify the benefits of multiple value
streams. Other noteworthy aspects of the scope include:
We assess battery storage value under a broad range of California-specific market
conditions and system costs observed between 2013 and 2016. We account for the value
of avoided energy, generation capacity (i.e., resource adequacy), transmission and
distribution capacity, and ancillary services.
We model two battery discharge cases to account for differences in the battery operator’s
ability to predict future market prices. In the Perfect Foresight case, the battery is
assumed to operate with perfect foresight into all future market prices and marginal costs.
In the Limited Foresight case, the battery is operated with realistic constraints around the
ability to predict prices.
1 The importance of accounting for “stacked benefits” was also previously addressed in The Brattle
Group’s 2014 assessment of distributed storage in Texas. See Judy Chang, et al., “The Value of
Distributed Electricity Storage in Texas,” prepared for Oncor by The Brattle Group, November 2014.
The stacked benefits issue has also been examined in studies by Lawrence Livermore National
Laboratory (LLNL) and the National Renewable Energy Laboratory (NREL).

ii | brattle.com
We analyze the incremental value of a single battery storage project on the California
power system. We have not analyzed the impact that the addition of large quantities of
storage could have on market prices.
The scope of our analysis is focused exclusively on quantifying avoided system costs (i.e.,
we quantify the system-wide benefits of deploying batteries). We do not specifically
quantify the value that could be captured at the retail level by individual customers with
distributed storage.
Key Findings
Our analysis suggests that, in many cases, the “stacked” benefits of battery storage compare
favorably to recent estimates of new battery costs. This finding is sensitive to the marginal cost
of generation capacity but is otherwise robust across the sensitivity cases we analyzed. The
quantified benefits appear to be in line with those of other studies. Important observations from
our assessment of the value of battery storage in California include:
Under our Base Case assumptions, with limited market foresight, the total value of
“stacked benefits” in California for one kilowatt / four kilowatt-hours of battery storage
could be around $280/kW-year. By comparison, recent estimates of battery costs have
been in the range of $200 to $500/kW-year (though they vary significantly by technology
type and configuration).
Accounting for the “stacked” benefits of battery storage by optimizing its dispatch across
all analyzed value streams significantly increases the total value of the battery relative to
any individual value stream (by a factor of at least 2x to 3x over individual uses cases).
Avoided generation capacity, frequency regulation, and energy price arbitrage are the
largest sources of quantified value. However, the “depth” of each market should be taken
into consideration when valuing large quantities of energy storage. Frequency regulation
in particular is a highly valuable service with a very limited system need. At the same
time, the need for frequency regulation is likely to increase with greater renewable
resource deployment. This consideration is particularly relevant in the California market,
as the state progresses toward its 50% renewable energy target.
Sensitivity cases suggest that uncertainty about the capacity value of storage could
significantly impact estimates of total value. In the short run, excess supply means that
the capacity value of energy storage in California will be modest unless there are local
needs for resource adequacy. In the longer term, as planning reserve margins tighten,
system-wide capacity value could approach the levels quantified in this study. Aside
from sensitivity to generation capacity cost assumptions, the Base Case results are fairly

iii | brattle.com
robust across a range of assumptions about T&D capacity costs, location, and historical
study year.
A summary of the Base Case estimate of battery value is provided in Figure ES-1.
Figure ES-1: Battery Value for Individual Use Cases and with “Stacked” Benefits
Figure notes: Results shown for San Diego. Value in other California locations is assessed through sensitivity analysis.
Energy and ancillary services value is an average across market conditions between 2013 and 2016.
Addressing Barriers
California is considered to be a leader in its efforts to facilitate the adoption of energy storage.
Noteworthy energy storage initiatives in California include:
An aggressive storage procurement mandate for the investor-owned utilities (IOUs);
The Self Generation Incentive Program (SGIP), which provides incentive payments to
behind-the-meter storage;
Enhancements to CAISO’s energy and A/S markets to support storage participation;
CAISO’s implementation of new wholesale market products that are amenable to storage,
such as the flexible ramping product;
CAISO’s Energy Storage and Distributed Energy Storage (ESDER) stakeholder group,
which works to enhance the market participation of grid-connected storage;
CPUC proceedings to quantify the locational value of distributed energy resources; and
The CPUC requirement that load serving entities contract for sufficient flexible capacity,
which storage is eligible to provide.
iv | brattle.com
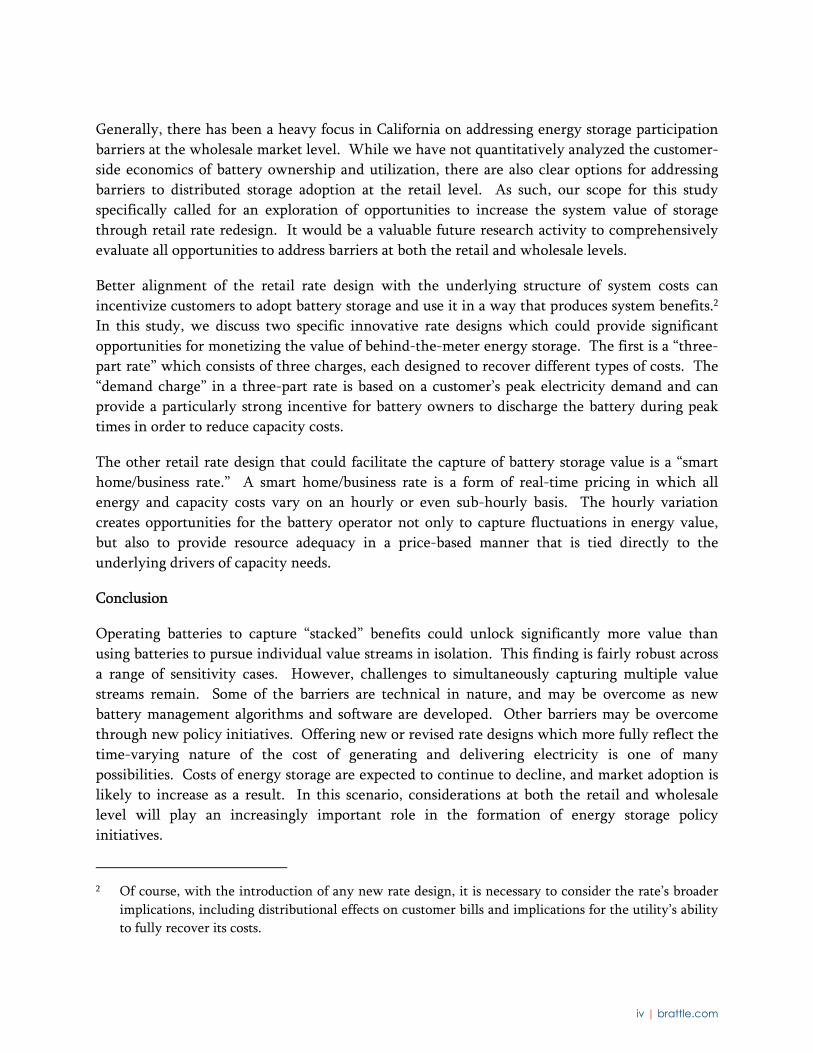
Generally, there has been a heavy focus in California on addressing energy storage participation
barriers at the wholesale market level. While we have not quantitatively analyzed the customer-
side economics of battery ownership and utilization, there are also clear options for addressing
barriers to distributed storage adoption at the retail level. As such, our scope for this study
specifically called for an exploration of opportunities to increase the system value of storage
through retail rate redesign. It would be a valuable future research activity to comprehensively
evaluate all opportunities to address barriers at both the retail and wholesale levels.
Better alignment of the retail rate design with the underlying structure of system costs can
incentivize customers to adopt battery storage and use it in a way that produces system benefits.2
In this study, we discuss two specific innovative rate designs which could provide significant
opportunities for monetizing the value of behind-the-meter energy storage. The first is a “three-
part rate” which consists of three charges, each designed to recover different types of costs. The
“demand charge” in a three-part rate is based on a customer’s peak electricity demand and can
provide a particularly strong incentive for battery owners to discharge the battery during peak
times in order to reduce capacity costs.
The other retail rate design that could facilitate the capture of battery storage value is a “smart
home/business rate.” A smart home/business rate is a form of real-time pricing in which all
energy and capacity costs vary on an hourly or even sub-hourly basis. The hourly variation
creates opportunities for the battery operator not only to capture fluctuations in energy value,
but also to provide resource adequacy in a price-based manner that is tied directly to the
underlying drivers of capacity needs.
Conclusion
Operating batteries to capture “stacked” benefits could unlock significantly more value than
using batteries to pursue individual value streams in isolation. This finding is fairly robust across
a range of sensitivity cases. However, challenges to simultaneously capturing multiple value
streams remain. Some of the barriers are technical in nature, and may be overcome as new
battery management algorithms and software are developed. Other barriers may be overcome
through new policy initiatives. Offering new or revised rate designs which more fully reflect the
time-varying nature of the cost of generating and delivering electricity is one of many
possibilities. Costs of energy storage are expected to continue to decline, and market adoption is
likely to increase as a result. In this scenario, considerations at both the retail and wholesale
level will play an increasingly important role in the formation of energy storage policy
initiatives.
2 Of course, with the introduction of any new rate design, it is necessary to consider the rate’s broader
implications, including distributional effects on customer bills and implications for the utility’s ability
to fully recover its costs.

1 | brattle.com
I. Introduction Emerging changes to the U.S. power system are creating unique opportunities for battery storage.
In particular, the growing adoption of wind and solar generation has introduced a greater
demand for flexible resources. At the same time, large capital investments will be needed to
replace aging power system infrastructure. Utilities, regulators, and other industry stakeholders
are exploring opportunities to defer or avoid these investments through deployment of energy
storage.
Battery storage has received considerable attention in California. Several open regulatory
proceedings at the California Public Utilities Commission (CPUC) are addressing issues related to
energy storage. These include a docket on the integration of distributed energy resources (R.14-
10-003), a docket on the state’s storage mandate (R.15-03-011), and a proceeding on rules and
policies related to distributed generation (R.12-11-005). Additionally, the California Independent
System Operator (CAISO) has introduced new market products designed to provide energy
storage with an opportunity to participate in the state’s wholesale electricity markets.
The California Energy Commission (CEC) is also actively facilitating the deployment of battery
storage technology.3 The CEC’s activities have primarily focused on energy storage research,
development, and deployment. An important aspect of this activity has been the sponsorship of
energy storage pilots and demonstration projects.
The CEC’s ongoing demonstration projects include three battery storage deployments by Eos
Energy Storage (“Eos”). One deployment is a 125 kW / 500 kWh battery in Northern California,
and the other deployments will be smaller installations at the University of California, San Diego
(UCSD) campus, ranging in size from 2 to 40 kW. The deployments will be operated to collect
data on a wide range of potential storage use cases. Among the research objectives of the Eos
projects is an assessment of the potential economic benefits of energy storage in California. The
purpose of this report is to provide that assessment of energy storage economics. The study was
developed by The Brattle Group under a subcontract with Eos.
DISTINGUISHING FEATURES OF THE STUDY
Given the high degree of industry interest in energy storage, it is not surprising that many studies
have been conducted to assess the value of the technology. Several of these studies have been
3 For instance, in collaboration with the CPUC and CAISO, the CEC introduced a roadmap for
advancing energy storage in California. “Advancing and Maximizing the Value of Energy Storage
Technology: A California Roadmap,” California ISO, December, 2014.
http://www.energy.ca.gov/research/energystorage/tour/roadmap/.

2 | brattle.com
specific to the California market. Notable studies on the value of energy storage in California
over the past several years were authored by Lawrence Livermore National Laboratory (LLNL),
the Electric Power Research Institute (EPRI), Rocky Mountain Institute (RMI), and the National
Renewable Energy Laboratory (NREL).4
The existing research on energy storage uses a broad range of modeling techniques to explore
different sources of battery storage value. However, the studies commonly focus only on isolated
use cases for the technology, such as energy price arbitrage or peak capacity deferral.5 In fact, an
advantage of battery storage is its ability to capture multiple sources of value.
Accurately capturing these “stacked benefits” of battery storage requires detailed analysis of both
the operational characteristics of the battery and the nature of the value streams it captures. In
this study, we have used a modeling approach designed to accurately quantify the benefits of
multiple value streams. Distinguishing features of our study include:
Our approach accounts for the simultaneous capture of multiple value streams rather
than analyzing individual use cases in isolation. An important feature of battery storage is
that it can be used to provide many different sources of value by changing its utilization
over short time horizons to pursue those services with the largest benefits.
We utilize sophisticated modeling software to accurately represent the dispatch of the
battery subject to pre-defined operational characteristics. The software allows for
dispatch optimization to capture difficult-to-quantify benefits such as the value that can
be created through price arbitrage between day-ahead and real-time energy markets.
We assess battery storage value under a broad range of California-specific market
conditions and system costs. The value of various services can differ significantly from
one year to the next and within different geographical locations in the state. We have
considered a broad range of possible market conditions.
Our study includes a discussion of retail-level regulatory reforms that could increase the
ability of storage to create and monetize wholesale market value.
SCOPE OF THE STUDY
We analyze the incremental value of a single battery storage project on the California power
system. We have not analyzed the impact that the addition of large quantities of storage could
4 See the bibliography for a complete list of the energy storage studies we reviewed.
5 Some studies, such as the Rocky Mountain Institute study, considered stacked benefits but across a
limited number of specific use cases.

3 | brattle.com
have on market prices. All else being equal, at higher levels of storage adoption we would expect
the energy market price profile to flatten to some degree, and the remaining supply of capacity
and ancillary services to begin to become saturated. As a result, the per-unit value of energy
storage would decrease as additional storage capacity is added to the system. This dynamic could
be explored in future research through power systems modeling.6
The scope of this study is focused exclusively on quantifying avoided system costs. We do not
specifically quantify the value that could be captured at the retail level by individual customers
with distributed storage. The value to end-use customers with battery storage could include, for
instance, reduced bills through the avoidance of demand charges or time-varying rates, and
enhanced reliability by using the battery as a form of backup power. These would also be
valuable areas to explore through further research.
To establish the system costs that could be avoided through battery storage dispatch, we use
recent historical market prices and costs, rather than projected prices. This approach ensures
that we are capturing realistic market conditions.
Further, we do not conduct a detailed cost-effectiveness assessment of batteries. Rather, the
study is intended to highlight the potential benefits of a given battery configuration – in other
words, the magnitude of the opportunity. Similarly, this is not a “potential assessment” and is
not intended to indicate the total quantity of energy storage that may be economic in the
California market. There would be considerable value to state policymakers and utilities in
conducting such a study.
We explore barriers to capturing the full system value of energy storage in California and explore
options for overcoming the barriers. Consistent with our scope of work for this study, we
exclusively consider how retail rate reform could help to address the barriers. While we do not
specifically quantify the customer benefits of behind-the-meter storage, it is still possible to
establish principles for promoting energy storage through retail rate design. It would be a
valuable future research activity to comprehensively evaluate opportunities to address barriers at
both the retail and wholesale levels.
6 This was the finding, for example, of Brattle’s recent assessment of battery storage value in Texas. See
Chang, Judy, et al., “The Value of Distributed Electricity Storage in Texas,” Prepared for Oncor by The
Brattle Group, November 2014. This dynamic has also been examined in the aforementioned studies
by Lawrence Livermore National Laboratory (LLNL) and the National Renewable Energy Laboratory
(NREL).

4 | brattle.com
ORGANIZATION OF THE REPORT
The remainder of this report is organized as follows: Section II describes the methodological
framework. Section III summarizes key findings. Section IV concludes the report with a brief
discussion of important policy considerations.

5 | brattle.com
II. Methodology SOURCES OF VALUE
The focus of this study is on quantifying the value that distributed battery storage creates by
reducing system costs.7 This approach is sometimes referred to as quantifying “system value” or
“societal value”. As such, we are quantifying benefits from the perspective of the total power
system, rather than from the specific perspective of the battery operator or an individual
customer.
The following are sources of system value quantified in this study:
Energy price arbitrage: The battery can be charged during low (or negative) priced hours
and discharged during higher priced hours to avoid dispatching generators with high fuel
and variable O&M costs.
Ancillary services: The battery provides regulation (rapidly charging and discharging to
in response to short-duration supply/demand imbalances) and spinning reserves
(protecting against large contingencies). The need for these services may grow as market
penetration of renewable generation grows.8
Generation capacity / resource adequacy: The battery contributes to system resource
adequacy by discharging during peak demand hours and scarcity events.
Transmission and distribution capacity: Storage can be located in key constrained
locations on the grid, reducing demand during times of capacity constraints and deferring
the need for transmission and distribution capacity upgrades.9
Reduced CO2 emissions: The societal cost of CO2 emissions is at least partially
incorporated into the energy price due to California’s “AB 32” climate policy. The extent
7 As is discussed throughout this report, the battery is modeled as a “price-taker,” meaning we do not
account for the impact that its dispatch could have on marginal costs. The impact is likely to be
negligible at small levels of market penetration, but will likely become significant as market adoption
of energy storage grows.
8 Battery storage can also enlarge the pool of resources that provide (or qualify to provide) ancillary
services. For instance, on-site batteries can be paired with generators to effectively reduce the
generator’s start time, allowing it to participate in quick-start ancillary services markets.
9 Further, storage can increase transfer capability by eliminating voltage constraints. That possible
benefit is not quantified in our analysis.

6 | brattle.com
to which there is an increase or decrease in CO2 emissions will depend on whether the
battery is being charged during hours with higher- or lower-than-average marginal
emissions. This value (or cost) is captured in our analysis of energy value.
Other potential sources of system value from battery storage are not quantified in the analysis.
The following sources of value were not quantified because they are difficult to accurately
quantify or are likely to be small relative to the quantified sources of value. The non-quantified
potential benefits of battery storage include:
Reduced transmission congestion
Extension of transmission and distribution equipment life
Additional ancillary services, such as ramping, voltage support, blackstart, and inertia
Flexible resource adequacy value10
Avoided startup costs of other generators on the system
Additionally, the following are possible retail-level benefits that would accrue to end-use owners
of distributed batteries. As such, these benefits were beyond the scope of our valuation
framework:11
Bill reductions for end-use customers (e.g., avoided demand charge, TOU rate)
Improved reliability for end-use customers (i.e., as backup generation)
Enhanced power quality
ANALYTICAL FRAMEWORK
Using a battery to pursue one value stream may require forgoing opportunities to pursue other
“competing” sources of value. For instance, on a peak load day it may be beneficial to store
energy in the battery in anticipation of high-value reliability events and, as a result, bypass
opportunities for energy price arbitrage. While the value streams quantified in this study can be
estimated individually, those estimates are not purely additive. A battery operator must choose
how much of the battery’s capacity to allocate to pursuing each opportunity. Accurately
estimating the comprehensive value of battery storage requires accounting for tradeoffs across
the value streams.
10 CAISO has introduced market products for flexible resources and for ramping. There was not enough
price data available for these products to accurately account for them in our analysis. Doing so would
be a valuable future research activity.
11 Note that these non-quantified sources of value would not necessarily be purely additive to the
quantified sources of value; in some instances, they may reflect the same benefit as it accrues to as
specific stakeholder (e.g., bill reductions through avoidance of demand charges would double-count
avoided capacity costs).

7 | brattle.com
Therefore, we “co-optimized” the battery’s dispatch across multiple value streams, such that it
maximizes overall system value. We used the Power System Optimizer (PSO) model to perform
this co-optimization. PSO is a commercially-licensed production cost market simulator which
allows for realistic representation of the battery’s operations. Our simulations account for
market rules, historical marginal prices, and operational parameters of the battery provided by
Eos.
To the extent feasible, our approach to valuing battery storage is consistent with established
methods for valuing distributed energy resources in California.12 First, capacity costs are
allocated to hours of the year proportional to the risk of capacity shortage in each hour. These
hourly capacity costs are combined with hourly energy market prices and ancillary services
prices to establish a “stacked” price series which reflects all avoidable costs. Then, operational
characteristics of the battery are defined to account for technical constraints and limitations on
the ability to capture multiple services simultaneously. The battery is dispatched against the
price series subject to these constraints to produce an estimate of the net avoided marginal costs.
This methodological framework is summarized in Figure 1.
Figure 1: Overview of the Methodological Framework
Charge/discharge algorithm
We model two battery discharge cases to account for differences in the battery operator’s ability
to predict future market prices. We refer to those two cases as the “Perfect Foresight” case and
the “Limited Foresight” case.
12 For example, see E3, “Time Dependent Valuation of Energy for Developing Building Efficiency
Standards,” Prepared for the California Energy Commission, July 2016.
8 | brattle.com
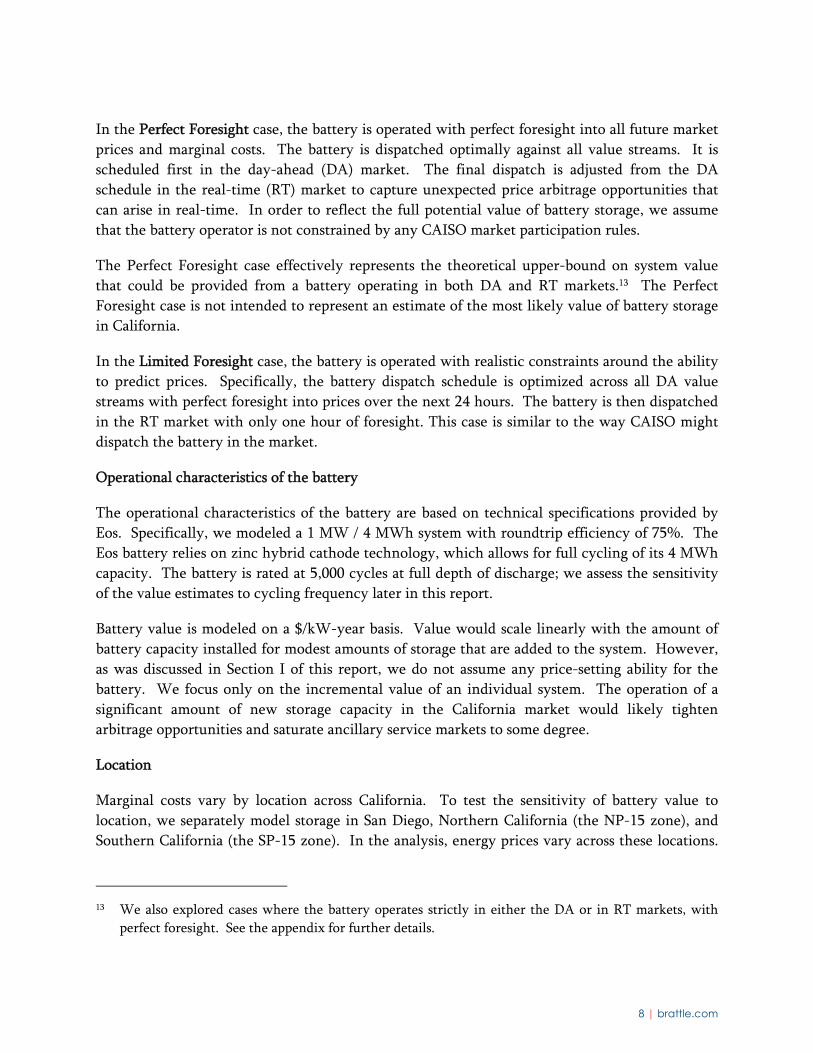
In the Perfect Foresight case, the battery is operated with perfect foresight into all future market
prices and marginal costs. The battery is dispatched optimally against all value streams. It is
scheduled first in the day-ahead (DA) market. The final dispatch is adjusted from the DA
schedule in the real-time (RT) market to capture unexpected price arbitrage opportunities that
can arise in real-time. In order to reflect the full potential value of battery storage, we assume
that the battery operator is not constrained by any CAISO market participation rules.
The Perfect Foresight case effectively represents the theoretical upper-bound on system value
that could be provided from a battery operating in both DA and RT markets.13 The Perfect
Foresight case is not intended to represent an estimate of the most likely value of battery storage
in California.
In the Limited Foresight case, the battery is operated with realistic constraints around the ability
to predict prices. Specifically, the battery dispatch schedule is optimized across all DA value
streams with perfect foresight into prices over the next 24 hours. The battery is then dispatched
in the RT market with only one hour of foresight. This case is similar to the way CAISO might
dispatch the battery in the market.
Operational characteristics of the battery
The operational characteristics of the battery are based on technical specifications provided by
Eos. Specifically, we modeled a 1 MW / 4 MWh system with roundtrip efficiency of 75%. The
Eos battery relies on zinc hybrid cathode technology, which allows for full cycling of its 4 MWh
capacity. The battery is rated at 5,000 cycles at full depth of discharge; we assess the sensitivity
of the value estimates to cycling frequency later in this report.
Battery value is modeled on a $/kW-year basis. Value would scale linearly with the amount of
battery capacity installed for modest amounts of storage that are added to the system. However,
as was discussed in Section I of this report, we do not assume any price-setting ability for the
battery. We focus only on the incremental value of an individual system. The operation of a
significant amount of new storage capacity in the California market would likely tighten
arbitrage opportunities and saturate ancillary service markets to some degree.
Location
Marginal costs vary by location across California. To test the sensitivity of battery value to
location, we separately model storage in San Diego, Northern California (the NP-15 zone), and
Southern California (the SP-15 zone). In the analysis, energy prices vary across these locations.
13 We also explored cases where the battery operates strictly in either the DA or in RT markets, with
perfect foresight. See the appendix for further details.

9 | brattle.com
The timing of the hours to which marginal network capacity costs are allocated varies as well,
due to variation in load across the locations (discussed in more detail later in this section of the
report). San Diego is modeled with actual hourly nodal LMPs for downtown (the Coronado 6
node). NP-15 and SP-15 reflect average prices across all trading hubs in Northern California and
Southern California, respectively. Spinning reserves, regulation, and annual marginal capacity
costs are held constant across locations. A map of the modeled locations is provided in Figure 2.
Figure 2: Map of California Transmission Congestion Zones
Source: CAISO OASIS, node used is Coronado_6_N001
ESTABLISHING MARGINAL COSTS
Energy price arbitrage value
We rely on historical hourly CAISO energy market prices to establish a range of realistic hourly
marginal energy costs.14 The market price data spans the period from 2013 through 2016.
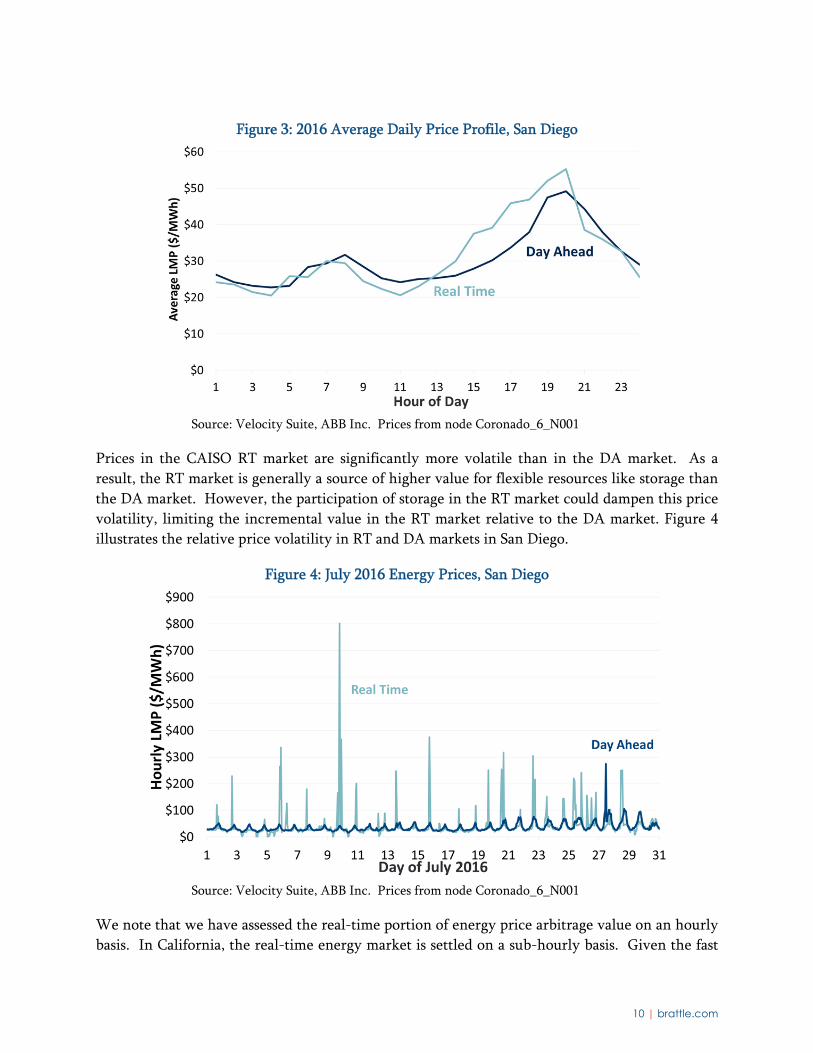
Higher peak prices tend to occur between 5 pm and 11 pm. The average daily price profile for
San Diego in 2016 is illustrated in Figure 3.
14 LMPs are used as a reasonable proxy for avoidable marginal energy costs. This is a standard approach
to assessing the energy value of distributed energy resources. In practice, unit start-up costs,
locational constraints, and other factors would also influence the precise energy value of distributed
battery storage. More detailed dynamic modeling of energy storage dispatch using a production cost
simulation model would be one way to account for these nuances in future research.
10 | brattle.com
Figure 3: 2016 Average Daily Price Profile, San Diego
Source: Velocity Suite, ABB Inc. Prices from node Coronado_6_N001
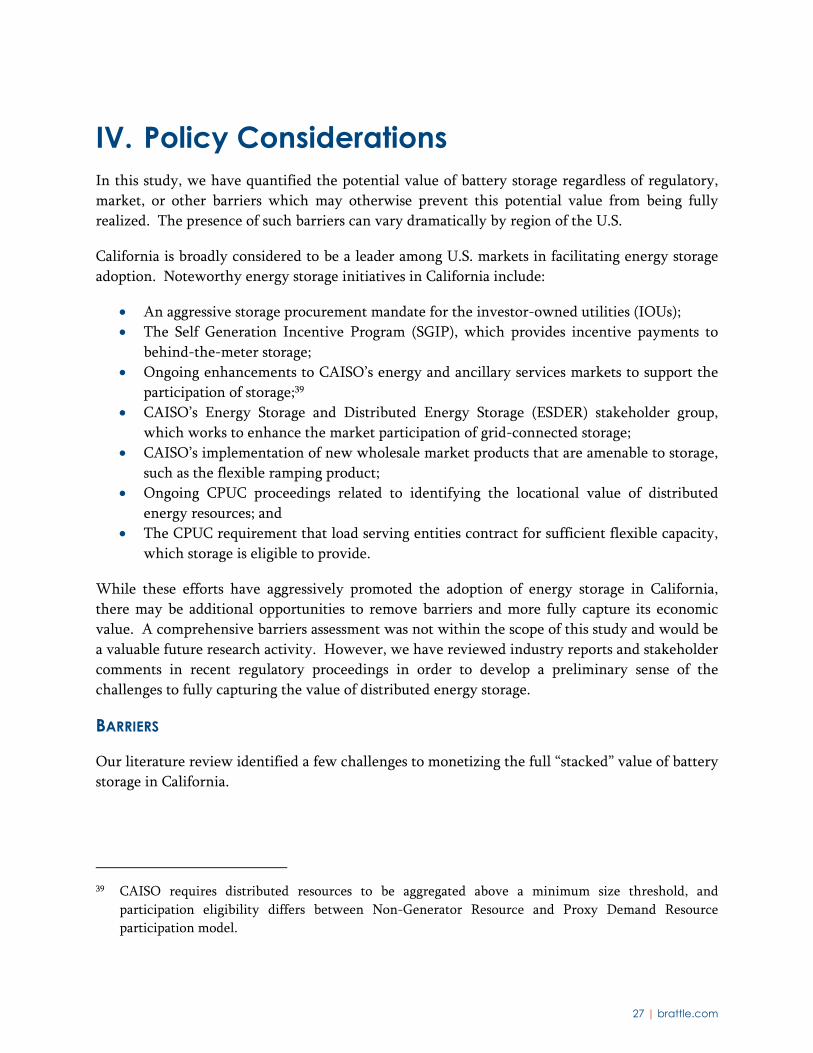
Prices in the CAISO RT market are significantly more volatile than in the DA market. As a
result, the RT market is generally a source of higher value for flexible resources like storage than
the DA market. However, the participation of storage in the RT market could dampen this price
volatility, limiting the incremental value in the RT market relative to the DA market. Figure 4
illustrates the relative price volatility in RT and DA markets in San Diego.
Figure 4: July 2016 Energy Prices, San Diego
Source: Velocity Suite, ABB Inc. Prices from node Coronado_6_N001
We note that we have assessed the real-time portion of energy price arbitrage value on an hourly
basis. In California, the real-time energy market is settled on a sub-hourly basis. Given the fast

11 | brattle.com
response capabilities of battery storage, capturing price volatility at this level of granularity
would likely increase the energy value relative to our estimates in this study. Modeling real-time
energy value in sub-hourly increments would be a useful future research activity.
Ancillary services value
CAISO procures multiple ancillary services. “Frequency regulation” (which includes “Reg Up”
and “Reg Down”) is a fast-moving signal followed by flexible resources to manage system
frequency. It requires the ability to respond to power fluctuations virtually instantaneously.
“Spinning reserves” are resources held in reserve to respond quickly to a major contingency.
Non-spinning reserves are contingency reserves that generally provide a lower associated degree
of certainty than spinning reserves.
In this study, we rely on historical hourly CAISO ancillary services prices for 2013 through 2016.
To capture the full potential value of battery storage, we allow the battery to participate in the
spin and frequency regulation markets regardless of any potential constraints in current market
participation rules.15 Since participation in non-spin is universally less profitable than spin, non-
spin has been excluded from this analysis.
The frequency regulation market is commonly considered a highly lucrative market for energy
storage across the U.S. The high degree of operational flexibility in battery storage makes it
ideally suited to provide this service. However, it is important to note that the frequency
regulation market is “shallow” and can quickly saturate. For instance, in 2016 the CAISO system
peak demand was 46 GW. In comparison, the total frequency regulation requirement has ranged
from 400 to 800 MW (i.e., less than 2% of peak demand).16
To account for the potentially small size of the frequency regulation market opportunity, our
sensitivity analysis includes a case in which frequency regulation is excluded from the dispatch
optimization.
Generation capacity value
There are competing views on the value of peak demand reductions in California. On one hand,
some share a view that the system is generally overbuilt with capacity until around 2025. In this
view, peak demand reductions have very limited near-term capacity value. This was a finding,
15 Note that under CAISO market rules, a 1 MW, 15-min duration battery can provide as much
regulation as a 1 MW, 4-hr duration battery.
16 Peak demand and frequency regulation requirement from CAISO website. See:
https://www.caiso.com/Documents/CaliforniaISOPeakLoadHistory.pdf. See also:
http://www.caiso.com/Documents/Q2_2016_Report_on_Market_Issues_and_Performance_Final.pdf.

12 | brattle.com
for instance, of Lawrence Berkeley National Lab’s (LBNL’s) recent study of demand response
potential in California.17 50% of the recent resource adequacy contracts for existing generators in
California include a resource adequacy payment of around $33/kW-year or less, supporting this
view of modest capacity value.18
In the long run, however, as the system approaches an equilibrium balance of supply and
demand, we would expect the marginal cost of capacity to be equal to the net cost of new entry
(net CONE). Net CONE is the full capital cost of a peaking unit less the unit’s energy and
ancillary services earnings.
For the Base Case, we have assumed a marginal capacity cost of $113/kW-year based on a net
CONE value that is consistent with recent studies in California.19 It is common practice in
California regulatory proceedings to use net CONE to assess the capacity value of distributed
resources. Sensitivity analysis is conducted using the lower resource adequacy value of $33/kW-
year discussed above.
In practice, the near-term capacity value of storage is likely somewhere in between the low
resource adequacy payments to existing resources and the much higher net CONE value. There
will be instances of local grid constraints in California. While limited in their pervasiveness,
these locations will experience a near-term need for new capacity. SCE’s response in Aliso
Canyon and the resource void left by the retirement of the San Onofre Nuclear Generating
Station (SONGS) are two such examples. In Aliso Canyon, where natural gas shortages rendered
power plants inoperable, 60 MW of battery storage was procured and deployed in only 9
months.20 Further, there are some features of energy storage that may increase its value relative
to a new gas-fired simple-cycle combustion turbine (CT) – such as faster deployment capability, a
17 The study identified significant value in load flexibility, but found that there is limited value in
conventional peak demand reductions. See Alstone, Peter, et al., “Final Report on Phase 2 Results
2025 California Demand Response Potential Study Charting California’s Demand Response Future,”
Lawrence Berkeley National Laboratory, March 1, 2017.
18 Contracts signed for the period from 2015 to 2019, for existing generators reported to the CPUC under
RA contracts. See “Testimony of Jim Caldwell Exhibit CPUC 2015 Resource Adequacy Report,”
Docket 15-AFC-01 before the Public Utility Commission of the State of California, January 18, 2017.
19 See Edmunds, Thomas, et al., “The Value of Energy Storage and Demand Response for Renewable
Integration in California,” Lawrence Livermore National Laboratory, February 2017. Higher estimates
of net CONE ($154/kW-year) were reported in “Comments…on the CAISO’s Capacity Procurement
Mechanism,” CAISO (2014). This value is similar to the marginal generation capacity cost in the
CPUC’s marginal cost calculator, which is used to assess the value of distributed energy resources.
20 Trabish, Herman, “Is battery energy storage at a ‘turning point’ for US utilities,” Utility Dive, April 11,
2017.

13 | brattle.com
smaller physical footprint, and no local emissions – but these benefits are difficult to directly
translate into financial value.
It is worth mentioning that “preferred resources” in California receive sizeable resource adequacy
payments. These payments can be as high as $300/kW-year for new contracts (the majority of
storage projects in CA have received these new contracts).21 While this payment may appear to
be significantly higher than the net CONE value described above, the two values are in fact
largely consistent. The payments to preferred resources effectively levelize net CONE over a
consolidated ten-year period rather than the full life of the asset. Thus, the preferred resource
payment is higher in the years when it is accrued, but the payment ends after only ten years. As
such, the preferred resource payment does not directly reflect a value of capacity that is higher
than net CONE.
Transmission and distribution capacity value
Avoided transmission and distribution capacity costs tend to be the most challenging benefits of
distributed energy resources to accurately quantify. This is partly because these benefits are very
location-specific and partly because the analysis requires a large amount of granular network
data which is typically not made publicly available. As a result, the most uncertainty is
associated with these benefits, though some general rules of thumb can provide an average
approximation of the value.
The CPUC recognizes the value of reducing peak-driven transmission capacity investment needs
through reductions in peak demand. The CPUC’s marginal cost calculator, which is commonly
used in regulatory filings by the state’s investor-owned utilities, includes a range of marginal
transmission costs. We reviewed transmission cost estimates across several years of these studies
and assumed a value of $24/kW-year, which was roughly in the middle of the observed range.22
There is increasing interest in the use of batteries or other distributed resources to defer the need
for new distribution capacity. In California in particular, utilities are required to assemble
Distribution Resource Plans to identify areas on the distribution system where new resources are
valuable.23 Avoidable distribution costs, though, are particularly difficult to quantify. Based on a
review of the CPUC’s marginal cost calculator, demand response filings in other jurisdictions,
21 See Pfeifenberger, Johannes P. et al., “Resource Adequacy in California,” The Brattle Group, October
2012.
22 Transmission cost values for SDG&E and SCE “sub transmission” based on a review of several years of
the E3 avoided cost study titled “Energy Efficiency Avoided Costs.” Various annual updates are
available on the CPUC and E3 websites.
23 Please see more information on the CPUC’s Demand Response Evaluation and Research at
http://www.cpuc.ca.gov/General.aspx?id=10622.

14 | brattle.com
and studies on the value of energy storage, we have assumed an avoidable distribution cost of
$33/kW-year in the Base Case.24
The estimates used for both transmission and distribution costs are representative of average
avoidable costs across the power system. Some locations on the grid will have avoidable costs
that are significantly higher than this average due to a near-term need for significant upgrades or
expansions of existing infrastructure. Estimates of value for those specific locations could be
higher than we have quantified in this study. Conversely, in other locations there will be little
to no near-term need for new network capacity
Allocation of capacity costs to hours of year
Capacity costs are allocated to hours of the year proportional to the likelihood that those hours
will drive the need for new capacity. In other words, the greater the risk of a capacity shortage
in a given hour, the larger the share the marginal capacity cost that is allocated to that hour.
In the Base Case, capacity costs are allocated across the top 100 load hours of the year.25 The
allocation is proportional to each hour’s share of total load in the hours. This means more
capacity cost is allocated to the top load hour than the 100th load hour. Note that load used for
allocation of capacity costs is net of expected output from wind and solar resources. This accounts
for the impact of inflexible, intermittent generation in system planning.
Generation capacity costs are allocated based on hourly CAISO system load. Transmission and
distribution (T&D) capacity costs are allocated based on zonal load to reflect the more local
nature of the drivers of grid costs.26
A conceptually similar approach to quantifying capacity value has been used in the CEC’s time-
dependent valuation (TDV) methodology for quantifying the value of energy efficiency, and also
in the CPUC’s demand response cost-effectiveness protocols. This approach effectively derates
24 This estimate is consistent with the lower end of the range of values observed in recent E3 avoided
cost studies for the CPUC. The estimate is conservative relative to the values in the 2016 update to
that E3 study, which can be more than twice as high as this assumption.
25 Sensitivity cases testing allocation over 50 hours and 250 hours indicated that the estimates of total
value in this study are not highly sensitive to the number of assumed hours for allocation.
26 Ideally, distribution value would be assessed on a much more geographically granular level, with
marginal capacity costs being allocated to hours of the year based on location-specific load values.
Such data is not typically publically available. Therefore, we make the simplifying assumption that
distribution and transmission peaks coincide (but are non-coincident with the California system
peak). With more granular data, accounting for coincidence of generation, transmission, and
distribution peaks could potentially decrease the value estimates.

15 | brattle.com
the value of distributed resources relative to the avoided cost of new peaking capacity by
accounting for constraints that may exist on the operator’s ability to predict and respond to
resource adequacy needs. These constraints could result in battery utilization patterns that
reflect a willingness to bypass some energy value in order to store sufficient levels of energy to
meet anticipated resource adequacy requirements. The approach is akin to capacity value derates
that are applied to demand response programs to account for limitations on the timing and
frequency of customer load interruptions. The approach is effectively a theoretical construct
intended to quantify long-term capacity value, rather than reflecting the way resource adequacy
payments would be monetized by a battery operator in the CAISO market.
A summary of the allocation of all costs is shown in Figure 5. The figure shows, as an average
across all hours of the year in 2016, the costs that could be avoided through the discharge of a
battery in each hour of the day (and, conversely the costs that would be incurred when
charging).
Figure 5: Allocation of Marginal Costs (2016 Annual Average)
Notes: Marginal costs are shown for San Diego. Avoidable distribution costs
will be significantly higher in areas of the network with localized constraints
and on specific days with peak capacity needs. On days without peak
capacity constraints, there is no allocation of capacity value.
While Figure 5 above illustrates average hourly value across all days of the year in 2016, the
capacity costs are in fact assumed to be concentrated in just the top 100 load hours of the year (as
described earlier). Figure 6 below shows this hourly allocation for a single week in August 2016.
The lack of perfect coincidence between the generation peak and the T&D peak is highlighted by

16 | brattle.com
the fact that some hours include only generation capacity costs while other have only T&D
capacity costs.
Figure 6: Chronological Illustration of Marginal Cost Allocation (Week of August 15, 2016)
Notes: Marginal costs are shown for San Diego.

17 | brattle.com
III. Key Findings BASE CASE
Under the “Limited Foresight” case, which accounts for constraints around the battery operator’s
ability to predict prices, the total value of the battery to the power system is $283/kW-year. This
estimate comprehensively includes all “stacked” value streams that could be simultaneously
pursued through the battery’s dispatch. To put this value in context, the costs of battery storage
were recently reported to be in the range of $200 to $500/kW-year.27 Battery costs have declined
by more than 70% since 2010, and costs are expected to continue to decline in coming years.28
The “Perfect Foresight” case represents a theoretical upper-bound, with no limits on the battery
operator’s ability to optimize the dispatch of the battery against prices. Under this case, the value
estimate increases to $328/kW-year. There is a difference in value of only 16% between the
Limited Foresight and Perfect Foresight cases. This small difference highlights that much of the
estimated value is coming from sources that are fairly predictable on a day-ahead basis (such as
day-ahead energy prices and some system reliability events) and/or do not require that
significant operational tradeoffs be made with other value streams (e.g., frequency regulation).
Most of the quantified value resides in avoided generation capacity costs and frequency
regulation, with a fair amount of additional value in energy price arbitrage. Avoided T&D
capacity costs are modest relative to these other sources of value. However, it is important to
highlight that the avoided T&D capacity costs are averages across the system; there are possibly
specific locations on the grid where T&D deferral value would be significantly higher than this
(and vice versa).29
27 Derived from assumptions in the CPUC’s resource planning process, which are based on Lazard’s
Levelized Cost of Storage 2.0 study. Cited estimates are for 4-hour duration batteries, which aligns
with the assumptions in our study. Costs will vary depending on technology type and configuration.
See CPUC Energy Division, “Preliminary RESOLVE Modeling Results for Integrated Resource
Planning at the CPUC,” July 19, 2017, page 33. The CPUC presented costs ranging from $2,000/kW to
$4,500/kW in 2016, decreasing to $2,000/kW to $3,000/kW by 2030. We levelized the costs over an
assumed life of 15 years using a discount rate of 8%.
28 McKinsey & Company, “Electrifying Insights: How Automakers Can Drive Electrified Vehicle Sales
and Profitability,” January 2017.
29 It is also the case that T&D capacity costs will account for a proportionally larger share of the total
value when marginal generation capacity costs are assumed to be closer to the lower resource
adequacy payments that are being given to existing generators in California.

18 | brattle.com
When quantified in isolation, the individual value streams are significantly lower than the
combined estimates of total value. Pursuing resource adequacy value or frequency regulation in
isolation, for instance, would only produce around $100/kW-year of benefits with perfect
foresight. This contrast highlights the significant potential value in being able to dispatch the
battery to capture multiple value streams.
Some sources of value will need to be forgone in order to pursue higher sources of value (e.g., not
maximizing energy market value in order to ensure sufficient energy is available to provide
capacity value). The individual value streams are not purely additive. However, it is noteworthy
that the “stacked” value of energy storage is only 6% less than the sum of the individual value
streams.30 In other words, relatively little value is foregone by pursuing multiple value streams
simultaneously.31
Given the value in stacking the benefits of battery storage, one might ask why there are not more
instances of batteries being used to capture these multiple value streams. Currently, technical
barriers pose a constraint. The algorithms and software that are required to manage the battery’s
operation across multiple markets and price signals need to be developed further in order to
capture these benefits. Additionally, in some instances, regulatory and market design barriers
prohibit batteries from being used to comprehensively capture this value. Those issues are
discussed in Section IV of this report.
Figure 7 summarizes the Base Case battery value estimates.
30 These are the results for the San Diego market under the Perfect Foresight case.
31 It is possible that more detailed modeling of the timing of T&D system peaks could reduce this value,
to the extent that those peaks are less coincident with the system peak than we have accounted for in
this study. More granular data would be needed to conduct that analysis.

19 | brattle.com
Figure 7: Battery Value for Individual Use Cases and Stacked Benefits
Note: Results shown for San Diego. Value in other California locations is
assessed through sensitivity analysis. Energy and ancillary services value is
an average across market conditions between 2013 and 2016.
In our simulations, as expected, the battery is generally discharged on the energy market when
prices are high (between 4 and 9 pm) and charged when prices are low (mostly midnight to 4
am). Figure 8 illustrates the average dispatch of the battery across hours of the day. Of course,
the dispatch pattern could look different that this average profile on any individual day,
depending on the prices on that specific day.

20 | brattle.com
Figure 8: Average Battery Operation (Summer 2016)
Notes: Results shown for San Diego. For simplicity, the figure only accounts
for participation in the DA and RT energy market and does not illustrate
provision of regulation or spinning reserves.
SENSITIVITY CASES
Market conditions can vary significantly by location and over time. As discussed in Section II of
this report, there is uncertainty associated with some of the assumptions in the analysis. We
developed several sensitivity cases to address this uncertainty. Specifically, we tested sensitivity
of the value estimates to assumptions regarding (1) marginal generation capacity costs, (2) the
historical basis for market prices, (3) the amount of notification provided in advance of a resource
adequacy event, (4) the marginal cost of distribution capacity, (5) the need for frequency
regulation, and (6) the battery’s location within the CAISO transmission system. Each of the
sensitivity cases assumes limited foresight (as described above) and co-optimizes the battery’s
dispatch across all available value streams. Table 1 summarizes the upper- and lower-bound
assumptions for each of these sensitivity cases.

21 | brattle.com
Table 1: Description of the Sensitivity Cases
Notes: Assumptions that vary by location include power prices and the
distribution of capacity events
The battery’s value is highly sensitive to the marginal price of generation capacity. In the longer
term, or in locations where there is a need for new peaking capacity, the battery’s capacity value
is significant (as illustrated in the Base Case). Alternatively, if the need for new generation
capacity is considered to be smaller than the Base Case estimate – a near-term view shared by
many in the California market – then the total value of the battery could be less than half of the
Base Case estimate.
The Base Case value estimate is less sensitive to changes in assumptions other than the value of
generation capacity. Variation in value estimates across historical study years is fairly material,
highlighting revenue volatility that could be faced by battery owners participating in wholesale
markets. Figure 9 summarizes the results of the sensitivity analysis.

22 | brattle.com
Figure 9: Results of the Sensitivity Cases
Notes: Average 2013-2016 value for Limited Foresight case in SDG&E
location, unless otherwise specified. “Location” sensitivity only includes
variation in energy and ancillary service prices; it does not include variation
in marginal capacity costs.
While our assessment captures some historical variation in market price drivers such as the
power supply mix, fuel prices, and ancillary services and capacity needs, these are factors that
could change further in the future. Changes to the price of natural gas in particular can have a
significant impact on the energy price arbitrage and ancillary services value of battery storage,
since natural gas and renewables are the marginal sources of generation in California. The
expected addition of increasing amounts of renewable generation will also have a significant, and
likely positive, impact on the value of energy storage.32 Further assessment of the sensitivity of
battery storage value to changes in the price of natural gas and the market share of renewables
would be a valuable research activity.
32 For instance, we separately assessed how the energy value of the battery would change if it were being
dispatched against projected 2030 hourly day ahead prices in Southern California, assuming the
California meets its aggressive renewable portfolio standard (RPS) requirements. As an isolated use
case, the energy value of the battery increased by a factor of five.

23 | brattle.com
Over time, a battery’s useful energy storage capacity is affected by its operations. Cycling a
battery (i.e., charging and discharging) leads to reduction in its storage capability. The extent to
which this capacity degradation occurs can vary significantly from one technology to the next.
Regardless, due to cycling limitations or other considerations like variable O&M costs, battery
operators may wish to restrict dispatch of the battery to its highest-value uses.
We conducted analysis to understand the extent to which the value of battery modeled in this
study would be sensitive to cycling restrictions. Specifically, we optimized the battery’s
operation subject to additional constraints on the number of cycles.33
Our analysis suggests that total value is relatively insensitive to restrictions on the number of
charging cycles. This is because capacity and ancillary services are the primary drivers of value,
and capturing these value streams does not require frequent discharging of significant amounts of
energy. Energy price arbitrage, which requires frequent charging and discharging of the battery,
is somewhat sensitive to the cycling restriction but only accounts for a modest portion of total
value. In fact, a significant fraction of the energy arbitrage value is made up through discharging
during infrequent, large price spikes rather than cycling to arbitrage daily price patterns. Figure
10 illustrates the total value as a function of the number of full charging cycles per year.34
33 This was effectively modeled by imposing an artificial variable O&M cost. The impact of the variable
O&M cost was only reflected in the battery’s dispatch; it was not included as a cost when calculating
total benefits.
34 The number of full charging cycles is calculated as the total MWh of annual discharge divided by the
MWh of energy storage capacity.

24 | brattle.com
Figure 10: Total Battery Value vs Number of Full Charging Cycles per Year
Notes: Cycles per year calculated as MWh of annual discharge divided by
MWh of battery capacity. Calculation assumes no cycling for frequency
regulation, which is provided every hour.
COMPARISON TO OTHER STUDIES
We reviewed prior studies on the value of energy storage to add context to our findings. Some
studies were California-specific while others focused on other regions of the U.S. The studies
typically quantify on only a subset of the value streams that are estimated in our analysis.
However, it is still possible to benchmark the results of our study by making comparisons
specifically for the subset of relevant value streams.
California-specific studies included reports by NREL (2015)35 and LLNL (2014 and 2017)36. For
findings from other regions, we relied on a 2015 RMI study37 which surveyed analyses conducted
by seven different organizations.
Figure 11 summarizes how our value estimates compare to the range observed in the other
studies. The estimates of comparable value streams in our study are within the range of findings
35 Eichman, Josh, et al., “Operational Benefits of Meeting California’s Energy Storage Targets,” National
Renewable Energy Laboratory, December 2015.
36 Edmunds, Thomas, et al., “The Value of Energy Storage and Demand Response for Renewable
Integration in California,” Prepared for the California Energy Commission by Lawrence Livermore
National Laboratory, June 2013.
37 Edmunds, Thomas, et al., “The Value of Energy Storage and Demand Response for Renewable
Integration in California,” Lawrence Livermore National Laboratory, February 2017.

25 | brattle.com
of the prior studies. While this benchmarking exercise helps to put our findings in context, there
are limitations on its usefulness due to the wide range of assumptions and modeling approaches
that are used across the analyses.
Figure 11: Energy Storage Value Estimates from Recent Studies
Notes: All values shown are approximate. See bibliography for a complete
list of reviewed studies on energy storage value.
SUMMARY
Our analysis suggests that, in many cases, the “stacked” benefits of battery storage compare
favorably to recent estimates of new battery costs. This finding is sensitive to the marginal cost
of generation capacity but is otherwise robust across the sensitivity cases we analyzed. The
quantified benefits appear to be in line with those in other studies. The following is a summary
of the important observations from this assessment of the value of battery storage in California:
Even with limited foresight in LMP forecasting, our Base Case findings suggest that the
total value of one kilowatt / four kilowatt-hours of energy storage in California could be
around $280/kW-year. By comparison, recent estimates of battery costs have been in the

26 | brattle.com
range of $200 to $500/kW-year (though they vary significantly by technology type and
configuration).38
Accounting for the “stacked” benefits of battery storage by optimizing its dispatch across
all analyzed value streams significantly increases the total value of the battery relative to
any individual value stream (i.e., by a factor of 2x to 3x over the most lucrative individual
uses cases).
Multiple value streams can be captured without significantly sacrificing the benefits of
any given individual value stream.
Improved price forecasting capability (i.e., market foresight) could further increase the
estimated value of the battery, but only to a limited degree.
Avoided generation capacity, frequency regulation, and energy price arbitrage are the
largest sources of quantified value. However, the “depth” of each market should be taken
into consideration when valuing large quantities of energy storage in a given market.
Frequency regulation in particular is a highly valuable service with a very limited need.
At the same time, the need for frequency regulation is likely to increase with greater
renewable resource deployment. This consideration is particularly relevant in the
California market, as the state approaches its 50% renewable energy target.
Sensitivity cases suggest that uncertainty about the capacity value of storage could
significantly impact estimates of total value. In the short run, excess supply means that
the capacity value of energy storage in California will be modest unless there are local
needs for resource adequacy. In the longer term, as planning reserve margins tighten,
system-wide capacity value could approach the levels quantified in this study.
Aside from sensitivity to generation capacity cost assumptions, the Base Case results are
otherwise fairly robust across a range of assumptions about T&D capacity costs, location,
and study year, ranging roughly from $200 to $300/kW-year. Total value exceeds
$200/kW-year even the case where there is assumed to be no market opportunity to
provide frequency regulation.
38 Derived from assumptions in the CPUC’s resource planning process, which are based on Lazard’s
Levelized Cost of Storage 2.0 study. See footnote 30 for further discussion.
27 | brattle.com
IV. Policy Considerations In this study, we have quantified the potential value of battery storage regardless of regulatory,
market, or other barriers which may otherwise prevent this potential value from being fully
realized. The presence of such barriers can vary dramatically by region of the U.S.
California is broadly considered to be a leader among U.S. markets in facilitating energy storage
adoption. Noteworthy energy storage initiatives in California include:
An aggressive storage procurement mandate for the investor-owned utilities (IOUs);
The Self Generation Incentive Program (SGIP), which provides incentive payments to
behind-the-meter storage;
Ongoing enhancements to CAISO’s energy and ancillary services markets to support the
participation of storage;39
CAISO’s Energy Storage and Distributed Energy Storage (ESDER) stakeholder group,
which works to enhance the market participation of grid-connected storage;
CAISO’s implementation of new wholesale market products that are amenable to storage,
such as the flexible ramping product;
Ongoing CPUC proceedings related to identifying the locational value of distributed
energy resources; and
The CPUC requirement that load serving entities contract for sufficient flexible capacity,
which storage is eligible to provide.
While these efforts have aggressively promoted the adoption of energy storage in California,
there may be additional opportunities to remove barriers and more fully capture its economic
value. A comprehensive barriers assessment was not within the scope of this study and would be
a valuable future research activity. However, we have reviewed industry reports and stakeholder
comments in recent regulatory proceedings in order to develop a preliminary sense of the
challenges to fully capturing the value of distributed energy storage.
BARRIERS
Our literature review identified a few challenges to monetizing the full “stacked” value of battery
storage in California.
39 CAISO requires distributed resources to be aggregated above a minimum size threshold, and
participation eligibility differs between Non-Generator Resource and Proxy Demand Resource
participation model.
28 | brattle.com
Capturing energy and ancillary services value
Energy storage currently has the ability to participate in CAISO’s energy and ancillary services
markets. CAISO has established multiple participation models for storage, to accommodate a
variety of physical characteristics and desired participation strategies. For example, the Non-
Generator Resource (NGR) model has been established for smaller, energy-constrained resources
that are able to provide energy, regulation, and operating reserves. The Proxy Demand Resource
(PDR) model is designed for storage resources that exist behind the meter and can provide load
curtailment (but not inject power onto the grid).40
Stakeholder views on barriers to capturing energy and ancillary services value in California have
generally related to the need to clarify and streamline market rules and regulatory processes.
Areas in which stakeholders have previously identified a need for clarification include: (1)
aggregation requirements for wholesale market participation, (2) limits on net exports of energy
from customers to the grid and the regulatory treatment of distributed resources which export
energy to the distribution system, and (3) prioritizing dispatch control in cases when the battery
is being operated to provide multiple sources of value.41 The latter point on dispatch control
would address confusion around which entity has priority to dispatch a battery when it is
utilized for more than one purpose by multiple parties.
Capturing flexibility value
CAISO and the CPUC have recently implemented reforms to enhance incentives for flexible
resources. This includes the recent CPUC requirement that utilities procure sufficient flexible
capacity, and the addition of a new CAISO flexible ramping ancillary service product. Storage
can provide both of those services. However, it is not clear if the current products are sufficient
to attract adequate flexibility or if additional market products are needed. An ongoing CAISO
stakeholder process is exploring further enhancements to increase system flexibility and enable
storage to provide flexible capacity, but no solutions have yet been finalized.
Capturing transmission and distribution value
In California, the IOUs are in the process of developing Distribution Resource Plans (DRPs).
These DRPs are intended in part to provide an indication of locations where distributed energy
resources, including distributed storage, could be used as a cheaper alternative to distribution
system capacity upgrades. Related to this activity, stakeholders are establishing protocols for
“locational net benefits assessments,” which would lead to a uniform methodology for
40 California ISO, “Response of the California Independent System Operator Corporation to Data
Request”, FERC Docket No. AD16-20-000, May 16, 2016.
41 California ISO, “Draft Energy Storage Roadmap for California,” October 8, 2014.

29 | brattle.com
quantifying the benefits of distributed energy resources. While these initiatives are ongoing,
they have not yet produced a well-defined and accepted methodology.42
Capturing generation capacity value
There is no centralized capacity market in California. That is in contrast to several other
organized markets in the U.S., such as ISO New England, the Midwest ISO, the New York ISO,
and PJM. In California, capacity resources are procured by utilities through bilateral contracts.
Analysts and some stakeholders have indicated that this bilateral process can be a less transparent
and more administratively cumbersome approach than working through a wholesale capacity
market with well-defined rules and clear outcomes.43,44 While a centralized capacity market is
not necessary for storage to participate in providing resource adequacy, the absence of a capacity
market results in the lack of a transparent price signal. This presents a challenge for significant
deployment of storage outside of the state’s storage procurement process.
Other issues
While California IOUs have a mandate to procure a significant amount of energy storage,45 it is
not entirely clear to what extent the utilities will be able to operate the storage technology to
maximize its total potential value. In many regions of the U.S., utilities are not incentivized –
and are often even prohibited – from using storage to maximize total system benefits. This
restriction is generally due to concerns about regulated monopolies operating assets to compete
in unregulated markets. As a result, utilities can be limited to operating the battery only to
capture its distribution value, while leaving energy, ancillary services, and resource adequacy
value on the table.46
ADDRESSING BARRIERS AT THE RETAIL LEVEL
There is a variety of ways in which to address barriers to monetizing the full value of battery
storage. Many of the options for addressing the barriers are at the wholesale market level, along
the lines of the various ongoing initiatives in California that are described above. Wholesale
market barriers are being resolved by CAISO and FERC in concert with other CPUC efforts.
42 Trabish, Herman, “Have California's efforts to value distributed resources hit a roadblock?” Utility
Dive, March 21, 2017.
43 Pfeifenberger, Johannes, Kathleen Spees, and Sam Newell, “Resource Adequacy in California:
Options for Improving Efficiency and Effectiveness,” prepared for Calpine by The Brattle Group,
October 2012.
44 Fitzgerald, Garrett, et al., “The Economics of Battery Storage,” Rocky Mountain Institute, 2015.
45 See the CPUC’s storage mandate docket (R.15-03-011).
46 Bade, Gavin, “Who Should Operate the Distribution Grid,” Utility Dive, March 19, 2015.

30 | brattle.com
Generally, there has been a heavy focus in California on addressing energy storage participation
barriers in wholesale markets.
While we have not quantitatively analyzed the customer-side economics of battery ownership
and utilization, there are also clear options for addressing barriers to distributed storage adoption
at the retail level. To this end, our scope for this study specifically called for an exploration of
opportunities to facilitate storage adoption through retail rate reform. It would be a valuable
future research activity to comprehensively evaluate opportunities to address barriers at both the
retail and wholesale levels.
Better alignment of the retail rate design with the underlying structure of system costs can
incentivize customers to adopt battery storage and use it in a way that produces system benefits.47
In some instances, current rates have flat volumetric charges that do not vary by time of day,
and/or demand charges that do not reflect the full cost of capacity. These rates do not fully
convey the underlying costs which could be avoided through optimal utilization of the battery.
A more granular, cost-based rate design that accounts for the operational characteristics of
battery storage would incentivize customers to operate behind-the-meter battery installations in
a way that would increase the overall system value of the battery.
Generally, rates with the following characteristics will most fully capture the benefits associated
with the significant operational flexibility of battery storage:
Significant price granularity and temporal variation
Strong price signals that fully reflect the time-dependent nature of capacity costs
High-price events that are limited in duration but still sufficient to capture the drivers of
the underlying costs
THE STATE OF RATE DESIGN FOR STORAGE IN CALIFORNIA
In California, there currently are retail rate designs that satisfy the criteria for storage-friendly
rates to at least some degree. These rate offerings appear to be more prominent for commercial
and industrial (C&I) customers than for residential customers. For instance, most C&I customers
have access to a three-part rate with a demand charge (this concept is discussed in further detail
below).48 C&I customers also have access to a rate with hourly variation in the generation
47 Of course, with the introduction of any new rate design, it is necessary to consider the rate’s broader
implications, including distributional effects on customer bills and implications for the utility’s ability
to fully recover its costs.
48 See, for instance, SCE’s “General Service – Demand” tariff:
https://www.sce.com/NR/sc3/tm2/pdf/ce30-12.pdf.
31 | brattle.com
charge.49 For these customers, important future rate design considerations from an energy
storage standpoint include (1) whether or not the demand charge and time-varying volumetric
charges fully reflect marginal (i.e., avoidable) capacity costs, and (2) if time-varying charges can
be tied to system costs in a more dynamic manner, as opposed to a pre-published hourly price
schedule.
Storage-friendly rates for residential customers in California also exist to a certain degree, though
the options are more limited. All residential customers have access to a static time-of-use rate,
with higher prices during peak hours of each day and discounted prices during all other hours.50
Depending on their utility, residential customers also typically have access to either a critical
peak pricing (CPP) rate51, which provides the higher peak period price signal on a day-ahead
basis during a limited number of events per year, or a peak time rebate (PTR) which provides
payments for peak load reductions below an estimated baseline level of “normal” energy
consumption52. Further price granularity in these rate offerings could enhance the incentive for
behind-the-meter storage to provide system value.
Regulatory proceedings are underway in California to develop optional tariffs that are
specifically designed for customers with distributed energy resources such as rooftop solar PV,
energy storage, or smart appliances.53 The overarching objective of this initiative will be to move
beyond the current rate offerings and provide rate options with enhanced price granularity and
cost-reflectivity. Along these lines, we have identified two rate design innovations that could
provide particularly significant opportunities for monetizing the value of behind-the-meter
energy storage. Those options are a “three-part rate” and a “smart home/business rate”.
TWO NEW RATE DESIGNS FOR CAPTURING STORAGE VALUE
Three-part rate
Three-part rates consist of three charges, each of which is designed to recover different types of
costs. A demand charge ($/kW) would recover the utility’s distribution capacity costs, and
49 See, for instance, SCE’s “Real Time Pricing” rate schedule for Small General Service customers:
https://www.sce.com/NR/sc3/tm2/pdf/CE330.pdf.
50 Further, static TOU rates are expected to become the default residential rate offering in 2019.
51 See, for instance, PG&E’s SmartRate: https://www.pge.com/en_US/residential/rate-plans/rate-plan-
options/smart-rate-add-on/smart-rate-add-on.page.
52 See, for instance, SCE’s Domestic Summer Discount Plan:
https://www.sce.com/NR/sc3/tm2/pdf/ce342.pdf.
53 Jeff St. John, “California Solar Industry and Utilities Unveil Dueling Solar-Storage Tariffs,” Greentech
Media, March 17, 2017.

32 | brattle.com
possibly also some portion of transmission and generation capacity costs.54 A time-varying
volumetric charge ($/kWh) would recover energy costs. The peak period of the energy charge
could also recover some portion of generation capacity costs, if those are not already being
recovered through the demand charge. A fixed charge would recover fixed customer costs, such
as metering and billing.
Demand charges provide a strong, cost-based price signal for recovering capacity costs. Further,
the short duration of the demand charge measurement (typically anywhere from 15- to 60-
minutes) makes it avoidable through the dispatch of many configurations of battery storage. The
addition of a time-varying volumetric charge further enhances the actionable price signal in a
three-part rate.
In California, the introduction of three-part rates would be an opportunity particularly for
residential customers with storage. Three-part rates are already offered on an optional basis to
small commercial and industrial customers and appear to be a standard feature of rates for larger
customers. However, three-part rates are not currently offered to the residential class. The
California utilities have proposed the introduction of residential demand charges in prior rate
cases, but those proposals have not been adopted due to stakeholder opposition.
Demand charge avoidance has become a viable business model for energy storage companies,
including developers of both battery storage and thermal energy storage technology. The Energy
Storage Association, for instance, highlights the opportunities in demand charge avoidance on its
website.55 Many storage developers advertise the opportunities presented by demand charges.
Recent research has quantified the opportunity that demand charges can present for customers
with behind-the-meter storage.56
Smart home/business rate
A smart home/business rate is a form of real-time pricing in which all energy and capacity costs
vary on an hourly or even sub-hourly basis. Energy costs are recovered through an hourly price
tied directly to the wholesale energy market (or to the marginal cost of energy where there is no
wholesale market). Capacity costs are allocated to hours of the year proportional to the risk that
each hour presents in terms of reliability and capacity shortages.
54 For further discussion, see Hledik, Ryan, “Rediscovering Residential Demand Charges,” The Electricity Journal, August/September 2014.
55 Energy Storage Association Website (accessed June 2017): http://energystorage.org/energy-
storage/case-studies/peak-shaving-and-demand-charge-avoidance-prudent-energy-vanadium-redox.
56 Hledik, Ryan and Gus Greenstein, “The Distributional Impacts of Residential Demand Charges,” The Electricity Journal, 2016.

33 | brattle.com
If sufficient information, infrastructure, and capabilities are available, the prices in a smart
home/business rate may also vary geographically to reflect local system constraints. While
geographic price variation is not currently implemented at the retail level, there has been
emerging interest among some industry stakeholders in extending the wholesale market concept
of locational marginal pricing (LMPs) down to the distribution network. Whether this can be
practically implemented remains to be seen.
Rates with hourly energy price variation are commonly available for commercial & industrial
customers. However, it is typically only the energy price that varies by hour in these rates. In
California, hourly energy pricing is offered as an option to even the smallest commercial
customers, though the prices are based on a predetermined, published rate schedule rather than
being based on real-time market fluctuations. Residential customers generally do not have access
to hourly or sub-hourly pricing, but there is emerging interest in the concept of an optional
smart home rate for customers with various home energy management technologies.57
What makes smart home/business rate offerings distinct from prior rate offerings is the hourly
allocation of capacity costs across hours. This is a new concept that is largely untested but is
expected to begin to receive consideration in pricing pilots over the next couple of years.58 The
hourly variation in capacity costs creates opportunities for the battery operator not only to
capture fluctuations in energy value, but to provide resource adequacy in a price-based manner
that is tied directly to the underlying drivers of capacity needs.
Important rate design considerations
The overarching goal of rate design is to develop rates that are cost-based. While tradeoffs must
always be made in rate design, rates should not be created with the sole objective of creating
financial opportunities for any individual technology (including storage) if doing so means
dramatically departing from the principle of cost-causation. If there is a policy objective of
subsidizing certain emerging technologies, it is most economically efficient to do that outside of
the rate design, such as through rebates or other incentives.
If carefully designed, the two rate options discussed in this report can be developed in a manner
that satisfies the objective of cost causation while still providing price signals that are tailored to
the specific operating characteristics of energy storage technologies. Important challenges to be
overcome when developing these rates include:
57 See, for instance, Devi Glick, Matt Lehrman, and Owen Smith, “Rate Design for the Distribution
Edge,” Rocky Mountain Institute report, August 2014.
58 For instance, this concept is being explored by at least one utility in New York.

34 | brattle.com
Aligning the avoidable charges in the new rate (e.g., the demand charge) with marginal
costs. This ensures that avoidance of the charges through dispatch of the battery is
accompanied by a commensurate reduction in the utility’s long-run costs.
Addressing the location-specific nature of transmission and distribution capacity costs.
To closely align price signals with the marginal cost of transmission and/or distribution
capacity, it would be necessary to introduce price variation on a geographic basis within a
utility’s system. It will be important to consider whether that can be practically achieved
through rate design, or if it is better achieved through geographically-targeted incentive-
based demand response programs in which distributed storage could participate.
Providing rate-based incentives to capture multiple storage value streams while limiting
the complexity of the rate design to a level that is acceptable to customers. Due to
complexity, ancillary services and day-ahead / real-time price arbitrage opportunities
would likely need to be addressed at the retail level outside of the rate design, through a
separate program with an aggregator or utility.
CONCLUSION
Operating batteries to capture “stacked” benefits could unlock significantly more value than
using batteries to pursue individual value streams in isolation. This finding is fairly robust across
a range of sensitivity cases conducted in this study.
However, challenges to fully capturing the value in stacked benefits remain. Some of the
barriers are technical in nature, and may be overcome as new battery management algorithms
and software are developed. Other barriers may be overcome through new policy initiatives.
Offering new or revised rate designs which more fully reflect the time-varying nature of the cost
of generating and delivering electricity is one of many possibilities. Costs of energy storage are
expected to continue to decline, and market adoption is likely to increase as a result. In this
scenario, considerations at both the retail and wholesale level will play an increasingly important
role in the formation of energy storage policy initiatives.
35 | brattle.com
References Alstone, Peter, et al., “Final Report on Phase 2 Results 2025 California Demand Response
Potential Study Charting California’s Demand Response Future,” Lawrence Berkeley
National Laboratory, March 1, 2017. Bistline, John, "Technical and Economic Challenges
of Flexible Operations: Case Studies in California and Texas," EPRI, 2016.
Bade, Gavin, “Who Should Operate the Distribution Grid,” Utility Dive, March 19, 2015.
Bistline, John, "Technical and Economic Challenges of Flexible Operations: Case Studies in
California and Texas," EPRI 2016.
Caldwell, Jim, “Testimony of Jim Caldwell Exhibit CPUC 2015 Resource Adequacy Report,”
Docket 15-AFC-01 before the Public Utility Commission of the State of California,
January 18, 2017.
California Energy Storage Alliance, “Energy Storage - a Cheaper, Faster, and Cleaner Alternative
to Conventional Frequency Regulation,” 2011.
California Energy Storage Alliance, “Response of The California Energy Storage Alliance To The
Consolidated Distribution Resource Plan Applications Of The Investor Owned Utilities,”
Before the Public Utility Commission of the State of California, August 31, 2015.
California ISO, “Draft Energy Storage Roadmap for California,” October 8, 2014.
California ISO “Response of the California Independent System Operator Corporation to Data
Request”. FERC Docket No. AD16-20-000, May 16, 2016.
Chang, Judy, Johannes Pfeifenberger, Kathleen Spees, Matthew Davis, Ioanna Karkatsouli,
Lauren Regan, James Mashal, “The Value of Distributed Electricity Storage in Texas,”
Prepared for Oncor by The Brattle Group, November 2014.
“Clean Coalition Response on Distribution Resources Plan Locational Net Benefits Proposals,”
Before the Public Utility Commission of the State of California, August 14, 2014.
CPUC Energy Division, “Preliminary RESOLVE Modeling Results for Integrated Resource
Planning at the CPUC,” July 19, 2017.
CPUC Staff, “Comments of the Staff of the California Public Utilities Commission on the
CAISO’s Capacity Procurement Mechanism Revised Straw Proposal,” Before the Public
Utility Commission of the State of California, July 24, 2014.

36 | brattle.com
Devi Glick, Matt Lehrman, and Owen Smith, “Rate Design for the Distribution Edge,” Rocky
Mountain Institute report, August 2014.
E3, “Time Dependent Valuation of Energy for Developing Building Efficiency Standards,”
Prepared for the California Energy Commission, July 2016.
Edmunds, Thomas, et al., “The Value of Energy Storage and Demand Response for Renewable
Integration in California,” Prepared for the California Energy Commission by Lawrence
Livermore National Laboratory, June 2013.
Edmunds, Thomas, et al., “The Value of Energy Storage and Demand Response for Renewable
Integration in California,” Lawrence Livermore National Laboratory, February 2017.
Eichman, Josh, et al., “Operational Benefits of Meeting California’s Energy Storage Targets,”
National Renewable Energy Laboratory, December 2015.
“Energy Storage Valuation in California: Policy, Planning and Market Information Relevant to
the StorageVET™ Model,” EPRI, 2017. Pg 11.
“Final Report Of The IDER Working Group Filed By Southern California Edison Company (U
338 E), Pacific Gas And Electric Company (U 39 M), San Diego Gas & Electric Company
(U 902 E), and Southern California Gas Company (U 904-G),” R.14-10-003, filed October
2, 2014.
Fitzgerald, Garrett, et al., “The Economics of Battery Storage,” Rocky Mountain Institute, 2015.
Glick, Devi, Matt Lehrman, and Owen Smith, “Rate Design for the Distribution Edge,” Rocky
Mountain Institute report, August 2014.
Hledik, Ryan, “Rediscovering Residential Demand Charges,” The Electricity Journal, August/September 2014.
Hledik, Ryan and Gus Greenstein, “The Distributional Impacts of Residential Demand Charges,”
The Electricity Journal, 2016.
Horri, Brian, and Eric Cutter, “Energy Efficiency Avoided Costs 2011 Update,” E3, December 19,
2011.
Horri, Brian, et al., “Avoided Costs 2016 Interim Update,” E3, August 1, 2016.
Kaun, B., “Cost-Effectiveness of Energy Storage in California: Application of the EPRI Energy
Storage Valuation Tool to Inform the California Public Utility Commission Proceeding R.
10-12-007,” EPRI, 2013.

37 | brattle.com
Pfeifenberger, Johannes P. et al., “Resource Adequacy in California,” prepared for Calpine by The
Brattle Group, October 2012.
“Response of the California Energy Storage Alliance to the Consolidated Distribution Resource
Plan Applications of the Investor Owned Utilities,” Before the Public Utility Commission
of the State of California, August 31, 2015.
Simon, Jason, “Comments of Enphase Energy, Inc. On Roadmap Staff Proposal & Discussion
During The Roadmap Workshop,” Before the Public Utility Commission of the State of
California, November 20, 2015.
St. John, Jeff, “California Solar Industry and Utilities Unveil Dueling Solar-Storage Tariffs,”
Greentech Media, March 17, 2017.
Trabish, Herman K., “Have California's efforts to value distributed resources hit a roadblock?”
Utility Dive, March 21, 2017.