Embed Size (px)
Citation preview

P/2226 USSR
Stable Plasma Column in a Longitudinal Magnetic Field
By I. N. Golovin, D. P. Ivanov, V. D. Kirillov, D. P. Petrov, K. A. Razumova andN. A. Yavlinsky
The results of the experimental study of a pulsedischarge between two electrodes in a straight tube inthe presence of a longitudinal magnetic field arepresented in this paper. The discharge starts approxi-mately along the tube axis and gradually expands.When the strengths of the longitudinal magneticfield and the magnetic field of the current at theplasma boundary are related in certain definiteways the discharge column remains stable and doesnot reach the tube walls. For strong currents, whenthe field of the current is comparable to the longitudi-nal field, the plasma column fills the whole tube crosssection and becomes unstable.
To obtain a high temperature in a discharge withoutelectrodes it is essential in the first place to ensurethe macroscopic stability of the plasma column. In theexperiments described, therefore, we have studiedpulsed deuterium discharges in a straight tube, withelectrodes in the presence of a longitudinal magneticfield.
The maximum current varied from 3000 to 300,000amp. The duration of the first half-cycle of the currentranged from 300 to 1800 /¿sec. The magnetic field inthe same direction as the current could be adjustedfrom 0 to 27,000 gauss. The initial deuterium pressurein the experiments varied from 0.005 to 5 mm Hg.
The amplitude of the current through the gas andthe longitudinal magnetic field could be variedindependently in different experiments. Thus, for awide range of absolute values of the current throughthe gas, the ratio of the longitudinal magnetic fieldHo to the magnetic field of the current Нф could bevaried from 1 to 10.
EXPERIMENTAL EQUIPMENT
Investigations of the stable plasma column werecarried out with several units very similar in con-struction, size and characteristics of the feedingcircuits. A schematic view of such a unit is shown inFig. 1.
The discharge tube is a porcelain or glass tube of18 to 23 cm diameter and 80 cm high. The faces of thetube are covered by porcelain plates on which copper
or stainless steel electrodes are mounted. In theexperiments described the following electrodes wereused: flat electrodes 9 cm and 17 cm in diameter, andhemispherical electrodes 4 cm in diameter. Thedistance between the electrodes in all the experimentswas ~70 cm, unless otherwise stated.
The discharge tube was surrounded by a 5 mm thickcoaxial stainless steel return conductor whose stabili-zing effect should be negligible. The longitudinalmagnetic field in the discharge tube was excited bya coil through which а Сг capacitor bank of 10,000
2226.1 13
Original language: Russian.* Academy of Sciences of the USSR, Moscow.
Figure 1 . General diagram of the experimental equipment:1, coaxial return conductor; 2, porcelain or glass tube; 3, slotfor photographing; 4, spherical spark gap; 5, trigger circuit;6, from control board; 7, synchronization circuit; 8, triggercircuit; 9, voltage divider; 10, to oscillograph; 11, belts formeasuring the current distribution; 12, turns for measuring thedistribution of the longitudinal magnetic field ; 13, coil producingthe longitudinal magnetic field; 14, copper or stainless steel
electrodes
72

STABLE PLASMA COLUMN 73
400 800 1200 1600
100 300 4002002226.2 /usée
Figure 2. Oscillograms of the voltage between the electrodes andthe discharge current for systems with various durations of thefirst half-period with a large Но/Нф ratio: Ho = 15,000 gauss,
/m = 20 ka, p = 0.2 mm Hg
to 100,000 /xf was discharged. The pulse current in thetube was produced by the discharge of the C\ capacitorbank (800 to 6800 yd) through a spherical spark gap.
The С i and С 2 banks were made up of pulsecapacitors of the IM-3-100 type each with a 100 /xfcapacity and a charge voltage of 3 kv. f The amplitudeof the discharge current was adjusted from 3 to 300 kaand the duration of the first current half-wave from300 to 1800/xsec by varying the capacitor bankvoltage and by the insertion of an additional induc-tance L into the circuit.
The С1 and С 2 banks worked jointly in the follow-ing way. When the current in the coil reached amaximum, the synchronization circuit triggered thespark gap in the C\ circuit, producing a dischargethrough the gas. The discharge circuit oscillationperiod was chosen to be much less than that of thecircuit producing the longitudinal magnetic field.Thus, the discharge occurred in an almost constant
(c)
(d)
02226.3
1/¿sec
j The capacitors were designed by M. M. Morozov and S. K.Medvedyev.
Figure 3. Oscillograms of the voltage between the electrodes atp = 0.1 mm Hg
(0) /m ^ 60 ka, Ho = 0(b) /m £ 90 ka, Ho £ 10,000 gauss(c) /m £ 60 ka, Ho ^ 10,000 gauss(d) /m ~ 30 ka, Ho ^ 10,000 gauss
magnetic field. The strength of the longitudinalmagnetic field could be raised to 27,000 gauss.
The discharge was investigated in deuterium (atpressures p from 0.005 to 5 mm Hg) and in argon.The tube was filled with deuterium through a palladiumfilter ensuring the appropriate purity of the gas. Afterthe discharge the tube was evacuated to a pressure ofl - 2 x l O - 5 m m H g by an oil diffusion pump with atrap cooled with liquid nitrogen.
PROCEDURE AND RESULTS
For each of the experimental conditions chosen thefollowing parameters were measured: (a) the total dis-charge current, (b) the voltage between the electrodes,
74 SESSION A-7 P/2226 I. N. GOLOVIN et al.
s * - -
о
о S"0"о.
0JC
•fr-« * -
о
Du
rai
r
yy*
p = 0
m
y
<
.2 mm H g
= 185 kA
3O
2226.4Magnetic field intensity, kilooersts
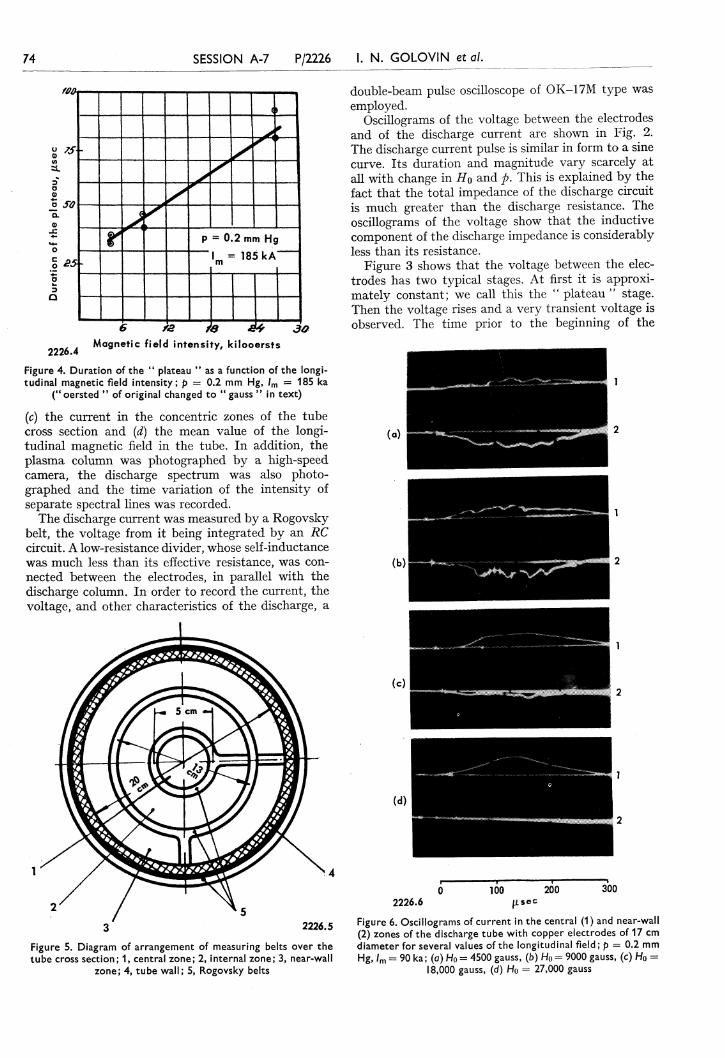
Figure 4. Duration of the " plateau " as a function of the longi-tudinal magnetic field intensity; p = 0.2 mm Hg, /m = 185 ka
("oersted " of original changed to " gauss " i n text)
(c) the current in the concentric zones of the tubecross section and (d) the mean value of the longi-tudinal magnetic field in the tube. In addition, theplasma column was photographed by a high-speedcamera, the discharge spectrum was also photo-graphed and the time variation of the intensity ofseparate spectral lines was recorded.
The discharge current was measured by a Rogovskybelt, the voltage from it being integrated by an RCcircuit. A low-resistance divider, whose self-inductancewas much less than its effective resistance, was con-nected between the electrodes, in parallel with thedischarge column. In order to record the current, thevoltage, and other characteristics of the discharge, a
2226.5
Figure 5. Diagram of arrangement of measuring belts over thetube cross section; 1, central zone; 2, internal zone; 3, near-wall
zone; 4, tube wall; 5, Rogovsky belts
double-beam pulse oscilloscope of 0K-17M type wasemployed.
Oscillograms of the voltage between the electrodesand of the discharge current are shown in Fig. 2.The discharge current pulse is similar in form to a sinecurve. Its duration and magnitude vary scarcely atall with change in Ho and p. This is explained by thefact that the total impedance of the discharge circuitis much greater than the discharge resistance. Theoscillograms of the voltage show that the inductivecomponent of the discharge impedance is considerablyless than its resistance.
Figure 3 shows that the voltage between the elec-trodes has two typical stages. At first it is approxi-mately constant; we call this the " plateau " stage.Then the voltage rises and a very transient voltage isobserved. The time prior to the beginning of the
(c)
(d)
2226.6100 200
fisec300
Figure 6. Oscillograms of current in the central (1) and near-wall(2) zones of the discharge tube with copper electrodes of 17 cmdiameter for several values of the longitudinal field; p = 0.2 mmHg, /m = 90 ka ; (a) Ho = 4500 gauss, (b) Ho = 9000 gauss, (c) Ho =
18,000 gauss, (d) Ho = 27,000 gauss

STABLE PLASMA COLUMN 75
О
7326.7ssa seo 7SO /000 /aso tsoo
Time, /xsec
Figure 7. Ratio of the current density in a given zone to the meancurrent densit/ in the tube cross section; p = 0.2 mm Hg,
/m = 18 ka, at (a) H o = 5000 gauss and (b) Ho = 15,000 gauss
Mean current density,in zones. Current distribution
along radius
2226.9
Figure 9. Determination of the current distribution over thetube cross section by current densities measured in separate
zones
second stage (" plateau " duration) is inversely pro-portional to the rate of the current increase. This timerises as the longitudinal magnetic field increases(Fig. 4). At rather large values of #n the " plateau " isobserved all the time the current flows through thegas (Fig. 2).
The voltage between the electrodes at the momentwhen the discharge current reaches its maximum
Figure 8-. Ratio of the current densit/ in a given zone to the meancurrent density; p = 0.2 mm Hg, /m = 185 ka, H o = 8000 gauss
"3
Л 1
1
2502226.10
500 750Time, (isec
1000 1250
Figure 10. Time variation of plasma column "current" radius.Stainless steel electrodes ~ 9 cm in diameter; p = 0.2 mm Hg,/m = 18 ka, duration of the first half-period ~ 1600 /¿sec: Curve
1, Ho = 5000gauss; curve 2, Ho = 15,000 gauss
increases linearly with the amplitude of the currentand depends little on the initial pressure p and themagnetic field Ho. The size of the electrodes and thematerial of which they are made influence the magni-tude of voltage between them.
Two procedures were used for studying the con-figuration of the plasma column: (1) the transversedistribution of the current in the plasma column was

76 SESSION A-7 P/2226 I. N. GOLOVIN et ai.
Time, fisec2226.11a
Figure 11 (a). Time variation of plasma column "current" radius.Solid line, copper electrodes of 4 cm diameter, dashed line, stain-less steel electrodes of 17 cm diameter; duration of the first half-
period, 300 ¿¿sec
measured with Rogovsky concentric belts, and (2) theplasma column was photographed by a high-speedcamera. The Rogovsky belts placed in quartz tubes8 mm in diameter were inserted inside the tube. Theequal-sensitivity of the belts made it possible tobalance one belt against another in order to measuredirectly the current in each of the three concentriczones between the belts. The arrangement and thesizes of the belts are given in Fig. 5.
Figure 6 presents oscillograms of the current in thecentral and near-wall tube zone. For the same zonethese oscillograms have the same current and timescales. At the initial value of magnetic field(Ho = 27,000 gauss) the current in the near-wall zoneis very small; with the decrease in Ho the current inthe near-wall zone increases, but in the central partit drops. Figures 7 and 8 present the results of theanalysis of such oscillograms.
When Ho has the value 15,000 gauss, the density ofthe current in the near-wall zone is negligible, while thecurrent density in the central zone is 15 times largerthan the mean current density at the beginning ofthe process, and 7 or 8 times larger at the end of the
process. When the intensity of the magnetic field isequal to 5000 gauss, the current density distributionbecomes more regular (Fig. 7). With a still smallerratio of Ho to Нф, when the " plateau " of the voltageis sharply pronounced, the current distribution at themoment corresponding to the end of the "plateau"changes appreciably: the current in the central zonedrops; at the extreme it increases sharply and thereappear strong oscillations corresponding to the re-distribution of the current over the tube cross section(Fig. 8).
Thus, the measurements of the current densitydistribution over the tube cross section have shownthat under definite conditions a discharge may berealized in which the current through the near-wallzone is negligible (j < 1 amp/cm2), i.e., the plasmacolumn interacts weakly with the tube walls andexists as long as the current passes through the gas.
For such discharges the imaginary radius a of thecurrent column was plotted as a function of time. This" current " radius was defined as follows: a quadraticdependence of current density on the radiusj = A(l — Br2) was taken, and the constants A and Вwere calculated assuming that the entire current insidethe internal and central zones coincided with themeasured values. The current in the near-wall zonewas neglected (Fig. 9).
Figures 10 and 11 (я) show the dependence of" current " radius on time. The oscillograms corres-ponding to the first half-period of the current (300 or1600 /*sec) were treated. For all the operating condi-tions some increase in the " current " radius at thebeginning of the process is typical. Then the radiusremains almost invariable until the current vanishes.
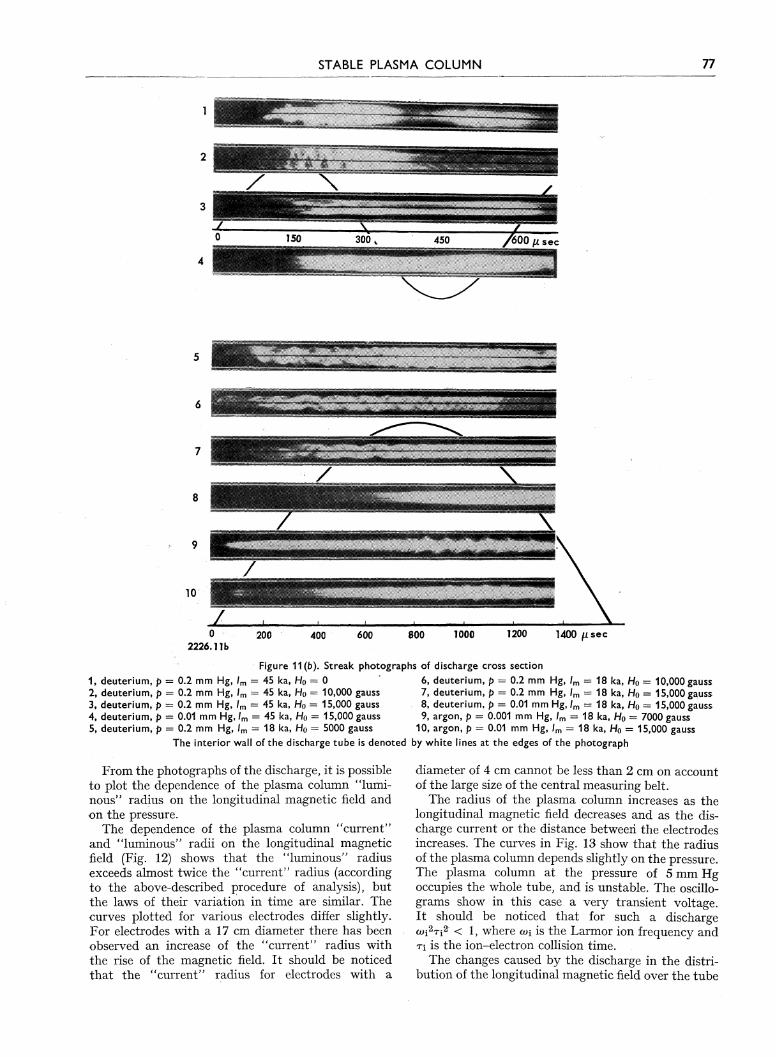
The change of the luminous plasma column widthwith time was photographed simultaneously with themeasuring of the current distribution. For thispurpose a narrow cross slot was made in the middleof the coil producing the longitudinal magnetic field(Fig. 1). Such photographs for discharges with thefirst half-period equal to 300 or 1600 /¿sec are givenin Fig. 11(6). These photographs show that the dis-charge begins in a narrow channel near the tube axis.For all the discharges investigated the plasma columnexpands with velocity proportional to the rate ofincrease of the current. The width of the luminousplasma column at the moment of the current maxi-mum decreases with the rise of the longitudinalmagnetic field.
In the streak photographs of the plasma columnluminous sinusoidal stripes attract the attention.The amplitude of oscillation of the stripes increaseswith the rise of the current in the discharge anddecreases with the rise of the longitudinal magneticfield. During the first half-period their frequencydecreases, which is much more visible in the photo-graphs of a discharge in argon (two lower photographson Fig. 11 (6)). The explanation of these regular motionsrequires further investigation. However, it is possibleto state that they are not associated with the distortionof the basic part of the current through the gas.
STABLE PLASMA COLUMN 77
10
о2226.11b
200 400 600 800 1000 1200 1400 ¿l sec
Figure 11 (b). Streak photographs of discharge cross section
1, deuterium, p= 0.2 mm Hg, /m = 45 ka, Ho = 0 * 6, deuterium, p = 0.2 mm Hg, /m = 18 ka, Ho = 10,000 gauss2, deuterium, p = 0.2 mm Hg, /m = 45 ka, Ho = 10,000 gauss 7, deuterium, p = 0.2 mm Hg, /m = 18 ka, Ho = 15,000 gauss3, deuterium, p = 0.2 mm Hg, /m = 45 ka, Ho = 15,000 gauss 8, deuterium, p = 0.01 mm Hg, /m = 18 ka, Ho = 15,000 gauss4, deuterium, p = 0.01 mm Hg, /m = 45 ka, Ho = 15,000 gauss 9, argon, p = 0.001 mm Hg, /m = 18 ka, Ho = 7000 gauss5, deuterium, p = 0.2 mm Hg, /m = 18 ka, Ho = 5000 gauss 10, argon, p = 0.01 mm Hg, /m = 18 ka, Ho = 15,000 gauss
The interior wall of the discharge tube is denoted by white lines at the edges of the photograph
From the photographs of the discharge, it is possibleto plot the dependence of the plasma column ' 'lumi-nous" radius on the longitudinal magnetic field andon the pressure.
The dependence of the plasma column "current"and ' 'luminous" radii on the longitudinal magneticfield (Fig. 12) shows that the "luminous" radiusexceeds almost twice the "current" radius (accordingto the above-described procedure of analysis), butthe laws of their variation in time are similar. Thecurves plotted for various electrodes differ slightly.For electrodes with a 17 cm diameter there has beenobserved an increase of the "current" radius withthe rise of the magnetic field. It should be noticedthat the "current" radius for electrodes with a
diameter of 4 cm cannot be less than 2 cm on accountof the large size of the central measuring belt.
The radius of the plasma column increases as thelongitudinal magnetic field decreases and as the dis-charge current or the distance between the electrodesincreases. The curves in Fig. 13 show that the radiusof the plasma column depends slightly on the pressure.The plasma column at the pressure of 5 mm Hgoccupies the whole tube, and is unstable. The oscillo-grams show in this case a very transient voltage.It should be noticed that for such a dischargeCÜÍ2TÍ2 < 1, where an is the Larmor ion frequency andTÍ is the ion-electron collision time.
The changes caused by the discharge in the distri-bution of the longitudinal magnetic field over the tube

78 SESSION A-7 P/2226 I.. N. GOLOVIN et al.
2226.12
10 15 20Field intensity in kllooorst
25
Figure 12. Dependence of the "Luminous" and "current" radiion the experimental conditions shown in Table 1
Table 1. Operating Conditions for Figure 12
Curve
Nofi
IL2L345678
Press.,
mm H g.
0.20.20.20.010.20.20.20.01
ЕЫ
Metal
S S b
SSSS
ssssssCuCu
trodes
Diam.cm
9°99
179
1744
I,
ha
18181818.52018.516.516.5
Г/2,
li sec
160016001600
400300400400400
a L = "luminous" radius shown, other curves show "current" radius.Tube radius 9 cm for Curves 1, 2, 3 and 5; 11.5 cm. for Curves 4, 6, 7 and 8.*SS = stainless steel.cElectrode separation 135 cm for Curve 1, 70 cm for the others.
cross section were investigated using wire loops overthe discharge tube so that the plane of the loops wasperpendicular to the tube axis. In order to increasethe accuracy of measurement a method of compensa-tion was employed. Compensating turns wound over
10
и«"Э
-5SсЭ
оиD
ma
2226.13
the coil producing the longitudinal magnetic fieldwere balanced against the measuring turns. Thesensitivity of the compensating turns was chosen sothat in the absence of a discharge, the signal fromunit magnetic field linking both loops should be assmall as possible. Since the external resistance of themagnetic coil circuit is small in comparison with theinductive impedance of the coil, the magnetic fluxin it remains constant during the discharge, andhence the compensating turns cannot record themagnetic field alterations inside the discharge. The emfinduced in the turns was integrated by the RC circuit.For all discharges there was observed an increasein the longitudinal magnetic flux within the discharge.
The oscillograms of the magnetic flux alterationsare presented in Fig. 14. The analysis of such oscillo-grams (Fig. 15) shows that the gas pressure in thiscase is considerably lower than the magnetic pressure.
In discharges separated from the walls, whenHo > Нф, the increase in the longitudinal magneticfield within the discharge is small in comparison withits nonexcited value. Therefore, the measurementsunder these conditions are only of a qualitative nature.They show that the equilibrium of the magnetictensions is considerably disturbed only at smallcurrents when even at low temperatures (10-20 ev)the gas pressure becomes comparable with the magneticfield pressure.
A study of the nature of the spectrum in the visibleregion was carried out for various discharges through-out the entire current pulse; the time variation ofseparate lines of this spectrum was also studied.
The discharge spectrum was photographed by aISP-51 spectrograph accommodating glass optics.The time variation of separate spectral lines wasinvestigated by a UM-2 monochromator providedwith a FEU-19 photomultiplier. To protect the photo-multiplier from the dispersed magnetic field themonochromator with the photomultiplier is placedin a metal encasement. The signal received from thephotomultiplier was amplified, and recorded by anoscilloscope.
The radiation was observed through a small hole
0:02 0.05 0.2
Initial deuterium pressure, mm Hg
Figure 13. Dependence of the (1) "current" and (2) "luminous" radii of the plasma column on theinitial pressure; /m = 18 ka, Ho = 15,000 gauss (solid line, electrodes of 9 cm diam.; dashed line,
electrodes of 17 cm diam.)

STABLE PLASMA COLUMN 79
2226
100 200 300 ftsec
Figure 14. Examples of current oscillograms (upper trace) andmeasurement of magnetic flux within a discharge (lower trace).The upper oscillogram corresponds to a system with p = 0.2 mmHg, /m = 90 ka, Ho = 4500 gauss, and the lower with p = 1 mm
Hg, /m = 180 ka, Ho = 4500 gauss
10 x io4
M X 104
о
x* 6 x 10'
4 x
2 x IO4
Y
25 502226.15
75 100 125
Time^sec
150 175
Figure 15. Time variation of the increment of the magnetic fluxwithin the discharge measured experimentally and the value7го2Нф2/2Но calculated for conditions corresponding t o a n incre-ment of the magnetic flux that is at magnetic pressure balance.
Conditions: p = 0.2 mm Hg, /m = 1800 ka, H o = 4500 gauss
(25 mm diameter) in the magnetic coil, located half-way between the electrodes.
In addition to the Balmer lines there were observed,in the spectra of some discharges under investigation,lines of the atoms and ions of the wall and electrodematerials. Thus, for example, the spectra of thedischarges which occur without a longitudinal magneticfield, or at a comparatively weak magnetic field,involve the Si11 lines 4128 Â, 4130 Â and several others.
Figure 16. Oscillograms of the time variation of the D/з intensityand the total discharge current for p = 0.01 mm Hg, /m = 45 kaand various magnetic fields. Oscillograms (c), (d) and (e) areobtained with greater amplification on the photomultiplier than(a) and (b). The field strengths H o are: (a) 0, (b) 5, (c) 5, (d) 10}
(e) 15 kilogauss
Figure 16 shows the oscillograms of the photo-multiplier signals induced by the radiation of theBalmer line D^ from the discharge. These oscillogramsshow a decrease in the intensity of the Balmer linesafter the superposition of the magnetic field. Thisdecrease is sharper for a larger field.
The oscillograms in Fig. 17 convincingly confirm theexistence of a stable discharge. They express thecharacter of the time variation of the radiationintensity of the silicon lines (4128 Â and 4130 Â), and

80 SESSION A-7 P/2226 I. N. GOLOVIN et al.
(0
Figure 17. Oscillograms of the time variation of the Si11 lineat 4128 Л and the total current for p = 0.01 mm Hg, /m = 45 kaand various magnetic fields H o : (a) 0, (b) 5, (c) 7.5, (d) 10,
(e)12, ( f ) 15 kilogauss
evidence a significant relaxation of the interaction ofthe discharge plasma with the tube walls when thelongitudinal magnetic field is sufficiently large and theradius of the plasma column is smaller than theinterior radius of the discharge tube. All the photo-multiplier signal oscillograms presented are synchro-nized with the discharge current trace.
DISCUSSION OF RESULTS
The measurements of the current density distri-bution over the cross section of the discharge column
and the streak photographs show that under experi-mental conditions the discharge starts near the tubeaxis. This fact is observed for all the values of thelongitudinal magnetic field and very often for Ho = 0.This is possibly associated with the configuration ofthe electric fields before the breakdown. Since therate of the current increase is small and the plasmaresistance at these discharge stages is high (R >̂ wl),the discharge develops in the central region where theconductivity is much higher. The original dischargechannel expands but does not reach the walls andremains stable when Ho is large enough. Investigationof the dependence of the radius of the plasma columnon the longitudinal magnetic field was described inRef. 1.
The radius of the stable plasma column as shown inRef. 2 must satisfy the condition
п ^ Ъ (1)
where Л is the wavelength of excited instability,Нф is the intensity of the field of the current at thedischarge column boundary and Ho is the intensity ofthe longitudinal magnetic field. Numerical comparisonof the radii obtained experimentally and those calcu-lated by means of the formula
1Нф}
shows that Eq. (1) is correct if Л is taken as 2/, whereI is the electrode separation—70 or 135 cm.
The data presented (Fig. 12) show that the decreasein the intensity of the longitudinal magnetic fieldif HQ < 15,000 gauss leads only to an increase in theplasma column radius but not to instability. One ofthe possible explanations of such a discharge behaviourmay lie in the following mechanism: after the start inthe narrow discharge channel, the current densityincreases with time and may turn out to be consider-ably larger than the current density allowed by thestability conditions (1) for the discharge columnradius. In this case instability is developed in thenarrow column and its wavelengths will be the smaller,the poorer the fulfilment of condition (1). Macroscopicmotions of the unstable column lead to a partialionization of the neutral gas enveloping the plasmacolumn and, consequently, to an expansion of theconducting region through which the current flows.Such a process will take place until the current densitybecomes stable, equal to j , the value Нф on theboundary drops and conditions are created for theexistence of a stable plasma column.
We do not have at our disposal sufficient data toevaluate the time of existence of the stable plasmacolumn. In comparing the data presented in Fig. 12,one can see that the stable plasma column in experi-ments with a duration of the first half-cycle of1600 /xsec has a larger radius than in experiments witha duration of the first half-cycle of 300 jusec, althoughall the other conditions are the same. It may beassumed that diffusion phenomena become essentialwhen the period is increased. However, it may be
STABLE PLASMA COLUMN 81
possible that the diffusion phenomena affect the processduring a shorter period of time, and the stable columnradius may be defined by the ratio of the diffusionrate to the charged particle drift.
In experiments with narrow electrodes, when theplasma column radius exceeds the radius of theelectrode, the voltage across the gap increases andbecomes transient. But this is not associated withinstability of the discharge column, as no chaoticredistribution of the current density over the crosssection is observed. This may be associated with thefact that in this case the electrons near the electrodeshave to travel across the magnetic field.
The conductivity of the plasma column in the mag-netic field is anisotropic. In such a plasma the currentflows along a spiral line intensifying the magneticfield within the plasma column.
Calculations show that the increment of magneticflux caused by the anisotropy of conductivity,
can balance only half of the pressure produced by thefield Нф.
In experiments with currents of 100 ka or more thereis always observed an equality between the mag-netic pressures of the field of the current and of theincreased longitudinal magnetic field within the plasmacolumn.
If we assume that the plasma column expands, a"diamagnetic" effect, i.e., a magnetic field repulsioneffect, must be observed. The expansion of theionization region resulting from the mechanismdescribed above does not require a repulsion of thefield Unes. On the contrary, the expansion of theionization region might take place simultaneouslywith the constriction of the plasma column and withan increase of the magnetic field intensity within it,in order to satisfy the requirements of equality of themagnetic pressures.
Measurements of the voltage between the electrodesand of the current through the gas provide all thedata for the evaluation of the plasma conductivityand the degree of ionization.
By excluding the inductance component from themeasured value of the voltage between the electrodes,it is possible to determine the value of E, the intensityof the electric field in the plasma. The evaluation ofthe plasma conductivity in stable regimes shows that,at the moment of maximum current, in the centralzone it reaches the value of 3 to 5 x 10¹⁴ cgse, whilein the internal zone it reaches only 1 x 10¹⁴ cgse. Atsmall values of Но/Нф the conductivity increases onlyuntil the discharge column touches the tube walls.After this moment the conductivity in the central
zone decreases to values close to the mean value overthe discharge cross section.
It follows from the evaluation of the energy trans-ferred to the electrodes that the plasma temperaturecannot exceed 50 ev. Therefore, if the conductivity isof the order of 5 x 10¹⁴ cgse, the degree of gas ioniza-tion must exceed 20 per cent. This also agrees with themeasurements of the Ц8 line intensity with time,which decreased with increase in the magnetic field,and had a pronounced maximum in the zero regionof the current (Fig. 16).
CONCLUSIONS
The following conclusions may be made, based onthe experimental material:
1. In straight gas discharge tubes when the distancebetween the electrodes exceeds the tube diameterappreciably and also in;the absence of a coaxialdamping conductor, the discharge column in alongitudinal magnetic field can be stable for more thana thousand microseconds.
2. After the breakdown, the region occupied by thedischarge expands and the rate of this expansionincreases with increase in the derivative of thecurrent and decreases with increase in the intensityof the longitudinal magnetic field.
3. At large Но/Нф ratios, when the relationНо/Нф > А/2тгя is satisfied, the discharge column doesnot reach the walls and remains stable while thecurrent flows.
4. If the condition in item 3 is not satisfied, thedischarge fills the whole tube volume and the stabilityfails.
5. The ionization in the stable plasma columnexceeds 20 per cent.
6. The longitudinal field within the plasma columnincreases up to the value sufficient to ensure equalityin the magnetic pressures (neglecting the insignificantpressure of the plasma heated to 10-100 ev).
ACKNOWLEDGEMENTS
The authors express their deep gratitude to V. S.Vasilyevsky for the design of the experimentalequipment and to their unfailing assistants B. A.Galperin, N. V. Krasnov, A. A. Kondratyev andV. S. Mukhovatov.
REFERENCES
1. K. S. W. Champion, Proc. Phys. Soc, 70, 212.2. V. D. Shafranov, Atomnaya Energ., 5 (1956).3. S. I. Braginsky and V. D. Shafranov, Plasma Column in
the Presence of a Longitudinal Magnetic Field, AN SSSR,Fizika Plazmy i Problema Upravliaemykh TermoiadernikhReaksii, 1, 3, Moscow, 1958.