Embed Size (px)
Citation preview

Geological Society, London, Special Publications Online First
May 14, 2013; doi 10.1144/SP382.1, first publishedGeological Society, London, Special Publications
Aisha H. Al-Suwaidi and Hai-Lu YouMarina B. Suarez, Gregory A. Ludvigson, Luis A. González, the Xiagou Formation, Gansu Province, NW ChinaStable isotope chemostratigraphy in lacustrine strata of
serviceEmail alerting
new articles cite this article to receive free e-mail alerts whenhereclick
requestPermission
part of this article to seek permission to re-use all orhereclick
Subscribe
Collection London, Special Publications or the Lyell
to subscribe to Geological Society,hereclick
How to citeFirst and how to cite articles
for further information about Onlinehereclick
Notes
© The Geological Society of London 2013
at University of Kansas on May 24, 2013http://sp.lyellcollection.org/Downloaded from

Stable isotope chemostratigraphy in lacustrine strata of the
Xiagou Formation, Gansu Province, NW China
MARINA B. SUAREZ1,6*, GREGORY A. LUDVIGSON2, LUIS A. GONZALEZ1,
AISHA H. AL-SUWAIDI3,4 & HAI-LU YOU5,7
1Department of Geology, The University of Kansas, 1475 Jayhawk Boulevard.,
Lawrence, KS 66045, USA2Kansas Geological Survey, 1930 Constant Avenue, Lawrence KS 66047, USA
3Department of Earth Sciences, Oxford University, South Parks Road,
Oxford OX1 3AN, UK4Present address: Petroleum Institute University and Research Centre, Petroleum
Geoscience Dept., PO BOX 2533, Abu Dhabi, UAE5Institute of Geology, Chinese Academy of Geological Sciences, 26 Baiwanzhuang Road,
Beijing 100037, China6Present address: Department of Geological Sciences, University of Texas at
San Antonio One UTSA Circle, San Antonio, Texas 78249, USA7Present address: Key Laboratory of Vertebrate Evolution and Human Origin of Chinese
Academy of Sciences, Institute of Vertebrate Paleontology and Paleoanthropology,
Chinese Academy of Sciences, 142 Xizhimenwai Street, Beijing 100044, China
*Corresponding author (e-mail: [email protected])
Abstract: Two sections from Early Cretaceous lacustrine strata of the Xiagou Formation from theChangma Basin in Gansu Province, China, are correlated based on their carbon isotopic compo-sitions of bulk sedimentary organic matter and carbonate, as well as carbonate oxygen-isotopiccompositions. The samples were collected from fossiliferous strata, which contain well-preservedCretaceous bird remains. The sections are primarily correlated based on a two-step increase ind13Corg with an overall magnitude of c. 12.5‰. The stratigraphic variations in carbon isotopeswithin the two lacustrine sections are correlated with global carbon isotope variations C3–C7based on marine carbon isotope records. This correlation places the Xiagou lacustrine strata inthis locality within the early Aptian Stage, specifically, the Selli Equivalent, which is associatedwith Ocean Anoxic Event 1a.
The Lower Cretaceous record of positive and nega-tive d13C excursions in organic carbon and carbon-ate carbon has been well documented (Menegattiet al. 1998; Bralower et al. 1999) in marine strata.Based on the relationship between carbon reser-voirs in the ocean–atmosphere system, variationsof d13C from organic carbon and carbonate incontinental sediments have been used to correlatethe continental chemostratigraphic record of theseexcursions with those in the marine record (Grockeet al. 1999; Heimhofer et al. 2003; Ludvigson et al.2010). This can be particularly useful in sedimen-tary sequences, which may have limited means forchronostratigraphic constraints.
Abundant exposures of Lower Cretaceous con-tinental strata occur in Gansu Province, China(Fig. 1), and contain well-preserved flora and fauna,
including the remains of dinosaurs, birds and flow-ering plants (Tang et al. 2001; You et al. 2005,2006, 2010; Ji et al. 2011). Although palaeonto-logical research in these regions has advanced,detailed stratigraphic relationships and correlationsbetween sites and between local basins are stilluncertain. Palaeoenvironmental and palaeoclimato-logical interpretations are dependent on more accu-rately defining the stratigraphic succession andtiming of these continental deposits.
This study focuses on the Xiagou Formation inthe locally named Changma Basin in the north-western part of Gansu Province (Fig. 1), which hasproduced a number of well-preserved early birdfossils and is known to be Early Cretaceous in agebased on biostratigraphy of purported equivalentstrata in the region (see section ‘Background
From: Bojar, A.-V., Melinte-Dobrinescu, M. C. & Smit, J. (eds) 2013. Isotopic Studies inCretaceous Research. Geological Society, London, Special Publications, 382,http://dx.doi.org/10.1144/SP382.1 # The Geological Society of London 2013. Publishing disclaimer:www.geolsoc.org.uk/pub_ethics
at University of Kansas on May 24, 2013http://sp.lyellcollection.org/Downloaded from

geology’; You et al. 2006). Because detailed tempo-ral relationships in this region are lacking, it is thegoal of this study to make use of the stable carbonisotope chemostratigraphy of sedimentary organiccarbon to provide better time constraints for animportant fossil bird locality.
Background geology
Lower Cretaceous strata in northwestern GansuProvince consist primarily of fluvio-lacustrine strata
that were deposited in intermontane basins. Thesebasins formed as numerous tectonic blocks coa-lesced during the late Palaeozoic to early Mesozoicperiods (Frost et al. 1995; Chen & Yang 1996; Zhaoet al. 1996). Samples were taken from the locallynamed Changma Basin near the town of Changma.The Changma Basin locality is situated in a wedge-shaped basin bounded to the north by the Altyn Taghstrike–slip fault and thrust faults to the east andsouth (Fig. 1). The basin began to form along thealready active Altyn Tagh fault as left-lateral move-ment caused clockwise rotation of the basin; this,
Fig. 1. Location of the Changma bird quarries, and structural geological map. (Modified from Li & Yang 2004.) Insetphotograph: location of the two bird fossil quarries.
M. B. SUAREZ ET AL.
at University of Kansas on May 24, 2013http://sp.lyellcollection.org/Downloaded from

together with continued uplift to the south, resultedin local subsidence and fault-bounded basins (Li &Yang 2004).
Four formations within this region are thoughtto span the Early Cretaceous series: the Chijinqiao(sandstones interbedded with mudstones and silt-stones), Chijinpu (sandstones interbedded withmudstones and siltstones), Xiagou (mudstones,shales and siltstones interbedded with sandstones)and Zhonggou (sandstones) formations (Chen &Yang 1996; You pers. comm. 2011). Precise ages ofthese formations are lacking, and biostratigraphiccorrelations produce only a coarse resolution forages. As reported in You et al. 2006 (and refer-ences therein), ostracode and charophyte biostrati-graphy from strata thought to be correlative to thelacustrine Xiagou Formation in the Changma Basinsuggests a Barremian Age, while pollen suggests aHauterivian Age. The Xiagou Formation in the Cha-ngma Basin has yielded numerous well-preservedfossils of early birds, including Gansus yumenen-sis and Qiliania graffini as well as other unnamedearly bird specimens (You et al. 2005, 2006, 2010;Ji et al. 2011). Together with vertebrate mater-ial, abundant invertebrates such as conchostracans,ostracodes, charophytes, insects and freshwatermussels are also present, but detailed biostratigra-phic analysis from this locality has not been com-pleted. The similarity of taxa found in the XiagouFormation and the underlying Chijinpu Forma-tion with those found in the Jehol Biota of Liaon-ing Province suggests a Barremian to Aptian age(He et al. 2004; You et al. 2006). G. yumenensis isthought to be evolutionarily as advanced or moreadvanced than bird taxa of the Jehol biota (Youet al. 2006).
No numerical age dates exist for the mainfossil localities. Numerical age dates from maficto intermediate lava flows interbedded with equiv-alent Cretaceous strata, and dykes cross-cuttingCretaceous strata from localities surrounding theChangma Basin, have been dated using whole-rockK–Ar and Ar/Ar. Figure 1 shows the locality ofthe lava flows dated and reported by Li & Yang(2004), the majority of which are Aptian (with theexception of the Beidayao locality). The Beidayaolocality to the north of the Changma Basin pro-duces a K age of 99.2 + 1.2 Ma and an Ar age of105.3 + 1.3 Ma. The Hongliuxia volcanic fields tothe NE of the Changma Basin produces a K age of116.6 + 2.2 Ma and an Ar age of 112 + 0.6 Ma.The Jianquanzi locality south of the ChangmaBasin produces a K age of 112.8 + 3.4 Ma and anAr age of 118.8 + 3.6 Ma. Zeng et al. (2006) reportcross-cutting dykes from the Hongliuxia volcanicfield dated as c. 85 Ma. The combined biostrati-graphic and numerical age data suggest that theChangma Basin began accumulating sediment no
older than Hauterivian (based on pollen records),is older than the Coniacian (based on the cross-cutting dykes), but is likely Barremian to Aptianbased on the similarities to the Jehol biota.
Methods
The Xiagou Formation in this location consistsprimarily of greyish-yellowish shales, siltstones, cal-careous shales, argillaceous limestones and sand-stones deposited in fluvio-lacustrine environments.Significant structural deformation has occurred inthis region such that the Xiagou Formation occursat very high dip angles to almost vertically orientedbeds. Samples from two sections were collectedat c. 1 m intervals. One of the sections is from anactive fossil bird quarry that has produced numer-ous specimens of G. yumenensis, a primitive orni-thuran aquatic bird. The other section is from aninactive quarry that produced the first specimensof G. yumenensis. The two sites are located oneither side of a dirt road c. 100 m apart, with theinactive quarry down-section of the active quarry(Fig. 1). Correlation of the two sections is tenuous,because the two sections are primarily laminatedshales that are vertically oriented. In addition, smalllateral faults and covered sections make directcorrelation difficult. The section from the activequarry was 53.19 m thick, with a total of 64samples collected. The section from the inactivequarry was 41 m thick, with a total of 40 samplescollected.
Approximately 1–2 g of each hand sample waspowdered using a hand-held drill and dried for24 h in an oven. Approximately 1 g of each sam-ple was decarbonated using 0.5 M HCl for 24 hor until all carbonate was removed. After decar-bonation, the remaining HCl was decanted andsamples were rinsed with deionized-distilled wateruntil the supernatant reached neutrality. Sampleswere dried in an oven at 45 8C for 24–48 h andre-homogenized with a mortar and pestle. Approxi-mately 0.3–2 mg per sample was combusted witha Costech elemental analyser, with the resultingCO2 analysed with a ThermoFinnigan MAT 253continuous-flow isotope ratio mass spectrometer.The analysis resulted in d13C values for both bulksedimentary organic carbon and total organic car-bon (TOC). Aliquots of samples that were notdecarbonated were analysed for stable isotopiccompositions of carbonate oxygen and carbon.Another set of microsampled carbonates were dril-led from polished slabs of hand samples. Thecarbonates (c. 50 mg) were reacted with 100% phos-phoric acid in a KIEL III carbonate device con-nected to a ThermoFinnigan MAT 253 dual-inletisotope ratio mass spectrometer. All analyses were
CHEMOSTRATIGRAPHY OF THE XIAGOU FORMATION
at University of Kansas on May 24, 2013http://sp.lyellcollection.org/Downloaded from

carried out at the Keck Palaeoenvironmental andEnvironmental Stable Isotope Lab at the Univer-sity of Kansas. All samples are reported relative toV-PDB, with accuracy monitored by analysis ofinternational standards such as NBS-19 and NBS-18 (for carbonates) and IAEA-600 and USGS 24(for organic carbon) to within 0.1‰.
Results
Sedimentary organic carbon isotope curve
The carbon isotope curve of organic matter has anoverall shift to heavier d13C values up-section forboth the active quarry section and the inactivequarry section (Fig. 2; Table 1). The d13Corg in thefirst 7 m of the active quarry varies at the base of thesection by more than 5‰. It begins with an overalldecrease in d13Corg from 225.0‰ to 231.8‰(0 to 7 m), the most negative value for the section.This is followed by a sharp peak characterizedby an c. 5‰ increase to 225.3‰ followed by adecrease back to 231.0‰, at 10.3 m. There is a pro-nounced increase in d13Corg of c. 6‰ to 225‰ from10.3 to 17.5 m. The d13Corg curve then oscillates byc. 2–3‰, before a sharp peak occurs at 221.5‰(38.18 m), followed by a decrease to 227.2‰ at41.74 m. The d13Corg finally increases to 220.9‰at 45.74 m, the most enriched value of the section.The top of the section (45.74–52.74 m) is character-ized by a decrease in d13Corg of c. 3‰.
The inactive quarry samples includes the low-est d13Corg value of both sections (233.2‰); thisoccurs 1 m above the base of the section. Thed13Corg curve fluctuates by c. 3–5‰, over 12 m,but gradually increases to a value of 226.5‰ at12 m. The curve again oscillates by c. 2‰ between12 and 19 m before increasing to 222.9‰ at 21 m,and then decreases significantly to 228.7‰ at25 m. A large shift to more positive values ford13Corg occurs above 25m, and values increase to222.7‰ at 27.33 m, followed by a smaller positivestep at 31 m to 220.7‰ (the most positive valuefor this section), with an overall increase of 8‰between 25 and 31 m. The d13Corg curve decreasesagain to 227.6‰ at 34 m, before it increases to asecond positive peak of 221.6‰ at 39 m.
Carbonate carbon isotope curve
The d13Ccarb curve for the active quarry sectionshows an initial decrease in d13C from 9.6‰ at 1 mto 3.7‰ at 5 m. The d13Ccarb then increases to amaximum value of 11.4‰ at 8.5 m (Fig. 3a, Table1). The curve varies by c.+1‰, with an overalldecrease in d13Ccarb from the maximum of 11.4‰to 9.5‰ over a thickness of 24.6 m, followed by a7.8‰ decrease to 1.7‰ at 34.1 m. The carbon iso-tope curve then fluctuates significantly over the next19 m by 8‰ with a maximum value of 8.4‰ at35.6 m, and a minimum value of 0.4‰ at 38.9 m.
The d13Ccarb in the inactive quarry increasesfrom the base of the section at 7.0‰ to 10.2‰ at
Fig. 2. Lithostratigraphy and bulk sedimentary organic carbon stable isotope chemostratigraphy from the active andinactive bird quarries. The solid red lines reflect a three-point running average of data depicted by thin, blue dashed lines.The square data points in the active quarry section are values for charcoalified wood. The two sections are correlatedbased on the four segments depicted as alternating shaded/non-shaded segments. Profile is in metres. Horizontalscale indicated grain size: c, clay; si, silt; fs, fine sand; ms, medium sand; cs, coarse sand; cngl, conglomerate.
M. B. SUAREZ ET AL.
at University of Kansas on May 24, 2013http://sp.lyellcollection.org/Downloaded from

Table 1. Chemostratigraphic data
Section Sample Metres d13Corg ‰(V-PDB)
d13Ccarb ‰(V-PDB)
d18Ocarb ‰(V-PDB)
TOC(%)
Active quarry CBBQ-1 0.00 231.0 7.3 20.1 2.6CBBQ-2 1.00 225.0 9.6 25.5 0.4CBBQ-3 2.00 226.3 0.4CBBQ-4 3.00 231.8 3.7 26.7 1.0CBBQ-5 4.00 227.4 7.4 28.9 0.1CBBQ-6aux 4.50 231.1 5.0 28.3 6.5CBBQ-6 5.00 231.7 3.7 27.5 1.7CBBQ-6
charcoal5.00 226.5
CBBQ-7 6.00 231.7 9.2 27.1 0.0CBBQ-8r 7.00 231.8 11.3 21.6 3.8CBBQ-9 8.00 230.9 6.9 28.6 0.8CBBQ-10 8.50 226.9 11.4 20.5 0.3CBBQ-11 8.90 225.3 0.4CBBQ-12r 9.30 230.5 5.7CBBQ-13r 10.30 231.0 9.5 20.2 2.5CBBQ-14r 11.40 230.4 9.0 0.7 2.5CBBQ-15r 12.60 230.6 8.3 22.0 3.2CBBQ-16 13.40 228.7 9.2 21.3 0.9CBBQ-17 14.40 228.9 9.0 24.0 0.9CBBQ-18 15.50 225.4 10.5 0.1 0.5CBBQ-19 16.50 226.6 8.6 21.2 0.2CBBQ-20 17.50 225.0 0.2CBBQ-21 18.50 225.0 8.5 24.3 0.4CBBQ-22 19.55 225.2 7.4 21.3 0.2CBBQ-23 20.40 225.3 6.9 26.3 0.4CBBQ-24 21.30 225.6 8.1 22.4 0.2CBBQ-25 22.30 224.4 10.5 22.4 0.2CBBQ-26 23.30 224.4 9.7 21.6 0.4CBBQ-27 24.40 228.4 8.1 21.2 1.5CBBQ-28 25.40 227.8 8.0 23.5 1.3CBBQ-29 26.10 224.4 9.0 24.9 0.4CBBQ-30 27.10 227.4 7.8 25.6 1.2CBBQ-31bottom 27.60 225.5 6.2 26.7 0.3CBBQ-31top 27.60 225.4 8.3 24.3 0.4CBBQ-32 28.10 224.3 10.5 23.2 0.2CBBQ-33 29.10 227.9 3.7CBBQ-34 30.10 227.0 7.2 24.5 0.6CBBQ-36 32.10 224.2 0.2CBBQ-37 33.10 225.2 9.5 25.4 0.1CBBQ-38shale 34.00 224.4 3.7 26.5 0.7CBBQ-38ss 34.10 223.9 1.7 210.0 0.1CBBQ-39 35.10 224.8 3.8 212.9 0.1CBBQ-39
charcoal35.10 221.7
CBBQ-40 35.60 224.5 8.4 24.0 0.5CBBQ-41 36.60 225.3 1.0CBBQ-42 37.60 225.3 7.9 24.5 0.5CBBQ-43 38.29 222.1 4.2 213.0 1.1CBBQ-43bR 38.72 221.4 1.4CBBQ-43c 38.89 222.3 0.4 211.7 4.6CBBQ-43dR 38.99 222.1 1.7 212.1 2.3CBBQ-44 39.29 224.4 0.1CBBQ-45 40.29 225.3 0.1CBBQ-46 41.29 224.1 3.5 29.3 0.5CBBQ-47 42.29 227.2 8.0 24.0 1.6CBBQ-48 43.29 224.7 0.1
(Continued)
CHEMOSTRATIGRAPHY OF THE XIAGOU FORMATION
at University of Kansas on May 24, 2013http://sp.lyellcollection.org/Downloaded from

3 m (Fig. 3a). The curve oscillates slightly beforedecreasing to a d13Ccarb value of 3.9‰ at 22 m.The curve then begins a series of large fluctuations
of c. 8‰ over the next 19 m with a maximumvalue of 9.5‰ at 29 m and a minimum value of2.4‰ at 32 m.
Table 1. Continued
Section Sample Metres d13Corg ‰(V-PDB)
d13Ccarb ‰(V-PDB)
d18Ocarb ‰(V-PDB)
TOC(%)
CBBQ-49b 44.29 224.0 0.2CBBQ-49.5 44.89 224.3 2.9 213.2 0.5CBBQ-50 45.29 226.9 0.1CBBQ-51 46.29 220.9 0.4CBBQ-52 47.29 222.8 1.6CBBQ-53 48.19 222.8 2.3 212.2 6.5CBBQ-54 49.19 224.3 0.1CBBQ-55 50.19 223.1 1.3CBBQ-56 51.19 223.5 1.1CBBQ-57 52.19 223.0 2.6 28.0 0.8CBBQ-58 53.19 223.8 4.1 27.8 0.6
Inactive quarry CB-G-1 0.00 232.2 3.5CB-G-2 1.00 233.2 7.0 29.9 4.0CB-G-3 2.00 230.9 4.4CB-G-4 3.00 229.7 10.2 24.9 2.7CB-G-5 4.00 230.2 8.8 21.4 1.6CB-G-6 5.00 231.3 3.9CB-G-7 6.00 230.2 8.2CB-G-8 7.00 231.3 9.2 20.1 2.8CB-G-9 8.00 230.2 8.3 20.1 1.5CB-G-10 9.00 227.8 8.1 27.1 0.5CB-G-11 10.00 231.9 7.9 21.8 2.9CB-G-12 11.00 226.7 8.4 23.3 15.8CB-G-13 12.00 226.4 9.5 20.7 0.6CB-G-14 16.00 228.1 3.5CB-G-15 17.00 227.2 9.9 22.9 2.6CB-G-16 18.00 225.9 6.7 23.7 1.5CB-G-17 19.00 228.9 3.9CB-G-18r 20.00 225.3 7.0 26.2 0.8CB-G-19r 21.00 222.9 1.0CB-G-20 22.00 227.5 3.9 26.8 3.4CB-G-21r 23.00 225.5 7.5 21.2 0.6CB-G-22 24.00 228.7 6.5 25.0 2.9CB-G-23 25.00 228.7 8.4 27.6 1.3CB-G-24 26.00 225.7 8.3 24.2 0.9CB-G-25black
shale26.99 222.7 4.1 26.5 0.9
CB-G-25r 27.00 222.6 4.0 26.4 0.5CB-G-26r 28.00 222.9 7.0 25.7 0.5CB-G-27r 29.00 223.7 9.5 22.2 0.6CB-G-28 30.00 223.2 5.6 25.2 0.9CB-G-29 31.00 220.7 0.2CB-G-30 31.40 222.2 0.1CB-G-31 32.00 224.4 2.4 29.4 0.1CB-G-32 33.00 222.5 3.8 27.5 0.5CB-G-33 34.00 227.6 7.1 28.0 1.3CB-G-34 35.00 222.7 1.0CB-G-36 37.00 223.3 2.6 212.9 0.1CB-G-37 39.00 221.6 4.1 212.8 0.2CB-G-38 39.49 222.4 1.3CB-G-39 40.00 223.3 0.0CB-G-40 41.00 222.7 4.8 213.7 0.1
M. B. SUAREZ ET AL.
at University of Kansas on May 24, 2013http://sp.lyellcollection.org/Downloaded from
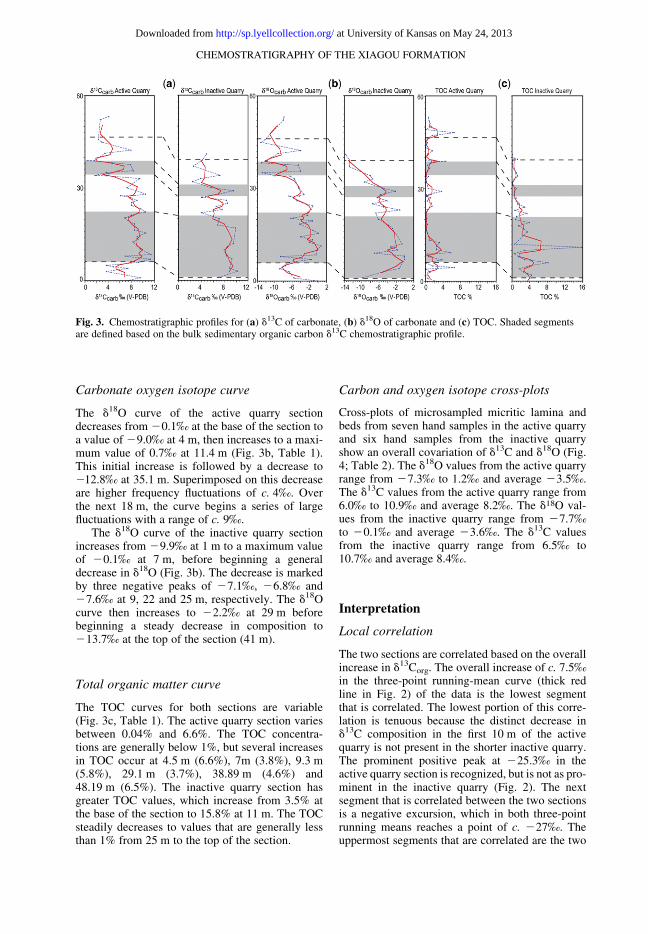
Carbonate oxygen isotope curve
The d18O curve of the active quarry sectiondecreases from 20.1‰ at the base of the section toa value of 29.0‰ at 4 m, then increases to a maxi-mum value of 0.7‰ at 11.4 m (Fig. 3b, Table 1).This initial increase is followed by a decrease to212.8‰ at 35.1 m. Superimposed on this decreaseare higher frequency fluctuations of c. 4‰. Overthe next 18 m, the curve begins a series of largefluctuations with a range of c. 9‰.
The d18O curve of the inactive quarry sectionincreases from 29.9‰ at 1 m to a maximum valueof 20.1‰ at 7 m, before beginning a generaldecrease in d18O (Fig. 3b). The decrease is markedby three negative peaks of 27.1‰, 26.8‰ and27.6‰ at 9, 22 and 25 m, respectively. The d18Ocurve then increases to 22.2‰ at 29 m beforebeginning a steady decrease in composition to213.7‰ at the top of the section (41 m).
Total organic matter curve
The TOC curves for both sections are variable(Fig. 3c, Table 1). The active quarry section variesbetween 0.04% and 6.6%. The TOC concentra-tions are generally below 1%, but several increasesin TOC occur at 4.5 m (6.6%), 7m (3.8%), 9.3 m(5.8%), 29.1 m (3.7%), 38.89 m (4.6%) and48.19 m (6.5%). The inactive quarry section hasgreater TOC values, which increase from 3.5% atthe base of the section to 15.8% at 11 m. The TOCsteadily decreases to values that are generally lessthan 1% from 25 m to the top of the section.
Carbon and oxygen isotope cross-plots
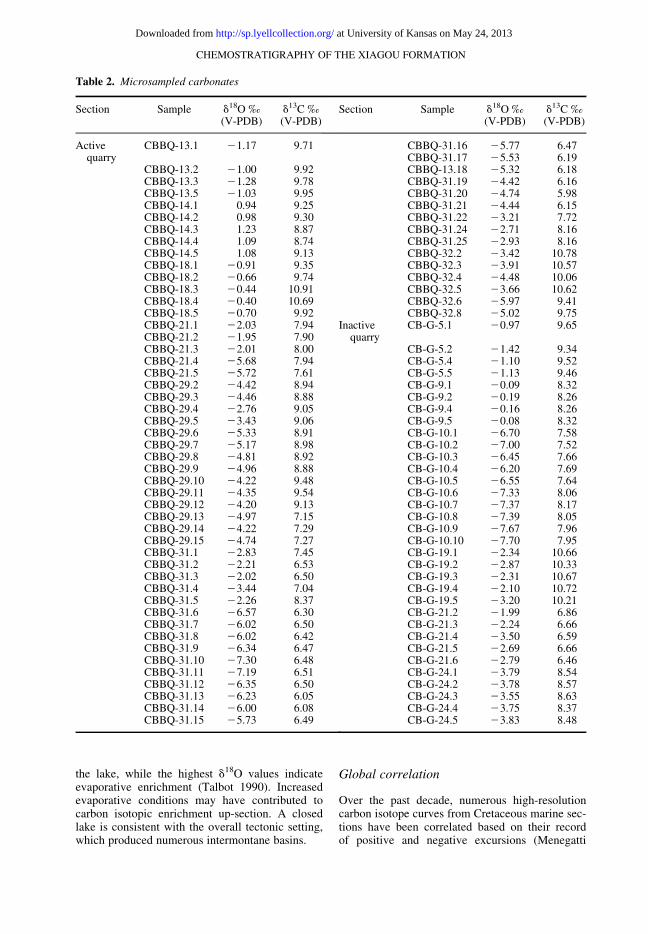
Cross-plots of microsampled micritic lamina andbeds from seven hand samples in the active quarryand six hand samples from the inactive quarryshow an overall covariation of d13C and d18O (Fig.4; Table 2). The d18O values from the active quarryrange from 27.3‰ to 1.2‰ and average 23.5‰.The d13C values from the active quarry range from6.0‰ to 10.9‰ and average 8.2‰. The d18O val-ues from the inactive quarry range from 27.7‰to 20.1‰ and average 23.6‰. The d13C valuesfrom the inactive quarry range from 6.5‰ to10.7‰ and average 8.4‰.
Interpretation
Local correlation
The two sections are correlated based on the overallincrease in d13Corg. The overall increase of c. 7.5‰in the three-point running-mean curve (thick redline in Fig. 2) of the data is the lowest segmentthat is correlated. The lowest portion of this corre-lation is tenuous because the distinct decrease ind13C composition in the first 10 m of the activequarry is not present in the shorter inactive quarry.The prominent positive peak at 225.3‰ in theactive quarry section is recognized, but is not as pro-minent in the inactive quarry (Fig. 2). The nextsegment that is correlated between the two sectionsis a negative excursion, which in both three-pointrunning means reaches a point of c. 227‰. Theuppermost segments that are correlated are the two
Fig. 3. Chemostratigraphic profiles for (a) d13C of carbonate, (b) d18O of carbonate and (c) TOC. Shaded segmentsare defined based on the bulk sedimentary organic carbon d13C chemostratigraphic profile.
CHEMOSTRATIGRAPHY OF THE XIAGOU FORMATION
at University of Kansas on May 24, 2013http://sp.lyellcollection.org/Downloaded from

prominent positive excursions of c. 222‰ in thethree-point running-mean curve.
To test the validity of the d13Corg correlationbetween the two sections, stratification of the car-bon isotope defined segments described above canbe applied to the carbonate d13C and d18O curves(Fig. 3a, b). The segments produce a good correla-tion with the d13Ccarb curve, with an increase invalues to 11.4‰ in the active quarry and 10.23‰in the inactive quarry. This is followed by anoverall plateau and shallow decrease up-section ind13Ccarb values. The second segment is character-ized by an overall increase and decrease in d13Cto as low as 1.7‰ in the active quarry, but higherin the inactive quarry (4.0‰). The third and fourthsegments each correspond, with positive excursionsin the d13Ccarb curve. The d18O record is also con-sistent with the correlation based on the d13Corg
curve. Both the inactive and active d18O curvesincrease significantly from c. 29‰ to as high as0.69‰ in the active quarry (20.10‰ in the inactivequarry), then shallowly decrease. The second seg-ment is characterized by a slight increase but over-all continuation of decreasing d18O values. Thethird and fourth segments are also characterizedby positive excursion, but an overall pattern ofdecreasing d18O values. It should be noted that thelightest d18O values are consistently, although notexclusively, from sandstones. This could indicatethat the carbonate cement was influenced by lighterd18O water, possibly sourced from rivers drainingupland areas and precipitating as early cementswith lower isotopic compositions, or that the coar-ser rocks in the upper part of the sections havebeen influenced by later diagenetic fluids and cem-ents. A comparison of the TOC record shows apoor correlation that is probably due to the fact that
the TOC varies spatially throughout the section(Fig. 3c). In hand samples, this is evident visuallyas concentrations of dark organic material, primar-ily plant fragments. The chemostratigraphic corre-lation places the inactive quarry c. 10–15 m lowerthan the active quarry, suggesting more than oneaccumulation of fossilized bird remains.
Palaeolimnological interpretation
Lacustrine carbonates are generally precipitatedchemically and/or are microbially mediated. Aqua-tic plants also contribute by reducing the pH oflacustrine system when consuming CO2. The car-bonates sampled at the Changma bird quarriesconsist of micritic lamina, small (centimetrescale or smaller) thrombolitic masses, or massivecentimeter-scale beds. The d13C of carbonates iscontrolled by the d13C composition of dissolvedinorganic carbon (DIC), which responds not onlyto the d13C of atmospheric CO2, but also to proces-ses within the lake that affect the DIC, such as anaccelerated biological pump drawing light carbonfrom the reservoir or degassing of gases such asmethane. The overall enriched compositions ofthe d13Ccarb values (as high as 11‰) suggest thatmethanogenesis and ebullition of isotopically lightmethane may have caused this enrichment (Talbot& Kelts 1986). A similar effect has been suggestedfor the lacustrine Yixian Formation, which also con-tains well-preserved birds and other fossils (Lud-vigson et al. 2005).
Covariant trends in the carbon and oxygen cross-plots indicate an overall evaporative and closed lakesystem (Fig. 4). The lowest d18O carbonate values(c. 27.5‰) probably reflect the average precipita-tion composition within the catchment area of
Fig. 4. Cross-plot of carbon and oxygen isotopic composition of microsampled carbonates from hand samples from theactive and inactive quarry sections.
M. B. SUAREZ ET AL.
at University of Kansas on May 24, 2013http://sp.lyellcollection.org/Downloaded from
the lake, while the highest d18O values indicateevaporative enrichment (Talbot 1990). Increasedevaporative conditions may have contributed tocarbon isotopic enrichment up-section. A closedlake is consistent with the overall tectonic setting,which produced numerous intermontane basins.
Global correlation
Over the past decade, numerous high-resolutioncarbon isotope curves from Cretaceous marine sec-tions have been correlated based on their recordof positive and negative excursions (Menegatti
Table 2. Microsampled carbonates
Section Sample d18O ‰(V-PDB)
d13C ‰(V-PDB)
Activequarry
CBBQ-13.1 21.17 9.71
CBBQ-13.2 21.00 9.92CBBQ-13.3 21.28 9.78CBBQ-13.5 21.03 9.95CBBQ-14.1 0.94 9.25CBBQ-14.2 0.98 9.30CBBQ-14.3 1.23 8.87CBBQ-14.4 1.09 8.74CBBQ-14.5 1.08 9.13CBBQ-18.1 20.91 9.35CBBQ-18.2 20.66 9.74CBBQ-18.3 20.44 10.91CBBQ-18.4 20.40 10.69CBBQ-18.5 20.70 9.92CBBQ-21.1 22.03 7.94CBBQ-21.2 21.95 7.90CBBQ-21.3 22.01 8.00CBBQ-21.4 25.68 7.94CBBQ-21.5 25.72 7.61CBBQ-29.2 24.42 8.94CBBQ-29.3 24.46 8.88CBBQ-29.4 22.76 9.05CBBQ-29.5 23.43 9.06CBBQ-29.6 25.33 8.91CBBQ-29.7 25.17 8.98CBBQ-29.8 24.81 8.92CBBQ-29.9 24.96 8.88CBBQ-29.10 24.22 9.48CBBQ-29.11 24.35 9.54CBBQ-29.12 24.20 9.13CBBQ-29.13 24.97 7.15CBBQ-29.14 24.22 7.29CBBQ-29.15 24.74 7.27CBBQ-31.1 22.83 7.45CBBQ-31.2 22.21 6.53CBBQ-31.3 22.02 6.50CBBQ-31.4 23.44 7.04CBBQ-31.5 22.26 8.37CBBQ-31.6 26.57 6.30CBBQ-31.7 26.02 6.50CBBQ-31.8 26.02 6.42CBBQ-31.9 26.34 6.47CBBQ-31.10 27.30 6.48CBBQ-31.11 27.19 6.51CBBQ-31.12 26.35 6.50CBBQ-31.13 26.23 6.05CBBQ-31.14 26.00 6.08CBBQ-31.15 25.73 6.49
Section Sample d18O ‰(V-PDB)
d13C ‰(V-PDB)
CBBQ-31.16 25.77 6.47CBBQ-31.17 25.53 6.19CBBQ-13.18 25.32 6.18CBBQ-31.19 24.42 6.16CBBQ-31.20 24.74 5.98CBBQ-31.21 24.44 6.15CBBQ-31.22 23.21 7.72CBBQ-31.24 22.71 8.16CBBQ-31.25 22.93 8.16CBBQ-32.2 23.42 10.78CBBQ-32.3 23.91 10.57CBBQ-32.4 24.48 10.06CBBQ-32.5 23.66 10.62CBBQ-32.6 25.97 9.41CBBQ-32.8 25.02 9.75
Inactivequarry
CB-G-5.1 20.97 9.65
CB-G-5.2 21.42 9.34CB-G-5.4 21.10 9.52CB-G-5.5 21.13 9.46CB-G-9.1 20.09 8.32CB-G-9.2 20.19 8.26CB-G-9.4 20.16 8.26CB-G-9.5 20.08 8.32CB-G-10.1 26.70 7.58CB-G-10.2 27.00 7.52CB-G-10.3 26.45 7.66CB-G-10.4 26.20 7.69CB-G-10.5 26.55 7.64CB-G-10.6 27.33 8.06CB-G-10.7 27.37 8.17CB-G-10.8 27.39 8.05CB-G-10.9 27.67 7.96CB-G-10.10 27.70 7.95CB-G-19.1 22.34 10.66CB-G-19.2 22.87 10.33CB-G-19.3 22.31 10.67CB-G-19.4 22.10 10.72CB-G-19.5 23.20 10.21CB-G-21.2 21.99 6.86CB-G-21.3 22.24 6.66CB-G-21.4 23.50 6.59CB-G-21.5 22.69 6.66CB-G-21.6 22.79 6.46CB-G-24.1 23.79 8.54CB-G-24.2 23.78 8.57CB-G-24.3 23.55 8.63CB-G-24.4 23.75 8.37CB-G-24.5 23.83 8.48
CHEMOSTRATIGRAPHY OF THE XIAGOU FORMATION
at University of Kansas on May 24, 2013http://sp.lyellcollection.org/Downloaded from

et al. 1998; Erba et al. 1999; Price 2003; and others).The largest change in d13C compositions occursover the Early Aptian C3 to C7 segments definedby Menegatti et al. (1998), in which marine d13Ccarb
varies from slightly less than 1.6‰ to slightlygreater than 4.4‰ in the classic Cismon sectionfrom the Italian Alps. The d13Corg record from theChangma bird quarries shows an even greaterchange in d13C, with a c. 7‰ increase from228.4‰ to 221.2‰. This negative excursion fol-lowed by very large positive excursion is alsoobserved in terrestrial d13Corg records in woodfrom England and Japan (Grocke et al. 1999;Ando et al. 2002). It is the C3 to C7 segments ofthe global d13C record to which we correlate theXiagou Formation lacustrine d13C record (Fig. 5).
The minimum d13Corg value in the Xiagou For-mation curves (Figs 2 & 5) is identified as theC3 negative excursion. The initial 7‰ increase ind13Corg (Figs 2 & 5) is identified as C4, the firstof two positive isotope shifts. The C5 segment inEuropean marine sections is defined by uniformd13C values, although both curves in Menegattiet al. (1998) and Erba et al. (1999) show a slightdecrease in d13C, and Price (2003) and Ando et al.
(2008) also show a somewhat more signifi-cant decrease in d13C. C5 is identified in the activeand inactive quarry sections as the segment afterthe initial increase in carbon isotopic composition,to the most negative point within the non-shadedsegment of Figure 2 (see also Fig. 4). In the activequarry section this segment is characterized bynearly stable d13C values with a decrease ofc. 4‰. In the inactive quarry section, this segmentis less well defined and has slightly greater d13Cfluctuations. The second major positive excursion(C6) is identified by the 7–8‰ increase in d13Corg
from the negative point in the non-shaded sectionof Figure 2 to the positive excursion defining theupper boundary of the second shaded segment inFigure 2 (see also Fig. 4). The uppermost sectionsof the carbon isotope curves are identified as thestart of the C7 segment.
The overall increase in d13Corg from C3 to themaximum value in C7 is as much as 12.5‰ in theinactive quarry and 10.9‰ in the active quarry,which is an extremely large change in carbon iso-tope composition. Other terrestrial organic matterrecords show similar magnitudes in d13C shifts.Heimhofer et al. (2003) shows an 8.5‰ change in
Fig. 5. Correlation of the active quarry section to the Cismon section, Italy, from Menegatti et al. (1998). The negativeexcursion at C3 followed by the two-step positive excursion defined by C4, C5 and C6 define the ‘Selli Equivalent’associated with ocean anoxic event 1a (OAE 1a) (shaded region). The age, chronostratigraphy, magnetostratigraphy,planktonic foraminiferal biozones, and anoxic event record were created using the Time Scale Creator version4.2.5 software (TSCreator 2011).
M. B. SUAREZ ET AL.
at University of Kansas on May 24, 2013http://sp.lyellcollection.org/Downloaded from

carbon isotope composition of terrestrial organicmatter from Portugal. Moreover, Grocke et al.(1999) shows a c. 11‰ change from the lightest toheaviest d13C composition of wood from the EarlyCretaceous Isle of Wight. This enhanced magnitudeeffect may be a result of a more buffered oceansystem due to a larger carbon reservoir, whereasthe terrestrial carbon reservoir may be more sensi-tive to variations in atmospheric d13C changes.This effect can also be attributed at least in part tochanges in d13C plant composition due to changesin pCO2, with increasing pCO2 causing lighterplant composition, and decreasing pCO2 causingheavier plant compositions (van de Water et al.1994; Korner et al. 1988; Grocke et al. 1999). Par-titioning between organic carbon and DIC withinthe lacustrine setting may also cause a large separ-ation between d13Corg and d13Ccarb, in which highproductivity and enhanced burial of light carboncan cause significant enrichment in the remain-ing DIC, and thus d13Ccarb (Leng et al. 2006). Hol-lander & McKenzie (1991) also show enrichmentin particulate organic carbon (POC) d13C duringseasonal highs in productivity. These processescould account for the large variation in d13Corg.
We consider whether these changes in fraction-ation between DIC and POC are the origins of theoverall stratigraphic d13Corg pattern. As mentionedabove, this process could account for the differ-ence in magnitude of the d13Corg variation, but itis not likely to be the sole cause of the patternobserved stratigraphically. There are four reasonsfor this. First, the variations as described by Hol-lander & McKenzie (1991) and Leng et al. (2006)often occur as seasonal variations. The large-scalestratigraphic pattern that we correlate with globalchanges in CO2 occurs at much longer timescalesthan these seasonal changes. Second, if the increasein d13Corg were solely the result of high produc-tivity, TOC and d13C would be positively correla-ted. Figure 6 shows no correlation between thesetwo variables. Third, two pieces of charcoalifiedwood were analysed from within the active quarrysection: one near the base of the section at 5 m(226.5‰) and another at 35.1 m (221.7‰) – anincrease of 4.8‰ (square data points in Fig. 2).Both values are somewhat heavier than the bulkorganic carbon isotopic composition, which maybe due to the fact that coalified and charcoalifiedplant remains often become more enriched thantheir original isotopic composition (Robinson &Hesselbo 2004). While any conclusions drawnfrom only two data points from charcoalified woodare somewhat uncertain, it is consistent with chan-ging isotopic compositions of atmospheric CO2
as a primary control on the isotopic compositionof both bulk organic carbon and wood carbon.Finally, we consider whether an increase in
terrestrial organic matter (with slightly heavier iso-topic composition) is the cause of the increase ind13C for bulk organic matter. It is possible that thecoarsening-upward section signals a greater amountof terrestrial input over aquatic organic matter;however, this is an unlikely primary cause for thechange in carbon isotopic composition, becausethe increase in d13Corg occurs well below (c. 10 mor more) the first occurrence of sandstone in boththe inactive and active quarry sections.
Implications
Assignment of the Xiagou Formation to the C3 toC7 segments firmly places the age of the bird quar-ries in the early Aptian Age. Menegatti et al. (1998)defined the ‘Selli Equivalent’, which is associatedwith oceanic anoxic event 1a (OAE1a), as theincrease in d13C (C4), stabilized d13C of C5, fol-lowed by the increase (C6) of d13C values tomaximum early Aptian Age values. Based on theAPTICORE reference core from Cismon, this inter-val is almost entirely within the Leupoldina cabriplanktonic foraminiferal biozone, which occursjust above the magnetic polarity zone CM0 (Erbaet al. 1999). In many other pelagic marine sections,the first occurrence of L. cabri occurs later than atthe Cismon section, so the sequence is also correla-tive to the upper part of the Globigerinoides blowiibiozone (Fig. 4). Regardless of the placement of theboundary between these two biozones, we can nar-row down the age of the lacustrine Xiagou Forma-tion strata in the Changma Basin to between 124and 120 Ma (Gradstein et al. 2004; Ogg et al. 2008).
Fig. 6. Carbon isotopic composition of bulk sedimentaryorganic carbon of the active quarry, plotted v. totalorganic carbon. No correlation between the two variablesis recognized.
CHEMOSTRATIGRAPHY OF THE XIAGOU FORMATION
at University of Kansas on May 24, 2013http://sp.lyellcollection.org/Downloaded from

Many authors have concluded that the negativeand subsequent positive carbon isotope excursionindicates dramatic changes in palaeoclimate dur-ing the Aptian, and the early Aptian Age is thoughtto be the initiation of the mid-Cretaceous green-house period (Menegatti et al. 1998; Grocke et al.1999; Jahren et al. 2001; van Breugel et al. 2007;Ando et al. 2008). The light carbon signature hasbeen attributed to an increase in volcanic activity(i.e. at the Ontong Java Plateau, with a releaseof isotopically light carbon into the atmosphere)(Menegatti et al. 1998). The abruptness and strongdepletion at C3 have also been attributed to arelease of extremely isotopically light carbon frommethane into the atmosphere (e.g. Grocke et al.1999; Jahren et al. 2001; van Breugel et al. 2007;Ando et al. 2008). According to this hypothesis, therelease of greenhouse gases (methane and carbondioxide) would result in increased global tempera-tures and greater weathering, increasing nutrientsupply into the oceans. This would have increasedprimary productivity and anoxic conditions asorganic carbon burial increased (resulting in wide-spread black shale deposition). As organic carbonburial increased, the remaining pool of carbon in theocean, and hence atmospheric CO2 in equilibriumwith the ocean, increased in isotopic composition.Subsequent drawdown of CO2 due to carbonburial would have caused global cooling (Jenkyns2003; Weissert & Erba 2004; Ando et al. 2008;Strohmenger et al. 2010). Changes in marinefauna (ex. rudist extinctions) during this time arethought to have been triggered by these dramaticshifts in climate; whether there is evidence forchanges in continental flora and fauna remains tobe seen. Identification of this interval in EarlyCretaceous strata of NW China will allow examin-ation of the impact of this event on terrestrial floraand fauna.
Conclusions
Carbon isotope chemostratigraphy can signifi-cantly aid the correlation of continental strata. Thed13Corg curves of two profiles within lacustrinestrata of the Xiagou Formation are character-ized by a negative excursion followed by a largeincrease in d13C of c. 12.5‰. Chemostratigraphicprofiles of d13Corg, d13Ccarb and d18Ocarb from thetwo sections places the inactive fossil bird quarryc. 10–15 m below the active quarry. The negativeexcursion in the d13Corg curve corresponds with theglobal C3 negative excursion of Menegatti et al.(1998), and the subsequent increase in d13C cor-responds to the C4 through C6 segments. This cor-relation firmly places this section of the XiagouFormation within the early Aptian (124–120 Ma)Stage (Gradstein et al. 2004; Ogg et al. 2008). The
identification of these carbon isotope excursionsindicates that the Xinminpu Group encompassesthe onset of potential greenhouse conditions rep-resented by the C3 negative excursion, followedby subsequent cooling, represented by the increasein d13C.
The authors wish to thank the members of the Summer2006 Sino-KU expedition (J. J. Smith, B. F. Platt, C. A.Suarez, B. Totten, and E. Tremain). G. Cane (KPESIL)was instrumental in sample analyses. Funding was pro-vided by an NSF supplemental award EAR-0636207travel grant from the Office of International Programs ofKU Research and Graduate Studies office to L. Gonzalezand G. Ludvigson, and an AAPG Grants-in-Aid toM. Suarez. Funding was also provided by the NationalNatural Science Foundation of China (40672007 and41072019) to Hai-Lu You. We are grateful to the crewof the former Fossil Research and Development Centerof the Third Geology and Mineral Resources ExplorationAcademy of Gansu Province for field work assistance.This manuscript was improved greatly by constructivecomments and suggestions from one anonymous reviewerand F. Neubauer.
References
Ando, A., Kakegawa, T., Takashima, R. & Saito, T.2002. New perspective on Aptian carbon isotopestratigraphy: data from d13C records of terrestrialorganic matter. Geology, 30, 227–230.
Ando, A., Kaiho, K., Kawahata, H. & Kakegawa, T.2008. Timing and magnitude of early Aptian extremewarming: unraveling primary d18O variation in indu-rated pelagic carbonates at Deep Sea Drilling Projectsite 463, central Pacific Ocean. Palaeogeography,Palaeoclimatology, Palaeoecology, 260, 463–476.
Bralower, T. J., CoBabe, E., Clement, B., Sliter, W.V., Osburn, C. L. & Longoria, J. 1999. The record ofglobal change in mid-Cretaceous (Barremian-Albian)sections from the Sierra Madre, Northeastern Mexico.Journal of Foraminiferal Research, 29, 418–437.
Chen, J. & Yang, H. 1996. Geological development ofthe northwest China basins during the Mesozoic andCenezoic. In: Zhiyi, Z. & Dean, W. T. (eds) Phaner-ozoic Geology of Northwest China. Science Press,Beijing, 39–62.
Erba, E., Channell, J. E. T. et al. 1999. Integrated stra-tigraph of the Cismon APTICORE (Southern Alps,Italy): a reference section for the Barremian–Aptianinterval at low latitudes. Journal of ForaminiferalResearch, 29, 371–391.
Frost, G. M., Coe, R. S. et al. 1995. Preliminary EarlyCretaceous paleomagnetic results from Gansu Corri-dor, China. Earth and Planetary Science Letters, 129,217–232.
Gradstein, F. M., Ogg, J. G. & Smith, A. G. 2004. AGeologic Time Scale. Cambridge University Press,New York.
Grocke, D. R., Hesselbo, S. P. & Jenkyns, H. C. 1999.Carbon-isotope composition of Lower Cretaceousfossil wood: ocean–atmosphere chemistry and relationto sea-level change. Geology, 27, 155–158.
M. B. SUAREZ ET AL.
at University of Kansas on May 24, 2013http://sp.lyellcollection.org/Downloaded from

He, H. Y., Wang, X. L., Zhou, Z. H., Wang, F., Boven,A., Shi, G. H. & Zhu, R. X . 2004. Timing of the Jiu-fotang Formation (Jehol Group) in Liaoning, north-eastern China, and its implication. GeophysicalResearch Letters, 31, L12605.
Heimhofer, U., Hochuli, P. A., Burla, S., Andersen,N. & Weissert, H. 2003. Terrestrial carbon-isotoperecords from coastal deposits (Algarve, Portugal): atool for chemostratigraphic correlation on an intrabas-inal and global scale. Terra Nova, 15, 8–13.
Hollander, D. J. & McKenzie, J. A. 1991. CO2 controlon carbon-isotope fractionation during aqueous pho-tosynthesis: a paleo-pCO2 barometer. Geology, 19,929–932.
Jahren, A. H., Arens, N. C., Sarmiento, G., Guerrero,J. & Amundson, R. 2001. Terrestrial record of meth-ane hydrated dissociation in the Early Cretaceous.Geology, 29, 159–162.
Jenkyns, H. C. 2003. Evidence for rapid climate changein the Mesozoic–Paleogene greenhouse world. Philoso-phical Transactions of the Royal Society A, 361,1885–1916.
Ji, S.-A., Atterholt, J. et al. 2011. A new, three-dimensionally preserved enantiornithine bird (Aves:Ornithothoraces) from Gansu Province. ZoologicalJournal of the Linnean Society, 162, 201–219.
Korner, C., Farquhar, G. D. & Roksandic, Z. 1988. Aglobal survey of carbon isotope discrimination inplants from high altitude. Oecologia, 74, 623–632.
Leng, M. J., Lamb, A. L. et al. 2006. Isotopes inlake sediments. In: Leng, M. J. (ed.) Isotopes inPalaeoenvironmental Research. Developments in Palae-oenvironmental Research. Springer, Dordrecht, 147–184.
Li, H. & Yang, J. 2004. Evidence for Cretaceous uplift ofthe northern Qinghai-Tibetan Plateau. Earth ScienceFrontiers, 11, 345–359.
Ludvigson, G. A., Gonzalez, L. A., Kirkland, J. I.,You, H.-L., Ufnar, D. F., Carpenter, S. J. &Davis, J. 2005. Stable isotope palaeorecords, EarlyCretaceous Yixian Fm. (Barremian), Liaoning Pro-vince, P.R. China: paleohydrologic and paleoenviron-mental interpretations. Geological Society of AmericaAbstracts with Programs, 37, 458.
Ludvigson, G. A., Joekel, R. M. et al. 2010. Correla-tion of Aptian–Albian carbon isotope excursions incontinental strata of the Cretaceous foreland basin,Eastern Utah, U.S.A. Journal of Sedimentary Research,80, 955–974.
Menegatti, A. P., Weissert, H., Brown, R. S., Tyson,R. V., Farrimond, P., Stasser, S. & Caron, M. 1998.High-resolution d13C stratigraphy through early Aptian‘Livello Selli’. Paleoceanography, 13, 530–545.
Ogg, J. G., Ogg, G. & Gradstein, F. M. 2008. TheConcise Geologic Time Scale. Cambridge UniversityPress, Cambridge.
Price, G. D. 2003. New constraints upon isotope variationduring the early Cretaceous (Barremian–Cenomanian)from the Pacific Ocean. Geology Magazine, 140,513–522.
Robinson, S. A. & Hesselbo, S. P. 2004. Fossil-woodcarbon-isotope stratigraphy of the non-marine Wealden
Group (Lower Cretaceous, southern England). Journalof the Geological Society, London, 161, 133–145.
Strohmenger, C. J., Steuber, T., Ghani, A., Barwick,D. G., Al-Mazrooei, S. H. A. & Al-Zaabi, N. O.2010. Sedimentology and chemostratigraphy of theHawar and Shu’aiba depositional sequences AbuDhabi, United Arab Emirates. GeoArabia Special Pub-lication, 4, 341–365.
Talbot, M. R. 1990. A review of the paleohydrologicalinterpretation of carbon and oxygen isotope rations inprimary lacustrine carbonate. Chemical Geology, 80,261–280.
Talbot, M. R. & Kelts, M. 1986. Primary and diageneticcarbonates in the anoxic sediments of Lake Bosumtwi,Ghana. Geology, 14, 912–916.
Tang, F., Luo, Z.-X., Zhou, Z.-H., You, H.-L., Georgi,A., Tang, Z.-L. & Wang, X.-Z . 2001. Biostratigraphyand palaeoenvironment of the dinosaur-bearing sedi-ments in Lower Cretaceous of Mazongshan area, GansuProvince, China. Cretaceous Research, 22, 115–129.
TSCREATOR 2011. Time Scale Creator visualization ofenhanced Geologic Time Scale 2004 database (Ver-sion 4.2.5; 2011). James Ogg (database coordinator)and Adam Lugowski (software developer). WorldWide Web Address: http://www.tscreator.org
van Breugel, Y., Schouten, S., Tsikos, H., Erba, E.,Price, G. D. & Sinninghe Damste, J. S. 2007. Syn-chronous negative carbon isotope shifts in marineand terrestrial biomarkers at the onset of the earlyAptian ocean anoxic event 1a: evidence for therelease of 13-C depleted carbon into the atmosphere.Paleoceanography, 22, PA 1210.
Van de Water, P. K., Leavitt, S. W. & Betancourt,J. L. 1994. Trends in stomatal density and 13C/12Cratios of Pinus flexilis needles during Last Glacial–Interglacial cycle. Science, 264, 239–243.
Weissert, H. & Erba, E. 2004. Volcanism, CO2 andpaleoclimate: a Late Jurassic–Early Cretaceous car-bon and oxygen isotope record. Journal of the Geolo-gical Society, London, 161, 695–702.
You, H.-L., Atterholt, J., O’Connor, J. K., Harris, J.D., Lamanna, M. C. & Li, D.-Q. 2010. A second Cre-taceous ornithuromorph bird from the Changma Basin,Gansu Province, northwestern China. Acta Palaeonto-logica Polonica, 55, 617–625.
You, H.-L, Lamana, M. C. et al. 2006. A nearly modernamphibious bird from the early Cretaceous of north-west China. Science, 312, 1640–1643.
You, H.-L., O’Conner, J., Chiappe, L. M. & Qiang, J.2005. A new fossil bird from the early Cretaceous ofGansu Province, northwest China. Historical Biology,17, 7–14.
Zeng, L., Yang, J. & Li, H. 2006. Genesis of the Cre-taceous HFSE-enriched Hongliuxia andesitic dike onthe northern margin of the Qinghai-Tibet Plateau:anorthite fractional crystallization and enhanced dis-solution of zircon. Geology in China, 33, 326–331.
Zhao, X., Coe, R. S., Glider, S. A. & Frost, G. M. 1996.Palaeomagnetic constraints on the paleogeography ofChina: implications for Gondwanaland. AustralianJournal of Earth Sciences, 43, 643–672.
CHEMOSTRATIGRAPHY OF THE XIAGOU FORMATION
at University of Kansas on May 24, 2013http://sp.lyellcollection.org/Downloaded from