Embed Size (px)
Citation preview

Vol. 7, No. 7 / July 2008 / JOURNAL OF OPTICAL NETWORKING 704
Stability of virtual network topologycontrol for overlay routing
services
Yuki Koizumi,1,* Takashi Miyamura,2 Shin’ichi Arakawa,1 Eiji Oki,2
Kohei Shiomoto,2 and Masayuki Murata1
1Graduate School of Information Science and Technology, Osaka University,1-5 Yamadaoka, Suita, Osaka 565-0871, Japan
2NTT Network Service Systems Laboratories, 3-9-11 Midori-cho, Musashino,Tokyo 180-8585, Japan
*Corresponding author: [email protected]
Received April 2, 2008; revised May 21, 2008; accepted June 10, 2008;published June 30, 2008 �Doc. ID 94481�
Overlay networks achieve new functionality and enhance network perfor-mance by enabling control of routing at the application layer. However, thisapproach results in degradations of underlying networks due to the selfish be-havior of overlay networks. We discuss the stability of virtual network topol-ogy (VNT) control under overlay networks that perform dynamic routing up-dates. We find that the dynamics of routing on overlay networks cause a highfluctuation in the traffic demand matrix, which leads to significant VNT con-trol instability. To overcome this instability, we introduce three extensions,hysteresis, two-state utilization hysteresis, and filtering, to VNT control.Simulation results show that the hysteresis mechanism improves networkstability, but cannot always improve network performance. We therefore ex-tend the hysteresis mechanism and show that it improves both network sta-bility and performance. However, this extension requires a lot of time for theVNT to converge to a stable state. To achieve fast convergence, we use a fil-tering method for VNT control. Through simulations, we prove that our meth-ods achieve stability against overlay routing without loss of adaptability forchanges in traffic demand. © 2008 Optical Society of America
OCIS codes: 060.4250, 060.4258.
1. IntroductionA wavelength-division-multiplexing (WDM) network offers a flexible network infra-structure by utilizing wavelength-routing capability. In such a wavelength-routedWDM network, a set of optical transport channels, called lightpaths, are establishedbetween nodes via optical cross-connects (OXCs). Much research has been devoted tomethods of carrying IP traffic, which is the majority of Internet traffic, over awavelength-routed WDM network [1–7]. One approach for accommodating IP trafficon a wavelength-routed WDM network is to configure a virtual network topology(VNT), which consists of lightpaths and IP routers. To achieve effective transport oftraffic, VNT control, which configures the VNT on the basis of traffic demand, hasbeen investigated in many papers [8,9].
Overlay networks have recently received much attention as a way to achieve newfunctionality and enhance network performance over IP networks. One of the keytechnologies in overlay networks lies in overlay routing [10,11]. The fundamental ideaof overlay routing is to construct a logical network above the IP network and to allowrouting to be controlled on that logical topology. In the literature, a virtual networktopology provided by a set of lightpaths is sometimes called logical topology. In thispaper, we use the term logical topology in the context of an overlay’s logical topology,and we use the term VNT for virtual network topology provided by lightpaths. Eachoverlay node measures the status, such as throughput and delay, of the underlyingnetwork, and determines the appropriate route to destination nodes on the overlaynetwork to improve performance and resilience. The resilient overlay network (RON)architecture was proposed in [10]. The RON provides fast detection and recovery fromnetwork failures and performance degradation using the existing Internet infrastruc-ture as the underlay network. Another architecture is Detour [11]. It is revealed in
1536-5379/08/070704-16/$15.00 © 2008 Optical Society of America

Vol. 7, No. 7 / July 2008 / JOURNAL OF OPTICAL NETWORKING 705
[11] that a large percentage of flows can locate better alternative routes by relayingamong overlay nodes, which improves the performance of those flows.
As the amount of traffic generated by overlay networks increases, the dynamics ofoverlay routing has a significant effect on VNT control. One typical type of effect is theselfish behavior of overlay routing, as discussed in [12]. Since overlay nodes indepen-dently select their route in a selfish manner to optimize their own performance, sys-temwide performance may not be optimized [13]. Another effect on VNT control is thehigh variance in the traffic demand induced by overlay routing. Since origin–destination pairs in overlay networks traverse several source–destination pairs in IPnetworks, the traffic demand of the IP networks strongly depends on the overlay rout-ing. When the VNT is reconfigured in response to changes in the traffic demand dueto overlay routing, the network status measured at the overlay network may change.This leads to re-adaptation of the overlay network via overlay routing, which in turnresults in changes in the traffic demand for VNT control. In this way, coexistence ofoverlay routing and VNT control leads to a high variance in the traffic demand, as wewill demonstrate in Section 2.
The interaction between overlay routing and packet layer traffic engineering (TE)has been studied in many papers. In the packet layer TE, the routing of IP traffic iscontrolled to satisfy its quality requirements. In [12], it is revealed that interactionbetween overlay routing and packet layer TE causes degradation in the performanceof packet layer TE. They argue that the main reason for this degradation is a conflictbetween two different routing objectives performed at each layer. The effect of selfishrouting in intradomain networks was also investigated in [14]. According to [14], self-ish routing can achieve almost optimal performance if an underlay network performsstatic routing. However, if packet layer TE is used, the performance of the packetlayer TE is degraded due to the interaction between overlay routing and packet layerTE. However, these papers show that the performance of packet layer TE is degradedin terms of maximum link utilization, network cost, and average latency. Since VNT isconfigured on the basis of traffic demand, fluctuations in traffic demand induced byoverlay routing are much more severe for VNT control.
In this paper, we discuss a network architecture in which an overlay network per-forms dynamic routing in accordance with its own policy above a VNT. We first showthat overlay routing highly degrades the performance of VNT control. Then we focuson the VNT control instability caused by the interaction between overlay routing andVNT control. Simulation results show that the instability appears in link utilization,traffic demand, and VNTs due to VNT control. To overcome this instability andachieve a stable VNT control method against overlay routing services, we proposethree extensions for VNT control. First, to improve the stability of VNT control, weintroduce hysteresis, which absorbs traffic demand fluctuations. We show that simplehysteresis applications can improve stability, but cannot always improve performance.We extend the hysteresis application, two-state utilization hysteresis, and show thatthis extension can improve both the stability and performance of VNT control. How-ever, this extension requires a lot of time for the VNT control to become stable. Thus,we achieve faster convergence by using a filtering method. Finally, we show that ourmethods can adapt to changes in the traffic demand, and we therefore achieve stableand feasible VNT control against overlay routing.
The rest of this paper is organized as follows. In Section 2, we discuss performancedegradations of the underlay network and show that the coexistence of overlay rout-ing and VNT control results in significant underlay network instability. We introducehysteresis to overcome this instability in Section 3 and show that simple hysteresisapplications cannot improve performance. Because of this, we extended the hysteresisapplication, as described in Section 4. Although the extended application can improveboth stability and performance, it takes a long time for the VNT control to becomestable. Therefore, we introduce a filtering method and achieve faster convergence, asdescribed in Section 5. Finally, we conclude this paper in Section 6.
2. Instability of the Network StateIn this section, we investigate the influence of overlay routing on dynamically config-ured VNT. Through simulation experiments, we show that the presence of overlayrouting services increases the maximum link utilization of the VNT. We also showthat the coexistence of overlay routing and VNT control leads to VNT instability.

Vol. 7, No. 7 / July 2008 / JOURNAL OF OPTICAL NETWORKING 706
2.A. Network ModelIn our view, a network consists of three layers: an optical layer, a packet layer, and anoverlay layer, as shown in Fig. 1. On the optical layer, the WDM network consists ofOXCs and optical fibers. The VNT control configures lightpaths between IP routersvia OXCs on the WDM network, and these lightpaths and the IP routers form a VNT.On the packet layer, packets are forwarded along the routes that are determined byIP routing on this VNT. On the overlay layer, overlay nodes built on the packet layerform an overlay network. In this network, two types of traffic are carried over theVNT: traffic from overlay networks and traffic from nonoverlay networks, which areillustrated as solid and dashed arrows in Fig. 1, respectively. We refer to overlay traf-fic as the traffic in the overlay network and to nonoverlay traffic as the traffic in thenonoverlay network. We also use the term underlay traffic for all traffic on the VNT,which contains both overlay and nonoverlay traffic.
Figure 1 shows an example of a network. In this figure, the VNT that has six IProuters and nine links are configured on the WDM network that has six OXCs and sixfibers. On the VNT, three overlay nodes, 1, 5, and 6, which are built on IP routers 1,5, and 6, respectively, form an overlay network, and these nodes are interconnectedwith overlay links. Solid arrows show overlay traffic from overlay nodes 1 to 6, anddashed arrows show nonoverlay traffic from IP routers 1 to 6. Routes for overlay traf-fic on an overlay network are determined by overlay routing. The overlay traffic inthis figure is forwarded from overlay nodes 1 to 6 by relaying through overlay node 5.First, the overlay traffic is sent to overlay node 5. Overlay links are IP tunnels overthe VNT in the sense that the traffic on the overlay links is forwarded on the VNTand their routes are determined by IP routing. Thus, the traffic on the overlay linkbetween overlay nodes 1 and 5 is forwarded along the route determined by IP routing,that is, from IP routers 1 to 5 through router 2 on the VNT. The overlay traffic is thenforwarded from overlay nodes 5 to 6 in the same way. The nonoverlay traffic is for-warded from IP routers 1 to 6 through router 3, which is also controlled by IP routing.The underlay traffic is transported on the WDM network in a similar way as that ofthe overlay traffic in the sense that lightpaths are transport tunnels over the WDM
Overlay node 1
IP router 1
OXC 1
OXC 2
OXC 3
OXC 4
OXC 5
OXC 6
IP router 2
IP router 3
IP router 4
IP router 5
IP router 6
Overlay node 5
Overlay node 6
Overlay traffic
Nonoverlaytraffic
Optical layer(WDM network)
Packet layer(IP network)
Overlay layer(Overlay network)
Fig. 1. Example of a network consisting of three layers: optical, packet, and overlay.

Vol. 7, No. 7 / July 2008 / JOURNAL OF OPTICAL NETWORKING 707
network and their routes are decided by VNT control. Thus, the underlay traffic fromIP routers 1 to 3 is transported from OXCs 1 to 3 via OXC 2. In this paper, we discussan interaction between the overlay routing and VNT control through the IP layer.Before we introduce this interaction, we describe overlay routing and VNT controlmore precisely.
2.B. Overlay RoutingSeveral routing policies for overlay networks, such as overlay selfish routing and over-lay optimal routing, have been proposed and evaluated in many papers [14–16]. Weuse overlay selfish routing, in which each overlay node selects the route that has thelargest available bandwidth. This selection is done in a selfish manner aiming atmaximizing the throughput experienced by the overlay nodes. The available band-width al on link l is calculated as al=cl−xl, where cl is the capacity of link l, and thatalong route r is represented by a�r�=minl�r�al�. The overlay network selects the router that satisfies a�r�=maxi�Ra�i�, where R denotes the set of all possible routes.
Several papers have proposed means for improving the performance of the overlaynetwork by relaxing the selfishness or greediness of overlay routing [15,16]. Moreover,selfish routing of which metric of the route selection is the available bandwidth is oneof the greediest overlay routing services, as reported in [16]. In this paper, since ourobjective is to obtain a robust VNT control method against selfish and greedy overlaynetworks, we use the overlay network that selects the route with the most availablebandwidth and do not assume that it uses the previously mentioned cooperativeapproaches.
2.C. Virtual Network Topology ControlThe VNT is configured on the basis of its performance objective by the VNT controlmethod. Several performance objectives for selecting VNTs have been investigated in[17–19]. These investigations have aimed at minimizing the average weighted numberof hops, minimizing the maximum link utilization, minimizing the average delay, andmaximizing single-hop traffic. Many VNT control algorithms for achieving those per-formance objectives have been investigated [9,20–22]. Since the link utilizationdirectly affects the available bandwidth, which the overlay network seeks to optimize,we use algorithms for minimizing the maximum link utilization to investigate theinteraction between overlay routing and VNT control. For minimizing the maximumlink utilization, we investigated the minimum delay logical topology design algorithm(MCDA) [9] and the extended MLDA (e-MLDA) [20]. The MLDA aims to minimizeaverage delay as its performance objective by solving the routing and wavelengthassignment problem, but the main objective for configuring VNTs is to minimize themaximum link utilization. The e-MLDA is proposed as an extension of the MLDA toensure accommodation of the traffic demand. The e-MLDA also tries to decrease themaximum link utilization in the network by taking into account the minimum-hop IProuting. All these algorithms configure VNTs on the basis of traffic demand to opti-mize their performance objectives. Note that VNT control cannot distinguish betweenthe traffic demand caused by the overlay and nonoverlay traffic. The VNT control usesonly combined traffic demand, that is, the traffic demand caused by the underlay traf-fic. Hereafter, we refer to the traffic demand caused by overlay traffic, nonoverlay traf-fic, and underlay traffic as overlay traffic demand, nonoverlay traffic demand, andunderlay traffic demand, respectively.
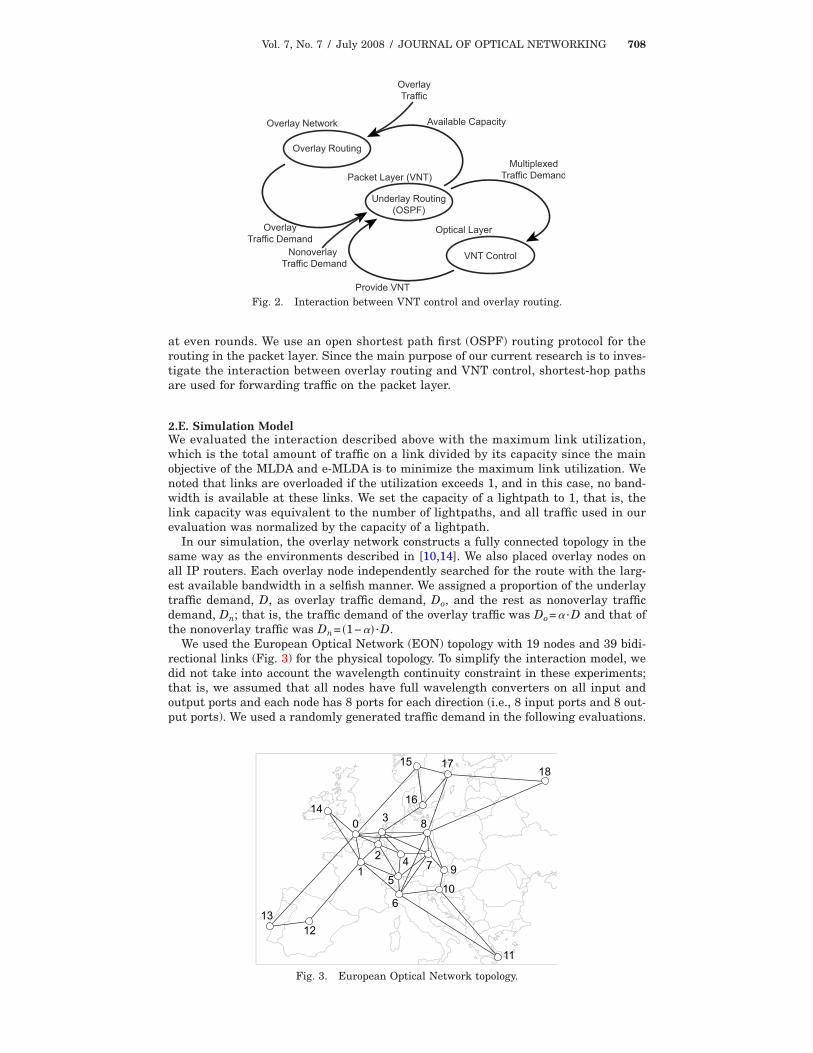
2.D. Interaction between Overlay Routing and Virtual Network Topology ControlA model for evaluating an interaction between overlay routing and packet layer TEwas introduced in [12]. That model consists of an overlay layer and a packet layer. Inthis paper, we introduce an optical layer to that model and evaluate the interactionbetween overlay routing and VNT control through the packet layer. Figure 2 showsour model. When the overlay network switches routes, the overlay traffic demandchanges. In response to this traffic change, VNT control reconfigures its VNT. Thisreconfiguration updates the available bandwidth. The overlay network again switchesto a new route that is superior to the previous one to improve the throughput of theoverlay traffic. In our simulation experiments, each layer performs the above-mentioned actions and updates their status alternately. More specifically, overlayrouting makes its decisions at odd rounds, and VNT control reconfigures its topology
Vol. 7, No. 7 / July 2008 / JOURNAL OF OPTICAL NETWORKING 708
at even rounds. We use an open shortest path first (OSPF) routing protocol for therouting in the packet layer. Since the main purpose of our current research is to inves-tigate the interaction between overlay routing and VNT control, shortest-hop pathsare used for forwarding traffic on the packet layer.
2.E. Simulation ModelWe evaluated the interaction described above with the maximum link utilization,which is the total amount of traffic on a link divided by its capacity since the mainobjective of the MLDA and e-MLDA is to minimize the maximum link utilization. Wenoted that links are overloaded if the utilization exceeds 1, and in this case, no band-width is available at these links. We set the capacity of a lightpath to 1, that is, thelink capacity was equivalent to the number of lightpaths, and all traffic used in ourevaluation was normalized by the capacity of a lightpath.
In our simulation, the overlay network constructs a fully connected topology in thesame way as the environments described in [10,14]. We also placed overlay nodes onall IP routers. Each overlay node independently searched for the route with the larg-est available bandwidth in a selfish manner. We assigned a proportion of the underlaytraffic demand, D, as overlay traffic demand, Do, and the rest as nonoverlay trafficdemand, Dn; that is, the traffic demand of the overlay traffic was Do=� ·D and that ofthe nonoverlay traffic was Dn= �1−�� ·D.
We used the European Optical Network (EON) topology with 19 nodes and 39 bidi-rectional links (Fig. 3) for the physical topology. To simplify the interaction model, wedid not take into account the wavelength continuity constraint in these experiments;that is, we assumed that all nodes have full wavelength converters on all input andoutput ports and each node has 8 ports for each direction (i.e., 8 input ports and 8 out-put ports). We used a randomly generated traffic demand in the following evaluations.
Overlay Network
Packet Layer (VNT)
Optical Layer
Underlay Routing(OSPF)
VNT Control
Overlay Routing
OverlayTraffic
NonoverlayTraffic Demand
OverlayTraffic Demand
Available Capacity
Provide VNT
MultiplexedTraffic Demand
Fig. 2. Interaction between VNT control and overlay routing.
Fig. 3. European Optical Network topology.

Vol. 7, No. 7 / July 2008 / JOURNAL OF OPTICAL NETWORKING 709
2.F. Degradation of Underlay Network PerformanceThe main objective of this subsection is to discuss the influence that overlay routinghas on VNT control. For the purposes of comparison, we used fiber topologies, onwhich lightpaths are statically configured on a single fiber; i.e., the VNT is equivalentto the physical topology, and the configured topology is fixed.
We show the maximum link utilization in Fig. 4. In this figure, the horizontal axisshows the total amount of traffic demand and the vertical axis shows the maximumlink utilization. We observed that the maximum link utilization increases as the pro-portion of the overlay traffic increases in the case of all the VNT control algorithms.With a small amount of overlay traffic ��=0.1�, the maximum link utilization of theMLDA and e-MLDA with overlay traffic is twice as large as the result without overlaytraffic, and a slight degradation is observed in the case of the fiber topology. Althoughthe utilization of the fiber topology gets larger as � increases, the utilization of theMLDA and e-MLDA increases much more severely compared with the result of thefiber topology. This degradation is caused by two factors. One is due to the interactionbetween overlay nodes, and the other is due to the interaction between overlay rout-ing and VNT control. We refer to the interaction between overlay routing and VNTcontrol as the vertical interaction and the interaction between overlay nodes as thehorizontal interaction. Note that only the horizontal interaction appears in the fibertopology since no VNT reconfiguration occurs. In the case of the MLDA and e-MLDA,both the vertical interaction and the horizontal interaction degrade the maximum linkutilization since a VNT is reconfigured in response to the dynamics of overlay routing.By comparing the results of the MLDA or e-MLDA with the results of the fiber topol-ogy, we can see that the vertical interaction has more effect than the horizontal inter-action on the degradation of the maximum link utilization.
2.G. Instability due to Coexistence of Two Routing MechanismsIn subsection 2.D, we showed that the vertical interaction between overlay routingand VNT control degraded the maximum link utilization. In this subsection, we showthat the coexistence of both overlay routing and VNT control leads to VNT controlinstability.
Figure 5 shows that the maximum link utilization depends on the rounds at whichVNT control or overlay routing takes their actions. As we described above, for the all-VNT control method, the maximum link utilization increases if the amount of overlaytraffic is larger than 0.1. Therefore, we set � to 0.2, as shown in this figure, and lookedfor causes of the degradation mentioned above. When a VNT is dynamically controlled(i.e., the MLDA or e-MLDA is applied), the fluctuation of the maximum link utiliza-tion is larger and the cycle of the fluctuation is irregular. That is, the networkbecomes unstable due to the vertical interaction.
0
0.2
0.4
0.6
0.8
1
0 5 10 15 20 25 30 35 40
Maximum
LinkUtilization
Total Traffic Demand
No Overlayα=0.1α=0.2α=0.3
0
0.2
0.4
0.6
0.8
1
0 5 10 15 20 25 30 35 40
Maximum
LinkUtilization
Total Traffic Demand
No Overlayα=0.1α=0.2α=0.3
0
0.2
0.4
0.6
0.8
1
0 5 10 15 20 25 30 35 40
Maximum
LinkUtilization
Total Traffic Demand
No Overlayα=0.1α=0.2α=0.3
(c) e-MLDA(b) MLDA(a) Fiber topology
Fig. 4. Maximum link utilization.
0 100 200 300 4000
0.2
0.4
0.6
0.8
1
1.2
Round
Maximum
LinkUtilization
0 100 200 300 4000
0.2
0.4
0.6
0.8
1
1.2
Round
Maximum
LinkUtilization
0 100 200 300 4000
0.2
0.4
0.6
0.8
1
1.2
Round
Maximum
LinkUtilization
(c) e-MLDA(b) MLDA(a) Fiber topology
Fig. 5. Fluctuation of maximum link utilization (�=0.2, total traffic: 10).

Vol. 7, No. 7 / July 2008 / JOURNAL OF OPTICAL NETWORKING 710
Figure 6 shows the fluctuation of the traffic volume on each link. The error barsshow the maximum and minimum values of the traffic volume in the evaluation, anda point in the bar indicates the average value during the simulation. The horizontalaxis represents the link index that is specified uniquely by the source–destinationpair. For all the VNTs, the traffic volume of almost all links fluctuates. This resultindicates that the horizontal interaction fluctuates the traffic volume on each link.However, the vertical influence is significant in the traffic demands for source–destination pairs on the VNT. Figure 7 shows the maximum, minimum, and averagetraffic demand for each node pair. We also observed that the traffic demand fluctuatesdrastically when the VNT is dynamically controlled via the MLDA or e-MLDA. If over-lay routing and VNT control coexist on the same network, the network state becomesunstable and its performance is drastically degraded. The main reason for this insta-bility is that the VNT control algorithms generate VNTs on the basis of the currenttraffic demand. As shown in Fig. 7, if there is selfish overlay routing in the network,the traffic demand drastically changes. Since the traffic demand is the most importantinput parameter for designing VNTs, traffic demand fluctuation leads to a significantVNT control instability.
3. Improving the Stability of the Network State3.A. Applying HysteresisIn this subsection, we apply hysteresis to VNT control in order to overcome the prob-lem of vertical interaction. Hysteresis is the property of systems that do not immedi-ately react to forces applied to them. This property is often used to avoid routing fluc-tuation [10,16,23].
As discussed in Section 2, the traffic demand heavily fluctuates in the case thatoverlay routing and VNT control coexist. Because the traffic demand is the inputparameter of the VNT control algorithms, applying hysteresis to the traffic demand inorder to suppress the influence imposed by overlay routing is one possible application.We refer to this application as demand hysteresis. Another application is utilizationhysteresis, in which the hysteresis property is used for the maximum link utilization.In the case of utilization hysteresis, the current VNT is kept if the improvement inthe link utilization of the new VNT is less than a particular hysteresis threshold. Weexpect that this leads to a decrease in the number of VNT reconfigurations. Wedescribe each application in more detail in the following subsections.
3.A.1. Demand HysteresisDemand hysteresis works as follows. Let D�t�= �dp�t�� denote the traffic demand fornode pair p at the round t and D�t−2� denote the previously observed traffic demand
0 100 200 3000
0.5
1
1.5
2
Link ID
TotalAmountofTraffic
onLink
0 100 200 3000
0.5
1
1.5
2
Link ID
TotalAmountofTraffic
onLink
(c) e-MLDA(b) MLDA(a) Fiber topology
0 100 200 3000
0.5
1
1.5
2
Link ID
TotalAmountofTraffic
onLink
Fig. 6. Traffic volume on each link (�=0.2, total traffic: 10).
0 100 200 3000
0.5
1
1.5
2
Node Pair ID
Traffic
Dem
and
0 100 200 3000
0.5
1
1.5
2
Node Pair ID
Traffic
Dem
and
0 100 200 3000
0.5
1
1.5
2
Node Pair ID
Traffic
Dem
and
(a) Fiber topology (b) MLDA (c) e-MLDA
Fig. 7. Fluctuation of traffic demand (�=0.2, total traffic: 10).

Vol. 7, No. 7 / July 2008 / JOURNAL OF OPTICAL NETWORKING 711
at round t−2. Note that the overlay network updates its routes at round t−1. We firsttemporarily calculate a VNT Ch�t� using the current traffic demand D�t�. The VNTCh�t� is represented by a set of cp
h�t�, where cph�t� is the capacity between node pair p at
round t. We then compare the traffic demand dp�t� with dp�t−2� for each node pair. Ifthe current traffic demand dp�t� decreases below the ratio of Hl or increases above theratio of Hu, we use cp
h�t� as the new capacity for node pair p. Otherwise, cp�t−2� iskept. More precisely, cp�t�, where C�t�= �cp�t�� is the VNT that is actually used as theIP layer topology, is updated by the following equations:
cp�t� = �cp
h�t� if dp�t� � �1 + Hu� · dp�t�
cph�t� if dp�t� � �1 − Hl� · dp�t�
cp�t − 2� otherwise� .
Demand hysteresis is aimed at stabilizing VNT control by absorbing the fluctuation ofthe traffic demand and reduces unnecessary topology changes. That is, VNT control,to which demand hysteresis is applied, reacts slowly against the heavy fluctuation ofthe traffic demand.
3.A.2. Utilization HysteresisUtilization hysteresis works as follows. Similar to demand hysteresis, we first tempo-rarily calculate the VNT, Ch�t�, using the current traffic demand D�t�. We then calcu-late the expected link utilization Uh�t� using D�t� and Ch�t�. We next compare themaximum link utilization max�Uh�t�� with max�U�t−1��, where U�t−1� is the link uti-lization after the overlay network updates its route. If the improvement in the maxi-mum link utilization is larger than the ratio of H, we use Ch�t� as the new VNT. Uti-lization hysteresis is formulated as follows:
C�t� = Ch�t� if max�Uh�t�� � �1 − H� · max�U�t − 1��
C�t − 2� otherwise .
Utilization hysteresis stabilizes VNT control by keeping the current VNT if there islittle benefit of changing to the new VNT.
3.B. Performance EvaluationWe evaluated demand hysteresis and utilization hysteresis via computer simulations.We used the same simulation model as presented in Section 2, but in this subsection,the MLDA is selected as the VNT control algorithm. In obtaining the following figures,the hysteresis mechanisms are not applied during the first 20 rounds to disregard thetransient phase. Figures 8 and 9 show the fluctuation of the maximum link utilizationwhen utilization hysteresis and demand hysteresis are applied. The vertical axisshows the maximum link utilization, and the horizontal axis shows the rounds. Look-ing at these figures, we observe that the maximum utilization with utilization hyster-esis is stable compared with that without hysteresis. However, in contrast to utiliza-tion hysteresis, the maximum utilization still fluctuates for demand hysteresis. Themain purpose of demand hysteresis is to decrease the number of changed lightpathsby absorbing the fluctuation of the traffic demand caused by overlay routing. However,decreasing the number of changed lightpaths cannot lead to an improvement in thestability of the maximum link utilization. To explain this more clearly, we evaluatedtwo hysteresis applications, and we compared the number of changed lightpaths toinvestigate the efficiency of demand hysteresis. The results of our evaluation areshown in Figs. 10 and 11. We define the number of changed lightpaths at round t as��ce�t�−ce�t−2��. The number of changed lightpaths is decreased by more than 50% inthe case that demand hysteresis is applied. However, demand hysteresis cannot makethe number of changed lightpaths zero since traffic demand still fluctuates due to theselfish behavior of overlay routing. In the case of utilization hysteresis, the number ofchanged lightpaths is always zero if VNT control maintains the current VNT. Theseresults show that the changes in the VNT lead to the fluctuation of the maximum linkutilization, even if those changes are small.
More detailed observations of these figures show that the performance does notstrongly depend on the decision of the hysteresis threshold H in the case that utiliza-tion hysteresis is applied. If a large hysteresis threshold H is used, the VNT controldoes not immediately react against the changes in the network environments. This

traffic: 10).
Vol. 7, No. 7 / July 2008 / JOURNAL OF OPTICAL NETWORKING 712
0 100 200 300 4000
0.5
1
1.5
Round
LinkU
tilization
0 100 200 300 4000
0.5
1
1.5
Round
LinkU
tilization
0 100 200 300 4000
0.5
1
1.5
Round
LinkU
tilization
0 100 200 300 4000
0.5
1
1.5
Round
LinkU
tilization
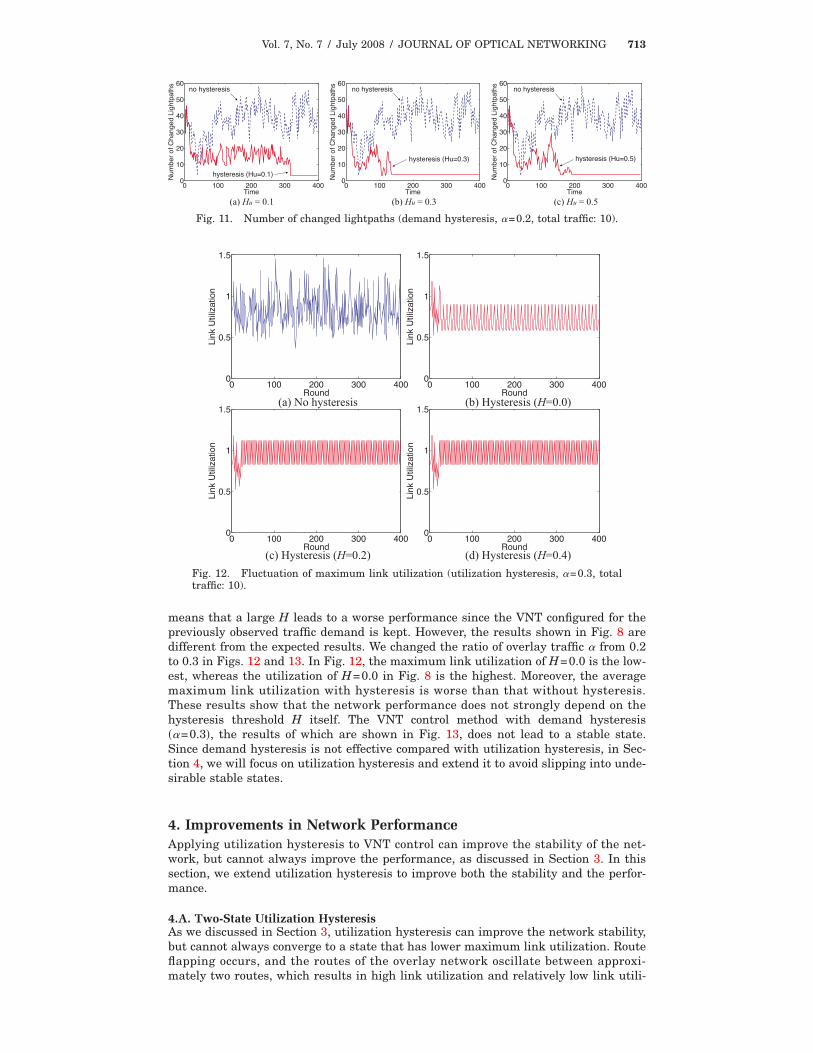
(a) No hysteresis (b) Hysteresis (H=0.0)
(c) Hysteresis (H=0.2) (d) Hysteresis (H=0.4)Fig. 9. Fluctuation of maximum link utilization (demand hysteresis, �=0.2, total traf-fic: 10).
0 100 200 300 4000
10
20
30
40
50
60
Time
Num
berofC
hanged
Lightpaths
0 100 200 300 4000
10
20
30
40
50
60
Time
Num
berofC
hanged
Lightpaths
0 100 200 300 4000
10
20
30
40
50
60
Time
Num
berofC
hanged
Lightpaths
(c) H = 0.4(b) H = 0.2(a) H = 0.0
no hysteresis
hysteresis (H=0.0)
no hysteresis
hysteresis (H=0.2)
no hysteresis
hysteresis (H=0.4)
Fig. 10. Number of changed lightpaths (utilization hysteresis, �=0.2, total traffic: 10).
0 100 200 300 4000
0.5
1
1.5
Round
LinkU
tilization
0 100 200 300 4000
0.5
1
1.5
Round
LinkU
tilization
0 100 200 300 4000
0.5
1
1.5
Round
LinkU
tilization
0 100 200 300 4000
0.5
1
1.5
Round
LinkU
tilization
(a) No hysteresis (b) Hysteresis (H=0.0)
(c) Hysteresis (H=0.2) (d) Hysteresis (H=0.4)Fig. 8. Fluctuation of maximum link utilization (utilization hysteresis, �=0.2, total
Vol. 7, No. 7 / July 2008 / JOURNAL OF OPTICAL NETWORKING 713
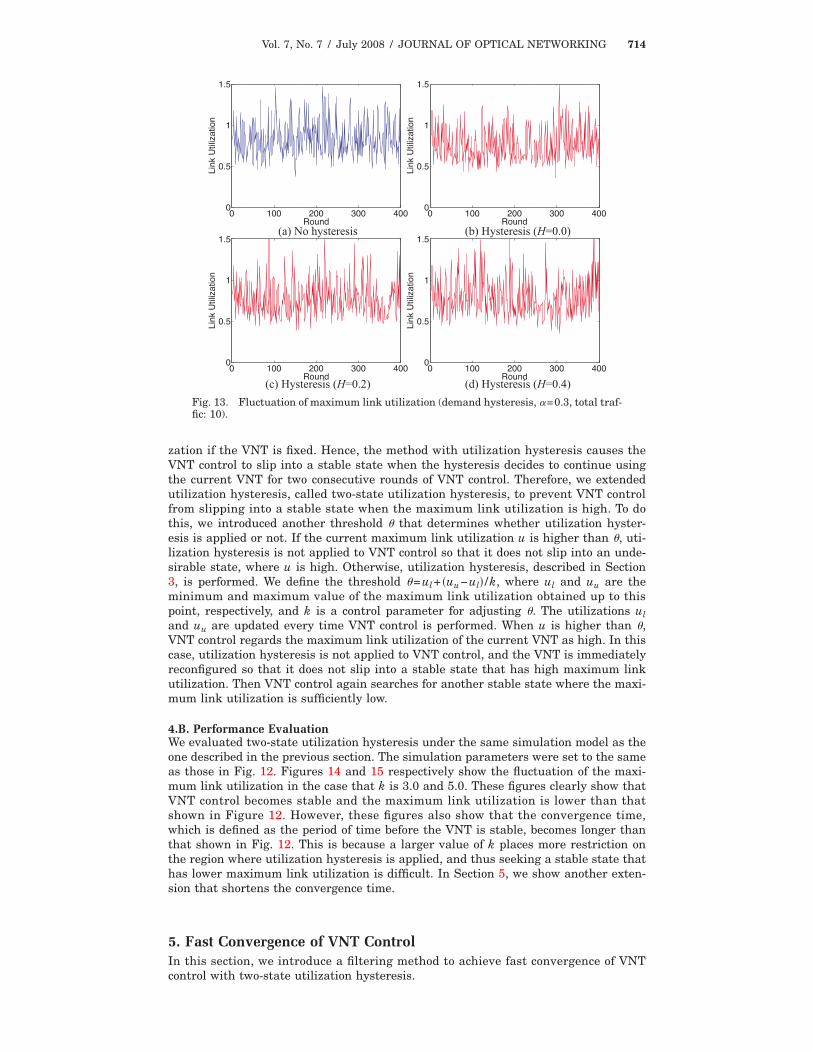
means that a large H leads to a worse performance since the VNT configured for thepreviously observed traffic demand is kept. However, the results shown in Fig. 8 aredifferent from the expected results. We changed the ratio of overlay traffic � from 0.2to 0.3 in Figs. 12 and 13. In Fig. 12, the maximum link utilization of H=0.0 is the low-est, whereas the utilization of H=0.0 in Fig. 8 is the highest. Moreover, the averagemaximum link utilization with hysteresis is worse than that without hysteresis.These results show that the network performance does not strongly depend on thehysteresis threshold H itself. The VNT control method with demand hysteresis��=0.3�, the results of which are shown in Fig. 13, does not lead to a stable state.Since demand hysteresis is not effective compared with utilization hysteresis, in Sec-tion 4, we will focus on utilization hysteresis and extend it to avoid slipping into unde-sirable stable states.
4. Improvements in Network PerformanceApplying utilization hysteresis to VNT control can improve the stability of the net-work, but cannot always improve the performance, as discussed in Section 3. In thissection, we extend utilization hysteresis to improve both the stability and the perfor-mance.
4.A. Two-State Utilization HysteresisAs we discussed in Section 3, utilization hysteresis can improve the network stability,but cannot always converge to a state that has lower maximum link utilization. Routeflapping occurs, and the routes of the overlay network oscillate between approxi-mately two routes, which results in high link utilization and relatively low link utili-
0 100 200 300 4000
0.5
1
1.5
Round
LinkU
tilization
0 100 200 300 4000
0.5
1
1.5
Round
LinkU
tilization
0 100 200 300 4000
0.5
1
1.5
RoundLin
kUtilization
0 100 200 300 4000
0.5
1
1.5
Round
LinkU
tilization
(a) No hysteresis (b) Hysteresis (H=0.0)
(c) Hysteresis (H=0.2) (d) Hysteresis (H=0.4)Fig. 12. Fluctuation of maximum link utilization (utilization hysteresis, �=0.3, totaltraffic: 10).
0 100 200 300 4000
10
20
30
40
50
60
Time
Num
berofC
hanged
Lightpaths
0 100 200 300 4000
10
20
30
40
50
60
Time
Num
berofC
hanged
Lightpaths
0 100 200 300 4000
10
20
30
40
50
60
Time
Num
berofC
hanged
Lightpaths
(c) Hu = 0.5(b) Hu = 0.3(a) Hu = 0.1
no hysteresis
hysteresis (Hu=0.1)
hysteresis (Hu=0.3) hysteresis (Hu=0.5)
no hysteresis no hysteresis
Fig. 11. Number of changed lightpaths (demand hysteresis, �=0.2, total traffic: 10).
Vol. 7, No. 7 / July 2008 / JOURNAL OF OPTICAL NETWORKING 714
zation if the VNT is fixed. Hence, the method with utilization hysteresis causes theVNT control to slip into a stable state when the hysteresis decides to continue usingthe current VNT for two consecutive rounds of VNT control. Therefore, we extendedutilization hysteresis, called two-state utilization hysteresis, to prevent VNT controlfrom slipping into a stable state when the maximum link utilization is high. To dothis, we introduced another threshold � that determines whether utilization hyster-esis is applied or not. If the current maximum link utilization u is higher than �, uti-lization hysteresis is not applied to VNT control so that it does not slip into an unde-sirable state, where u is high. Otherwise, utilization hysteresis, described in Section3, is performed. We define the threshold �=ul+ �uu−ul� /k, where ul and uu are theminimum and maximum value of the maximum link utilization obtained up to thispoint, respectively, and k is a control parameter for adjusting �. The utilizations uland uu are updated every time VNT control is performed. When u is higher than �,VNT control regards the maximum link utilization of the current VNT as high. In thiscase, utilization hysteresis is not applied to VNT control, and the VNT is immediatelyreconfigured so that it does not slip into a stable state that has high maximum linkutilization. Then VNT control again searches for another stable state where the maxi-mum link utilization is sufficiently low.
4.B. Performance EvaluationWe evaluated two-state utilization hysteresis under the same simulation model as theone described in the previous section. The simulation parameters were set to the sameas those in Fig. 12. Figures 14 and 15 respectively show the fluctuation of the maxi-mum link utilization in the case that k is 3.0 and 5.0. These figures clearly show thatVNT control becomes stable and the maximum link utilization is lower than thatshown in Figure 12. However, these figures also show that the convergence time,which is defined as the period of time before the VNT is stable, becomes longer thanthat shown in Fig. 12. This is because a larger value of k places more restriction onthe region where utilization hysteresis is applied, and thus seeking a stable state thathas lower maximum link utilization is difficult. In Section 5, we show another exten-sion that shortens the convergence time.
5. Fast Convergence of VNT ControlIn this section, we introduce a filtering method to achieve fast convergence of VNTcontrol with two-state utilization hysteresis.
0 100 200 300 4000
0.5
1
1.5
Round
LinkU
tilization
0 100 200 300 4000
0.5
1
1.5
Round
LinkU
tilization
0 100 200 300 4000
0.5
1
1.5
Round
LinkU
tilization
0 100 200 300 4000
0.5
1
1.5
RoundLin
kUtilization
(a) No hysteresis (b) Hysteresis (H=0.0)
(c) Hysteresis (H=0.2) (d) Hysteresis (H=0.4)Fig. 13. Fluctuation of maximum link utilization (demand hysteresis, �=0.3, total traf-fic: 10).

Vol. 7, No. 7 / July 2008 / JOURNAL OF OPTICAL NETWORKING 715
5.A. Filtering Method to Achieve Fast ConvergenceAs mentioned in Section 4, the convergence time is longer if the VNT control methodwith two-state utilization hysteresis is used. Since two-state utilization hysteresisrestricts the region in which utilization hysteresis is applied, the chances that VNTcontrol converges to a stable state decrease and therefore the convergence timebecomes longer. When utilization hysteresis is not applied due to the high maximumlink utilization, the VNT is reconfigured in the same way as the VNT control methodwithout utilization hysteresis. These changes in the VNTs lead to network instability.To achieve fast convergence, a mechanism to reduce the changes in VNTs is needed.
To investigate changes in VNTs in more detail, we observed the number of light-paths between node pairs. We selected two node pairs that have a typical tendency,and we show the results of using these node pairs in Fig. 16. The horizontal axis
0 200 400 6000
0.5
1
1.5
Round
LinkU
tilization
0 200 400 6000
0.5
1
1.5
Round
LinkU
tilization
0 200 400 6000
0.5
1
1.5
RoundLin
kUtilization
0 200 400 6000
0.5
1
1.5
Round
LinkU
tilization
(a) No hysteresis (b) Hysteresis (H=0.0)
(c) Hysteresis (H=0.2) (d) Hysteresis (H=0.4)Fig. 14. Fluctuation of maximum link utilization (two-state utilization hysteresis,�=0.3, total traffic: 10, k=3.0).
0 200 400 6000
0.5
1
1.5
Round
LinkU
tilization
0 200 400 6000
0.5
1
1.5
Round
LinkU
tilization
0 200 400 6000
0.5
1
1.5
Round
LinkU
tilization
0 200 400 6000
0.5
1
1.5
Round
LinkU
tilization
(a) No hysteresis (b) Hysteresis (H=0.0)
(c) Hysteresis (H=0.2) (d) Hysteresis (H=0.4)Fig. 15. Fluctuation of maximum link utilization (two-state utilization hysteresis,�=0.3, total traffic: 10, k=5.0).

Vol. 7, No. 7 / July 2008 / JOURNAL OF OPTICAL NETWORKING 716
shows the rounds, and the vertical axis shows the number of lightpaths between anode pair. In Fig. 16(a), one lightpath is configured from node 0 to 1 at most rounds,and the number of lightpaths finally converges to 1; however, only at rounds 60, 160,and 350 are two lightpaths configured. In Fig. 16(b), two lightpaths are configured atalmost all the rounds, and the number of lightpaths finally converges to 2, althoughthe number of lightpaths decreases or increases in a short period. We find theseresults in more than half of all the node pairs. We refer to these small changes in thenumber of lightpaths as spike lightpath changes. These multiple spike lightpathchanges lead to a large change in VNT and the network instability.
To achieve fast convergence of VNT control, we introduced a filtering method toVNT control that reduces the spike lightpath changes. The VNT control method withfiltering remembers the number of lightpaths that the VNT control method has calcu-lated, that is, Ch�t�= �cp
h�t��, described in Section 3. Here, the history of the past Trounds of the VNT control method is maintained �Ch�t−2� ,Ch�t−4� , . . . ,Ch�t−2T��. Ifn lightpaths were configured between a node pair p at more than x% of rounds in thishistory, the number of lightpaths between p is set to n, even if cp
h�t� is different fromn. This is how the filtering method reduces the spike lightpath changes and thusachieves fast convergence. In Subsection 5.B, we show that the filtering methodreduces the convergence time of VNT control.
5.B. Performance EvaluationWe evaluated the filtering method under the same simulation environments as thosedescribed in Section 4. The simulation parameters were set to the same as those in
0 200 400 6000
0.5
1
1.5
Round
LinkU
tilization
0 200 400 6000
0.5
1
1.5
Round
LinkU
tilization
0 200 400 6000
0.5
1
1.5
Round
LinkU
tilization
0 200 400 6000
0.5
1
1.5
Round
LinkU
tilization
(a) No hysteresis (b) Hysteresis (H=0.0)
(c) Hysteresis (H=0.2) (d) Hysteresis (H=0.4)Fig. 17. Fluctuation of maximum link utilization (two-state utilization hysteresis, fil-tering, �=0.3, total traffic: 10, k=5.0).
0 100 200 300 400 5000
1
2
3
4
5
6
Round
Numberoflightpaths
0 100 200 300 400 5000
1
2
3
4
5
6
RoundNumberoflightpaths
(a) Node pair (0, 1) (b) Node pair (10, 9)Fig. 16. Number of lightpaths (�=0.3, total traffic: 10, k=5.0). Node ID in this figure isshown in Fig. 3.

Vol. 7, No. 7 / July 2008 / JOURNAL OF OPTICAL NETWORKING 717
Fig. 15. The convergence time in Fig. 17(b) is 72% shorter than that in Fig. 15(a). Inthe case that H=0.4, the convergence time with the filtering method is also 71%rounds shorter than that without the filtering method. The maximum link utilizationin the stable state is almost the same since the filtering method only reduces the spikelightpath changes, and the generated VNT is almost the same as the VNT generatedby VNT control without the filtering method. These results show that the filteringmethod enhances the feasibility of the real network by reducing the convergence time.
We next evaluated adaptability for changes in the traffic demand in the situationwhen the traffic demand is dynamically changed. To evaluate the adaptability, we ran-domly generated the traffic demand at the same interval of rounds while keeping thesum of the traffic demand constant. We refer to this interval as the changing interval.The other simulation conditions we used are the same as those described in Section 4.Figure 18 shows that the maximum link utilization depends on the rounds for k=3.0.In the case that the changing interval is 40 (i.e., 20 VNT reconfigurations), VNT con-
0
0.2
0.4
0.6
0.8
1
1.2
0 400 800 1200 1600 2000Maximum
linku
tilization
Round0
0.2
0.4
0.6
0.8
1
1.2
0 400 800 1200 1600 2000
Maximum
linku
tilization
Round
0
0.2
0.4
0.6
0.8
1
1.2
0 400 800 1200 1600 2000
Maximum
linku
tilization
Round0
0.2
0.4
0.6
0.8
1
1.2
0 400 800 1200 1600 2000
Maximum
linku
tilization
Round
(a) Changing interval: 400 (b) Changing interval: 200
(c) Changing interval: 100 (d) Changing interval: 40Fig. 18. Fluctuation of maximum link utilization (two-state utilization hysteresis, fil-tering, �=0.2, total traffic: 10, k=3.0).
0
0.2
0.4
0.6
0.8
1
1.2
0 400 800 1200 1600 2000
Maximum
linku
tilization
Round0
0.2
0.4
0.6
0.8
1
1.2
0 400 800 1200 1600 2000
Maximum
linku
tilization
Round
0
0.2
0.4
0.6
0.8
1
1.2
0 400 800 1200 1600 2000
Maximum
linku
tilization
Round0
0.2
0.4
0.6
0.8
1
1.2
0 400 800 1200 1600 2000
Maximum
linku
tilization
Round
(a) Changing interval: 400 (b) Changing interval: 200
(c) Changing interval: 100 (d) Changing interval: 40Fig. 19. Fluctuation of maximum link utilization (two-state utilization hysteresis, fil-tering, �=0.2, total traffic: 10, k=5.0).

Vol. 7, No. 7 / July 2008 / JOURNAL OF OPTICAL NETWORKING 718
trol follows almost all the changes in the traffic demand. However, only at rounds1440 and 1480 does the VNT control not converge until the next traffic change occurs.If the changing interval is longer than 40, VNT control converges, although the maxi-mum link utilization fluctuates for a short period after the traffic change occurs. Wenext evaluated the adaptability for k=5.0. The results of our evaluation are shown inFig. 19. VNT control cannot follow the changes in the traffic demand in the case thatthe changing interval is 40. As we mentioned in Section 4, the region where hysteresisis applied becomes narrow and therefore the convergence time becomes longer if largek is used. This also leads to the degradation of the adaptability for the traffic changes.In the case that the changing interval is 100, VNT control follows almost all thechanges in the traffic demand except at round 200. Although our methods do notalways follow extremely heavy changes in the traffic demand, they follow almost allthe changes. The reason for this is that VNT control with the hysteresis mechanismreconfigures its VNT immediately to adapt to changes in the traffic demand if the per-formance of the VNT is degraded due to changes in the traffic demand.
6. ConclusionIn this paper, we have discussed the selfish behavior of overlay routing on top of aVNT. We revealed that the dynamics of overlay routing cause high fluctuations in traf-fic demand, which lead to a significant VNT control instability. To overcome the traf-fic demand fluctuation and to make VNT control more stable, we applied demand hys-teresis and utilization hysteresis to VNT control. We found that demand hysteresisimproves the stability in terms of the number of changed lightpaths, but does not pro-vide the stable maximum link utilization, especially when the overlay traffic ratio islarge. We also found that utilization hysteresis improves the stability, but cannotalways improve the maximum link utilization. Because of this, we proposed a two-state utilization hysteresis method that applies utilization hysteresis only when themaximum link utilization is sufficiently low. Simulation results show that two-stateutilization hysteresis improves both the stability and the maximum link utilization.However, the convergence time becomes longer. To achieve faster convergence, weintroduced a filtering method to the VNT control method with two-state utilizationhysteresis. Through simulations, we showed that the filtering method reduces theconvergence time. Both the hysteresis method and filtering method aim at improvingthe VNT control stability by reducing unnecessary changes in the VNT. In general,these types of approaches degrade the adaptability for changes in the traffic demandsince the two methods tend to continue using the VNT designed for the old trafficdemand. Although the VNT control method with two-state utilization hysteresis andfiltering do not always follow extremely heavy changes in the traffic demand, it fol-lows almost all the changes.
References1. J. Li, G. Mohan, E. C. Tien, and K. C. Chua, “Dynamic routing with inaccurate link state
information in integrated IP over WDM networks,” Comput. Netw. 46, 829–851 (2004).2. T. Ye, Q. Zeng, Y. Su, L. Leng, W. Wei, Z. Zhang, W. Guo, and Y. Jin, “On-line integrated
routing in dynamic multifiber IP/WDM networks,” IEEE J. Sel. Areas Commun. 22,1681–1691 (2004).
3. S. Arakawa, M. Murata, and H. Miyahara, “Functional partitioning for multi-layersurvivability in IP over WDM networks,” IEICE Trans. Commun. E83-B, 2224–2233 (2000).
4. N. Ghani, S. Dixit, and T.-S. Wang, “On IP-over-WDM integration,” IEEE Commun. Mag.38(3), 72–84 (2000).
5. M. Kodialam and T. V. Lakshman, “Integrated dynamic IP and wavelength routing in IPover WDM networks,” in INFOCOM 2001. Twentieth Annual Joint Conference of the IEEEComputer and Communications Societies (IEEE, 2001), pp. 358–366.
6. J. Comellas, R. Martinez, J. Prat, V. Sales, and G. Junyent, “Integrated IP/WDM routing inGMPLS-based optical networks,” IEEE Network 17(2), 22–27 (2003).
7. Y. Koizumi, S. Arakawa, and M. Murata, “On the integration of IP routing and wavelengthrouting in IP over WDM networks,” Proc. SPIE 6022, 602205 (2005).
8. B. Mukherjee, D. Banerjee, S. Ramamurthy, and A. Mukherjee, “Some principles fordesigning a wide-area WDM optical network,” IEEE/ACM Trans. Netw. 4, 684–696 (1996).
9. R. Ramaswami and K. N. Sivarajan, “Design of logical topologies for wavelength-routedoptical networks,” IEEE J. Sel. Areas Commun. 14, 840–851 (1996).
10. D. G. Andersen, H. Balakrishnan, M. F. Kaashoek, and R. Morris, “Resilient overlaynetworks,” in Proceedings of the Symposium in Operating Systems Principles (Associationfor Computing Machinery, 2001), pp. 131–145.

Vol. 7, No. 7 / July 2008 / JOURNAL OF OPTICAL NETWORKING 719
11. S. Savage, T. Anderson, A. Aggarwal, D. Becker, N. Cardwell, A. Collins, E. Hoffman, J.Snell, A. Vahdat, G. Voelker, and J. Zahorjan, “Detour: a case for informed internet routingand transport,” Nat. Phys. 19, 50–59 (1999).
12. Y. Liu, H. Zhang, W. Gong, and D. Towsley, “On the interaction between overlay routing andunderlay routing,” in INFOCOM 2005. 24th Annual Joint Conference of the IEEE Computerand Communications Societies (IEEE, 2005), pp. 2543–2553.
13. T. Roughgarden and E. Tardos, “How bad is selfish routing?” J. ACM 49, 236–259 (2002).14. L. Qiu, Y. R. Yang, Y. Zhang, and S. Shenker, “On selfish routing in internet-like
environments,” in Proceedings of ACM SIGCOMM (Associate for Computing Machinery,2003), pp. 151–162.
15. W. Jiang, D.-M. Chiu, and J. C. S. Lui, “On the interaction of multiple overlay routing,”Math. Methods Oper. Res. 62, 229–246 (2005).
16. M. Seshadri and R. H. Katz, “Dynamics of simultaneous overlay network routing,” Tech.Rep. UCB/CSD-03–1291 (EECS Department, University of California, Berkeley, 2003).
17. C. S. R. Murthy and M. Gurusamy, WDM Optical Networks Concepts, Design, andAlgorithms (Prentice Hall, 2002).
18. B. Mukherjee, Optical WDM Networks (Springer Verlag, 2006).19. R. Dutta and G. N. Rouskas, “A survey of virtual topology design algorithms for wavelength
routed optical networks,” Visual Geosci. 1, 73–89 (2000).20. Y. Fukushima, S. Arakawa, M. Murata, and H. Miyahara, “Design of logical topology with
effective waveband usage in IP over WDM networks,” Photonic Network Commun. 11,151–161 (2006).
21. J. Katou, S. Arakawa, and M. Murata, “A design method for logical topologies with stablepacket routing in IP over WDM networks,” IEICE Trans. Commun. E86-B, 2350–2357(2003).
22. E. Leonardi, M. Mellia, and M. A. Marsan, “Algorithms for the logical topology design inWDM all-optical networks,” Opt. Networks Mag. 1, 35–46 (2000).
23. R. Gao, C. Dovrolis, and E. W. Zegura, “Avoiding oscillations due to intelligent route controlsystems,” in INFOCOM 2006. 25th IEEE Conference on Computer and Communications(IEEE, 2006), pp. 1–12.