Embed Size (px)
Citation preview

43
Iranian Journal of Pharmaceutical Sciences 2016: 12 (2): 43-60
www.ijps.ir
Original Article
Stability-Indicating UFLC Method For Uncoupling And Estimation Of
Impurities In Clopidogrel, Aspirin And Omeprazole In Their Tablet Dosage
Form Using PDA Detection
Jinesh Bahubali Nagavia*
, Bannimath Gurupadayyab
a, b Department of Pharmaceutical Chemistry, JSS College of Pharmacy, JSS University, Mysore, Karnataka, India
570015
Abstract
In this paper a fast and novel stability-indicating ultra fast LC method for separation and estimation of
impurities in clopidogrel and aspirin in their combined tablet dosage form and omeprazole was developed. The
separation of USP related substances of clopidogrel (A, B and C), aspirin (D), omeprazole (A, B and C) and few other
unknown impurities was detected by using ultra fast liquid chromatography with PDA detection. The maximum
detection was set as follows: 237 nm for aspirin, its impurities and for the impurity C of Clopidogrel and 254 nm for
Clopidogrel and its impurities except for impurity C and 280 nm for omeprazole and its impurities. Phenomenex C8
(250 mm × 4.6 mm, 5µ) was used as a stationary column to separate and analyze the mixture within 11 min with a
programmed gradient elution of 0.01 M phosphate buffer pH 2.0 and acetonitrile. The method was successfully
validated in accordance to the International Conference of Harmonization (ICH) guidelines for clopidogrel and its
impurities, aspirin and its impurity D and omeprazole and its impurities A, B and C. The tablets were exposed to acid,
alkaline, thermal, higher humidity, oxidative and photolytic stress conditions. Samples undergone stressed conditions
were analyzed by the novel proposed method. Separation was satisfactory for all the significant degradation products
from the principal peaks of drug substances and the impurities from each other. The method complies for the peak
purity test for clopidogrel, aspirin and omeprazole in all the samples under stress and showed no co-elution of
degradation products. The method was found to be stable, precise, linear, accurate, sensitive, specific and robust. The
method can be used routinely to test the adulteration in the pharmaceutical formulations of clopidogrel, aspirin, and
omeprazole.
Keywords: Clopidogrel, aspirin, omeprazole, LC, ICH, PDA.

Bahubali Nagavi J, et al / IJPS 2016; 12 (2): 43-60
44
1. Introduction
Registration authorities compulsorily require
the purity testing method, which is an important
part of the method development for a drug
molecule. A validated analytical method for
assuring the maximum safety of drug therapy is
necessary[1, 2]. Liquid chromatography is one of
the most widely applied tools for pharmaceutical
analysis and its latest technical tackle called “ultra
fast liquid chromatography” has a significant
advantage like short analysis time, better
resolution, higher peak capacity and sensitivity,
minimum solvent utilization [3]. Monographs
depicting the HPLC method for related substances
are devoted to clopidogrel and aspirin in European
Pharmacopoeia [4] as well as in United State
Pharmacopoiea5. Stability-indicating [6] and non
stability-indicating [7, 8] assay methods for
simultaneous estimation of aspirin and clopidogrel
bisulphate have been published. Determination of
aspirin Ph. Eur. impurity D4 and omeprazole Ph.
Eur. impurity B 4 in combination was published
under reversed phase HPLC conditions [9].
Omeprazole impurities A, B and C named
according to Ph. Eur.4 were determined by a RP-
HPLC method suitable for both assay of drug
substances and their purity test. UPLC methods
for impurities of aspirin [10] and clopidogrel were
determined. Alternate chromatographic methods
in combination have been focused majorly on the
estimation of the active molecules. Clopidogrel
and omeprazole were analyzed simultaneously by
stability-indicating assay methods. Non-stability-
indicating assay methods for a combination of
clopidogrel, omeprazole and aspirin are also
reported. Clopidogrel Ph. Eur. impurity D4 as its
main acidic degradation product was analyzed by
stability-indicating purity testing methods for
combinations of Clopidogrel with atorvastatin
calcium. As mentioned, combined pharmaceutical
dosage forms containing aspirin or clopidogrel
have been analyzed mostly by assay methods and
purity test methods have been published mainly
for combination with omeprazole. The triple
combination of aspirin, clopidogrel and
omeprazole has so far been analyzed only by
assay methods. The retention ability of the drug
substances in reversed phase HPLC methods
depends on the pH of mobile phase. If a low pH
mobile phase is used, the analytes elute in the
order omeprazole, Clopidogrel and aspirin. If
weakly acidic or neutral conditions are used, the
elution order of Clopidogrel and aspirin is
reversed and, if neutral or basic buffer is used,
aspirin is eluted first, followed by omeprazole and
Clopidogrel leaves the column. Few stability-
indicating methods have been published for this
triple combination. However, no purity data for the
peaks obtained and identification of degradation
products were provided. Spectrophotometric
methods for determination of aspirin, clopidogrel
and omeprazole were also performed The aim of
this work was to develop and validate a stability-
indicating UFLC analytical method for
quantitative purity testing of aspirin, clopidogrel
Corresponding Author: Bahubali Nagavi J, Department of
Pharmaceutical Chemistry, JSS College of Pharmacy, JSS
University, Mysore, Karnataka, India 570015.
Tel: +919738516415
E-Mail: [email protected] Cite this article as: Bahubali Nagavi J, Gurupadayya B,
Stability-Indicating UFLC Method For Uncoupling And
Estimation Of Impurities In Clopidogrel, Aspirin And
Omeprazole In Their Tablet Dosage Form Using PDA
Detection.Iranian Journal of Pharmaceutical Sciences, 2016,
12 (2): 33-42.

Uncoupling and Estimation of Impurities in Clopidogrel, Aspirin, and Omeprazole
45
and omeprazole, as no method for determination
of their impurities in such a combination was
found in the literature. The still unofficial USP
describes only an HPLC column for the
determination of organic impurities of this triple
combination. According to authors learning, no
UFLC method for analysis of this combination of
drug substances and impurities has been published
till date.
2. Material and Methods
2.1. Chemicals
Reference materials of aspirin, clopidogrel,
omeprazole and samples of tablets and placebo
were supplied by Deviz Enterprises (Navi
Mumbai, Maharashtra, India).
Clopidogrel impurities A, (+)-(S)-(2-
Chlorophenyl)[6,7-dihydrothieno [3,2-c]pyridine-
5(4H)-yl]acetic acid hydrochloride, Clopidogrel
impurities B, (RS)-Methyl (2-chlorophenyl)-4,5-
dihydrothieno[2,3-c]pyridine-6(7H)-acetate
hydrochloride and ). Clopidogrel impurities C,
Methyl (2R)-(2-Chlorophenyl) [6, 7-dihydrothieno
[3, 2-c] pyridin-5(4H)-yl] acetate Hydrogen
(according to Ph. Eur. [8]) were purchased from
Sai Traders (Ahmedabad, Gujarat, India).
Aspirin impurity D (according to Ph. Eur. [8]) was
supplied by TLC Pharma Labs (Hyderabad,
Telangana, India).Omeprazole impurities A, B and
C were supplied by Veeprho Pharmaceuticals
(Pune, Maharashtra, India).
Ultra gradient HPLC grade acetonitrile and
HPLC gradient grade methanol were purchased
from Arihant Enterprise (Maharashtra, India). The
mobile phase and solvents were prepared using
potassium dihydrogen ortho phosphate (98.0%),
ortho-phosphoric acid (90%), hydrochloric acid
(37.5%), sodium hydroxide (99.0%) and hydrogen
peroxide (30%); all purchased from Merck
(Darmstadt, Germany) and water for
chromatography was treated by the Milli-Q
system from Merck Millipore (Billerica, USA).
2.2. Chromatographic Conditions
The experiments were performed on the
Shimadzu prominence UFLC system with column
thermostat and PDA detector from Shimadzu
(SPD-M20A). Data were collected and evaluated
by LC Solutions software from Shimadzu. UFLC
column Phenomenex C8 250 mm × 4.6 mm, 5µ
particle size, from Shimadzu (Santa Clara, CA),
thermostatted at 28°C was used for the separation.
The mobile phase was a gradient mixture of
component A (1.15 g/l solution of potassium
dihydrogen ortho phosphate adjusted to pH 2.0
with ortho-phosphoric acid) and component B
(acetonitrile). The flow rate of the mobile phase
was 1.2 mL/min. The final gradient program
[(min)/% B] was 0/5, 5/25, 7.5/50, 10/75, 12.5/50
and 15/5. The sample temperature was set at 25°C
and the injection volume was 10µl. Data for the
impurities of aspirin and impurity C of clopidogrel
were evaluated at a wavelength of 237 nm. Other
Clopidogrel impurities were detected and
evaluated at a wavelength of 254 nm. Based on
the UV spectra of Omeprazole and it’s the
impurities, 280nm was selected as the wavelength
for this method. The PDA detector operated at
sampling rate 20 points per second. A Mark
ultrasonic bath from RCSystems (Bangalore,
Karnataka, India) was used for sample sonication.
Samples were centrifuged with an eppendorf
centrifuge 5810R from Eppendorf AG (Hamburg,
Germany).

Bahubali Nagavi J, et al / IJPS 2016; 12 (2): 43-60
46
2.3. Preparation of solutions
2.3.1. Sample Solvent Preparation
Ten milliliter of ortho-phosphoric acid (90%)
was pipetted into a 1000 mL volumetric flask and
diluted upto 1000 mL with water. This solution
was mixed with acetonitrile and methanol in a
ratio of 50/30/20 (ortho-phosphoric acid
solution/acetonitrile/methanol; v/v/v).
2.3.2. Sample Solution Preparation
Twenty tablets of clopidogrel, aspirin and
omeprazole were thoroughly homogenized. An
amount of 750 mg of the homogenized sample
was weighed into a 50mL amber volumetric flask
and 40mL of sample solvent were added. The
sample was put in an ultrasonic bath and sonicated
for 30 min. During the sonication, the sample was
occasionally shaken and the temperature of the
bath was controlled not to exceed 26°C. After the
sonication, the sample was made up to the mark
with the sample solvent. Then the sample was
stirred for 15 min using a magnetic stirring plate.
After this, the sample was centrifuged for 15 min
at 1.0 × 10⁴ rotations per minute and 10°C. The
supernatant was carefully transferred into a vial
using a pipette tip and crimped. The final
concentrations of the drug substances were 2.5
mg/mL of aspirin, 13.5 mg/mL of Clopidogrel and
0.2 mg/mL of omeprazole calculated with respect
to their contents in the formulated tablets (Table
1).
2.3.3. Standard Solution Preparation
Aspirin, clopidogrel and omeprazole
reference materials were dissolved in the sample
solvent corresponding to the concentration level to
0.5% of the concentration of the sample solution
for all the drug substances.
2.3.4. Placebo Solution Preparation
An amount of 400 mg of homogenized
placebo (mainly composed from microcrystalline
Table 1. Composition of the formulated triple tablets.
Compound Amount (mg)
Concentration
in sample
solvent (mg/ml)
Impurity Limit (%)
lopidogrel 75 13.5
Impurity A 0.3
Impurity B 0.2
Impurity C 0.2
Unidentified Impurity 0.2
Omeprazole 10 0.2
Impurity A 1.0
Impurity B 0.5
Impurity C 0.2
Aspirin 100 2.5 Impurity D 0.2
Unidentified Impurity 0.2

Uncoupling and Estimation of Impurities in Clopidogrel, Aspirin, and Omeprazole
47
cellulose, stearate and anhydrous colloidal silica)
was weighed into a 50 mL amber volumetric flask.
Then the placebo solution was prepared in the
same way as the sample solution.
2.4. Method Validation
The method was validated according to the
ICH Q2 (R1) guideline [12] for clopidogrel
impurities, aspirin impurity D and omeprazole
impurities. The selectivity of the method was
confirmed for all the above mentioned impurities
with addition of the other available clopidogrel
impurities E, F, G and aspirin impurities B. These
impurities of clopidogrel and aspirin were
quantified and labeled as unknown impurities in
the sample solution because they did not exceeded
the limits during preliminary stability studies of
the tablets and therefore it was not fully validated.
2.4.1. Precision
The repeatability of the method was verified
by analyzing the six replicate samples of the
tablets and the % RSD values of the contents of
the detected impurities were calculated. The
intermediate precision was analyzed by injecting
six replicate samples of the same batch of
formulated tablets by a different analyst in a
different laboratory on a different day using a
different column (same type, different batch). The
% RSD values of the impurities content were
calculated for all the replicates (two analysts
together).
2.4.2. Linearity and Accuracy
Spiked samples of tablet powder were
examined for the linearity and accuracy.
Reference materials of Clopidogrel impurity A, B,
and C, omeprazole impurities A, B and C and
aspirin impurity D were dissolved in the sample
solvent and then spiked into the weighed sample
of tablets at five concentration levels, three
samples per level. Sample solution preparation
procedure was followed to prepare the solutions.
The volume of sample solvent was reduced
according to the volume of spikes of impurities.
Unspiked samples of formulated tablets were also
prepared to rectify the amount of impurities which
were originally identified. The linearity and
accuracy for determination of drug substances
were also evaluated for quantification of unknown
impurities. Reference materials of aspirin,
omeprazole and clopidogrel were dissolved in the
sample solvent and spiked into the weighed
sample of placebo at five concentration levels,
three samples per level. These samples were
treated according to the procedure of the placebo
solution preparation (Section 2.3.4). The volume
of sample solvent was reduced by the volume of
spikes of impurities. The linearity was calculated
for each impurity and each drug from the whole
range of concentrations. Samples for evaluation of
the linearity and accuracy were prepared
corresponding to the concentrations of the related
drugs in the sample solution (Section 2.3.2) at the
concentration levels: 0.10–0.50% for Clopidogrel,
0.10–0.30% for omeprazole and aspirin, 0.10–
0.50% for Clopidogrel impurity C, 0.05–1.20%
for omeprazole impurities A and B, 0.10– 0.20%
for omeprazole impurity C and 0.15–0.30% for
impurity D of aspirin. The accuracy was computed
for each impurity and each drug as the percent
recovery of the sum of the impurity/drug that was
added to the sample at three selected levels across
the range of concentrations.

Bahubali Nagavi J, et al / IJPS 2016; 12 (2): 43-60
48
2.4.3. Selectivity
The selectivity of the method was confirmed
by analysis of the sample spiked with all the
available impurities. Impurities were spiked
relative to the concentrations of the related drugs
in the sample solution (Section 2.3.2). Based on
the limit concentrations for each impurity, the
concentration levels were set (Table 1). To
demonstrate the absence of interferences with the
peaks for the spiked sample, chromatograms of
the sample solvent and the placebo solution were
obtained. The stability-indicating property of the
method was tested by performing the forced
degradation study (see Section 2.5). In order to
confirm that there was no interference of any
unknown impurity with the principal peaks of the
drugs, peak purity test was done.
2.4.4. Robustness
The robustness of the method was examined
by varying the chromatographic conditions, such
as the column temperature (±5°C), flow rate (±0.3
mL/min), pH of the buffer (±0.5), volume of
acetonitrile at all points of the gradient (±3%),
concentration of salt in the buffer (±15%) and
particular column used. The spiked sample
prepared in the same way as the sample for
evaluation of the selectivity (Section 2.4.3) was
analyzed and the retention times of all the
impurities and principal peaks were monitored.
2.4.5. Stability of the Sample and Standard
Solutions
One of the sample solutions from the
linearity evaluation (Section 2.4.2) was used for a
stability study of the sample solution. The sample
was stored in an autosampler at 10°C in the dark
as well as at ambient temperature not protected
from the light. It was analyzed after 12, 24, 36 and
48 h. The standard solution was also stored under
the same conditions as the sample solution and
was analyzed after 12, 24, 36, 48 and 72 h. The
absolute differences in the contents of the drug
and the impurities at the beginning and at the end
of the stability study were evaluated.
2.5. Forced Degradation Study
The potential of the method to separate the
drug and their known and unknown degradation
products were examined by the forced degradation
study. The samples of homogenized tablets were
treated under acidic, alkaline, oxidative, thermal,
hydrolytic and photolytic stress conditions. Then
they were prepared according to the procedure
mentioned in Section 2.3.2. An unstressed sample
solution was also prepared as a blank in this study.
Evaluation of the peak purity for clopidogrel,
omeprazole and aspirin was done.
2.5.1. Stress Conditions
For dry thermal stress conditions, the
weighed sample was placed in an oven at 65°C for
18 h. For hydrolytic stress conditions, one
milliliter of water was added to the weighed
sample and then the sample was kept at 65°C for
18 h. For acidic and alkaline stress conditions,
three milliliter of 0.5 M HCl and two milliliter of
0.2 M NaOH were added to the weighed sample
and then the sample was treated at 50°C for 2 h.
To simulate oxidative stress conditions, three
milliliter of 30% H2O2 was added to the weighed
sample and then the sample was kept at 50°C for 2
h. For photolytic stress conditions, the sample was
prepared according to the procedure described in

Uncoupling and Estimation of Impurities in Clopidogrel, Aspirin, and Omeprazole
49
Section 2.3.2 but without using an amber colored
volumetric flask. The sample was exposed to
daylight for 18 h before centrifugation.
3. Results And Discussion
3.1. Method development and optimization
3.1.1. Chromatographic conditions
The UFLC method with reversed phase and
gradient elution of the mobile phase consisting of
acetonitrile and low pH phosphate buffer was
chosen as chromatographic conditions because of
its promising and good peak shapes provided in
the assay methods. The sample for optimization of
the chromatographic conditions was prepared with
50% methanol as a solvent and the sample was
spiked with all the available impurities at
concentration levels corresponding to their limits
(Table 1). Low content of acetonitrile was used to
start the gradient elution to achieve the appropriate
retention of highly polar omeprazole. A successful
separation was achieved on an Phenomenex C8
(250 mm × 4.6 mm, 5µ) column at 23°C with a
linear gradient of 90% of 0.01 M potassium
dihydrogen ortho phosphate buffer pH 2.0 and
10% acetonitrile at the beginning to 30% of the
buffer and 70% acetonitrile after 10 min (flow rate
0.6 mL/min) with injection volume of 10µL.
Satisfactory sensitivity for Clopidogrel and its
impurities was achieved with this injection
volume. Many critical pairs of compounds (i.e.,
omeprazole impurity A and omeprazole;
omeprazole impurities B and A; unknown
omeprazole impurity and aspirin impurity D;
omeprazole impurity C and unknown impurity of
aspirin; aspirin and Clopidogrel impurity B; and
Clopidogrel impurities B and C) were carefully
observed to achieve acceptable resolution. A
larger injection volume (20µL) was used to obtain
maximum sensitivity for clopidogrel and its
impurities. But, the column was seemed to be
overloaded by omeprazole and thus its peaks were
distorted when 20µL were injected. 25% or 30%
of acetonitrile in gradient elution resulted in better
peak shapes for aspirin impurity D. A higher
content of acetonitrile at the start of the gradient
program led to co elution of omeprazole
impurities B and A. Other columns with similar
dimensions, such as phenomenex C8 RRHD
1.8mm and phenomenex C8 2.7 mm were also
tested under these conditions and both of them
yielded similar elution profile to the Phenomenex
C8 4.6mm column but underwent distortion of the
omeprazole peaks. Finally, the column
Phenomenex C8 (250 mm × 4.6 mm, 5µ) was
chosen. In the column with diameter of 4.6 mm, it
was significant to use a flow rate of 0.8 mL/min.
An injection volume of 20µL of the sample
solution could be used with this column as the
omeprazole peaks were no longer distorted, the
column was not overloaded and, despite the higher
column volume, the sensitivity was maintained for
Clopidogrel impurity C. A smoother baseline
compared to that observed with the narrower
columns was also achieved. The gradient program
(slower compared to the original gradient
program) and column temperature were gradually
adjusted to their final values as described in
Section 2.2 and consequently satisfactory
resolution of all the critical pairs of peaks was
achieved (R ≥ 2.0). The detection wavelengths
were set as a compromise between the sensitivity
and selectivity for each drug substance based on
their absorption spectra. Clopidogrel exhibited
strong absorption at 238 nm and 254 nm. The

Bahubali Nagavi J, et al / IJPS 2016; 12 (2): 43-60
50
latter was chosen as an optimal wavelength
because of the better signal to noise ratio, except
for impurity C, which did not absorb at this
wavelength. This impurity was finally evaluated at
237 nm, which was also the optimal wavelength
for aspirin and its impurities.
3.1.2. Sample Preparation
To achieve satisfactory sensitivity for all the
drug substances and impurities, an amount of 652
mg of homogenized tablets was dissolved in a
volume of 50 mL. 50% methanol was used as a
solvent in the beginning. It was observed that
omeprazole is quite unstable in this solvent, as the
area of omeprazole impurity B increased rapidly
(80% of area after 18 h at room temperature).
Also, the recovery of omeprazole impurity C in
50% methanol was not satisfactory. Degradation
of omeprazole to its impurity B was stopped by
using a 2.0% solution of ortho-phosphoric acid
instead of water in 50% methanol. The recovery of
impurity C improved when 75% methanol or 50%
acetonitrile were used as solvents. Thus, the peak
areas of omeprazole and its impurities were
disturbed. Therefore, a final sample solvent
consisting of a 2.0% solution of ortho-phosphoric
acid, 50% acetonitrile and methanol in a volume
ratio of 40:30:30 (v/v/v).
Omeprazole was found to be stable in this sample
solvent for up to 36 h at 10°C (Section 3.2.5) and
satisfactory recovery of omeprazole impurity B
was achieved (Section 3.2.2). Instability of
omeprazole may also have happened because of
not maintaining a constant temperature during
sonication (26°C) and centrifugation (10°C).
When the temperature was not maintained
constant, a significant increase (up to 60%) in the
peak area of omeprazole was found when
compared with the sample prepared under
controlled conditions.
3.2. Method Validation
3.2.1. Precision
The intermediate precision and repeatability
were determined as mentioned in Section 2.4.1.
Impurities present in the sample were determined
as a percent of the amount of related drug in one
tablet against the calibration obtained by injection
of a standard solution. The % RSD of the content
was calculated for one unknown impurity of
aspirin, Clopidogrel impurity C and omeprazole
impurities A, B and C, which were present in the
samples. The % RSD values for five injections
peak area of standard solution were also
calculated. The intermediate precision was
evaluated as the % RSD values for all the results
obtained by the first and second analysts. The
values of RSD ≤0.5% for five injections of the
standard solution and RSDs in the range 0.44–
1.8% for the contents of impurities met the
acceptance criteria [12] and expressed good
repeatability of the method. The % RSD values of
the contents of impurities calculated from all the
replicates were in the range 1.5–10% met the
acceptance criteria [12] and the intermediate
precision of the method was expressed
satisfactorily. (Table 2).

Uncoupling and Estimation of Impurities in Clopidogrel, Aspirin, and Omeprazole
51
3.2.2. Linearity, Accuracy, LOD and LOQ
The linearity and accuracy of the method
were verified by analyzing the spiked samples of
tablets and placebo as described in Section 2.4.2.
Recovery was calculated based on the relative
response factor for each impurity. Based on the
peak areas of the impurities the relative response
factor was calculated as the ratio of the slopes of
the linearity regression lines of the drug substance
and its particular impurity. Data such as RSD of
the area/concentration ratio, regression equation,
correlation coefficient and standard deviation
values of the slope and the intercept are reported
in Table 3 and showed good linearity between the
peak area and the concentration for each
compound, as well as the fact that points in the
residual plots were randomly distributed around
the horizontal axis. The LOD and LOQ values
were determined as the ratios 3.3 × _ /S and 10 ×
_ /S, respectively, where _ is the mean value of
the baseline noise obtained from six
chromatograms of the placebo and S is the slope
of the regression line (based on peak heights)
obtained from the linearity data. The LOD and the
LOQ data are reported in Table 4 and showed
satisfactory sensitivity of the method. The relative
response factors and recovery data are reported in
Table 5 and indicated that the method is accurate,
since the recovery values were in the range 92–
104%. The RSD value of the recovery ≤4%
demonstrated the repeatability of the
determination for all the spiked analytes. LOD,
LOQ, Baseline noise and recovery of Clopidogrel
were evaluated at a detection wavelength of 254
nm because only impurity C from among the
Clopidogrel impurities was detected at 237 nm.
Table 2. Precision data.
Compound Content range (%) Precision RSD (%) Intermediate precision
RSD (%)
Omeprazole – 0.66 –
Clopidogrel – 0.44 –
Aspirin – 0.57 –
Unknown imp. of
aspirin ≤0.05 0.57 2.0
Imp. C (Clopidogrel) ≤0.05 0.89 10
Imp. A (omeprazole) 0.05–0.20 0.45 3.0
Imp. B (omeprazole) ≤0.05 0.71 2.8
Imp. C (omeprazole) 0.20–0.50 1.8 1.5
Content range – the content of the impurity in percent of the related drug amount in one tablet.
Precision RSD – for omeprazole, clopidogrel and aspirin calculated from the peak areas of five injections of the standard
solution; for impurities calculated from the content determined from six replicate samples.
Intermediate precision RSD – for impurities calculated from the content determined from twelve replicate samples (combined
from two analysts). Acceptance criteria.

Bahubali Nagavi J, et al / IJPS 2016; 12 (2): 43-60
52
Table 3. Linearity data.
Compound Concentration
range (%)
Correlation
coefficient
Regression
equation
SD of the
intercept
RSD of
area/concent
ration ratio
(%)
SD of the
slope
Clopidogrel at
237 nm 0.05–0.30 1.000
y =
1.9347*104 x
− 131
211 0.51 89
Imp. A
(Clopidogrel) 0.05–1.00 1.000
y =
9.4960*103 x
+ 34
46 1.5 911
Imp. B
(Clopidogrel) 0.05–1.00 1.000
y =
1.9135*104 x
− 213
102 0.9 132
Imp. C
(Clopidogrel) 0.05–1.14 0.999
y =
6.9387*104 x
– 511
209 3.2 315
Aspirin 0.05–0.30 1.000
y =
1.0349*106 x
+ 1723
412 0.9 295
Imp. D (Aspirin) 0.05–0.41 1.000
y =
4.8862*104 x
− 197
296 1.1 396
Omeprazole 0.05–0.30 0.999
y =
7.1284*104 x
− 304
34 0.93 217
Imp. A
(Omeprazole) 0.10–0.60 0.999
y =
1.9448*104 x
+ 36
37 2.0 166
Imp. B
(Omeprazole) 0.10–0.30 0.999
y =
1.1037*106 x
+ 649
24 2.8 931
Imp. C
(Omeprazole) 0.10–0.50 1.0000
y =
9.3291*104 x
+ 46
47 1.7 159
Regression equation – relationship between concentration and peak area.
Acceptance criteria14. Correlation coefficient >0.98 for impurities and >0.99 for drug substances. RSD of area/concentration ratio
≤ 10.0% for impurities and ≤ 3.0% for drug substances.

Uncoupling and Estimation of Impurities in Clopidogrel, Aspirin, and Omeprazole
53
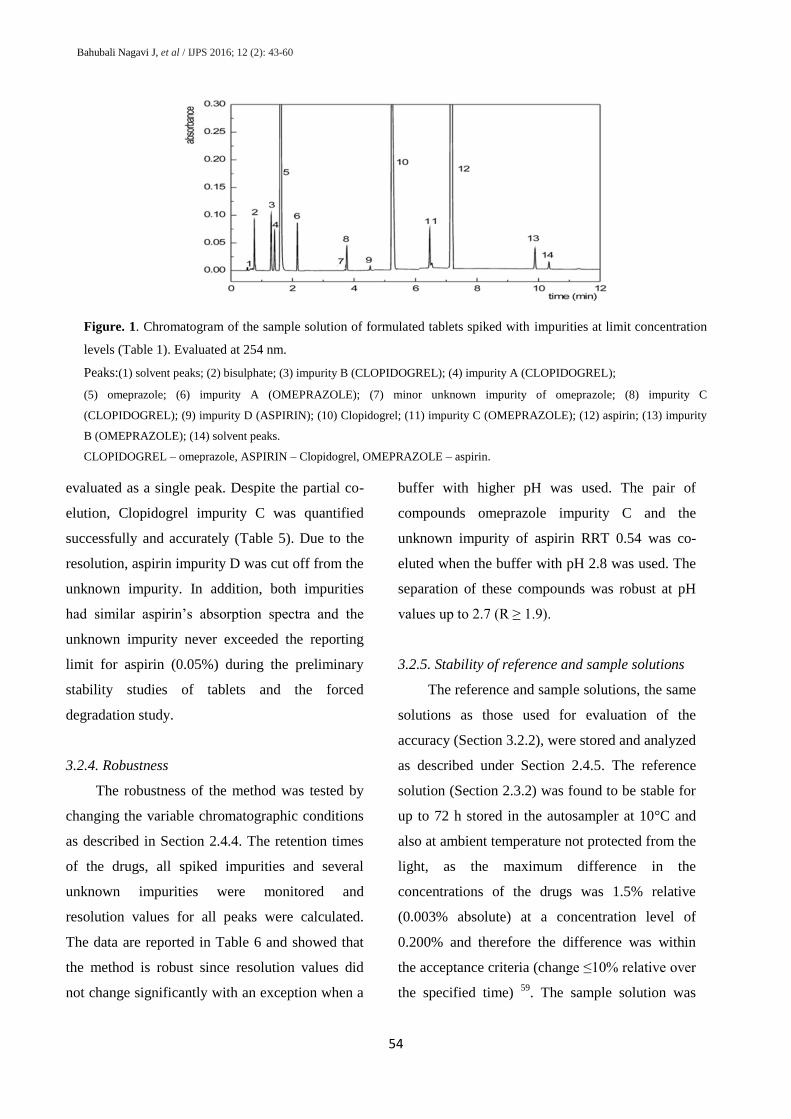
3.2.3. Selectivity
The selectivity of the method was examined
by analyzing a sample spiked considering all the
available impurities at their limit levels (Table 1),
as mentioned in Section 2.4.3. The chromatograms
of the placebo solution and sample solvent were
also obtained to examine the possible
interferences. All the peaks of the sample solvent
and placebo solution were separated from the
peaks of the impurities and drugs in the sample
solution and are designated in the chromatogram
of the spiked sample (Figure 1). Stability-
indicating ability of the method was confirmed by
carrying out the forced degradation study (Section
3.3). The chromatogram of the spiked sample
solution evaluated at 254 nm (all the impurities
were detected) is shown in figure 1. It
demonstrates satisfactory selectivity of the method
as the resolution of all the peaks of interest was
not less than 2.2 with the exception of partial co-
elution of aspirin impurity C with aspirin
unknown D (resolution R= 1.02) and partial co-
elution of Clopidogrel impurity C with an
unknown impurity of aspirin (R= 0.75). The
selectivity of the method was enhanced by using
different detection wavelengths for each drug
substance and its impurities. As a result, the
partial co-elution of Clopidogrel impurity C and
unknown impurity of aspirin visible at 237 nm
was resolved by detection of Clopidogrel
impurities at 254 nm. Aspirin and its impurities
did not absorb at 280 nm and impurity D was
Table 4. LOD and LOQ data.
Compound _(V) LOD
(g/mL)
LOQ
(g/mL) LOD (%) LOQ (%)
Omeprazole 51 0.30 0.102 0.004 0.008
Clopidogrel at
237 nm – – – – –
Clopidogrel at
254 nm 55 0.311 0.097 0.003 0.008
Aspirin 32 0.90 0.114 0.026 0.048
Imp. A
(omeprazole) 45 0.238 0.109 0.006 0.021
Imp. B
(omeprazole) 107 0.054 0.172 0.004 0.041
Imp. C
(omeprazole) 61 0.061 0.119 0.0003 0.011
Imp. C
(Clopidogrel) 65 0.087 0.092 0.021 0.017
Imp. D (aspirin) 49 0.91 0.162 0.044 0.012
– Baseline noise obtained from the chromatogram of the placebo solution at the retention time of the analyte, calculated as the
mean of six injections.
LOD – limit of detection, LOQ– limit of quantification.
Bahubali Nagavi J, et al / IJPS 2016; 12 (2): 43-60
54
evaluated as a single peak. Despite the partial co-
elution, Clopidogrel impurity C was quantified
successfully and accurately (Table 5). Due to the
resolution, aspirin impurity D was cut off from the
unknown impurity. In addition, both impurities
had similar aspirin’s absorption spectra and the
unknown impurity never exceeded the reporting
limit for aspirin (0.05%) during the preliminary
stability studies of tablets and the forced
degradation study.
3.2.4. Robustness
The robustness of the method was tested by
changing the variable chromatographic conditions
as described in Section 2.4.4. The retention times
of the drugs, all spiked impurities and several
unknown impurities were monitored and
resolution values for all peaks were calculated.
The data are reported in Table 6 and showed that
the method is robust since resolution values did
not change significantly with an exception when a
buffer with higher pH was used. The pair of
compounds omeprazole impurity C and the
unknown impurity of aspirin RRT 0.54 was co-
eluted when the buffer with pH 2.8 was used. The
separation of these compounds was robust at pH
values up to 2.7 (R ≥ 1.9).
3.2.5. Stability of reference and sample solutions
The reference and sample solutions, the same
solutions as those used for evaluation of the
accuracy (Section 3.2.2), were stored and analyzed
as described under Section 2.4.5. The reference
solution (Section 2.3.2) was found to be stable for
up to 72 h stored in the autosampler at 10°C and
also at ambient temperature not protected from the
light, as the maximum difference in the
concentrations of the drugs was 1.5% relative
(0.003% absolute) at a concentration level of
0.200% and therefore the difference was within
the acceptance criteria (change ≤10% relative over
the specified time) 59
. The sample solution was
Figure. 1. Chromatogram of the sample solution of formulated tablets spiked with impurities at limit concentration
levels (Table 1). Evaluated at 254 nm.
Peaks:(1) solvent peaks; (2) bisulphate; (3) impurity B (CLOPIDOGREL); (4) impurity A (CLOPIDOGREL);
(5) omeprazole; (6) impurity A (OMEPRAZOLE); (7) minor unknown impurity of omeprazole; (8) impurity C
(CLOPIDOGREL); (9) impurity D (ASPIRIN); (10) Clopidogrel; (11) impurity C (OMEPRAZOLE); (12) aspirin; (13) impurity
B (OMEPRAZOLE); (14) solvent peaks.
CLOPIDOGREL – omeprazole, ASPIRIN – Clopidogrel, OMEPRAZOLE – aspirin.

Uncoupling and Estimation of Impurities in Clopidogrel, Aspirin, and Omeprazole
55
found to be stable for up to 48 h when stored in
Table 5. Relative response factors and accuracy data
Parameter
Clopidogrel Aspirin Omeprazole
Substance Imp.
A
Imp.
B
Imp.
C Substance
Imp.
D Substance
Imp.
A
Imp.
B
Imp.
C
RRF – 1.91 1.31 1.34 – 1.01 – 0.94 1.31 1.34
Level 1
(%) 0.05 0.05 0.05 0.10 0.10 0.10 0.05 0.05 0.05 0.10
Recovery
(%) 97.1 92.1 95.4 99.0 98.3 103.4 102.4 101.4 95.3 99.5
RSD (%) 1.3 0.6 1.3 1.5 2.7 0.8 2.3 0.9 1.0 2.1
95%
confidence
interval
99.5–
101.7
97.1–
109.4
91.7–
97.1
96.6–
103.5 91.7–97.1
96.6–
103.5 91.4–92.2
94.9–
112.5
93.4–
95.4
95.1–
98.3
Level 2
(%) 0.31 2.12 1.04 1.31 0.41 0.73 1.11 0.41 1.42 0.63
Recovery
(%) 100.3 99.2 95.4 100.5 95.7 95.6 95.5 95.0 95.4 95.0
RSD (%) 0.5 0.6 0.4 1.3 1.4 1.7 0.9 1.1 0.7 1.3
95%
confidence
interval
94.6–96.3 94.9–
96.3
94.5–
96.3
94.3–
95.7
98.6–
102.3
94.6–
96.9
99.5–
101.2
99.0–
99.4
94.5–
96.3
94.3–
95.7
Level 3
(%) 0.30 1.20 1.20 1.24 0.30 0.66 0.3 0.41 1.20 1.24
Recovery
(%) 97.1 99.5 96.4 98.6 99.0 97.1 98.9 99.6 96.9 96.5
RSD (%) 1.0 1.2 1.3 0.7 0.4 1.0 1.2 1.4 0.9 0.3
95%
confidence
interval
93.9–99.0 94.7–
95.8
99.5–
100.3
98.9–
100.1 94.8–96.7
94.7–
96.3
97.6–
100.9
94.7–
96.4
94.8–
96.7
94.7–
95.8
RRF – relative response factor, calculated as a ratio of slopes of regression lines of the drug substance and its particular impurity.
Acceptance criteria [14].
0.05 ≤ c < 0.1%; recovery: 50.0–150.0%.
0.1 ≤ c < 0.5%; recovery: 70.0–130.0%.
0.5 ≤ c < 1.0%; recovery: 80.0–120.0%. c ≥ 1.0%; recovery: 90.0–110.0%.

Bahubali Nagavi J, et al / IJPS 2016; 12 (2): 43-60
56
the autosampler at 10°C, as the difference in the
contents of impurities was in the range 0.01–
2.86% relative and therefore within the acceptance
criteria (change ≤10% over the specified time)59
.
The partial instability of omeprazole and its
impurity C resulted in stability of the sample
solution only for up to 36 h at ambient
temperature. After that, the contents of two
unknown omeprazole impurities RRT 1.25 and
RRT 1.57 increased over the reporting limit
(0.05%) and thus did not meet the acceptance
criteria (no new impurity ≥ reporting limit)[12]. In
Table 6.Robustness data expressed as resolution between adjacent peaks.
Parameter Standard
conditions
column % acetonitrile
pH of the buffer
(2.5)
Salt
concentration
in
the buffer
(1.15 g/l)
Flow rate (0.8
mL/min)
Column
temperature
(30°C)
Compound -2% +2% 2.2 2.8 1.04
g/l
1.27
g/l
0.7
mL/
min
0.9
mL/
min
25 ◦
C
35 ◦
C
Clopidogrel
7.9 8.1 7.8 7.9 7.7 8.0 8.0 8.0 8.0 7.6 8.3 7.4
Imp. A (Clopi) 13.9 12.0 14.1 13.2 14.2 14.3 14.1 14.0 13.3 14.9 13.1
Imp. B (Clopi) 2.4 2.4 3.1 1.9 2.4 2.4 2.6 2.5 2.6 2.4 2.7 2.4
Imp. C (Clopi) 6.2 6.1 6.2 6.2 6.2 6.1 6.3 6.4 6.2 6.2 6.4 6.2
Omeprazole 14.4 14.1 14.3 14.5 15.4 13.7 15.4 15.4 12.0 15.5 14.1
Imp. A (Omp) 3.3 4.1 3.5 3.0 3.3 3.2 3.3 3.3 3.3 3.2 3.4 3.2
Imp. B (Omp) 5.9 5.7 5.5 5.5 5.5 5.8 5.7 5.6 5.8 5.4 5.9 5.2
Imp. C (Omp) 26.9 25.7 27.5 24.9 26.4 26.2 26.9 26.7 26.8 26.9 25.3
Aspirin 0.76 0.84 0.84 0.71 0.77 0.76 0.77 0.77 0.87 0.74 0.81 0.67
Imp. D (Asp) 2.1 2.4 3.2 4.1 4.2 1.9 1.8 1.2 2.6 3.5 2.7 3.4
The first integrated peak in the chromatogram. The retention times in minutes are reported. Omp – omeprazole, Asp – aspirin,
Clopi – Clopidogrel.
Uncoupling and Estimation of Impurities in Clopidogrel, Aspirin, and Omeprazole
57
addition, the content of omeprazole impurity C
decreased by 7.5% relative after 36 h at ambient
temperature.That value met the acceptance
criteria[12] but the degradation was significant
compared to the value of the solution stored in the
autosampler at 10 ◦ C.
3.3. Forced Degradation Study
Degraded samples were analyzed to confirm
the stability-indicating property of the method.
The samples were stressed under the acidic,
alkaline, oxidative, thermal, hydrolytic and
photolytic conditions as described in the Section
2.5 and analyzed. Data of analyzed samples were
Table 7.Forced degradation study data.
Stress
condition Omeprazole Clopidogrel Aspirin
Degradation
products Purity
Degradation
products Purity
Degradation
products Purity
Angle Thresh
old Angle
Thresh
old Angle
Threshol
d
Thermal
65°C, 18
h
Imp. B 0.094 0.243 Imp. C 0.043 0.244 Imp. D 0.056 0.379
Hydrolyti
c (1mL H2
O)
65°C, 18
h
Imp. B, C,
A 0.009 0.361
Imp. A
0.081 0.240 - 0.053 0.281
Acidic (3
mL 0.5 M
HCl)
50°C, 2 h
Imp. B, C,
A 0.062 0.269 Imp. C 0.034 0.290 Imp. D 0.021 1.304
Alkaline
(2 mL 0.2
M NaOH)
50°C, 2 h
Imp. B, C 0.278 0.517 Imp. C 0.067 0.221 – 0.477 1.011
Oxidative
(3 mL 3%
H2 O2 )
50°C, 2 h
Imp. B 0.07 0.317 Imp. D 0.031 0.217 Imp D 0.060 0.402
Photolytic
(daylight)
18 h
– 0.030 0.402 Imp. D 0.025 0.418 – 0.038 1.320
The peak is spectrally clear if the purity angle < the purity threshold.

Bahubali Nagavi J, et al / IJPS 2016; 12 (2): 43-60
58
evaluated. Degradation products were assigned to
the proper drug substance on the basis of the UV
spectra and preliminary experiments with
separately stressed active pharmaceutical
ingredients. All the impurities and the detected
degradation products were satisfactory separated
from each other (R ≥ 1.2). The peak purity test
successfully passed for the peaks of clopidogrel,
omeprazole and aspirin in analysis of all the
stressed samples and thus confirmed the spectral
clearness of the principal peaks. Forced
degradation studies data are summarized in Table
7 and represent the stability-indicating ability of
the method. The method was found to be
acceptable for the analysis of stability samples.
3.3.1. Clopidogrel
Clopidogrel degraded mainly to its impurity C.
The content of impurity C increased under all the
stress conditions including day-light. After 24 h of
expose to day-light, the amount of impurity C
increased twice and this resulted in the necessity
of using amber glass for preparation of the sample
solution. Similar to omeprazole, the main
degradation was observed under hydrolytic stress
conditions (Section 3.3.2). Other degradation
products including several unknown impurities
were detected and data including peak purities are
reported in Table 7.
3.3.2. Omeprazole
As mentioned in Sections 3.1.2 and 3.2.5,
omeprazole was found to be a relatively unstable
molecule. Impurity B of omeprazole was found to
be the main degradation product as its content
increased significantly under all the stress
conditions with the exception of daylight
conditions. The maximum degradation was
observed under the hydrolytic stress condition as
the content of impurity B increased 150 times in
comparison with an unstressed sample. The
impurities A and C were also found as degradation
products under the hydrolytic stress conditions, as
their contents increased two-fold and three-fold,
respectively. Degradation of omeprazole under
different conditions and peak purity data are
reported in Table 7.
3.3.3. Aspirin
Aspirin was found to be relatively stable in
comparison with clopidogrel and omeprazole. It
degraded significantly only to impurity D under
thermal, hydrolytic, acidic and oxidative stress
conditions (Table 7). The content of impurity D
increased over the reporting limit (0.05%) only
under the thermal and hydrolytic stress conditions.
Despite the degradation pathway, the limit for
unknown impurities (0.2%) was found to be
suitable for impurity D and thus it did not need to
be validated as described in Section 3.2. No
degradation of aspirin was observed under the
alkaline and photolytic stress conditions. An
increase in the contents of several unknown
impurities was observed under oxidative and
hydrolytic stress conditions. The list of
degradation products and peak purity data are
reported in Table 7.
4. Conclusion
A novel, fast, gradient-reversed phase UFLC
method was developed and validated for
separation of clopidogrel, aspirin, omeprazole and
their impurities in tablet dosage form. The method
successfully separated clopidogrel and related

Uncoupling and Estimation of Impurities in Clopidogrel, Aspirin, and Omeprazole
59
substances A, B and C, omeprazole and related
substances A, B and C and aspirin Ph. Eur. related
substance D and several unknown impurities of all
the drug substances. The method is precise, linear,
accurate, sensitive, specific, robust and stability-
indicating. The method can be used as a routine
quality control method for triple combined dosage
form and also for stability studies.
Acknowledgement
The authors express their sincere thanks to
the Head of the Department, Dept. of
Pharmaceutical Chemistry and The Principal, JSS
College of Pharmacy, JSS University, Mysore for
providing the necessary facilities to carry out the
research work.
References
[1] S. Ahuja, Assuring quality of drugs by monitoring
impurities, Adv. Drug Deliv. Rev. 59 (2007) 3–11.
[2] S. Gorog, Drug safety, drug quality, drug analysis, J.
Pharm. Biomed. Anal. 48 (2008) 247–253.
[3] M. Gumustas, S. Kurbanoglu, B. Uslu, S.A. Oskan,
UPLC versus HPLC on drug analysis: advantageous,
Appl. Valid. Parameters Chromatogr. 76 (2013) 1365–
1427.
[4] European Pharmacopoeia, European Directorate for
the Quality of Medicines & HealthCare, 8.2th ed., 2014,
Strasbourg.
[5] USP 37, The United States Pharmacopeial
Convention, 2014.
[6] C. Krishnaiah, A.R. Reddy, R. Kumar, K. Mukkanti,
Stability -indicating UPLC method for determination of
Aspirin and their degradation products in active
pharmaceutical ingredient and pharmaceutical dosage
forms, J. Pharm. Biomed. Anal. 53 (2010) 483–489.
[7] N.K. Ramadan, H.M. Mohamed, A.A. Moustafa,
Rapid and highly sensitive HPLC and TLC methods for
quantitation of Clopidogrel besilate and aspirin in bulk
powder and in pharmaceutical dosage forms and in human
plasma, Anal. Lett. 43 (2010) 570–581.
[8] D. Ivanovic, A. Malenovic, B. Jancic, M. Madenica,
M. Maskovic, Monitoring of impurity level of aspirin and
omeprazole employing RP-HPLC gradient mode, J. Liq.
Chromatogr. Relat. Technol. 30 (2007) 2879–2890.
[9] USP 37 Second supplement, The United States
Pharmacopeial Convention, 20.10.2014. ICH Q2 (R1)
Validation of Analytical Procedures: Text and
Methodology, 2005.
[10] R. LoBrutto, T. Patel, Method validation, in: Y.
Kazakevich, R. LoBrutto (Eds.), HPLC for
Pharmaceutical Scientists, John Wiley & Sons, Hoboken,
2007, pp. 455–502.
[11] J.B. Crowther, Validation of pharmaceutical test
method, in: S. Ahuja, S. Scypin- sky (Eds.), Handbook of
Modern Pharmaceutical Analysis, Academic Press, San
Diego, 2001, pp. 415–443.
[12] ICH Q2 (R1) Validation of Analytical Procedures:
Text and Methodology, 2005.
[13] R. LoBrutto, T. Patel, Method validation, in: Y.
Kazakevich, R. LoBrutto (Eds.), HPLC for
Pharmaceutical Scientists, John Wiley & Sons, Hoboken,
2007, pp. 455–502.
[14] J.B. Crowther, Validation of pharmaceutical test
method, in: S. Ahuja, S. Scypin- sky (Eds.), Handbook of
Modern Pharmaceutical Analysis, Academic Press, San
Diego, 2001, pp. 415–443.

ONLINE SUBMISSION
www.ijps.ir


