Embed Size (px)
Citation preview

ST. VINCENT & THE GRENADINES
2019
DIGEST OF STATISTICS
Statistical Office
Economic Planning Division
Ministry of Finance Economic Planning & Information
Technology

CONTENTS AREA & CLIMATE .............................................................................................................................................. 1
Table 1.1 - Area of St Vincent and the Grenadines by Census Division ............................................................ 2
Table 1.2 - Mean Temperature and Humidity, 2015 to 2019 ........................................................................... 2
Table 1.3 - Rainfall as Recorded at Selected Weather Stations, 2015 to 2019 ................................................ 3
Table 1.4 - Monthly Rainfall for Selected Weather Stations (mm), 2019 ......................................................... 4
POPULATION & VITAL STATISTICS ................................................................................................................ 5
Table 2.1 - Estimated End of Year Total Population by Census Division, 2010 to 2019 ................................... 6
Table 2.2 - Estimated Total Mid-Year Population, Births, Deaths, Marriages and Divorces, 2015 to 2019 ..... 7
Table 2.3 - Births by Usual Place of Residence of Mother and Sex, 2017 to 2019 ........................................... 8
Table 2.4 - Number of Live Births and Deaths by Sex, 2015 to 2019................................................................ 9
Table 2.5 - Deaths by Usual Place of Residence and Sex, 2017 to 2019 ......................................................... 10
Table 2.6 - Marriage by Age of Bride and Groom, 2019 ................................................................................. 11
HEALTH ............................................................................................................................................................. 12
Table 3.1 - Life Expectancy, 2017 to 2019 ...................................................................................................... 13
Table 3.2 - Number of Malignant Neoplasms/Cancer Cases by Year, 2013 to 2017 ...................................... 13
Table 3.3 - Underlying Cause of Death by Cause Groups, 2015 - 2017 .......................................................... 14
TRANSPORTATION AND COMMUNICATION ................................................................................................... 15
Table 4.1 - Arrivals and Departures of Passengers by Air and Sea, 2015 to 2019 .......................................... 16
Table 4.2 - Arrival of Passengers by Categories, 2018 & 2019 ....................................................................... 17
Table 4.3 - Departure of Passengers by Categories, 2018 & 2019 ................................................................. 17
Table 4.4 - Vehicles Involved in Road Traffic Accidents by Type, 2010 to 2019 ............................................. 18
Table 4.5 - Road Traffic Accidents, 2010 to 2019 ........................................................................................... 18
Table 4.6 - Number of Persons Killed in Road Traffic Accidents by Class of Road User, 2010 to 2019 .......... 19
Table 4.7 - Number of Persons Injured in Road Traffic Accidents by Class of Road User, 2010 to 2019 ....... 19
EDUCATION ....................................................................................................................................................... 20
Table 5.1 - Enrolment of Pupils in Primary School by Age & Sex, 2017 to 2019 ............................................ 21
Table 5.2 - Teachers in Primary Schools, 2010 to 2019 .................................................................................. 21
Table 5.3 - Enrolment of Pupils in Secondary School by Age & Sex, 2017 to 2019 ........................................ 22
Table 5.4 - Teachers in Secondary Schools, 2010 to 2019 .............................................................................. 22

CRIME ................................................................................................................................................................. 23
Table 6.1 - Number of Reported Crimes, 2015 to 2019 ................................................................................. 24
Table 6.2 – Drug Statistics by Number of Arrest, 2015 to 2019 ..................................................................... 25
Table 6.3 – Drugs Destroyed and Seized, 2015 to 2019 ................................................................................. 25
Table 6.4 - Imprisonment by Offence, 2016 to 2019 ...................................................................................... 26
Table 6.5 - Length of Prison Sentences, 2016 to 2019 ................................................................................... 27
Table 6.6 - Number of Prisoners by Age Group and Sex from 2016 to 2019.................................................. 28
TRAVEL & TOURISM ........................................................................................................................................ 29
Table 7.1 - Visitor Air Arrivals by Country of Residence and Purpose of Visit – 2019P ................................... 30
Table 7.2 - Total Visitor Arrivals by First Port of Entry, 2015 to 2019 ............................................................ 31
Table 7.3 - Visitor Arrivals by Visitor Type, 2015 to 2019 ............................................................................... 31
LABOUR ............................................................................................................................................................. 32
Table 8.1 - Labour Force Participation (LFP) Rate by Age Group and Sex, 2017..................................... 33
Figure 8.1- Labour Force Participation (LFP) Rate by Age and Sex, 2017 ...................................................... 33
The ECONOMY .................................................................................................................................................. 34
Table 9.1 - GDP by Economic Activity in Current Prices, 2015 to 2018, EC$’ Million ..................................... 35
Table 9.2 - Consumer Price Index, 2015 to 2019 ........................................................................................... 36
HOUSING ............................................................................................................................................................ 37
Table 10.1 - Application for Planning Permission Building Works, 2019 ........................................................ 38
Table 10.2 - Applications for Planning Permission Sub-division of Land, 2019 .............................................. 39
TRADE................................................................................................................................................................ 40
Table 11.1 - Balance of Visible Trade, 2010 to 2019, EC$’ Million ................................................................. 41
Table 11.2 - Value of Import by SITC Section, 2015 to 2019, EC$’ Million ..................................................... 42
Table 11.3 - Value of Domestic Export by SITC Sections, 2015 to 2019, EC$’ Million .................................... 43
Table 11.4 - Imports from OECS/CARICOM Countries, 2015 to 2019, EC$’ 000 ............................................ 44
Table 11.5 - Domestic Exports to OECS/CARICOM Countries, 2015 to 2019, EC$’ 000 ................................. 45
ELECTORAL STATISTICS ................................................................................................................................ 46
Table 12.1 - Summary Results for General Elections, December 7th 2005 ..................................................... 47
Table 12.2 - Summary Results for General Elections, December 13th 2010 ................................................... 48
Table 12.3 - Summary Results for General Elections, December 9th 2015 ..................................................... 49

Symbols
. Data not available for any reference period
.. Data not available for specific reference period
... Not applicable
R Revised
P Preliminary
Est. Estimated
0 True zero or value rounded to 0

1
AREA & CLIMATE
1
2
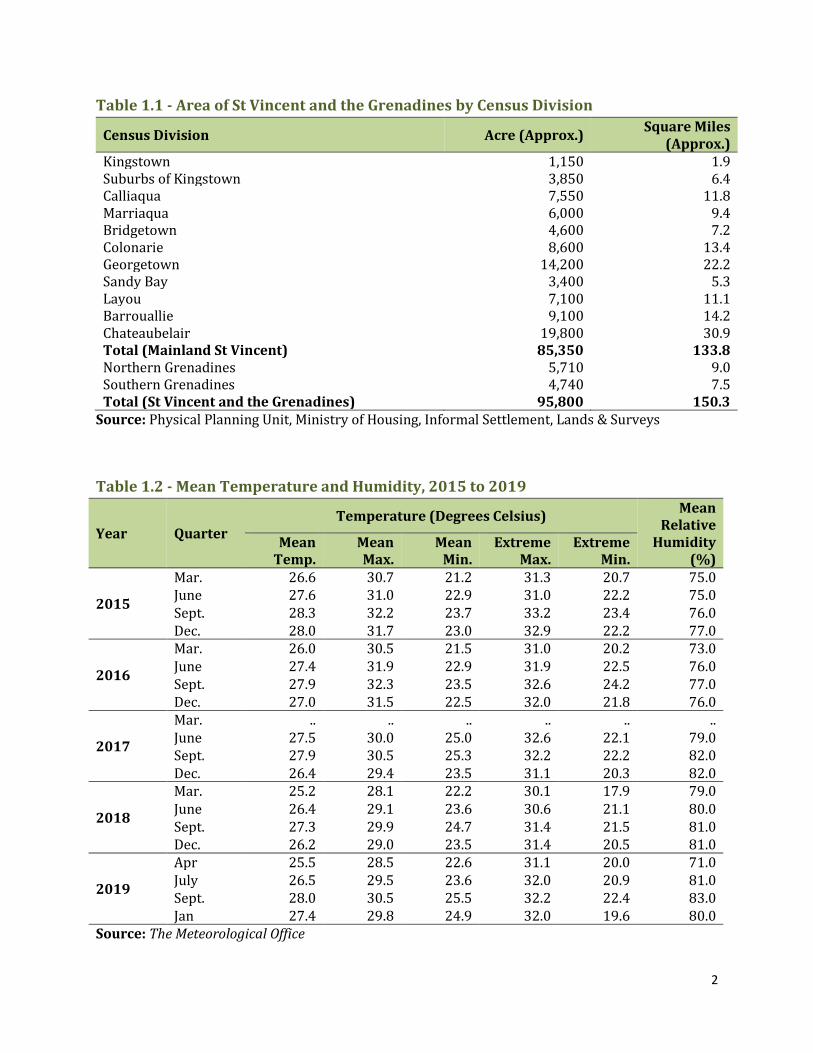
Table 1.1 - Area of St Vincent and the Grenadines by Census Division
Census Division Acre (Approx.) Square Miles
(Approx.) Kingstown 1,150 1.9 Suburbs of Kingstown 3,850 6.4 Calliaqua 7,550 11.8 Marriaqua 6,000 9.4 Bridgetown 4,600 7.2 Colonarie 8,600 13.4 Georgetown 14,200 22.2 Sandy Bay 3,400 5.3 Layou 7,100 11.1 Barrouallie 9,100 14.2 Chateaubelair 19,800 30.9 Total (Mainland St Vincent) 85,350 133.8 Northern Grenadines 5,710 9.0 Southern Grenadines 4,740 7.5 Total (St Vincent and the Grenadines) 95,800 150.3
Source: Physical Planning Unit, Ministry of Housing, Informal Settlement, Lands & Surveys
Table 1.2 - Mean Temperature and Humidity, 2015 to 2019
Year Quarter Temperature (Degrees Celsius)
Mean Relative
Humidity (%)
Mean Temp.
Mean Max.
Mean Min.
Extreme Max.
Extreme Min.
2015
Mar. 26.6 30.7 21.2 31.3 20.7 75.0 June 27.6 31.0 22.9 31.0 22.2 75.0 Sept. 28.3 32.2 23.7 33.2 23.4 76.0 Dec. 28.0 31.7 23.0 32.9 22.2 77.0
2016
Mar. 26.0 30.5 21.5 31.0 20.2 73.0 June 27.4 31.9 22.9 31.9 22.5 76.0 Sept. 27.9 32.3 23.5 32.6 24.2 77.0 Dec. 27.0 31.5 22.5 32.0 21.8 76.0
2017
Mar. .. .. .. .. .. .. June 27.5 30.0 25.0 32.6 22.1 79.0 Sept. 27.9 30.5 25.3 32.2 22.2 82.0 Dec. 26.4 29.4 23.5 31.1 20.3 82.0
2018
Mar. 25.2 28.1 22.2 30.1 17.9 79.0 June 26.4 29.1 23.6 30.6 21.1 80.0 Sept. 27.3 29.9 24.7 31.4 21.5 81.0 Dec. 26.2 29.0 23.5 31.4 20.5 81.0
2019
Apr 25.5 28.5 22.6 31.1 20.0 71.0 July 26.5 29.5 23.6 32.0 20.9 81.0 Sept. 28.0 30.5 25.5 32.2 22.4 83.0 Jan 27.4 29.8 24.9 32.0 19.6 80.0
Source: The Meteorological Office
3
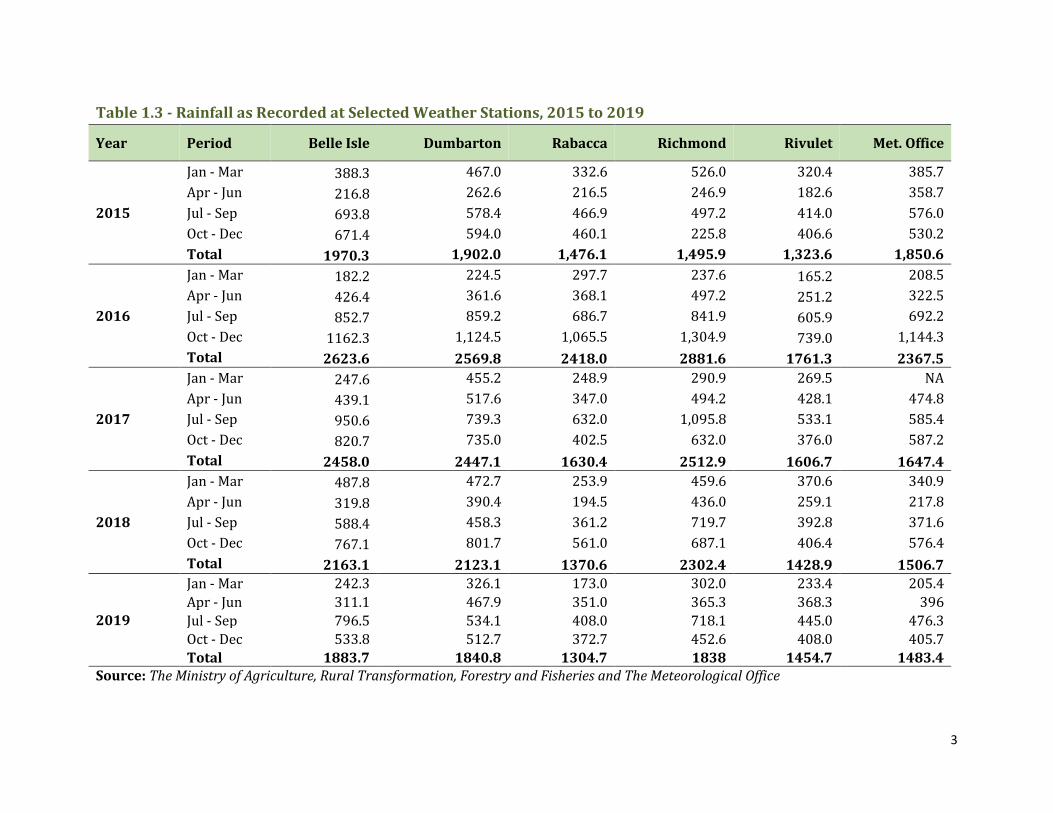
Table 1.3 - Rainfall as Recorded at Selected Weather Stations, 2015 to 2019
Year Period Belle Isle Dumbarton Rabacca Richmond Rivulet Met. Office
2015
Jan - Mar 388.3 467.0 332.6 526.0 320.4 385.7
Apr - Jun 216.8 262.6 216.5 246.9 182.6 358.7
Jul - Sep 693.8 578.4 466.9 497.2 414.0 576.0
Oct - Dec 671.4 594.0 460.1 225.8 406.6 530.2
Total 1970.3 1,902.0 1,476.1 1,495.9 1,323.6 1,850.6
2016
Jan - Mar 182.2 224.5 297.7 237.6 165.2 208.5
Apr - Jun 426.4 361.6 368.1 497.2 251.2 322.5
Jul - Sep 852.7 859.2 686.7 841.9 605.9 692.2
Oct - Dec 1162.3 1,124.5 1,065.5 1,304.9 739.0 1,144.3
Total 2623.6 2569.8 2418.0 2881.6 1761.3 2367.5
2017
Jan - Mar 247.6 455.2 248.9 290.9 269.5 NA
Apr - Jun 439.1 517.6 347.0 494.2 428.1 474.8
Jul - Sep 950.6 739.3 632.0 1,095.8 533.1 585.4
Oct - Dec 820.7 735.0 402.5 632.0 376.0 587.2
Total 2458.0 2447.1 1630.4 2512.9 1606.7 1647.4
2018
Jan - Mar 487.8 472.7 253.9 459.6 370.6 340.9
Apr - Jun 319.8 390.4 194.5 436.0 259.1 217.8
Jul - Sep 588.4 458.3 361.2 719.7 392.8 371.6
Oct - Dec 767.1 801.7 561.0 687.1 406.4 576.4
Total 2163.1 2123.1 1370.6 2302.4 1428.9 1506.7
2019
Jan - Mar 242.3 326.1 173.0 302.0 233.4 205.4
Apr - Jun 311.1 467.9 351.0 365.3 368.3 396
Jul - Sep 796.5 534.1 408.0 718.1 445.0 476.3
Oct - Dec 533.8 512.7 372.7 452.6 408.0 405.7
Total 1883.7 1840.8 1304.7 1838 1454.7 1483.4 Source: The Ministry of Agriculture, Rural Transformation, Forestry and Fisheries and The Meteorological Office

4
Table 1.4 - Monthly Rainfall for Selected Weather Stations (mm), 2019
Stations Belle Isle Richmond
Station Dumbarton Met Office Rivulet Rabacca Monthly
Total Monthly Average
January 88.7 121.5 67.1 24.3 57.5 45.5 380.3 76.1
February 39.5 41.1 37.0 11.4 23.2 19.4 160.2 32.0
March 114.1 139.4 222.0 169.7 152.7 108.1 736.3 147.3
April 65.3 112.8 104.8 79.1 100.9 84.5 468.3 93.7
May 89.4 87.7 156.9 127.9 101.6 152.0 587.6 117.5
June 156.4 164.8 206.2 189.0 165.8 114.5 807.7 161.5
July 276.5 330.3 199.1 174.0 146.1 150.1 1,102.1 220.4
August 253.9 173.5 160.3 164.2 168.3 100.5 856.5 171.3
September 266.1 214.3 174.7 138.1 130.6 157.4 943.1 188.6
October 235.7 139.2 248.1 198.9 178.9 141.4 943.3 188.7
November 175.2 193.3 190.1 136.8 157.1 142.5 858.2 171.6
December 122.9 120.1 74.5 70.0 72.0 88.8 478.3 95.7
Total 1,883.7 1,838.0 1,840.8 1,483.4 1,454.7 1,304.7 8,321.9 1,664.4
Average 157.0 153.2 153.4 123.6 121.2 108.7 693.5 138.7 Source: The Ministry of Agriculture, Rural Transformation, Forestry and Fisheries and The Meteorological Office

5
POPULATION & VITAL
STATISTICS
2
6
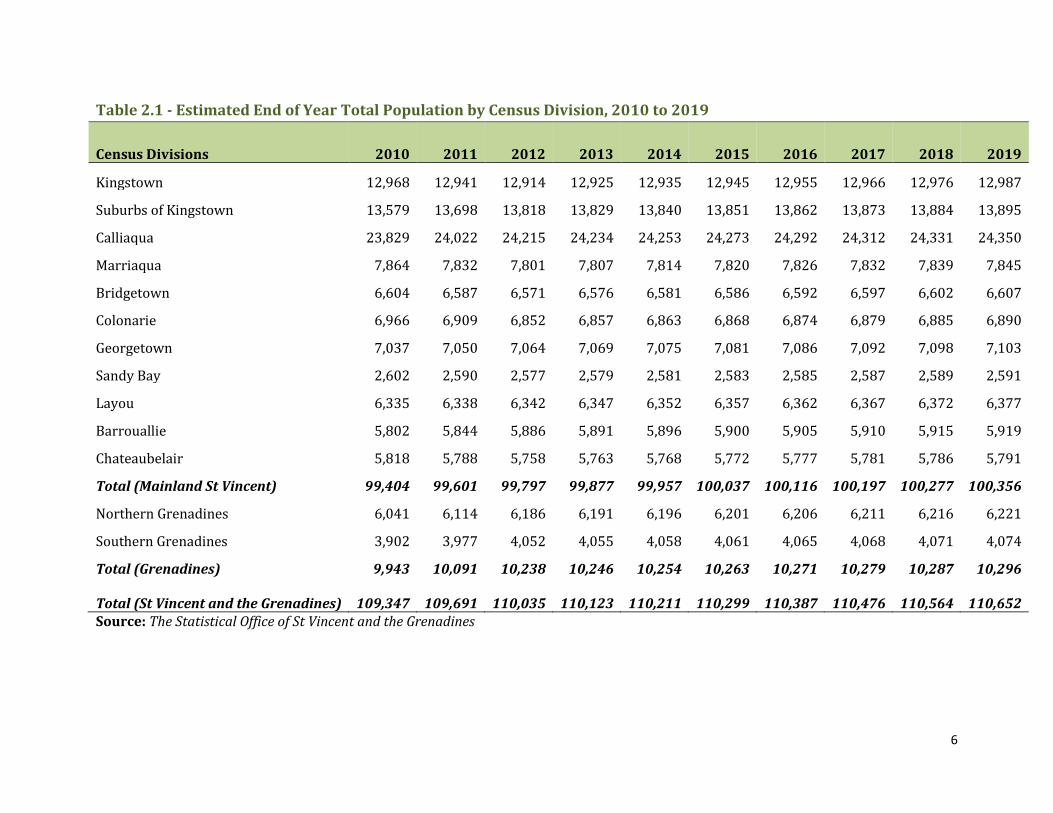
Table 2.1 - Estimated End of Year Total Population by Census Division, 2010 to 2019
Census Divisions 2010 2011 2012 2013 2014 2015 2016 2017 2018 2019
Kingstown 12,968 12,941 12,914 12,925 12,935 12,945 12,955 12,966 12,976 12,987
Suburbs of Kingstown 13,579 13,698 13,818 13,829 13,840 13,851 13,862 13,873 13,884 13,895
Calliaqua 23,829 24,022 24,215 24,234 24,253 24,273 24,292 24,312 24,331 24,350
Marriaqua 7,864 7,832 7,801 7,807 7,814 7,820 7,826 7,832 7,839 7,845
Bridgetown 6,604 6,587 6,571 6,576 6,581 6,586 6,592 6,597 6,602 6,607
Colonarie 6,966 6,909 6,852 6,857 6,863 6,868 6,874 6,879 6,885 6,890
Georgetown 7,037 7,050 7,064 7,069 7,075 7,081 7,086 7,092 7,098 7,103
Sandy Bay 2,602 2,590 2,577 2,579 2,581 2,583 2,585 2,587 2,589 2,591
Layou 6,335 6,338 6,342 6,347 6,352 6,357 6,362 6,367 6,372 6,377
Barrouallie 5,802 5,844 5,886 5,891 5,896 5,900 5,905 5,910 5,915 5,919
Chateaubelair 5,818 5,788 5,758 5,763 5,768 5,772 5,777 5,781 5,786 5,791
Total (Mainland St Vincent) 99,404 99,601 99,797 99,877 99,957 100,037 100,116 100,197 100,277 100,356
Northern Grenadines 6,041 6,114 6,186 6,191 6,196 6,201 6,206 6,211 6,216 6,221
Southern Grenadines 3,902 3,977 4,052 4,055 4,058 4,061 4,065 4,068 4,071 4,074
Total (Grenadines) 9,943 10,091 10,238 10,246 10,254 10,263 10,271 10,279 10,287 10,296
Total (St Vincent and the Grenadines) 109,347 109,691 110,035 110,123 110,211 110,299 110,387 110,476 110,564 110,652 Source: The Statistical Office of St Vincent and the Grenadines

7
Table 2.2 - Estimated Total Mid-Year Population, Births, Deaths, Marriages and Divorces, 2015 to 2019
2015 2016 2017 2018 2019
Total Mid-Year Population 110,255 110,343 110,431 110,520 110,608
Male 56,555 56,600 56,645 56,690 56,735
Female 53,701 53,744 53,787 53,829 53,872
Live Births 1,813 1,729 1,539 1,524 1,426
Male 917 857 796 709 756
Female 896 872 743 815 670
Still Births 36 22 14 18 29
Male 16 12 9 9 13
Female 20 10 3 8 11
Unknown 0 0 2 1 5
Deaths Under 1 year of age 26 25 17 22 14
Male 16 11 8 9 10
Female 10 14 9 13 4
Total Deaths (Residents) 885 930 911 965 1,023
Male 511 507 501 571 576
Female 374 423 410 448 447
Unknown 0 0 0 0 0
Marriages 574 583 536 524 482
Divorces 69 72 41 21 11
Note: Population totals may not add exactly, due to rounding
Source: The Statistical Office of St Vincent and the Grenadines

8
Table 2.3 - Births by Usual Place of Residence of Mother and Sex, 2017 to 2019
Census Division 2017 2018 2019
Male Female Total Male Female Total Male Female Total
Kingstown 114 117 231
101 56 157
75 65 140
Kingstown Suburbs 97 98 195
137 118 255
129 122 251
Calliaqua 150 133 283
142 157 299
154 137 291
Marriaqua 61 60 121
51 62 113
58 41 99
Bridgetown 45 46 91
46 42 88
39 31 70
Colonarie 50 36 86
57 46 103
48 39 87
Georgetown 61 52 113
34 35 69
58 41 99
Sandy Bay 38 31 69
38 24 62
24 27 51
Layou 34 34 68
47 33 80
38 46 84
Barrouallie 41 38 79
54 46 100
55 31 86
Chateaubelair 53 52 105
46 37 83
36 39 75
Northern Grenadines 26 29 55
30 32 62
21 27 48
Southern Grenadines 23 16 39
27 19 46
21 23 44
Not Stated/Unknown 3 1 4
5 2 7
0 1 1
Total 796 743 1,539 815 709 1,524 756 670 1,426
Source: The Statistical Office of St Vincent and the Grenadines

9
Table 2.4 - Number of Live Births and Deaths by Sex, 2015 to 2019
Year / Month Births Deaths
Male Female Both Sexes Male Female Both Sexes
2015 917 896 1,813
511 374 885
2016 857 872 1,729
508 426 934
2017 796 743 1,539
504 413 917
2018 709 815 1,524
517 448 965
January 60 78 138
40 30 70
February 50 53 103
44 27 71
March 60 52 112
54 48 102
April 50 53 103
39 44 83
May 52 54 106
30 36 66
June 46 55 101
39 34 73
July 51 67 118
46 39 85
August 55 88 143
44 37 81
September 72 83 155
51 42 93
October 76 84 160
48 39 87
November 63 69 132
34 38 72
December 74 79 153
48 34 82
2019 756 670 1,426
576 447 1,023
January 72 57 129
53 27 80
February 61 38 99
42 36 78
March 42 61 103
53 32 85
April 62 55 117
51 32 83
May 55 47 102
45 31 76
June 53 42 95
38 34 72
July 76 50 126
51 45 96
August 45 49 94
51 42 93
September 64 74 138
52 40 92
October 69 73 142
48 33 81
November 87 52 139
45 46 91
December 70 72 142 47 49 96
Source: The Statistical Office of St Vincent and the Grenadines

10
Table 2.5 - Deaths by Usual Place of Residence and Sex, 2017 to 2019
Census Division 2017
2018
2019
Male Female Total Male Female Total Male Female Total
Kingstown 78 61 139
75 66 141
81 71 152
Suburbs of Kingstown 52 54 106
72 56 128
71 59 130
Calliaqua 106 86 192
130 104 234
165 92 257
Marriaqua 42 46 88
47 33 80
32 34 66
Bridgetown 35 23 58
23 18 41
28 22 50
Colonarie 30 31 61
26 33 59
28 26 54
Georgetown 31 22 53
32 32 64
34 25 59
Sandy Bay 14 10 24
15 17 32
15 13 28
Layou 27 29 56
24 28 52
19 25 44
Barrouallie 21 13 34
17 20 37
23 12 35
Chateaubelair 26 19 45
28 15 43
34 24 58
Northern Grenadines 28 14 42
16 18 34
23 29 52
Southern Grenadines 11 2 13
12 8 20
23 15 38
Not Stated 0 0 0
0 0 0
0 0 0
Deaths (Residents) 501 410 911
517 448 965
576 447 1,023
Deaths (Foreigners) 3 3 6
0 0 0
0 0 0
Total Deaths 504 413 917 517 448 965 576 447 1,023
Source: The Statistical Office of St Vincent and the Grenadines

11
Table 2.6 - Marriage by Age of Bride and Groom, 2019
Age of Bride
Age of Groom Total
15 - 19 20 - 24 25 - 29 30 - 34 35 - 39 40 - 44 45 - 49 50 - 54 55 - 59 60 - 64 65+ Not
Stated
15 - 19 1 2 2 0 1 0 0 1 0 0 0 0 7
20 - 24 0 7 15 13 3 0 0 0 1 0 0 0 39
25 - 29 0 4 30 16 12 8 5 2 0 0 0 0 77
30 - 34 0 1 12 29 29 11 4 3 2 1 1 0 93
35 - 39 0 1 8 6 25 18 17 6 3 1 0 0 85
40 - 44 0 0 3 8 6 12 12 8 2 4 2 0 57
45 - 49 0 0 0 2 2 10 11 16 3 5 1 0 50
50 - 54 0 0 0 1 1 2 6 8 8 5 4 0 35
55 - 59 0 0 0 0 1 0 0 1 10 4 5 0 21
60 - 64 0 0 0 0 0 0 0 3 1 5 2 0 11
65+ 0 0 0 0 0 0 0 0 0 1 3 0 4
Not Stated
0 0 0 0 0 0 0 0 0 0 0 3 3
Total 1 15 70 75 80 61 55 48 30 26 18 3 482
Source: The Statistical Office of St Vincent and the Grenadines

12
HEALTH
3
13
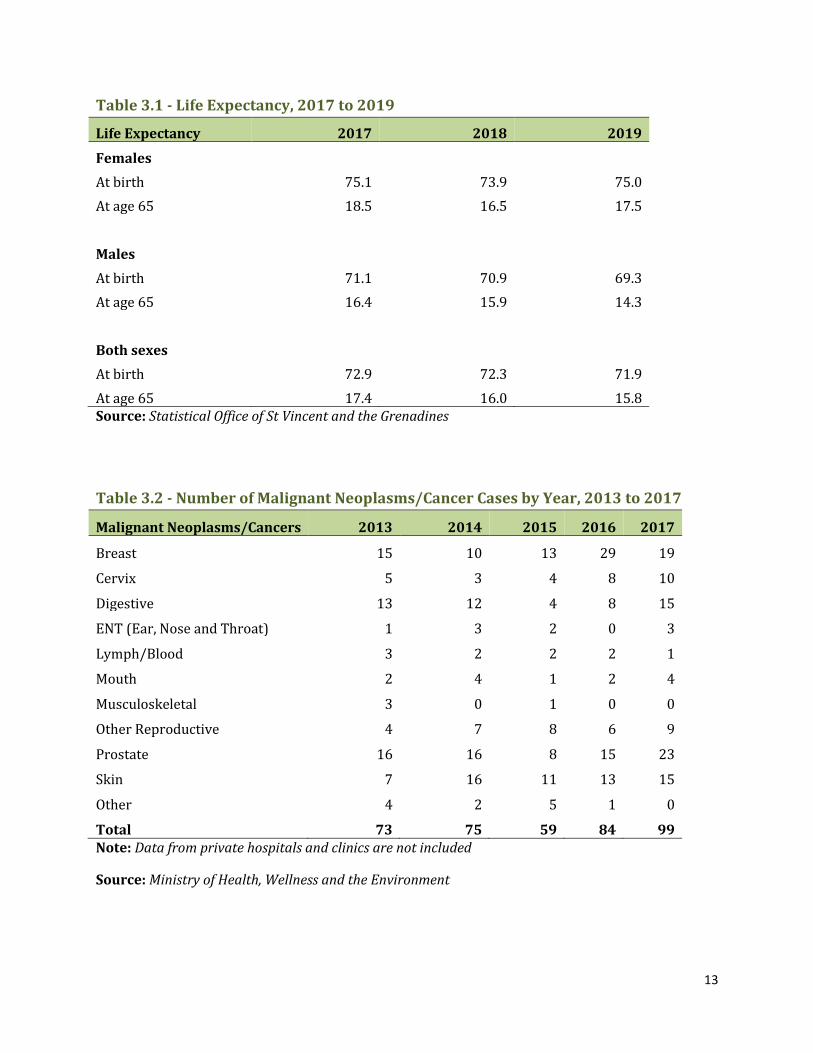
Table 3.1 - Life Expectancy, 2017 to 2019
Life Expectancy 2017 2018 2019
Females
At birth 75.1 73.9 75.0
At age 65 18.5 16.5 17.5
Males
At birth 71.1 70.9 69.3
At age 65 16.4 15.9 14.3
Both sexes
At birth 72.9 72.3 71.9
At age 65 17.4 16.0 15.8 Source: Statistical Office of St Vincent and the Grenadines
Table 3.2 - Number of Malignant Neoplasms/Cancer Cases by Year, 2013 to 2017
Malignant Neoplasms/Cancers 2013 2014 2015 2016 2017
Breast 15 10 13 29 19
Cervix 5 3 4 8 10
Digestive 13 12 4 8 15
ENT (Ear, Nose and Throat) 1 3 2 0 3
Lymph/Blood 3 2 2 2 1
Mouth 2 4 1 2 4
Musculoskeletal 3 0 1 0 0
Other Reproductive 4 7 8 6 9
Prostate 16 16 8 15 23
Skin 7 16 11 13 15
Other 4 2 5 1 0
Total 73 75 59 84 99 Note: Data from private hospitals and clinics are not included
Source: Ministry of Health, Wellness and the Environment

14
Table 3.3 - Underlying Cause of Death by Cause Groups, 2015 - 2017
Broad Groups Underlying Causes of Mortality 2015 2016 2017
Disease of the Circulatory System
Ischemic Heart Disease 92 88 77
Cerebrovascular Disease 80 77 68
Hypertension 52 53 67
Other Forms of Heart Disease 36 40 43
Communicable Diseases
Acute Respiratory Infection 35 12 1
Septicemia 18 17 14
HIV/AIDS 21 18 15
Malignant Neoplasms
Prostate Cancer 52 24 29
Breast 14 16 17
Cervical Cancer 7 7 2
Colon 11 9 10
Stomach 11 6 4
Conditions arising in the Perinatal Period
Respiratory & Cardiovascular Disorders 8 0 1
Prematurity 4 6 5
All Other Diseases
Diabetes 67 86 57
Chronic Lower Respiratory 11 9 6
Disease of the Liver 8 10 9
External Causes
Assaults 25 35 21
Other External Causes Of Injury (e.g. falls) 20 69 23
Transport Accidents 24 8 5 Source: Ministry of Health, Wellness and the Environment

15
TRANSPORTATION AND
COMMUNICATION
4

16
Table 4.1 - Arrivals and Departures of Passengers by Air and Sea, 2015 to 2019
Period Arrivals Departures
Air Sea Total Air Sea Total
2015
Jan - June 53,628 86,574 140,202 56,500 84,253 140,753
Jul - Dec 58,994 49,379 108,373 55,845 47,381 103,226
Total 112,622 135,953 248,575 112,345 131,634 243,979
2016
Jan - June 56,832 94,501 151,333 60,356 93,859 154,215
Jul - Dec 59,723 65,723 125,446 57,409 62,926 120,335
Total 116,555 160,224 276,779 117,765 156,785 274,550
2017
Jan - June 55,005 119,544 174,549 57,827 108,197 166,024
Jul - Dec 114,446 121,441 235,887 56,161 115,685 171,846
Total 169,451 240,985 410,436 113,988 223,882 337,870
2018
Jan - June 57,567 195,142 252,709 61,485 193,217 254,702
Jul - Dec 60,603 99,075 159,678 57,313 93,576 150,889
Total 118,170 294,217 412,387 118,798 286,793 405,591
2019
Jan - June 61,028 196,730 257,758 65,427 191,374 256,801
Jul - Dec 63,041 113,021 176,062 59,665 107,531 167,196
Total 124,069 309,751 433,820 125,092 298,905 423,997
Source: Immigration Department of St Vincent and the Grenadines

17
Table 4.2 - Arrival of Passengers by Categories, 2018 & 2019
Categories 2018
2019
Jan.-Jun. Jul. -Dec. Total Jan.-Jun. Jul. -Dec. Total
Residents 18,227 23,449 41,676
18,854 24,771 43,625
Visitors 80,395 64,143 144,538
83,597 66,415 150,012
Immigrants 0 0 0
0 0 0
In transits 200 83 283
170 320 490
Excursionists 3,190 1,232 4,422
2,429 1,215 3,644
Total 102,012 88,907 190,919 105,050 92,721 197,771 Source: Immigration Department of St Vincent and the Grenadines
Table 4.3 - Departure of Passengers by Categories, 2018 & 2019
Categories 2018
2019
Jan.-Jun. Jul. -Dec. Total
Jan.-Jun. Jul. -Dec. Total
Residents 26,580 24,488 51,068
20,619 24,864 45,483
Visitors 77,810 55,605 133,415
87,245 60,197 147,442
Immigrants 0 0 0
0 0 0
In transits 73 20 93
26 100 126
Excursionists 1 3 4
0 0 0
Total 104,464 80,116 184,580 107,890 85,161 193,051
Source: Immigration Department of St Vincent and the Grenadines

18
Table 4.4 - Vehicles Involved in Road Traffic Accidents by Type, 2010 to 2019
Year Cars Jeeps Trucks Motor Cycles Buses
Pedal Cycle
Other Vehicles
2010 474 364 95 10 168 1 67
2011 541 324 185 22 247 16 73
2012 540 395 185 10 230 5 50
2013 623 351 192 12 196 2 54
2014 392 296 172 5 238 14 132
2015 556 387 177 12 283 6 85
2016 638 354 182 10 276 8 90
2017 .. .. .. .. .. .. ..
2018 .. .. .. .. .. .. ..
2019 .. .. .. .. .. .. .. Source: Traffic Department, Royal St. Vincent and the Grenadines Police Force
Table 4.5 - Road Traffic Accidents, 2010 to 2019
Year Total Number of
Accidents Reported
Number of Accidents with
Injured Persons
Number of Accidents with no Injured Persons
Number of Fatal
Accidents
2010 828 148 676 4
2011 799 176 619 4
2012 807 125 679 4
2013 796 136 655 5
2014 696 121 565 11R
2015 845 176 654 15
2016 938 180 751 7
2017 967 183 779 5
2018 986 184 802 5
2019 833 195 637 3 Source: Traffic Department, Royal St. Vincent and the Grenadines Police Force

19
Table 4.6 - Number of Persons Killed in Road Traffic Accidents by Class of Road User, 2010 to 2019
Year Driver Rider Pillion Rider Pedestrian Passenger Total
2010 1 2 0 0 2 5
2011 1 2 0 1 0 4
2012 0 0 0 4 0 4
2013 1 2 0 3 2 8
2014 1 1 0 5 5 12
2015 3 5 0 2 14 24
2016 2 0 0 2 3 7
2017 2 1 0 2 0 5
2018 2 1 0 2 0 5
2019 2 0 0 3 0 5 Source: Traffic Department, Royal St. Vincent and the Grenadines Police Force
Table 4.7 - Number of Persons Injured in Road Traffic Accidents by Class of Road User, 2010 to 2019
Year Driver Rider Pillion Rider Pedestrian Passenger Total
2010 36 9 2 98 82 227
2011 48 15 1 81 74 219
2012 31 4 0 76 85 196
2013 47 6 1 86 68 208
2014 39 2 0 76 77 194
2015 53 4 0 96 126 279
2016 45 8 0 99 123 275
2017 46 4 0 130 124 304
2018 34 12 0 115 111 272
2019 45 5 0 103 121 274 Source: Traffic Department, Royal St. Vincent and the Grenadines Police Force

20
EDUCATION
5
21
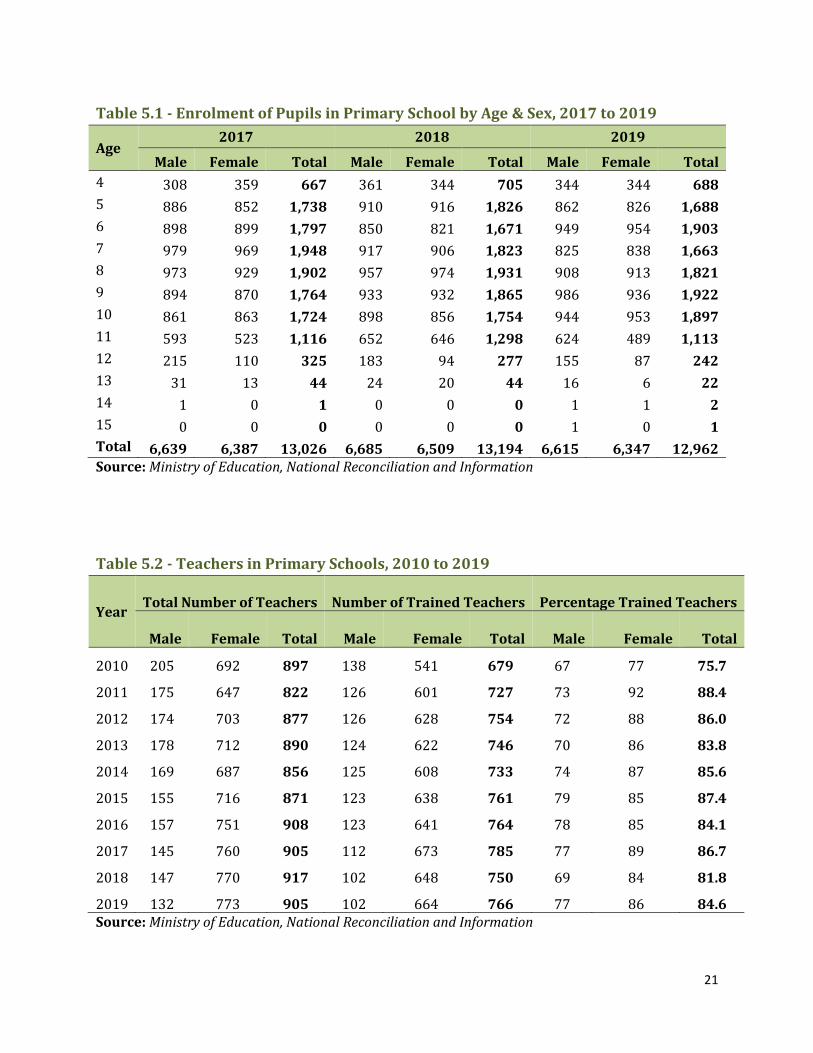
Table 5.1 - Enrolment of Pupils in Primary School by Age & Sex, 2017 to 2019
Age 2017 2018 2019
Male Female Total Male Female Total Male Female Total
4 308 359 667 361 344 705 344 344 688
5 886 852 1,738 910 916 1,826 862 826 1,688
6 898 899 1,797 850 821 1,671 949 954 1,903
7 979 969 1,948 917 906 1,823 825 838 1,663
8 973 929 1,902 957 974 1,931 908 913 1,821
9 894 870 1,764 933 932 1,865 986 936 1,922
10 861 863 1,724 898 856 1,754 944 953 1,897
11 593 523 1,116 652 646 1,298 624 489 1,113
12 215 110 325 183 94 277 155 87 242
13 31 13 44 24 20 44 16 6 22
14 1 0 1 0 0 0 1 1 2
15 0 0 0 0 0 0 1 0 1
Total 6,639 6,387 13,026 6,685 6,509 13,194 6,615 6,347 12,962 Source: Ministry of Education, National Reconciliation and Information
Table 5.2 - Teachers in Primary Schools, 2010 to 2019
Year Total Number of Teachers Number of Trained Teachers Percentage Trained Teachers
Male Female Total Male Female Total Male Female Total
2010 205 692 897 138 541 679 67 77 75.7
2011 175 647 822 126 601 727 73 92 88.4
2012 174 703 877 126 628 754 72 88 86.0
2013 178 712 890 124 622 746 70 86 83.8
2014 169 687 856 125 608 733 74 87 85.6
2015 155 716 871 123 638 761 79 85 87.4
2016 157 751 908 123 641 764 78 85 84.1
2017 145 760 905 112 673 785 77 89 86.7
2018 147 770 917 102 648 750 69 84 81.8
2019 132 773 905 102 664 766 77 86 84.6 Source: Ministry of Education, National Reconciliation and Information

22
Table 5.3 - Enrolment of Pupils in Secondary School by Age & Sex, 2017 to 2019
Age
2017 2018 2019
Male Female Total Male Female Total Male Female Total
Under 11 7 4 11 3 3 6 1 7 8
11 319 301 620 236 366 602 267 364 631
12 714 729 1,443 698 777 1,475 651 764 1,415
13 904 882 1,786 894 830 1,724 877 829 1,706
14 960 926 1,886 917 891 1,808 864 881 1,745
15 938 946 1,884 906 887 1,793 855 857 1,712
16 759 663 1,422 723 661 1,384 715 606 1,321
17 421 333 754 431 284 715 431 249 680
18 170 81 251 168 83 251 152 83 235
19 & Over 38 18 56 34 16 50 35 22 57
Total 5,230 4,883 10,113 5,010 4,798 9,808 4,848 4,662 9,510 Source: Ministry of Education, National Reconciliation and Information
Table 5.4 - Teachers in Secondary Schools, 2010 to 2019
Year Total Number of Teachers Number of Trained Teachers Percentage Trained Teachers
Male Female Total Male Female Total Male Female Total
2010 213 390 603 107 213 320 50.2 54.6 53.1
2011 216 434 650 120 269 389 55.6 62.0 59.8
2012 232 448 680 124 272 396 53.4 60.7 58.2
2013 251 455 706 124 281 405 49.4 61.8 57.4
2014 231 439 670 121 260 381 52.4 59.2 56.9
2015 228 457 685 126 274 400 55.3 60.0 58.4
2016 228 478 706 118 272 390 51.8 56.9 55.2
2017 228 476 704 129 302 431 56.6 63.4 61.2
2018 225 482 707 123 290 413 54.7 60.2 58.4
2019 222 490 712 128 317 445 57.7 64.7 62.5 Source: Ministry of Education, National Reconciliation and Information

23
CRIME
6

24
Table 6.1 - Number of Reported Crimes, 2015 to 2019
Reported Crimes 2015 2016 2017 2018 2019P
Crimes Against Authority 14 7 8 10 9
Crimes Against Penal Code 713 583 635 683 479
Drug Related .. .. .. 299 121
Firearm/Ammunition Crimes 89 109 101 104 72
Other Penal Offences 624 474 534 280 286
Crimes Against Person 1,777 1,930 1,837 2,155 1,960
Crimes of Assault 1,002 1,063 962 1,199 1,044
Crimes of Robbery 86 79 73 140 129
Crime of Sexual Assault 195 250 256 229 257
Crimes of Wounding 441 480 459 499 493
Murders/Manslaughters/Att.. 53 57 87 84 37
Cyber crimes .. .. .. 4 ..
Other Crimes against person .. 1 .. .. ..
Crimes Against Property 3,384 3,193 3,131 3,186 2,906
Crimes of Burglary 968 908 997 1,017 848
Crimes of Theft 1,749 1,653 1,545 1,472 1,422
Other Crimes Against Property 667 632 589 697 636
Miscellaneous 27 23 10 17 7
Total Offences Reported 5,915 5,736 5,621 6,051 5,361 Source: Criminal Investigations Department, Royal St. Vincent and the Grenadines Police Force

25
Table 6.2 – Drug Statistics by Number of Arrest, 2015 to 2019
Year No. of cases Persons Arrested No. of cases
Reported For Cannabis For Cocaine Convicted
2015 466 362 40 223
2016 409 270 35 242
2017 305 212 23 172
2018 407 241 28 233
2019 238 131 19 96
Total 1,825 1,216 145 966
Source: Criminal Investigations Department, Royal St. Vincent and the Grenadines Police Force
Table 6.3 – Drugs Destroyed and Seized, 2015 to 2019
Year No. of cannabis
trees destroyed Amt. of cannabis
seized (Grams) No of cannabis
sticks seized
Amt. of cocaine
seized (Grams)
Number of cocaine
rocks seized
2015 879,967 2,497,630 105 56,463 268
2016 45,190 1,951,403 56 15,283 55
2017 71,086 3,096,412 0 27,205 46
2018 28,206 1,460,970 2 25,629 70
2019 0 1,650,211 0 10,290 9
Total 1,024,449 10,656,626 163 134,869 448
Source: Royal St. Vincent and the Grenadines Police Force, Criminal Investigations Department

26
Table 6.4 - Imprisonment by Offence, 2016 to 2019
Offence 2016 2017 2018 2019
Male Female Total Male Female Total Male Female Total Male Female Total
Disorder, Assault, Indecent Language and Other Offences
107 3 110 72 0 72 71 3 74 95 2 97
Larceny 157 5 162 169 6 175 161 5 166 133 5 138
House Breaking 115 0 115 131 4 135 134 1 135 81 2 83
Criminal Trespass 14 0 14 19 1 20 37 0 37 6 0 6
Robbery with Violence 18 1 19 24 1 25 36 0 36 34 0 34
Wounding 139 1 140 159 5 164 158 3 161 144 4 148
Murder 19 4 23 21 3 24 26 2 28 22 0 22
Dangerous Drugs 145 5 150 90 11 101 155 3 158 79 3 82
Other Offences 251 9 260 257 20 277 182 19 201 204 12 216
Total 965 28 993 942 51 993 960 36 996 798 28 826 Source: Her Majesty’s Prison

27
Table 6.5 - Length of Prison Sentences, 2016 to 2019
Imprisonment
2016 2017 2018 2019
Male Female Total Male Female Total Male Female Total Male Female Total
Under 1 month 14 0 14 13 0 13 4 0 4 7 0 7
1 month and less than 3 months 243 6 249 195 17 212 146 8 154 137 6 143
3 months and less than 6 months 0 0 0 0 0 0 0 0 0 0 . 0
6 months and less than 12 months 189 4 193 145 2 147 127 2 129 90 2 92
12 months and less than 18 months 46 2 48 58 2 60 52 1 53 48 1 49
18 months and over 64 5 69 74 2 76 88 4 92 60 3 63
Life Imprisonment 0 0 0 0 0 0 0 0 0 0 0 0
H.M. Pleasure 0 0 0 0 0 0 0 0 0 0 0 0
Total 556 17 573 485 23 508 417 15 432 342 12 354 Source: Her Majesty’s Prison

28
Table 6.6 - Number of Prisoners by Age Group and Sex from 2016 to 2019
Age Group 2016 2017 2018 2019
Male Female Total Male Female Total Male Female Total Male Female Total
Under 16 0 1 1
0 0 0
0 0 0
0 0 0
16 - 21 105 1 106
120 2 122
109 2 111
83 1 84
22 - 30 306 4 310
306 8 314
326 5 331
267 4 271
31 - 40 336 0 336
302 15 317
309 6 315
272 5 277
41 - 50 125 1 126
124 11 135
123 9 132
92 8 100
51 and over 96 3 99
86 6 92
87 6 93
77 6 83
Unknown 15 0 15
13 0 13
14 0 14
11 0 11
Total 983 10 993 951 42 993 968 28 996 802 24 826 Source: Royal St. Vincent and the Grenadines, Criminal Investigations Department

29
TRAVEL & TOURISM
7
30
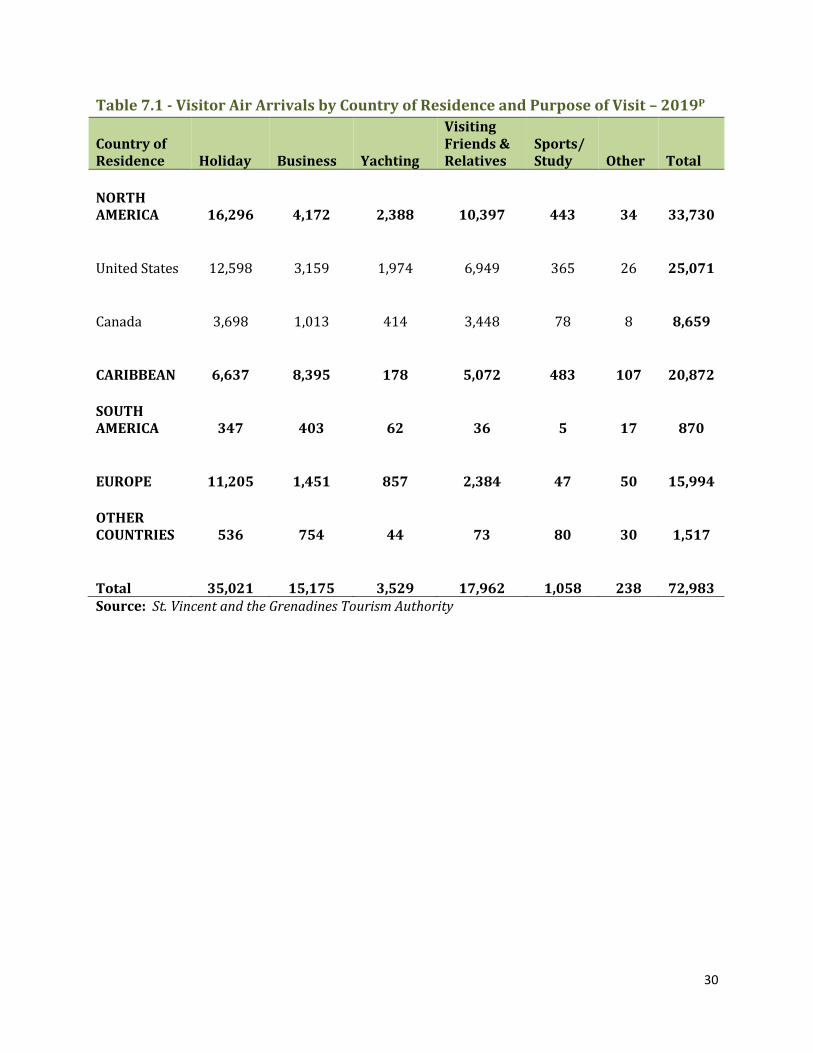
Table 7.1 - Visitor Air Arrivals by Country of Residence and Purpose of Visit – 2019P
Country of Residence Holiday Business Yachting
Visiting Friends & Relatives
Sports/Study Other Total
NORTH AMERICA 16,296 4,172 2,388 10,397 443 34 33,730
United States 12,598 3,159 1,974 6,949 365 26 25,071
Canada 3,698 1,013 414 3,448 78 8 8,659
CARIBBEAN 6,637 8,395 178 5,072 483 107 20,872
SOUTH AMERICA 347 403 62 36 5 17 870
EUROPE 11,205 1,451 857 2,384 47 50 15,994
OTHER COUNTRIES 536 754 44 73 80 30 1,517
Total 35,021 15,175 3,529 17,962 1,058 238 72,983 Source: St. Vincent and the Grenadines Tourism Authority

31
Table 7.2 - Total Visitor Arrivals by First Port of Entry, 2015 to 2019
Port of Entry 2015 2016 2017 2018 2019P
ST. VINCENT
Airport 57,651 60,071 57,812 59,641 55,892
Kingstown 61,176 73,626 133,392 183,162 156,911
BEQUIA
Airport 4,439 4,847 5,458 5,656 4,291
Port Elizabeth 40,954 44,177 58,145 58,024 62,125
MUSTIQUE
Airport 6,865 6,615 6,458 7,225 6,153
Britannia Bay 1,187 1,038 1,257 1,451 855
CANOUAN
Airport 2672 2883 3314 3889 3,370
Charleston Bay 1469 1404 1705 2108 1659
UNION ISLAND
Airport 5,486 5,697 4,928 4,956 4,488
Clifton 24,763 26,872 31,088 29,957 23,820
St Vincent & The Grenadines 206,662 227,230 303,557 356,069 319,564 Source: St. Vincent and the Grenadines Tourism Authority
Table 7.3 - Visitor Arrivals by Visitor Type, 2015 to 2019
Year
Air Sea
Grand Total Stay-
Overs Same-day
Visitors Total Yachts
Cruise ships
Total
2015 75,381 1,732 77,113 47,470 82,079 129,549 206,662
2016 78,751 1,362 80,113 47,575 99,542 147,117 227,230
2017 76,485 1,485 77,970 51,351 174,236 225,587 303,557
2018 80,080 1,287 81,367 56,826 217,876 274,702 356,069
2019 72,983 1,211 74,194 53,581 191,789 245,370 319,564
Total 383,680 7,077 390,757 256,803 765,522 1,022,325 1,413,082
Source: St. Vincent and the Grenadines Tourism Authority

32
LABOUR
8

33
Table 8.1 - Labour Force Participation (LFP) Rate by Age Group and Sex, 2017
Age Group Men Women Both Sexes
15 - 24 (Youth) 52.1 48.3 50.3
25 - 34 90.9 80.6 85.5
35 - 54 92.7 85.5 89.0
55 - 64 73.7 55.1 64.3
65+ (Elderly) 30.9 10.2 20.5
15+ (Working age population) 72.4 63.3 67.8 Source: The Statistical Office of St Vincent and the Grenadines
Figure 8.1- Labour Force Participation (LFP) Rate by Age and Sex, 2017
0
10
20
30
40
50
60
70
80
90
100
15 - 24(Youth)
25 - 34 35 - 54 55 - 64 65+ (Elderly) 15+ (Workingage
population)
Ra
te(%
)
Men Women Both Sexes

34
The ECONOMY
9

35
Table 9.1 - GDP by Economic Activity in Current Prices, 2015 to 2018, EC$’ Million
Sector 2015 2016 2017 R 2018
Agriculture, Hunting & Forestry 118.1 135.3 138.2 142.8
Fishing 9.1 8.7 10.0 15.8
Mining & Quarrying 3.9 3.9 4.0 4.1
Manufacturing 99.5 102.7 107.8 109.8
Electricity & Water 72.9 66.1 67.0 72.9
Construction 138.0 135.7 142.2 141.7
Wholesale & Retail Trade 230.6 233.0 233.7 246.9
Hotels & Restaurants 36.0 33.4 41.2 44.3
Transport, Storage and communications 233.3 247.5 247.4 245.4
Financial Intermediation 123.2 119.3 118.9 120.1
Real Estate, Renting and Business Activities 253.1 261.4 266.7 270.0
Public Administration, Defense & Compulsory Social Security 226.1 225.0 226.8 223.1
Education 102.3 103.0 106.3 107.6
Health and Social Work 55.3 56.4 54.1 57.8
Other community, social & personal services 35.0 31.5 32.6 34.0
Private Households with Employed Persons 4.9 4.6 4.9 4.9
Less FISIM 19.4 20.4 19.5 18.9
Gross Value Added at Basic Prices 1,721.9 1,747.1 1,782.3 1,822.3
GROWTH RATE 3.3 1.5 2.0 2.3
Taxes on products 318.7 344.9 358.0 369.3
Less Subsidies 1.1 1.1 1.1 1.1
GDP at Market Prices 2,039.5 2,090.9 2,139.2 2,190.5
Growth Rate 3.8 2.5 2.3 2.4 Source: The Statistical Office of St. Vincent and the Grenadines

36
Table 9.2 - Consumer Price Index, 2015 to 2019
Year and Month 2015 2016 2017 2018 2019
January 107.5 104.7 106.7 109.6 111.4
February 106.0 104.6 106.4 109.4 110.9
March 105.5 104.8 106.3 109.6 111.0
April 105.6 104.5 107.5 110.4 111.5
May 105.4 105.3 108.0 110.5 111.0
June 105.4 106.4 108.3 110.6 111.6
July 106.3 106.3 108.5 110.7 111.8
August 106.3 106.3 108.4 110.8 111.8
September 105.8 106.4 108.4 110.9 111.5
October 105.4 106.1 108.5 111.0 111.5
November 105.4 106.3 108.8 110.9 111.9
December 105.1 106.1 109.3 110.8 111.3 Source: The Statistical Office of St. Vincent and the Grenadines

37
HOUSING
10

38
Table 10.1 - Application for Planning Permission Building Works, 2019
Census Divisions
Application Gross Floor Gross Land Cost of
Received Area Area Building
(NO) SQ. FT. SQ. FT. Approx. (EC$)
Kingstown 40 82,751 75,599 11,970,012
Suburbs of Kingstown 81 127,662 635,675 11,970,012
Calliaqua 245 781,088 3,007,030 11,970,012
Marriaqua 46 123,303 562,161 18,376,209
Bridgetown 30 69,756 354,805 10,134,596
Colonarie 51 81,878 410,738 13,012,429
Georgetown 43 56,086 379,132 8,562,099
Sandy Bay 7 7,622 35,444 1,175,685
Layou 38 87,221 618,079 28,781,752
Barrouallie 22 56,805 457,832 11,185,840
Chateaubelair 11 16,363 44,355 2,334,900
Grenadines 49 134,531 555,997 11,970,012
Total 663 1,625,066 7,136,849 141,443,556 Source: Physical Planning Unit, Ministry of Housing, Informal Settlement, Lands & Surveys

39
Table 10.2 - Applications for Planning Permission Sub-division of Land, 2019
Location/Census
Application Gross Land Cost Of
Received Area Land
NO SQ.FT. Approx. (EC$)
Kingstown 0 0 0
Suburbs of Kingstown 0 0 0
Calliaqua 3 435,600 175,000
Marriaqua 0 0 0
Bridgetown 1 37,026 0
Colonarie 2 305,548.5 500,000
Georgetown 1 110,642 0
Sandy Bay 0 0 0
Layou 2 118,308 0
Barrouallie 1 61,409 0
Chateaubelair 10 1,068,533.5 675,000
Grenadines 0 0 0
Total 20 2,137,067 1,350,000 Source: Physical Planning Unit, Ministry of Housing, Informal Settlement, Lands & Surveys

40
TRADE
11
41
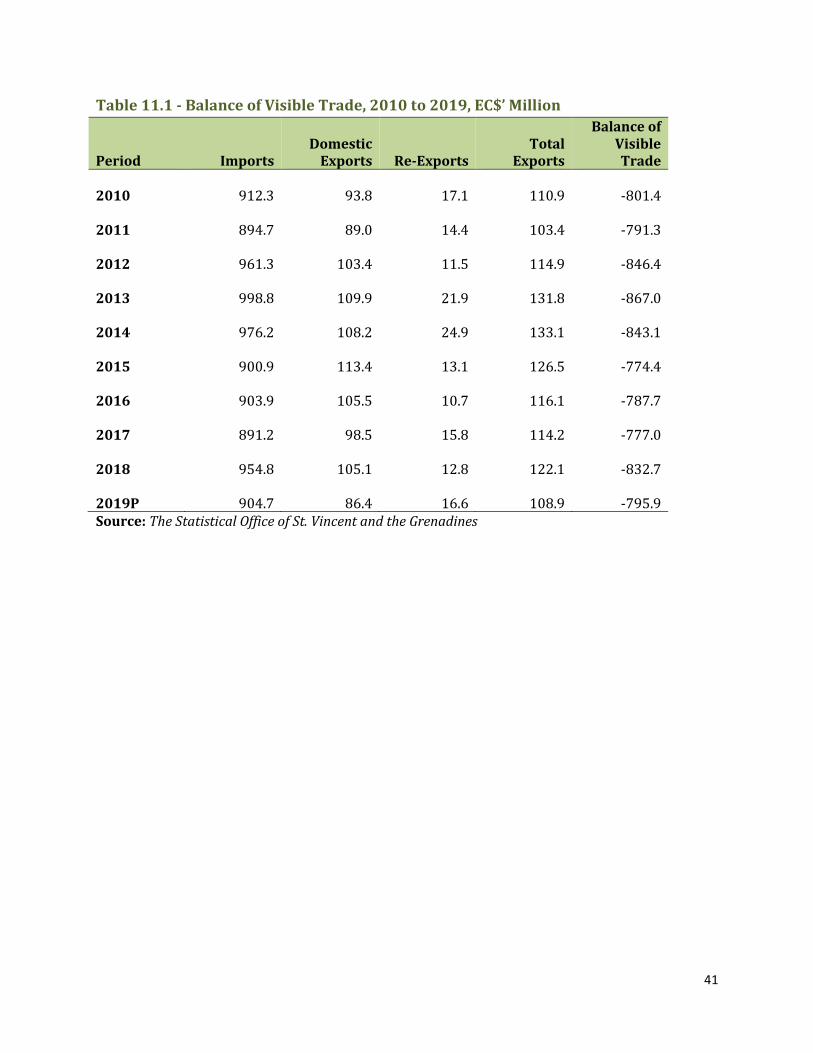
Table 11.1 - Balance of Visible Trade, 2010 to 2019, EC$’ Million
Period Imports Domestic
Exports Re-Exports Total
Exports
Balance of Visible Trade
2010 912.3 93.8 17.1 110.9 -801.4
2011 894.7 89.0 14.4 103.4 -791.3
2012 961.3 103.4 11.5 114.9 -846.4
2013 998.8 109.9 21.9 131.8 -867.0
2014 976.2 108.2 24.9 133.1 -843.1
2015 900.9 113.4 13.1 126.5 -774.4
2016 903.9 105.5 10.7 116.1 -787.7
2017 891.2 98.5 15.8 114.2 -777.0
2018 954.8 105.1 12.8 122.1 -832.7
2019P 904.7 86.4 16.6 108.9 -795.9 Source: The Statistical Office of St. Vincent and the Grenadines

42
Table 11.2 - Value of Import by SITC Section, 2015 to 2019, EC$’ Million
S.I.T.C. SECTION Year
2015 2016 2017 2018 2019
0. Food 211.9 204.3 209.9 209.0 212.2
1. Beverages & Tobacco 32.9 34.9 33.1 35.0 36.4 2. Crude Materials, Inedible Except Fuels 28.1 30.0 22.4 22.2 24.8
3. Mineral Fuels, Lubricants and Related Materials 108.3 106.2 83.0 136.0 106.1 4. Animal & Vegetable Oils, Fats & Waxes 4.4 4.1 4.0 4.5 4.2
5. Chemicals and Related Product n.e.s 78.9 75.0 71.4 78.3 73.8
6. Manufactured Goods Classified Chiefly by Materials 159.9 148.5 163.8 170.0 153.1 7. Machinery and Transport Equipment 176.7 196.6 203.4 183.8 191.9 8. Miscellaneous Manufactured Articles 99.8 104.3 100.0 116.1 102.5
9. Commodities and Transactions Not Classified Elsewhere in the SITC 0.0 0.0 0.0 0.0 0.0
Total 900.9 903.9 891.2 954.8 905.1 Source: The Statistical Office of St. Vincent and the Grenadines

43
Table 11.3 - Value of Domestic Export by SITC Sections, 2015 to 2019, EC$’ Million
S.I.T.C. SECTION Year
2015 2016 2017 2018 2019
0. Food 81.7 74.1 63.8 63.2 64.9
1. Beverages & Tobacco 20.2 18.6 16.3 18.0 12.3
2. Crude Materials, Inedible Except Fuels 0.4 0.2 0.2 0.6 0.3
3. Mineral Fuels, Lubricants and Related Materials 0.0 0.0 0.0 0.0 0.0
4. Animal & Vegetable Oils, Fats & Waxes 0.0 0.0 0.0 0.1 0.0
5. Chemicals and Related Product n.e.s 0.4 0.8 0.6 0.4 0.6
6. Manufactured Goods Classified Chiefly by Materials 9.2 10.1 16.5 25.7 12.7
7. Machinery and Transport Equipment 0.1 0.4 0.1 0.1 0.2
8. Miscellaneous Manufactured Articles 1.4 1.2 1.0 1.3 1.2
9. Commodities and Transactions Not Classified Elsewhere in the SITC 0.0 0.0 0.0 0.0 0.0
Total 113.4 105.5 98.5 109.4 92.2 Source: The Statistical Office of St. Vincent and the Grenadines

44
Table 11.4 - Imports from OECS/CARICOM Countries, 2015 to 2019, EC$’ 000
O.E.C.S / CARICOM Countries
Year
2015 2016 2017 2018 2019
Anguilla 3 7 4 4 1
Antigua & Barbuda 718 520 330 544 695
Dominica 1,231 798 798 949 927
Grenada 3,014 2,980 5,083 5,798 6,879
Montserrat - - - 841 -
St. Kitts & Nevis 193 325 309 1,241 2,715
St. Lucia 6,720 5,509 4,254 5,267 5,729
Total O.E.C.S Countries 11,879 10,139 10,778 14,644 16,946
Belize 416 1,184 908 697 1,181
Bahamas 41 8 12 - -
Barbados 25,092 26,610 24,474 22,458 21,154
Guyana 14,485 16,867 22,044 15,704 11,885
Haiti 79 74 46 58 58
Jamaica 12,921 10,939 6,443 8,643 9,701
Suriname 1,038 705 769 637 885
Trinidad & Tobago 158,825 146,402 140,354 170,452 137,697
Total O.E.C.S. / CARICOM Countries
224,776 212,928 205,828 233,293 199,507
Source: The Statistical Office of St. Vincent and the Grenadines

45
Table 11.5 - Domestic Exports to OECS/CARICOM Countries, 2015 to 2019, EC$’ 000
O.E.C.S / CARICOM Countries Year
2015 2016 2017 2018 2019
Anguilla 35 10 27 61 290
Antigua & Barbuda 17,359 16,965 14,484 14,469 11,380
Dominica 10,198 9,359 14,726 20,521 15,019
Grenada 4,634 3,993 4,627 3,876 3,787
Montserrat 720 698 707 825 529
St. Kitts & Nevis 7,448 7,875 8,598 12,118 7,668
St. Lucia 20,049 19,951 16,846 11,260 11,326
Total O.E.C.S Countries 60,443 58,851 60,015 63,130 49,999
Belize 4,159 3,676 2,112 2,328 99
Bahamas 0 0 0 0 20
Barbados 19,484 19,399 16,646 16,769 17,965
Guyana 406 183 544 294 239
Haiti 0 0 0 0 0
Jamaica 1,013 841 897 922 271
Suriname 559 408 182 211 85
Trinidad & Tobago 21,040 17,185 11,008 9,082 7,911
Total OECS/CARICOM Countries 107,104 100,543 91,404 92,736 76,589 Source: The Statistical Office of St. Vincent and the Grenadines

46
ELECTORAL STATISTICS
12

47
Table 12.1 - Summary Results for General Elections, December 7th 2005
No. of No. of No. of
Constituency No. of Total No. No. of Total No. Ballots Ballots Ballots
Electors of Ballots Rejected of accepted for N.D.P for U.L.P for G.P.
on list cast Ballots Ballots Candidate Candidate Candidate
North Windward 5,841 4,447 14 4,433 2,016 2,405 12
North Central Windward 5,724 3,577 14 3,563 676 2,887 0
South Central Windward 6,173 3,995 16 3,979 1,702 2,268 9
South Windward 5,924 3,636 11 3,625 1,172 2,451 2
Marriaqua 6,551 4,147 14 4,133 1,438 2,695 0
East St. George 7,600 4,636 18 4,618 1,952 2,652 14
West St. George 6,996 4,114 22 4,092 1,678 2,414 0
East Kingstown 7,084 4,456 13 4,443 2,300 2,143 0
Central Kingstown 7,016 3,956 10 3,946 1,965 1,981 0
West Kingstown 6,821 4,027 38 3,989 1,977 2,012 0
South Leeward 7,175 4,537 16 4,521 2,203 2,318 0
Central Leeward 6,031 4,154 16 4,138 1,784 2,354 0
North Leeward 5,481 3,952 14 3,938 1,958 1,980 0
Northern Grenadines 3,919 2,516 14 2,502 1,855 647 0
Southern Grenadines 2,697 1,889 32 1,857 1,058 799 0 Total
91,033
58,039
262
57,777
25,734
32,006
37
Percentage
63.76 0.45 99.55 44.34 55.15 0.06
Source: Electoral Office
N.D.P. - New Democratic Party U.L.P. - Unity Labour Party G.P. – Green Party

48
Table 12.2 - Summary Results for General Elections, December 13th 2010
No. of Total No. No. of Total No. Ballots Ballots Ballots
Constituency Electors of Ballots Rejected of accepted for N.D.P for U.L.P for G. P.
on list cast Ballots Ballots Candidate Candidate Candidate
North Windward 6,526 4,777 10 4,767 2,252 2,502 13
North Central Windward 6,262 3,775 10 3,765 761 3,004 0
South Central Windward 6,796 4,312 12 4,300 1,857 2,425 18
South Windward 6,696 4,109 9 4,100 1,648 2,434 18
Marriaqua 7,165 4,503 18 4,485 1,954 2,522 9
East St. George 8,664 5,257 8 5,249 2,477 2,760 12
West St. George 7,851 4,569 8 4,561 2,066 2,495 0
East Kingstown 7,846 4,732 15 4,717 2,589 2,122 6
Central Kingstown 7,838 4,527 7 4,520 2,445 2,063 12
West Kingstown 7,549 4,414 12 4,402 2,451 1,940 11
South Leeward 8,068 5,023 25 4,998 2,595 2,396 7
Central Leeward 6,614 4,457 21 4,436 2,140 2,290 6
North Leeward 6,080 4,218 11 4,207 2,189 2,007 11
Northern Grenadines 4,163 2,538 14 2,524 2,024 491 9
Southern Grenadines 2,949 1,782 8 1,774 1,120 648 6
Total 101,067 62,993 188 62,805 30,568 32,099 138
Percentage
62.33 0.30 99.70 48.53 50.96 0.22
Source: Electoral Office
N.D.P – New Democratic Party U.L. P – Unity Labour Party G.P – Green Part

49
Table 12.3 - Summary Results for General Elections, December 9th 2015
No. of Total No. No. of Total No. Ballots Ballots Ballots Ballots
Constituency Electors of Ballots Rejected of accepted for U.L.P for N.D.P for G. P. for D.R.P
on list cast Ballots Ballots Candidate Candidate Candidate Candidate
North Windward 6,295 5,130 7 5,123 2,713 2,390 5 15
North Central Windward 5,297 3,787 9 3,778 3,015 746 0 17
South Central Windward 5,788 4,379 11 4,368 2,476 1,888 4 0
South Windward 6,035 4,291 11 4,280 2,507 1,748 25 0
Marriaqua 6,210 4,547 12 4,535 2,643 1,887 5 0
East St. George 7,789 5,733 22 5,711 3,135 2,528 13 35
West St. George 6,880 4,850 19 4,831 2,682 2,104 0 45
East Kingstown 6,583 4,771 9 4,762 2,295 2,444 0 23
Central Kingstown 6,644 4,713 18 4,695 2,084 2,600 11 0
West Kingstown 6,328 4,508 20 4,488 2,015 2,459 14 0
South Leeward 7,340 5,396 19 5,377 2,620 2,738 0 19
Central Leeward 6,102 4,697 16 4,681 2,497 2,184 0 0
North Leeward 5,704 4,537 15 4,522 2,255 2,267 0 0
Northern Grenadines 3,841 2,536 9 2,527 601 1,924 0 0
Southern Grenadines 2,691 1,833 5 1,828 708 1,120 0 0
Total 89,527 65,708 202 65,506 34,246 31,027 77 154
Percentage 73.39 0.23 73.17 38.25 34.66 0.09 0.17
Source: Electoral Office
N.D.P – New Democratic Party U.L. P – Unity Labour Party G.P – Green Party

50
Contact Us
Telephone: 1 (784) 457-2921
Email: [email protected]
Website: stats.gov.vc
1st Floor, Administrative Building
Kingstown
St Vincent and the Grenadines