Embed Size (px)
Citation preview
ST. LOUISHEALTH CARE
INDUSTRY OVERVIEW2016
Volume 1: Health Plan Quality andFinancial Overview

Volume 1: Health Plan Quality and Financial Overview, 2016 St. Louis Area Business Health Coalition
Table of contents
MESSAGE TO THE COMMUNITY . . . . . . . . . . . . . . . . . . . . . . . . . . . . . . . . . . . . . . . . . . . . . . . . . . . . . . . . . . . . . . . . . . . . . . . . . . . . . . . . . . . . . . . . . . . . . . . . . . . . . . .1
SECTION ONE: FINANCIAL PERFORMANCE Health plan medical loss ratios . . . . . . . . . . . . . . . . . . . . . . . . . . . . . . . . . . . . . . . . . . . . . . . . . . . . . . . . . . . . . . . . . . . . . . . . . . . . . . . . . . . . . . . . . . . . . . . . . . . . . .2
Graph: National Health Plans, Missouri Medical Loss Ratios, 2014
Quality improvement spending locally mirrors national trends . . . . . . . . . . . . . . . . . . . . . . . . . . . . . . . . . . . . . . . . . . . . . . . . . . . . . . . . . . . . . . . . . . . . . . . . . .3
Graph: National Health Plans, Missouri Quality Improvement Expense as a % of Premium, 2013 - 2014
Profits flow as enrollment expands in the exchanges . . . . . . . . . . . . . . . . . . . . . . . . . . . . . . . . . . . . . . . . . . . . . . . . . . . . . . . . . . . . . . . . . . . . . . . . . . . . . . . . . . . .4
Graph: National Health Plan Operating Margins, 2013 – 2014
Graph: National Health Plan Profit Margins, 2013 – 2014
Assessing the impact of the ACA on BHC members’ benefit offerings . . . . . . . . . . . . . . . . . . . . . . . . . . . . . . . . . . . . . . . . . . . . . . . . . . . . . . . . . . . . . . . . . . . . .5
Graph: Figure 1: Premium Contributions, 2010 and 2015
Graph: Figure 2: In-Network Deductibles, 2010 and 2015
Graph Figure 3: In-Network Out-of-Pocket Max, 2010 and 2015
Table: In-Network Copays by Year, 2010 and 2015
Medicare Advantage plans outperform commercial health plans . . . . . . . . . . . . . . . . . . . . . . . . . . . . . . . . . . . . . . . . . . . . . . . . . . . . . . . . . . . . . . . . . . . . . . . . .6
Graph: St . Louis Metropolitan Area, Medicare Advantage Plan Star Ratings, 2015 – 2016
Medicare Advantage stands out in reducing readmissions . . . . . . . . . . . . . . . . . . . . . . . . . . . . . . . . . . . . . . . . . . . . . . . . . . . . . . . . . . . . . . . . . . . . . . . . . . . . . .7
Graph: Plan All-Cause 30-Day Readmission Rates, St . Louis Medicare Advantage Plans, 2014
SECTION TWO: QUALITY PERFORMANCE Health plan customer service . . . . . . . . . . . . . . . . . . . . . . . . . . . . . . . . . . . . . . . . . . . . . . . . . . . . . . . . . . . . . . . . . . . . . . . . . . . . . . . . . . . . . . . . . . . . . . . . . . . . . . . .8
Graph: Percent of enrollees surveyed who would give their health plan an overall rating of 8, 9 or 10,
St . Louis Area Health Plans, 2012 - 2014
Blood pressure control improves, resource use increases . . . . . . . . . . . . . . . . . . . . . . . . . . . . . . . . . . . . . . . . . . . . . . . . . . . . . . . . . . . . . . . . . . . . . . . . . . . . . . . .9
Graph: Hypertension Care Cost and Quality, St . Louis Health Plans, 2014
Graph: Commercial vs . Medicare Advantage Plans, % of Patients with Blood Pressure in Control, 2014
About the BHC and this report . . . . . . . . . . . . . . . . . . . . . . . . . . . . . . . . . . . . . . . . . . . . . . . . . . . . . . . . . . . . . . . . . . . . . . . . . . . . . . . . . . . . . . . .Inside Back Cover

St. Louis Area Business Health Coalition Volume 1: Health Plan Quality and Financial Overview, 2016 1
Growing enrollment, comfortable financial positions and more engaged customers pushing for lower cost, higher value offerings defined 2014 for commercial health plans .
Public exchange customers had more health plan options to choose from in the second year under the Affordable Care Act (ACA) . As all major national insurers participated, marketplaces offered 25% more plans . Over 10 million customers purchased coverage, up from more than 6 million in the previous year . In Missouri, enrollment increased 67% to nearly 254,000 .
Nationally, individual group market enrollment grew 46%, while locally 51% more individuals gained coverage, federal government estimates show . Aetna and Anthem, the two largest national insurers that tested the federal exchanges the first year, enrolled a combined one million customers, only a fraction of their total fully-insured membership . In 2014, despite growth in the individual market, fully-insured enrollment declined across large national carriers while enrollment in self-insured plans increased, consistent with trends in recent years . Medicare and Medicaid managed care plans continued to be an important area of growth for all major carriers .
Health plans’ 2014 operating margins grew, driven in part by increased enrollment through the exchanges, Medicaid expansion or both . Nationally, the average operating margin was 7 .8%, up from 5% the previous year and plan share prices reached historic highs . This was the first full year that health coverage purchased on the ACA exchanges became effective and despite concerns about a sicker risk pool, large national health plans reported the smallest medical cost increase in five years .
In 2014, profit margins declined for the fifth consecutive year . This seemed to be impacted by higher fees and taxes imposed by ACA programs intended to help balance the premium risk of sicker, costlier enrollees . Fees and taxes as a percentage of premiums increased by nearly one-third, and these costs were passed on to customers (p . 4) . The risk corridor program was intended to share risk among plans in the individual and small group markets and redistribute funds to plans that lose money covering high-risk enrollees . Yet, high-risk plans’ losses exceeded payments from lower risk plans by $2 .5 billion .
After three consecutive years of decline, plan refunds to customers increased 41% to $469 million in 2014, yet remained below levels in the first year of the program . Refunds in Missouri decreased 7% to $13 .5 million . Plans operating in St . Louis paid out $11 .2 million of these refunds, about one-third more than in 2013 . In Missouri and across the nation fewer consumers received refunds in 2014 and average payments increased (p . 2) . Premiums across group sizes increased slightly 2% in 2014 while claims costs increased 4%, yet results varied widely . Individual market premiums increased 27% while claims expenses grew 32% .
Some national insurers offered more narrow networks, yet plans did not price competitively and lower than anticipated medical cost increases partially explains the uptick in rebates . Toward the end of 2015, the news that UnitedHealth Group may consider exiting the marketplaces prompted concerns about a sicker risk pool and the long-term sustainability of the exchange . Yet, a study by the Commonwealth Fund found no evidence individuals enrolled on the exchange were sicker than those outside the marketplaces . United was a minor player in the individual market prior to the ACA and signed up only 5% of exchange customers . Some suggest the failures of many Consumer Operated and Oriented Plans (CO-OP) are a more troubling sign . Only time will tell whether the exchanges can enroll enough healthy people to balance the risk of those with health problems while keeping coverage affordable .
To assess differences in employer benefits, the St . Louis Area Business Health Coalition evaluated benefit plan data pre- and post-ACA from more than 40 member companies for the 2010 and 2015 plan years . The percentage of employers offering high deductible health plans increased from 15% to 39%, while PPO and HMO plans decreased to 47% and 3% respectively . Premium-based incentives for wellness program participation increased to 33% of companies, up from 3% in 2010 . Companies setting higher premium rates for smokers nearly tripled, to 44% from 16% . In-network copays increased slightly for specialist office visits, hospital inpatient and emergency room care . For pharmacy cost-sharing, generic drug copays remained stable while copays for preferred and non-preferred drugs increased (p . 5) .
Exchange customers in 2014 had levels of satisfaction equal to or higher than plan members with employer-sponsored coverage, a survey by J .D . Power and Associates found . Cost emerged as the most important factor driving satisfaction . Unlike members tied to a single employer benefit offering, marketplace customers can shop for the most affordable or highest value plan . Interestingly, the survey also found people having multiple employer-based plan offerings at varied price points had the same satisfaction as marketplace consumers, emphasizing the importance of multiple cost options . As health plans evolve to become more consumer centric, 76% of members nationally rated their health plan “8, 9 or 10” in 2014, down slightly from 78% the year before . In St . Louis, nearly 74% of Anthem members gave it the top score . Yet, scores decreased for over half of the plans locally, among the lowest in five years (p . 8) .
For the first time, Medicare Advantage (MA) plans outpaced private insurers on quality, the National Committee for Quality Assurance found in its 2015 annual report (p . 6) . Nearly half of MA plans’ quality improved, earning at least 4 out of 5 stars . Two-thirds of St . Louis plans earned 4 stars, outperforming the national average . Essence Healthcare was the only local plan that earned a 5-star rating . UnitedHealthcare’s Special Needs Plan (SNP), which provides coverage only to patients living in skilled nursing facilities, earned 4 .5 stars and outperformed other MA plans on some key quality metrics . It excelled at reducing readmissions, with a rate of just 5% (p . 7) . Virtually all MA plans stood out with lower readmission rates than traditional Medicare . In 2014, national readmission rates for MA plans were 10% as compared to 15% for traditional Medicare .
In 2014, Coventry of Illinois’ PPO provided the best value for care of hypertension in the region for the third consecutive year . For the second year, MA plans performed better than commercial plans in controlling members’ high blood pressure (p . 9) .
Despite uncertainties regarding new members enrolled through the state and federal exchange marketplaces, large national carriers weathered the first full year of ACA implementation with roughly comparable financial performance as in recent years . In addition, consumers purchasing on the exchanges had equal or better satisfaction than members with employer-sponsored coverage as long as the coverage was affordable, even though some of these plans offered more narrow networks . While questions remain regarding the long-term financial viability of the exchanges, these early results are an encouraging sign . Perhaps even more promising is the growing awareness of the high cost of health care among consumers . Their choices in the marketplace suggest a desire for high-value insurance products and a willingness to try narrower networks, which will likely lead to greater competition among providers seeking to be included in those offerings .
Message to the Community – Marketplaces bring profit and uncertainty

Volume 1: Health Plan Quality and Financial Overview, 2016 St. Louis Area Business Health Coalition2
CIGNA Health & Life Ins. Co.
CIGNA HealthCare of St. Louis, Inc.
Aetna Life Ins. Co.
Aetna Health Inc.
Coventry Health Care of IL
Coventry Health and Life of MO
Coventry Health Care of MO
Anthem (Healthy Alliance Life Co.)
Anthem (HMO MO)
UnitedHealthcare-Golden Rule
UnitedHealthcare Ins. Co.
UnitedHealthcare of the Midwest, Inc.
101.9%
Nationally in 2014 after three consecutive years of declines, refunds increased 41% to $469 million compared to the previous year under the medical loss ratio (MLR) rule, according to Medicare’s Center for Consumer Information & Insurance Oversight . Still, payments remained below amounts in 2011, the first year of refunds . Health coverage purchased on the federal exchanges under the Affordable Care Act (ACA) became effective for the first time in 2014 . To ensure health plans serve the needs of consumers, the MLR rule under the ACA requires insurers to spend a specified percentage of premiums for fully-insured coverage on medical care . Plans must pay 80% of premium dollars for individual and small group plans and 85% for large group plans on medical and quality improvement expenses . Insurers with MLRs below this amount must repay the difference to customers .
The story was different in Missouri where plans paid $13 .5 million in refunds, down 7% compared to 2013 . In Missouri and across the nation, fewer customers received a refund in 2014, and average payments increased . Nationally nearly 20% fewer customers received refunds, and the average payment increased to $129 per family, up from $80 the prior year . In Missouri, plans paid refunds to 36% fewer customers, and the average payment increased to $109 per family, up from $66 in 2013 .
In 2014, the first year of the federal marketplaces, some national insurers offered plans with more narrow networks yet were not generally competitive in their pricing, researchers said .1 Large national carriers reported smaller than anticipated medical cost increases across products, including exchange plans, according to Securities and Exchange Commission filings for 2014 . This may partially explain the uptick in refunds . Toward the end of 2015, the news that UnitedHealth Group may consider exiting the marketplaces prompted concerns about a sicker risk pool in the ACA exchanges . Yet, researchers for the Commonwealth Fund found no evidence that individual exchange enrollees were sicker than those outside the marketplace . United was a minor player in the individual market before the ACA passed and covered only about 5% of marketplace enrollees . Still, its announcement brought considerable press and public worry over the long-term sustainability of the exchange . Some suggest the highly publicized failures of many Consumer Operated and Oriented Plans (CO-OP) might be a more troubling harbinger . Only time will determine whether the exchanges can enroll enough healthy people to balance the risk of those with health problems while keeping coverage affordable .2
82.9%
In 2014, local fully-insured membership in individual health plans increased dramatically an average of 51%, while small group members decreased 17% and large group enrollment declined 11% . Premiums across group sizes increased 2% in 2014 while claim costs grew 4%, yet results varied widely . Individual market plans saw the largest premium increase of 27% while claims expenses grew 32% . Large group market plans saw the smallest increase in premiums of 3% while claims costs grew 4% . Missouri MLRs for most of the health plans operating in St . Louis shown in the graph above increased slightly as compared to the previous year with one notable exception . The average MLR in CIGNA’s Health and Life large groups was 101 .9%, the highest overall among plans . In 2014, local plans refunded $11 .2 million to consumers, approximately one-third more than the $8 .3 million paid in 2013 .
• Anthempaidmorethan$6.7millioninrefundstosmallgroupmarketconsumersin2014,upfrom$3.2millionin2013,the largest amount for any plan in the region . Refunds accounted for 0 .4% of earned premiums .
• UnitedHealthcarepaidover$4.2millioninrefundstosmallgroupmarketconsumers,upfrom$3.9millionin2013.Thisrepresented0.5%ofearned premiums .
• CIGNApaidover$223thousandinrefundstolargegroupconsumerswhichrepresented1.3%ofpremiums.
Large Group Small Group Individual
Large Group
Benchmark 85%
Individual and Small Group Benchmark
80%
0.0% 20.0% 40.0% 60.0% 80.0% 100.0%
87.3%86.9%
87.9%96.6%
90.6%
88.5%
89.8%
87.8%
96.1%
National Health PlansMissouri Medical Loss Ratios, 2014
Source: The Center for Medicare and Medicaid Services, Center for Consumer Information & Insurance Oversight (CCIIO) .
88.5%
1 L Blumberg, J Holahan, E Wengle, “Marketplace Price Competition in 2014 and 2015, Does Insurer Type Matter in Early Performance?” RWJF and the Urban Institute, June 2015 .2 D Blumenthal, S Collins, “How Stable Are the ACA Marketplaces?” The Commonwealth Fund, December 3, 2015 .
120.0%
90.3%
90.1%88.6%
79.6%83.3%
85.2%71.8%
85.7%88.5%
80.4%63.8%
Section One: Financial Performance

St. Louis Area Business Health Coalition Volume 1: Health Plan Quality and Financial Overview, 2016
Coventry
Anthem
UnitedHealthcare
Aetna
CIGNA
1.24%.25%
2014 2013
2013 & 2014 National Average
1.1%
0.00% 0.20% 0.40% 0.60% 0.80% 1.00%
1.05%0.94%
0.83%
National Health PlansMissouri Quality Improvement Expense as a % of Premium, 2013 - 2014
Source: The Centers for Medicare and Medicaid Services, Center for Consumer Information & Insurance Oversight (CCIIO) Medical Loss Ratio (MLR) and Public Use Files .
1.08%
1.20%
1.16%
0.99%
0.51%0.40%
3
1.40%
The Affordable Care Act (ACA) permits insurers to include the amount of premium spent on activities to improve health care quality in addition to the amount spent on medical claims when calculating medical loss ratios (MLR) (p . 2) . In 2014, the Centers for Medicare and Medicaid Services (CMS) publicly reported plan-specific quality improvement expenses at the state level for the third year . Plans have been rated and accredited based on the quality of care provided to enrollees by the National Committee for Quality Assurance for more than 20 years . Yet, before the ACA, the amount of plans’ resources invested in quality improvement was unclear .
Nationally, health plans spent nearly $5 .4 billion on quality improvement (QI) activities for commercially insured customers, or an average of 1 .1% of premium, unchanged from the previous year . Health plans operating in St . Louis spent $40 .6 million on QI for commercially insured members in 2014, or an average of 1 .1% of premium, up by over one-third since 2013 . Three out of five local plans increased QI expenses as a percent of premium compared to the previous year, as shown in the graph below .
As noted in the graphic above, Coventry’s QI expenses grew six-fold in 2014 as compared to the previous year and the largest change among plans in the region . However, the jump was largely due to changing its methodology to mirror Aetna, which acquired the carrier in 2013, said Karen Miller, Senior Director Network, Mid-America Region .
Aetna and Coventry plans spent nearly 75% of quality improvement expenses on improving health outcomes, while Anthem allocated 27%, CIGNA 29% and UnitedHealthcare 38% to this category . In 2014, Coventry’s quality scores for its Medicare Advantage and commercial health plans tended to be above average (see pgs . 6, 7, and 9), which is consistent with its strong quality performance in previous years .
Across the region, local plans spent an average of 45% QI expenses on improving health outcomes, up from 32% the previous year . Spending on wellness and health promotion activities also increased to 16% as compared 12% in 2013 . As a result, percentage allocations across categories in the St . Louis region were more consistent with national averages as shown in the table to the right .
On October 1, 2015 the U .S . health care system transitioned to the new ICD-10 diagnosis code system . Despite dire predictions of potential problems, about eight in 10 health care organizations reported the transition went smoothly, a survey by KPMG LLP found .1 Plans decreased QI expenses allocated to the ICD-10 transition, a category introduced in 2013 . Nationally, just 3% of QI expenses were allocated, down from 5% the previous year . Locally, the percentage fell to 2%, down from 4% in 2013 . Health plans may have prepared earlier for the conversion deadline set for October 2014, before Congress pushed it to October 2015 due to physician opposition to the previous deadline .
1 R Leventhal, “Survey: So Far, Most Orgs Satisfied with ICD-10 Transition,” Healthcare Informatics, Nov . 30, 2015
NationalHealth Plans
Operating Locally %
QI Expenses
NationalAverage
% QIExpenses
Percentage of QualityImprovement Expenses by Category, 2014
Improve health outcomes 45% 46%Prevent hospital readmissions 12% 10%Improve patient safety 10% 10%Wellness and health promotion 16% 16%Health information technology 16% 16%Allowable ICD-10 Expenses 2% 3%
Quality improvement spending locally mirrors national trends

Volume 1: Health Plan Quality and Financial Overview, 2016 St. Louis Area Business Health Coalition4
Profits flow as enrollment expands in exchanges
Source: SEC Health Plan 10-K Statements . CSI Markets national average operating margin statistics . Aetna acquired Coventry in May 2013 .
National Health Plan Operating Margins2013 - 2014
CIGNA
UnitedHealth Group
Aetna
Anthem
8.4%
5.4%
2014 2013
2014 National Average
Operating Margin
7.8%
0.0% 3.0% 6.0% 9.0% 12.0%
Nationally, operating margins surged as health plans experienced a burst of new revenue in 2014 driven in part by an increase in customers enrolled through the Affordable Care Act’s (ACA) federal exchanges, Medicaid expansion or both . Despite concerns that the mix of new ACA enrollees may be older and sicker, utilization was lower than expected resulting in the smallest medical cost increase in five years . Operating margins increased for four of the five carriers, most performing close to or above the national average as shown in the graph to the right . Thus, plans’ share prices reached or came close to reaching historic highs.
Anthem and Aetna were the two largest national insurers that tested the federal exchanges the first year, signing up over one million fully-insured members, plans said . CIGNA, whose customer base is over 80% self-insured, had few public exchange enrollees . Medicare and Medicaid managed care plans continued to be an important area of growth for CIGNA and all major carriers . In 2014, Medicare Advantage established a minimum medical loss ratio of 85% and reduced benchmark payment rates . Mandatory budget cuts further reduced Medicare payments . Plans such as UnitedHealth Group made up for the reductions by entering into provider contracts that indexed reimbursement to Medicare Advantage revenues or Medicare fee-for-service rates . Plans also invested and participated in private exchanges, yet employer interest lagged due to a lack of customized product offerings, a recent report by Accenture said .
The ACA bars plans from charging higher premiums or denying coverage for pre-existing conditions or chronic illness and imposes taxes and fees on insurers . Funds are redistributed to other carriers to make up for losses on high cost members . To offset this, insurers raised premiums and service fees to customers, according to plans’ annual 10-K reports to the Securities and Exchange Commission (SEC) .
7.9%
7.9%
7.5%
7.3%5.5%
6.1%
5.7%
Source: SEC Health Plan10-K Statements . CSI Markets national average profit margins 2014 . Aetna acquired Coventry in May 2013 .
National Health Plan Profit Margins2013 - 2014
CIGNA
UnitedHealth Group
Aetna
Anthem
6.0%
4.6%
2014 2013
2014 National Average
Profit Margin
4.3%
0.0% 2.5% 5.0% 7.5%
4.3%
4.6%
3.5%
4.0%3.5%
3.5%
3.5%
Nationally 2014 health plan profit margins remained at or below 2013 levels as shown in the graph at left . This marks the fifth consecutive year of decreases . CIGNA and UnitedHealth Groups’ profit margins were at or above the national average .
Profit margins deduct taxes, depreciation and interest and are lower than operating margins . In 2014, taxes as a percentage of operating revenue increased by nearly one-third to national plans as a result of taxes and fees imposed by the ACA . The Patient-Centered Outcomes Research Institute tax increased to $2 per covered life . The Health Insurer Tax collected $8 billion, increasing premiums to customers an estimated 2 .0% – 2 .5%, the Joint Committee on Taxation said .
The “3Rs” refer to three new ACA programs in 2014 aimed to reduce risk and stabilize premiums for high-risk, high-cost enrollees:
• Reinsurance: Temporary program ending in 2016 . Fees apply to plans and self-funded employers . It pays insurers a portion of high medical costs for individual plans . In 2014 in Missouri, Aetna received $67 million, Anthem received $32.7 million and United received $2 million.
• Risk Adjustment: Program is used to spread risk among individual and small group insurers . Plans with high risk populations receive payments from plans with lower risk . In 2014 in Missouri, Aetna paid $14.9 million, Anthem paid $22.9 million, and United received $1 million.
• Risk Corridor: Temporary program ending in 2016 intended to limit the risk of a sicker risk pool in the individual and small group markets . If premiums exceed medical costs, plans pay the government which redistributes the funds to plans that lose money covering high cost enrollees . In 2014, losses by high risk plans exceeded payments from lower risk plans by $2 .5 billion .

St. Louis Area Business Health Coalition Volume 1: Health Plan Quality and Financial Overview, 2016 5
Assessing the impact of the ACA on BHC members’ benefit offerings
To assess the changes in benefit plan design pre- and post-ACA, the St . Louis Area Business Health Coalition (BHC) evaluated the benefit offerings of member companies for the 2010 and 2015 plan years . The goal of this project was to provide employers with information about evolving trends in the local health care market, while also establishing a benchmark for current benefit design practices . Over a period of six months, BHC staff abstracted relevant data from the enrollment materials of member companies . In total, data was collected from 58 companies (188 health plans) for the 2010 plan year and 41 companies (123 health plans) for the 2015 plan year.
The ACA has necessitated changes for a majority of employer-sponsored health plans; however, a small number of plans remain “grandfathered” and thus exempt from ACA provisions . To obtain this status, plans must have been in existence at the time of the law’s passing and have not made significant changes to reduce benefits or increase employee cost in the years following . According to a survey of 26 BHC members, three member companies indicated that at least one of their offered plans remain grandfathered in 2015.
Since ACA implementation, the availability of High-Deductible Health Plans (HDHPs)* offered by employers in the study increased from 15% to 39%, while the percentage of PPO and HMO plans offered by employers in the study decreased to 47% and 3%, respectively. The consumer-directed health care trend has also contributed to a growth in the percentage of companies offering Health Savings Accounts (HSAs), from 7% in 2010 to 61% in 2015 .
*For the purposes of this report, HDHP was defined using the following guidelines determined by the Internal Revenue Service: 2010 Annual minimum deductible of least $1,200 for self-only or $2,400 for coverage other than self-only; 2015 Annual minimum deductible of least $1,300 for self-only or $2,600 for coverage other than self-only.
Employee cost-sharing in the form of premium contributions, deductibles, and out-of-pocket maximums has increased for both single and family coverage, as indicated in the charts below . The use of premium-based incentives for participation in wellness activities (e .g ., screenings or assessments) has also increased from 3% of companies in 2010 to 33% in 2015 . Likewise, the percentage of companies setting higher premium rates for smokers versus non-smokers more than doubled from 16% to 44% .
PCP Office Visit $5 - $75 $20 $23 $5 - $40 $20 $24Specialist Office Visit $5 - $80 $25 $34 $20 - $70 $40 $39Hospital (Inpatient) $50 - $500 $250 $214 $100 - $500 $250 $274Urgent Care $15 - $100 $50 $42 $15 - $100 $50 $49Emergency Room $25 - $300 $150 $121 $50 - $300 $200 $151
In reviewing cost-sharing at the point of care, average in-network copays increased for specialist office visits, inpatient hospital services, urgent care, and emergency room care between 2010 and 2015 (see chart below) . In-network coinsurance amounts remained consistent across years, averaging approximately 20% for employees; nevertheless, during this time, more plans transitioned to a coinsurance cost-sharing model for medical services . For pharmacy cost-sharing, copays for preferred and non-preferred drugs increased, while generic drug copays remained stable . This trend reflects employer efforts to incent employee use of generic drugs versus branded products .
$5,000
$4,000
$3,000
$2,000
$1,000
$0
$2,000
$1,500
$1,000
$500
$0
$6,000
$4,000
$2,000
$0
2010 2015
Figure 1: Premium Contributions Figure 2: In-Network Deductibles Figure 3: In-Network Out-of-Pocket Max
Single Family Single Family Single Family
$922 $1,122
$3,370
$4,570
$625
$1,010
$1,422
$2,172
$2,056
$3,140
$4,318
$6,502
Figure 4: In-Network Copays by Year
In-Network Services 2010 Copays
Range Mode Average
2015 Copays
Range Mode Average
22%
36%
62%
53%
53%
51%
Volume 1: Health Plan Quality and Financial Overview, 2016 St. Louis Area Business Health Coalition
Medicare Advantage plans outperform commercial health plans
6
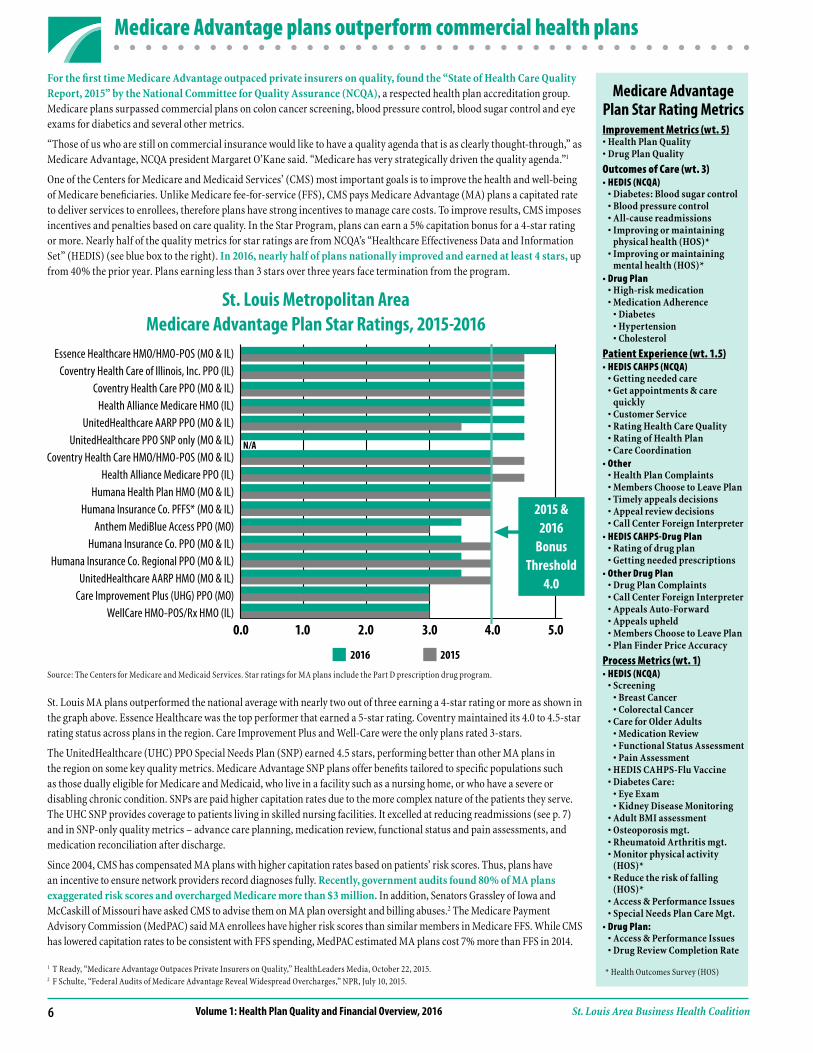
Source: The Centers for Medicare and Medicaid Services . Star ratings for MA plans include the Part D prescription drug program .
St. Louis Metropolitan AreaMedicare Advantage Plan Star Ratings, 2015-2016
2016 2015
0.0 1.0 2.0 3.0 4.0
St . Louis MA plans outperformed the national average with nearly two out of three earning a 4-star rating or more as shown in the graph above . Essence Healthcare was the top performer that earned a 5-star rating . Coventry maintained its 4 .0 to 4 .5-star rating status across plans in the region . Care Improvement Plus and Well-Care were the only plans rated 3-stars .
The UnitedHealthcare (UHC) PPO Special Needs Plan (SNP) earned 4 .5 stars, performing better than other MA plans in the region on some key quality metrics . Medicare Advantage SNP plans offer benefits tailored to specific populations such as those dually eligible for Medicare and Medicaid, who live in a facility such as a nursing home, or who have a severe or disabling chronic condition . SNPs are paid higher capitation rates due to the more complex nature of the patients they serve . The UHC SNP provides coverage to patients living in skilled nursing facilities . It excelled at reducing readmissions (see p . 7) and in SNP-only quality metrics – advance care planning, medication review, functional status and pain assessments, and medication reconciliation after discharge .
Since 2004, CMS has compensated MA plans with higher capitation rates based on patients’ risk scores . Thus, plans have an incentive to ensure network providers record diagnoses fully . Recently, government audits found 80% of MA plans exaggerated risk scores and overcharged Medicare more than $3 million. In addition, Senators Grassley of Iowa and McCaskill of Missouri have asked CMS to advise them on MA plan oversight and billing abuses .2 The Medicare Payment Advisory Commission (MedPAC) said MA enrollees have higher risk scores than similar members in Medicare FFS . While CMS has lowered capitation rates to be consistent with FFS spending, MedPAC estimated MA plans cost 7% more than FFS in 2014 .
Medicare Advantage Plan Star Rating MetricsImprovement Metrics (wt. 5)•HealthPlanQuality•DrugPlanQuality
Outcomes of Care (wt. 3)•HEDIS(NCQA) •Diabetes:Bloodsugarcontrol •Bloodpressurecontrol •All-causereadmissions •Improvingormaintaining
physical health (HOS)* •Improvingormaintaining
mental health (HOS)*•DrugPlan •High-riskmedication •MedicationAdherence •Diabetes •Hypertension •Cholesterol
Patient Experience (wt. 1.5)•HEDISCAHPS(NCQA) •Gettingneededcare •Getappointments&care
quickly •CustomerService •RatingHealthCareQuality •RatingofHealthPlan •CareCoordination•Other •HealthPlanComplaints •MembersChoosetoLeavePlan •Timelyappealsdecisions •Appealreviewdecisions •CallCenterForeignInterpreter•HEDISCAHPS-DrugPlan •Ratingofdrugplan •Gettingneededprescriptions•OtherDrugPlan •DrugPlanComplaints •CallCenterForeignInterpreter •AppealsAuto-Forward •Appealsupheld •MembersChoosetoLeavePlan •PlanFinderPriceAccuracy
Process Metrics (wt. 1)•HEDIS(NCQA) •Screening •BreastCancer •ColorectalCancer •CareforOlderAdults •MedicationReview •FunctionalStatusAssessment •PainAssessment •HEDISCAHPS-FluVaccine •DiabetesCare: •EyeExam •KidneyDiseaseMonitoring •AdultBMIassessment •Osteoporosismgt. •RheumatoidArthritismgt. •Monitorphysicalactivity
(HOS)* •Reducetheriskoffalling
(HOS)* •Access&PerformanceIssues •SpecialNeedsPlanCareMgt.•DrugPlan: •Access&PerformanceIssues •DrugReviewCompletionRate
1 T Ready, “Medicare Advantage Outpaces Private Insurers on Quality,” HealthLeaders Media, October 22, 2015 .2 F Schulte, “Federal Audits of Medicare Advantage Reveal Widespread Overcharges,” NPR, July 10, 2015 .
5.0
ForthefirsttimeMedicareAdvantageoutpacedprivateinsurersonquality,foundthe“StateofHealthCareQualityReport,2015”bytheNationalCommitteeforQualityAssurance(NCQA), a respected health plan accreditation group . Medicare plans surpassed commercial plans on colon cancer screening, blood pressure control, blood sugar control and eye exams for diabetics and several other metrics .
“Those of us who are still on commercial insurance would like to have a quality agenda that is as clearly thought-through,” as Medicare Advantage, NCQA president Margaret O’Kane said . “Medicare has very strategically driven the quality agenda .”1
One of the Centers for Medicare and Medicaid Services’ (CMS) most important goals is to improve the health and well-being of Medicare beneficiaries . Unlike Medicare fee-for-service (FFS), CMS pays Medicare Advantage (MA) plans a capitated rate to deliver services to enrollees, therefore plans have strong incentives to manage care costs . To improve results, CMS imposes incentives and penalties based on care quality . In the Star Program, plans can earn a 5% capitation bonus for a 4-star rating or more . Nearly half of the quality metrics for star ratings are from NCQA’s “Healthcare Effectiveness Data and Information Set” (HEDIS) (see blue box to the right) . In 2016, nearly half of plans nationally improved and earned at least 4 stars, up from 40% the prior year . Plans earning less than 3 stars over three years face termination from the program .
2015 & 2016
Bonus Threshold
4.0
Essence Healthcare HMO/HMO-POS (MO & IL) Coventry Health Care of Illinois, Inc. PPO (IL)
Coventry Health Care PPO (MO & IL)Health Alliance Medicare HMO (IL)
UnitedHealthcare AARP PPO (MO & IL) UnitedHealthcare PPO SNP only (MO & IL)
Coventry Health Care HMO/HMO-POS (MO & IL)Health Alliance Medicare PPO (IL)
Humana Health Plan HMO (MO & IL) Humana Insurance Co. PFFS* (MO & IL)
Anthem MediBlue Access PPO (MO)Humana Insurance Co. PPO (MO & IL)
Humana Insurance Co. Regional PPO (MO & IL) UnitedHealthcare AARP HMO (MO & IL)
Care Improvement Plus (UHG) PPO (MO)WellCare HMO-POS/Rx HMO (IL)
* Health Outcomes Survey (HOS)
Plan All-Cause 30-Day Readmission Rates - St. Louis Medicare Advantage Plans, 2014
N/A

St. Louis Area Business Health Coalition Volume 1: Health Plan Quality and Financial Overview, 2016
UnitedHealthcare HMO/PPO SNP only (MO & IL)
Essence Healthcare HMO/HMO-POS (MO & IL)
UnitedHealthcare AARP HMO (MO & IL)
Humana Health Plan HMO (MO & IL)
Coventry Health Care HMO/HMO-POS (MO & IL)
Coventry Health Care PPO (MO & IL)
Humana Insurance Co. Regional PPO (MO & IL)
Humana Insurance Co. PPO (MO & IL)
Anthem MediBlue Access PPO (MO)
Humana Insurance Co. PFFS* (MO & IL)
Coventry Health Care of Illinois, Inc. PPO (IL)
National Average Medicare Advantage Plans
UnitedHealthcare AARP PPO (MO & IL)
WellCare HMO-POS/Rx HMO/SNP (IL)
Care Improvement Plus PPO/SNP (MO)
Health Alliance Medicare HMO (IL)
Health Alliance Medicare PPO (IL)
Medicare Advantage stands out in reducing readmissions
7
The UHC SNP program is well-managed by nurse practitioners (NP) who use the Optum Care Nurse Practitioner model of care . The program selects NPs based on rigorous criteria, including expertise in geriatric care, and are highly trained . The NPs are integrated into the Skilled Nursing Facility team and are supported by Optum field-based clinical managers, the Director of Clinical Operations and a Medical Director . The NPs are salaried and compensated based on the quality of care they provide . Physician quality performance is also continually reviewed . While some physicians are paid FFS Medicare, others are paid based on capitated contracts .
Ample time is invested in advanced care planning, trajectory of illness and contingency planning . If there is a concern about a patient’s change in condition, the NPs’ assessment is driven in part by Optum’s Decision Support Tool which defines the level and amount of care . If a patient needs treatment, typically the appropriate intervention is provided at the SNF . Every potential admission and readmission to the hospital is subject to a rigorous, objective assessment which places the patient in one of three categories:
• Avoidable
• PotentiallyAvoidable
• Necessary
“We regularly find opportunities to avoid readmission in the majority of our reviews, many times solutions are simply-based and others are more complex . We design a specific clinical strategy for each facility . Our team and the facility work toward implementing plans to identify and not repeat the same error,” said Peter Hansen, Vice President of Market Development, West Region, Optum Care Management .
5%
8%
2014 National Medicare Hospital
Readmission Rate 15.2%
0% 2% 4% 6% 8% 10%
9%
Plan All-Cause 30-Day Readmission Rates - St. Louis Medicare Advantage Plans, 2014
12%
9%
9%
9%
10%
10%
10%
10%
10%
10%
11%
12%
12%
12%
12%
14% 16%
1 Jencks SF, Williams MV, Coleman EA . “Rehospitalizations among patients in the Medicare fee-for-service program .” N Engl J Med. 2009; 360 (14):1418-1428 .2 J Lemieux; C Sennett, R Wang, T Mulligan, J Bumbaugh . “Hospital Readmission Rates in Medicare Advantage Plans .” Am J Manag Care . 2012; 18 (2):96-1043 D Levinson, Inspector General, “Medicare Nursing Home Resident Hospitalization Rates Merit Additional Monitoring,” Department of Health and Human Services, Nov . 2013
Reducing re-hospitalizations among Medicare members has become a high priority for policymakers and the Centers for Medicare & Medicaid Services (CMS) . Hospital readmissions are seen as a marker of poor care quality, costing Medicare billions of dollars annually .
Since 2009, Medicare has publicly-reported hospital readmission rates . Just prior, a national study found that in 2004, an average of 20% of Medicare fee-for-service (FFS) members were readmitted to the hospital 30 days after discharge, costing more than $17 billion . Compared to an earlier study, researchers found no substantial reductions in readmissions in 23 years .1 In 2010, the Affordable Care Act (ACA) required CMS to establish a program to reduce payments to hospitals for higher than expected readmission rates by 2013 .
In comparison, Medicare Advantage (MA) plans’ average risk-adjusted readmission rate nationally from 2006 – 2008 was 14 .3%, or about 13% - 20% below the FFS average, a study found .2 The MA program’s capitated reimbursement has been a strong incentive to reduce avoidable hospitalizations and readmissions . In 2012, the MA star rating program started paying a bonus to high-performing plans which included readmissions as part of the care quality score (p . 6) . Since then, readmissions have continued to decrease .
In 2014, more than two out of three local MA plans had a readmission rate that was at or below the national MA plan average as shown in the graph below . As discussed on the previous page, the UnitedHealthcare (UHC) Special Needs Plan (SNP) that provides coverage to patients living in skilled nursing facilities (SNF), had a readmission rate of 5%, the lowest of any MA plan in the region . In comparison, the average national readmission rate for Medicare FFS patients living in a SNF is approximately 25% .3
In 2014, the average readmission rate for Medicare Advantage plans nationally was approximately 10%, well below the Medicare FFS rate of 15.2%. Plans have used nurse case management, transitional care management and patient-centered medical homes to reduce readmissions.

Volume 1: Health Plan Quality and Financial Overview, 2016 St. Louis Area Business Health Coalition
Percent of enrollees surveyed who would give theirhealth plan an overall rating of 8, 9 or 10
St. Louis Area Health Plans, 2012-2014
8
Section Two: Quality Performance
Source: National Committee for Quality Assurance (NCQA) Quality Compass 2013, 2014 and 2015, St . Louis Metropolitan Area . NCQA Quality Compass metrics represent data from the prior year . For example, NCQA Quality Compass 2015 reports data for 2014 .
2014 2013
0% 20% 40% 60% 80% 100%
2014 National
90th Percentile
75.7%
Anthem HMO/POS
CIGNA HMO/POS
UnitedHealthcare HMO/POS
Coventry of Illinois HMO/POS
Coventry of Missouri HMO/POS
UnitedHealthcare PPO
Aetna PPO
Coventry of Missouri PPO
CIGNA PPO
Aetna HMO/POS
Coventry of Illinois PPO
Anthem’s Customer-Centric Structure Gets Results
In 2008, Anthem implemented a consumer-centric organizational design when few of its competitors had adopted the approach. This type of structure re-orients a company’s entire operating model around specific customer segments. The narrower focus increases divisions’ understanding of consumer values and unmet needs to provide a more satisfying customer outcome and experience.
For example, Anthem’s product development, sales, care management, customer care, and other support services are aligned with either the Commercial and Specialty or Government business segments.
The new organizational structure enabled Anthem to discover and meet new customer needs such as better quality of care, enhanced transparency, and lower health care costs. The consumer-centric strategy yielded a 36% increase in return on assets four years after restructuring. The company has maintained and still benefits from this structural design.
Source: J Lee, S Sridhar, R Palmatier “Customer-Centric Org Charts Aren’t Right for Every Company,” Harvard Business Review, July-August 2015 .
73.0%71.5%
64.7%71.4%71.1%
66.8%NA
71.8%66.5%
67.7%73.3%
72.9%64.9%
67.3%64.7%64.1%64.1%
62.0%63.3%
57.8%65.1%
61.6%64.2%
57.3%55.5%
61.8%60.2%
55.1%63.6%63.9%
49.5%56.2%
50.2%
Nationally, a slightly smaller percentage of customers rated their health plan “8, 9 or 10” in 2014 than the previous year, a survey of privately insured found . Only 76% of health plan members gave their carrier a top score compared to about 78% the year before. The story was different in St . Louis where customer experience scores decreased for over half of the plans in the region as shown in the graph above . These were among the lowest scores in five years . Anthem had the highest rating at 73.9%, the best customer service score in five years. “We strive to treat our customers the way we want to be treated,” Deb Wiethop, an Anthem spokeswoman said .
In 2014, Americans who received coverage through state and federal exchange plans or “the Marketplace” had levels of member satisfaction equal to or higher than customers with employer-sponsored coverage, a recent study by J .D . Power and Associates said . The survey measured satisfaction with Marketplace health plans for the 2014 plan year in six areas including cost, customer service and provider selection . Cost emerged as the most influential attribute driving satisfaction among Marketplace plan members . “Marketplace shoppers are very cost-sensitive,” said Rick Johnson, senior director of the healthcare practice at J .D . Power . “Unlike many traditional health plan members, who are often tied to a single employer benefit offering, Marketplace members have an option to switch plans annually, allowing them to shop for either the most affordable or the most valuable plan . Plan providers need to demonstrate the value of their plan by clearly communicating coverage and benefits .”1 Yet, when comparing satisfaction among people with employer-based plans who had multiple plan options, J.D. Power found satisfaction levels were exactly the same as Marketplace customers. This suggests customers are more satisfied when they can choose among multiple health plan cost options .2
1 “J .D . Power Reports: Health Insurance Marketplace Exchange Enrollment Satisfaction Improves Significantly in Second Year,” Press Release, J .D . Power, April 23, 2015 .2 S Benen, “ACA scores big on customer satisfaction,” MSNBC, April 24, 2015 .
2012
St. Louis Area Business Health Coalition Volume 1: Health Plan Quality and Financial Overview, 2016 9
Blood pressure control improves, resource use increases
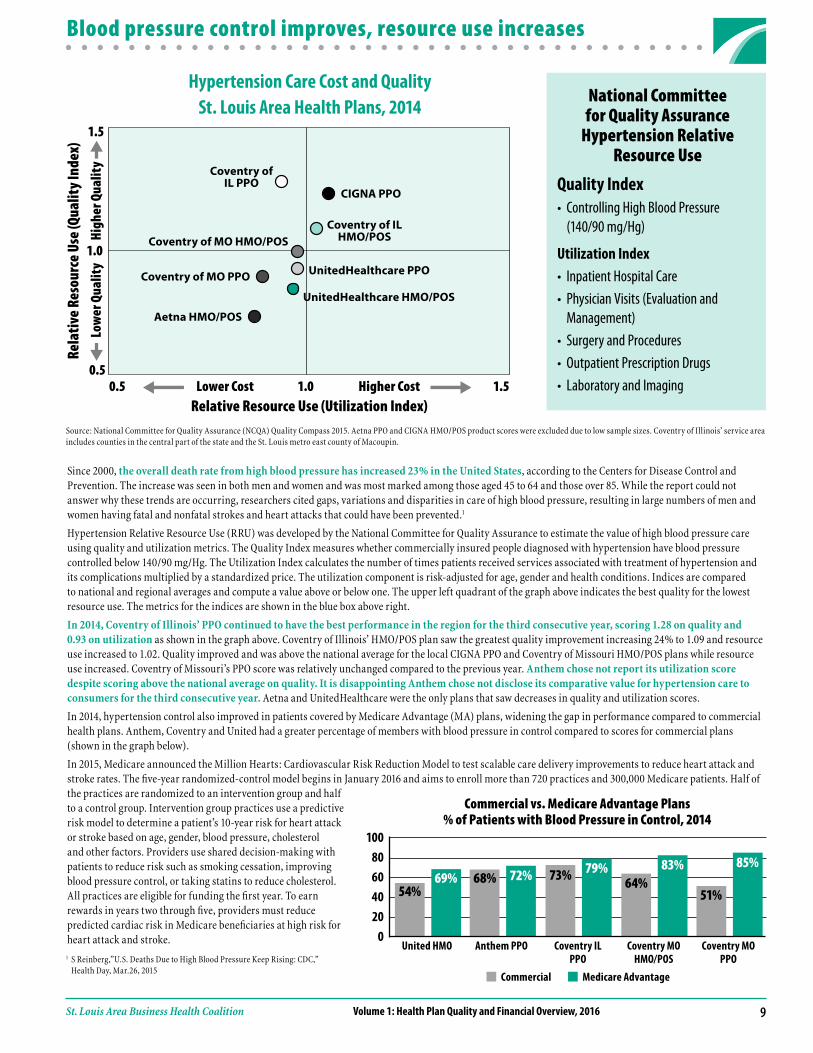
Hypertension Care Cost and QualitySt. Louis Area Health Plans, 2014
National Committee for Quality Assurance
Hypertension Relative Resource Use
Quality Index• ControllingHighBloodPressure (140/90 mg/Hg)
Utilization Index• InpatientHospitalCare• PhysicianVisits(Evaluationand Management)• SurgeryandProcedures• OutpatientPrescriptionDrugs• LaboratoryandImaging
Source: National Committee for Quality Assurance (NCQA) Quality Compass 2015 . Aetna PPO and CIGNA HMO/POS product scores were excluded due to low sample sizes . Coventry of Illinois’ service area includes counties in the central part of the state and the St . Louis metro east county of Macoupin .
Coventry ofIL PPO
CIGNA PPO
1.5
0.50.5 1.5Lower Cost Higher Cost1.0
Relative Resource Use (Utilization Index)
Low
er Q
ualit
yHi
gher
Qua
lity
1.0
Rela
tive R
esou
rce U
se (Q
ualit
y Ind
ex)
Coventry of ILHMO/POS
Coventry of MO PPO UnitedHealthcare PPO
UnitedHealthcare HMO/POS
Coventry of MO HMO/POS
Aetna HMO/POS
Since 2000, the overall death rate from high blood pressure has increased 23% in the United States, according to the Centers for Disease Control and Prevention . The increase was seen in both men and women and was most marked among those aged 45 to 64 and those over 85 . While the report could not answer why these trends are occurring, researchers cited gaps, variations and disparities in care of high blood pressure, resulting in large numbers of men and women having fatal and nonfatal strokes and heart attacks that could have been prevented .1
Hypertension Relative Resource Use (RRU) was developed by the National Committee for Quality Assurance to estimate the value of high blood pressure care using quality and utilization metrics . The Quality Index measures whether commercially insured people diagnosed with hypertension have blood pressure controlled below 140/90 mg/Hg . The Utilization Index calculates the number of times patients received services associated with treatment of hypertension and its complications multiplied by a standardized price . The utilization component is risk-adjusted for age, gender and health conditions . Indices are compared to national and regional averages and compute a value above or below one . The upper left quadrant of the graph above indicates the best quality for the lowest resource use . The metrics for the indices are shown in the blue box above right .
In 2014, Coventry of Illinois’ PPO continued to have the best performance in the region for the third consecutive year, scoring 1.28 on quality and 0.93 on utilization as shown in the graph above . Coventry of Illinois’ HMO/POS plan saw the greatest quality improvement increasing 24% to 1 .09 and resource use increased to 1 .02 . Quality improved and was above the national average for the local CIGNA PPO and Coventry of Missouri HMO/POS plans while resource use increased . Coventry of Missouri’s PPO score was relatively unchanged compared to the previous year . Anthem chose not report its utilization score despite scoring above the national average on quality. It is disappointing Anthem chose not disclose its comparative value for hypertension care to consumers for the third consecutive year. Aetna and UnitedHealthcare were the only plans that saw decreases in quality and utilization scores .
In 2014, hypertension control also improved in patients covered by Medicare Advantage (MA) plans, widening the gap in performance compared to commercial health plans . Anthem, Coventry and United had a greater percentage of members with blood pressure in control compared to scores for commercial plans (shown in the graph below) .
In 2015, Medicare announced the Million Hearts: Cardiovascular Risk Reduction Model to test scalable care delivery improvements to reduce heart attack and stroke rates . The five-year randomized-control model begins in January 2016 and aims to enroll more than 720 practices and 300,000 Medicare patients . Half of the practices are randomized to an intervention group and half to a control group . Intervention group practices use a predictive risk model to determine a patient’s 10-year risk for heart attack or stroke based on age, gender, blood pressure, cholesterol and other factors . Providers use shared decision-making with patients to reduce risk such as smoking cessation, improving blood pressure control, or taking statins to reduce cholesterol . All practices are eligible for funding the first year . To earn rewards in years two through five, providers must reduce predicted cardiac risk in Medicare beneficiaries at high risk for heart attack and stroke .
10080604020
0
Commercial Medicare Advantage
Commercial vs. Medicare Advantage Plans % of Patients with Blood Pressure in Control, 2014
54%69% 68% 72% 73% 79%
64%83%
51%
85%
United HMO Anthem PPO Coventry IL PPO
Coventry MO HMO/POS
Coventry MO PPO1 S Reinberg,”U .S . Deaths Due to High Blood Pressure Keep Rising: CDC,”
Health Day, Mar .26, 2015

Volume 1: Health Plan Quality and Financial Overview, 2016 St. Louis Area Business Health Coalition
About the BHC and this report
Board of DirectorsCarolyn Plummer*Monsanto Company
Ed Strouth*Barry-Wehmiller Cos, Inc .
Debbie Hanlon*ESCO Technologies
Marla Langenhorst*Ameren
Tim Sutter*Caleres
Beth BiggsCharter Communications
Dolores EnnicoOlin Corporation
Judy FairesEmerson
Gail FryePanera, LLC
Bruce HansonThe Boeing Company
Rick KusnierzPeabody Energy
Joan LawrenceAnheuser-Busch Inbev
Kirk McCarleySaint Louis County
Kristine SchusterMississippi Lime
Kevin SuppleFrancis Howell School District
Dave TobenBi-State Development/Metro
John ZieglerArch Coal, Inc .
Bob KnowlesEx-Officio
Bob WaldEx-Officio* BHC Foundation Executive
Committee member
Report AuthorKaren Roth, RN, MBA, CPA Director of ResearchFor more information, [email protected]
BHC MembersAAF InternationalAegionAmeren CorporationAnheuser-Busch InBevArch Coal, Inc .TheBANK of EdwardsvilleBarry-Wehmiller Cos, Inc .Bass Pro Shops, Inc .Bi-State Development/MetroThe Boeing CompanyBunzl Distribution USA, Inc .CaleresCharter CommunicationsCity of St . LouisConcordia Plan ServicesCushman & WakefieldDaikin AppliedThe Doe Run CompanyDrury Hotels Company, LLCEdward JonesEmersonEmmaus HomesESCO Technologies Inc .Ferguson-Florissant School District Francis Howell School DistrictGlobal Brass & Copper, Inc .Graybar Electric Company, Inc .Laclede Gas CompanyLaird Technologies, Inc .Maines Paper & Food Service, Inc .McCarthy Holdings, Inc .Mississippi LimeMonsanto CompanyNorth American LightingNorthwest R-1 School DistrictOlin CorporationPanera Bread, LLCParkway School DistrictPeabody EnergyRockwood School DistrictSaint Louis CountySaint Louis Public SchoolsSchnuck Markets, Inc .Shelter InsuranceSigma-Aldrich CorporationSt . Louis Graphic ArtsSuddenlink CommunicationsTucson Electric Power CompanyWatlowWestRock Co .World Wide Technology, Inc .
Sustaining MembersAon-HewittLockton Companies, LLCMercerWillis Towers Watson
Purchasing PartnersCentene CorporationExpress Scripts, Inc .Mallinckrodt PharmaceuticalsSaint Louis University University of Missouri
About the BHCThe St . Louis Area Business Health Coalition (BHC) represents leading St . Louis employers in their efforts to improve the well-being of their employees and enhance the overall value of their health benefit investments . BHC employers seek a transparent health care market where comparative information about quality, cost and outcomes is used to achieve high-quality, patient-centered, and affordable care for all people in the region .
The BHC Foundation is a separate non-profit subsidiary organization to the BHC . The BHC Foundation’s purpose is to provide pertinent health care information to the community .
About this ReportThis report analyzes, summarizes, and presents information and trends on St . Louis area health plans that include data from fiscal year 2012 through 2014 . The report includes data from the following sources: U .S . Department of Health and Human Services HealthCare .gov, the Centers for Medicare and Medicaid Services, Health Plan 10-K reports filed with the Securities and Exchange Commission, and National Committee for Quality Assurance (NCQA) Quality Compass, as well as additional information voluntarily submitted by health plans . This report may be downloaded from the BHC website, at www .stlbhc .org .
Data Limitation and CautionsBHC has made every effort to provide accurate information . Each health plan was given the opportunity to verify its data . As with any analysis of industry data, a note of caution is advised . BHC depends upon the accuracy of the data sources and cannot guarantee the complete accuracy of all the data in this report . For example, NCQA Quality Compass data may not always report rates from year to year and rates may also be affected by small sample sizes . In this case, data inaccuracies that may remain for individual health plans would have minimal impact on weighted average values and virtually no impact on the overall conclusions .
Please read and become familiar with the technical discussion while reviewing or interpreting the data detailed in this report .
AcknowledgmentsBHC would like to acknowledge the health plan representatives who voluntarily provided BHC with health plan data . Health plan representatives and their staff worked extensively with BHC to verify the accuracy of the data . The additional time and effort spent analyzing and verifying the data was invaluable to the project’s success .
BHC especially thanks its members that provided funding to the BHC Foundation to make this publication possible .

,