Embed Size (px)
Citation preview

Sri Lanka Transmission Plans Including ExistingTransmission System and Generation & Demand
Forecast Inclusive of Existing Demand/Generation Scenario
Dr. H.M. WijekoonChief Engineer
(Transmission Planning)Ceylon Electricity Board
Sri Lanka
2nd Task Force 2 Meeting On “Advancement ofTransmission Systems Interconnections”

Government of Sri LankaMinistry of Power and Energy
Public Utilities Commissionof
Sri LankaCEB GenerationLicence GL
Consumers
CEB Disribution
Small Power Producers
Independent Power Producers
Lanka Electricity Company PVT Ltd.DL5
CEB Disribution
CEB DisributionLicence DL 2
CEB Disribution
CEB TransmissionLicence TL
Licence DL 1
Licence DL 4
Licence DL 3
Licensing
Licensing
GOSL PolicyDirections
Organization ofthe Power Sector

Sri Lankan EconomyDemographic and Economic Indicators of Sri Lanka
Electricity and Economy
Units 2006 2007 2008 2009 2010 2011 2012
Mid-Year Population Millions 19.89 20.01 20.22 20.45 20.65 20.87 20.32
Population Growth Rate % 1.1 1.1 1.0 1.1 1.0 1.0 n.a
GDP Real Growth Rate % 7.7 6.8 6.0 3.5 8.0 8.2 6.4
GDP /Capita (Market prices) US$ 1,421 1,634 2,014 2,057 2,400 2,836 2,923
Exchange Rate (Avg.) LKR/US$ 103.96 110.62 108.33 114.94 113.06 110.57 127.60
GDP Const 2002 Prices Mill LKR 2,090,564 2,232,656 2,365,501 2,449,214 2,645,542 2,863,854 3,047,277
Sri Lanka Economy and Electricity
Source: Annual Report 2012, Central Bank of Sri LankaElectricity and Economy
Forecast of GDP Growth Rate in Real Terms
Year 2012 2013 2014 2015GDP GrowthRate (%)
7.2 8.0 8.3 8.5
Source: Annual Report 2011, Central Bank of Sri Lanka
3

Electricity Data for 2012 Installed capacity - 3334 MW
Peak Demand - 2146 MW
Electricity Generated - 11800 GWh
Generation Mix - Hydro 28% Thermal 72%
Capacity Mix - Hydro 46% Thermal 54%
System losses - 11%
Load Factor - 62.8%
Access to Electricity - 94%
Elec. Consumption per Capita - 515 kWh
Avg. Cost per unit (at selling point) - 22.13 Rs/kWh
Avg. selling price - 15.56 Rs/kWh
Installed capacity - 3334 MW
Peak Demand - 2146 MW
Electricity Generated - 11800 GWh
Generation Mix - Hydro 28% Thermal 72%
Capacity Mix - Hydro 46% Thermal 54%
System losses - 11%
Load Factor - 62.8%
Access to Electricity - 94%
Elec. Consumption per Capita - 515 kWh
Avg. Cost per unit (at selling point) - 22.13 Rs/kWh
Avg. selling price - 15.56 Rs/kWh

EXISTING GENERATING SYSTEM
Plant NameCapacity
(MW)Expected Annual Avg.
Energy (GWh)Laxapana Complex
Canyon 60 160Wimalasurendra 50 112Old Laxapana 50 286New Laxapana 100 552Polpitiya 75 453Laxapana Total 335 1563
Mahaweli ComplexUpper Kotmale 150 409
Victoria 210 865
Committed plants for the study
• 35MW Broadlands HydropowerProject annual energy -126GWh
• 120 MW Uma Oya HydropowerProject annual energy - 231GWh
Hydro and Renewable
Victoria 210 865
Kotmale 201 498Randenigala 122 454Ukuwela 38 154Bowatenna 40 48Rantambe 49 239Mahaweli Total 810 2667
Other HydroSamanalawewa 120 344Kukule 70 300Small hydro 20Other Hydro Total 210 644
Wind plant 3
Existing Total 1355 4874
Committed plants for the study
• 35MW Broadlands HydropowerProject annual energy -126GWh
• 120 MW Uma Oya HydropowerProject annual energy - 231GWh
5

Thermal Plants
Plant Name
No of Units xName Plate
Capacity(MW)
No of Units xCapacity used
for Studies(MW)
AnnualMax.
Energy(GWh)
Puttalam Coal Power PlantPuttalam CPP-Phase I 1x300 1x275
Kelanitissa Power StationGas turbine (Old) 5 x 20 5 x 17 417
Committed plants for the study• Puttalam Coal Power Project Stage II
(Net 2x275MW)• 24MW Chunnakam Extension
power plant• 20MW Northern Power plant
Plant Retirements• 2019- 5x17 MW Kelanitissa Gas Turbines• 2019- 4x18 MW units at Sapugaskanda• 2023- 115 MW Kelanitissa Gas Turbine• 2023 -4x9 MW units at Sapugaskanda• 2025- 4x9 MW units at Sapugaskanda
EXISTING GENERATING SYSTEM
Gas turbine (Old) 5 x 20 5 x 17 417Gas turbine (New) 1 x 115 1 x 115 707Combined Cycle (JBIC) 1 x 165 1 x 165 1290Kelanitissa Total 380 365 2414
Sapugaskanda Power StationDiesel 4 x 20 4 x 18 472Diesel (Ext.) 8 x 10 8 x 9 504Sapugaskanda Total 160 144 976
Small Thermal PlantsChunnakam 1 x 8 - -Small Thermal Total 8 - -
Existing Total Thermal 848 784 3390
Plant Retirements• 2019- 5x17 MW Kelanitissa Gas Turbines• 2019- 4x18 MW units at Sapugaskanda• 2023- 115 MW Kelanitissa Gas Turbine• 2023 -4x9 MW units at Sapugaskanda• 2025- 4x9 MW units at Sapugaskanda
Recommended Plant Extensions by5 years up to year 2018• 22.5MW Lakdhanavi power plant• 20MW ACE Power Matara• 20MW ACE Power Horana
6

IPP Thermal PlantsEXISTING GENERATING SYSTEM
Plant NameCapacity
(MW)Capacity used
for Studies
Min . GuaranteedAnn. Energy
(GWh)Independent Power ProducersAsia Power LtdColombo Power (Pvt) LtdAES Kelanitissa (Pvt.) Ltd
Heladanavi (Pvt.) Ltd.ACE Power Embilipitiya Ltd
West Coast ( Pvt)Ltd.LakdhanaviACE Power MataraACE Power Horana
5164
163
100100
27022.524.824.8
4960
163
100100
27022.5
2020
300420
698697
156167167
Independent Power ProducersAsia Power LtdColombo Power (Pvt) LtdAES Kelanitissa (Pvt.) Ltd
Heladanavi (Pvt.) Ltd.ACE Power Embilipitiya Ltd
West Coast ( Pvt)Ltd.LakdhanaviACE Power MataraACE Power Horana
5164
163
100100
27022.524.824.8
4960
163
100100
27022.5
2020
300420
698697
156167167
Existing Total IPP 820.1 804.5 2605CommittedNorthern power 30 20 -Committed Total IPP 30 20
7Total Installed Capacity 3334 MW (Including Small Hydros and Wind)

Enhanced accessibility(2013)
Electrification Level inDecember 2013
60-80% 80-97%
<60%
>97%
Kurunegala
96 %
Moneragala
86%
Kilinochchi28%
Vavuniya
77 %
Trincomalee
88%
Polonnaruwa
88 %
Kegalle
96%
Batticoloa80%
Matale
95%Kandy
100 %
Nuwaraeliya
93%Ratnapura
89%Galle
100 %Hambantota
100%
Mullaithivu 25%
Anuradhapura
93 %
Badulla95%
Puttalam
95 %
Mannar87%
Ampara
95%
Matara
98 %
Kalutara
100%
Colombo100%
Gampaha100%
Jaffna 89 %
Electrification Level inDecember 2013
Enrich Life through Power
96%
60-80% 80-97%
<60%
>97%
Kurunegala
96 %
Moneragala
86%
Kilinochchi28%
Vavuniya
77 %
Trincomalee
88%
Polonnaruwa
88 %
Kegalle
96%
Batticoloa80%
Matale
95%Kandy
100 %
Nuwaraeliya
93%Ratnapura
89%Galle
100 %Hambantota
100%
Mullaithivu 25%
Anuradhapura
93 %
Badulla95%
Puttalam
95 %
Mannar87%
Ampara
95%
Matara
98 %
Kalutara
100%
Colombo100%
Gampaha100%
Jaffna 89 %


Hydro Capacity Variation During Last 3 Years


ELECTRICITY DEMAND FORECAST…
13
Sectorial Consumption of Electricity (2012)

Domestic Sectoro GDP Per Capitao Number of Domestic Consumer Accounts
ELECTRICITY DEMAND FORECAST
Methodology
• Econometric modelling has been adopted by CEB for theelectricity demand forecast.
• Sales figures of the past were analysed against followingindependent variables.
Domestic Sector
Industrial Sector
Commercial Sector
Other
o Number of Domestic Consumer Accounts
o Previous year sector electricity demand
o GDPo Previous year sector electricity demand
o GDPo Previous year sector electricity demand
o Time-trend analysis 14
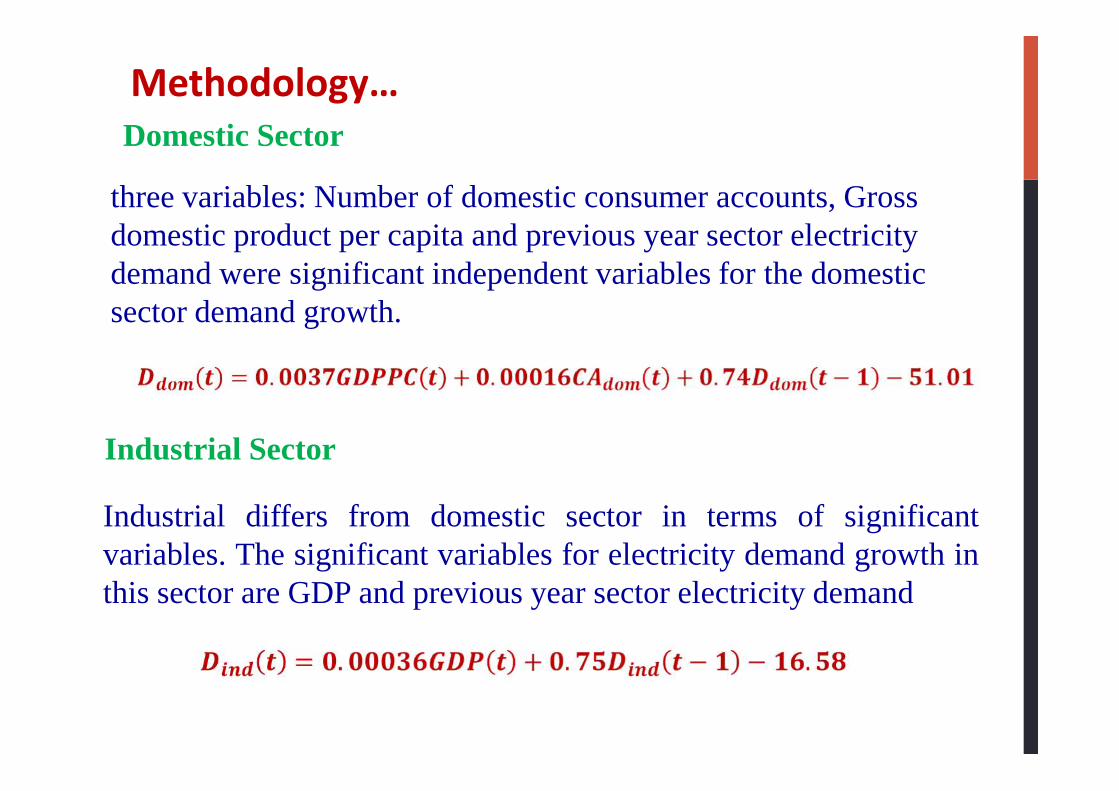
Methodology…Domestic Sector
three variables: Number of domestic consumer accounts, Grossdomestic product per capita and previous year sector electricitydemand were significant independent variables for the domesticsector demand growth.
Industrial Sector
Industrial differs from domestic sector in terms of significantvariables. The significant variables for electricity demand growth inthis sector are GDP and previous year sector electricity demand

Commercial (General Purpose) Sector
Commercial sector significant variables for electricity demandgrowth are GDP and previous year sector electricity demand, sameindustrial sector.
Other Sector
The two consumer categories: religious purpose and street lighting areconsidered in the ‘other sector’. Because of the diverse nature of theconsumers included in this category, this category was analysedwithout any links to other social or demographic variables. Hence, atime-trend analysis was performed to predict the demand in this sector
Other Sector

NATIONAL ELECTRICITY DEMAND FORECAST (2012-2032)Year Demand (GWh) Gross Losses (%) Generation (GWh) Peak Demand (MW)2013 11,104 11.6 12,566 2,4512014 12,072 11.6 13,502 2,6922015 12,834 11.6 14,509 2,8942016 13,618 11.5 15,388 3,0172017 14,420 11.4 16,270 3,1932018 15,240 11.3 17,171 3,3832019 16,075 11.1 18,087 3,5562020 16,937 11.0 19,030 3,7312021 17,830 10.9 20,010 3,9202021 17,830 10.9 20,010 3,9202022 18,754 10.8 21,023 4,1252023 19,713 10.7 22,072 4,2872024 20,707 10.6 23,159 4,4992025 21,737 10.5 24,284 4,7172026 22,813 10.4 25,458 4,9482027 23,932 10.3 26,677 5,1872028 25,101 10.2 27,949 5,3692029 26,318 10.1 29,273 5,6252030 27,581 10.0 30,645 5,8932031 28,899 8.0 32,079 6,1712032 30,258 9.8 33,555 6,461


LONG TERM TRANSMISSIONDEVELOPMENT PLAN
2013 - 2022
CEYLON ELECTRICITY BOARDSRI LANKA

PRESENT TRANSMISSION NETWORK -2013
Transmission voltage levels 220 kV 132 kV
Transmission Lines/Cables – 2348 km 220 kV 502 km
132 kV 1846 km
o OH 1796 kmo UG 50 km
Grid Substations No | MVA 132/33 kV 48 3045 220/132/33 kV 5 2100 220/132 kV 2 405 220/33 kV 1 70 132/11kV 5 369
Transmission voltage levels 220 kV 132 kV
Transmission Lines/Cables – 2348 km 220 kV 502 km
132 kV 1846 km
o OH 1796 kmo UG 50 km
Grid Substations No | MVA 132/33 kV 48 3045 220/132/33 kV 5 2100 220/132 kV 2 405 220/33 kV 1 70 132/11kV 5 369

2013 SriLankan
TransmissionSystem

Transmission Planning Procedure

Preparation of Grid Demand Forecast
National Power Demand is allocated among theexisting grid substations considering the trends ofload variation, spot loads and distribution networkarrangements
Overloaded grid substations are identified afterconsidering possible load transferred to adjacent gridsubstations
Augmentations and construction of new gridsubstations are established
This process is repeated until the grid substation demandforecast meet the planning criteria

TransmissionPlanning
Procedure
Generation Expansion Plan
YEARRENEWABLEADDITIONS
THERMALADDITIONS
THERMALRETIREMENTS
2013 - -4x5 MW ACE Power Matara4x5 MW ACE Power Horana4x5.63 MW Lakdanavi
2014 -4x5 MW Northern Power3x8 MW Chunnakum Extension**1x300 MW Puttalam Coal (Stage II)
2015 -
1x300 MW Puttalam Coal (StageIII)3x75 MW Gas Turbine
6x16.6 MW Heladanavi Puttalam14x7.11 MW ACE PowerEmbilipitiya4x15 MW Colombo Power
TransmissionPlanning
Procedure
2015 -
1x300 MW Puttalam Coal (StageIII)3x75 MW Gas Turbine
6x16.6 MW Heladanavi Puttalam14x7.11 MW ACE PowerEmbilipitiya4x15 MW Colombo Power
201635 MW Broadlands120 MW Uma Oya
- -
2017 - 1x10⁵ MW Gas Turbine -
201827 MW Moragolla
Plant2x250 MW Trincomalee Coal Powerplant
4x5 MW Northern Power8x6.13 MW Asia Power
2019 - 2x300 MW Coal plant5x17 MW Kelanitissa GasTurbines4x18 MW Sapugaskanda diesel
2020 - - -2021 - 1x300 MW Coal plant -2022 49 MW Gin Ganga 1x300 MW Coal plant -

Evaluation of Planning CriteriaEnsures quality and reliability of supplyunder normal operating conditions as wellas under single contingency conditions1) Voltage Criteria2) Thermal Criteria3) Security Criteria4) Stability Criteria5) Short Circuit Criteria1) Voltage Criteria2) Thermal Criteria3) Security Criteria4) Stability Criteria5) Short Circuit Criteria

Scenarios investigated underNormal and Single Contingency
Conditions
GenerationScenario
Load Scenario
DayPeak
NightPeak
Minimum
GenerationScenario Day
PeakNightPeak
Minimum
Hydro Max. HMDP HMNP
OP
Thermal Max. TMDP TMNP

2013
Project Proposals by Study Year 2013-2022
2014
2015 2016
2017 20192022
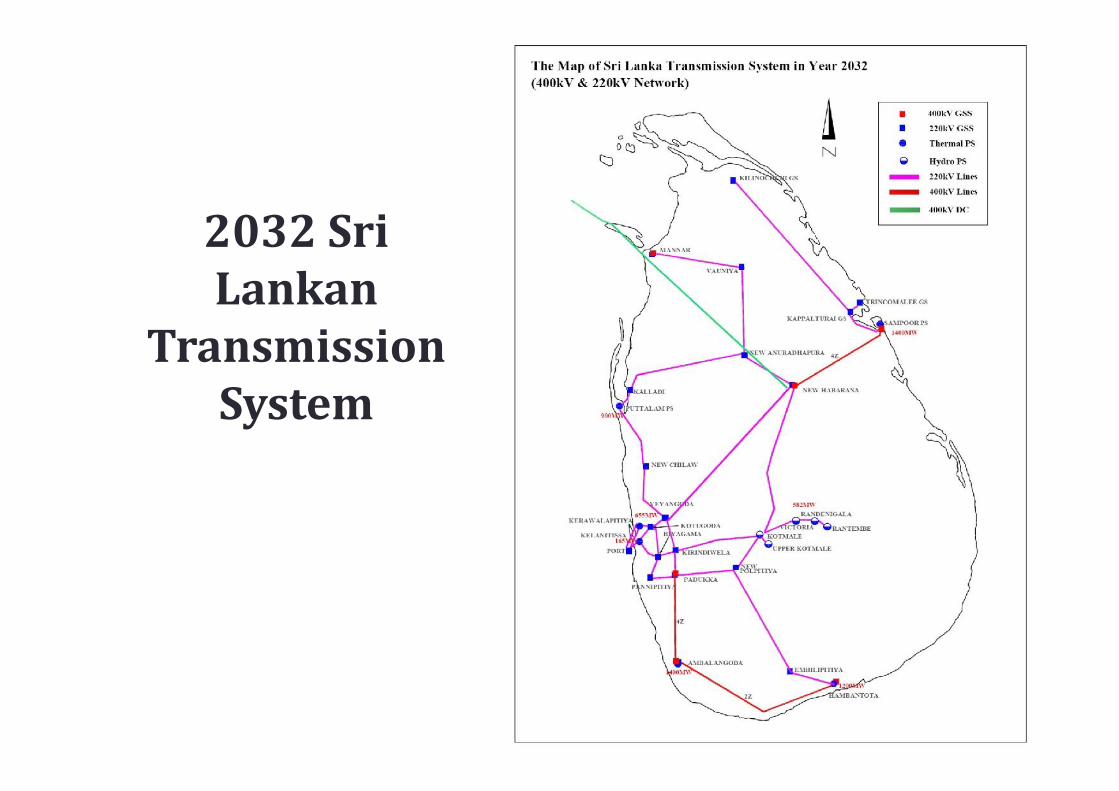
2032 SriLankan
TransmissionSystem
2032 SriLankan
TransmissionSystem


Total investment requirement from year 2013 to 2022

No. Name of Project Lender Cost(mUS$)
1 Clean Energy & Access Improvement Project ADB 1352 Augmentation of GS for Absorption of
Renewable EnergyGOSL 8
3 Augmentation of GS for Absorption ofRenewable Energy
ADB 130
4 Installation of Rantambe Inter- bus transformer GOSL/CEB 31
Projects Under Implementation
4 Installation of Rantambe Inter- bus transformer GOSL/CEB 315 Clean Energy & Network Efficiency
Improvement ProjectADB 130
6 Habarana – Veyangoda 220kV TransmissionProject
JICA 105
7 Greater Colombo Transmission & DistributionLoss Reduaction Project
JICA 205
Total (mUS$) 744

No. Name of Project Lender Cost(mUS$)
1 Construction of GS for RE Absorption FDA 302 Green Power Development and Energy
Efficiency Improvement ProgrammeADB 180
3 45th Yen Loan Package JICA 150Total (mUS$) 360
Projects Securing Funds

India - Sri Lanka Electricity GridInterconnection

Background Pre-feasibility study conducted with the assistance of USAID in
2002 by Nexant Inc.
Review of the Pre-feasibility study with assistance of USAID in2006 by Nexant/ Power Grid Corporation of India
Bilateral discussions by Secretary , Ministry of Power and EnergySri Lanka and Secretary Ministry of Power, India in Dec 2006.
Cabinet of Ministers approved in principle in Dec 2006, to studythe feasibility of power interconnection and to appoint aSteering Committee Co- Chaired by Secretaries of PowerMinistries and to appoint a Task Force for technical, commercial,regulatory and legal aspects.
36
Pre-feasibility study conducted with the assistance of USAID in2002 by Nexant Inc.
Review of the Pre-feasibility study with assistance of USAID in2006 by Nexant/ Power Grid Corporation of India
Bilateral discussions by Secretary , Ministry of Power and EnergySri Lanka and Secretary Ministry of Power, India in Dec 2006.
Cabinet of Ministers approved in principle in Dec 2006, to studythe feasibility of power interconnection and to appoint aSteering Committee Co- Chaired by Secretaries of PowerMinistries and to appoint a Task Force for technical, commercial,regulatory and legal aspects.

Background Conts. A MOU on Feasibility Study for India- Sri Lanka
Electricity Grid Interconnection was signed amongGOSL, GOI, CEB and Power Grid Corporation of IndiaLimited (PGCIL) on 9th June 2010.
Executing Agencies; CEB and PGCIL are jointly carryingout the feasibility study
37
A MOU on Feasibility Study for India- Sri LankaElectricity Grid Interconnection was signed amongGOSL, GOI, CEB and Power Grid Corporation of IndiaLimited (PGCIL) on 9th June 2010.
Executing Agencies; CEB and PGCIL are jointly carryingout the feasibility study

Benefits and Opportunities forSri Lanka
• Opportunity to enter into India Power Exchange forenergy trading
• Access to electricity from cheaper sources of powergeneration in the South Asia Region
• Reduction in operational cost through better resourcemanagement
• Meeting growing power demand with importedpower
• Improved load profile - valley filling• Improved system reliability and security
17 June 2014 38
• Opportunity to enter into India Power Exchange forenergy trading
• Access to electricity from cheaper sources of powergeneration in the South Asia Region
• Reduction in operational cost through better resourcemanagement
• Meeting growing power demand with importedpower
• Improved load profile - valley filling• Improved system reliability and security

Line RouteMaduari Panaikulam
130km Thiruketis-waram
120kmA’Pura
110kmsubmarineoverhead overhead
High voltage direct current (HVDC), operating at ±400 kV Total interconnection capacity will be 1000 MW

Potential for Power Exchange Contracts• Short term contracts
– Monthly average prices reported in Indian short term market are inthe range of 6.68 to 9.52 UScts/kWh (capacity + energy)
– monthly average purchase prices forecast for Sri Lanka are in therange of 6.50 to 13.46 UScts/kWh (energy only)
– During peak hours, Sri Lanka can make use of the lower cost Indianshort term market
– During off peak, the excess coal based generation in Sri Lankacould be sold to the Indian short term market
• Long term contracts– Owing to economies of scale, Sri Lanka signing up with an Indian
UMPP could be cheaper than building own plants– Similarly, if Sri Lanka can build an UMPP, it can also serve the
Indian base load, owing to the persistent shortfall in India
• Short term contracts– Monthly average prices reported in Indian short term market are in
the range of 6.68 to 9.52 UScts/kWh (capacity + energy)– monthly average purchase prices forecast for Sri Lanka are in the
range of 6.50 to 13.46 UScts/kWh (energy only)– During peak hours, Sri Lanka can make use of the lower cost Indian
short term market– During off peak, the excess coal based generation in Sri Lanka
could be sold to the Indian short term market
• Long term contracts– Owing to economies of scale, Sri Lanka signing up with an Indian
UMPP could be cheaper than building own plants– Similarly, if Sri Lanka can build an UMPP, it can also serve the
Indian base load, owing to the persistent shortfall in India
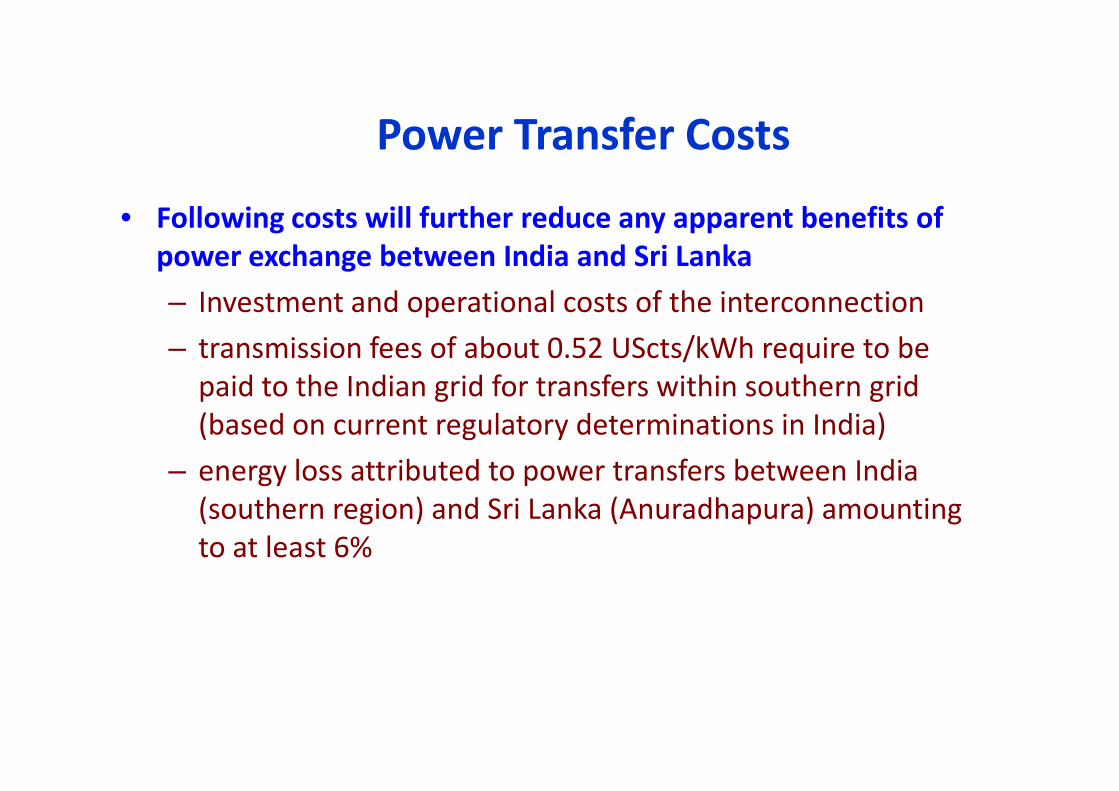
Power Transfer Costs
• Following costs will further reduce any apparent benefits ofpower exchange between India and Sri Lanka– Investment and operational costs of the interconnection– transmission fees of about 0.52 UScts/kWh require to be
paid to the Indian grid for transfers within southern grid(based on current regulatory determinations in India)
– energy loss attributed to power transfers between India(southern region) and Sri Lanka (Anuradhapura) amountingto at least 6%

Legal and Regulatory Issues
CEB needs to be empowered to enter into cross-border power transfers The Transmission and Bulk Supply license held by CEB
is required to be amended Dispute resolution in the Sri Lanka Electricity Act
requires to be further strengthened CEB Act has to be amended to enable the functions of
trader or broker, as relevant

To achieve project viability The project must be structured as a 1x500 MW monopolar
interconnection with no specific assets or commitments now toraise the capacity to 1000 MW If the project costs are further reduced by reconsidering the
routing options, the 1x500 MW monopolar option has thepotential to be viable Target project cost for a POWERGRID-CEB joint venture to be
profitable is 372.4 MUSD (excluding customs duty and taxes),which at present is estimated to be 554 MUSD Both Sri Lanka and India be allowed participation in the wholesale
market in each others’ country, with full options and freedom toparticipate in the short-term, day-ahead and unscheduledinterchanges market Sri Lankan power system shall relax its maximum load share
condition and allow the interconnection to supply at the optimalcapacity level
The project must be structured as a 1x500 MW monopolarinterconnection with no specific assets or commitments now toraise the capacity to 1000 MW If the project costs are further reduced by reconsidering the
routing options, the 1x500 MW monopolar option has thepotential to be viable Target project cost for a POWERGRID-CEB joint venture to be
profitable is 372.4 MUSD (excluding customs duty and taxes),which at present is estimated to be 554 MUSD Both Sri Lanka and India be allowed participation in the wholesale
market in each others’ country, with full options and freedom toparticipate in the short-term, day-ahead and unscheduledinterchanges market Sri Lankan power system shall relax its maximum load share
condition and allow the interconnection to supply at the optimalcapacity level

Revised Electricity Grid Interconnection
190 km
50km
Madurai
Thalai Mannar50km
140 km
NewAnuradhapura
Thalai Mannar

Thank YouDr. H.M. Wijekoon
Ceylon Electricity [email protected]
Ceylon Electricity Board 45
Thank YouDr. H.M. Wijekoon
Ceylon Electricity [email protected]

Voltage Criteria
Bus bar
voltage
Allowable voltage variation (%)
Normal operatingcondition
Single contingencycondition
Bus bar
voltageNormal operating
conditionSingle contingency
condition
220 kV 10% 10%
132 kV 10% 10%
Thermal Criteria
Loading of any element should not exceed theirrated thermal loading values for steady statecondition
Loading of any element should not exceed theirrated thermal loading values for steady statecondition

Security Criteria
After outage of any element, the system shouldbe able to meet the distribution demandmaintaining the specified voltage levels andremaining circuits should not exceed theiremergency ratings.
After outage of any element, the system shouldbe able to meet the distribution demandmaintaining the specified voltage levels andremaining circuits should not exceed theiremergency ratings.

Stability Criteria
Ensures the system stability during andafter disturbances in case of
Three Phase fault at any overhead lineterminal cleared by successful andunsuccessful re-closing
Loss of any generation unit
Load rejection
Ensures the system stability during andafter disturbances in case of
Three Phase fault at any overhead lineterminal cleared by successful andunsuccessful re-closing
Loss of any generation unit
Load rejection

Short Circuit Criteria
BusbarVoltage System
Maximum 3Phase Fault
level (kA)
132kV andabove
Over head 40.0
UG Cable 40.0132kV and
above UG Cable 40.0
33kVOver head 25.0
UG Cable 25.0
11kV UG Cable 25.0