Embed Size (px)
Citation preview
SR QPM OPOor
How many acronymscan you put in your title?
Dipl.-Phys. Carsten Langrock
Ginzton Lab, Stanford University
AP305 – p.1

Outline
• Motivation:What are optical parametric oscillators?Why not use a laser instead?
• Theory:SVEA, SFG, DFG, OPA, OPG, OPO, QPM
. . . any questions?• Experimental Setup:
What to do when you cannot measure your signaldirectly.
• Experimental Results:Temperature & QPM-Period Tuning,Pump Depletion.
• Conclusion: Where do we go from here?
AP305 – p.2

Outline
• Motivation:What are optical parametric oscillators?Why not use a laser instead?
• Theory:SVEA, SFG, DFG, OPA, OPG, OPO, QPM
. . . any questions?
• Experimental Setup:What to do when you cannot measure your signaldirectly.
• Experimental Results:Temperature & QPM-Period Tuning,Pump Depletion.
• Conclusion: Where do we go from here?
AP305 – p.2
Outline
• Motivation:What are optical parametric oscillators?Why not use a laser instead?
• Theory:SVEA, SFG, DFG, OPA, OPG, OPO, QPM
. . . any questions?• Experimental Setup:
What to do when you cannot measure your signaldirectly.
• Experimental Results:Temperature & QPM-Period Tuning,Pump Depletion.
• Conclusion: Where do we go from here?
AP305 – p.2

Outline
• Motivation:What are optical parametric oscillators?Why not use a laser instead?
• Theory:SVEA, SFG, DFG, OPA, OPG, OPO, QPM
. . . any questions?• Experimental Setup:
What to do when you cannot measure your signaldirectly.
• Experimental Results:Temperature & QPM-Period Tuning,Pump Depletion.
• Conclusion: Where do we go from here?AP305 – p.2

Motivation
What are optical parametric oscillators?
• Widely tunable source for coherent radiation.• Efficient nonlinear conversion from “pump” to
“signal” wavelength.• Low threshold for onset of oscillation.
AP305 – p.3
Motivation II
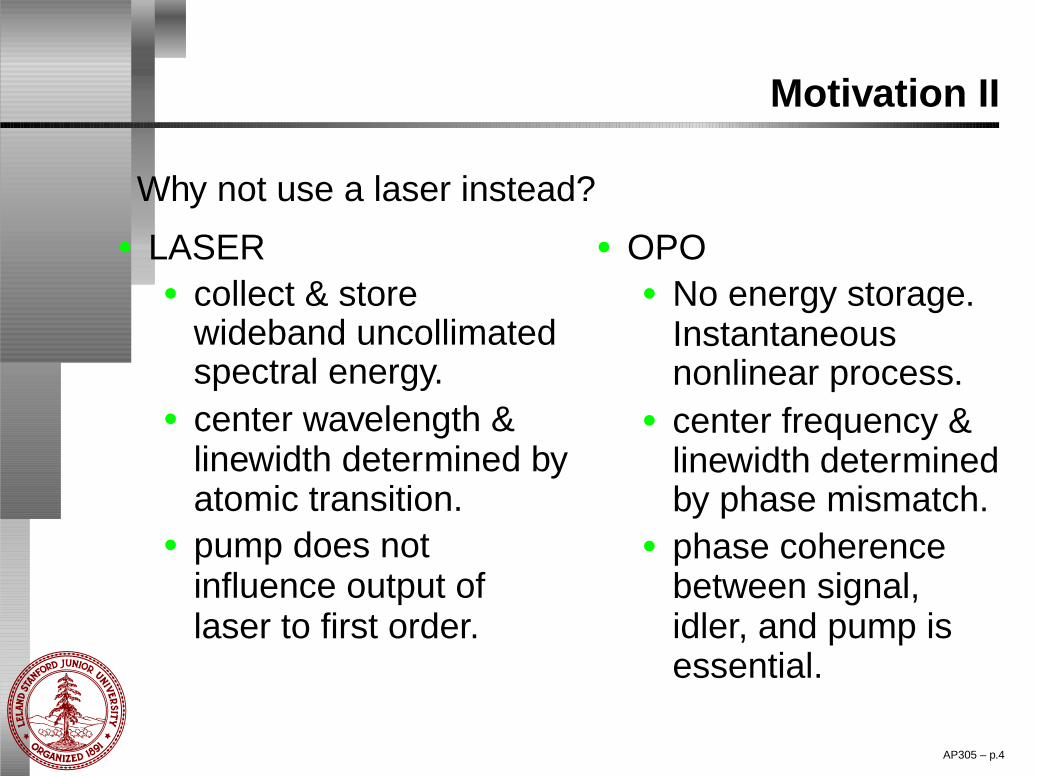
Why not use a laser instead?
• LASER• collect & store
wideband uncollimatedspectral energy.
• center wavelength &linewidth determined byatomic transition.
• pump does notinfluence output oflaser to first order.
• OPO• No energy storage.
Instantaneousnonlinear process.
• center frequency &linewidth determinedby phase mismatch.
• phase coherencebetween signal,idler, and pump isessential.
AP305 – p.4

Theory
Optical Parametric Oscillators (OPO)• Maxwell’s equations in source-free media• Slowly Varying Envelope Approximation (SVEA)
• Examine χ(2) processes, i.e. P (t) ∼ E2(t)
• Three field interaction at ωp, ωs, and ωi
dEp
dz= −iηpωpd(z)EsEie
i∆kz with ωp = ωs + ωi
dEs
dz= −iηsωsd(z)EpE
∗
i e−i∆kz ∆k = kp − ks − ki
dEi
dz= −iηiωid(z)EpE
∗
se−i∆kz
AP305 – p.5

Theory II
Coupled equations describe various nonlinearprocesses.
• Sum Frequency Generation (SFG):strong pump signal at ωi, weak signal at ωs
up-converted signal at ωp
• Difference Frequency Generation (DFG):strong pump at ωp, signal at ωs signal at ωi
• Parametric Generation (OPA, OPG, OPO):strong pump at ωp generation of signals at ωs
and ωi
AP305 – p.6
Theory III
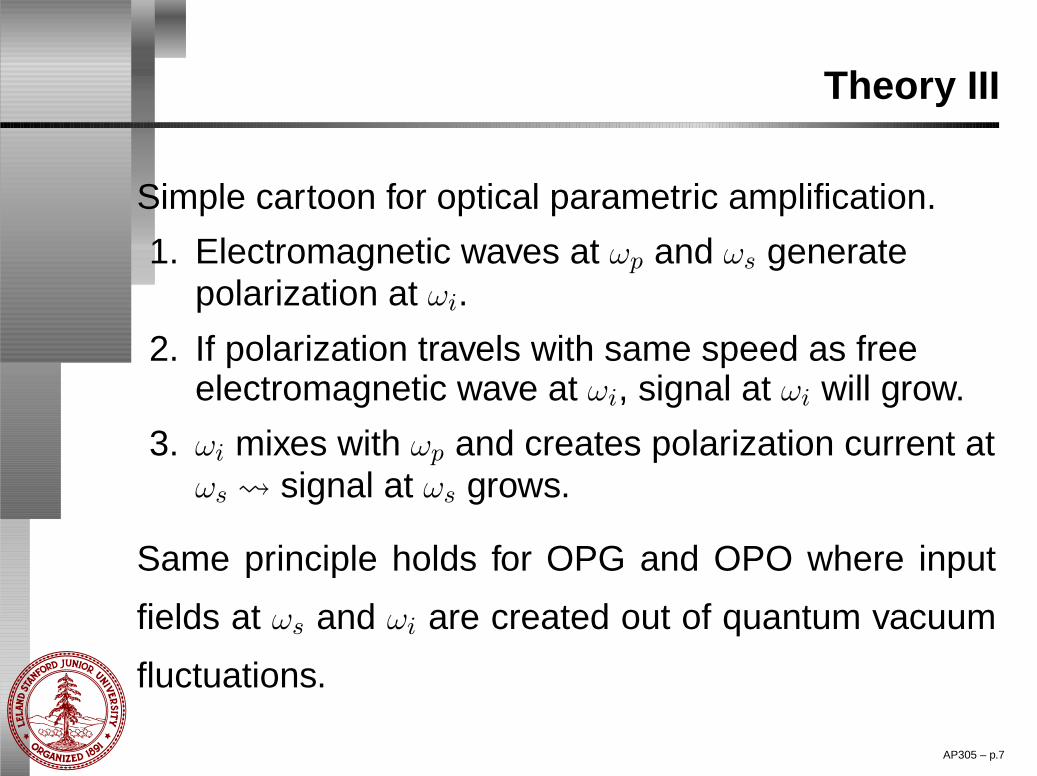
Simple cartoon for optical parametric amplification.
1. Electromagnetic waves at ωp and ωs generatepolarization at ωi.
2. If polarization travels with same speed as freeelectromagnetic wave at ωi, signal at ωi will grow.
3. ωi mixes with ωp and creates polarization current atωs signal at ωs grows.
Same principle holds for OPG and OPO where input
fields at ωs and ωi are created out of quantum vacuum
fluctuations.
AP305 – p.7
Theory IV
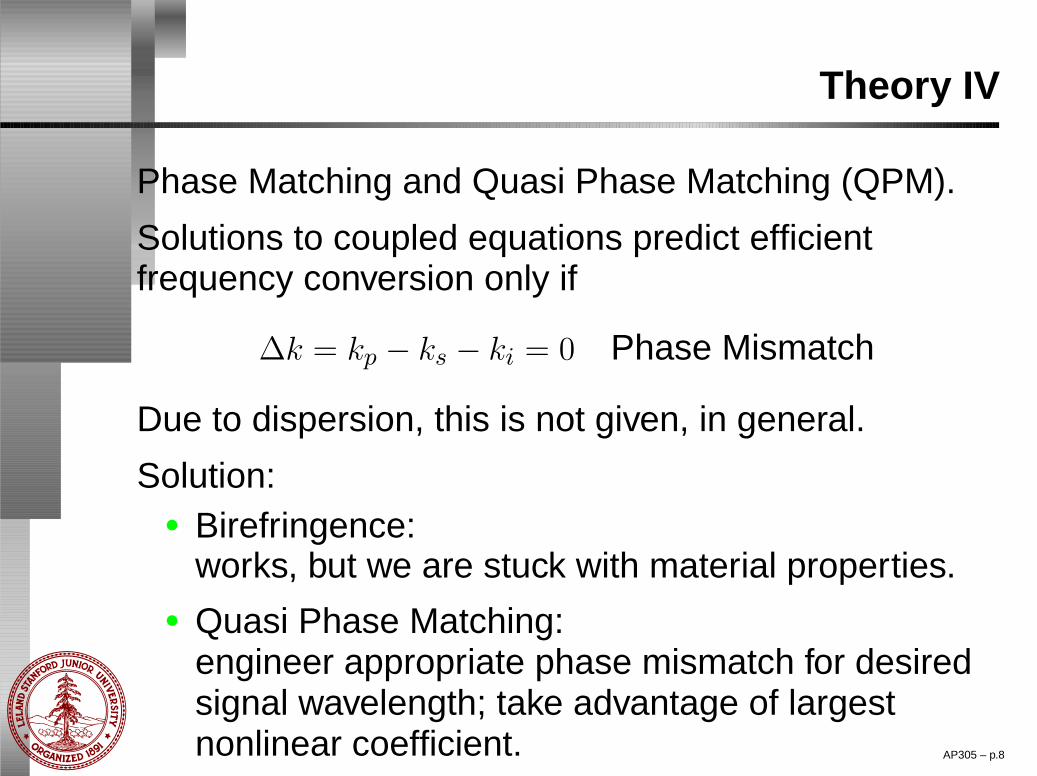
Phase Matching and Quasi Phase Matching (QPM).
Solutions to coupled equations predict efficientfrequency conversion only if
∆k = kp − ks − ki = 0 Phase Mismatch
Due to dispersion, this is not given, in general.
Solution:• Birefringence:
works, but we are stuck with material properties.• Quasi Phase Matching:
engineer appropriate phase mismatch for desiredsignal wavelength; take advantage of largestnonlinear coefficient. AP305 – p.8

Theory V
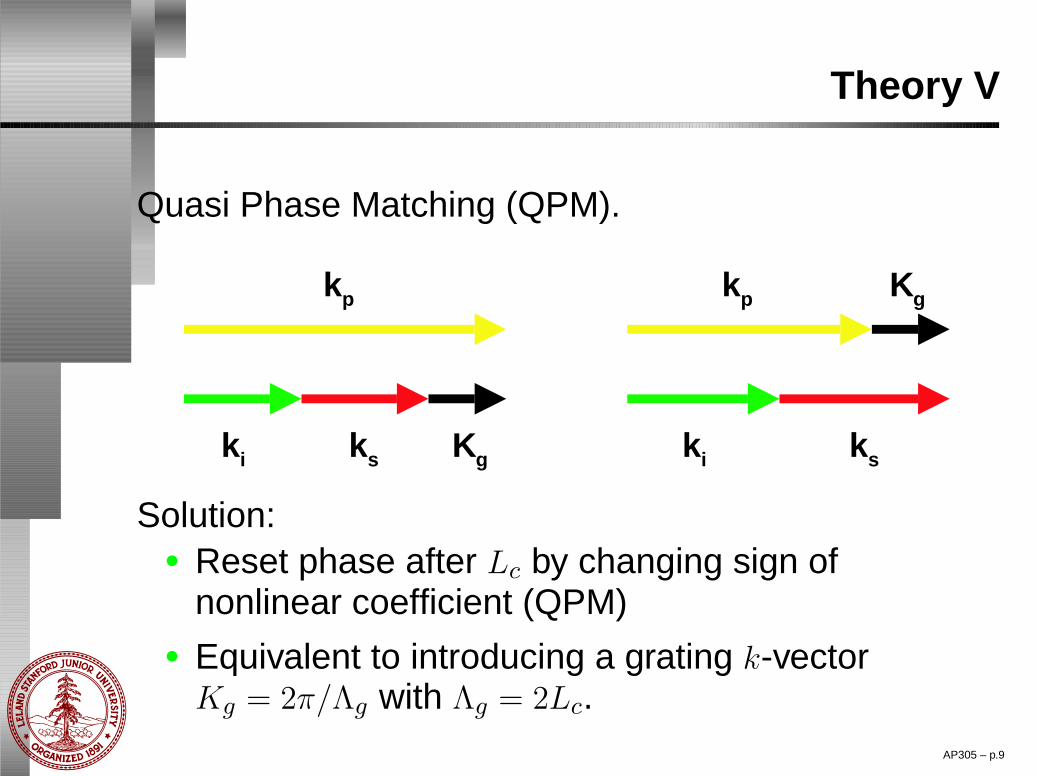
Quasi Phase Matching (QPM).
Problem:• ∆k 6= 0
conversion only over crystal length Lc = π/∆k.• Polarization and free wave slip out of phase.
kp
ki ks Kg
kp
ki ks
Kg
Solution:• Reset phase after Lc by changing sign of
nonlinear coefficient (QPM)• Equivalent to introducing a grating k-vector
Kg = 2π/Λg with Λg = 2Lc.
AP305 – p.9
Theory V
Quasi Phase Matching (QPM).
kp
ki ks Kg
kp
ki ks
Kg
Solution:• Reset phase after Lc by changing sign of
nonlinear coefficient (QPM)• Equivalent to introducing a grating k-vector
Kg = 2π/Λg with Λg = 2Lc.AP305 – p.9

Theory VI
Quasi Phase Matching (QPM).
0
5
10
15
20
25
30
1 2 3 4Propagation Distance (L )c
SH
G P
ower
(a.
u.)
AP305 – p.10

Experimental Setup
Q-switched Nd:YAG @ 1.06 µmvariable
Attenuator
HR @ 1.5 µmHR @ 1.5 µm
PPLN
HR @ 0.632 µm HT @ 1.06 µm
Si Photodiode
InGaAs Photodiode
Lens
Oven
Translation Stage
Signal and idler wavelength are determined by phasemismatch:
1
Λg=
np
λp−
ns
λs−
ni
λi
Tuning is achieved by varying either Λg, np, ns, or ni,i.e. change temperature or QPM period.
AP305 – p.11

Experimental Results
Temperature Tuning.
Temp er at ur e ( o C)
80 100 120 140 160 180
Wa v
el en
gt h
(n m
)
1500
2000
2500
3000
3500
Signal: 1529.2 - 1 607. 0 nm Id le r: 349 7. 5 - 3148. 7 nm
Measured ωp + ωs ωs and ωi via ωp = ωs + ωi
and ωp = 1.06µm.AP305 – p.12
Experimental Results II
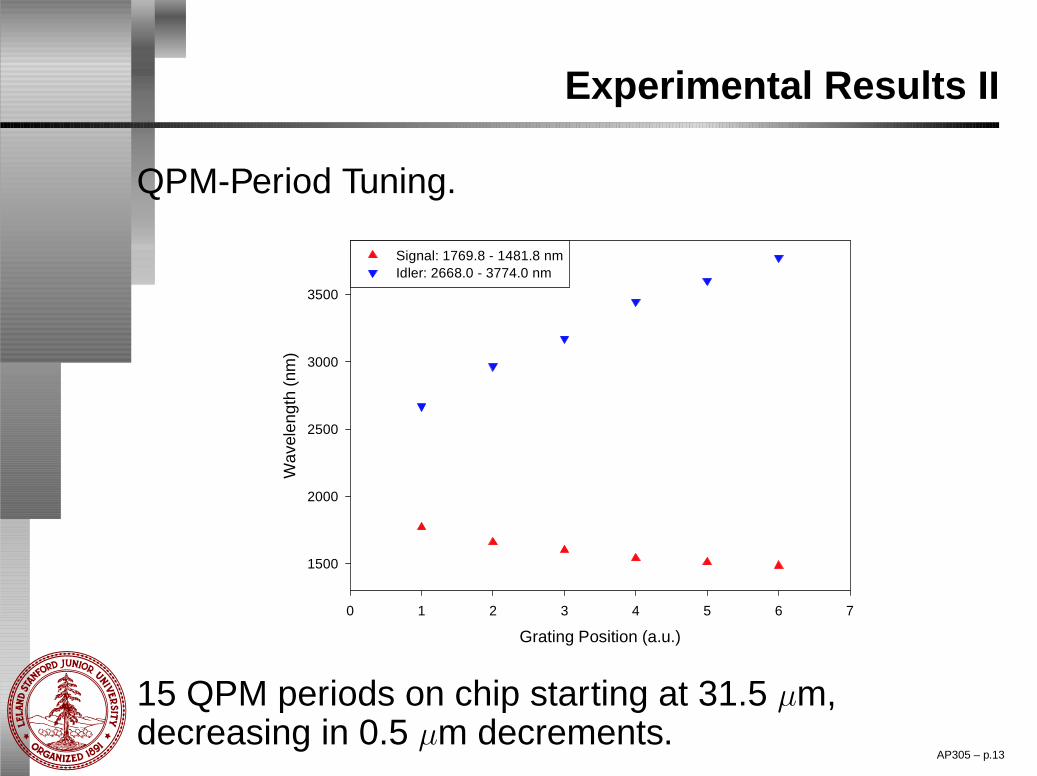
QPM-Period Tuning.
Grating Po si ti on (a .u .)
0 1 2 3 4 5 6 7
Wa v
e len
gth
(nm
)
1500
2000
2500
3000
3500
Signal: 1769.8 - 1 481. 8 nm Id le r: 266 8. 0 - 3774. 0 nm
15 QPM periods on chip starting at 31.5 µm,decreasing in 0.5 µm decrements.
AP305 – p.13

Experimental Results III
Pump Depletion = Increased Conversion Efficiency.
Time (n s)
0 2 0 4 0 6 0 8 0
Pum
p A
mpl
itude
(a.
u .)
0
1
2
3
In creasi ng Pump Conv ersi on
As the pump energy is being increased, the conversionefficiency increases and the pump gets depleted. AP305 – p.14

Conclusion
In this talk we presented the
• theory behind OPA, OPG, OPO, and other χ(2)
processes.• need for phase matching to achieve efficient
conversion.• advantage of quasi phase matching as compared
to birefringent phase matching.• generation of 1.6 µm, 3 µm, and 636 nm radiation
using an OPO.• possibility of temperature and QPM-period tuning.
AP305 – p.15

Outlook
Future research will involve• direct detection of signal wavelength at 1.6 µm.• complete characterization of conversion efficiency.• modification of setup to lower oscillation threshold
(DRO instead of SRO).• implementation of continuously tunable
QPM-period by means of “fanned” grating structure
AP305 – p.16

Acknowledgements
I would like to acknowledge contributions to thisresearch by the following people:
• Arun Sridharan• Karel Urbanek• Supriyo Sinha• David S. Hum• Eleni Diamanti• Mathieu Charbonneau-Lefort
AP305 – p.17