Embed Size (px)
Citation preview

L3 Cache
DBA Level 400
C P U
L2 Cache
L1 Cache
Core Core
L2 Cache
L1 Cache

About me
An independent SQL Consultant
A user of SQL Server from version 2000 onwards with 12+ years experience.
Speaker, both at UK user group events and at conferences.
I have a passion for understanding how the database engine worksat a deep level.
“Everything fits in memory, so performance is as good as it will get. It fits in memory therefore end of story”

Demonstration #1A Simple Query That Defies
Conventional Wisdom

Demonstration #1 Repeated With ‘Bigger’ Hardware
CPU6 core 2.0 Ghz (Sandybridge)
Warm large object cache used in all tests to remove storage as a factor.
CPU6 core 2.0 Ghz (Sandybridge)
48 Gb quad channel 1333 Mhz DDR3 memory
Hyper-threading enabled, unless specified otherwise.
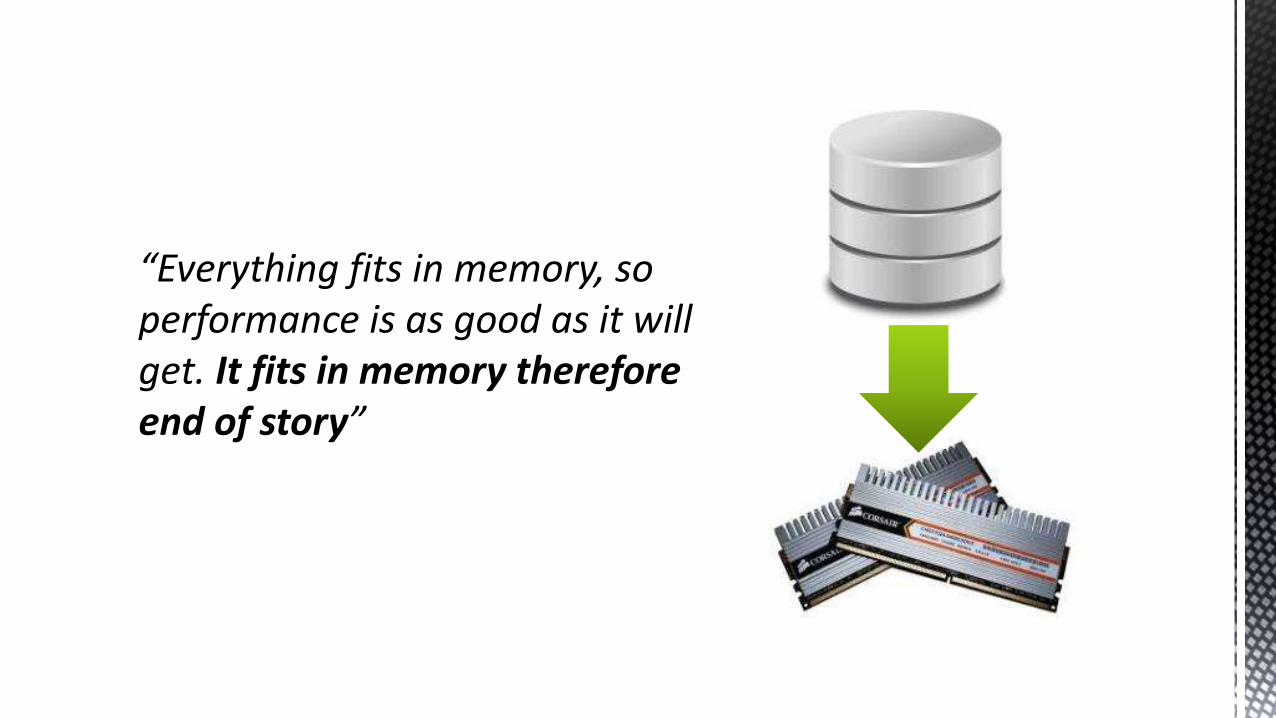
Which SELECT Statement Has The Lowest Elapsed Time ?
17.41Mb column store Vs. 51.7Mb column store
WITH generator AS (
SELECT TOP 3000 id = Row_Number() OVER (ORDER BY a)
FROM (SELECT a = 1
FROM master.dbo.syscolumns) c1
CROSS JOIN master.dbo.syscolumns c2
)
SELECT d.DateKey AS OrderDateKey
,CAST(((id - 1) % 1048576) AS money ) AS Price1
,CAST(((id - 1) % 1048576) AS money ) AS Price2
,CAST(((id - 1) % 1048576) AS money ) AS Price3
INTO FactInternetSalesBigNoSort
FROM generator
CROSS JOIN [dbo].[DimDate] d
CREATE CLUSTERED COLUMNSTORE INDEX ccsi ON
FactInternetSalesBigNoSort
SELECT CalendarQuarter
,SUM([Price1])
,SUM([Price2])
,SUM([Price3])
FROM [dbo].[FactInternetSalesBigNoSort] f
JOIN [DimDate] d
ON f.OrderDateKey = d.DateKey
GROUP BY CalendarQuarter
WITH generator AS (
SELECT TOP 3000 id = Row_Number() OVER (ORDER BY a)
FROM (SELECT a = 1
FROM master.dbo.syscolumns) c1
CROSS JOIN master.dbo.syscolumns c2
)
SELECT d.DateKey AS OrderDateKey
,CAST(((id - 1) % 1048576) AS money ) AS Price1
,CAST(((id - 1) % 1048576) AS money ) AS Price2
,CAST(((id - 1) % 1048576) AS money ) AS Price3
INTO FactInternetSalesBigSorted
FROM generator
CROSS JOIN [dbo].[DimDate] d
CREATE CLUSTERED INDEX ccsi
ON FactInternetSalesBigNoSorted ( OrderDateKey )
CREATE CLUSTERED COLUMNSTORE INDEX ccsi ON
FactInternetSalesBigNoSorted
WITH (DROP_EXISTING = ON)
SELECT CalendarQuarter
,SUM([Price1])
,SUM([Price2])
,SUM([Price3])
FROM [dbo].[FactInternetSalesBigSorted] f
JOIN [DimDate] d
ON f.OrderDateKey = d.DateKey
GROUP BY CalendarQuarter
The fastest
?
The fastest
?

The Case of The Two Column Store Index Sizes
SQL Server query tuning 101
The optimizer will always use the smaller data structures it can find to satisfy the query, right ?

How Well Do The Queries Using The Two Column Stores Scale ?
0
10000
20000
30000
40000
50000
60000
70000
80000
2 4 6 8 10 12 14 16 18 20 22 24
Tim
e (m
s)
Degree of Parallelism
Non-sorted column store Sorted column store
Data creation statement scaled using top 300,000 to create 1,095,600,000 rows.

Can We Use All Available CPU Resource ?
0
10
20
30
40
50
60
70
80
90
100
2 4 6 8 10 12 14 16 18 20 22 24
Perc
enta
ge C
PU
Uti
lizat
ion
Degree of Parallelism
Non-sorted Sorted
Memory access should be 100%
CPU intensive ?!?
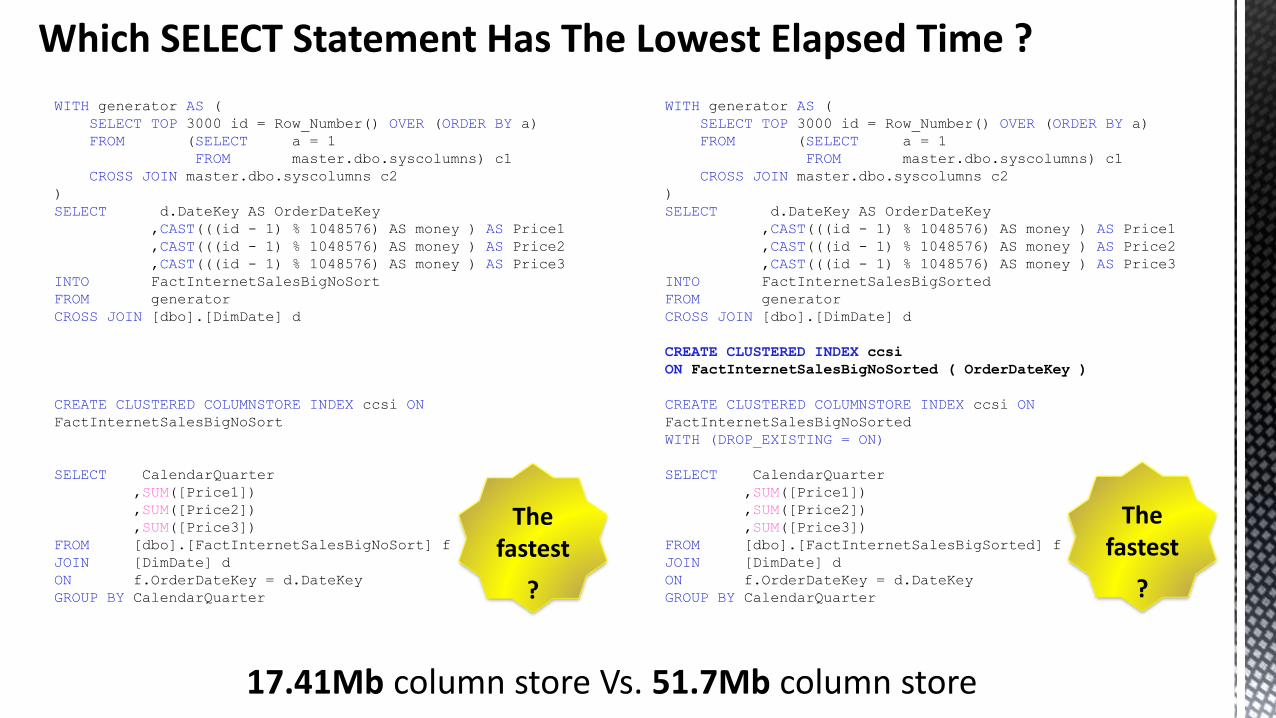
Wait Statistics Do Not Help Here !
Stats are for the query ran with a DOP of 24, a warm column store object pool and the column store created on pre-sorted data.
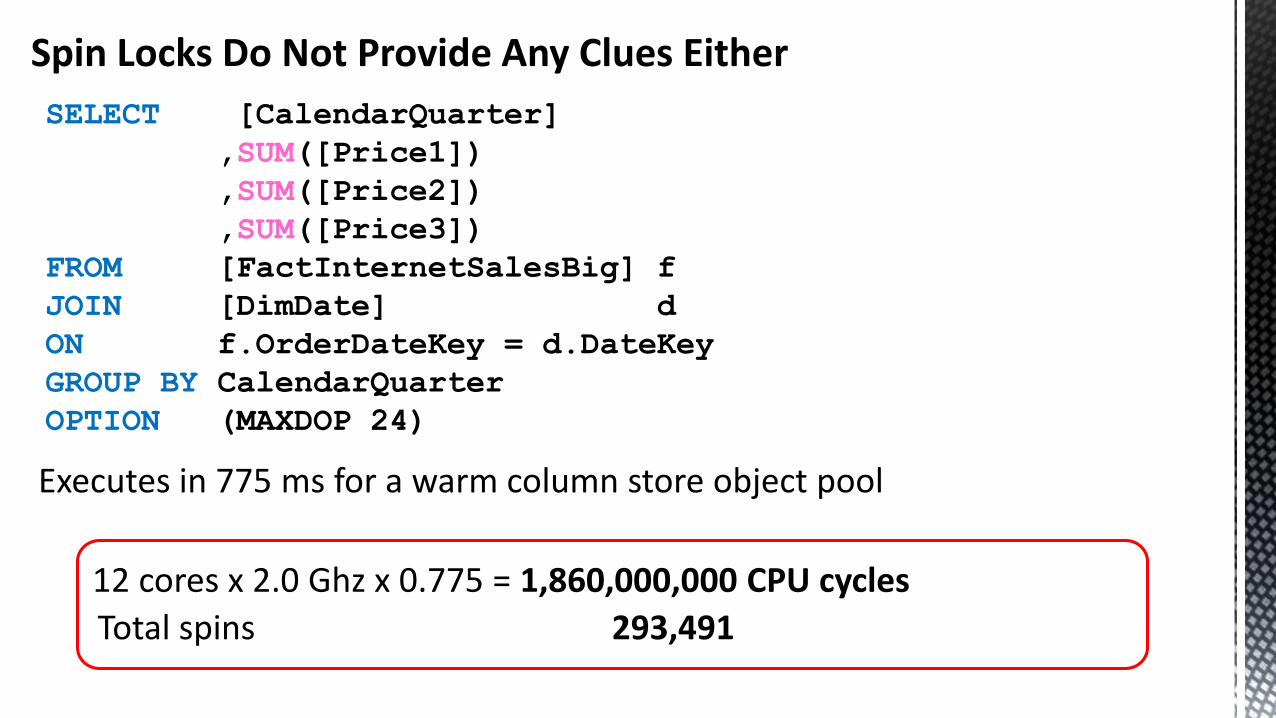
Spin Locks Do Not Provide Any Clues Either
Executes in 775 ms for a warm column store object pool
12 cores x 2.0 Ghz x 0.775 = 1,860,000,000 CPU cycles
Total spins 293,491
SELECT [CalendarQuarter]
,SUM([Price1])
,SUM([Price2])
,SUM([Price3])
FROM [FactInternetSalesBig] f
JOIN [DimDate] d
ON f.OrderDateKey = d.DateKey
GROUP BY CalendarQuarter
OPTION (MAXDOP 24)
Well Documented Tools
Dynamic management views and functions
Performance counters
Extended events
Not all wait events, latches and spin locks are well documented if documented at all.
Takeaway: These tools are not going to tell us definitively where our CPU time is going !!!

The Problem With Query Plan Costs
Assumptions:
The buffer cache is cold.
IO cannot be performed in parallel.
Data in different columns is never correlated ( improved on in SQL 2014 ).
Hash distribution is always uniform.
Etc. . . .
Based on the amount of time it took a developers machine to complete certain operations, a Dell OptiPlex ( according to legend ).

Response Time
Wait Time
+
Service Time
We need something to help find out what is happening
here.

A Not So Well Documented Tool
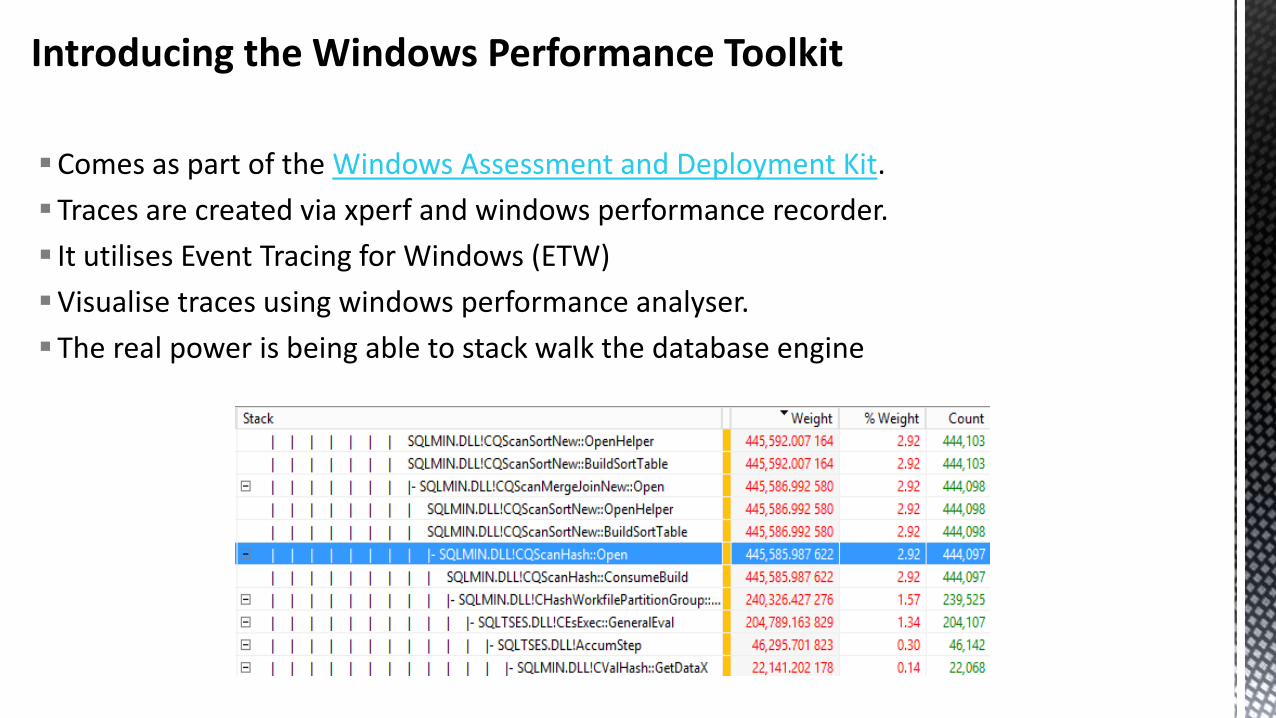
Introducing the Windows Performance Toolkit
Comes as part of the Windows Assessment and Deployment Kit.
Traces are created via xperf and windows performance recorder.
It utilises Event Tracing for Windows (ETW)
Visualise traces using windows performance analyser.
The real power is being able to stack walk the database engine

Public Symbols
These are labels contained in .pdb files that provide information on what programming construct generated a piece of machine code, also known as debug symbols.
Caution: public
symbols are version
specific, down to
CU level !
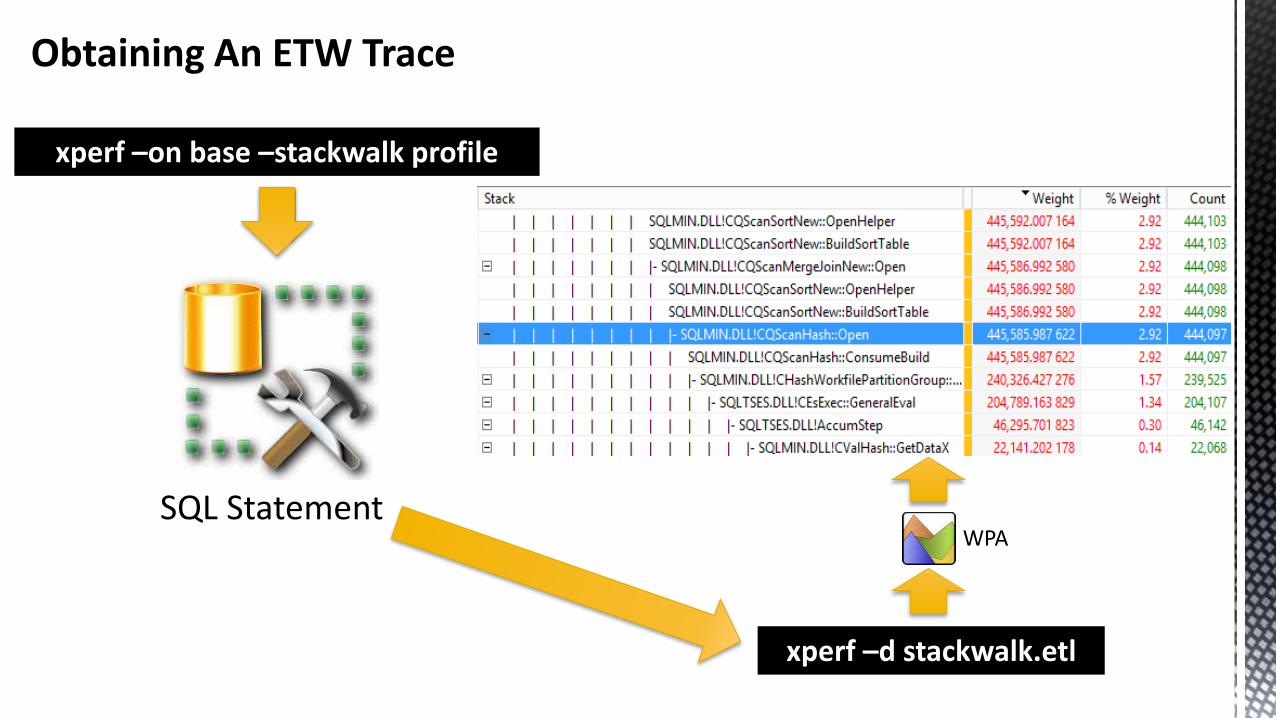
Obtaining An ETW Trace Stack Walking The Database Engine
xperf –on base –stackwalk profile
xperf –d stackwalk.etl
WPASQL Statement

Basic xperf Command Line Syntax
xperf –on < kernel flags | kernel groups > [ -stackwalk < stackwalk kernel providers ]
Kernel groups are groups of flags and not to be confused with Windows kernel groups
Takeaway: kernel groups make life easier
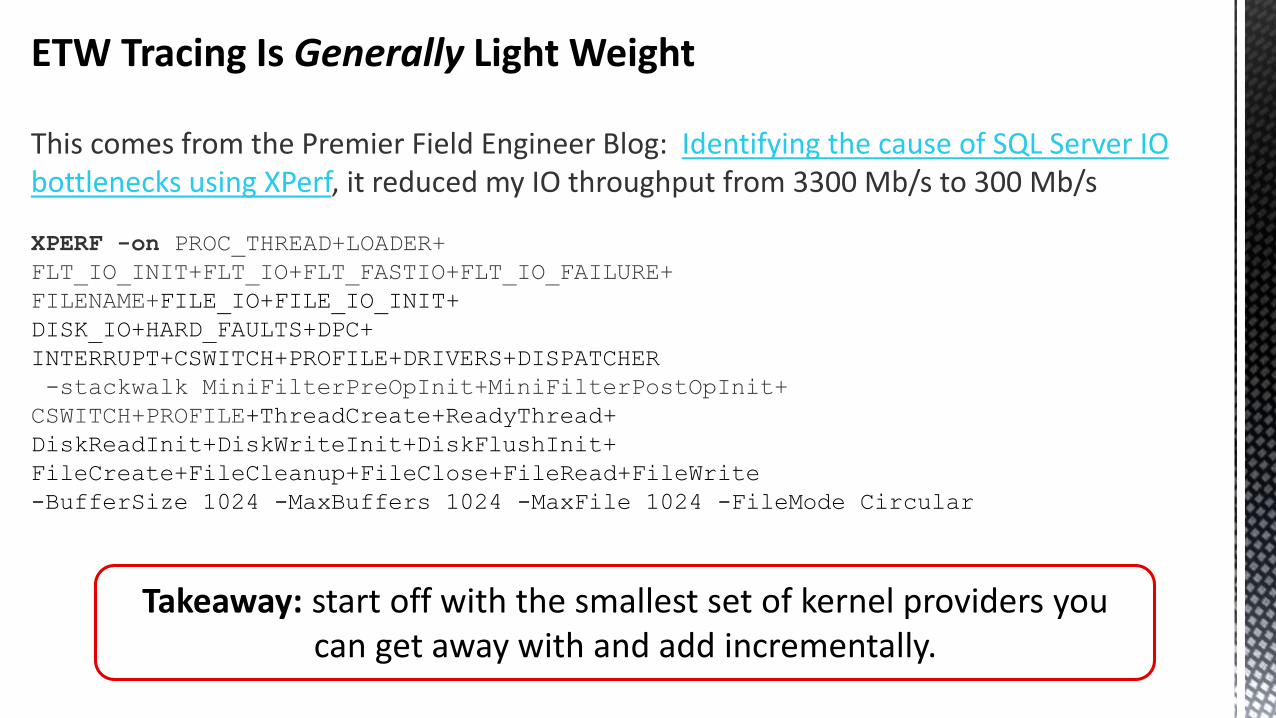
ETW Tracing Is Generally Light Weight
This comes from the Premier Field Engineer Blog: Identifying the cause of SQL Server IO bottlenecks using XPerf, it reduced my IO throughput from 3300 Mb/s to 300 Mb/s
XPERF -on PROC_THREAD+LOADER+
FLT_IO_INIT+FLT_IO+FLT_FASTIO+FLT_IO_FAILURE+
FILENAME+FILE_IO+FILE_IO_INIT+
DISK_IO+HARD_FAULTS+DPC+
INTERRUPT+CSWITCH+PROFILE+DRIVERS+DISPATCHER
-stackwalk MiniFilterPreOpInit+MiniFilterPostOpInit+
CSWITCH+PROFILE+ThreadCreate+ReadyThread+
DiskReadInit+DiskWriteInit+DiskFlushInit+
FileCreate+FileCleanup+FileClose+FileRead+FileWrite
-BufferSize 1024 -MaxBuffers 1024 -MaxFile 1024 -FileMode Circular
Takeaway: start off with the smallest set of kernel providers you can get away with and add incrementally.
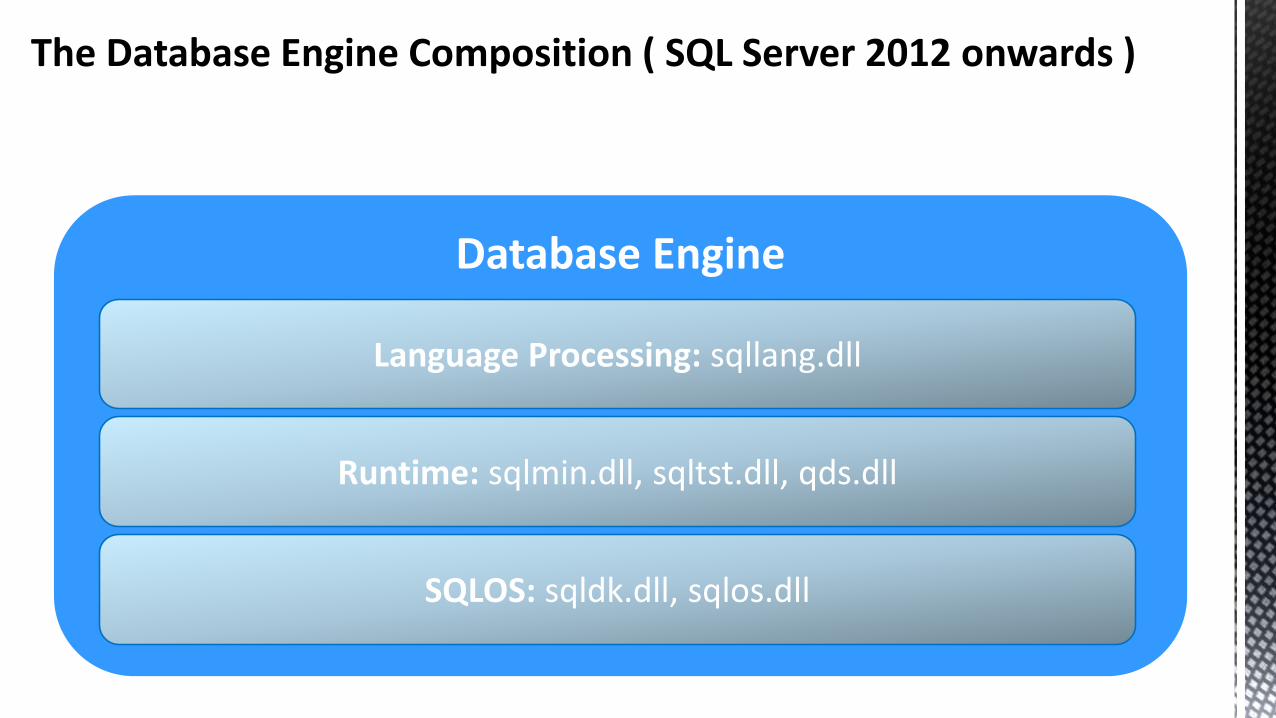
The Database Engine Composition ( SQL Server 2012 onwards )
Database Engine
Language Processing: sqllang.dll
Runtime: sqlmin.dll, sqltst.dll, qds.dll
SQLOS: sqldk.dll, sqlos.dll

Demonstration #2Stack Walking an ETW Trace
Of Our Simple Query

Demonstration #3Investigation
IO Sizes Via an ETW Trace File
Demonstration #4Quantifying The Cost Of
Extracting Row ValuesDuring A Table Scan
North bridge
Core
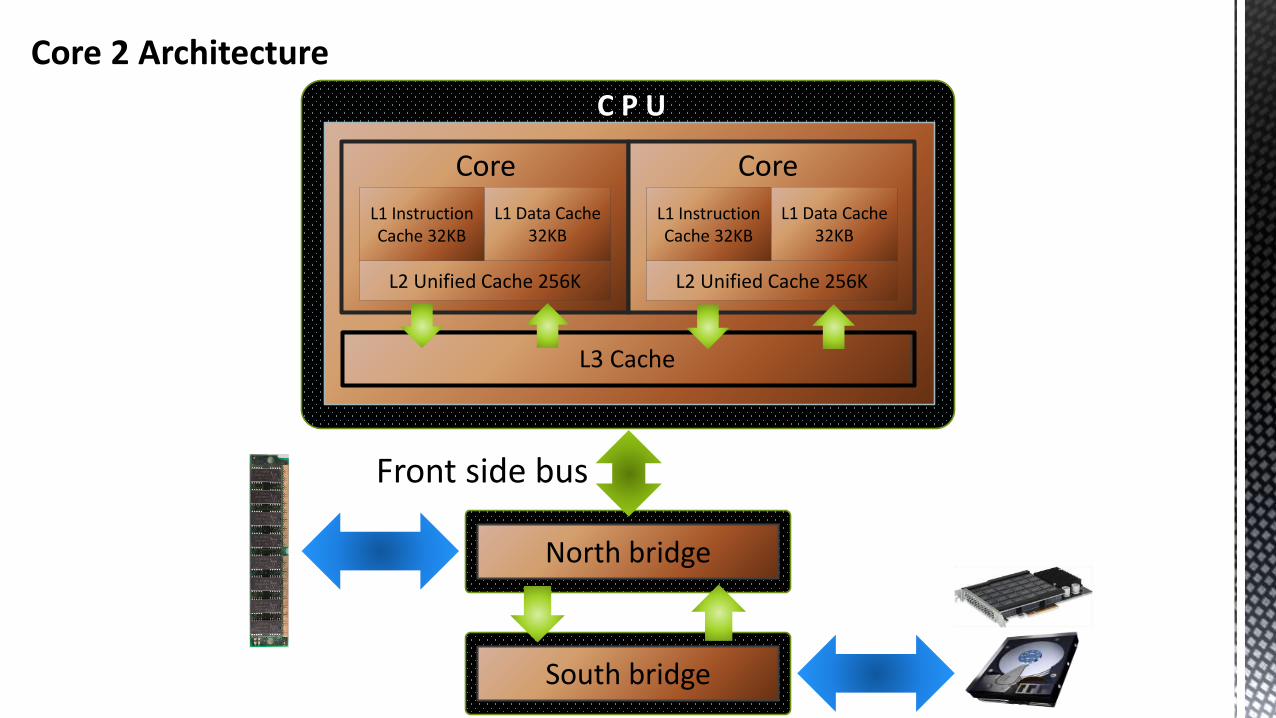
Core 2 Architecture
L3 Cache
L1 Instruction Cache 32KB
L2 Unified Cache 256K
L1 Data Cache32KB
Core
CoreL1 Instruction Cache 32KB
L2 Unified Cache 256K
L1 Data Cache32KB
Core
C P U
South bridge
Front side bus

Core 2 Architecture
Latency when talking to IO and memory controllers even before accessing memory or IO.
Single level TLB.
Hyper-threading via NetBurst, this delivered poor performance.
Design was not module, 4 CPU was 2 x 2 core CPUs “Bolted together”.
Only last generation “Dunnington” had a L3 cache.

Core
Core i Series Generation 1 ‘Nehalem’
L3 Cache
L1 Instruction Cache 32KB
L2 Unified Cache 256K
Power and
ClockQPI
MemoryController
L1 Data Cache32KB
Core
CoreL1 Instruction Cache 32KB
L2 Unified Cache 256K
L1 Data Cache32KB
Core
TLBMemory bus
C P U
QPI. . .
Un-core
Integrated memory controller.
NetBurst replaced with a new hyper threading technology.
The Lookaside Buffer ( TLB ) forcaching logical to physical memorymappings has two levels.
Front side bus replaced by the Quick Path Inter connector (QPI).
Genuine modular design.

Core
Core i Series Generation 2 ‘Sandybridge’
L3 Cache
L1 Instruction Cache 32KB
L0 UOP cache
L2 Unified Cache 256K
Power and
ClockQPI
MemoryController
L1 Data Cache32KB
Core
CoreL1 Instruction Cache 32KB
L0 UOP cache
L2 Unified Cache 256K
L1 Data Cache32KB
Core
Bi-directional ring bus
PCIe 2.0controllerTLBMemory bus
C P U
QPI…
Un-core
Integrated PCIe 2.0 controller.
Level 0 uop cache.
L3 cache connected to core via bi-directional ring bus.
Advanced Vector eXtensions v1.
Data Direct IO.

Cache Lines
Unit of transfer between memory and the CPU.
Cache lines are used to create “Cache entries”, these are tagged with the requested memory location.
Data structures should be cache line aligned in order to avoid split register operations.
If different cores access the same cache line for writes, this effectively ‘Bounces’ the L2 cache=> Try to avoid threads sharing cache lines.
CPU
Cache Line – 64 bits
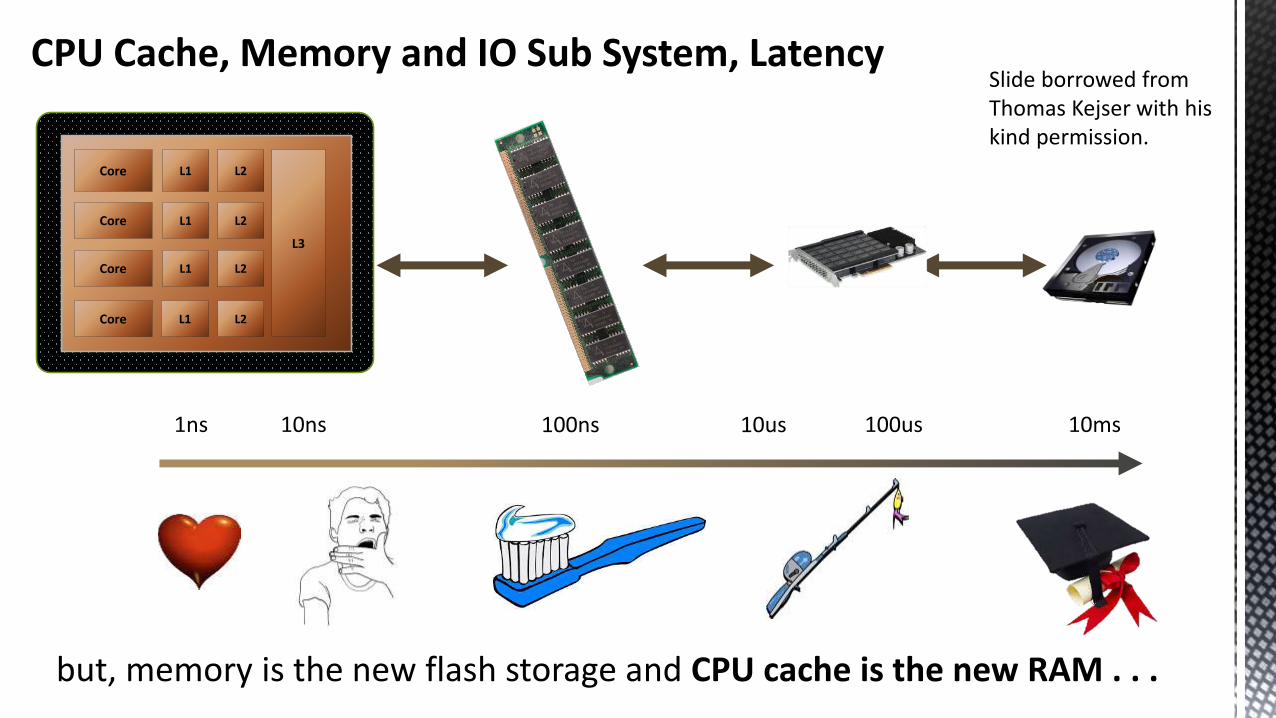
CPU Cache, Memory and IO Sub System, Latency
Core
Core
Core
Core
L1
L1
L1
L1
L3
L2
L2
L2
L2
1ns 10ns 100ns 100us 10ms10us
but, memory is the new flash storage and CPU cache is the new RAM . . .
Slide borrowed from Thomas Kejser with his kind permission.
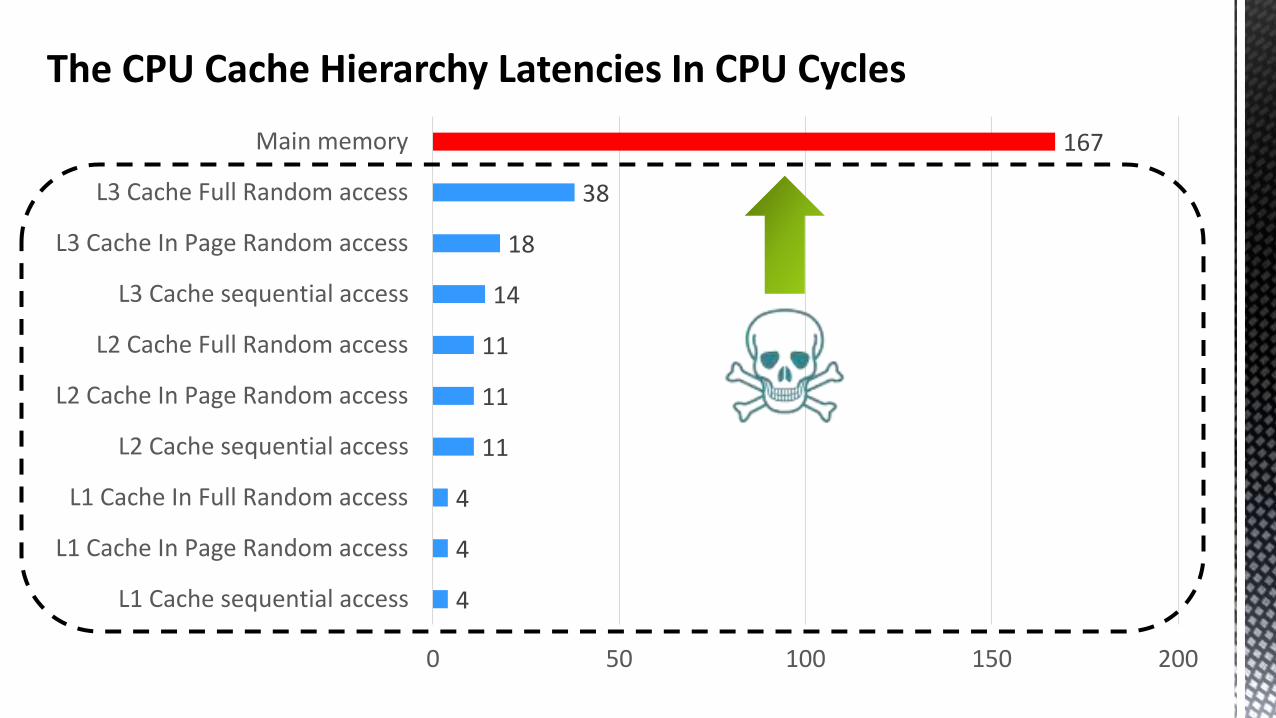
4
4
4
11
11
11
14
18
38
167
0 50 100 150 200
L1 Cache sequential access
L1 Cache In Page Random access
L1 Cache In Full Random access
L2 Cache sequential access
L2 Cache In Page Random access
L2 Cache Full Random access
L3 Cache sequential access
L3 Cache In Page Random access
L3 Cache Full Random access
Main memory
The CPU Cache Hierarchy Latencies In CPU Cycles Memory
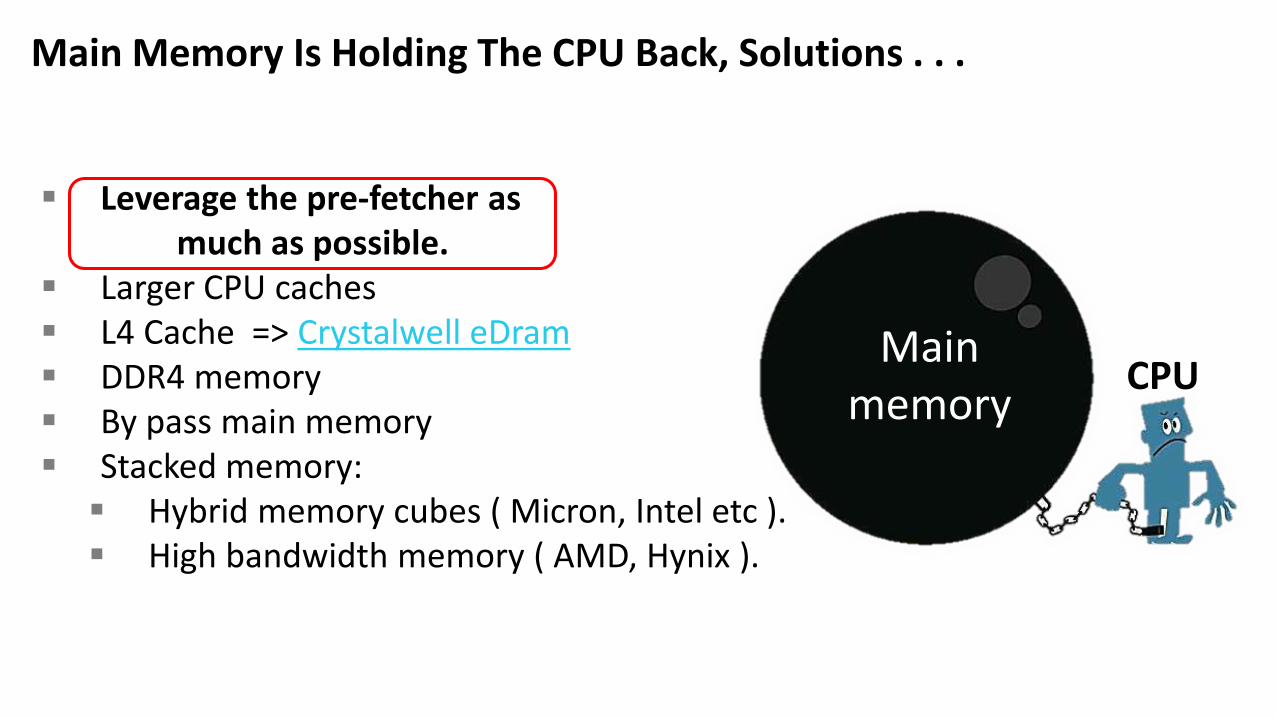
Leverage the pre-fetcher asmuch as possible.
Larger CPU caches L4 Cache => Crystalwell eDram DDR4 memory By pass main memory Stacked memory: Hybrid memory cubes ( Micron, Intel etc ). High bandwidth memory ( AMD, Hynix ).
Main Memory Is Holding The CPU Back, Solutions . . .
Main memory
CPU

What The Pre-Fetcher Loves
Column Store index
Sequential scan
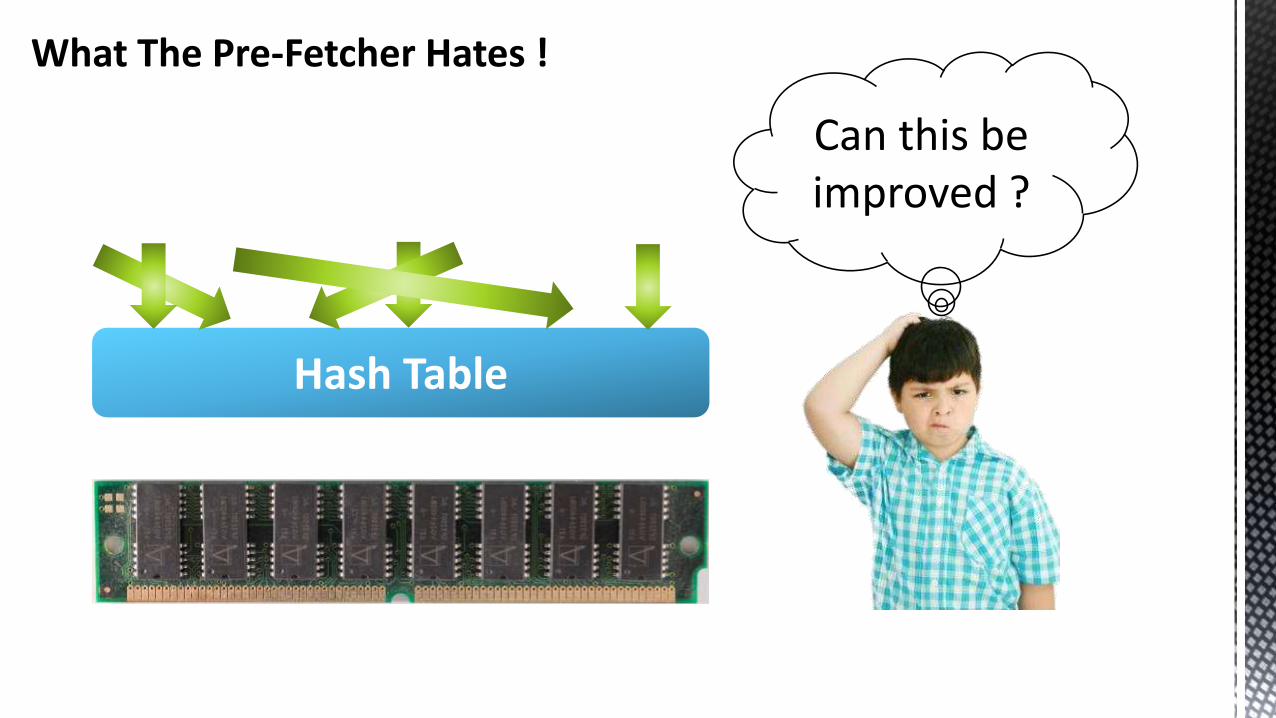
What The Pre-Fetcher Hates !
Hash Table
Can this be improved ?

By Passing Main Memory With Data Direct IO
C P U
Core
L3 Cache
The Old World
The New World With Data Direct IO
Core
C P U
Core
L3 Cache
Core
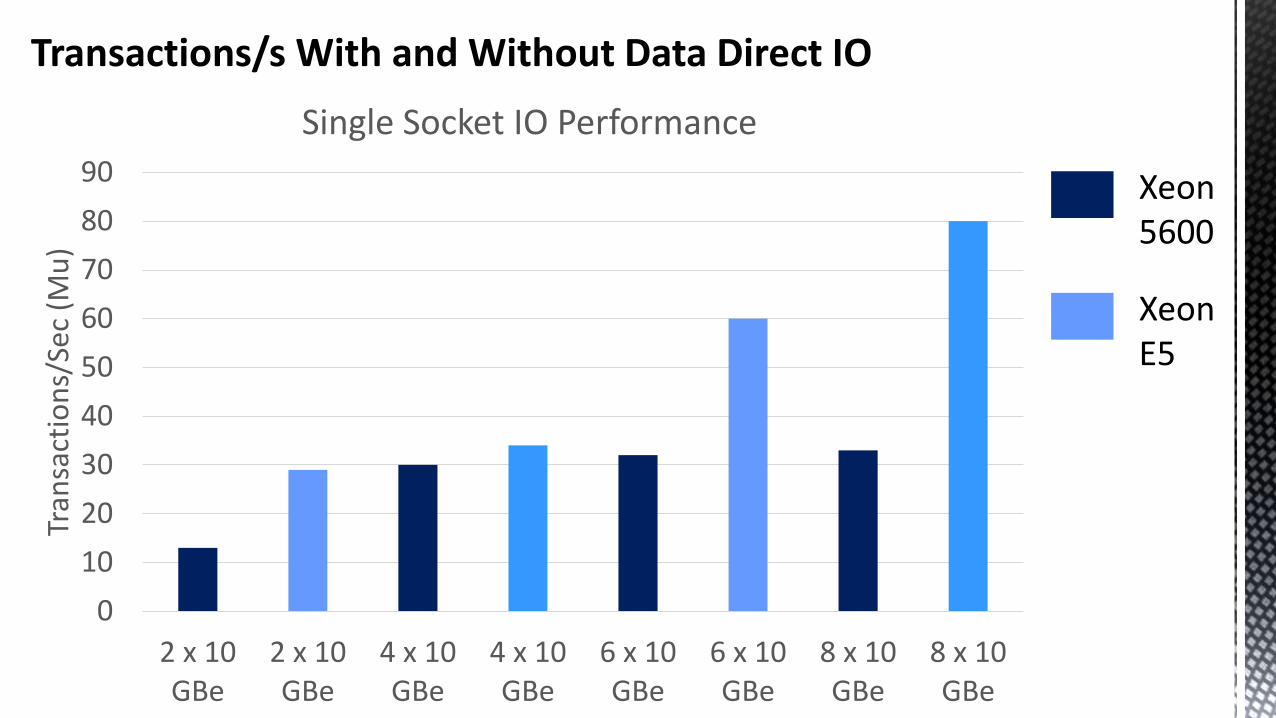
Transactions/s With and Without Data Direct IO
0
10
20
30
40
50
60
70
80
90
2 x 10GBe
2 x 10GBe
4 x 10GBe
4 x 10GBe
6 x 10GBe
6 x 10GBe
8 x 10GBe
8 x 10GBe
Tran
sact
ion
s/Se
c (M
u)
Single Socket IO Performance
Xeon5600
XeonE5

The Case Of The Two Column Store Index Sizes
Could the CPU cycles required to access the CPU cache versus main memory be a factor ?
. . . lets dig deeper

Call Stack For Query Against Column Store On Non-Pre-Sorted Data
Hash agg lookup weight 65,329.87
Column Store scan weight 28,488.73
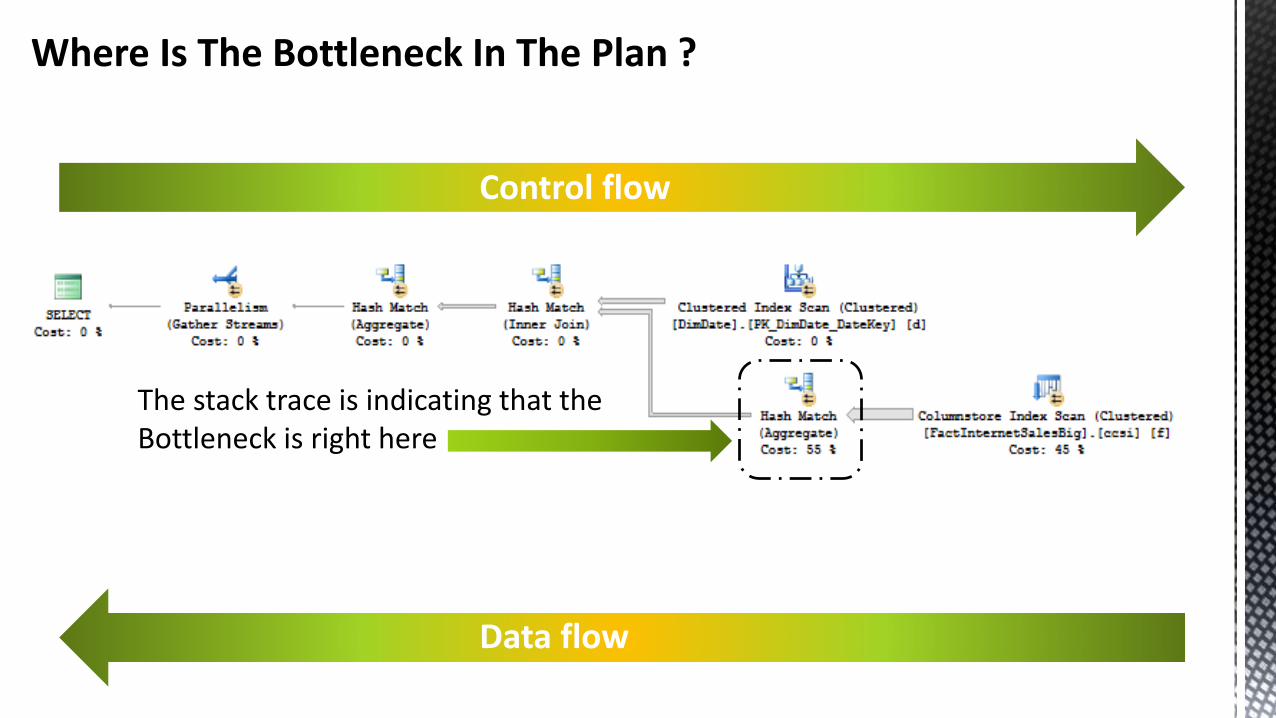
Control flow
Data flow
Where Is The Bottleneck In The Plan ?
The stack trace is indicating that theBottleneck is right here
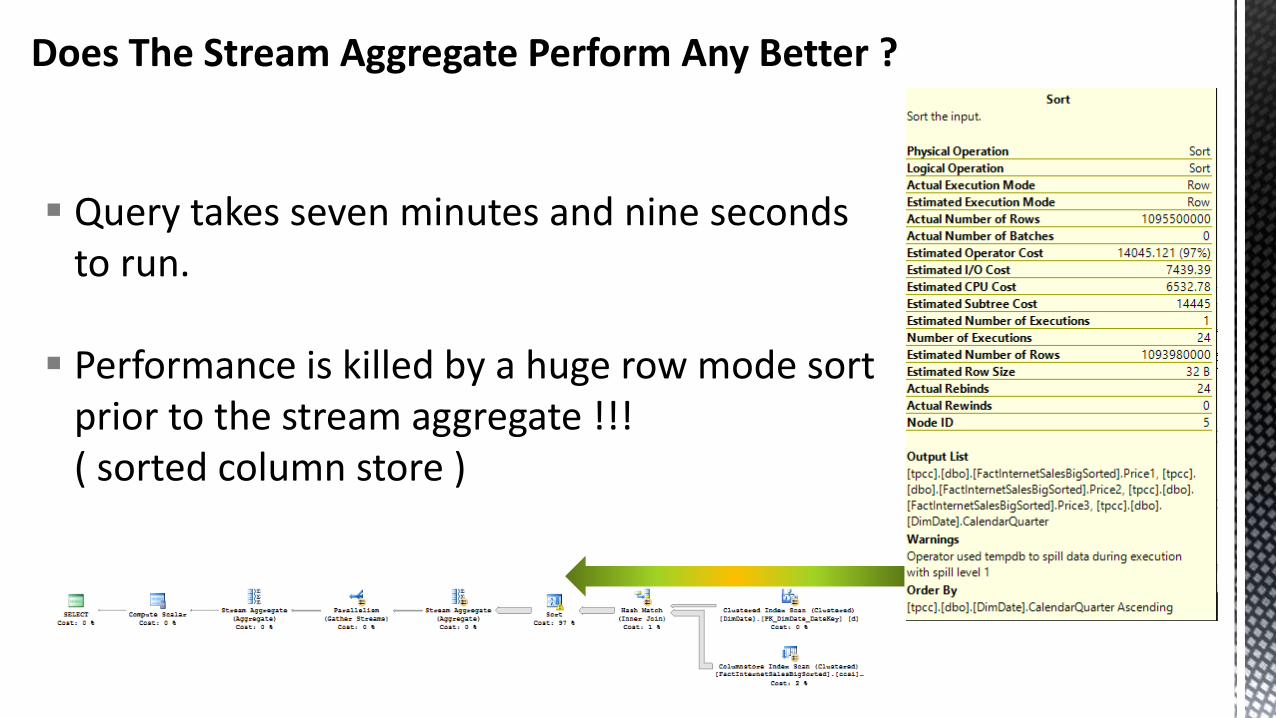
Does The Stream Aggregate Perform Any Better ?
Query takes seven minutes and nine seconds to run.
Performance is killed by a huge row mode sort prior to the stream aggregate !!! ( sorted column store )
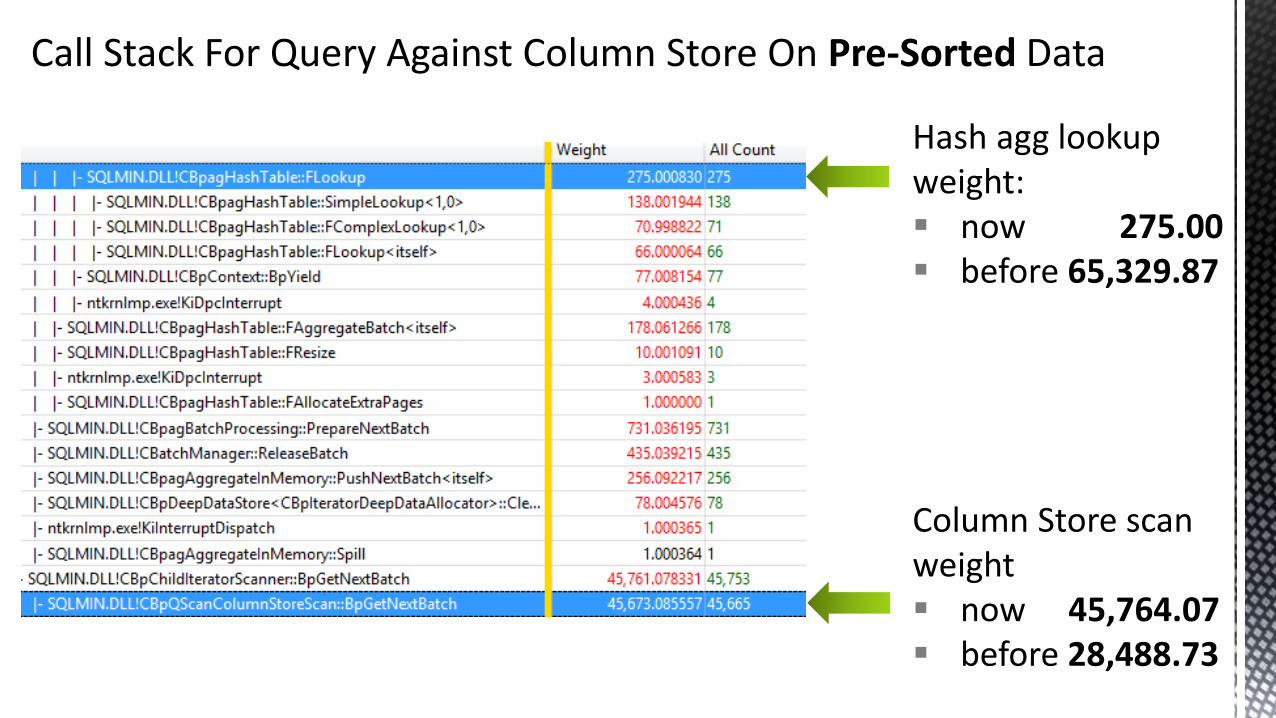
Call Stack For Query Against Column Store On Pre-Sorted Data
Hash agg lookup weight: now 275.00 before 65,329.87
Column Store scan weight now 45,764.07 before 28,488.73
The Case Of The Two Column Stores
The hash aggregate using the column stored created on pre-sorted data is very CPU efficient.
Why ?
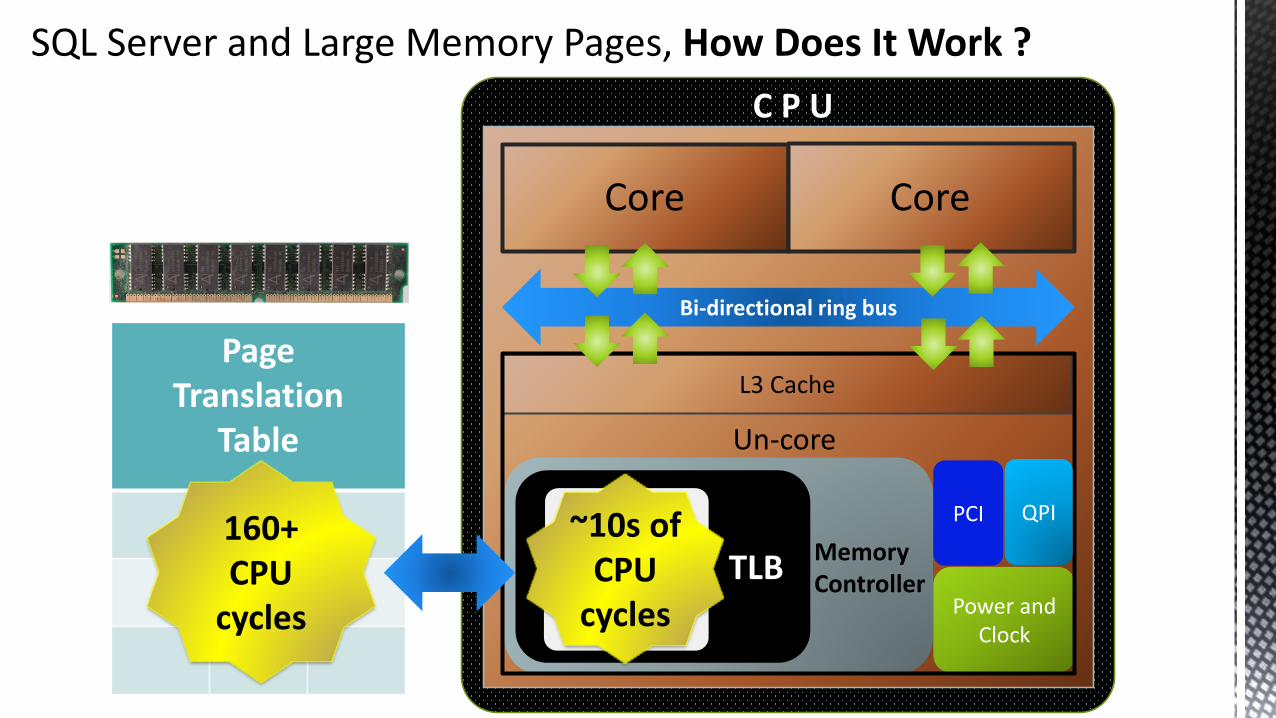
SQL Server and Large Memory Pages, How Does It Work ?
L3 Cache
Power andClock
Core
Bi-directional ring bus
PCI
TLB
C P U
QPI
Un-core
Core
PageTranslation
Table
MemoryController
DTLB( 1 st level )
STLB( 2 nd level )
~10s of CPU
cycles
160+ CPU
cycles

The TLB Without Large Page Support
L3 Cache
Power andClock
Core
Bi-directional ring bus
PCITLB: 32 x 4Kbpages
C P U
QPI
Un-core
Core
MemoryController
128Kb of logical to physical memory
mappings covered*
* Nehalem through to Ivybridgearchitectures

The TLB With Large Page Support
L3 Cache
Power andClock
Core
Bi-directional ring bus
PCITLB: 32 x 2Mbpages
C P U
QPI
Un-core
Core
MemoryController
128Kb of logical to physical memory mapping
coverage is increased to 64Mb !!!
Fewer trips off theCPU to the page table

What Difference Do Large Pages Make ?
130s elapsed time
28% saving
Large pagesupport off
Large pagesupport on
Page Lookups/s 222220 263766
0
50000
100000
150000
200000
250000
300000
93s elapsed time
Single 6 core socket
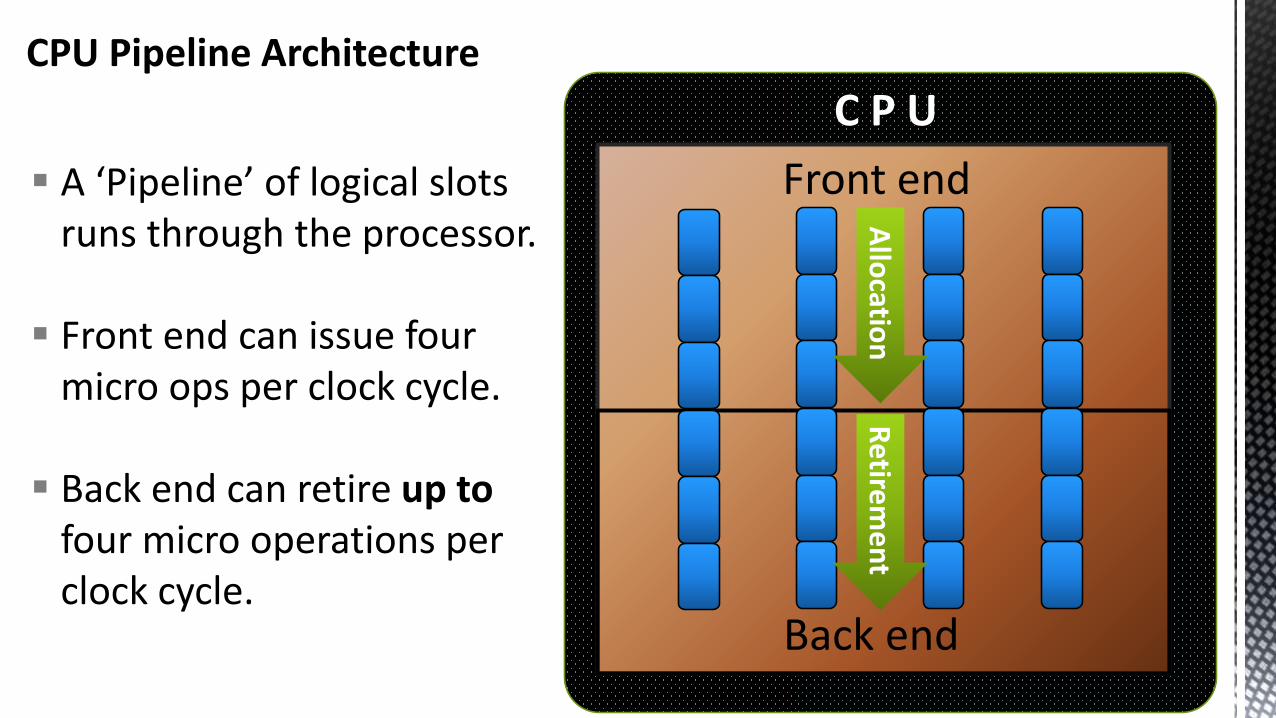
CPU Pipeline Architecture
C P U
Front end
Back end
A ‘Pipeline’ of logical slots runs through the processor.
Front end can issue four micro ops per clock cycle.
Back end can retire up tofour micro operations per clock cycle.
Allo
cation
Retire
me
nt
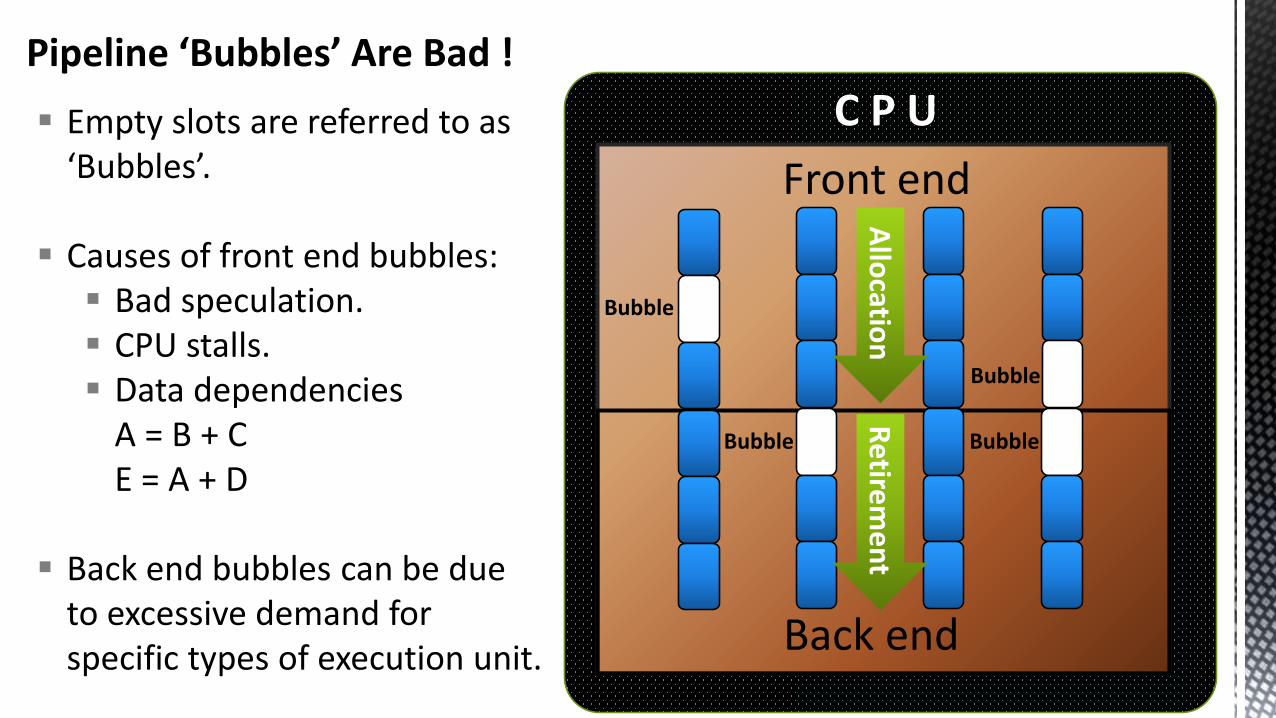
Pipeline ‘Bubbles’ Are Bad !
C P U
Front end
Back end
Empty slots are referred to as ‘Bubbles’.
Causes of front end bubbles: Bad speculation. CPU stalls. Data dependencies
A = B + CE = A + D
Back end bubbles can be due to excessive demand for specific types of execution unit.
Allo
cation
Retire
me
nt
Bubble
Bubble
Bubble
Bubble
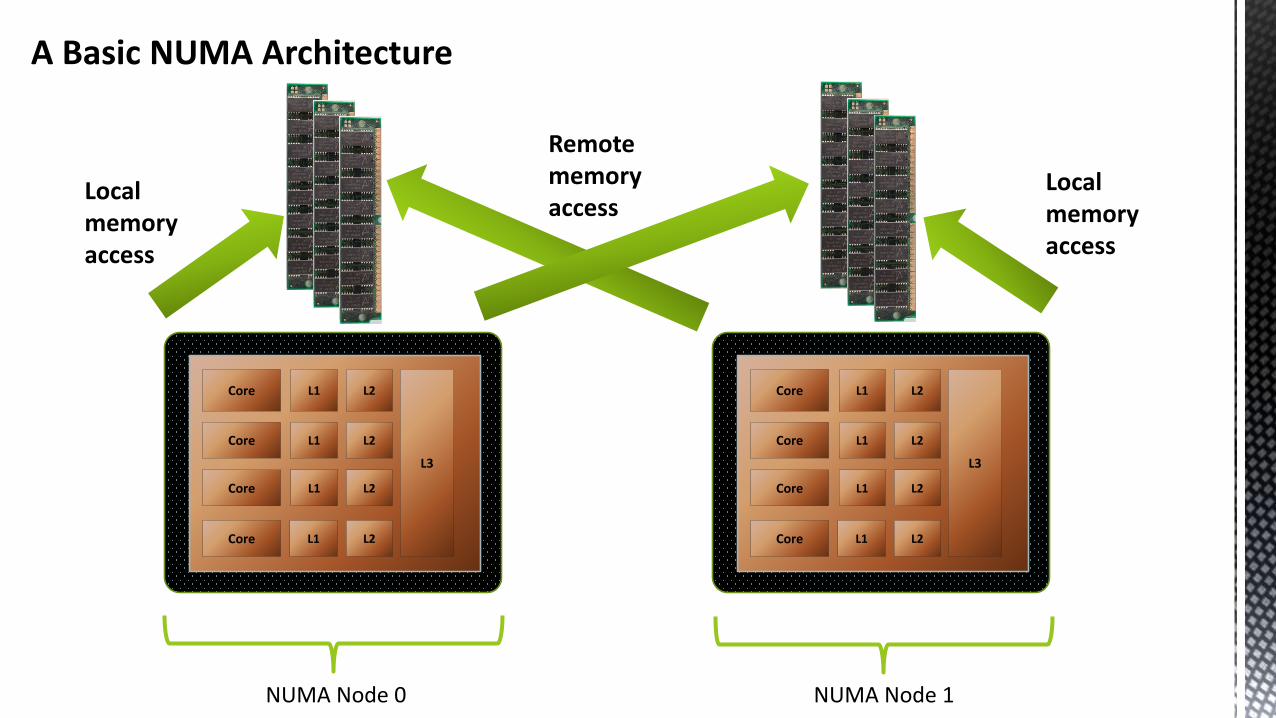
A Basic NUMA Architecture
Core
Core
Core
Core
L1
L1
L1
L1
L3
L2
L2
L2
L2
Core
Core
Core
Core
L1
L1
L1
L1
L3
L2
L2
L2
L2
Remote memory access
Local memory access
Local memory access
NUMA Node 0 NUMA Node 1
IO H
ub
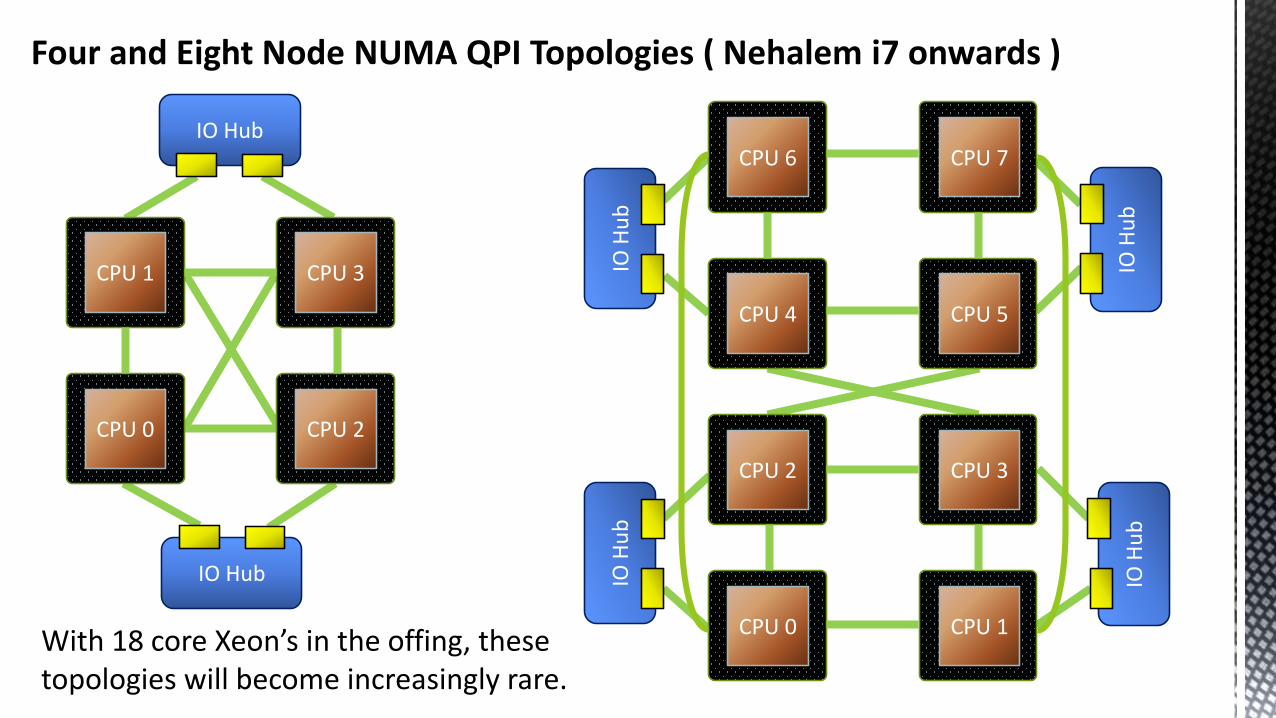
Four and Eight Node NUMA QPI Topologies ( Nehalem i7 onwards )
CPU 1 CPU 3
CPU 0 CPU 2
CPU 6 CPU 7
CPU 4 CPU 5
CPU 2 CPU 3
CPU 0 CPU 1
IO Hub
IO Hub
IO H
ub
IO H
ub
IO H
ub
With 18 core Xeon’s in the offing, these topologies will become increasingly rare.

Remote Node Memory Access Comes At A Cost
An additional 20% overhead when accessing ‘Foreign’ memory !( from coreinfo )

Local Vs Remote Memory Access and Thread Locality
How does SQLOS schedule hyper-threads in relation to physical cores ?
( 6 cores per socket )
CPU socket 0
CPU socket 1
Core 0 Core 1 Core 2
Core 3 Core 4 Core 5

Making Use Of CPU Stalls With Hyper Threading ( Nehalem i7 onwards )Access
n row B-tree
L2
L3
Last levelcache miss n row B-tree
1. Session 1 performs an index seek, pages not in CPU cache
2. A CPU stall takes place ( 160 clock cycles+ ) whilst the page is retrieved from memory.
3. The ‘Dead’ CPU stall cycles gives the physical core the opportunity to run a 2nd thread.
Core
L1

Hyper-Threading Scalability For The ‘Sorted’ Column Store Index
2 3 4 5 6 7 8 9 10 11 12 13 14 15 16 17 18 19 20 21 22 23 24
CPU Utilisation 5 8 10 13 15 18 20 23 25 28 30 33 35 38 40 43 46 48 50 53 54 58 59
0
10
20
30
40
50
60
70
80
90
100
CP
U U
tilis
atio
n
Degree of Parallelism
5 % CPU utilisation per core 60% of each core utilised
by first hyper thread
L1
L1
L1
L1
L3
L2
L2
L2
L2
Core
Core
Core
Core
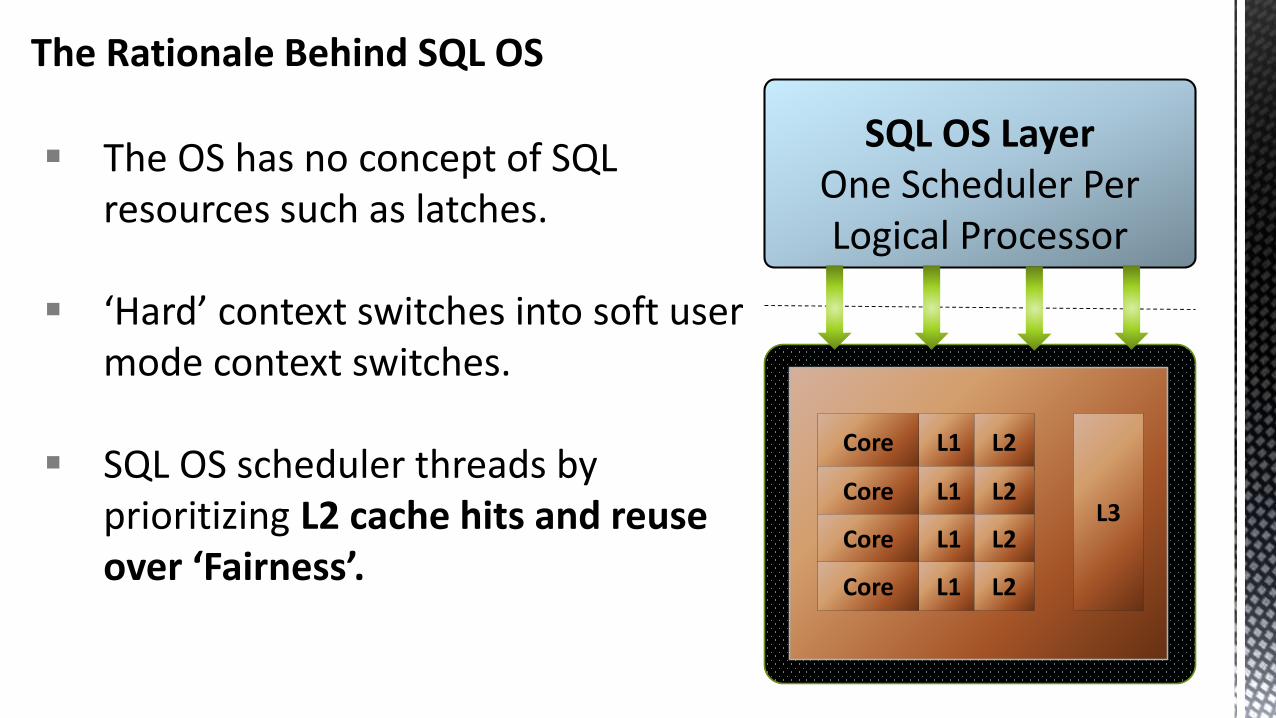
SQL OS LayerOne Scheduler Per Logical Processor
The OS has no concept of SQLresources such as latches.
‘Hard’ context switches into soft usermode context switches.
SQL OS scheduler threads byprioritizing L2 cache hits and reuse over ‘Fairness’.
The Rationale Behind SQL OS
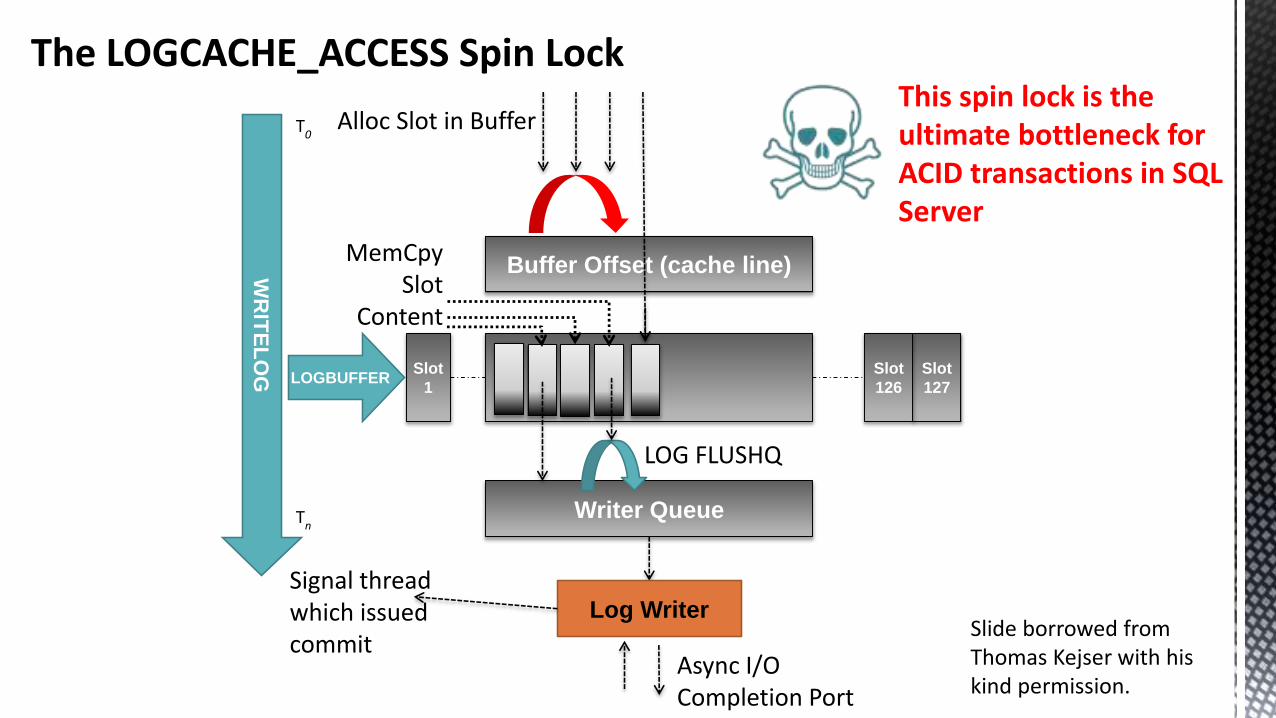
The LOGCACHE_ACCESS Spin Lock
Buffer Offset (cache line)
Alloc Slot in Buffer
MemCpy Slot
Content
Log Writer
Writer Queue
Async I/O Completion Port
Slot
1LOGBUFFER
WR
ITE
LO
G
Signal thread which issued commit
T0
Tn
Slot
127
Slot
126
LOG FLUSHQ
Slide borrowed from Thomas Kejser with his kind permission.
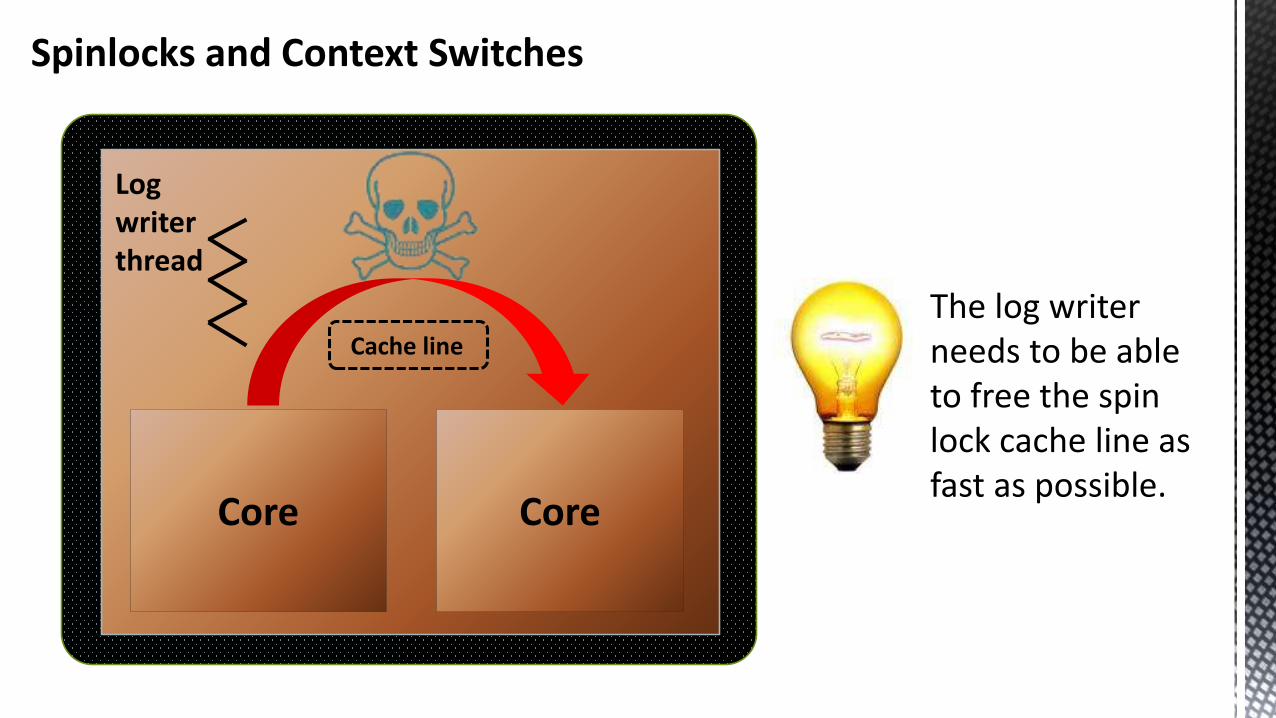
This spin lock is the ultimate bottleneck for ACID transactions in SQL Server
Core Core
Log writerthread
The log writer needs to be able to free the spin lock cache line as fast as possible.
Spinlocks and Context Switches
Cache line
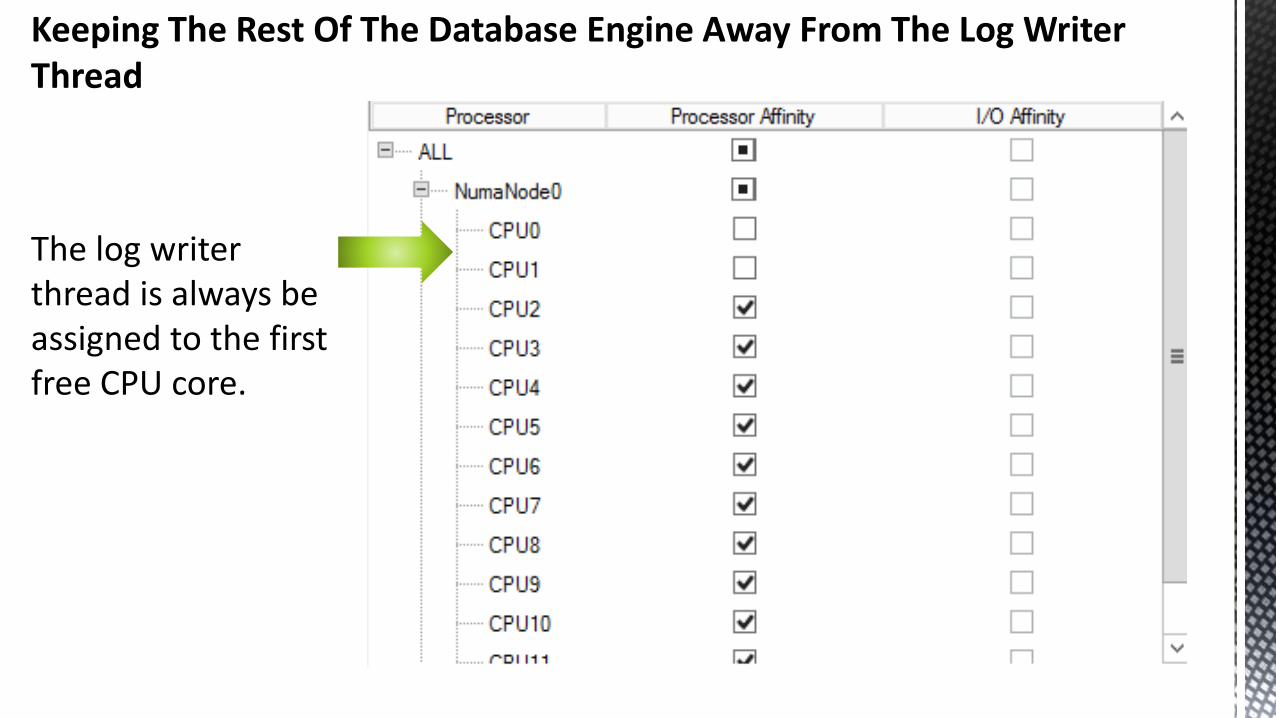
Keeping The Rest Of The Database Engine Away From The Log Writer Thread
The log writer thread is always be assigned to the first free CPU core.
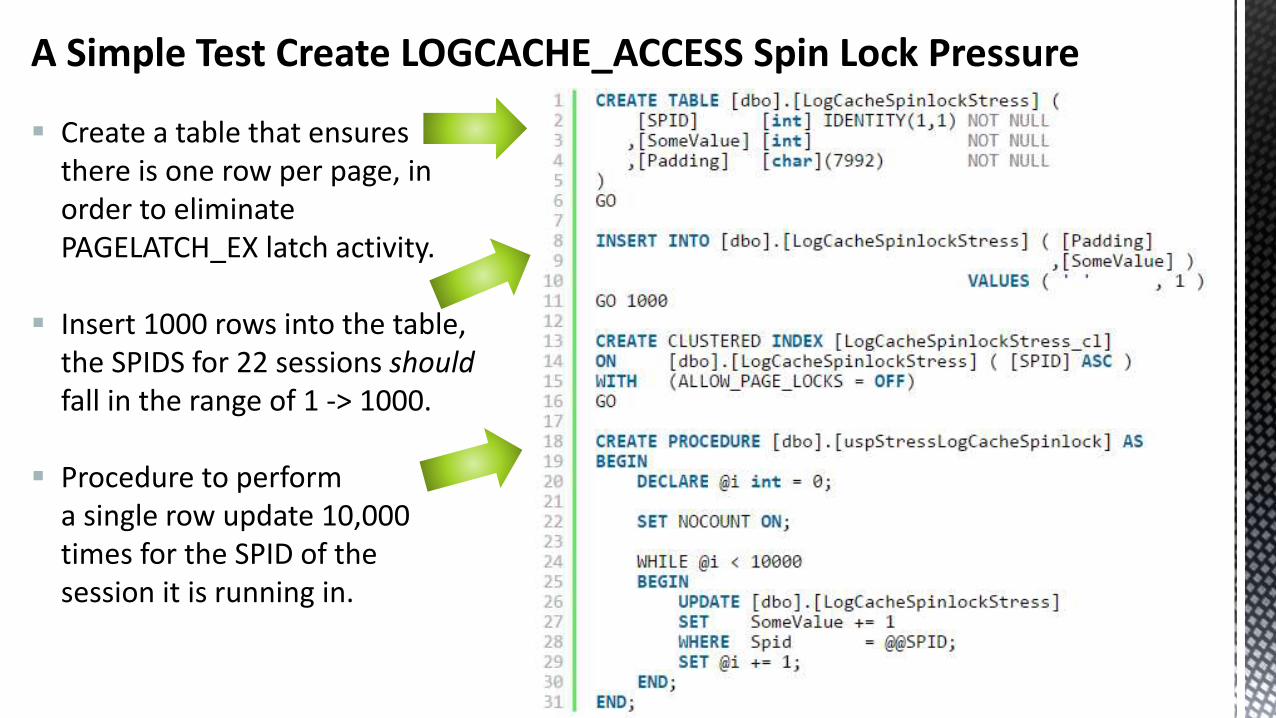
A Simple Test Create LOGCACHE_ACCESS Spin Lock Pressure
Create a table that ensures there is one row per page, in order to eliminate PAGELATCH_EX latch activity.
Insert 1000 rows into the table, the SPIDS for 22 sessions should fall in the range of 1 -> 1000.
Procedure to perform a single row update 10,000 times for the SPID of the session it is running in.

Results
234,915,993
10,554,325
0
50000000
100000000
150000000
200000000
250000000
Default CPU affinity mask Core 0 removed from affinity mask
Order of magnitude saving !!!
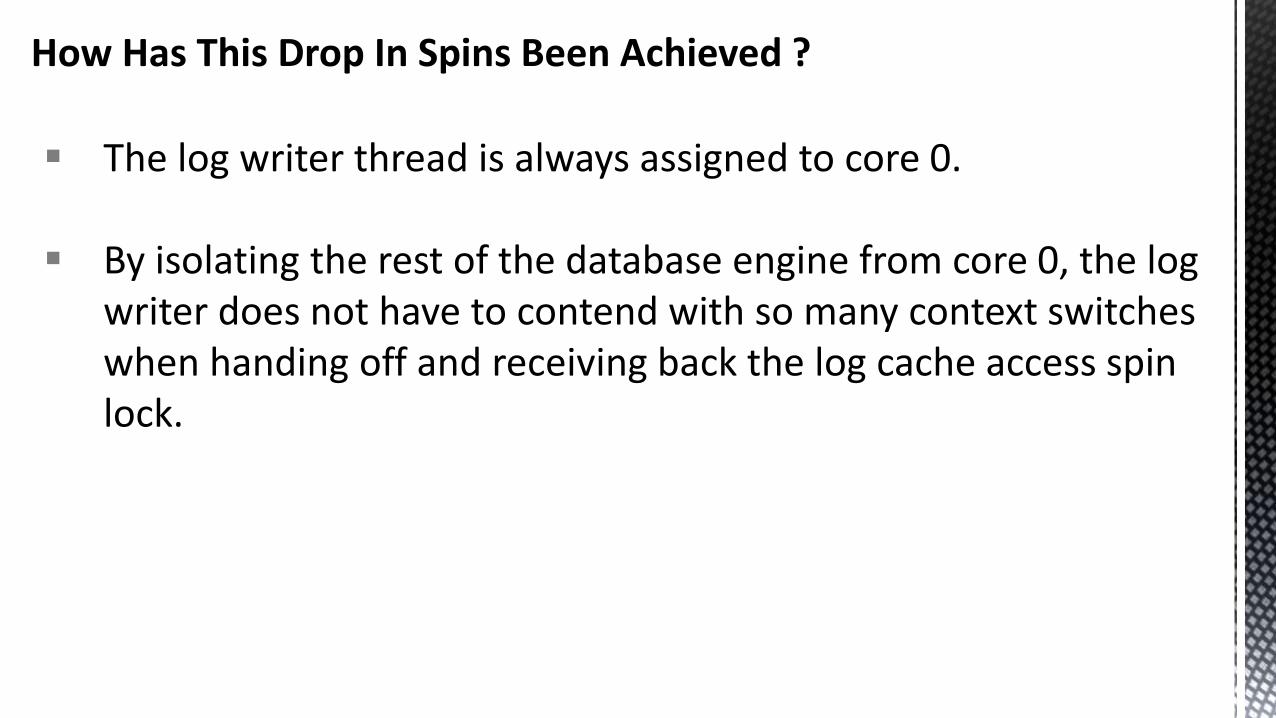
The log writer thread is always assigned to core 0.
By isolating the rest of the database engine from core 0, the log writer does not have to contend with so many context switches when handing off and receiving back the log cache access spin lock.
How Has This Drop In Spins Been Achieved ?

CPU
+

Segment Hash Key Value
Scan
Segment Hash Key Value
Scan
Column Store on Non-Pre-Sorted Data
Hash table is likely to be at the highlatency end of the cache hierarchy.
Hypothesis
Sequential access
Random access
Column Store on Pre-Sorted Data
Hash table is likely to be at the lowlatency end of the cache hierarchy.

The Case Of The 60% CPU Utilisation Ceiling
Column store scans are pre-fetcher friendly, hash joins and hash aggregates are not
Can a hash join or aggregate keep up with a column store scan ?
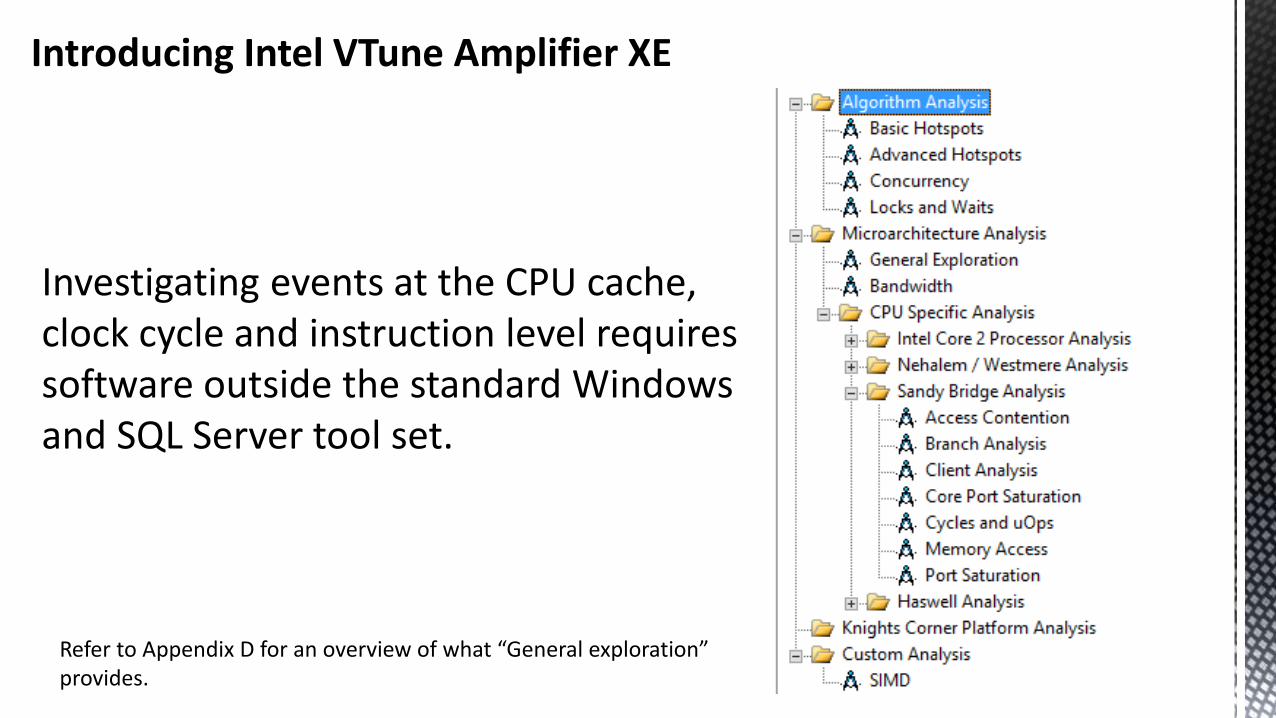
Introducing Intel VTune Amplifier XE
Investigating events at the CPU cache, clock cycle and instruction level requires software outside the standard Windows and SQL Server tool set.
Refer to Appendix D for an overview of what “General exploration” provides.
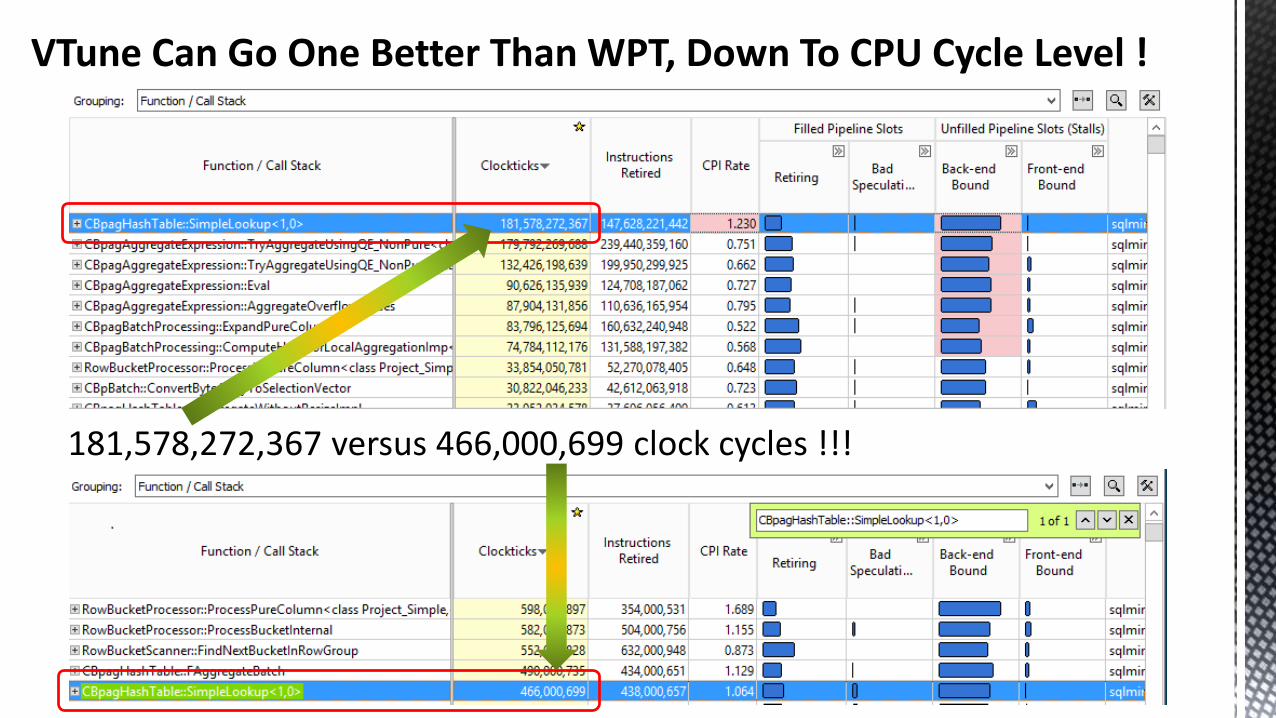
VTune Can Go One Better Than WPT, Down To CPU Cycle Level !
181,578,272,367 versus 466,000,699 clock cycles !!!
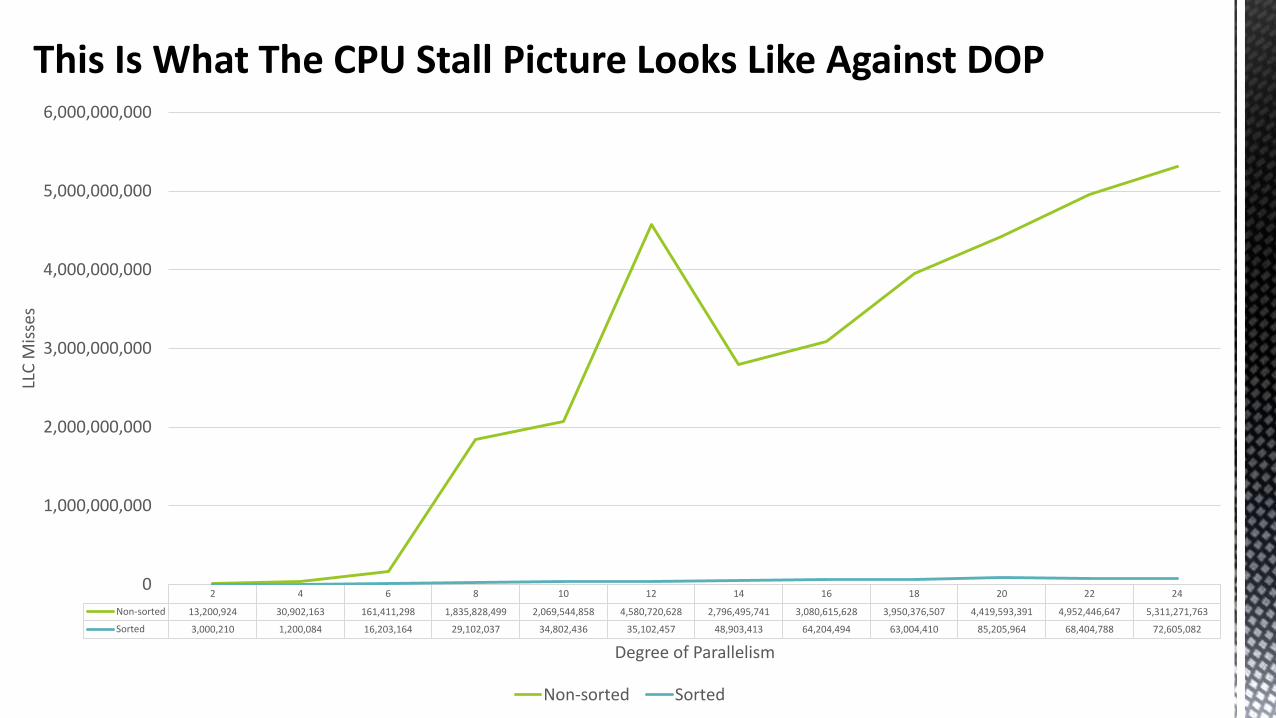
This Is What The CPU Stall Picture Looks Like Against DOP
2 4 6 8 10 12 14 16 18 20 22 24
Non-sorted 13,200,924 30,902,163 161,411,298 1,835,828,499 2,069,544,858 4,580,720,628 2,796,495,741 3,080,615,628 3,950,376,507 4,419,593,391 4,952,446,647 5,311,271,763
Sorted 3,000,210 1,200,084 16,203,164 29,102,037 34,802,436 35,102,457 48,903,413 64,204,494 63,004,410 85,205,964 68,404,788 72,605,082
0
1,000,000,000
2,000,000,000
3,000,000,000
4,000,000,000
5,000,000,000
6,000,000,000
LLC
Mis
ses
Degree of Parallelism
Non-sorted Sorted

Does The OrderDateKey Column Fit In The L3 Cache ?
Table Name Column Name Size (Mb)
FactInternetSalesBigNoSort
OrderDateKey 1786182
Price1 3871
Price2 3871
Price3 3871
FactInternetSalesBigSorted
OrderDateKey 738
Price1 2965127
Price2 2965127
Price3 2965127
No , L3 cache is 20Mb in size

The Case Of The Two Column Store Index Sizes: Conclusion
Turning the memory access on the hash aggregate table from random
to sequential probes=
CPU savings > cost of scanning an enlarged column store

Skew Is Also A Factor In Batch Mode Hash Join PerformanceBatch Mode
Hash Joins
70
Row Mode Batch Mode
Expensive to repartition inputs
Data skew reduces parallelism
Hash join
B1
B2
B3
Bn
Hash table
(shared)
Thread
Thread
Build input
Thread
Thread
Thread
Probe input
B1
B2
B4
BmB3
Build input
Hash join
Exchange Exchange
Probe input
Exchange Exchange
Data skew speeds up processing
No repartitioning
Slide borrowed from Thomas Kejser with his kind permission.

The Case Of The 60% CPU Utilisation Ceiling
Still not solved. Tuning 101, if you cannot max out the CPU capacity or IOPS bandwidth, there must be some form of contention at play . . .
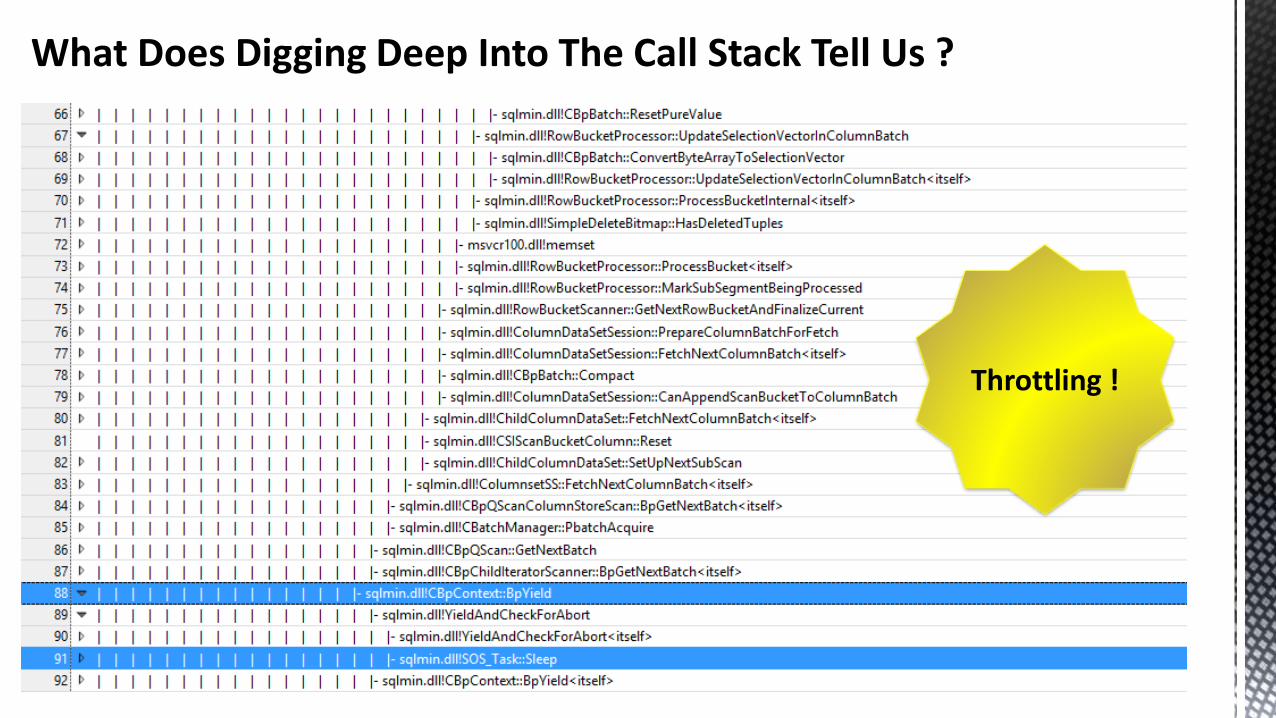
What Does Digging Deep Into The Call Stack Tell Us ?
Throttling !
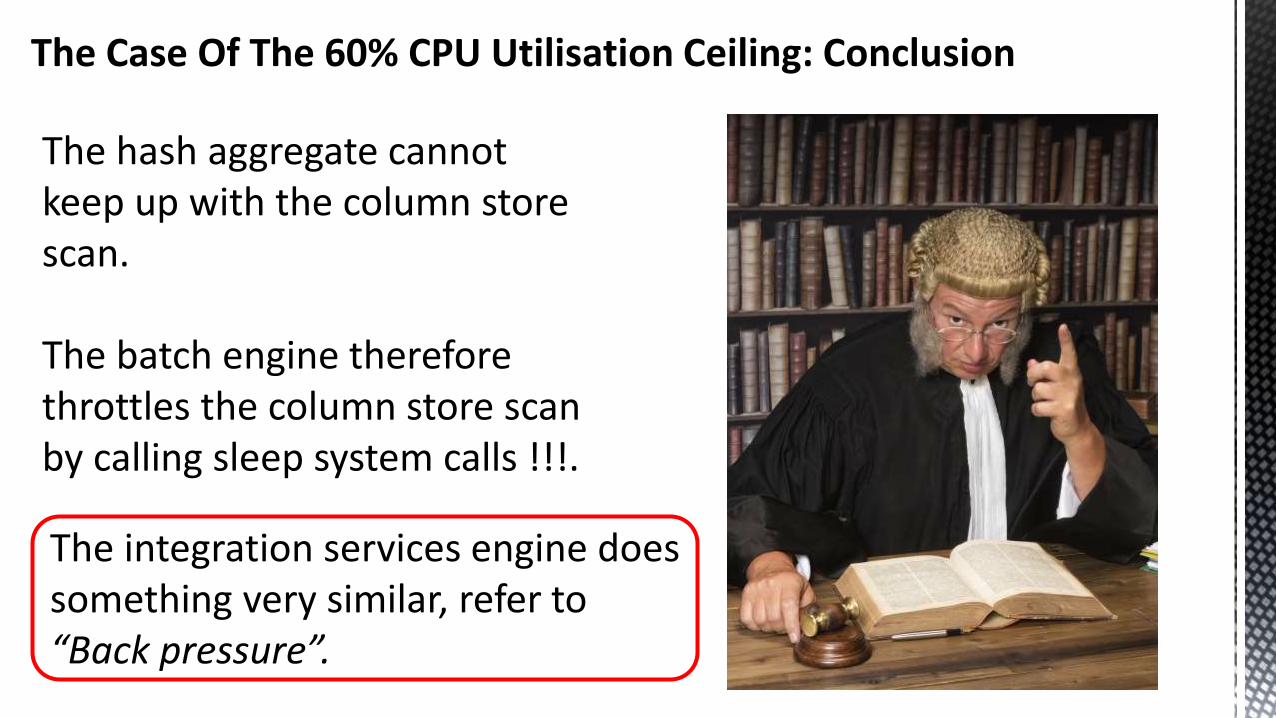
The Case Of The 60% CPU Utilisation Ceiling: Conclusion
The hash aggregate cannot keep up with the column store scan.
The batch engine therefore throttles the column store scan by calling sleep system calls !!!.
The integration services engine does something very similar, refer to “Back pressure”.

The Case of The CPU Pressure Point
Where are the pressure points on the CPU and what can be done to resolve this ?.

Making Efficient Use Of The CPU In The “In Memory” World
C P U
D A T A F L O WD A T A F L O WFront endBack end
Backend PressureRetirement throttled due to pressure on back end resources ( port saturation )
Frontend PressureFront end issuing < 4 uops per cycle whilst backend is ready to accept uops( CPU stalls, bad speculation, data dependencies )

Lots Of KPIs To Choose From, Which To Select ?
CPU Cycles Per Retired Instruction (CPI)This should ideally be 0.25, anything approaching 1.0 is bad.
Front end boundReflects the front end under supplying the back end with work, this figure should be as close to zero as possible.
Back end boundThe Back end cannot accept work from the front end because there is excessive demand for specific execution units.
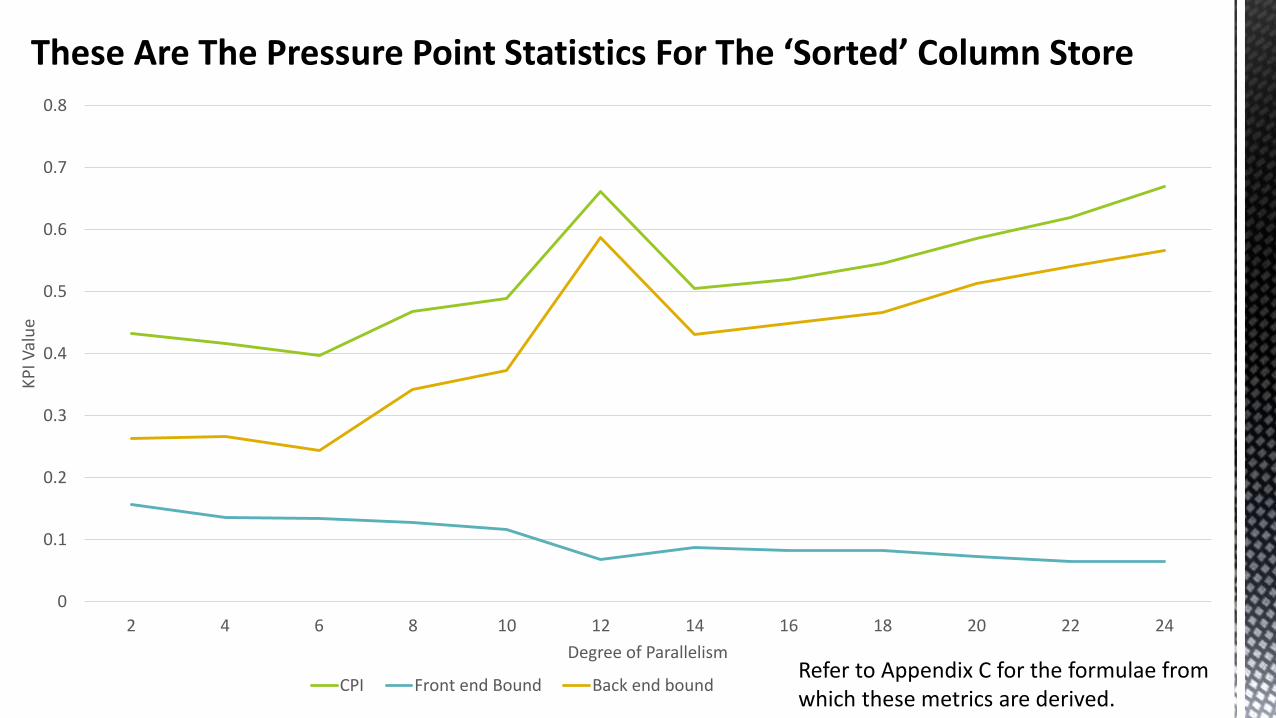
These Are The Pressure Point Statistics For The ‘Sorted’ Column Store
0
0.1
0.2
0.3
0.4
0.5
0.6
0.7
0.8
2 4 6 8 10 12 14 16 18 20 22 24
KP
I Val
ue
Degree of Parallelism
CPI Front end Bound Back end boundRefer to Appendix C for the formulae from which these metrics are derived.

Which Parts Of The Database Engine Are Suffering Backend Pressure ?
Results obtained for a degree of parallelism of 24.
256-bitFMULBlend
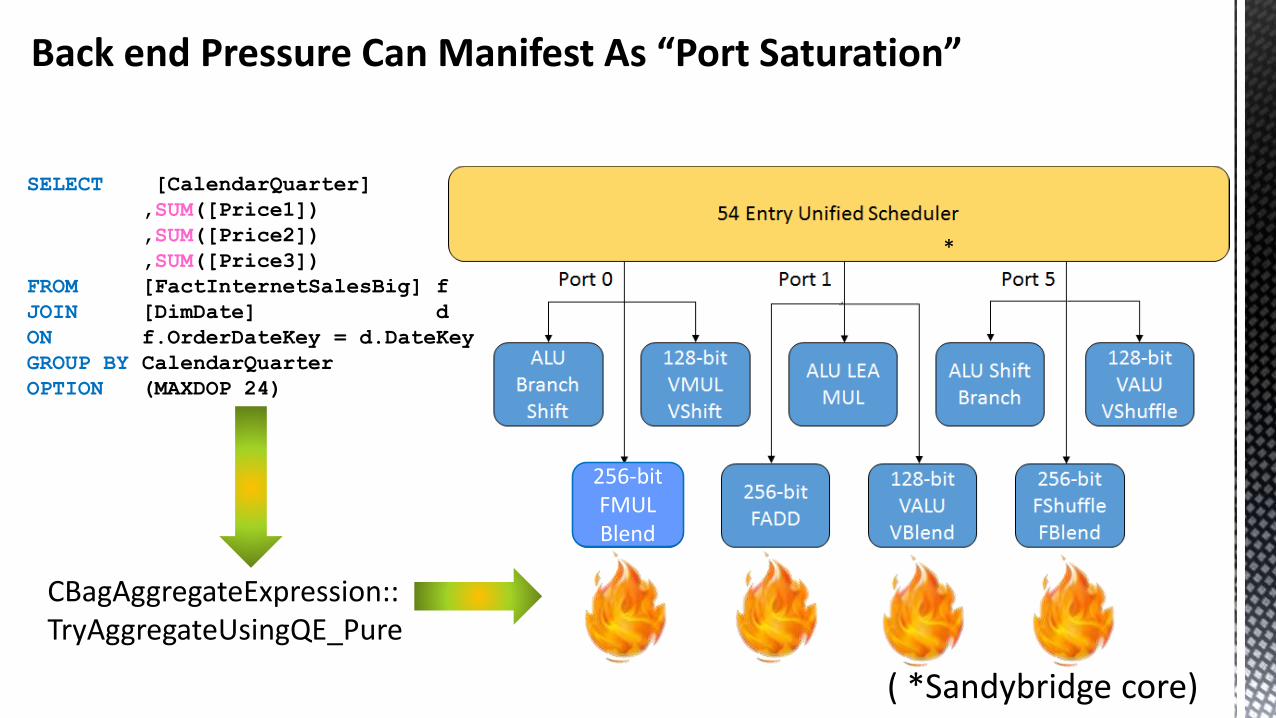
Back end Pressure Can Manifest As “Port Saturation”
( *Sandybridge core)
CBagAggregateExpression::TryAggregateUsingQE_Pure
*
SELECT [CalendarQuarter]
,SUM([Price1])
,SUM([Price2])
,SUM([Price3])
FROM [FactInternetSalesBig] f
JOIN [DimDate] d
ON f.OrderDateKey = d.DateKey
GROUP BY CalendarQuarter
OPTION (MAXDOP 24)

Ports Saturation Analysis
0.46
0.45
0.16
0.17
0.1
0.55
0 0.1 0.2 0.3 0.4 0.5 0.6
0
1
2
3
4
5
Hit Ratio
Port
0.7 and above is deemed as port saturation, if we can drive CPU utilisation above 60% we may start to see this on ports 0, 1 and 5.
Back end Pressure
Can we help the back end keep up with the front end ?
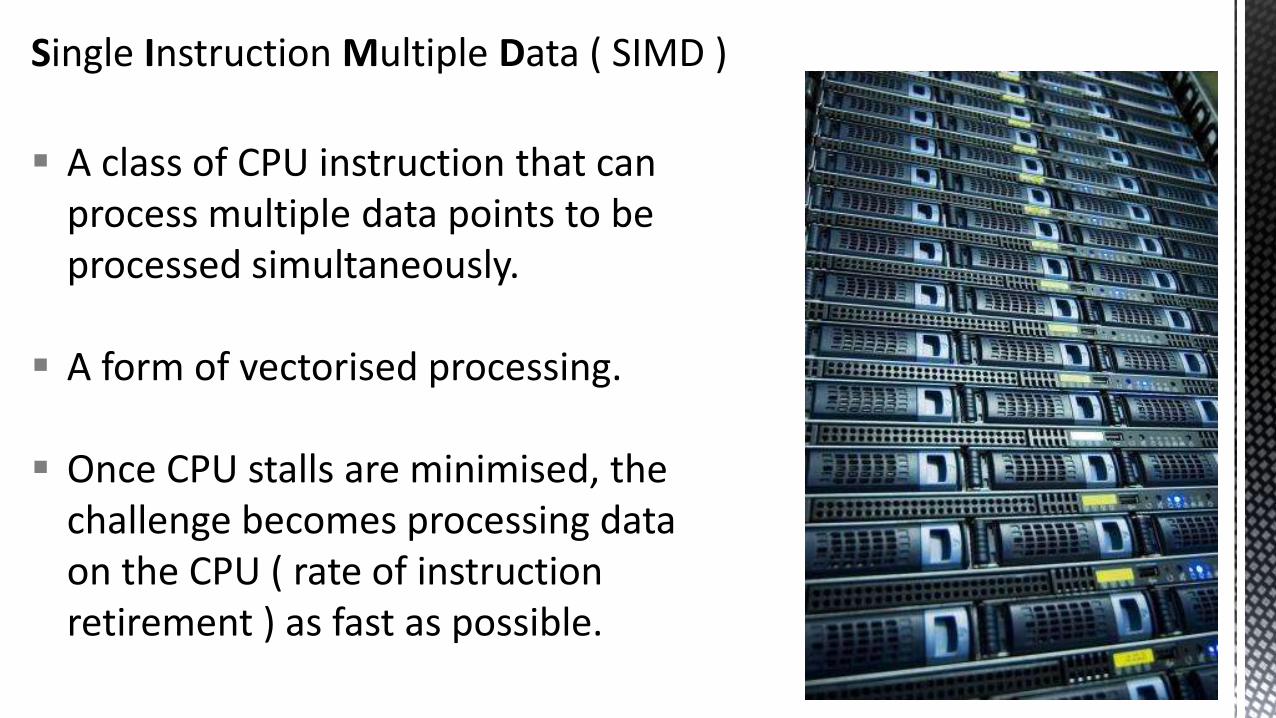
Single Instruction Multiple Data ( SIMD )
A class of CPU instruction that can process multiple data points to be processed simultaneously.
A form of vectorised processing.
Once CPU stalls are minimised, the challenge becomes processing data on the CPU ( rate of instruction retirement ) as fast as possible.
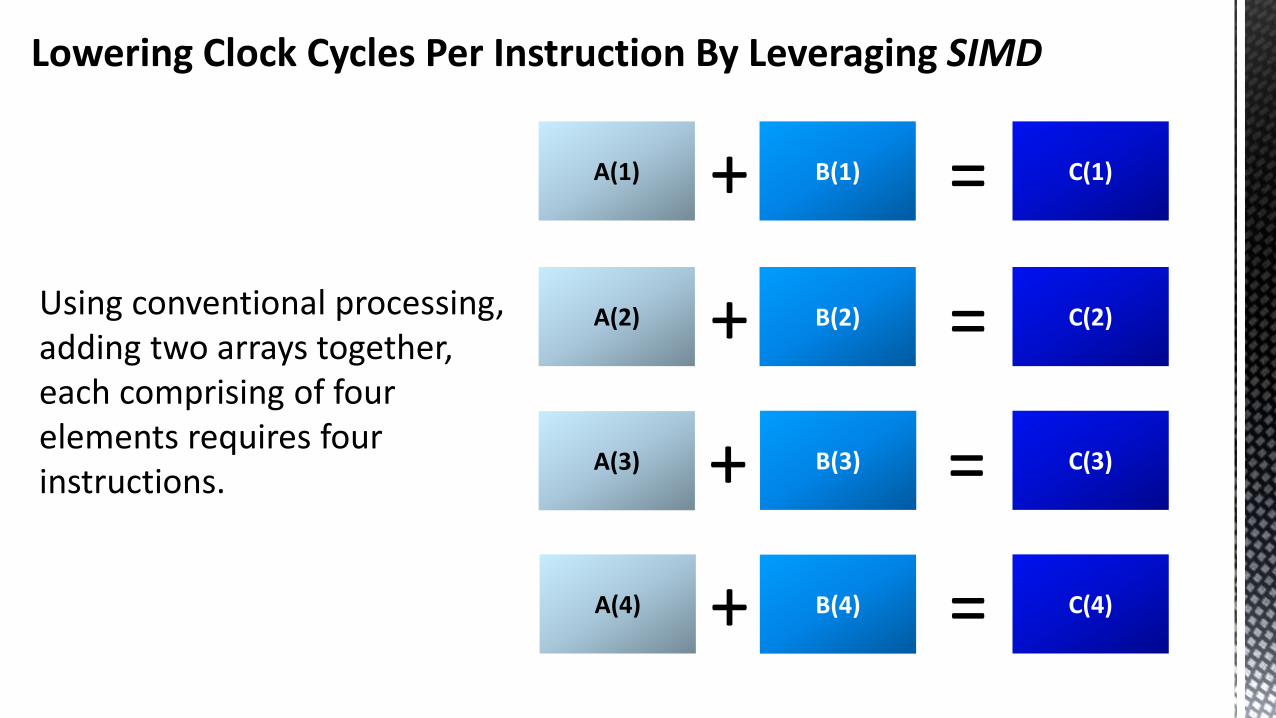
Lowering Clock Cycles Per Instruction By Leveraging SIMD
A(1) B(1)+ C(1)=
+ =
+ =
+ =
Using conventional processing, adding two arrays together, each comprising of four elements requires four instructions.
A(2)
A(3)
A(4)
B(2)
B(3)
B(4)
C(2)
C(3)
C(4)
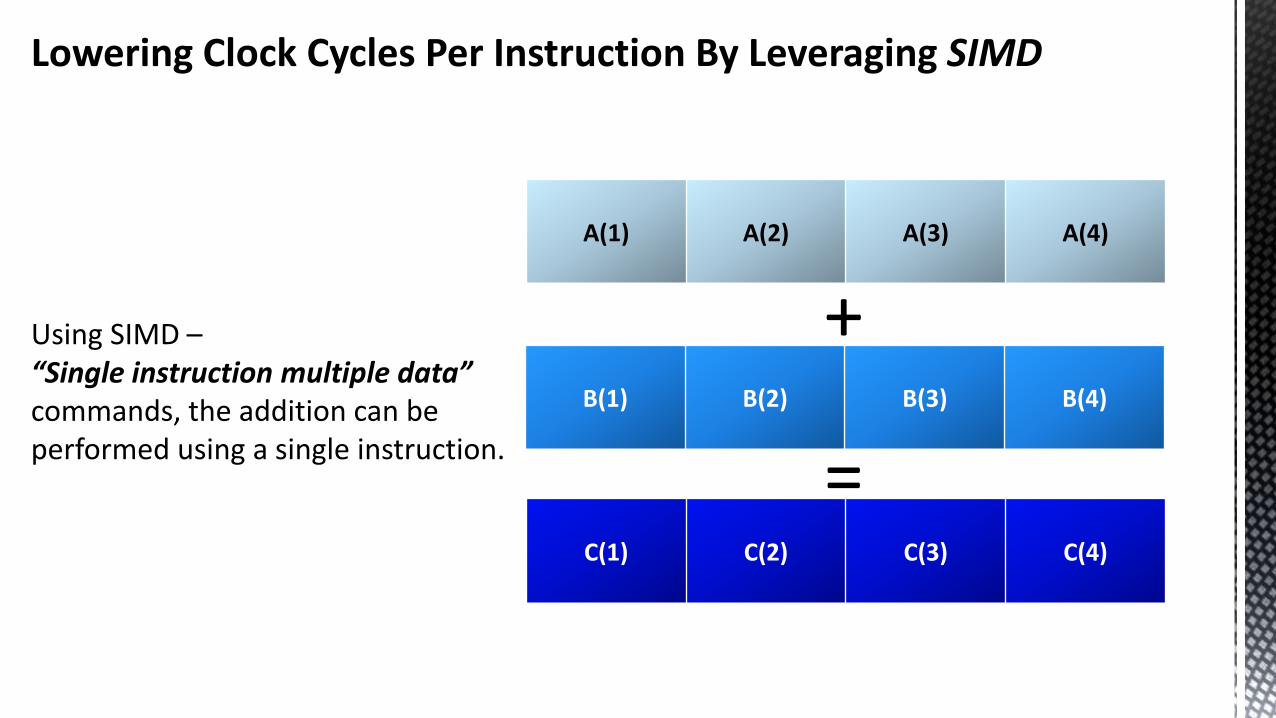
Lowering Clock Cycles Per Instruction By Leveraging SIMD
A(1) A(2) A(3) A(4)
B(1) B(2) B(3) B(4)
+
C(1) C(2) C(3) C(4)
=
Using SIMD –“Single instruction multiple data” commands, the addition can be performed using a single instruction.

Intel Advanced Vector eXtensions
2011 2012 2013 2014 2015 Future
WestmereSandy Bridge
Ivy Bridge Haswell Broadwell Skylake
87 GFLOPS 185 GFLOPS ~225 GFLOPS ~500 GFLOPS tbd GFLOPS tbd GFLOPS
32 nmSSE 4.2DDR3PCIe2
32 nmAVX
(256 bit registers)
DDR3PCIe3
22 nm 22 nmAVX2(new
instructions)DDR4PCIe3
14 nm 14 nmAVX 3.2(512 bit
registers)DDR4PCIe4
AVX Registers getting wider, instruction set getting richer
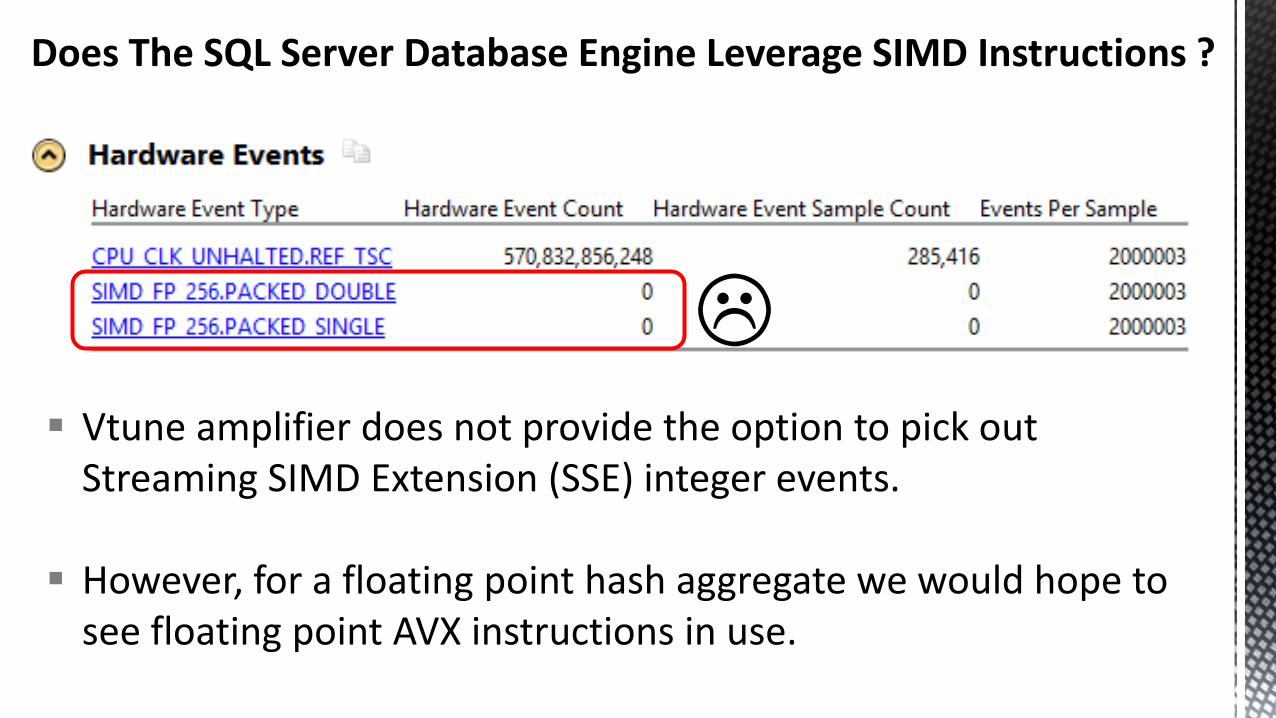
Does The SQL Server Database Engine Leverage SIMD Instructions ?
Vtune amplifier does not provide the option to pick out Streaming SIMD Extension (SSE) integer events.
However, for a floating point hash aggregate we would hope to see floating point AVX instructions in use.

The Case Of The CPU Pressure Point: Conclusion
The batch mode engine needs to leverage SIMD.
If the hash aggregate could ‘Crunch’ more data per clock cycle, it would stand a better chance of keeping up with the column store scan !.
Just about all other column store database engines use SIMD, please can the batch engine leverage SIMD Microsoft . . .

What About ?
AMD came up with the 3D Now SIMD instruction set.
Its losing the single threaded performance race to Intel: Will this change with Excavator ?
AMD innovations: 1st 64 bit implementation of the x86 architecture 1st the break the 1Ghz barrier for a x86 CPU 1st to release native dual and quad core x86 processors

A Look Into The Future: CPU Technology
Moore’s law runs out of steam => transition away from CMOS
L4 caches becoming more prevalent.
Aggressive vectorisation by leveraging GPU cores on the CPU die.
On CPU package NIC functionality.
Rise of the ARM processor in the data centre.
CPU

A Look Into The Future: Storage and Memory
Rise of:NVMe and NVMe over fabrics. Stacked memory technology.
Increase in NAND flash density through TLC and 3D NAND.
Mass storage and main memory converge.

A Look Into The Future: Database Engines
Column store technology becomes the de facto standard for data warehouses and marts.
Adoption of moreMonetDB innovationsinto popular database engines:Database crackingQuery recycling


Which Memory Your Data Is In Matters !, Locality Matters !
L3 Cache
Here ?
L1 Instruction Cache
L2 Unified Cache
Here ?
L1 Data Cache
Here ?
Core
Memory bus
Where is my data ?
C P U
Hopefully not here ?!?
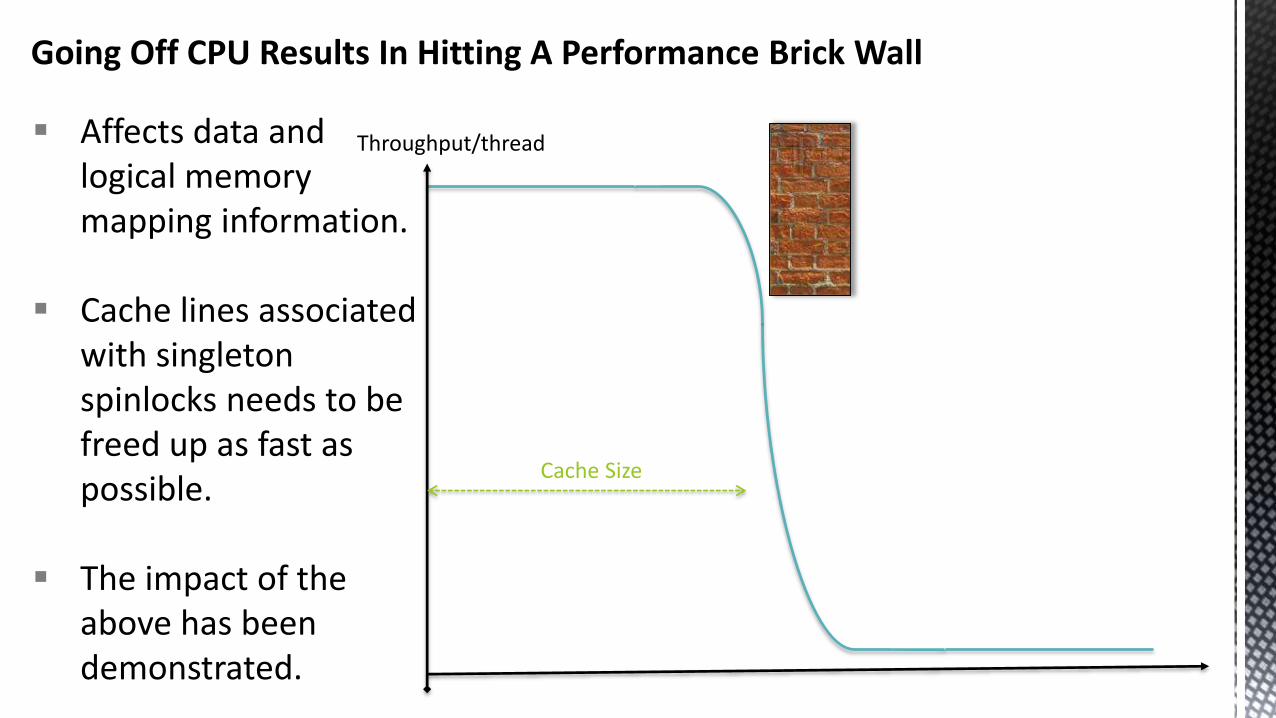
Going Off CPU Results In Hitting A Performance Brick Wall
Affects data and logical memory mapping information.
Cache lines associated with singleton spinlocks needs to be freed up as fast as possible.
The impact of the above has been demonstrated.
Throughput/thread
Cache Size
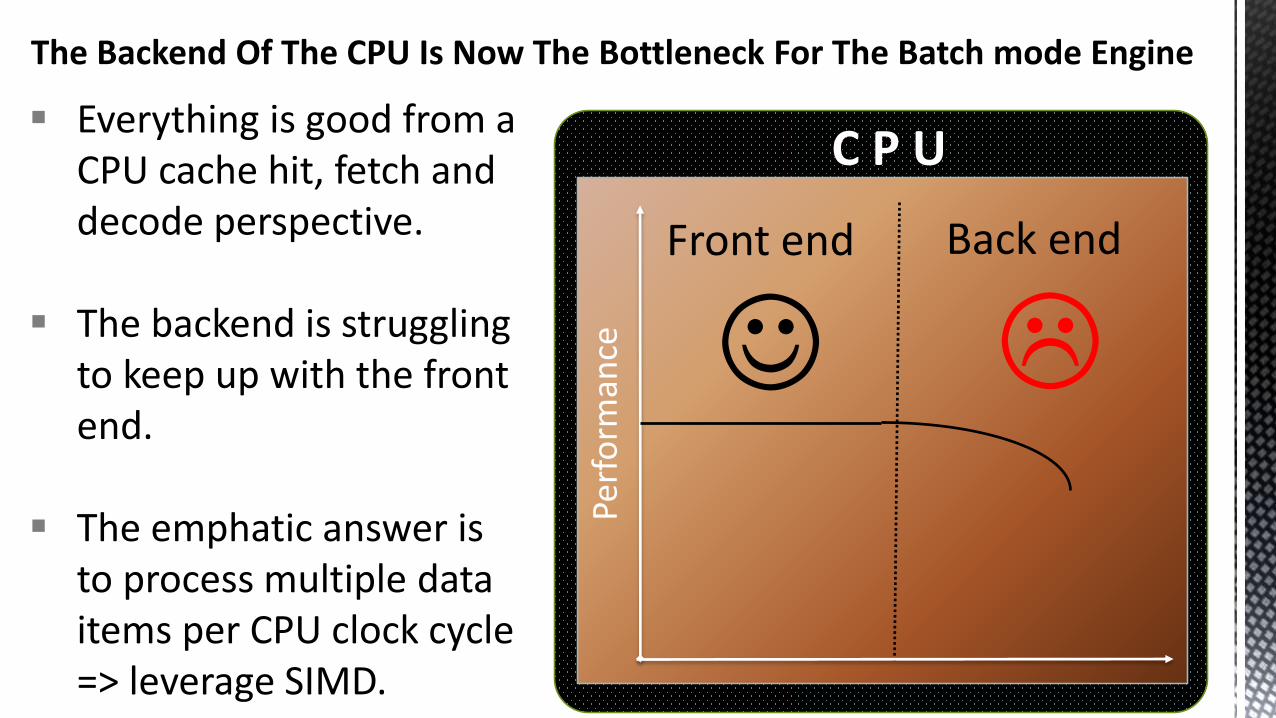
The Backend Of The CPU Is Now The Bottleneck For The Batch mode Engine
C P U
Front end
Back end
Perf
orm
ance
Everything is good from a CPU cache hit, fetch and decode perspective.
The backend is struggling to keep up with the front end.
The emphatic answer is to process multiple data items per CPU clock cycle => leverage SIMD.


http://uk.linkedin.com/in/wollatondba
ChrisAdkin8
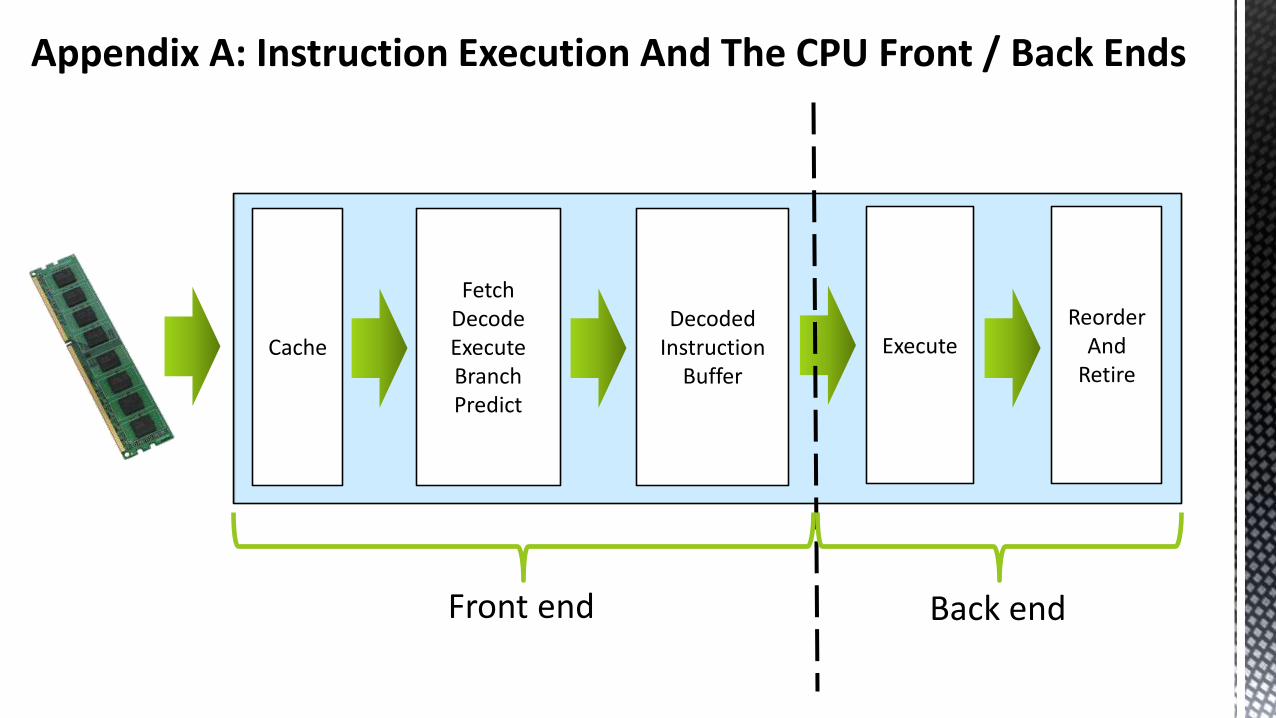
Appendix A: Instruction Execution And The CPU Front / Back Ends
Cache
FetchDecodeExecuteBranchPredict
DecodedInstruction
Buffer
ExecuteReorder
AndRetire
Front end Back end
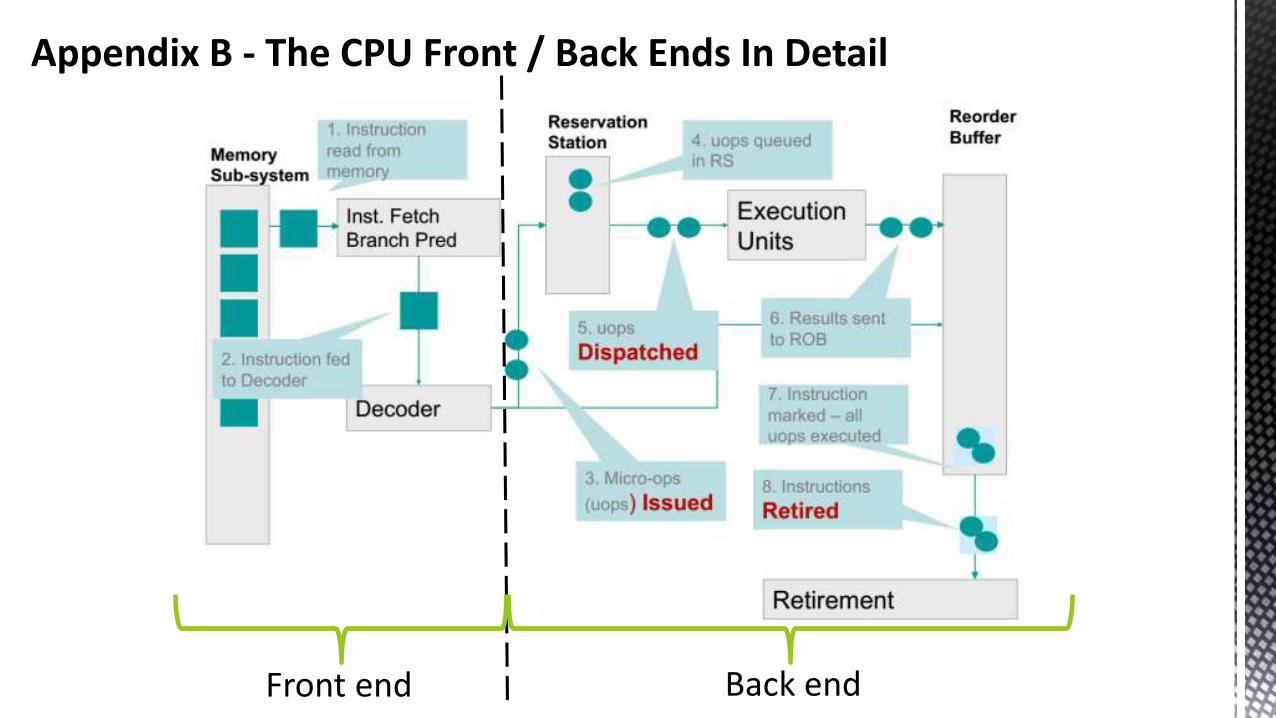
Appendix B - The CPU Front / Back Ends In Detail
Front end Back end

Front end bound ( smaller is better ) IDQ_NOT_DELIVERED.CORE / (4 * Clock ticks)
Bad speculation (UOPS_ISSUED.ANY – UOPS.RETIRED.RETIRED_SLOTS + 4 *
INT_MISC.RECOVERY_CYCLES) / (4 * Clock ticks)
Retiring UOPS_RETIRE_SLOTS / (4 * Clock ticks)
Back end bound ( ideally, should = 1 - Retiring) 1 – (Front end bound + Bad speculation + Retiring)
Appendix C - CPU Pressure Points, Important Calculations
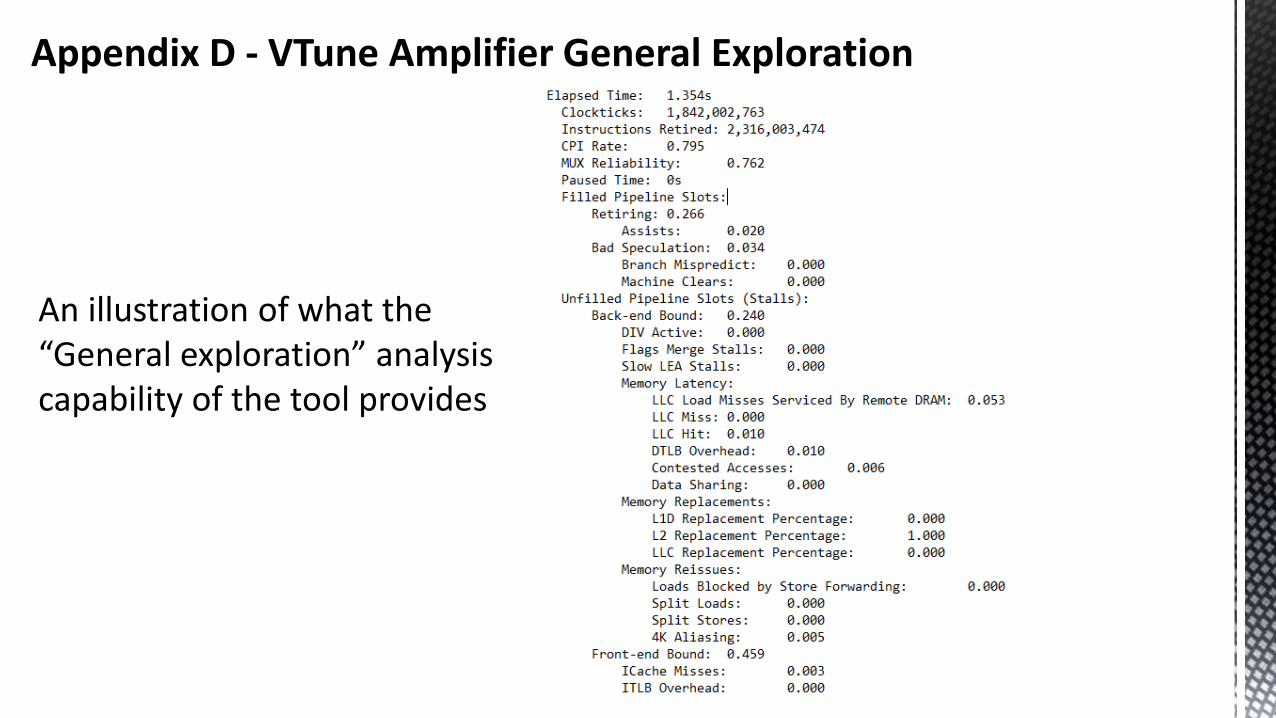
An illustration of what the “General exploration” analysis capability of the tool provides
Appendix D - VTune Amplifier General Exploration