Embed Size (px)
Citation preview
08/05/12 SQL Server Best Practices Article
1/15technet.microsoft.com/en-us/library/cc966412(d=printer).aspx
SQL Server Best Practices ArticlePublished: June 5, 2007
Writer: Mike Ruthruff
Contributors: Michael Thomassy, Prem Mehra
Technical Reviewers: Robert Dorr, Stuart Ozer, Juergen Thomas, Lindsey Allen, Burzin Patel, BillEmmert, Bruce Worthington, Sanjay Mishra
Applies To: SQL Server 2005
Summary: The I/O system is important to the performance of SQL Server. When configuring a newserver for SQL Server or when adding or modifying the disk configuration of an existing system, it isgood practice to determine the capacity of the I/O subsystem prior to deploying SQL Server. Thiswhite paper discusses validating and determining the capacity of an I/O subsystem. A number oftools are available for performing this type of testing. This white paper focuses on the SQLIO.exetool, but also compares all available tools. It also covers basic I/O configuration best practices forSQL Server 2005.
On This Page
Overview Determining I/O Capacity Disk Configuration Best Practices & Common Pitfalls SQLIO Monitoring I/O Performance Using System Monitor Conclusion Resources
Overview
One of the key components that affect the performance of Microsoft® SQL Server™ is the I/Osubsystem. When configuring a new server for SQL Server or when adding or modifying the diskconfiguration of an existing system it is good practice to determine the capacity of the I/Osubsystem prior to deploying SQL Server.
This paper provides guidance for validating and determining the capacity of an I/O subsystem. Anumber of tools are available that can be used to perform this type of testing. The focus of thispaper is on the SQLIO.exe tool. However, we will contrast and compare all of the available tools.Much of the information in this white paper is in the document that is included with the download ofthe SQLIO tool; however, this white paper includes updates to existing information and additionalinformation, including basic I/O configuration best practices as related to SQL Server based onrecent learnings.
Background
Using an I/O stress tool to validate performance and ensure that the system is tuned optimally forSQL Server before deployment helps identify hardware or I/O configuration related issues before thecomplexity of SQL Server is introduced. SQLIO.exe is a tool that can be used to determine the I/Ocapacity of a given hardware configuration. The purpose of SQLIO is not to simulate exactly the I/Opatterns of SQL Server but rather to determine the capacity of an I/O subsystem for specific I/Otypes that are relevant to SQL Server deployments. Testing a variety of I/O types is necessarybecause performance problems can be specific to a certain type of I/O or pattern of I/O.
A number of tools are available to stress and validate the functionality of I/O subsystems. Some ofthese tools actually simulate SQL Server I/O patterns and others allow you to control the I/Opatterns submitted to the subsystem. There are tools that confirm the functional validity of a
08/05/12 SQL Server Best Practices Article
2/15technet.microsoft.com/en-us/library/cc966412(d=printer).aspx
configuration and others that are used purely to test performance capacity. The following tablecompares the most common tools currently used to test I/O subsystems in the context of SQLServer.
Table 1 Tools used to test I/O subsystems
Tool Used to determine I/O Patterns Provided by
SQLIO.exe Performance capacityUser defined—Single I/O type at a time
Microsoft
IOMeter Performance capacityUser defined—Allows combinations of I/O types
Open Source
SQLIOSimFunctionalcorrectness
Simulates SQL Server I/Opatterns
Microsoft
SQLIOStress (deprecated – useSQLIOSim)
Functionalcorrectness
Simulates SQL Server I/Opatterns
Microsoft
SQLIOStress and SQLIOSim validate the basic functionality of an I/O subsystem under stress. Theyattempt to simulate actual SQL Server I/O patterns and check results for correctness. These toolsare commonly used by the Microsoft SQL Server support organization to isolate hardware-relatedcorruption problems.
For the purposes of this discussion, SQLIO and IOMeter are the most appropriate tools. SQLIO is afairly rudimentary tool that can be used to issue a particular type of I/O against one or many testfiles to measure I/Os per second (IOPs), throughput (MB/s), and latency.
IOMeter is a bit more sophisticated; it enables you to define combinations of I/O patterns, whichcan be issued concurrently against one or more test files. While this can be advantageous forcertain test scenarios, remember that the purpose of testing as described in this white paper is tomeasure performance and confirm that a particular I/O subsystem is configured correctly. It ismisleading to assume that using a tool such as IOMeter allows you to simulate SQL Server I/Opatterns just because with it you can define combinations of I/O types. This topic is discussed laterin this paper.
With the growing variety of storage solutions in today’s IT organizations, several items should benoted before continuing:
While the information provided in this white paper can be used to performance test any disksubsystem, much of it is directed toward higher end storage arrays (such as those withsignificant amounts of cache, processing power, and so on). Keep this in mind if you are usingor testing a more traditional disk subsystem.
This paper focuses heavily on I/O subsystems with fiber channel connectivity. However, thesame concepts can be applied to iSCSI or other traditional direct attach storage systems.
Top Of Page
Determining I/O Capacity
This section covers best practices that should be applied when using any tool to determine theperformance capacity of a given I/O configuration. Consider the following:
Test a variety of I/O types and sizes.
08/05/12 SQL Server Best Practices Article
3/15technet.microsoft.com/en-us/library/cc966412(d=printer).aspx
Test a combination of I/O sizes for read/write and sequential/random. For SQL-focuseddeployments, be sure to include I/O sizes of 8 KB, 64 KB, 128 KB, 256 KB & 1024 for sequentialI/O. (Read-ahead can be up to 1024 KB when running SQL Server Enterprise Edition). Forrandom I/O it is generally safe to focus only on 8-KB I/O.
There are differences when measuring the performance of sequential I/O versus measuring theperformance of random I/O. The important unit of measurement for sequential I/O isthroughput (MB/s) whereas for random I/O, the important unit of measure is the number ofI/Os per second. If summarized at a high-level I/O, operations within SQL Server can becharacterized as follows:
Online Transaction Processing (OLTP):
OLTP processing is generally random in nature for both reads and writes issued againstdata files.
Read activity (in most cases) is constant in nature.
Write activity to the data files occurs during checkpoint operations (frequency isdetermined by recovery interval settings).
Log writes are sequential in nature with a varying size, which is dependent on the natureof the workload (sector aligned up to 60 KB).
Log reads are sequential in nature (sector aligned up to 120 KB).
Decision Support System (DSS):
Reads and writes tend to be sequential in nature and are generally the result of table orindex scans and bulk insert operations.
I/O size varies but is generally larger than 8 KB. Read-ahead is any multiple of 8 KB up to256 KB (1024 KB for Enterprise edition). Bulk load operations are any multiple of 8 KB upto 128 KB.
Determine the saturation point of an I/O subsystem by gradually increasing the load.
Start with a small number of outstanding I/Os (-o) and gradually increase this until the path issaturated. Saturation occurs when latency increases and throughput stays the same. Anexample of disk saturation is shown in Figure 1.

08/05/12 SQL Server Best Practices Article
4/15technet.microsoft.com/en-us/library/cc966412(d=printer).aspx
Figure 1 Disk saturation for random reads
The performance monitor graph in Figure 1 shows three data points: Average Disk QueueLength, Disk Reads/sec and Avg. Disk sec/ Read (latency). The type of I/O issued here israndom 8 KB reads. Using I/O of this type removes the impact of the array cache on the testbecause random reads will not benefit from the cache. As illustrated, as the number ofoutstanding I/Os is increased (Avg Disk Queue Length), the throughput increases until greaterthan 64 outstanding I/Os are issued. At this point, latency continues to increase; however,I/Os per second (Disk Reads/sec) stays constant—this is the point of disk saturation.
In addition to disk saturation, it is also possible to saturate the capacity of a Host Bus Adapter(HBA) before exhausting disk resources. Typical modern HBAs have a bandwidth of 2 Gb/s.This equates roughly into 200 MB/s. We have observed practical throughput in the range of180–190 MB/s. The graph in Figure 2 illustrates the saturation of a single HBA.
08/05/12 SQL Server Best Practices Article
5/15technet.microsoft.com/en-us/library/cc966412(d=printer).aspx
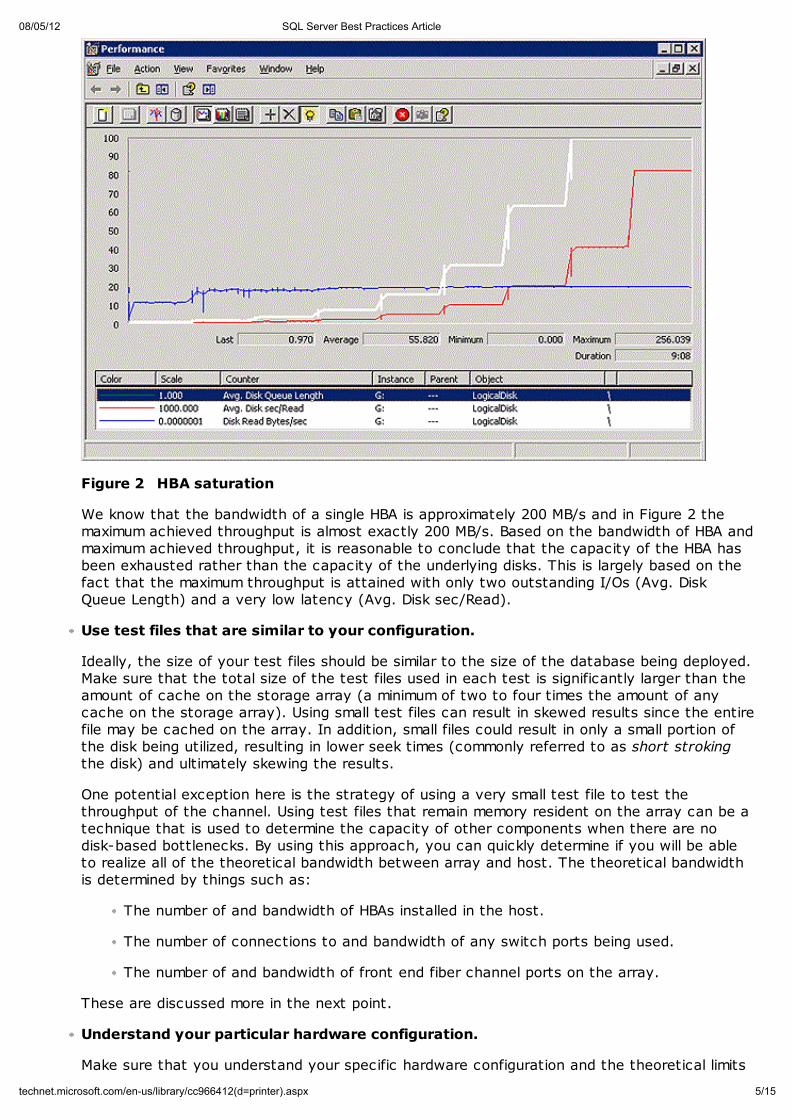
Figure 2 HBA saturation
We know that the bandwidth of a single HBA is approximately 200 MB/s and in Figure 2 themaximum achieved throughput is almost exactly 200 MB/s. Based on the bandwidth of HBA andmaximum achieved throughput, it is reasonable to conclude that the capacity of the HBA hasbeen exhausted rather than the capacity of the underlying disks. This is largely based on thefact that the maximum throughput is attained with only two outstanding I/Os (Avg. DiskQueue Length) and a very low latency (Avg. Disk sec/Read).
Use test files that are similar to your configuration.
Ideally, the size of your test files should be similar to the size of the database being deployed.Make sure that the total size of the test files used in each test is significantly larger than theamount of cache on the storage array (a minimum of two to four times the amount of anycache on the storage array). Using small test files can result in skewed results since the entirefile may be cached on the array. In addition, small files could result in only a small portion ofthe disk being utilized, resulting in lower seek times (commonly referred to as short strokingthe disk) and ultimately skewing the results.
One potential exception here is the strategy of using a very small test file to test thethroughput of the channel. Using test files that remain memory resident on the array can be atechnique that is used to determine the capacity of other components when there are nodisk-based bottlenecks. By using this approach, you can quickly determine if you will be ableto realize all of the theoretical bandwidth between array and host. The theoretical bandwidthis determined by things such as:
The number of and bandwidth of HBAs installed in the host.
The number of connections to and bandwidth of any switch ports being used.
The number of and bandwidth of front end fiber channel ports on the array.
These are discussed more in the next point.
Understand your particular hardware configuration.
Make sure that you understand your specific hardware configuration and the theoretical limits
08/05/12 SQL Server Best Practices Article
6/15technet.microsoft.com/en-us/library/cc966412(d=printer).aspx
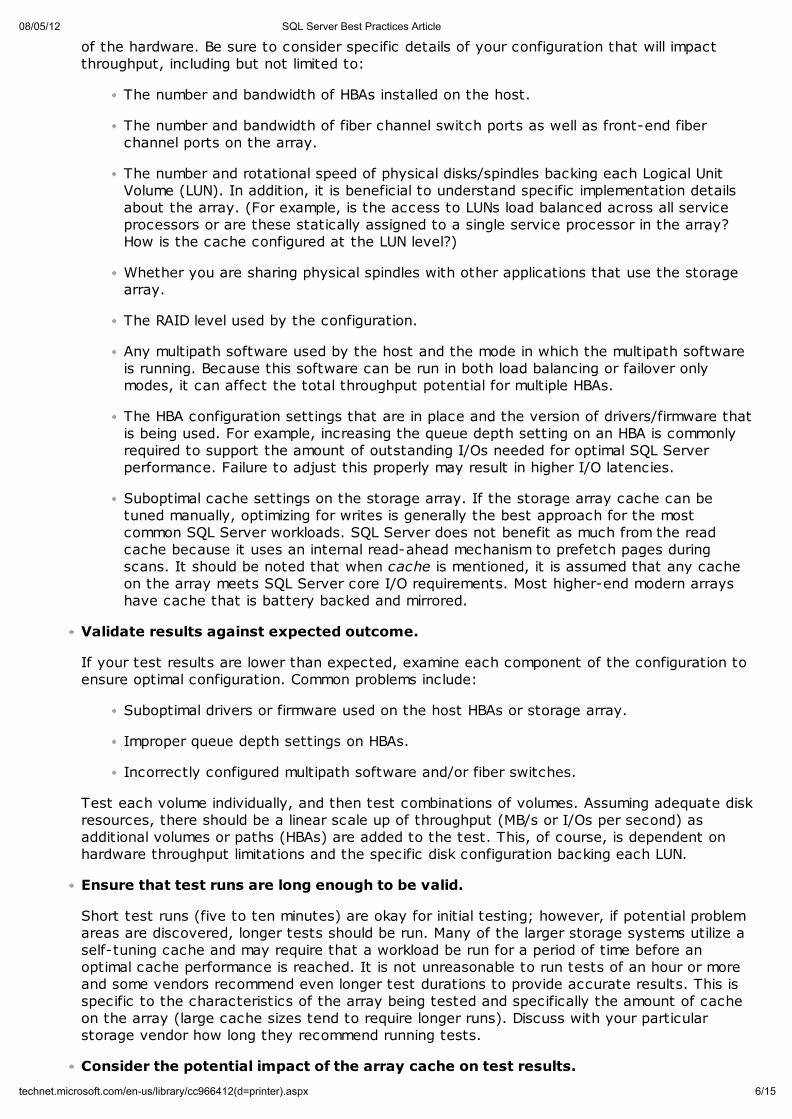
of the hardware. Be sure to consider specific details of your configuration that will impactthroughput, including but not limited to:
The number and bandwidth of HBAs installed on the host.
The number and bandwidth of fiber channel switch ports as well as front-end fiberchannel ports on the array.
The number and rotational speed of physical disks/spindles backing each Logical UnitVolume (LUN). In addition, it is beneficial to understand specific implementation detailsabout the array. (For example, is the access to LUNs load balanced across all serviceprocessors or are these statically assigned to a single service processor in the array?How is the cache configured at the LUN level?)
Whether you are sharing physical spindles with other applications that use the storagearray.
The RAID level used by the configuration.
Any multipath software used by the host and the mode in which the multipath softwareis running. Because this software can be run in both load balancing or failover onlymodes, it can affect the total throughput potential for multiple HBAs.
The HBA configuration settings that are in place and the version of drivers/firmware thatis being used. For example, increasing the queue depth setting on an HBA is commonlyrequired to support the amount of outstanding I/Os needed for optimal SQL Serverperformance. Failure to adjust this properly may result in higher I/O latencies.
Suboptimal cache settings on the storage array. If the storage array cache can betuned manually, optimizing for writes is generally the best approach for the mostcommon SQL Server workloads. SQL Server does not benefit as much from the readcache because it uses an internal read-ahead mechanism to prefetch pages duringscans. It should be noted that when cache is mentioned, it is assumed that any cacheon the array meets SQL Server core I/O requirements. Most higher-end modern arrayshave cache that is battery backed and mirrored.
Validate results against expected outcome.
If your test results are lower than expected, examine each component of the configuration toensure optimal configuration. Common problems include:
Suboptimal drivers or firmware used on the host HBAs or storage array.
Improper queue depth settings on HBAs.
Incorrectly configured multipath software and/or fiber switches.
Test each volume individually, and then test combinations of volumes. Assuming adequate diskresources, there should be a linear scale up of throughput (MB/s or I/Os per second) asadditional volumes or paths (HBAs) are added to the test. This, of course, is dependent onhardware throughput limitations and the specific disk configuration backing each LUN.
Ensure that test runs are long enough to be valid.
Short test runs (five to ten minutes) are okay for initial testing; however, if potential problemareas are discovered, longer tests should be run. Many of the larger storage systems utilize aself-tuning cache and may require that a workload be run for a period of time before anoptimal cache performance is reached. It is not unreasonable to run tests of an hour or moreand some vendors recommend even longer test durations to provide accurate results. This isspecific to the characteristics of the array being tested and specifically the amount of cacheon the array (large cache sizes tend to require longer runs). Discuss with your particularstorage vendor how long they recommend running tests.
Consider the potential impact of the array cache on test results.

08/05/12 SQL Server Best Practices Article
7/15technet.microsoft.com/en-us/library/cc966412(d=printer).aspx
Keep in mind for tests that issue writes, accurate disk-based performance will not be observeduntil the cache is saturated. If you are the only user of the array, allow some time in betweeneach I/O type that you test to allow the I/O system to return to an idle state and run longenough so that you are actually observing disk-based I/O performance. Following a largeamount of write activity, it may take some time to flush all pending write requests from cacheto disk. If no wait time is included between tests, this could impact the results of subsequenttests. Waiting one minute between tests is acceptable for most systems; however, you shouldconsult your storage vendor to determine what is acceptable on their specific hardware.
Review performance with storage administrators and hardware vendors.
Store all of the benchmark data in order to compare it with the SQL Server I/O throughputnumbers. Share this information with storage vendors and/or storage administrators todetermine if your results are what would be expected for your particular storage configuration.
Top Of Page
Disk Configuration Best Practices & Common Pitfalls
The SQL Server Best Practices site on Microsoft TechNet has a list of the top ten storage best
practices with respect to SQL Server: see Storage Top 10 Best Practices1.
In addition to the best practices on the Top 10 list, this section lists best practices whenconfiguring the NTFS file system and other host-specific I/O settings.
Volume Alignment
Volume alignment, commonly referred to as sector alignment, should be performed on the file system(NTFS) whenever a volume is created on a RAID device. Failure to do so can lead to significantperformance degradation; these are most commonly the result of partition misalignment with stripeunit boundaries. This can also lead to hardware cache misalignment, resulting in inefficient utilizationof the array cache. For more information on this, see Disk performance may be slower than expected
when you use multiple disks in Windows Server 2003, in Windows XP, and in Windows 20002.
Volume alignment on NTFS volumes can be performed by using diskpar.exe or DiskPart.exe. There isno advantage of using one over the other. However, DiskPart.exe is the preferred method since it isnow included as part of Microsoft Windows® and the functionality will continue to be enhanced.Diskpar.exe is a Windows 2000 Resource Kit tool and is most commonly used in versions of Windowsprior to Windows 2003 SP1. DiskPart.exe is a disk configuration utility that is built into Windows; inWindows 2003 version SP1 or greater DiskPart.exe contains an ALIGN option that can be used toalign volumes.
When aligning the file system keep in mind the following:
Ideally, the offset used to align the volume should be supplied by the OEM of your particularstorage array.
If the OEM does not provide an offset, the only way to determine the optimal offset is throughtesting.
A 64-KB offset (128 sectors) is a common value that works on many storage arrays and hasbeen used with success in the SQL Server test labs (at the time of writing this paper). Vista™and Windows Longhorn Server remove the need to manually establish correct alignment anduse 1024 KB (2048 sectors) as a starting offset, which will probably work well for almost anyarray.
Diskpar.exe works only on MBR partitions. DiskPart.exe supports both MBR and GPT partitions.Alignment of dynamic volumes is not currently supported as of Windows 2003 SP1.
The value of the offset for diskpar.exe is expressed in sectors (512 bytes) and differs from theALIGN option of DiskPart.exe, which uses a value defined in KB. For example “create partitionprimary align=64” creates a partition using a 64-KB offset.
08/05/12 SQL Server Best Practices Article
8/15technet.microsoft.com/en-us/library/cc966412(d=printer).aspx
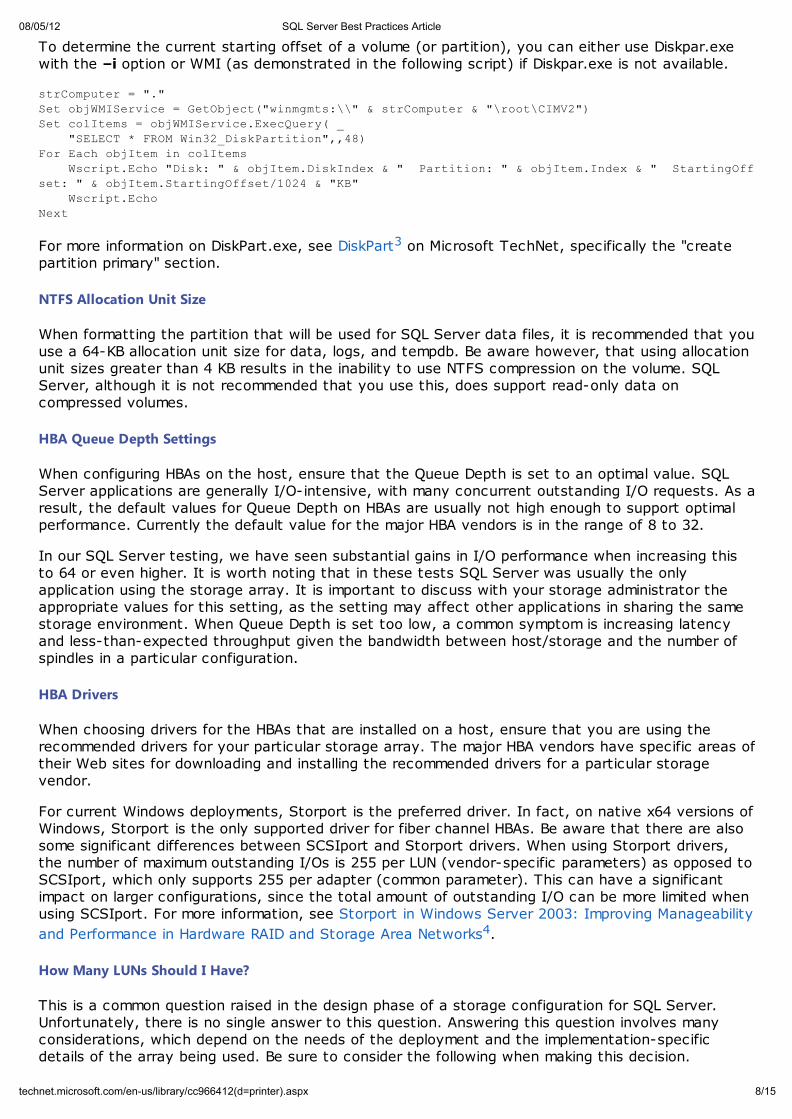
To determine the current starting offset of a volume (or partition), you can either use Diskpar.exewith the –i option or WMI (as demonstrated in the following script) if Diskpar.exe is not available.
strComputer = "."
Set objWMIService = GetObject("winmgmts:\\" & strComputer & "\root\CIMV2")
Set colItems = objWMIService.ExecQuery( _
"SELECT * FROM Win32_DiskPartition",,48)
For Each objItem in colItems
Wscript.Echo "Disk: " & objItem.DiskIndex & " Partition: " & objItem.Index & " StartingOff
set: " & objItem.StartingOffset/1024 & "KB"
Wscript.Echo
Next
For more information on DiskPart.exe, see DiskPart3 on Microsoft TechNet, specifically the "createpartition primary" section.
NTFS Allocation Unit Size
When formatting the partition that will be used for SQL Server data files, it is recommended that youuse a 64-KB allocation unit size for data, logs, and tempdb. Be aware however, that using allocationunit sizes greater than 4 KB results in the inability to use NTFS compression on the volume. SQLServer, although it is not recommended that you use this, does support read-only data oncompressed volumes.
HBA Queue Depth Settings
When configuring HBAs on the host, ensure that the Queue Depth is set to an optimal value. SQLServer applications are generally I/O-intensive, with many concurrent outstanding I/O requests. As aresult, the default values for Queue Depth on HBAs are usually not high enough to support optimalperformance. Currently the default value for the major HBA vendors is in the range of 8 to 32.
In our SQL Server testing, we have seen substantial gains in I/O performance when increasing thisto 64 or even higher. It is worth noting that in these tests SQL Server was usually the onlyapplication using the storage array. It is important to discuss with your storage administrator theappropriate values for this setting, as the setting may affect other applications in sharing the samestorage environment. When Queue Depth is set too low, a common symptom is increasing latencyand less-than-expected throughput given the bandwidth between host/storage and the number ofspindles in a particular configuration.
HBA Drivers
When choosing drivers for the HBAs that are installed on a host, ensure that you are using therecommended drivers for your particular storage array. The major HBA vendors have specific areas oftheir Web sites for downloading and installing the recommended drivers for a particular storagevendor.
For current Windows deployments, Storport is the preferred driver. In fact, on native x64 versions ofWindows, Storport is the only supported driver for fiber channel HBAs. Be aware that there are alsosome significant differences between SCSIport and Storport drivers. When using Storport drivers,the number of maximum outstanding I/Os is 255 per LUN (vendor-specific parameters) as opposed toSCSIport, which only supports 255 per adapter (common parameter). This can have a significantimpact on larger configurations, since the total amount of outstanding I/O can be more limited whenusing SCSIport. For more information, see Storport in Windows Server 2003: Improving Manageability
and Performance in Hardware RAID and Storage Area Networks4.
How Many LUNs Should I Have?
This is a common question raised in the design phase of a storage configuration for SQL Server.Unfortunately, there is no single answer to this question. Answering this question involves manyconsiderations, which depend on the needs of the deployment and the implementation-specificdetails of the array being used. Be sure to consider the following when making this decision.

08/05/12 SQL Server Best Practices Article
9/15technet.microsoft.com/en-us/library/cc966412(d=printer).aspx
Maintain a balanced storage design. The architecture of specific HBAs (Host Bus Adapters)and their settings influence performance and throughput. But in general, more LUNs result inmore independent I/O queues and potentially more concurrent outstanding I/Os. Assuming thatthe Storage Area Network (SAN) has no bottlenecks, one can expect better scalability withmultiple LUNs and multiple paths between server HBAs and the SAN.
Look at the design from potential failure viewpoint.
Keep in mind that a failed disk drive will impact the RAID group in which it participatesand additionally the various LUNs that span that RAID group. To minimize the impact,ensure that failure exposure is limited.
In the event of having to run CHKDSK, the amount of time for CHKDSK to completedepends on the number of files/directories on the LUN. Large LUNs will not necessarilyincrease the outage time; however, it is not recommended that you use a large LUN andplace a large number non-SQL related files on the volume. Keep the volume structureand number of files as small as is practical.
Any mount point volumes contained under a volume drive letter will be offline in theevent of a CHKDSK against the root volume. It is recommended that you keep the rootvolume small and dedicated to providing access to the mount point volumes.
Design for future growth. Data will undoubtedly grow over time and storage growthstrategies should be factored into any storage design. Will you add more LUNs or increase thesize of the LUNs when the need arises? Input from your storage vendor or administrator is verypertinent here—the administrator may have a policy that you must follow.
Be aware of SQL Server implementation considerations. Ultimately the I/O performance ofSQL Server is not tied to the number of underlying volumes (or LUNs). Rather, this isdetermined by the hardware capacity. A common misconception is that there is a one-to-oneassociation between SQL Server threads and data files. This is not true. I/O operations areissued by any worker thread inside the SQL Server process. There are, however, two potentialareas where the number of underlying LUNs affect SQL Server behavior. These are:
Backup and Restore. SQL Server will use one reader thread per volume and one writerthread per volume. If multiple volumes are mounted to a single drive letter using mountpoints, they still behave as separate volumes and use one thread per each volume.
File Initialization. Mainly a consideration on SQL Server 2000 and only for very largedatabases; SQL Server uses one thread per volume to initialize data files.
Ultimately, the storage design is a balance between performance, manageability, and availability.The previous list is not meant to be all inclusive but to bring up some of the common considerationsto think about when designing storage for SQL Server. The optimal storage design varies fromimplementation to implementation.
Top Of Page
SQLIO
SQLIO.exe is a tool provided by Microsoft that can be used to determine the I/O capacity of a givenconfiguration. SQLIO is provided ‘as is’ and there is no support offered for any problems encounteredwhen using the tool. Please see the EULA.doc for the license agreement for using this tool.
To download SQLIO, go to SQLIO Disk Subsystem Benchmark Tool5 on the Microsoft DownloadCenter.
Specific Instructions for Using SQLIO.exe
This section provides instructions for using SQLIO to test the hardware capacity of a givenconfiguration. For a complete set of the options available in SQLIO, see the readme.txt file or run'SQLIO.exe -?' from a command line.

08/05/12 SQL Server Best Practices Article
10/15technet.microsoft.com/en-us/library/cc966412(d=printer).aspx
When using SQLIO to test a storage configuration, all of the volumes should be tested individually,and then volumes should be added until all volumes are tested at the same time. When testing alarge number of volumes, there are potentially many combinations. In these cases, focus onscalability as the number of volumes included in the test is increased (1, 2, 4, 8, and so on). Testingthe volumes in this manner enables you to determine if there are any problems with a given volumeand if the cumulative throughput is expected, given the particular storage configuration.
Following is a sample of the syntax that could be used in a batch file to automate running SQLIOthrough a series of tests of varying I/O types and sizes. Table 2 has further explanations forsuggested values when running tests. When running tests, make sure that you keep in mind theitems outlined earlier in this document in Determining I/O Capacity. In addition, all baseline datashould be saved. This can be valuable information to reference when troubleshooting I/Operformance.
One example of how this might be used would be the following. Keep in mind however that in orderto gain a complete understanding of I/O subsystem performance, some of the parameters in thefollowing example will need to be altered after each test run, specifically the number of outstandingI/Os issued during each test (discussed in more detail in Table 2, following this code):
::Test randmon IO's of 8K
call sqlio -kW -s600 -frandom -o32 -b8 -LS -Fparam.txt
call sqlio -kR -s600 -frandom -o32 -b8 -LS -Fparam.txt
::Test small sequential writes
call sqlio -kW -s60 -fsequential -o1 -b4 -LS -Fparam.txt
call sqlio -kW -s60 -fsequential -o1 -b8 -LS -Fparam.txt
call sqlio -kW -s60 -fsequential -o1 -b16 -LS -Fparam.txt
call sqlio -kW -s60 -fsequential -o1 -b32 -LS -Fparam.txt
call sqlio -kW -s60 -fsequential -o1 -b64 -LS -Fparam.txt
::Test large sequential read/write
call sqlio -kR -s60 -fsequential -o8 –b8 -LS -Fparam.txt
call sqlio -kR -s60 -fsequential -o8 -b64 -LS -Fparam.txt
call sqlio -kR -s60 -fsequential -o8 -b128 -LS -Fparam.txt
call sqlio -kR -s60 -fsequential -o8 -b256 -LS -Fparam.txt
call sqlio -kW -s60 -fsequential -o8 –b8 -LS -Fparam.txt
call sqlio -kW -s60 -fsequential -o8 -b64 -LS -Fparam.txt
call sqlio -kW -s60 -fsequential -o8 -b128 -LS -Fparam.txt
call sqlio -kW -s60 -fsequential -o8 -b256 -LS -Fparam.txt
Some of the more commonly used parameters for SQLIO are discussed in the following table (again,see the readme.txt file or 'SQLIO.exe -?' for a complete list).
Table 2 Commonly used SQLIO.exe options
Option Description
-o
Number of outstanding I/O requests per thread. When attempting to determine the capacityof a given volume or set of volumes, start with a reasonable number for this and increaseuntil disk saturation is reached (that is, latency starts to increase without an additionalincrease in throughput or IOPs). Common values for this are 8, 16, 32, 64, and 128.
Keep in mind that this setting is the number of outstanding I/Os per thread.
-LSInstructs SQLIO to capture disk latency information. Capturing latency data is recommendedwhen testing a system.
-k
Specify either R or W (read or write). Both reads and writes should be tested. Keep in mindthat the storage array cache may absorb a good amount of write activity and potentiallyskew results. Ensure that the duration is long enough to saturate the cache in order to geta true measure of storage capacity.
08/05/12 SQL Server Best Practices Article
11/15technet.microsoft.com/en-us/library/cc966412(d=printer).aspx
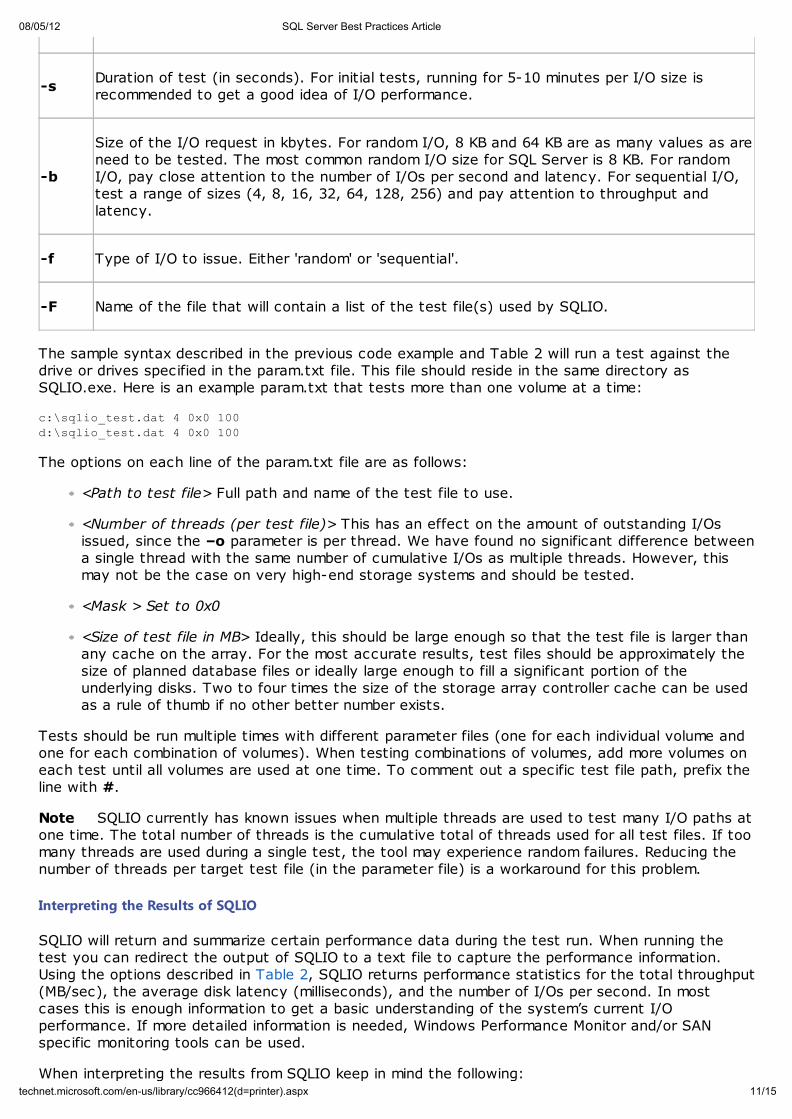
-sDuration of test (in seconds). For initial tests, running for 5-10 minutes per I/O size isrecommended to get a good idea of I/O performance.
-b
Size of the I/O request in kbytes. For random I/O, 8 KB and 64 KB are as many values as areneed to be tested. The most common random I/O size for SQL Server is 8 KB. For randomI/O, pay close attention to the number of I/Os per second and latency. For sequential I/O,test a range of sizes (4, 8, 16, 32, 64, 128, 256) and pay attention to throughput andlatency.
-f Type of I/O to issue. Either 'random' or 'sequential'.
-F Name of the file that will contain a list of the test file(s) used by SQLIO.
The sample syntax described in the previous code example and Table 2 will run a test against thedrive or drives specified in the param.txt file. This file should reside in the same directory asSQLIO.exe. Here is an example param.txt that tests more than one volume at a time:
c:\sqlio_test.dat 4 0x0 100
d:\sqlio_test.dat 4 0x0 100
The options on each line of the param.txt file are as follows:
<Path to test file> Full path and name of the test file to use.
<Number of threads (per test file)> This has an effect on the amount of outstanding I/Osissued, since the –o parameter is per thread. We have found no significant difference betweena single thread with the same number of cumulative I/Os as multiple threads. However, thismay not be the case on very high-end storage systems and should be tested.
<Mask > Set to 0x0
<Size of test file in MB> Ideally, this should be large enough so that the test file is larger thanany cache on the array. For the most accurate results, test files should be approximately thesize of planned database files or ideally large enough to fill a significant portion of theunderlying disks. Two to four times the size of the storage array controller cache can be usedas a rule of thumb if no other better number exists.
Tests should be run multiple times with different parameter files (one for each individual volume andone for each combination of volumes). When testing combinations of volumes, add more volumes oneach test until all volumes are used at one time. To comment out a specific test file path, prefix theline with #.
Note SQLIO currently has known issues when multiple threads are used to test many I/O paths atone time. The total number of threads is the cumulative total of threads used for all test files. If toomany threads are used during a single test, the tool may experience random failures. Reducing thenumber of threads per target test file (in the parameter file) is a workaround for this problem.
Interpreting the Results of SQLIO
SQLIO will return and summarize certain performance data during the test run. When running thetest you can redirect the output of SQLIO to a text file to capture the performance information.Using the options described in Table 2, SQLIO returns performance statistics for the total throughput(MB/sec), the average disk latency (milliseconds), and the number of I/Os per second. In mostcases this is enough information to get a basic understanding of the system’s current I/Operformance. If more detailed information is needed, Windows Performance Monitor and/or SANspecific monitoring tools can be used.
When interpreting the results from SQLIO keep in mind the following:
08/05/12 SQL Server Best Practices Article
12/15technet.microsoft.com/en-us/library/cc966412(d=printer).aspx
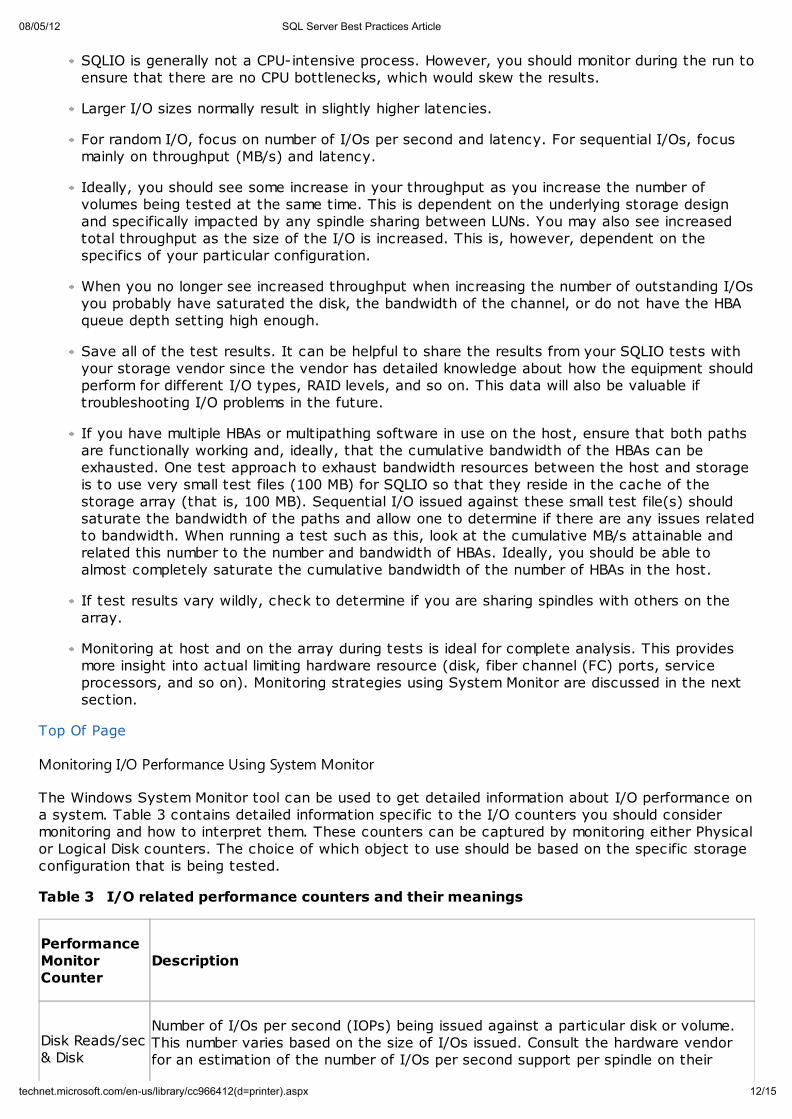
SQLIO is generally not a CPU-intensive process. However, you should monitor during the run toensure that there are no CPU bottlenecks, which would skew the results.
Larger I/O sizes normally result in slightly higher latencies.
For random I/O, focus on number of I/Os per second and latency. For sequential I/Os, focusmainly on throughput (MB/s) and latency.
Ideally, you should see some increase in your throughput as you increase the number ofvolumes being tested at the same time. This is dependent on the underlying storage designand specifically impacted by any spindle sharing between LUNs. You may also see increasedtotal throughput as the size of the I/O is increased. This is, however, dependent on thespecifics of your particular configuration.
When you no longer see increased throughput when increasing the number of outstanding I/Osyou probably have saturated the disk, the bandwidth of the channel, or do not have the HBAqueue depth setting high enough.
Save all of the test results. It can be helpful to share the results from your SQLIO tests withyour storage vendor since the vendor has detailed knowledge about how the equipment shouldperform for different I/O types, RAID levels, and so on. This data will also be valuable iftroubleshooting I/O problems in the future.
If you have multiple HBAs or multipathing software in use on the host, ensure that both pathsare functionally working and, ideally, that the cumulative bandwidth of the HBAs can beexhausted. One test approach to exhaust bandwidth resources between the host and storageis to use very small test files (100 MB) for SQLIO so that they reside in the cache of thestorage array (that is, 100 MB). Sequential I/O issued against these small test file(s) shouldsaturate the bandwidth of the paths and allow one to determine if there are any issues relatedto bandwidth. When running a test such as this, look at the cumulative MB/s attainable andrelated this number to the number and bandwidth of HBAs. Ideally, you should be able toalmost completely saturate the cumulative bandwidth of the number of HBAs in the host.
If test results vary wildly, check to determine if you are sharing spindles with others on thearray.
Monitoring at host and on the array during tests is ideal for complete analysis. This providesmore insight into actual limiting hardware resource (disk, fiber channel (FC) ports, serviceprocessors, and so on). Monitoring strategies using System Monitor are discussed in the nextsection.
Top Of Page
Monitoring I/O Performance Using System Monitor
The Windows System Monitor tool can be used to get detailed information about I/O performance ona system. Table 3 contains detailed information specific to the I/O counters you should considermonitoring and how to interpret them. These counters can be captured by monitoring either Physicalor Logical Disk counters. The choice of which object to use should be based on the specific storageconfiguration that is being tested.
Table 3 I/O related performance counters and their meanings
PerformanceMonitorCounter
Description
Disk Reads/sec& Disk
Number of I/Os per second (IOPs) being issued against a particular disk or volume.This number varies based on the size of I/Os issued. Consult the hardware vendorfor an estimation of the number of I/Os per second support per spindle on their
08/05/12 SQL Server Best Practices Article
13/15technet.microsoft.com/en-us/library/cc966412(d=printer).aspx
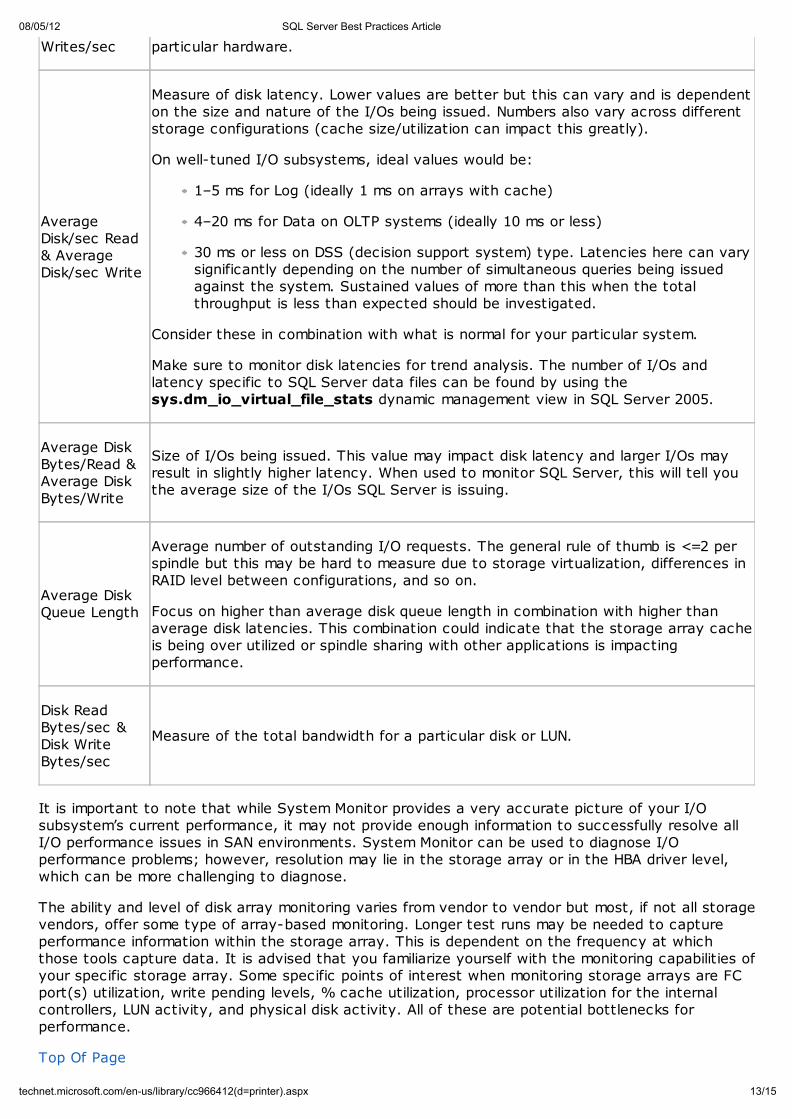
Writes/sec particular hardware.
AverageDisk/sec Read& AverageDisk/sec Write
Measure of disk latency. Lower values are better but this can vary and is dependenton the size and nature of the I/Os being issued. Numbers also vary across differentstorage configurations (cache size/utilization can impact this greatly).
On well-tuned I/O subsystems, ideal values would be:
1–5 ms for Log (ideally 1 ms on arrays with cache)
4–20 ms for Data on OLTP systems (ideally 10 ms or less)
30 ms or less on DSS (decision support system) type. Latencies here can varysignificantly depending on the number of simultaneous queries being issuedagainst the system. Sustained values of more than this when the totalthroughput is less than expected should be investigated.
Consider these in combination with what is normal for your particular system.
Make sure to monitor disk latencies for trend analysis. The number of I/Os andlatency specific to SQL Server data files can be found by using thesys.dm_io_virtual_file_stats dynamic management view in SQL Server 2005.
Average DiskBytes/Read &Average DiskBytes/Write
Size of I/Os being issued. This value may impact disk latency and larger I/Os mayresult in slightly higher latency. When used to monitor SQL Server, this will tell youthe average size of the I/Os SQL Server is issuing.
Average DiskQueue Length
Average number of outstanding I/O requests. The general rule of thumb is <=2 perspindle but this may be hard to measure due to storage virtualization, differences inRAID level between configurations, and so on.
Focus on higher than average disk queue length in combination with higher thanaverage disk latencies. This combination could indicate that the storage array cacheis being over utilized or spindle sharing with other applications is impactingperformance.
Disk ReadBytes/sec &Disk WriteBytes/sec
Measure of the total bandwidth for a particular disk or LUN.
It is important to note that while System Monitor provides a very accurate picture of your I/Osubsystem’s current performance, it may not provide enough information to successfully resolve allI/O performance issues in SAN environments. System Monitor can be used to diagnose I/Operformance problems; however, resolution may lie in the storage array or in the HBA driver level,which can be more challenging to diagnose.
The ability and level of disk array monitoring varies from vendor to vendor but most, if not all storagevendors, offer some type of array-based monitoring. Longer test runs may be needed to captureperformance information within the storage array. This is dependent on the frequency at whichthose tools capture data. It is advised that you familiarize yourself with the monitoring capabilities ofyour specific storage array. Some specific points of interest when monitoring storage arrays are FCport(s) utilization, write pending levels, % cache utilization, processor utilization for the internalcontrollers, LUN activity, and physical disk activity. All of these are potential bottlenecks forperformance.
Top Of Page

08/05/12 SQL Server Best Practices Article
14/15technet.microsoft.com/en-us/library/cc966412(d=printer).aspx
Conclusion
I/O performance is critical to any SQL Server deployment. Validating the performance of theunderlying disk subsystem should be considered a best practice prior to deploying SQL Serverapplications. The time it takes to perform these tests will expose any issues prior to the deploymentand avoid troubleshooting after the complexity of a SQL Server application is introduced. Thispractice is especially important for systems with large-scale I/O subsystems.
Top Of Page
Resources
SQLIO Disk Subsystem Benchmark Tool5 (Microsoft Download Center)
How to use the SQLIOSim utility to simulate SQL Server activity on a disk subsystem6 (KnowledgeBase article)
IOMeter7 (IOMeter site)
SQL ISV blog8 (Microsoft SQL ISV Program Management Team)
SQL Server CAT Blog9 (Microsoft SQL Server Development Customer Advisory Team)
SQL Server Best Practices10 (TechNet site)
SQL Server AlwaysOn Partner Program11 (Microsoft SQL Server site)
SQL Server Urban Legends12 (Product Services and Support (PSS) Engineers blog)
SQL Server 2000 I/O Basics white papers
SQL Server 2000 I/O Basics13
SQL Server I/O Basics, Chapter 214
Disk Subsystem Performance Analysis for Windows15 (Windows Hardware Developer Center)
Storport in Windows Server 2003: Improving Manageability and Performance in Hardware RAID and
Storage Area Networks4 (Windows Storage Server white paper)
Top Of Page
Links Table
1http://technet.microsoft.com/en-us/library/cc966534.aspx
2http://support.microsoft.com/default.aspx?scid=kb;EN-US;929491
3http://technet2.microsoft.com/WindowsServer/en/library/ca099518-dde5-4eac-a1f1-38eff6e3e5091033.mspx?mfr=true
4http://www.microsoft.com/windowsserversystem/wss2003/techinfo/plandeploy/storportwp.mspx
5http://www.microsoft.com/downloads/details.aspx?familyid=9a8b005b-84e4-4f24-8d65-cb53442d9e19&displaylang=en
6http://support.microsoft.com/kb/231619
7http://www.iometer.org/
8http://blogs.msdn.com/mssqlisv/default.aspx

08/05/12 SQL Server Best Practices Article
15/15technet.microsoft.com/en-us/library/cc966412(d=printer).aspx
© 2012 Microsoft. All rights reserved.
9http://blogs.msdn.com/sqlcat
10http://www.microsoft.com/technet/prodtechnol/sql/bestpractice/default.mspx
11http://www.microsoft.com/sql/alwayson/default.mspx
12http://blogs.msdn.com/psssql/archive/2007/02/21/sql-server-urban-legends-discussed.aspx
13http://technet.microsoft.com/en-us/library/cc966500.aspx
14http://technet.microsoft.com/en-us/library/cc917726.aspx
15http://www.microsoft.com/whdc/device/storage/subsys_perf.mspx
Community Content