Embed Size (px)
Citation preview

This PDF is a selection from an out-of-print volume from the National Bureauof Economic Research
Volume Title: The Defining Moment: The Great Depression and the AmericanEconomy in the Twentieth Century
Volume Author/Editor: Michael D. Bordo, Claudia Goldin and Eugene N.White, editors
Volume Publisher: University of Chicago Press
Volume ISBN: 0-226-06589-8
Volume URL: http://www.nber.org/books/bord98-1
Publication Date: January 1998
Chapter Title: Spurts in Union Growth: Defining Moments and Social Processes
Chapter Author: Richard B. Freeman
Chapter URL: http://www.nber.org/chapters/c6896
Chapter pages in book: (p. 265 - 296)

8 Spurts in Union Growth: Defining Moments and Social Processes Richard B. Freeman
The 1930s depression growth of unionism is the most studied and discussed period in U.S. labor history. Many analysts view the decade as a turning point in the development of the American labor relations system. Participation in unions exploded in the 1930s, with the sharpest increase in density occurring with the Supreme Court’s decision upholding the National Labor Relations (Wagner) Act in 1937 (see fig. 8.1, below). The Wagner Act, modified by the Taft-Hartley Act (1947) and ensuing legislation, continues to provide the legal framework for establishing unions in the United States. The 1930s growth of unionism was also associated with the development of industrial unions and the formation of a new national grouping of unions, the Congress of Industrial Organizations (CIO). In explaining the successful unionization of the blue- collar workforce in the 1930s, labor historians place great emphasis on the Wagner Act, the dramatic events surrounding the formation of the CIO, the development of the industrial union, and the specific battles and personalities of the era-John L. Lewis, Philip Murray, Walter Reuther, President Roosevelt, among others. It was an era of legends.
Was the depression growth of U.S. unionism a unique event in trade union history or was it part and parcel of the normal pattern of union development? Is there an underlying social dynamic behind the growth in unionization? Did the 1930s leave an institutional legacy that makes this period a defining mo- ment in the history of U S . labor relations; and, if so, what is that legacy?
Because the expansion of unionism in a single country in a single period leaves much scope for interpretation and only limited possibility for testing interpretations (where do we find the appropriate counterfactual to any given
Richard B. Freeman holds the Herbert Ascherman Chair in Economics at Harvard University. He is also director of the Labor Studies Program at the National Bureau of Economic Research and executive director of the Programme in Discontinuous Economics at the Centre for Economic Performance of the London School of Economics.
265
I
I I
b I -=w. J I
I
OL61
E961
0961
EE
61 -$ ! OE6L
% 7
e E
P61
3
0961 8 G
861
0861 0
OZ61
i E
68 L
068 1
E88 1
088 1

267 Spurts in Union Growth: Defining Moments and Social Processes
interpretation?), I consider the U.S. depression-era experience in light of devel- opments in other countries and in other time periods. I find that unionism gen- erally grows in discontinuous spurts and that the period of the Great Depres- sion was one of union growth in many countries. This leads me toward an explanation of the depression experience in terms of a general theory of employer-employee conflict over organization as opposed to an explanation rooted in specific events and personalities in the depression and United States. Specific events and people ignite processes and potentially impel those pro- cesses in particular directions at formative times, but the key to understanding union growth lies in the endogenous social process, not in the historical details, which vary from period to period and country to country. As to the legacy of the depression spurt, the 1960s-to- 1990s decline of private sector union density to predepression levels belies the view, prevalent 20 or 30 years ago, that the New Deal established a stable system of collective bargaining. The legacy of the depression-era spurt is quite different: an institutional framework for estab- lishing unions and collective bargaining that has become outmoded from the vantage point of workers, unions, and firms.
8.1 Spurts of Unionism: The Quantitative Record
Statistics on union membership for the United States and other countries show that trade union growth takes the form of discontinuous “spurts” rather than gradual logistic growth to some equilibrium value. The expansion of unionism in the depression era was an exceptionally large spurt but one with parallels in U.S. history and in other countries as well.
8.1.1 The American Experience
Figure 8.1 shows the pattern of union density in the United States from 1880 through 1995. For most of the period, unions were concentrated in the private sector, so the density figures largely represent that sector. In the 1960s, how- ever, public sector unionism grew substantially, but the overall pattern is still dominated by developments in the private sector. “Optimetrics” shows five spurts in union density: 1880-86, 1897-1904, 1916-21, 1934-39, and 1942- 45. Whether we should divide the depression-era growth of unionism into the 1934-39 and 1942-45 spurts is questionable. The Bureau of Labor Statistics (BLS) series on union membership, on which I rely, shows a break, but the series of union membership reported by Troy and Sheflin (1985) does not. Commons et al. (1966), Dunlop (1948), and most analysts differentiate be- tween the two periods, and I shall do so also. In addition, there is a spurt in public sector unionism from about 1962 to 1972 or so.
Going beyond the visual picture, the notion and treatment of spurts in union growth can be developed further. By a spurt I mean a sharp concentrated epi- sode of union growth. In such an episode, membership should grow more rap- idly in a few contiguous years than would be expected by any model of random

268 Richard B. Freeman
Table 8.1 Changes in Union Density during Spurts and Other Periods, 1880-1995
Year
Years When Density Density Grew Fell
Years When Density
Average Average
Initial Final Years Density Years Density No. of Change in No. of Change in
Spurts 1883-1 986 2.8 9.9 3 2.4 1899-1904 4.9 11.9 5 1.4 1916-21 9.6 17.4 5 I .6 1934-39 11.5 27.6 5 3.2 1942-45 25 34.2 3 3.1
All 21 2.2
Nonspurts 1880-83 1886-99 1904-16 1 92 1-34 1939-42 1945-95
1945-70 1970-95
1.7 2.8 9.9 4.9
11.9 9.6 17.4 11.5 27.6 25 34.2 14.9 34.2 26.4 26.4 14
0.4 0.3 6 -1.3 0.4 6 -0.8 0.4 7 -1.2 1 .o 2 -1.8 0.5 40 -0.6 0.5 17 -0.7 0.5 23 -0.6
All 33 0.5 61 -0.8
Source: Tabulated from union density statistics in table 8A.2. Nora: Average change in density in a spurt period is simply the average annual change in the specified years. Average change in density in a nonspurt period is the average annual change in the years when density grew and when density fell. The “all” figures are the averages of the change in density in the specified spurt and nonspurt years.
fluctuations in growth, even with some autocorrelation in the rate of growth. In addition, for spurts to be growth phenomena, the pattern of increases in union density should differ from the pattern of decreases in union density dur- ing periods of decline.
The statistical measures of changes in U.S. union density in private sector spurts and in “nonspurt” periods shown in table 8.1 indicate that the designated periods meet these criteria. The change in density is larger in the spurt periods (an average annual gain of 2.2 percentage points) than in the nonspurt periods when density increased (an average annual gain of 0.5 percentage points) or than in nonspurt periods when density declined (an average annual loss of 0.8). The change is also highly concentrated: gains in union density are more likely to be clumped together than decreases in density and are more highly corre- lated than are decreases. The optimetrics reading of the data is not spurious: spurts in growth are real. By contrast, absent the periods of spurt, U.S. union history is characterized by gradual erosion of union density

269 Spurts in Union Growth: Defining Moments and Social Processes
How does the 1934-39 depression spurt look in this context? It had the largest growth of density and of density per year of any spurt. In contrast to the other spurts, it occurred in a peacetime period of high unemployment. It was associated with innovations in labor laws and in the nature of union organi- zations that created a “new unionism” in the form of industrial unions. Earlier spurts were associated with either substantive legal changes (during World Wars I and I1 the government encouraged settlement of disputes) or new forms of unionism (the 1897-1904 spurt was related to the formation of the American Federation of Labor [AFL]; the increase in unionism in the 1880s was due in large part to the growth of the Knights of Labor), but not with both. Finally, the 1934-39 spurt was followed by the 1942-45 spurt associated with World War 11. This arguably brought union strength to levels that would never have been achieved or maintained simply from the 1930s spurt. In fact, between 1939 and 1942 union density fell (though membership increased), suggesting that at least some of the 1930s gain in density would have eroded absent World war 11.
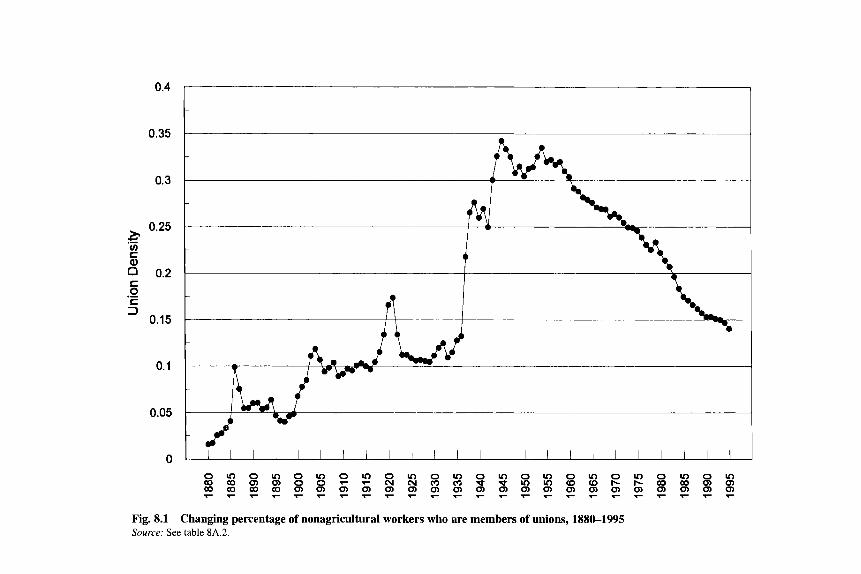
There are two possible ways in which aggregate unionism can increase rap- idly in a spurt. Existing unions with given jurisdictions could greatly increase their representation. The Carpenters’ Union might, for example, successfully organize carpenters in nonunion areas. Alternatively, new or existing unions could expand into previously nonunion sectors. Extant data on unionization by industry are limited before the 1950s, but figures on membership for particular unions provide a disaggregated picture of the spurt process by organization. Before the depression expansion, most unions were organized on a craft basis, with explicit jurisdictions; and the pre-CIO industrial unions, such as the Min- ers, also had relatively narrow jurisdictions. Thus, expansion of existing unions would indicate organization of sectors where unions were traditionally concen- trated. Creation of new unions would indicate union growth in traditionally nonunion occupations or industries. Using data from Troy and Sheflin (1985), I have examined the growth of individual unions during the four spurts identi- fied in figure 8.1 and table 8.1, and during relevant nonspurt periods. The re- sults of this analysis are summarized in table 8.2. Because I do not have infor- mation on employment within each union’s jurisdiction, I report the growth in terms of percentage changes in absolute membership. While this overstates growth in union density in relevant jurisdictions during periods of economic upswing, the rates of change in union membership during the various spurts are so great that they invariably imply large changes in density. The table shows, in any case, that in a spurt nearly every union experiences membership gains.
However, in the 1930s, a larger proportion of the growth occurred though the formation of new unions than in previous spurts. This helps explain the greater magnitude of that spurt than of previous spurts. The ubiquity of growth among existing unions and the formation of new unions during the depression suggests a sea change in labor-management relations that made this spurt something different. In fact, it is this sea change in the labor market that labor
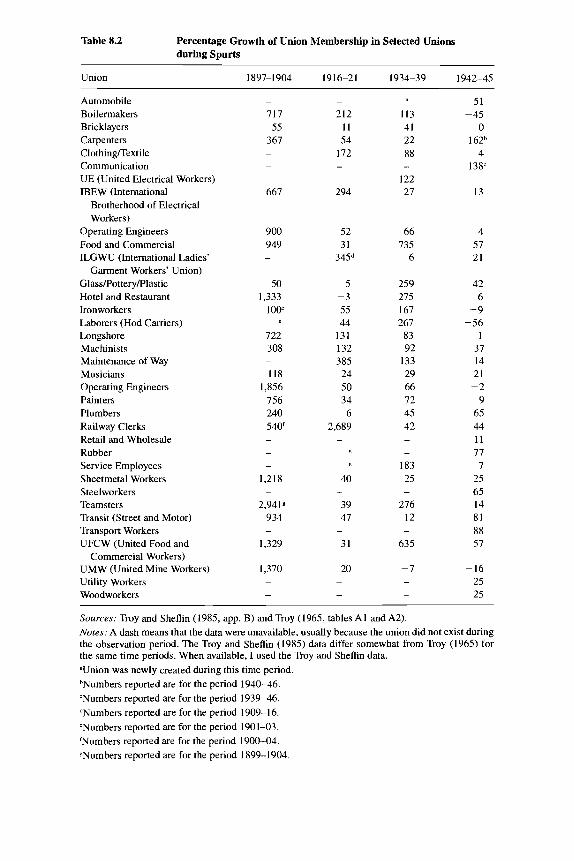
Table 8.2 Percentage Growth of Union Membership in Selected Unions during Spurts
Union 1891-1 904 19 16-2 I 1934-39
Automobile Boilermakers Bricklayers Carpenters ClothingRextile Communication UE (United Electrical Workers) IBEW (International
Brotherhood of Electrical Workers)
Operating Engineers Food and Commercial ILGWU (International Ladies'
Garment Workers' Union) GlassK'otteryK'lastic Hotel and Restaurant Iron workers Laborers (Hod Carriers) Longshore Machinists Maintenance of Way Musicians Operating Engineers Painters Plumbers Railway Clerks Retail and Wholesale Rubber Service Employees Sheetmetal Workers Steelworkers Teamsters Transit (Street and Motor) Transport Workers UFCW (United Food and
Commercial Workers) UMW (United Mine Workers) Utility Workers Woodworkers
-
111 55
361 -
-
-
661
900 949 -
50 1,333
1 O F
122 308
118 1,856
756 240 540'
-
-
-
-
1,218
2,9419 934
1,329
1,370
-
-
-
-
-
212 11 54
172 - -
294
52 31
345d
5 -3 55 44
131 132 385 24 50 34 -6
2,689 -
40
39 41
31
20
-
-
-
-
113 41 22 88
122 21
-
66 135
6
259 215 161 261
83 92
133 29 66 12 45 42 - -
183 25
216 12
635
-1
-
-
-
-
1942-45
51 - 45
0 162b
4 138'
13
4 51 21
42 6
-9 -56
1 31 14 21 -2
9 65 44 11 71 7
25 65 14 81 88 51
- 16 25 25
Sources: Troy and Sheflin (1985, app. B) and Troy (1965, tables A1 and A2). Nutes: A dash means that the data were unavailable, usually because the union did not exist during the observation period. The Troy and Sheflin (1985) data differ somewhat from Troy (1965) for the same time periods. When available, I used the Troy and Sheflin data. "Union was newly created during this time period. bNumbers reported are for the period 1940-46. 'Numbers reported are for the period 1939-46. dNumbers reported are for the period 1909-16. 'Numbers reported are for the period 1901-03. 'Numbers reported are for the period 1900-04. YNumbers reported are for the period 1899-1 904.

271 Spurts in Union Growth: Defining Moments and Social Processes
historians have stressed in their descriptions of the period (Bernstein 1971; Galenson 1960).
Finally, note that the spurt not covered in the table, involving public sector workers in 1962-72, has properties similar to those of the spurts shown in table 8.2: rapid expansion of unionism in new areas with new or changed organiza- tions (the conversion of employee associations such as the National Education Association [NEA] into unions) and growth of existing unions under the aegis of legal changes (Freeman 1986).
8.1.2 The Experience of Other Countries
Are spurts in union growth unique to the United States, or do they character- ize other countries as well? Given the historically confrontational labor rela- tions of the United States, we might expect to see less jumpy patterns of union growth in other countries. In some countries, union growth has in fact been less discontinuous than in the United States, but in most advanced capitalist countries we find a pattern similar to the U.S. experience: union growth taking the form of sharp concentrated spurts in membership. Even more striking, union growth spurts have occurred during roughly the same periods in most countries. For instance, union density rose sharply in the United States, United Kingdom, Germany, Sweden, Denmark, Norway, and Australia around the early 1900s. Density also grew during the World War I period in all countries for which’data exist.
Table 8.3 provides a rough picture of the time pattern of the growth or de- cline of union density across countries that highlights the similarity in the tim- ing of spurts. The number of countries in the table differs from period to period due to differing availability of union membership data. There is information on 7 countries in the 1900s, 12 countries until the rnid-l930s/World War I1 period when Germany and Austria are excluded because of the Nazi suppres- sion of free trade unions, and an increasing number of countries thereafter. The most striking pattern in the data is the similarity in most periods of union growth across countries that enables me to label the periods as times of spurt, stability, or decline. Union membership shows spurts in all of the countries for which I have data in the 1900s, in World War I, and in the mid-l930s/World War I1 period. For instance, in the United Kingdom, density jumped between 1910 and 1913 (15 percent to 23 percent), between 1916 and 1920 (26 percent to 45 percent), between 1939 and 1943 (32 percent to 40 percent), and between 1945 and 1948 (39 percent to 45 percent). It grew in the majority of countries in the 1970s, with the United States being an outstanding exception. In other periods, density was stable or falling. Declines in density occurred in nearly all of the countries in the 1920s and in a majority of countries in the 1980s to mid-1990s. Density was stable in 1910-16 and in the 1950s and 1960s.
I have given broad time groupings in the table and have, in particular, com- pressed the mid-l930s/World War I1 period into one interval, because the de- pression and war occurred at different times among the countries. The table is

272 Richard B. Freeman
Table 8.3 A Century of Change in Unionization in the Developed World
Period
Mean No. of Countries
Characterization Density Characterization Qualitative Change in That Fit Qualitative
1900s 19 10-1 6 World War I 1920s Mid-1930slWorld War I1 1950s 1960s 1970s 1980s/1990s
Increasing union density Stability Spurt in density Fall in density Spurt in density Stability Stability Growth with diversity Fall in density
9 0
19 -9 19
-2 0 5
-6
7 of 7 rise“ 6 rise; 6 fallb 12 of 12 rise 10 of 12 falF 10 of 10 rised 10 of 14 modest changes‘ 12 of 14 modest changes‘ 13 of 18 rise 13 of 18 fall
Sources: Visser (1989, 1992). Bain and Price (1980), Schneider (1991). and OECD (1991). Notes: Countries covered are Austria, Denmark, Finland, France, Germany, Ireland, Italy, Japan, Luxembourg, Netherlands, Norway, Sweden, Switzerland, United Kingdom, United States, Can- ada, Australia, and New Zealand. Mean change in density is the nnweighted average change in density for the countries over the relevant period. “1900s: The seven countries are United States, United Kingdom, Germany, Sweden, Denmark, Norway, and Australia.
‘1920s: Exceptions are Sweden and Australia. d1930s/World War 11: Missing countries are Germany and Austria. ‘1950s: Norway rises; Italy, France, and Japan have sharp falls. ‘1 960s: Italy rises; Switzerland falls.
19 10s: Additional five countries are Canada, France, Italy, Netherlands, and Switzerland.
“stylized” because I have used different-sized time windows for the periods to summarize the pattern, but the mean change in density is a “hard’ statistic: the unweighted average of changes in density for the countries in the part of the period when they had their spurts.
Table 8.4 focuses on union density in the depressionlworld War I1 period (with somewhat different years shown for the countries to capture the timing of their particular spurts). The table shows that union density rose prior to the war in several countries, as well as in the United States, though in some cases the increase was less concentrated in a few years (the depression experience of Denmark, in particular, is misleading as Danish density began trending up ear- lier). In the United Kingdom, density jumped from 22.6 percent in 1933 to 33.1 percent in 1940; in France, density went from 7.0 percent in 1935 to 35 percent in 1937; in Norway, density increased from 13 percent in 1927 to 43 percent in 1939; and so on. The similarity in the pattern suggests that unioniza- tion during the depression did not reflect country-specific political events but rather a more fundamental response of employees to the depression situation.
In sum, I conclude that data on union density for the United States and other countries show that unionism generally grows in sudden sharp spurts and that the depression spurt of unionism in the United States is not an isolated country phenomenon but rather exemplifies a general pattern in this seemingly inhospi-
273 Spurts in Union Growth: Defining Moments and Social Processes
Table 8.4 Union Density in the 1930s in Western Countries
Country
Density (Date) Average Annual
Before Spurt At Peak Spurt Change per Year
Australia 34.9 (1933) 38.8 (1939) Canada 17.6 (1936) 22.2 (1938) Denmark 36.2 (1929) 46.6 (1939) France 7.0 (1935) 25.4 (1937) Netherlands 26.3 (1928) 43.0 (1932) Norway 13.2 (1927) 42.9 (1939) Sweden 37.9 (1933) 53.7 (1939) Switzerland 21.1 (1928) 27.7 (1932) United Kingdom 22.6 (1933) 33.1 (1940) United States 11.9 (1934) 28.6 (1939)
Sources: Bain and Price (1980) and Visser (1989). aDenmark had fairly steady growth before and after the depression.
0.7 2.3 1 .o 9.2 4.2 2.5 2.6 1.7 1.5 3.3
table period for unionism. This regularity raises two questions about the growth of unionization. Is there is a single social process underlying growth by spurts, and if so, what is that process? Why does union growth occur in roughly similar periods across countries, including the depression when one might have expected unions to be particularly weak? The former question re- lates to the dynamics of growth. The latter relates to its timing.
8.2 Why Spurts?
Two types of models can generate spurts in union growth. The first are mod- els in which the process of growth creates nonlinearities that produce “phase transitions” when certain conditions are met-models of tipping, contagion, self-organized complexity. The second are standard comparative statics linear models in which massive shocks or environmental changes generate commen- surately large responses in otherwise stable union membership. The former models stress the underlying process by which organization occurs and the cumulative behavior of individual workers, unions, and firms. The focus is on the behavior of thousands or millions of individuals acting in response to one another. The latter models stress the exogenous shock, usually generated by political forces. Historians of unionism in particular countries generally inter- pret the growth of unionism in their country as resulting from political “top- down” changes: unions grew in the United States because of the Wagner Act, in France because of the Blum government, in Canada because of the enact- ment of PC 1003, and so on. Without denying the importance of particular laws or events as catalysts or triggers for the growth process, I lay out in this section a model in which sudden sharp changes in union density-discontinuities- arise from the process of organization.
My model concentrates on two aspects of unionization: the conflict between

274 Richard B. Freeman
management and labor in the formation of unions; and nonlinearities in the benefits, costs, and strengths that accrue to the two sides from different levels of unionization. The model makes union formation an outcome of a battle be- tween management and labor, rather than of the “laboratory voting” procedure the National Labor Relations Board (NLRB) envisages. Prior to the Wagner Act, organization was largely a matter of strategic workers using economic muscle to force employers to accept a union at their workplaces (Dunlop 1948) per the battle motif. Absent the strike threat by workers to impose economic costs on firms, management might refuse to recognize a union even if virtually all workers supported it. The result was a large number of often bitter recogni- tion strikes during many union spurts. A major goal of the Wagner Act was to transform this process into a secret ballot election campaign.
The model generates nonlinearity in organizing because the resources unions or employers bring to the campaign and the incentives that they have to use their resources to organize or oppose organization depend critically on the percentage already organized or covered by collective bargaining in the rele- vant market. When union density is low, unions have little strength to organize new firms and firms have a large incentive to oppose organization. As union density rises, unions have increased resources to use for organizing and firms see less competitive disadvantage in being organized. Thus, at some range of union density, union organizing strength rises and employer opposition falls, potentially producing a spurt in membership.
The backbone of this model is an accounting identity for union density:
(1) UNION, = (1 - r)*UNION,-, + NEW,,
where UNION is union density in a given product market in a particular year, defined as the ratio of union members to employment in that sector; r is the “normal” rate of depreciation of that density due, say, to attrition of members or firms or the growth of employment in new firms that have not yet been organized; and NEW is the ratio of new members organized to employment in the given year.
I define UNION as union density in a product market because the model focuses on the effects of unionization on firms that compete in the same area, and on the ability of collective bargaining to create a “level playing field” in terms of a single package of wage, benefit, and conditions in that sector that can reduce initial employer opposition to unions.
The key to the model is the rate of new organization, which depends on the resources that labor and management devote to organizing or opposing organi- zation:
( 2 ) NEW = f(ORG, OPP) ,
where ORG is the resources unions give to organizing and OPP is the resources management gives to opposing union drives.

275 Spurts in Union Growth: Defining Moments and Social Processes
The functionfis the key element of the model. As written, it is a production function of sorts, with df/dORG > 0 and af/aOPP < 0. Beyond this, it is difficult to specify functional form. One possibility is that f has diminishing marginal productivity in both ORG and OPP, so that, conditional on employer opposi- tion, more organizing effort will yield diminished growth of membership and, conditional on organizing effort, employer opposition will also have diminish- ing returns. But it is also possible that ORG or OPP has increasing marginal productivity over some range: a massive union drive might pay off much more than a smaller drive; employer opposition around a single banner-the Ameri- can plan-might be more successful in defeating union organizing than efforts by individual employers.
To close the model requires equations for ORG and OPP. ORG presumably depends on existing union resources, the potential benefits to existing members from spending their dues money on organizing new members, the benefits to nonunion workers of unionization, and so on. One could readily imagine ORG resulting from some form of union optimizing behavior. What my model re- quires is that at very low levels of unionization, ORG will be small: the union simply does not have the resources to devote to organizing campaigns. I expect that ORG is also low at high levels of unionization: at high density the union will have effective control over the market for labor, and existing members will gain little from expanding membership. If union benefits spill over to nonunion workers through “threat effects,” new workers may also gain little. For simplic- ity, I postulate that ORG rises, then falls more or less parabolically, with UNION. The OPP relation depends on firms’ estimates of the benefits and costs of operating union or nonunion, their assessment of the likely success of efforts to defeat union organizing drives, and the resources they have to combat the union. OPP is likely to be high when UNION is low: if the union is too weak to establish a level playing field in a sector, firms that are organized risk competitive disadvantage by paying higher wages or benefits. OPP may or may not be high when UNION is high: a nonunion firm in a primarily union market may find that to maintain this status, it must operate by union rules and pay union or higher wages or spend considerable resources fighting organizing drives, reducing the incentive to oppose union organizing efforts. On the other hand, if the firm can remain nonunion and avoid sharing economic rents with workers, it may be able to earn exceptionally high profits. As the analytics require only a single nonlinearity in the relation between union density and the resources devoted to the process of gaining new members, I assume for sim- plicity that employer opposition is simply a declining function of UNION.
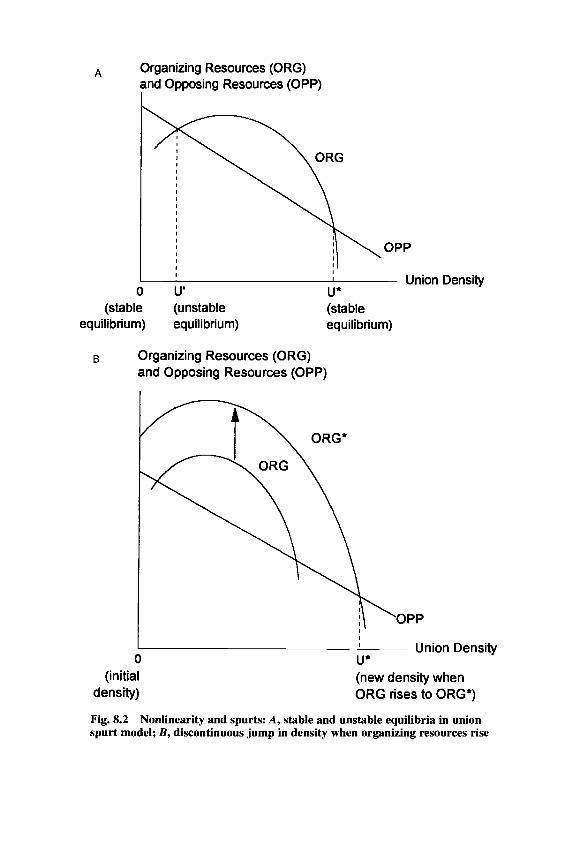
The result is a nonlinear difference equation that readily generates sharp jumps in union density.’ Figure 8.2 captures the essential nonlinearity. In panel A of figure 8.2 there are two stable union equilibria, 0 and U*, and one unstable
1 . In the simple case where ORG= a . UNION-, - b . (UNION_,)Z andOPP= 6 - c . UNION-,, the difference equation is second order.
A Organizing Resources (ORG) and Opposing Resources (OPP)
I I I I I I I I
I I I
I OPP I I I Union Density
0 U' U* (stable (unstable (stable
equilibrium) equilibrium) equilibrium)
B Organizing Resources (ORG) and Opposing Resources (OPP)
(initial density)
Density
(new density when ORG rises to ORG*)
Fig. 8.2 Nonlinearity and spurts: A , stable and unstable equilibria in union spurt model; B, discontinuous jump in density when organizing resources rise
277 Spurts in Union Growth: Defining Moments and Social Processes
equilibrium, U‘. Union density grows whenever ORG exceeds OPP (more properly, when NEW =f(ORG, OPP) > r * UNION-,). In panel B of the figure I assume that the initial unionization point is 0 (or some other low level). Be- ginning at 0, a gradual increase in the union-employee desire for organization, which shifts upward the ORG curve, or a gradual decrease in employer opposi- tion to unionization, which shifts downward the OPP curve, has no effect on union density until a critical point is reached: the point where ORG(0) > OPP(0). In panel B the increase in the organizing function to ORG* creates this situation. The result is a sudden spurt in density to the equilibrium U*.
As it stands, this model predicts both sudden spurts and sharp declines in union density. But in the United States (and many other countries), it is difficult to displace unions in workplaces where they exist. The Wagner Act made that particularly difficult by requiring a decertification process so that a firm could end a union relationship only when workers voted to decertify the union, though a firm with strong bargaining power could effectively eliminate unions by refusing to come to a collective bargaining agreement and bringing in re- placement workers to take the jobs of union members if the union struck. For the United States, though, I assume that shifts in ORG or OPP that reduce density do not have such a discontinuous effect and make the maximum loss of density in a given period r * UNION-,. Thus, the nonlinearity of the model transforms gradual changes in the underlying desire for or opposition to union- ism into jumps to a new equilibrium on the growth side but produces gradual drops in density on the decline side.
The point of this exercise is not to derive “the” union growth or decline equations applicable to all institutional settings or time periods but rather to highlight the potential for producing endogenous spurts when union and firms battle over organizing drives, given the likely relation between their allocation of resources to organizing or opposing activity and extant density. The key condition for growth spurts rather than gradual growth of unionization is con- frontation over the union institution. The logic of the model suggests that in the early phase of a spurt there will be considerable conflict but that this con- flict will diminish as the incentive for firms to oppose unions falls with higher levels of density, and that unionism will be concentrated in selected sectors as opposed to being evenly spread across sectors in the workforce. It makes prod- uct markets critical in analyzing union growth.
To go further, it is necessary to specify the factors likely to shift the ORG and OPP schedules over time in a particular setting. For the United States in the depression period, these factors include the New Deal labor policies, nota- bly the Wagner Act that most labor historians stress; the attitudes of workers, dependent on their assessment of the likely benefits and costs of unionization; the resources and incentives facing firms; and the resources and incentives of unions, including innovations in union structure, such as the formation of the CIO under John L. Lewis. The magnitude of the depression and consequent loss of belief in business leadership offers a potentially strong candidate for
278 Richard B. Freeman
raising worker desire for unionization, which in the framework given above shifts the ORG curve. In other time periods, such as the World War I or World War I1 spurts, economic booms might have reduced employer opposition, mak- ing unionization easier, even absent a change in ORG. For other countries, one may come up with a similar list of incentives to governments, employees, and firms and unions that arguably shifted over time. Since institutions affect com- pensation and benefit packages, moreover, the same economic changes might alter the benefits and costs to different parties differently in different countries. For example, in a European country with extension of collective bargaining contracts (from the organized sector to nonunionized firms), the incentive of employers to oppose unions will be much less than in a country with plant- or firm-level bargaining. But the task of this paper is not to explain unionization around the world but to use that and other evidence to cast light on the most dramatic period of U.S. union history.
8.3 The Depression and World War I1 Spurts in the United States
The 1934-39 depression spurt and the World War I1 spurt raised U.S. union density to unprecedented levels and seemed, through the 1960s at least, to make unions a permanent and accepted part of American society. During both spurts there was a substantial increase in density in private sector industries outside of the services but little growth of density in the service sector or gov- ernment (table 8.5). The World War I1 spurt fits an overall pattern in which unionism grows in war periods (recall the growth throughout the advanced world in World War I), as governments seek to maximize production by min- imizing labor disputes. Most labor experts would predict a growth of unionism in such a time period. But the depression-era spurt came as a shock to the experts of its period. In 1932 George Barnett, president of the American Eco- nomic Association (AEA) and an expert in industrial relations, declared: “American trade unionism is slowly being limited in influence by changes which destroy the basis on which it is erected. . . . I see no reason to believe that American trade unionism will . . . become in the next decade a more potent social influence” (1933,6). Perhaps in no other period of American history has the growth of unionism seemed so surprising.
There are two interpretations of the causes of the 1930s spurt in the United States, each focused on the possible catalytic role of particular social actors. The first interpretation, which I will call the top-down hypofhesis, is that the 1930s growth resulted from the decisions of the Roosevelt administration, the passage of prolabor New Deal legislation, and the formation of the CIO by a group of innovative union leaders led by John L. Lewis. Many analysts adhere to the view that a sympathetic administration in Washington was necessary, and perhaps even sufficient, to spark the growth of unions. They place great weight on the enactment of the National Industrial Relations Act (NIRA) and the Wagner Act. Some have gone so far as to call the Wagner Act “the most

279 Spurts in Union Growth: Defining Moments and Social Processes
Table 8.5 Union Density of Industries during the Depression and World War I1 spurts
Year
Industry 1933 1935 1939 1947
Manufacturing= Manufacturingb
Metals and machinery Clothing Food, drink, and tobacco Paper, printing, and
Leather and leather products Chemicals, rubber, clay,
Textiles Lumber and lumber products
Transportation, communication, and utilities
Railway transportation Building and construction Mining, quarrying, and oil Government Services
publishing
glass, and stone
-
13.6 11.0 51.6 5.5
20.5 23.1
4.4 1.5
10.0
27.9
55.3 71.7
8.8 2.8
22.8 23.1 24.5 53.8 24.1
28.7 16.7
13.2 7.1
11.1
50.0 58.3 77.3 65.4 10.5 6.0
40.1 40.2 49.6 60.9 29.6
38.2 41.4
26.3 30.2 16.0
70.8
89.0 69.3 11.6 9.2
Sources: Bain and Price (1980) and U.S. Department of Commerce (1966). ”This line is from Bain and Price (1980, table 3.3). hThese lines are obtained by dividing union membership from Bain and Price (1980, table 3.4) by employment data from the U S . Department of Commerce (1966).
radical piece of legislation ever enacted” (Klare 1978, 265). Bemstein (1971) devoted much of his prologue chapter to Roosevelt and his administration be- cause he believed that the coming of the New Deal was the key event in Ameri- can labor history. Taft claimed that “the change in the future of American labor which took place in 1933 was almost entirely due to the legislative measures . . . of FDR’ (1964, 416). Goldfield (1989) attributes similar views to many other analysts: Bums (1956), Derber and Young (19S7), Schlesinger (19S8), Leuchtenberg (1963), and Freidel (1952). The act aside, when unions can de- clare that “the President wants you to join” (as in one CIO organizing poster), surely it had to matter somewhat. A variant of the top-down hypothesis is that the leadership provided by John L. Lewis in forming the CIO was also a critical component in growth. According to Taft, “The CIO was largely the creation of John L. Lewis without whose leadership and financing the movement would have foundered and expired” (1964, xx). Taft’s story is basically that if you removed FDR and Lewis, nothing much would have happened on the union front during the depression.
The second interpretation is quite different. It is that the catalyst for the

280 Richard B. Freeman
1930s spurt was the grievances of employees and their loss of faith in business leadershlp. Government policies and union leadership were endogenous re- sponses to the changed views of employees. Since the spark for union growth emanates from workers, I call this the bottom-up hypothesis. Horace Davis’s theory of union growth exemplifies this view: “When labor has major griev- ances and an improving position in the labor market, unions tend to grow” (1941,623). He argues that the grievance-loss of jobs or risk thereof-was exceptional during the depression and that the direction of movement in the economy, rather than the level, was critical in allowing unions to develop. In this view, unionism can grow during an economic recovery, even if the recov- ery is still associated with high joblessness. This hypothesis stresses the activi- ties of workers, firms, and unions operating as individual agents, whose col- lective action determines unionization and influences governmental policy. Absent FDR and the Wagner Act and John L. Lewis, there still would have been substantial growth of unionization in the late 1930s, according to this hy- pothesis.
There are problems in differentiating between these explanations. The 1930s spurt occurred during the New Deal, was accompanied by the CIO split, and occurred during a period of recovery from economic recession. One could le- gitimately argue that the spurt began when a weighted sum of contributing factors, Cw,X,, exceeded some critical value, where Xi measures one of the factors and w, is its effect on unionization. In figure 8.2, ORG - OPP would depend on this sum. In this case, the issue of deciding between the two inter- pretations is not one of accepting either the top-down story or the bottom-up story but of partitioning the weighted sum to determine which set of factors was more important. Such a calculation would presumably give some weight to all factors and thus lead to a multicausal explanation of the spurt that would not reject either hypothesis. But the counterfactual for determining what would happen absent an observed X should not be a simple ceteris paribus thought experiment in which one removes X and holds everything else the same. Rather, the counterfactual requires a more complex thought experiment that assesses how the remaining factors might adjust to the change. Perhaps absent one factor, other causal factors would have increased sufficiently to keep the weighted sum above the critical value. In the case of the 1930s depression spurt, had Congress failed to enact the Wagner Act, might unions have ex- panded more through traditional recognition strikes? Absent John L. Lewis and the CIO, would AFL unions have eventually responded to the opportunities afforded by worker discontent in mass production industries, or might some other entrepreneurial union leader have stepped forward to take greater initia- tive than the AFL had shown up to that point? Or might another form of worker organization have come forth to unionize the mass production industries?
To assess the top-down and bottom-up interpretations of the depression -era spurt, I have examined three aspects of the unionization drive of the period: the extent to which unions formed through NLRB elections versus the recognition

281 Spurts in Union Growth: Defining Moments and Social Processes
strikes the legislation was designed to supplant, the extent to which the new CIO unions were in fact aided by the CIO, and the extent to which the old AFL unions responded to the new situation. If the top-down analysis is correct, I would expect (1) that recognition strikes would not continue to be a major mode of unionization once the benefits of the secret ballot process were estab- lished, (2) that the bulk of the new unions in the CIO would have relied on central funds or organizing assistance, and (3) that the AFL unions, which lacked the dynamic leadership of Lewis, and which were less favored by the New Deal than the CJO, would gain fewer members than the CIO unions.
Data relating to all three of these “tests” reject the top-down hypothesis in favor of an explanation of the depression-era spurt that places greater weight on the independent activities of workers and local unions in a bottom-up or- ganizing effort. From this perspective the Wagner Act was less an exogenous change in regime that caused the union spurt and more an endogenous outcome of unionizing pressures-a government means for channeling worker desires for unionism and employer opposition into a less violent and confrontational mode for determining organization and collective bargaining arrangements. This does not mean that the act had no effect on the events of the period, but that absent the act or in the presence of, say, a weaker labor law, there still would have been a major union spurt in the depression period.
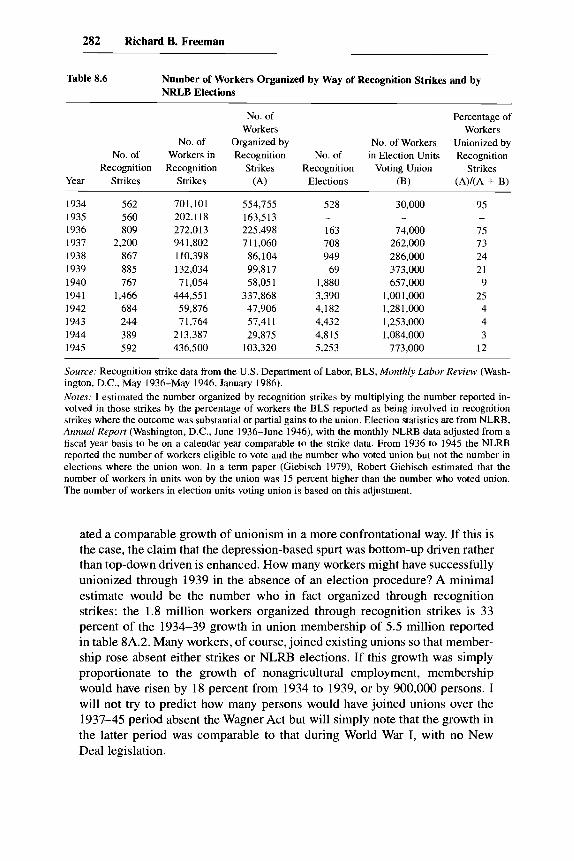
Consider first the evidence on recognition strikes. Despite the creation of the NLRB and “laboratory” elections for workers to choose whether or not they wanted to unionize, a huge number of workers were organized in the 1930s and through the war years by recognition strikes. In 1934, when Roose- velt ordered the pre-Wagner Act Labor Board to conduct bargaining elections, there were 562 recognition strikes involving over 700,000 workers. Table 8.6 shows that the number of workers involved in recognition strikes varied in ensuing years, trending downward as the National Labor Relations Act proce- dures become increasingly accepted but still remaining high as late as 1937, when the Supreme Court declared the Wagner Act constitutional.2 More sur- prising is the fact that recognition strikes were also an important method of organizing in 1941, 1944, and 1945. Overall, more workers were organized through recognition strikes during the 1934-39 spurt than were organized through NLRB elections: 1.8 million through recognition strikes versus 1 .0 million via NLRB elections. This suggests that the act may have changed the nature or process of union organization after 1937 more than it changed the actual number organized. A legitimate interpretation of the data is that the elec- tion procedure largely substituted for recognition strikes that would have cre-
2. The timing of the legal changes deserves some attention. On 16 June 1933, the NIRA was signed into law. The first code, with a statement on unionization, was given in July. In 1934 Roose- velt ordered the Labor Board to conduct bargaining elections, and they held 528 elections with approximately 30,000 votes. On 27 May 1935, the Supreme Court declared the NIRA unconstitu- tional in the Schechter Poultry Co. decision. The Congress passed the WagnerAct on 27 July 1935. The act was upheld by the U.S. Supreme Court in N.L.R.B. v. Jones and Loughlin (April 1937).
282 Richard B. Freeman
Table 8.6 Number of Workers Organized by Way of Recognition Strikes and by NRLB Elections
~ ~~~
No. of Percentage of
No. of Organized by No. of Workers Unionized by No. of Workers in Recognition No. of in Election Units Recognition
Year Strikes Strikes (A) Elections (B ) (AMA + B)
Workers Workers
Recognition Recognition Strikes Recognition Voting Union Strikes
1934 562 1935 5 60 1936 809 1937 2,200 1938 867 1939 885 1940 767 1941 1,466 1942 684 I943 244 1944 389 1945 592
701,101 202.1 18 272,O 13 941,802 110,398 132,034 7 1,054 444,55 1 59,876 7 1,764 213,387 436,500
554,755 163,513 225,498 71 1,060 86,104 99,817 58,051 337,868 47,906 57,411 29,875 103,320
528
163 708 949 69
1,880 3,390 4,182 4,432 4,815 5,253
- 30,000
74,000 262,000 286,000 373,000 657,000
1,001,000 1.28 1,000 1,253,000 1,084,000 773,000
95
75 73 24 21 9 25 4 4 3 12
Source: Recognition strike data from the U S . Department of Labor, BLS, Monthly Labor Review (Wash- ington, D.C., May 1936-May 1946, January 1986). Notes: 1 estimated the number organized by recognition strikes by multiplying the number reported in- volved in those strikes by the percentage of workers the BLS reported as being involved in recognition strikes where the outcome was substantial or partial gains to the union. Election statistics are from NLRB, Annual Report (Washington, D.C., June 1936-June 1946), with the monthly NLRB data adjusted from a fiscal year basis to be on a calendar year comparable to the strike data. From 1936 to 1945 the NLRB reported the number of workers eligible to vote and the number who voted union but not the number in elections where the union won. In a term paper (Giebisch 1979). Robert Giebisch estimated that the number of workers in units won by the union was 15 percent higher than the number who voted union. The number of workers in election units voting union is based on this adjustment.
ated a comparable growth of unionism in a more confrontational way. If this is the case, the claim that the depression-based spurt was bottom-up driven rather than top-down driven is enhanced. How many workers might have successfully unionized through 1939 in the absence of an election procedure? A minimal estimate would be the number who in fact organized through recognition strikes: the 1.8 million workers organized through recognition strikes is 33 percent of the 1934-39 growth in union membership of 5.5 million reported in table 8A.2. Many workers, of course, joined existing unions so that member- ship rose absent either strikes or NLRB elections. If this growth was simply proportionate to the growth of nonagricultural employment, membership would have risen by 18 percent from 1934 to 1939, or by 900,000 persons. I will not try to predict how many persons would have joined unions over the 1937-45 period absent the Wagner Act but will simply note that the growth in the latter period was comparable to that during World War I, with no New Deal legislation.

283 Spurts in Union Growth: Defining Moments and Social Processes
Consider next the evidence on the growth of CIO unions. How much of CIO membership growth resulted largely from the activities of workers and autonomous unions and how much from top-down central CIO assistance?
Two of the most important organizing drives in the 1930s and 1940s were in automobiles and steel, both highly oligopolized sectors with a large domi- nant firm whose unionization virtually guaranteed success in the sector. The automobile workers, employing the sit-down strike, forced General Motors to accept their organization after numerous abortive efforts. But the United Auto Workers (UAW) did not rely intensively on CIO monies for its organizing suc- cess or on Lewis or other CIO leadership for its operations. The history of the union is a story of workers trying to organize, subject to generally bungled efforts by the AFL to provide leadership and aided only modestly by the CIO leadership.
The organization of the steelworkers was quite different. In steel, the CIO set up and funded the Steelworkers Organizing Committee (SWOC), and the United Mine Workers provided organizers and money as well as Philip Murray, the Steelworkers Union’s first president. Much of the growth, however, came by gaining the support of the company unions that the steel firms had set up to buffer themselves from independent unions, which makes it clear that there was an important bottom-up character to this drive as well. Still, the great suc- cess of the SWOC came with the negotiations between Lewis and the head of the U.S. Steel Corporation, Myron Taylor-a closed-door meeting that orga- nized the largest company without a strike. The Steelworkers is the prime ex- ample of a union that fits the top-down model.
To what extent did the organization of workers in CIO unions follow the UAW bottom-up pattern as opposed to the Steelworkers top-down pattern? One way to answer this question is to categorize CIO unions according to the financial and organizing resources that the federation gave them and to contrast the membership or growth of membership in those unions over the relevant time period. Table 8.7 presents data on the amount of money the CIO gave to various unions from 1935 to 1941 and gives the dollars per member of each union in 1937. While financial support is not the sole indicator of CIO effort, it is an important measure of how involved the central federation was in partic- ular organizing campaigns. The table shows wide variation in the absolute amount of money given and in the amount given per member. Consistent with the history of unionization in autos and steel, the UAW received relatively little money while the Steelworkers obtained a lot. Table 8.8 contrasts the 1942 membership in the various CIO unions according to the amount of CIO support given per member in 1937. I treat the unions receiving less than $2.00 per 1937 member as organized independently of the CIO, those receiving more than $5.00 per member as being dependent on the CIO, and unions receiving be- tween $2.00 and $5.00 as being in an intermediate group. A classification of this type, based on a single indicator, is rough but, as noted in the auto and steel cases, my classification is generally consistent with the histories of particular

Table 8.7 Assistance Given by the CIO to National Affiliates, 1935-41, and Estimated Assistance per Member in the Affiliates as of 1937
Union
Assistance Total Assistance per Member
(thousand $) ($1
Aluminum Workers Architects Automobile Barbers Cannery Communication Construction Die Casters Distillers Electrical and Radio Farm Equipment Federal Flat Glassblowers Furniture Inland Boatmen Iron, Steel, and Tin Longshore Marine Engineers Marine and Shipbuilding Maritime Mine, Mill, and Smelter Newspaper Guild Office and Professional Oil Optical Packinghouse Workers Stone Radio and Telegraph Retail and Department Rubber Shoe State, Municipal, and City Steel Studio Technicians Textiles Toy and Novelty UMW, District 50 Utility Woodworkers
30 44 60 3
88 68
313 13 30 52 72
108 14 54 9
20 29
1 52 49 62 41 66
117 4
93 1
33 121 23 82
134 1,019
4 133 53
110 76 85
1.17 12.09
.31 6.00
6.18 125.20
2.60
1.68 1.45
33.75 .82
4.25 2.90 1.03 1.16 .80
2.67 1.67 3.18 3.59 7.59 6.92 2.50 2.94 .20
66.00 3.02 .74
4.77 23.10
8.15 1.53 1.97
11.04 12.09 9.50 4.36
Sources: Total assistance from Galenson (1960, table 26); for assistance per member, I divided total assistance by union membership in 1937 from Troy (1965, table A-2). When Troy reported no membership in a given year, I have taken the membership in the nearest available year.

285 Spurts in Union Growth: Defining Moments and Social Processes
Table 8.8 Membership in CIO Unions in 1942, According to Dependence on CIO for Financial Assistance
Dollars of Aid per 1937 Member, No. of Membership 1935-41 Unions in 1942 Major Unions in Group
Less than $2 15 1,055,000 UAW, Electrical, Rubber $2-$5 10 379,000 Textile, Marine and Shipbuilding More than $5 12 584,600 Steel, Construction District 50
Notes: Calculated from table 8.7 and membership data from Troy (1965, table A-2). Includes only unions given some central supprt. Thus, ACW, UMW, and ILGWU, among others are excluded from the data. When a union was not affiliated with the CIO (UMW, District 50, left with the UMW), I used the most recent CIO affiliation year.
unions. The striking fact is that in 1942 the CIO was not dominated by unions whose formation and growth had depended greatly on CIO financial and or- ganizing support. There are more than twice as many members in the unions that received relatively little CIO financial support than in those that received considerable support. One reason is that the CIO gave considerable money to some organizing drives, such as for construction workers, that had relatively little success (and were motivated less by the desire of workers to join CIO unions than by John L. Lewis’s desire to create trouble for the AFL craft unions).
The most dramatic histories of the depression spurt focus on the growth of the new CIO industrial unions, but a major component of union expansion in the period was the AFL response to the new competing federation (Galenson 1960). Indeed, the absolute growth of membership in AFL unions exceeded the growth in CIO unions, even if we count the CIO as having no members prior to 1937 (although some founding organizations like the Miners were al- ready large).
Between 1935 and 1942 the AFL gained 2.7 million members compared with a gain of 2.5 million for the CIO (see table 8.9). Several AFL unions made particularly large gains in the period: the Machinists, which had opposed industrial unionism in internal AFX debates, but which transformed itself into “one of the great mass production unions in the country” (Galenson 1960, 141), in part to c y p e t e with the UAW in areas like airplane production; the Teamsters, which debeloped regional conferences to create a multiindustry general transport workers’ union; the Carpenters (whose head, Bill Hutcheson, was the man Lewis punched when he quit the AFL to form the CIO); the Rail- way Clerks; and the Building Laborers; though membership grew in other unions as well. To some extent, AFL unions were galvanized to fight for mem- bership by rival CIO unions that threatened their jurisdictions rather than by the opportunities created by the Wagner Act election procedure per se. But they were also galvanized by worker desires to unionize in response to the depression conditions. The problem for the AFL unions was to get their “act in

286 Richard B. Freeman
Table 8.9 Membership in the AFL and CIO, 193542 (thousands)
Union 1935 1936 1937 1938 1939 1940 1941 1942
AFL Machinists Teamsters Retail clerks Bakers Carpenters Electrical Hotel Other building trades
Boilermakers Bridge and iron Operating engineers Painters Plumbers
CIO
3,218 98
162 12 21
129 57 82
15 13 35 64 35
-
3,516 116 188 18 25
150 67
110
16 17 35 75 37
-
3,180 167 353 24 30
209 94
194
18 32 42 93 44
1,99 1
3,547 171 394 30 56
215 107 187
28 42 42
101 54
1,958
3,878 178 442
51 69
215 125 211
29 39 58
103 59
1,838
4,343 207 47 8 74 81
233 146 226
33 41 64
114 62
2,154
5,179 313 599
83 83
357 202 269
43 63 97
131 81
2,654
6,073 489 566 80 91
517 277 237
90 94
138 127 114
2,493
Source: Troy (1965, table A-I).
gear” to take advantage of a market opportunity created more by worker de- sires than by government legislation.
Only three AFL (later CIO) unions exploited the opportunity first created by the Roosevelt administration’s NIRA to build or rebuild their membership base: the United Mine Workers (UMW), the Amalgamated Clothing Workers (ACW), and the International Ladies’ Garment Workers’ Union (ILGWU). All three unions operated in competitive industries. All had experienced periods of great growth followed by collapses throughout their histories. From 1927 to 1933 in particular, the UMW, then the largest exemplar of industrial unionism in the United States, had suffered massive losses of membership. The success of each of these unions depended critically on establishing some form of na- tional or at least regional wage pattern, so that firms that signed with the union were not driven out of business by nonunion competitors. Thus, the NIRA gave them a particular institutional setting through which to develop sectoral agreements. The UMW accomplished this in part through bargaining with the bituminous coal manufacturers’ federation and effectively helping them to oli- gopolize the industry. The ACW and ILGWU did the same in the major apparel-producing areas in the North but failed to extend their organizations to the South. Most of the successful new CIO unions, by contrast, were in industries dominated by a few large employers, often located in a single area: steel, autos, rubber. The great success of the AFL construction unions in the late 1930s reflected their monopoly of skilled crafts workers in particular local- ities, where organization depended largely on the activities of local unionists.
In sum, to understand the development of unionism during the Great De- pression, it is more useful to think of an endogenous bottom-up response op-

287 Spurts in Union Growth: Defining Moments and Social Processes
erating during a period of great change in worker desire for unionism than of a legalistic top-down unionization drive.
8.4 Conclusion: What Does a Defining Period Define?
For a particular event to be “defining,” it must lock in certain outcomes that persist into some future period when, given a blank slate, the society could have developed something very different. Historians and labor analysts writing in 1950s and 1960s believed that the depression spurt and the Wagner Act were such events, producing a substantial and stable collective bargaining system for the United States. According to Fleming, the Wagner Act “unquestionably contributed enormously to the growth of a large and independent labor move- ment . . . and to the . . . acceptance of that movement as a desirable part of a modern American society” (1957, 149). Bernstein wrote that “American labor history took an eventful turn with the coming of the New Deal” (197 1, ix). In 1964 Taft contrasted the labor movement “of today” with the “one that existed in the early 1930s:’ noting that “its numbers are about six times as great, and the level upon which it operates its legal, political, and research activities has been greatly expanded” (1964,708).
In 1997 the effect of the depression and World War I1 spurts on union density and the U.S. labor relations system appears quite different. Private sector union density has dropped to the levels of the mid- 1900s. The social accord that made unions a part of national decision making has broken down. An increasing number of employers seek the “union-free’’ environment that only retrograde right-wing ideologues once sought. Many firms that do not espouse the union- free world act as if that is what they truly want when their own workforce seeks to organize. The depression and World War I1 growth of unionism thus looks more like a diversion from American “exceptionalism”-a long and important diversion, but a diversion nonetheless-rather than a critical turning point in labor relations.
This does not, however, mean that the period did not leave a lasting legacy. What remains to this day is the nation’s legal framework for conducting private sector labor relations: a national labor code, based on the Wagner Act as amended in ensuing years. This is a framework that is arguably outmoded. One major purpose of the act-to encourage collective bargaining-has failed: the proportion of nonagricultural workers in unions is below what it was in the five depression years prior to its enactment. From the union side, the Wagner Act turned the process of unionization into a legalistic business, in which fimns and union organizers battle before the NLRB and courts as part of the election process. The protections that the act gave to workers who want to unionize have de facto been eliminated as the number of unfair practices committed by employers per election has risen sharply. Never envisaging a world in which upward of 35 percent of nonmanagerial workers would supervise others, where white-collar managerial and professional jobs would constitute the dominant

288 Richard B. Freeman
occupations, the act, with its Taft-Hartley amendments, fails to provide any place for intermediate organizations-staff associations, works councils, or more pejoratively company unions-that some of these workers may prefer to the stark “collective bargaining or nothing” choice that the Wagner Act offers. The labor relations code provides no place for unions of supervisors, profes- sionals, or managers. From the employer side, the act makes it illegal for firms to set up and support worker organizations that might give some legitimate voice to workers who want some organization at their workplace short of an independent union that bargains collectively (the “company union”). Perhaps most important, the NLRB representation procedure has not reduced the con- frontation between management and employees over unionization but has sim- ply transferred it from one setting to another. By contrast, state regulation of public sector labor relations has produced what the Wagner Act has not-a stable collective bargaining system in that part of the economy with much less confrontation in the organizing process. As the laws governing unionization in the public and private sectors are reasonably similar, this difference in outcomes is probably due to the smaller incentive and willingness of man- agers in the public sector than of managers in the private sector to fight union drives. Public sector managers are not motivated by corporate profit to op- pose unionism.
My view that the Wagner Act has locked the United States into an outmoded labor relations framework that does not fit labor market realities as the country moves into the twenty-first century is not an isolated one. Many labor experts concur that the Wagner Act framework no longer fits the U.S. economy, though they often disagree about the specifics of labor law reform, as can be seen in the differing views given by labor, management, and independent scholars be- fore the 1993-94 Commission on the Future of Worker-Management Relations (U.S. Department of Labor 1994a, 1994b). Workers, firms, union membership, and the economy have changed greatly since the 1930s. But, despite several amendments to the Wagner Act, the basic structure of the law has not changed, creating an institutional straitjacket that helps neither U.S. workers, nor firms, nor unions, but one that has proved difficult to change, given the fears of labor and management that any shifts in the law will tilt the balance of power against their side. The lesson I draw from the depression spurt is that these fears are probably ill placed. No plausible “labor law reform” is likely to induce a burst of unionism in the United States. The lesson from the depression experience is that bottom-up employee-driven bursts of union activity rather than particu- lar laws are necessary for any resurgence of union density. Another lesson is that any such resurgence of unionism will come suddenly, probably surprising the current crop of experts and labor historians as much as the depression spurt surprised Barnett and other observers of the period.

289 Spurts in Union Growth: Defining Moments and Social Processes
Appendix Union Membership and Density Estimates
There are alternative estimates of union membership for the United States that cover the depression era (and earlier) through the 1990s. These include Troy’s (1965), Troy and Sheflin’s (1985), and those of the BLS (reported in diverse publications such as various statistical abstracts and BLS bulletins, such as US. Department of Labor, BLS 1980). Galenson (1960,584-87) reports dif- ferent numbers for various unions in the depression period and describes some of the problems of determining membership at a time when unions were com- peting. He also contrasts “his” estimates with those of Wolman. There are dif- ferences between convention strength and membership claims, differences be- tween members in good standing and dues-paying members, that produce wide variation. Even the head of the CIO, Philip Murray, was uncertain about mem- bership in 1939, when per capita payments gave a membership estimate of 1.7 million: “He indicated that many affiliates were not paying their per capita fees to the CIO, and that actual membership might be as high as 3,000,000’ (Ga- lenson 1960, 585). The contemporaneous BLS estimate for 1939 was 4 mil- lion. Given these differences, it is not surprising that while all extant estimated series show a sharp increase in membership from 1935 through 1939 and from 1941 or 1942 through 1945, the timing and magnitude of the changes does differ, in some cases for reasons that are unclear. In table 8A. 1, I report five different union membership series for 1933-48 that show the range of varia- tion in these estimates. The differences among the series are largest in 1936
Table 8A.1 Union Membership (thousands)
Troy and Year BLS Troy Sheflin Galenson Wolman
1933 1934 1935 1936 1937 1938 I939 1940 1941 1942 I943 1944 1945 1946 1947 1948
2,857 3,249 3,728 4,164 7,218 8,265 8,980
10,489 10,762 13,642 14,621 14,796 14,974 15,414 15,000
8,944
2,973 3,609 3,753 4,107 5,780 6,080 6,556 7,282 8,698
10,200 11,812 12,628 12,562 13,263 14,595 I 5,020
3,659 4,164 3,794 4,3 I6 5,923 6,193 6,708 7,524 9,017
10,569 12,103 12,605 12,728 13,515 14,694 14,953
4,164 5,080 5,944 6,680 6,669 8,339
4,075 6,334 7,342 7,735 8,101 8.614

290 Richard B. Freeman
and 1937, when the BLS data show a much greater spurt in membership than the Troy, Troy and Sheflin, or Galenson series does. The Wolman series shows a large increase in membership for 1936-37 but still falls short of the change in membership in the BLS data. The differences in the series imply somewhat different timing and magnitudes for the depression-era spurt, but all still show sizable gains in membership. The BLS series also shows a larger increase in 1942-43 than the Troy or Troy and Sheflin series. But since the Troy and Troy and Sheflin data are roughly comparable to the BLS data in 1948, they show larger estimated increases in union membership from 1944 to 1948 than does the BLS series.
Why do the series differ? The BLS and Troy data differ presumably because the Troy figures are based on dues-paying membership while the BLS data are derived from union reports, which may include persons who do not pay dues, particularly in 1937. Troy and Sheflin are based on the earlier Troy figures, with adjustments from fiscal year to calendar year, but this does not readily explain some of the differences between these series, particularly in 1933 and 1934. The Galenson series uses AFL and independent union data together with Philip Murray’s estimates for the CIO, which may have understated even dues- paying membership, as individual unions sought to keep more of the dues for themselves.
There is no strong reason to prefer the BLS or Troy or Troy and Sheflin data for analyzing union growth in the United States. But because I am uneasy about the unexplained changes between the Troy estimates and the Troy and Sheflin estimates and have a mild preference for measures that reflect the broadest possible membership in unions to those limited to annual dues-paying members, as the former may give a better indication of changes in periods of rapid growth, I base my estimates on the BLS series spliced to other series. Use of any of the other series or variants of the particular splicing that I chose will not, however, affect the basic findings or analysis.
The estimates reported in table 8A.2 provide one continuous union member- ship series from 1880 to 1995, together with a single nonagricultural employ- ment series, from which I derive a density series. The union membership fig- ures refer to U.S. union members only. To obtain the figures, I spliced together three different series. The 1995 numbers come from U.S. Department of Labor, BLS (1996). For the period 1983-94, I use the numbers reported from the Current Population Survey (CPS) in Bureau of National Affairs (1 995, table I), with the 1981 number based on the reported percentage of wage and salary workers who were union members. As there are no numbers for 1982, I esti- mated membership in that year by assuming the change between 1981 and 1983 was proportionate to the change given in Troy and Sheflin (1985, table 3-10). For 1978-80, I use the CPS numbers reported in Bureau of National Affairs (1983, table 1). For 1930-77, I use the series reported by the U.S. Department of Labor, BLS (1980), spliced to be consistent with the CPS at the 1978 overlap year between the BLS and CPS series. For the period 1897-1929
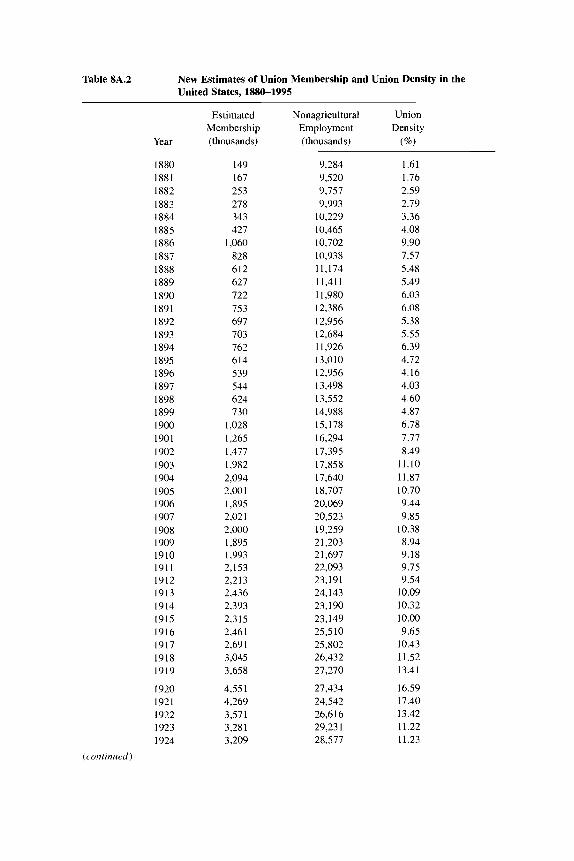
Table 8A.2 New Estimates of Union Membership and Union Density in the United States, 1880-1995
Estimated Nonagricultural Union Membership Employment Density
Year (thousands) (thousands) (%I
1880 1881 1882 1883 1884 1885 1886 1887 1888 1889 1890 1891 1892 I893 1894 1895 1896 1897 1898 1899 1900 1901 1902 1903 1904 1905 1906 I907 1908 1909 1910 1911 1912 1913 1914 1915 1916 1917 1918 1919
1920 1921 1922 1923 1924
(contiiiued)
149 167 253
343 427
1,060 828 612 627 722 753 697 703 762 614 539 544 624 730
1,028 1,265 1,477 1,982 2,094 2,001 1,895 2,02 1 2,000 1,895 1,993 2,153 2,213 2,436 2,393 2,315 2.46 1 2,69 1 3,045 3,658
455 1 4,269 3,571 3,28 I 3,209
278
9,284 9,520 9,757 9,993
10,229 10,465 10,702 10,938 11,174 11,411 11,980 12,386 12,956 12,684 11,926 13,010 12,956 13,498 13,552 14,988 15,178 16,294 17,395 17,858 17,640 18,707 20,069 20,523 19,259 2 1,203 2 1,697 22,093 23,191 24,143 23,190 23,149 25,510 25,802 26,432 27,270
27,434 24,542 26,616 29.23 1 28,577
1.61 1.76 2.59 2.79 3.36 4.08 9.90 7.57 5.48 5.49 6.03 6.08 5.38 5.55 6.39 4.72 4.16 4.03 4.60 4.87 6.78 7.77 8.49
11.10 11.87 10.70 9.44 9.85
10.38 8.94 9.18 9.75 9.54
10.09 10.32 10.00 9.65
10.43 11.52 13.41
16.59 17.40 13.42 11.22 11.23

Table SA.2 (continued)
Estimated Nonagricultural Union Membership Employment Density
Year (thousands) (thousands) (%)
1925 1926 1927 1928 1929 1930 1931 1932 1933 1934 1935 1936 1937 1938 1939 1940 1941 1942 1943 I944 1945 1946 1947 1948 1949 1950 195 1 1952 1953 1954 1955 1956 1957 1958 1959
1960 1961 I962 1963 1964 1965 1966 1967 1968 1969 1970
3,224 3,248 3,255 3,225 3,277 3,284 3,196 2,945 2,596 2,982 3,460 3,85 1 6,760 7,757 8,461 8,416 9,849
10,022 12,757 13,658 13,828 13,899 14,277 13,825 13,790 13,715 14,962 15,344 16,364 16,435 16,223 16,887 16,770 16,442 16,527
1 6,46 1 15,741 16,014 15,954 16,260 16,703 17,322 17,734 18,264 18,380 18,713
29,75 1 30,599 30,48 1 30,539 31,339 29,424 26,649 23,628 23,711 25,953 27,053 29,082 3 1,026 29,209 30,618 32,376 36,554 40,125 42,452 41,883 40,394 41,674 43,881 44,891 43,778 45,222 47,849 48,825 50,232 49,022 50,675 52,408 52,894 51,368 53,297
54,203 53,989 55,515 56,602 58,156 60,444 63,901 65,803 67,897 70,384 70,880
10.84 10.61 10.68 10.56 10.46 11.16 11.99 12.46 10.95 11.49 12.79 13.24 21.79 26.56 27.63 26.00 26.94 24.98 30.05 32.61 34.23 33.35 32.54 30.80 3 1 .50 30.46 31.27 3 1.43 32.58 33.53 32.01 32.22 31.71 32.01 31.01
30.37 29.16 28.85 28.19 27.96 27.63 27.11 26.95 26.90 26.11 26.40

293 Spurts in Union Growth: Defining Moments and Social Processes
Table 8A.2 (continued)
Year
Estimated Nonagricultural Union Membership Employment Density (thousands) (thousands) (%I
1971 1972 1973 1974 1975 I976 1977 1978 1979 1980 1981 I982 1983 1984 1985 1986 1987 I988 1989 I990 1991 1992 1993 1994 1995
18,549 18,765 19,167 19,503 18,935 18,957 19,016 19,548 20,986 20,095 19,507 18,558 17,717 17,340 16,996 16,975 16,913 17,002 16,961 16,740 16,568 16,390 16,598 16,740 16,360
71,211 73,675 76,790 78,265 76,945 79,382 82,471 86,697 89,823 90,406 91,152 89,544 90,152 94,408 97,387 99,344
101,958 105,210 107,895 109,419 108,256 108,604 110,730 1 14,034 116,609
26.05 25.47 24.96 24.92 24.6 1 23.88 23.06 22.55 23.36 22.23 21.40 20.73 19.65 18.37 17.45 17.09 16.59 16.16 15.72 15.30 15.30 15.09 14.99 14.68 14.03
I use the BLS series reported in U.S. Bureau of the Census (1960, series D- 735), adjusted so that the data refer to U.S. members of unions on the basis of the U.S. proportion of labor union membership in 1930 in series D-741 and D- 742. This eliminates Canadian members of U.S. unions. For the period 1880- 1913 I used the series of union membership reported by Gerald Friedman (1995), spliced to the BLS series (itself adjusted to be on a CPS-comparable basis) at the overlap year 1914.
The nonagricultural employment series is derived from several sources as well. For 1966-95, I used the Economic Report of the President (Council of Economic Advisers 1996, table B-42). For 1930-65, I used the data in U.S. Department of Commerce (1966, series A-88). For 1900-1929, I used the data in the U.S. Department of Commerce (1966, series A-87). For 1889-99, I used series A70 from the same volume; those data are an index of man-hours in nonagricultural industries, and I applied the index numbers to the 1900 nonag- ricultural employment data in series A-87. Finally, as there are no annual non- agricultural employment series prior to 1889, I estimated employment by as- suming that it grew proportionate to population, as reported in series A-106.

294 Richard B. Freeman
References
Bain, G. S., and Robert Price. 1980. Projles of union growth. Oxford: Blackwell. Bamett, George E. 1933. Presidential address to the 45th annual meeting of the Ameri-
can Economic Association, Cincinnati, Ohio, 29 December 1932. Published as “American trade unionism and social insurance,” in American Economic Review 23, no. 1 (March): 1-15.
Bemstein, Irving. 197 1. The turbulent years. New York: Houghton-Mifflin. Bureau of National Affairs. 1983. Directory of U.S. labor organizations, 1982-83 edi-
tion. Washington, D.C.: Bureau of National Affairs. . 1995. Union membership and earnings data book 1994. Washington, D.C.:
Bureau of National Affairs. Bums, James MacGregor. 1956. Roosevelt: The lion and the fox. New York: Harcourt
Brace Jovanovich. Commons, John R., David J. Saposs, Helen L. Sumner, E. B. Mittelman, H. E. Hoag-
land, John B. Andrews, and Selig Perlman. 1966. History of labour in the United States. New York: A. M. Kelley.
Council of Economic Advisers. 1996. Economic report of the president 1996. Washing- ton, D.C.: Government Printing Office.
Davis, Horace B. 1941. The theory of union growth. Quarterly Journal of Economics
Derber, Milton, and Edwin Young, eds. 1957. Labor and the New Deal. Madison: Uni- versity of Wisconsin Press.
Dunlop, John T. 1948. The development of labor organization: A theoretical framework. In Insights into labor issues, ed. Richard A. Lester and Joseph Shister, 163-93. New York: Macmillan.
Fleming, Robben Wright. 1957. The significance of the Wagner Act. In Labor and the New Deal, ed. Milton Derber and Edwin Young. Madison: University of Wisconsin Press.
Freeman, Richard B. 1986. Unionism comes to the public sector. Journal ofEconomic Literature 24 (March): 41-86.
Freidel, Frank. 1952. Franklin D. Roosevelt. Boston: Little, Brown. Friedman, Gerald. 1995. New estimates of union membership, the United States, 1880-
1914. University of Massachusetts at Amherst, October. Mimeograph. Galenson, Walter. 1960. The CIO challenge to the AFL. Cambridge, Mass.: Harvard
University Press. Giebisch, Robert. 1979. The impact of the Wagner Act on trade union growth. Paper
prepared for Economics 1650, Harvard University, Cambridge, Mass., 1 January. Goldfield, M. 1987. The decline of organized labor in the United States. Chicago: Uni-
versity of Chicago Press. . 1989. Worker insurgency, labor, radical organization, and New Deal labor leg-
islation. American Political Science Review 83, no. 4 (December): 1257-82. Klare, Karl. 1978. Judicial deradicalization of the Wagner Act. Minnesota Law Review
62 (March): 265-339. Leuchtenberg, William. 1963. Franklin D. Roosevelt and the New Deal. New York:
Harper and Row. Organization for Economic Cooperation and Development (OECD). 199 1. Employ-
ment outlook. Paris: Organization for Economic Cooperation and Development, July. Schlesinger, Arthur M . 1958. The coming of the New Deal. Boston: Houghton Mifflin. Schneider, Michael. 1991. A brief history of German trade unions. Bonn: Dietz. Taft, P. 1964. Organized labor in American history. New York: Harper and Row.
55 (August): 611-37.

295 Spurts in Union Growth: Defining Moments and Social Processes
Troy, Leo. 1965. Trade union membership, 1897-1962. New York: Columbia Univer- sity Press.
Troy, Leo, and Neil Sheflin. 1985. U S . union sourcebook. West Orange, N.J.: IRDIS (Industrial Relations Data and Information Services).
US. Bureau of the Census. 1960. Historical statistics of the United States: Colonial times to 1957. Washington, D.C.: Government Printing Office.
. 1966. Long-term economic growth, 1860-1965. Washington, D.C.: Govem- ment Printing Office.
U.S. Department of Commerce. 1966. The national income and product accounts of the United States, 1929-1965: Statistical tables. Washington, D.C.: Government Printing Office.
U.S. Department of Labor. 1994a. Factjinding report: Commission on the Future of Worker-Management Relations. Washington, D.C.: Government Printing Office, May.
. 1994b. Report and recommendations: Commission on the Future of Worker- Management Relations. Washington, D.C.: Government Printing Office, December.
. Bureau of Labor Statistics (BLS). 1980. Directory of national unions and em- ployee associations 1979. Bulletin no. 2079. Washington, D.C.: Government Print- ing Office.
. 1986-96. Employment and earnings: January issues. Washington, D.C.: Gov- ernment Printing Office.
Visser, Jelle. 1989. European trade unions injgures. Netherlands: Deventer. . 1992. Trade union membership database. Computer files. University of Am-
Wolman, Leo. 1924. The growth of American trade unions, 1880-1923. New York: sterdam, March.
National Bureau of Economic Research.

This Page Intentionally Left Blank