Embed Size (px)
Citation preview

NPV: DOING IT BETTER
Herbert Kierulff
Donald Snellman Professor of Entrepreneurship and Finance
School of Business and Economics
Seattle Pacific University
3307 Third Avenue West
Seattle, WA 98119
Phone: (206) 281-3523
Fax: (206) 281-2733

NPV: DOING IT BETTER
Abstract: Net Present Value has become the single most important tool in investment
analysis and capital budgeting. It is a valuable method that is significantly limited by
seven basic suppositions that almost always attend its use. These suppositions are either
unknown, ignored, or treated in a cursory way by those who practice and write about the
method. We ignore these assumptions at our peril because doing so easily leads to
erroneous financial conclusions. This article examines the five and shows how
academics, practitioners, and students can deal with them without undue effort. Doing so
leads to a better NPV.
Key Words: Net Present Value, Present Value, Discounted Cash Flow, Capital
Budgeting, Discount Rate, Risk Adjusted Discount Rate, Capital Asset Pricing Model.
1

INTRODUCTION
Ryan and Ryan’s (2002) survey indicates that 85% of Fortune 1000
companies use Net Present Value (NPV) 75-100% of the time in making investment
decisions. Earlier studies (Burns & Walker, 1987; Gitman & Forrester, 1977) show a
similar preference among executives, and a propensity to use NPV over others such
as payback and return on funds employed. The model prevails in the textbooks,
articles, computer spreadsheets, and calculators.
The literature tends to make seven basic and important suppositions when
discussing NPV that are rarely examined in sufficient detail. The central message of this
article is that these suppositions can easily lead to very large errors—errors that may lead
to bad decisions. Academics, executives, and finance professionals can deal with the
negative consequences of all of these assumptions with relative ease if they recognize
that they exist and apply the simple measures discussed here to deal with them.
The article begins with an introduction to the assumptions and then
demonstrates their implications using an example. Finally, it introduces briefly
other factors beyond the scope of this paper that may bring needed adjustments to
NPV.
2

WHAT ARE THE ASSUMPTIONS; WHAT ARE THEIR IMPLICATIONS
The discounted cash flow models presented in textbooks and other educational
materials in the finance literature typically take for granted seven suppositions. These
seven are either potentially misleading or completely wrong:
1. All cash flows, including the initial investment, come at the end
of the year in which they occur.
2. The initial investment happens all at once.
3. The initial investment is not risky.
4. The firm uses its cost of capital or the project hurdle rate to
discount fixed costs and investments made after the initial one.
5. The firm uses its cost of capital or the project hurdle rate to
discount the project terminal value.
6. The cost of capital or project hurdle rate is appropriate to
measure the required rate of return on the free cash flows
resulting from the investment.
7. The positive cash flows resulting from the investment are
reinvested at the cost of capital or project hurdle rate.
The following example, similar to ones found in articles and textbooks, is used to
demonstrate the logical and practical inconsistencies in the assumptions:
The initial investment for the new Apex Project is $5 million at the end of
year 0, of which $4 million is tax-deductable research and development (R&D). The
rest is equipment. The expected sales are $22 million over six years, at which time
the product will become obsolete and the project liquidated. The $4 million R&D
includes start-up costs and constitutes the entire year 0 operating costs. The
3

company expects the TV of the patents, working capital, and equipment to be $1
million after taxes at the end of year 5. The riskless rate of interest is 5.5% and the
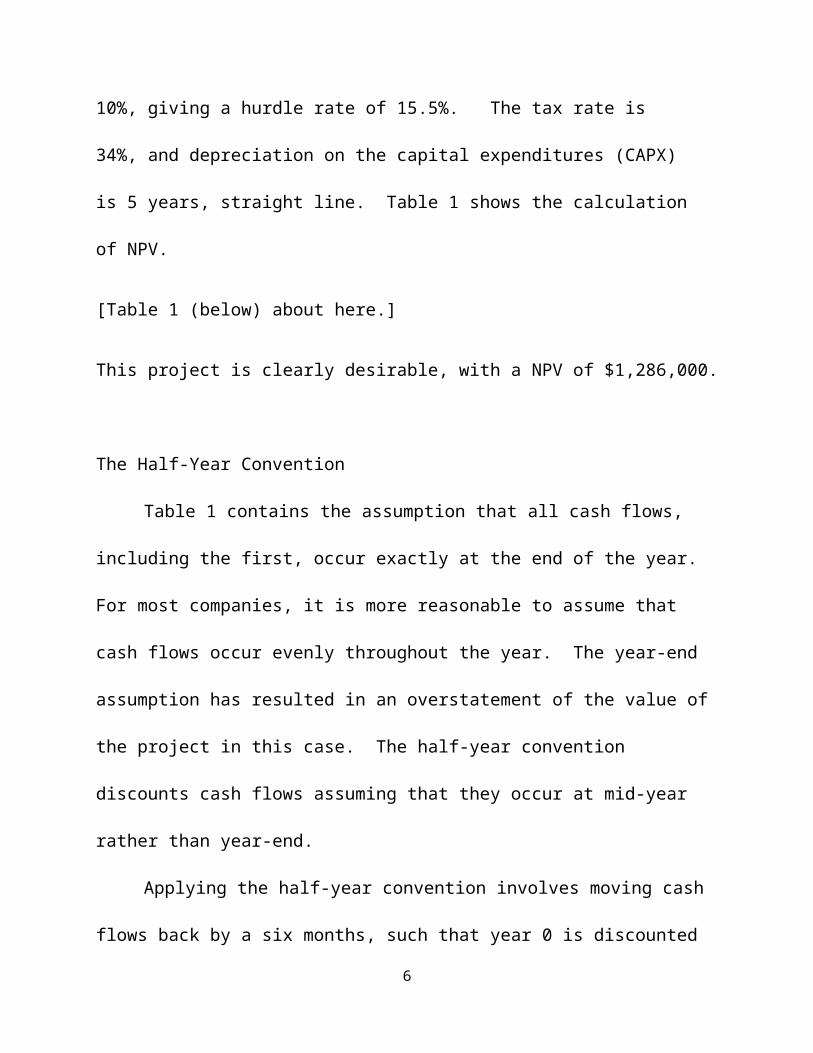
beta-adjusted risk factor is 10%, giving a hurdle rate of 15.5%. The tax rate is 34%,
and depreciation on the capital expenditures (CAPX) is 5 years, straight line. Table 1
shows the calculation of NPV.
[Table 1 (below) about here.]
This project is clearly desirable, with a NPV of $1,286,000.
The Half-Year Convention
Table 1 contains the assumption that all cash flows, including the first, occur
exactly at the end of the year. For most companies, it is more reasonable to assume that
cash flows occur evenly throughout the year. The year-end assumption has resulted in an
overstatement of the value of the project in this case. The half-year convention discounts
cash flows assuming that they occur at mid-year rather than year-end.
Applying the half-year convention involves moving cash flows back by a six
months, such that year 0 is discounted by (1 + i)0.5,, year one by (1 + i)1.5, year two by (1
+i )2.5, and so on (Pratt, 253). Year 0 becomes year 0.5, with the initial investment
beginning at the start of year 0 and the funds being spread evenly throughout the first
year. The TV occurs at the end of the final year rather than at the middle. Table 2
demonstrates the half-year convention, using the operating cash flows and the TV from
Table 1. The NPV drops from $1,286,000 to $1,170,000.
4

[Table 2 about here]
The reduction in NPV comes about because the initial investment is large and is
discounted by only a half-year, while the inflows are relatively small at first and then
increase. As the inflows increase in size over time, the discount rate increases
geometrically, reducing the inflows geometrically. When the reverse is true—small up-
front investment and large, earlier cash inflows—NPV may increase (Bruckner, 1991).
All up-front investment occurs at one time
Tables 1 and 2 are seriously flawed in that they fix all R&D and CAPX in period
0. If the company is purchasing a relatively small piece of easily installed equipment that
goes to work immediately, it is reasonable to assume that the entire outlay will take place
at the end of time 0. However, for major projects in such industries as aerospace,
pharmaceuticals, mining, and large-scale construction, this assumption is far off the
mark. In these and other industries, CAPX and R&D begin many years before product
launch and continue after positive cash flow generation.
There is disagreement regarding the value of NPV analysis during the early stages
of project research. The issue is whether an early-stage forecast can be based upon
information that is sufficiently reliable (Varila & Sievanen, 2005; Uppal & Van Gool,
1991). However, at some point during the R&D cycle—well before product roll out—
discounted cash flow analysis becomes highly relevant. For company acquisitions and
5
most (if not all) R&D and plant and equipment purchase decisions, NPV analysis is
relevant from the start.
Table 3 demonstrates the dramatic shift in NPV when the company spreads the
same amount of initial R&D and CAPX over a period of four years instead of the end of
time 0. NPV drops from $1,170,000 to $437,000.
[Table 3 about here.]
Risky costs and capital investments
Tables 2 and 3 deal with the investment in capital and R&D costs in the traditional
way—by discounting them over time for inflation, the real rate of interest, maturity or
investment rate risk, and market risk. However, simple logic would indicate that risk-
averse managers should increase costs to account for risk over time, not decrease them.
This means lowering the discount rate—perhaps using a rate less than one.
Literature discussions that took place in the 1970s and early 1980s deal with this
issue (Lewellen, 1977; Lewellen, 1979; Celec & Pettway, 1979; Berry and Dyson, 1980;
Booth, 1982). It seems clear from that discussion that variable costs and working capital
changes should be discounted at the same rate as revenues, and that the above simple
logic misses the point. Booth’s (1982, p. 299) summary explains why: “In evaluating
cash outflows, remember that a negative correlation between the value of a project’s cash
6

flows and the market rate of return translates into a positive correlation between the
project’s rate of return and the market rate of return.”
In other words, the variable components of a typical set of cash outflows are
correlated to sales in a direct way. If sales over five periods were 4, 8, 12, 8, and 4
respectively, the associated variable costs plus changes in working capital should follow
a similar pattern; say -3, -6, -9, -6, and -3. The two are perfectly negatively correlated.
If the discount rate for sales were 15.5%, the discount rate for the variable costs and
working capital changes would also have to be 15.5% to maintain the correlation at
minus 100%. Any other discount rate would disrupt the relationship and would
invalidate the logic behind the definition of variable costs and changes in working capital
as those elements that vary directly with sales.
Note that it is the free cash flow, not the sales or variable costs and working capital
changes, which is being measured. If investment and fixed costs are not involved, the
correlation between sales and the resulting cash flow (1, 2, 3, 2, and 1) is 100%.
However, up-front costs such as R&D and expenditures on plant and equipment
where there are no sales are another matter. The same is true of depreciation and other
fixed costs. Experienced investors are familiar with the impact on free cash flow of cost
overruns, delays, and mid-course changes in R&D and capital expenditures—especially
in those industries involved with technology (Davis, 2002; Uppal, 2001).
It is not unusual for managers to increase original R&D cost estimates by 5% to
200% to establish certainty equivalent proxies for risk prior to market introduction. One
executive who managed the new technical projects division at a Global-100 manufacturer
7

occasionally used pi (3.14159) as a cost multiplier for up-front costs in highly risky
projects (Personal conversation, 2008). Estimates such as these, when transformed into
risk adjusted discount rates (RADRs), can yield discount rates of considerably less than
one.
Everett and Schwab (1979) demonstrate that the discount rate could actually be
less than one if the risks are great enough. Booth (1982, p. 299) concludes: “Given risk-
free revenues and cost uncertainty, the cost stream for a normal firm with a positive risk
premium attached to its cash flows must be discounted with a RADR below the risk-free
rate.” Risk-free revenues are consistent with the revenues of zero that attend up-front
investment and maintenance of that investment (if any) after start-up.
The exceptions would include cases of contractual arrangements such as fixed-
price contracts and other riskless costs (Hartl, 1990). In these cases, the discount rate
would be the risk-free rate.
When the initial and subsequent investments are spread out over a period of time
the issue of systematic risk may become relevant. The business cycle may well affect
investment costs. Spreading expenditures over a longer period will affect the present
value through the discount rate.
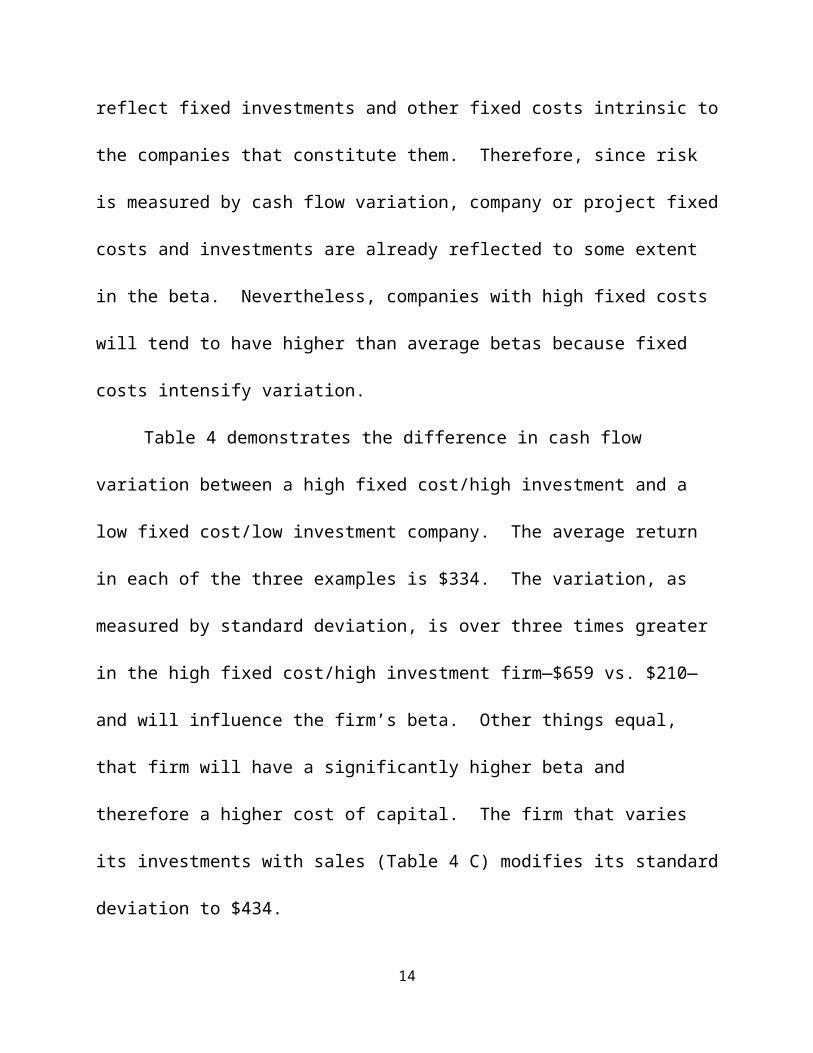
What to do with fixed investments? As proxy variables for risk, the S & P 500
and other similar measures already reflect fixed investments and other fixed costs
intrinsic to the companies that constitute them. Therefore, since risk is measured by cash
flow variation, company or project fixed costs and investments are already reflected to
8

some extent in the beta. Nevertheless, companies with high fixed costs will tend to have
higher than average betas because fixed costs intensify variation.
Table 4 demonstrates the difference in cash flow variation between a high fixed
cost/high investment and a low fixed cost/low investment company. The average return
in each of the three examples is $334. The variation, as measured by standard deviation,
is over three times greater in the high fixed cost/high investment firm—$659 vs. $210—
and will influence the firm’s beta. Other things equal, that firm will have a significantly
higher beta and therefore a higher cost of capital. The firm that varies its investments
with sales (Table 4 C) modifies its standard deviation to $434.
[Table 4 about here]
It follows from the table above that the firm should treat its fixed costs differently
from its variable costs notwithstanding the fact that fixed costs are captured in the proxy
variable such as the S&P 500 when beta is calculated. Although the science is imperfect,
start-up costs and investments in property, plant, and equipment prior to start-up should
be discounted separately in cases where significant investment is contemplated. In the
absence of forecast bias, it may be reasonable to discount these outlays at no more than
the risk-free rate. That rate should be adjusted downward if systematic risk such as
timing with the business cycle is involved.
When the company spreads the same amount of R&D and CAPX over a period of
four years instead of one, discounts R&D, CAPX, and depreciation by 5.5% (assuming
no systematic risk), uses the half-year convention, and assumes that the discount rate
9

after market introduction is reasonably accurate at 15.5%, NPV drops to a negative
$278,000.
Terminal Values
Terminal value systematic risks and biases may be significantly different from
operating cash flow risks and may be more or less difficult to forecast. Even forecasts of
the same terminal value using different methods can produce significantly different
results. The market value of future cash flows will produce one estimate, while models
that forecast free cash flow into perpetuity will produce another.
A 4% factor for terminal value added to the normal discount rate will reduce NPV
by an additional $71,000. When the terminal value is large, as in corporate acquisitions,
the amount can become highly significant. Table 5 demonstrates the effect of all of the
adjustments. As a result of the above analysis, NPV moved from a positive $1,286,000
in Table 1 to a negative $349,000. This $1.6 million shift represents nearly 33% of the
initial $5 million investment.
[Table 5 about here]
OTHER ADJUSTMENTS
In recent years, critics of NPV have pointed out that NPV models are incomplete
because they are deterministic. Among other things, they tend to underestimate the value
of real options and alternative outcomes (Boer, 2003; Carter, 1992).
10

Real options are those outcomes under management control (Benninga &
Tolkowsky, 2002; Brealey, et. al. 2006, p. 597; Olafsson, 2003). They include
opportunities to:
1. Expand a project to include other prospects.
2. Abandon a project entirely at various stages in its development or rollout.
3. Delay investment –wait and see.
4. Change a project.
Practitioners and academics have examined these approaches in depth over the last
few decades and have offered alternatives to complement NPV. These alternatives
appear under the headings of scenario (“what if”) and contingency analyses, decision
trees, and Monte Carlo simulations. They are used to examine a range of possible
outcomes beyond the control of management as well as those outcomes management can
reasonably expect to control.
However, this author knows of no peer-reviewed study that has demonstrated their
superiority over the NPV models in forecasting project or company attractiveness.
Presumably, studies comparing the methods will be forthcoming. A further discussion of
these more complex approaches is beyond the scope of this article, but may be found in
most finance texts and in many articles and cases.
One need not abandon or seriously readjust NPV to apply the less sophisticated
methods—scenario and contingency analyses—in their more straightforward modes. For
example, companies frequently invest in projects with the expectation that they will lead
11

to further opportunities. What if the Adams Company could build upon its proposed
R&D by making an additional investment of $500,000 one year after the Apex product
rollout? Assume this would lead to other products with subsequent free cash flows of
$250,000 per year for the following 5 years. The value of this alternative discounted to
the present would bring the total Apex NPV well into the positive column.
CONCLUSION AND TAKEAWAYS
NPV remains the most extensively used financial tool in evaluating investments.
Its wide applicability—from simple equipment purchases to corporate acquisitions—
combines with its relatively straightforward application to make it a valuable method.
However, it has been misunderstood and misapplied both in the literature and in practice.
This is partly because it ignores potential options, it has not been thoroughly or well
explained, and because examples have been incomplete or in error.
The intent of this article has been to demonstrate how decisions using NPV can be
improved simply by:
1. Adjusting the timing of free cash flows to reflect the reality of their
occurrence. Most cash flows do not come exactly at the end of the year,
treating them as if they do biases the result. Many projects have initial
R&D, fixed asset purchases, and other expenditures that extend more or
less evenly over one or more years.
12

2. Appreciating the difference between systematic and unsystematic risk and
accounting for systematic biases in forecasting.
3. Recognizing fixed costs in investments and other expenditures and using
different discount rates for these costs.
4. Noting that the terminal value of an investment generally exhibits different
systematic risk characteristics from the other free cash flows and requires a
different discount rate.
5. Considering other opportunities (real options) that may be brought about by
investing in a given project.
13
References
Benninga, S. & Tolkowsky, E. (2002). Real options: an introduction and an application to R&D valuation. The Engineering Economist, 47(2), 151-168.
Berry, R. H. & Dyson, R. G. (1980). On the negative risk premium for risk adjusted discount rates. Journal of Business Finance& Accounting, 7(3), 427-436.
Boer, F. P. (2003). Risk-adjusted valuation of R & D projects. Research Technology Management, 46(5), 50-58.
Booth, L. D. (1982). Correct procedures for the evaluation of risky cash outflows. Journal of Financial and Quantitative Analysis, 17(2), 287-300.
Brealey, R. A., Myers, S. C. & Allen, F. (2006). Principles of Corporate Finance (8th ed.). Boston: McGraw-Hill/Irwin.
Bruckner, K. L. (1991). Mid-year versus year-end present worth factors in DCF analysis. The Appraisal Journal, 59(1), 126-130.
Burns, R. M., & Walker, J. (1987). Investment techniques among the Fortune 500: A rationale approach. Managerial Finance, 23(9), 3-15.
Carter, W. K (1992). To invest in new technology or not? New tools for making the decision. Journal of Accountancy, 173(5), 58-62.
Celec, S. E. & Pettway, R. H. (1979). Some observations on risk-adjusted discount rates: A comment. The Journal of Finance, 34(4), 1061-1063.
Davis, C.R. (2002). Calculated risk: A framework for evaluating product development. MIT Sloan Management Review, 43(4), 71-77.
Everett, J. E. & Schwab, B. (1979). On the proper adjustment for risk through discount rates in a mean-variance framework. Financial Management, 8(2), 61-65.
Financial Accounting Standards Board (2000). Statement of financial accounting concepts no. 7: using cash flow information and present value in accounting measurements. Norwalk, CT: Financial Accounting Foundation.
Gitman, L. J., & Forrester, J. R. (1977). A survey of capital budgeting techniques used by
major U. S. firms. Financial Management, 6(3), 66-71.
14

Graves, S. B. & Ringuest, J. L. (1991). Evaluating competing R&D investments. Research Technology Management, 34(4), 32-36.
Hartl, R. J. (1990). DCF analysis: The special case of risky cash outflows. Real Estate Appraiser and Analyst, 56(2), 67-72.
Hollmann, J. K. (2007). The Monte-Carlo challenge: A better approach. 2007 AACE International Transactions, Risk 3, 1-7.
Lev, Baruch (1974). On the association between operating leverage and risk. Journal of Financial and Quantitative Analysis, 9(4), 627-641.
Lewellen, W. G. (1977). Some observations on risk-adjusted discount rates. The Journal of Finance, 32(4), 1331-1337.
Lewellen, W. G. (1979). Reply to Pettway and Celec. The Journal of Finance, 34(4), 1065-1066.
Olafsson, S. (2003). Making decisions under uncertainty—Implications for high technology investments. BT Technology Journal, 21(2), 170-183.
Personal conversation, August, 2008.
Pratt, S.P. (2008). Valuing a business (5th ed.). New York: McGraw Hill.
Ryan, P. A., & Ryan, G. P. (2002). Investment practices of the Fortune 1000: How have things changed? Journal of Business and Management, 8(4), 355-364.
Uppal, K. B. (2001). Estimating? The number/confidence/resources, or what? Cost Engineering, 43(2), 35-40
Uppal, K. B. & Van Gool, H. (1991). R&D phase—Capital cost-estimating. Transactions of American Association of Cost Engineers, 1, ABI/INFORM Research, A.4.1.
Varila, M. & Sievanen, M. (2005). Profitability estimation of pioneering R&D project. AACE International Transactions, EST.19.1-8.
15

TABLE 1: THE APEX PROJECT ($000)Time Periods In Years 0 1 2 3 4 5 6Sales Per Year 1,000 2,500 4,000 6,000 5,000 2,000 Cost of Goods Sold (250) (625) (1,000) (1,500) (1,250) (500)Operating Costs (4,000) (150) (375) (600) (900) (750) (300)Depreciation (200) (200) (230) (320) (380) (180) (180)Earnings Before Interest and Taxes (4,200) 400 1,270 2,080 3,220 2,820 1,020 Taxes @ .34 1,428 (136) (432) (707) (1,095) (959) (347)Earnings Before Interest After Taxes (2,772) 264 838 1,373 2,125 1,861 673 Depreciation 200 200 230 320 380 180 180 Working Capital Change (100) (150) (150) (200) 100 600 CAPX (1,000) (150) (450) (200)Operating Cash Flow (3,572) 428 768 1,093 2,105 2,141 1,453 Terminal Value After Taxes 1,000 Free Cash Flow (3,572) 428 768 1,093 2,105 2,141 2,453 NPV 1,286
16

TABLE 2. THE APEX PROJECT ($000): HALF-YEAR CONVENTION
Half-Year Convention 0.50 1.5 2.5 3.5 4.5 5.5 6.5Sales Per Year 1,000 2,500 4,000 6,000 5,000 2,000 Cost of Goods Sold (250) (625) (1,000) (1,500) (1,250) (500)Operating Costs (4,000) (150) (375) (600) (900) (750) (300)Depreciation (200) (200) (230) (320) (380) (180) (180)Earnings Before Interest and Taxes (4,200) 400 1,270 2,080 3,220 2,820 1,020 Taxes @ .34 1,428 (136) (432) (707) (1,095) (959) (347)Earnings Before Interest After Taxes (2,772) 264 838 1,373 2,125 1,861 673 Depreciation 200 200 230 320 380 180 180 Working Capital Change (100) (150) (150) (200) 100 600 Capital Expenditure (CAPX) (1,000) (150) (450) (200)Annual Operating Cash Flow (3,572) 364 768 1,093 2,105 2,141 1,453 Discounted Operating Cash Flow (3,324) 293 536 660 1,101 969 570 Discounted Terminal Value (7 years) 365 Net Present Value @ 15.5% 1,170
17

TABLE 3: INITIAL INVESTMENT SPREAD OVER FOUR YEARS ($000)
Time Periods 0.5 1.5 2.5 3.5 4.5 5.5 6.5 7.5 8.5 9.5
Sales Per Year 0 0 0 01,00
02,50
0 4,000 6,000 5,000 2,000
Cost of Goods Sold (250)(625
)(1,000
)(1,500
) (1,250) (500)
Operating Costs (150)(375
) (600) (900) (750) (300)
R&D(100
)(1,000
)(1,400
)(1,500
)
Depreciation (20) (60) (120) (200) (200)(210
) (260) (240) (160) (160)Earnings Before
Interest and Taxes(120
)(1,060
)(1,520
)(1,700
) 4001,29
0 2,140 3,360 2,840 1,040
Taxes @ .34 41 360 517 578 (136)(439
) (728)(1,142
) (966) (354)Earnings Before Interest After Taxes (79) (700)
(1,003)
(1,122) 264 851 1,412 2,218 1,874 686
Depreciation 20 60 120 200 200 210 260 240 160 160Change In Working Capital (100)
(150) (150) (200) 100 600
Capital Expenditure(100
) (200) (300) (400)(150
) (450) (200)
Cash Flow(159
) (840)(1,183
)(1,322
) 364 761 1,072 2,058 2,134 1,446
Discounted (148
) (676) (825) (798) 190 345 420 698 627 368Discounted Terminal Value 237NPV @ 15.5% 437
18

Table 4. COMPARISON OF HIGH AND LOW FIXED COST COMPANIES ($000)
Year 1 Year 2 Year 3 Year 4
Year 5 Standard
A. High Fixed Cost Company DeviationSales 1,000 2,000 3,000 2,000 1,000 Variable Costs (including taxes) (100) (200) (300) (200) (100)Fixed Costs (950) (950) (950) (950) (950)Change in Working Capital (20) (40) (60) (40) (20)Investments (300) (300) (300) (300) (300)Free Cash Flow (370) 510 1,390 510 (370) 659 Average Return: Free Cash Flow = 334
B. High Variable Cost CompanySales 1,000 2,000 3,000 2,000 1,000 Variable Costs (including taxes) (700) (1,400) (2,100) (1,400) (700)Fixed Costs (70) (70) (70) (70) (70)Working Capital (20) (40) (60) (40) (20)Investments (100) (100) (100) (100) (100)Free Cash Flow 110 390 670 390 110 210 Average Return: Free Cash Flow = 334
C. Investment Varies with SalesSales 1,000 2,000 3,000 2,000 1,000
19

Variable Costs (including taxes) (100) (200) (300) (200) (100)Fixed Costs (710) (710) (710) (710) (710)Change in Working Capital (20) (40) (60) (40) (20)Investments (300) (600) (900) (600) (300)Free Cash Flow (130) 450 1,030 450 (130) 434
Average Return: Free Cash Flow = 334
TABLE 5. COMBINING THE ADJUSTMENTS ($000)
Time Periods 0.5 1.5 2.5 3.5 4.5 5.5 6.5 7.5 8.5 9.5Sales Per Year 0 0 0 0 1,000 2,500 4,000 6,000 5,000 2,000 Cost of Goods Sold (250) (625) (1,000) (1,500) (1,250) (500)Operating Costs (150) (375) (600) (900) (750) (300)Research and Development (100) (1,000) (1,400) (1,500)Depreciation (Fixed) (20) (60) (120) (200) (200) (210) (260) (240) (160) (160)Earnings Before Interest and Taxes (120) (1,060) (1,520) (1,700) 400 1,290 2,140 3,360 2,840 1,040 Taxes @ .34 41 360 517 578 (136) (439) (728) (1,142) (966) (354)Earnings Before Interest After Taxes (79) (700) (1,003) (1,122) 264 851 1,412 2,218 1,874 686 Depreciation (Fixed) 20 60 120 200 200 210 260 240 160 160 Chg. In Working Capital (100) (150) (150) (200) 100 600 CAPX (Fixed) (100) (200) (300) (400) (150) (450) (200)Free Cash Flow (159) (840) (1,183) (1,322) 364 761 1,072 2,058 2,134 1,446
Free Cash Flow (Fixed) (159) (840) (1,183) (1,322) 68 (79) (362) (118) 54 54 DCF @ adjusted rate (155) (775) (1,035) (1,096) 53 (59) (255) (79) 35 33 Free Cash Flow (Variable) 0 0 0 0 296 840 1,434 2,176 2,080 1,392 DCF @ hurdle rate 0 0 0 0 155 380 562 738 611 354 Sum Adjusted Discounted FCF (155) (775) (1,035) (1,096) 208 322 307 659 646 387 Terminal Value 184Net Present Value (349)
DEPRECIATION SCHEDULE ($000)Depreciation (Fixed) (20) (20) (20) (20) (20)
(40) (40) (40) (40) (40)
20

(60) (60) (60) (60) (60)(80) (80) (80) (80) (80)
(20) (60) (120) (200) (200) (180) (140) (80) 0 0
Depreciation on CAPX After Start-up (30) (30) (30) (30) (30)
(90) (90) (90) (90)(40) (40) (40)
(30) (120) (160) (160) (160)
Total Depreciation (20) (60) (120) (200) (200) (210) (260) (240) (160) (160)
21