Embed Size (px)
Citation preview

Business Analytics Software
Decisions drive better outcomes through predictive analyticsIBM SPSS Product Catalog

2
Table of Contents
Introduction to predictive analytics The Data Analysis Path to Success .................... .........................................................4 The SPSS end-to-end story
Get More Value with Every Release ..................... ....................................................... 6 See what you’ll gain when you upgrade from an earlier version of IBM SPSS Statistics
IBM® SPSS® Statistics .......................................... ............................................................ 8 Analyze data with the world’s leading statistical software
Most popular products IBM® SPSS® Statistics Base .........................................................................................10 Your first choice for data analysis
IBM® SPSS® Data Preparation .....................................................................................13 Improve data preparation for more accurate results
IBM® SPSS® Decision Trees ............................... ...........................................................15 Create classification trees for better identification of groups and relationships
IBM® SPSS® Custom Tables ............................... ........................................................... 17 Analyze data easily and communicate results effectively
IBM® SPSS® Advanced Statistics ...................... ..........................................................19 Use powerful techniques to analyze complex data
IBM® SPSS® Regression ..................................... ............................................................21 Make better predictions using regression procedures
IBM® SPSS® Missing Values ............................... ..........................................................23 Build better models when you fill in the blanks
IBM® SPSS® Forecasting .................................... ...........................................................25 Build expert time-series forecasts—in a flash
Special-purpose products IBM® SPSS® Bootstrapping ................................ .......................................................... 27 Ensure the stability of your models
IBM® SPSS® Complex Samples ......................... .........................................................29 Correctly and easily compute statistics for complex samples
IBM® SPSS® Statistics Server ............................ ..........................................................31 Analyze “big data” and data in dispersed organizations
IBM® SPSS® Direct Marketing ............................ .........................................................32 Easily identify the right contacts and improve campaigns
IBM® SPSS® Developer ...................................... ............................................................33 Complete flexibility to build customized functionality and procedures in R® or
Python® your way
IBM® SPSS® Neural Networks ............................ .........................................................34 Discover complex relationships in your data more easily
IBM® SPSS® Visualization Designer ................... .......................................................35 Easily create and share customized visualizations
IBM® SPSS® Exact Tests .................................... ...........................................................36 Reach accurate conclusions with small samples or rare occurrences
IBM® SPSS® Categories ..................................... ........................................................... 37 Predict outcomes and reveal relationships through perceptual maps of
categorical data
IBM® SPSS® Conjoint ......................................... .............................................................39 Discover what drives your customers’ purchase decisions
IBM® SPSS® Data Collection .........................................................................................41 A faster, more effective way to collect and manage survey research data
IBM® Social Media Analytics ........... ............................................................................42 Create relationships. Build advocacy. Improve loyalty.
IBM® Cognos® Insight ........... .........................................................................................45 Personal analytics freedom—without compromise.
IBM® Analytic Answers ........... .......................................................................................47 Cloud-based predictive insights for nontechnical business users
Complementary products IBM® SPSS® Text Analytics for Surveys ............ .......................................................49 Easily make your survey text responses usable in quantitative analysis
IBM® SPSS® SamplePower® .............................. ............................................................51 Save time, effort and money by finding the appropriate sample size for your study
IBM® SPSS® Amos ........................................... ................................................................53 Get your research noticed—take your analysis to the next level
Data mining and modeling IBM® SPSS® Modeler .......................................... ............................................................55 Solve your toughest challenges with data mining
IBM® SPSS® Modeler Premium .......................... ......................................................... 57 Improve model accuracy with unstructured data
IBM® SPSS® Modeler Professional .................... ........................................................59 Make better decisions through predictive intelligence
To order, call 1-800-543-2185 | ibm.com/spss

3 To order, call 1-800-543-2185 | ibm.com/spss
Who uses IBM SPSS analytics?Businesses use analytics for…• Sales and marketing forecasting and budgeting• Database and direct marketing• Product attribute testing• New product development• Financial account balancing• Risk and credit management• Customer and employee satisfaction surveys• Planning for facility and staffing resources• Market basket analysis• Operational excellence• …and more
Colleges and universities use analytics for…• Teaching and student assessment• Administration• Enrollment management• Alumni development• Research• …and more
Schools and school districts use analytics for…• Student assessment• Program assessment• Community and staff surveys• Planning and budgeting• Facility maintenance scheduling• …and more
Government agencies use analytics for…• Human Capital Management• Program evaluation• Community and employee surveys• Fighting crime and protecting public safety• Promoting public health• Preventing fraud, waste and abuse• Environmental impact studies• …and more
Medical and healthcare organizations use analytics for… • Evidence-based medicine • Treatment outcome analysis • Behavioral and biomedical research • Outcome management • …and more

4 To order, call 1-800-543-2185 | ibm.com/spss
Follow the Path to Improved Outcomes through Predictive AnalyticsCAPTURE information, PREDICT outcomes and ACT on insights
outcomes. Specific benefits to your business include the ability to To get the answers you need for successful decision making, it’s impor-tant to follow all the steps in the data analysis process—and using the right data analysis tools along the way will help you arrive at those deci-sions faster and more accurately.
When your organization follows the analytical path illustrated here, you will benefit in a number of ways. You’ll gain a better understanding of your current situation, be able to consider the most appropriate options, predict what is likely to happen next and take actions to improve
acquire, grow and retain customers; reduce costs; minimize risk and fraud; and improve efficiency.
IBM SPSS predictive analytics products are delivered in an easy-to-integrate, open technology platform. So take a look at how you can turn your organization’s data into a strategic asset that gives your orga-nization a competitive advantage.
Planning• IBM SPSS SamplePower
• IBM SPSS Complex Samples
• IBM SPSS Conjoint
Reporting• IBM SPSS Statistics Base
• IBM SPSS Custom Tables
• IBM SPSS Modeler
• IBM SPSS Visualization Designer
• IBM SPSS Data Collection
Data Analysis• IBM SPSS Statistics Base
• IBM SPSS Amos
• IBM SPSS Advanced Statistics
• IBM SPSS Bootstrapping
• IBM SPSS Categories
• IBM SPSS Direct Marketing
• IBM SPSS Exact Tests
• IBM SPSS Forecasting
• IBM SPSS Modeler
• IBM SPSS Neural Networks
• IBM SPSS Regression
• IBM Social Media Analytics
• IBM Cognos Insight
• IBM Analytic Answers
Deployment• IBM SPSS Collaboration
and Deployment Services
Data Managementand Preparation• IBM SPSS Statistics Base
• IBM SPSS Data Preparation
• IBM SPSS Missing Values
• IBM SPSS Text Analytics for Surveys
• IBM SPSS Modeler Professional
• IBM SPSS Modeler Premium
Data Access• IBM SPSS Statistics Base
• IBM SPSS Modeler
• All Modules
Data Collection• IBM SPSS Data Collection
Web Interviews
• IBM SPSS Data Collection
Data Entry

5 To order, call 1-800-543-2185 | ibm.com/spss
Rely on IBM SPSS products at every stage of the analytical process
1. Planning Beginning with the end result in mind, the first steps are to set objectives, identify data sources and carefully craft the process. Products:
• IBM SPSS SamplePower• IBM SPSS Conjoint• IBM SPSS Complex Samples
2. Data collection Data is collected through surveys, online activity, call centers and more. Products:
• IBM SPSS Data Collection Web Interviews• IBM SPSS Data Collection Data Entry
3. Data access Data is brought in from available sources, using ODBC or direct file input. Products:
• IBM SPSS Statistics Base• All modules
4. Data management and data preparation Data is reviewed for suspicious, invalid, or missing cases, variables and data values. Products:
• IBM SPSS Statistics Base• IBM SPSS Data Preparation• IBM SPSS Missing Values• IBM SPSS Text Analytics for Surveys• IBM SPSS Modeler Professional
5. Data analysisIn this step, the data is examined, tested, explored and transformed. Pat-terns are identified, hypotheses are tested and information is extracted.
Products for understanding data:• IBM SPSS Statistics Base• IBM SPSS Data Preparation• IBM SPSS Complex Samples• IBM SPSS Modeler
Products for predicting numerical outcomes:• IBM SPSS Statistics Base• IBM SPSS Regression• IBM SPSS Advanced Statistics• IBM SPSS Complex Samples• IBM SPSS Neural Networks• IBM SPSS Amos• IBM SPSS Modeler
Products for identifying groups:• IBM SPSS Statistics Base• IBM SPSS Direct Marketing• IBM SPSS Regression• IBM SPSS Advanced Statistics• IBM SPSS Complex Samples• IBM SPSS Custom Tables• IBM SPSS Categories• IBM SPSS Decision Trees• IBM SPSS Exact Tests• IBM SPSS Neural Networks• IBM SPSS Modeler
Product for forecasting time-series data:• IBM SPSS Forecasting
6. Reporting Data is summarized, put in tables and charts and ready for consumption. Products:
• IBM SPSS Statistics Base• IBM SPSS Custom Tables• IBM SPSS Visualization Designer• IBM SPSS Data Collection
7. Deployment Data, reports and procedures are distributed to end users globally, with interaction and access managed centrally. Products:
• IBM SPSS Collaboration and Deployment Services
8. Success! Take a moment to celebrate—you’ve done it! But now it’s back to plan-ning how to maintain your competitive advantage—once again using IBM SPSS products to help you reach the next level of success.

6 To order, call 1-800-543-2185 | ibm.com/spss
Get More Value with Every Release of IBM SPSS StatisticsWe continually update our IBM SPSS Statistics product family to deliver the power, versatility and ease of use you need to address your toughest analytical challenges. With each release, we add new procedures, features and platform support to help you work faster and more effectively.
If you’re using an earlier version of IBM SPSS Statistics, you’ll gain all of these productivity-boosting features—and many more
What’s new in version 22IBM SPSS Statistics 22 continues to increase accessibility to predic-tive analytics techniques through improved tools, output and ease-of-use features. This release focuses on increasing the analytic capabilities of the software through:
• Ability to make your output easily consumable – View interactive SPSS Statistics output on smart devices (smartphones, tablets, etc.)
– Produce presentation or publication-ready output that is easy for audiences to understand ˚ Select and modify objects within a table ˚ Apply colors to columns or rows (including gradation across
rows/columns) to emphasize key findings ˚ Change the color, font, size, background color and other
table text attributes ˚ Use conditional styling to highlight selected cell(s) based on
the value or significance values of tests ˚ Index, hide, show or delete table objects ˚ Apply a Table Look to a table
• Enhanced Monte Carlo simulation to improve model accuracy – Ability to fit a categorical distribution to string fields – Support for Automatic Linear Modeling (ALM) – Generate heat maps automatically when displaying scatter-plots in which the target or the input, or both, are categorical
– Automatically determine and use associations between cat-egorical inputs when generating data for those inputs
– Generating data in the absence of a predictive model
• Providing faster performance with increased productivity and effec-tiveness using a range of specialized techniques
– Find features faster on a new startup screen – Improve performance and scalability using SPSS Statistics Server with SQL push back
– Greater resilience of Statistics Server in the event of network failures
– Asynchronous reading of data to get data to the procedures faster
– Improvements to importing/exporting from/to database – ODBC pooling for more reliable database connections – Make custom programming easier by simplifying the installa-tion of extensions within SPSS Statistics
– Use a simplified method to specify user-defined estimands in SPSS Amos
– Benefit from Improved logging support for Enterprise Standard in the Platform Standards
– Enable other applications to read/write encrypted Statistics data files with i/o dll
– Generate pivot table output for nonparametric procedures

7 To order, call 1-800-543-2185 | ibm.com/spss
Added in IBM SPSS Statistics 21• Monte Carlo simulation for building better models to uncertain inputs• Ability to compare two data files or data sets to ensure the data
values and records are compatible• Password protection of data and output files (encryption) to prevent
others from seeing confidential information• Improved and faster file merging
• Two datasets or files can be compared in SPSS Statistics• Improvements to pivot tables in SPSS Statistics• Improved storage space by compressing the data file in SPSS
Statistics• Integration of the Java programming language through the SPSS
Statistics Programmability Extension• Load balancing through SPSS Collaboration and Deployment
Services improves scalability and performance in SPSS Statistics Server
• Single sign-on between the SPSS Statistics client and SPSS Statistics Server
• Improved security enables SPSS Server to run as non-root on Unix/Linux
• Client and server software can be on different release levels• Easier model specification in SPSS Amos• Improved and faster file merging in SPSS Statistics• Export output to Excel 2007/2010 (.xlsx)• Pivot table output for Generalized Linear Mixed Models in SPSS
Advanced Statistics• Improved usability with one-click descriptive information from the
data editor
Added in IBM SPSS Statistics 20• Pre-built map templates and support for ESRI files in SPSS Statistics
Base• Faster pivot table output• GLMM procedure in IBM SPSS Advanced Statistics can be run with
ordinal values• Non-graphical, programmatic method for specifying models in IBM
SPSS Amos• Run IBM SPSS Statistics Server jobs offline by disconnecting the
SPSS Statistics client.• Compress temporary files created by the sort procedure within
SPSS Statistics Server to save disk space when sorting large files.
Added in IBM SPSS Statistics 19• Automatic Linear Models (ALM) gives non-specialist users the tools
to build powerful linear models automatically and predict numerical outcomes
• Generalized Linear Mixed Models (GLMM), in SPSS Advanced Sta-tistics, lets you create more-accurate models for predicting nonlinear outcomes based on hierarchical/nested data or data that includes repeated measures
• Several new capabilities in IBM SPSS Direct Marketing• Faster performing tables in SPSS Statistics Base• More than a dozen performance and ease-of-use enhancements to
the Syntax Editor, available in all products in the IBM SPSS Statistics family
• The Statistics portal provides internal or external users with interac-tive online access to analysis (requires SPSS Statistics Server and SPSS Collaboration and Deployment Services)
• Compiled transformations is a feature in SPSS Statistics Server that improves the performance of SPSS Statistics programs that execute a large number of data transformations
• Analysts using SPSS Statistics Base can score customer data, access pre-built models and interface directly with data in Salesforce.com
• Pivot columns and cross-tabulations in SPSS Statistics Base and SPSS Custom Tables
• Work with smaller and sparse datasets on Linux and Mac operating systems in SPSS Exact Tests
• Run SPSS Statistics Base Server on IBM System z (requires SUSE Linux)
Added in IBM SPSS Statistics 18• Prepare data in a single step using the new Automated Data Prepa-
ration feature• New Nonparametric tests in IBM SPSS Statistics Base• Post computed categories in IBM SPSS Custom Tables• IBM SPSS Direct Marketing Module• IBM SPSS Bootstrapping Module• Rule checking on Secondary SPC Charts • IBM SPSS Statistics Developer• Ability to view significance tests in the main results table in IBM
SPSS Custom Tables• Interactive Model Viewer on Two-Step Cluster Analysis and Auto-
mated Data Preparation procedures• Improved display of large pivot tables• Improved performance on procedures within IBM SPSS Statistics
Base Server for Frequencies, Descriptives, Cross-tabs• Support for 64-bit hardware on desktop for Windows and Mac• Support for Snow Leopard on Mac OS X 10.6

8 To order, call 1-800-543-2185 | ibm.com/spss
IBM® SPSS® StatisticsAnalyze data with the world’s leading statistical software
With IBM SPSS Statistics, you can:• Easily access, manage and analyze any kind of dataset• Gain reliable results with a broad range of tests and procedures• Report results in easy-to-understand formats
Whether you are a beginner or an experienced analyst or statistician, IBM SPSS Statistics puts the power of advanced statistical analysis in your hands.
Solves business and research problems IBM SPSS Statistics offers superior capabilities, flexibility and usability that are not available in traditional statistical software.
Organizations around the world rely on it to:
• Identify which customers are likely to respond to specific promo-tional offers
• Forecast future trends to better plan organizational strategies, logis-tics and manufacturing processes
• Detect fraud and minimize business risk • Report test and program results to the government and other regu-
latory agencies • Identify groups, discover relationships between groups and predict
future events
Improves the entire analytical process IBM SPSS Statistics addresses the entire analytical process from plan-ning and data preparation to analysis, reporting and deployment. It enables you to get a quick look at your data, formulate hypotheses for additional testing and then carry out a number of statistical and analytic procedures to help clarify relationships between variables, create clus-ters, identify trends and make predictions.
Quickly access and analyze massive datasets IBM SPSS Statistics makes it easy for you to quickly access, manage and analyze any kind of dataset, including survey data, corporate data-bases or data downloaded from the Web. It can also process Unicode data, enabling your organization to view, analyze and share data writ-ten in multiple languages.
Prepare your data in a flashWith IBM SPSS Statistics, you can prepare data for analysis quickly and easily. Eliminate the time-consuming task of labeling all your data by creating your labels once and applying them to your entire data-set. Make sure your data is clear and organized properly for analysis by automatically identifying duplicate cases.
In addition, Visual Binning allows you to easily create bands (such as breaking income into bins of 10,000 or ages into demographic groups). A histogram then enables you to interactively create cut points and automatically create data value labels for them.
Powerful statistics for better analysisIBM SPSS Statistics includes an extensive variety of procedures for descriptive analysis, numerical prediction, group identification and forecasting that help you quickly generate the most accurate results for specific data types. And through the IBM SPSS Statistics Program-mability Extension, users can create procedures in third-party program-ming languages such as Python, Microsoft .NET and Java, as well as access and use the many statistical procedures written in R.
Easy, flexible reporting optionsIBM SPSS Statistics makes it easy to integrate your output into your reports by enabling you to automatically export results into Microsoft Word, PowerPoint and Excel (including Excel 2010), and as a PDF. In addition, through the Custom Dialog Builder, you can create proce-dures and make them available to others, making it easier to ensure that all analyses are performed correctly.
Specifications: System Requirements
For IBM SPSS Statistics for Windows• Operating system: Microsoft Windows XP (Professional,
32-bit) or Vista (Home, Business, 32- or 64-bit), Windows 7 (32- or 64-bit)
• Hardware – Intel or AMD x86 processor
running at 1 GHz or higher – Memory: 1 GB or more
recommended – Minimum free drive space:
800 MB* – DVD drive – Super VGA (800x600) or higher-resolution monitor – For connecting with an IBM SPSS Statistics Server, a
network adapter running the TCP/IP network protocol
For IBM SPSS Statistics for MAC• Operating system
– Apple Mac 10.6x (Snow Leopard) and 10.7 (Lion)• Hardware
– Intel processor (32- and 64-bit) – Memory: 1 GB or more
recommended – Minimum free drive space: 800 MB* – DVD drive – Super VGA (800x600) or a
higher-resolution monitor• Browser
– Web browser: Mozilla Firefox 2.x and 3.x
IBM SPSS Statistics 19 for Linux• Operating system: Any Linux OS SPSS Statistics was tested
on and is supported on only Red Hat Enterprise Linux 5 and 6 and Debian 6. We do not expect any problems with distri-butions derived from Red
• Hat and Debian, but we do not test or support them.• Browser
– Mozilla Firefox 2.X and 3.X
* Installing Help in all languages requires 1.1 GB free drive space

9 To order, call 1-800-543-2185 | ibm.com/spss
First Tennessee Bank Sharpens Marketing Focus with IBM® SPSS® Predictive Analytics
First Tennessee Bank, a Memphis-based bank with more than $25 bil-lion in assets, also suspected it was wasting money on inefficient mar-keting campaigns, which typically focused on products, not customers. “You could say we were throwing our messages away,” says Tanner Mueller, First Tennessee’s Direct Marketing Database Manager.
Once it settled on SPSS, First Tennessee built a model that examined each customer’s monthly transactions and behavioral data. To gain his-torical perspective, it had SPSS Modeler analyze two years’ worth of marketing ROI and customer response data. From this analysis, First Tennessee was able to determine historically high-, under-, and non-performing segments. This, in turn, helped the bank develop new mar-keting campaigns designed to both enhance revenue and reduce costs.
The new Modeler-driven campaigns showed positive results right from the start: customer response rates rose 3.1 percent and mail costs declined 20 percent—equating to a 600 percent return on investment. And because its forecasts are more accurate now, the staff has had to hold fewer planning meetings. “We’ve reached the point now where everyone knows we can get better results using Modeler versus tra-ditional segmentation approaches.”
Ultimately, First Tennessee sees predictive analytics as an effective way to bring the bank closer to its customers. “First Tennessee prom-ises our customers that we will be there for them, that we will power their dreams,” says Dan Marks, chief marketing officer. “One of the most exciting things for me is that Modeler allows us to understand our customers better than we ever did before and optimize our con-versations with them in a way that’s a winwin—profitable for us and relevant for our customers.”

10 To order, call 1-800-543-2185 | ibm.com/spss
IBM® SPSS® Statistics BaseYour first choice for data analysis
With IBM SPSS Statistics Base, you can:• Quickly access and manage data• Get a “first look” through descriptive statistics• Perform fundamental tests to classify data, uncover
relationships and make predictions
You can take the analytical process from start to finish with IBM SPSS Statistics Base. In addition to the data preparation, data management, output management and charting features now available in all IBM SPSS Statistics modules, IBM SPSS Statistics Base offers the most frequently used procedures for statistical analysis—the fundamental toolset that every analyst should have.
A company generates heat maps to determine whether customer satisfaction levels extracted from social media data have an impact on its monthly sales target of USD7 million. When the satisfaction level is “Neutral,” the monthly sales numbers are spread roughly evenly around the sales target. However, when the social media satisfaction level is “Somewhat Positive,” the sales distribution shifts so that the bulk of the distribution (for that satisfaction level) exceeds the target. This suggests that customer satisfaction level as measured by social media data are an integral part of achieving a sales target.
These procedures will enable you to get a quick look at your data, for-mulate hypotheses for additional testing and then carry out a number of procedures to help clarify relationships between variables, create clusters, identify trends and make predictions.
SPSS Statistics Base even offers Monte-Carlo Simulation techniques to build better models and assess risk when inputs are uncertain.
Get a quick data “snapshot”You can quickly understand the basic structure of your data through the foundational statistics in IBM SPSS Statistics Base. These include cross-tabulations, frequencies, descriptives, descriptive ratio statistics, ANOVA and ANCOVA, correlation and the procedures for comparing means and exploring data.
Make better decisions using Monte-Carlo Simulation SPSS Statistics combines the power of predictive analytics with the what-if capabilities of Monte-Carlo Simulation to help you assess risk and deal with uncertainty in predictive models.
• Assess “what if” scenarios• Simulate data according to user-specified parameters, and then use
that simulated data as input to predict an outcome• Adjust the parameters used to simulate the data and compare
outcomes
Start with your existing models and data With SPSS Statistics, you don’t need to specify your entire model. You can use your existing predictive models and data as the starting points for your simulation. The predictive models can be built in SPSS Statistics or SPSS Modeler, and can be used to specify the strength of the inputs. SPSS Statistics can use existing similar data you have to fit the distri-bution of the inputs and the correction of the inputs automatically.
You can also modify the parameters used to simulate the data and com-pare outcomes. For example, you may want to simulate various advertis-ing budget amounts and see how that affects total sales. Depending on the outcome of the simulation, you might decide to spend more on advertising to meet your total sales goal.
When the existing data is inadequate, create simulated data sets based on existing data, known parameters or both.
Download datasheet and full specification

11 To order, call 1-800-543-2185 | ibm.com/spss
Map relationships in your dataIBM SPSS Statistics Base also includes a number of procedures to help you identify groups and predict outcomes. These procedures include:
• Factor analysis• K-means Cluster Analysis• Hierarchical Cluster Analysis• Two-Step Cluster Analysis• Discriminant analysis• Linear regression• Ordinal regression (also called PLUM)• Nearest Neighbor analysis
With SPSS Statistics v22, you can take your SPSS Statistics charts and tables wherever you go and make decisions anytime, anywhere. The latest release enables you to view output on the following platforms and devices without the need for a dedicated Smart Reader or other application:
• Windows, Mac and Linux desktop environments• iPod, iPhone and iPad• Android phones and tablets (versions 2.1 and above)• Windows 8 devices
Even if you use one or more of the other modules in the IBM SPSS Statistics family for specific kinds of analysis, IBM SPSS Statistics Base will continue to form the basis of many deployments, since it contains statistical tests and procedures that are fundamental to many analyses.
The Data Editor makes it easy to manage data from IBM SPSS Statistics and IBM SPSS Data Collection files, as well as text files and data from other applications and databases.
Move from analytics to predictive analytics The top five benefits of using IBM SPSS Statistics and IBM SPSS Modeler together:
• Move seamlessly between the two products• Include more types of data, including text, in your analyses• Tap into a wealth of modeling algorithms, plus automatic modeling• Test multiple modeling techniques on any issue—easily• Use a visual, secure, repeatable process
Ask your sales representative to show you how you can benefit.
12 To order, call 1-800-543-2185 | ibm.com/spss
“ Automatic Linear Models (ALM) is a great procedure for handling modeling of data—this is something we can add to our list of tools we can now offer our clients. While ALM is the feature I liked best, the faster table rendering will likely have the biggest impact on our business given the large amount of IBM SPSS Statistics output we produce, most of which uses IBM SPSS Custom Tables functionality.” —Brian Robertson, PhD Director of Research, Market Decisions
Specifications: Key Features
Descriptive statistics• Cross-tabulations• Frequencies; Descriptives; Explore; Descriptive ratio
statistics
Bivariate statistics• Means; t tests; ANOVA; Correlation (Bivariate, Partial, Dis-
tances); and Non-parametric tests
Prediction for numerical outcomes and identifying groups• Factor Analysis• K-means Cluster Analysis• Hierarchical Cluster Analysis• Two-Step Cluster Analysis• Discriminant• Linear Regression• Ordinal regression—PLUM• Multithreaded algorithms: SORT, correlation, partial correla-
tion, linear regression, factor analysis• Nearest Neighbor analysis, which can be used for predic-
tion or for classification• Non-parametric tests provide multiple comparisons and
perform efficiently on large datasets• New! Monte-Carlo Simulation• Data Editor
– Configure attributes, so that some can be hidden – Spell check value labels and variable labels – Sort by variable name, type, format, etc. – Use Find and Replace functionality
• Easily eliminate duplicate records with the Identify Duplicate Cases tool
• Make sense and keep track of your data files by adding notes to them with the Data File Comments command
• Create read-only datasets• More accurately describe your data using longer variable
names (up to 64 bytes)• Create value labels up to 120 characters• Clone or duplicate datasets• Apply an extended Variable Properties command to cus-
tomize properties for individual users• Longer text strings (up to 32,000 bytes)• Define Variables Properties tool• Right click on the variable to choose its descriptive statistics• Copy Data Properties tool• Data Restructure Wizard• Aggregate data to external or to the active data file• Automatically convert string variables to numeric with
Autorecode – Spell-checking of long text strings
• Date and Time Wizard: – Easily work with data containing time and dates in IBM
SPSS Statistics – Create a time/date variable from a string containing a
date variable – Create a time/date variable from variables that include
individual date units, such as month or year – Calculate times and dates – Separate a date unit from a time/date variable
• Apply splitters in the Data Editor for easier viewing of wide or long data files
• Create your own dictionary information for variables by using Custom Attributes
• Customize the viewing of extremely wide files with Variable Sets
• Use syntax to change string length and basic data type• Set a permanent default working directory
Transformations• Easily find and replace text strings in your data using the
find/replace function• Recode string or numeric value• Recode values into consecutive integers• Create conditional transformations using DO IF, ELSE IF,
ELSE and END IF statements• Use programming structures, such as do repeat-end
repeat, loop-end loop and vectors• Compute variables using arithmetic, cross-case, date and
time, logical, missing-value, random-number, statistical or string functions
• Create variables that contain the values of existing variables from preceding or subsequent cases
• Count occurrences of values across variables• Make transformations permanent or temporary• Execute transformations immediately, batched or on demand
Reporting• Reports
– OLAP cubes – Case summaries – Report summaries
Graphs• Categorical charts
– 3-D Bar: Simple, cluster and stacked – Bar: Simple, cluster, stacked, dropped shadow and 3-D – Line: Simple, multiple and drop-line – Area: Simple and stacked – Pie: Simple, exploding and 3-D effect – High-low: High-low-close, difference area and range bar – Box plot: Simple and clustered – Error bar: Simple and clustered – Error bars: Add to bar, line and area charts; and confi-
dence level, S.D or S.E. – Dual-Y axes and overlay
• Scatterplots – Simple, grouped, scatterplot matrix and 3-D – Fit lines: Linear, quadratic, or cubic regression; Lowess
smoother; confidence interval control; and for total or subgroups, display spikes to line
– Bin points by color or marker size to prevent overlap• Density charts
– Population pyramids: Mirrored axis to compare distribu-tions, with or without normal curve
– Dot charts: Stacked dots show distribution; symmetric, stacked and linear
– Histograms: With or without normal curve; custom binning options
• Quality control charts – Pareto, X-Bar, range, Sigma, individual chart or moving
range chart – Rule-checking performed on primary and secondary
charts – Automatic flagging of points that violate Shewhart rules,
the ability to turn off rules and the ability to suppress charts
• Diagnostic and exploratory charts – Case plots and time-series plots – Probability plots – Autocorrelation and partial autocorrelation function plots – Cross-correlation function plots – Receiver-Operating Characteristics
• Multiple use charts – 2-D line charts (with 2 scale axes) – Charts for multiple response sets
• Custom charts – Graphics Production Language (GPL), a custom chart
creation language, enables advanced users to attain a broader range of chart and option possibilities than the interface supports to create mixed charts and more
• Layout options – Paneled charts: Create a table of subcharts, one panel
per level or condition; multiple row and columns – 3-D effects: Rotate, modify depth and display
backplanes.• Chart templates
– Save selected characteristics of a chart and apply them to others automatically
– Apply the following attributes at creation or edit time: Layout, titles, footnotes and annotations; chart element styles; data element styles; axis scale range; axis scale settings; fit and reference lines; and scatterplot point binning
– Tree-view layout and finer control of template bundles
System requirements Please see p. 8 for complete system requirements

13 To order, call 1-800-543-2185 | ibm.com/spss
IBM® SPSS® Data PreparationImprove data preparation for more accurate results
With IBM SPSS Data Preparation, you can:• Streamline the data preparation process• Eliminate labor-intensive manual checks• Reach more accurate conclusions
IBM SPSS Data Preparation enables you to easily identify suspicious and invalid cases, variables and data values; view patterns of missing data; and summaries variable distributions. You can streamline the data preparation process so that you can get ready for analysis faster and reach more accurate conclusions.
Prepare data in a single step—automaticallyManual data preparation is a complex and time-consuming process. When you need results quickly, the Automated Data Preparation (ADP) procedure helps you detect and correct quality errors and impute miss-ing values in one efficient step. The ADP feature provides an easy-to-understand report with complete recommendations and visualizations to help you determine the right data to use in your analysis.
Additional options for data preparationPerform automatic data checks Eliminate time-consuming, tedious, manual checks by using the Validate Data procedure. This procedure enables you to apply rules to perform data checks based on each vari-able’s measure level (whether categorical or continuous). Then, deter-mine data validity and remove or correct suspicious cases at your discretion prior to analysis.
Quickly find multivariate outliersEasily detect multivariate outliers so you can further examine them and determine if they should be included in your analyses. The Anom-aly Detection procedure searches for unusual cases based upon devi-ation, enabling you to flag outliers by creating a new variable.
Bin or set cut points for scale variablesWith the Optimal Binning procedure, you can more accurately use algorithms designed for nominal attributes (such as Naïve Bayes and logit models). Optimal Binning enables you to bin—or set cutpoints for—scale variables. Select from three types of optimal binning for preprocessing data prior to model building:
• Unsupervised: Create bins with equal counts• Supervised: Take the target variable into account to determine cut-
points. This method is more accurate than unsupervised; however, it is also more computationally intensive.
• Hybrid approach: Combines the unsupervised and supervised approaches. This method is particularly useful if you have a large amount of distinct values.
Specifications
Key FeaturesAutomated Data Preparation
• Recommends steps to speed up model building and improve predictive power
• Determine objective, prepare dates and times for modeling, exclude low-quality input fields, prepare fields to improve data quality, rescale fields, continuous input and target fields, transform fields, perform feature selection and con-struction, name fields and apply transformations to data
Validate dataValidate data in the working data file
• Basic checks: – Maximum percent of missing values, single category
cases and cases with a count of 1 – Minimum coefficient of variation – Minimum standard deviation – Flag incomplete IDs, duplicate IDs and empty cases
• Standard rules: Describe the data, view single variable rules and apply them to analysis variables
– Description of data ˚ Distribution: Shows a thumbnail-size bar chart for
categorical variables or histogram for scale variables ˚ Min./max. data values shown
– Single-variable rules: ˚ Apply rules to identify missing or invalid values ˚ User-defined
• Custom rules: Define cross-variable rule expressions in which respondents’ answers violate logic
• Output: Reports for invalid data – Casewise report, specify by case
˚ Specify the minimum number of violations needed for a case
˚ Specify the maximum number of cases in the report – Standard validation rules reports
˚ Summarize violations by analysis variable and rule ˚ Display descriptive statistics
• Save: Save variables that record rule violations and use them to clean data and filter out bad cases
– Summary variables: ˚ Empty case indicator ˚ Duplicate ID indicator ˚ Incomplete ID indicator ˚ Validation rule violation
– Indicator variables that record all validation rule violations
Play a quick demo Download datasheet and full specification

14 To order, call 1-800-543-2185 | ibm.com/spss
Identify suspicious or invalid cases, variables and data values easily with IBM SPSS Data Preparation
Variables tab: The Validate Data dialog is used to validate your data. The Variables tab shows variables in your file. Start by selecting the variables you are interested in and moving them to the Analysis Variables list.
Basic checks: You can specify basic checks to apply to variables and cases in your file. For example, you can obtain reports that identify variables with a high percentage of missing values or empty cases.
Standard rules: Apply rules to individual variables that identify invalid values, such as values outside a valid range or missing values.
Define standard rules: The Validate Data dialog lets you create your own rules or apply predefined rules.
Define custom rules: Create cross-variable rules in which respondents’ answers violate logic (such as “pregnant males”).
Recommendations: Automated Data Preparation delivers recommendations and allows users to drill in and examine the recommendations.
Specifications
Identify unusual casesAnomaly Detection searches for unusual cases, based upon deviations from peer group, and reasons for deviations
• VARIABLES subcommand: Specify categorical, continuous and ID variables, and list variables that are excluded from the analysis
• HANDLEMISSING subcommand: Specify the methods of handling missing values in this procedure
• The CRITERIA subcommand specifies the following settings:
– Number of peer groups – Adjustment weight on the measurement level – Number of reasons in the anomaly list – Percentage and number of cases considered as anoma-
lies and included in the anomaly list – Cut point of the anomaly index to determine whether a
case is considered as an anomaly • Save additional variables to the working data file including:
– Anomaly index – Peer group ID, size and size in percentage – Variable, variable impact measure, variable value and
norm value associated with a reason • OUTFILE subcommand: Write a model to a filename as XML
• PRINT subcommand prints: – Case-processing summary – Anomaly index list, anomaly peer ID list and anomaly
reason list – The Continuous Variable Norms table, for continuous
variable, and the Categorical Variable Norms, for cat-egorical variable
– Anomaly Index Summary – Reason Summary Table
Optimal Binning Preprocess data with Optimal Binning. Categorizes one or more continuous variables by distributing the values of each into bins
• Select from the following methods: – Unsupervised binning via the equal frequency algorithm.
It uses the equal frequency algorithm to discretize the binning input variables. Guide variable not required.
– Supervised binning via the MDLP (Minimal Description Length Principle) algorithm. Discretizes binning input variables using the MDLP algorithm without any preprocessing. Ideal for small datasets. Guide variable required.
– Hybrid MDLP binning. Involves preprocessing via the equal frequency algorithm, followed by the MDLP algo-rithm. Ideal for large datasets. Guide variable required.
• Specify the following criteria: – How to define the minimum and maximum cut point for
each binning input variable, and the lower limit of an interval
– Whether to force-merge sparsely populated bins – Whether missing values uses
listwise or pairwise deletion• Save new variables with binned values and syntax to an
IBM SPSS Statistics syntax file• PRINT subcommand prints:
– The binning input variables’ cut point sets – Descriptive information for all binning input variables – Model entropy for binned variables
System requirements • Requirements vary according to platform
Available on the following platforms: Windows, Mac, Linux

15 To order, call 1-800-543-2185 | ibm.com/spss
IBM® SPSS® Decision TreesCreate classification trees for better identification of groups and relationships
IBM SPSS Decision Trees creates classification and decision trees to identify groups, discover relationships and predict future events. By cre-ating visual trees, you are able to present results in an intuitive manner—so you can more clearly explain results to nontechnical audiences.
Why IBM SPSS Decision Trees should be added to your desktop:
• Identify groups, segments and patterns in a highly visual manner with classification trees
• Choose from CHAID, Exhaustive CHAID, C&RT and QUEST to find the best fit for your data
• Present results in an intuitive manner—perfect for nontechnical audiences
• Save information from trees as new variables in data (information such as terminal node number, predicted value and predicted probabilities)
With IBM SPSS Decision Trees, you can:• Create classification trees using your choice of algorithms• Identify patterns, segments and groups in your data• Choose from four established tree-growing algorithms
Play a quick demo Download datasheet and full specification
Harnessing Statistics to Combat CrimePredictive Analytics helps Memphis Police Department pinpoint crime and focus police resources
The Memphis Police Department saw an opportunity to better under-stand and fight criminal activity by mining the department’s huge dig-ital repository of crime records and police reports. By identifying crime patterns by time and location, the department would be able to pinpoint
“hot spots” of activity and better deploy police details to deter crime.
The department turned to IBM® SPSS® predictive analytics to chart and analyze crime patterns and develop effective strategies for reducing crime rates while optimizing police manpower and resources.
The MPD routinely uses the software to uncover trends and pinpoint “hot spots” of criminal activity, taking advantage of IBM SPSS Statistics to slice and dice the data in virtually unlimited ways. To help officers visualize these hot spots, analysts feed SPSS data into a geographi-cal information system from ESRI ArcGIS, creating color-coded maps that display crime patterns across the city in vivid detail. Because the analytics software is designed for easy integration with other applica-tions and platforms, transferring data into ArcGIS is seamless (and painless), analysts say.
“On short notice, we’re able to shift officers to a particu-lar ward, on a particular day, right down to the shift level,” says MPD Director Godwin. “It’s a bit like a chess match, and [the IBM SPSS solution] is enabling us to make arrests we never could have before.”
Since the program was launched, the number of Part One crimes—a category of serious offenses including homicide, rape, aggravated assault, auto theft and larceny—has plummeted, dropping 27 per-cent from 2006 to 2010. Intelligent positioning of resources has been a major factor in the decline, helping to deter criminal activity by having more officers patrolling the right area at the right time on the right day.

16 To order, call 1-800-543-2185 | ibm.com/spss
Uncover patterns in your data with powerful tree-growing algorithmsThe four algorithms in this module differ from more traditional statistics, such as logistic regression, because these algorithms produce trees that enable you to explore your results and visually deter-mine how your model flows. IBM SPSS Decision Trees makes it easier to identify specific sub-groups and relationships in your data than if more traditional statistics were used. It breaks your data into branches and nodes, so you can easily see where a group splits and terminates.
IBM SPSS Decision Trees includes four established tree-growing algorithms. Find the best fit for your data by trying different algorithms or let IBM SPSS Decision Trees suggest the most appropriate algorithm.
• CHAID: A statistical multi-way tree algorithm that explores data quickly and builds segments and profiles with respect to the desired outcome
• Exhaustive CHAID: A modification of CHAID that examines all possible splits for each predic-tor (independent) variable
• Classification & Regression Trees (C&RT): A complete binary tree algorithm, which parti-tions data and produces accurate homogeneous subsets
• QUEST: A statistical algorithm that selects variables without bias and builds accurate binary trees quickly and efficiently
Once you have produced your classification tree(s), you can dig deeper into your data and gain more insight by identifying a particular subset of the data via the tree, and then run further analysis on this group.
Segment and group cases directly within the dataAs you are creating classification trees, you can use the results to segment and group cases directly within your data. Additionally, you can generate selection or classification/prediction rules in the form of IBM SPSS Statistics syntax, SQL statements or simple text. Display these rules in the Viewer and save them to an external file for later use to make predictions about individual and new cases.
Use the highly visual trees to discover relationships that are currently hidden in your data. IBM SPSS Decision Trees’ diagrams, tables and graphs are easy to interpret.
The Decision Tree procedure creates a tree-based classification model. It classifies cases into groups or predicts values of a dependent (target) variable based on values of independent (predictor) variables. The procedure provides validation tools for exploratory and confirmatory classification analyses.
The Decision Tree module provides a variety of options for saving classification rules.
Directly select cases or assign predictions in IBM SPSS Statistics Base from the model results, or export rules for later use.
Specifications
Key features • Create tree-based classification models for:
– Segmentation – Stratification – Prediction – Data reduction and variable screening – Interaction identification – Category merging and discretizing continuous variables
• Classify cases into groups or predict values of a dependent (target) variable based on values of independent (predictor) variables
• Validation tools for exploratory and confirmatory classifica-tion analysis
• View nodes using one of several ways: Show bar charts of your target variables, tables or both in each node
• Collapse and expand branches without deleting the model • Generate syntax automatically from the UI• Re-run tree building using syntax in production mode• Score data based on results or use results in further analy-
sis using other IBM SPSS Statistics procedures
Algorithms• Four powerful tree-modeling algorithms:
– CHAID by Kass (1980) – Exhaustive CHAID by Biggs, de Ville and Suen (1991)
– Classification & Regression Trees (C&RT) by Breiman, Friedman, Olshen and Stone (1984)
– QUEST by Loh and Shih (1997)
Evaluation• Evaluation graphs enable visual representation of gains
summary tables• Misclassification functionality• Gains chart: Identify segments by highest (and lowest)
contribution
Deployment• Export output objects to any of IBM SPSS Statistics’ avail-
able output formats• Generate rules that define selected segments in SQL to
score databases or IBM SPSS Statistics syntax to score IBM SPSS Statistics files
• Export XML models to score new cases
System requirements • Requirements vary according to platform
Available on the following platforms: Windows, Mac, Linux

17 To order, call 1-800-543-2185 | ibm.com/spss
IBM® SPSS® Custom TablesAnalyze data easily and communicate results effectively
IBM SPSS Custom Tables enables you to display your analyses as pre-sentation-quality, production-ready tables. It gives you all the tools you need to easily create and work with tabular reports.
One of the most popular modules in the IBM SPSS Statistics family, IBM SPSS Custom Tables delivers many valuable capabilities:
• Create new fields directly in output tables to perform calculations (e.g., sum, difference, percentage difference) on output categories
• See the results of significance tests directly in output tables• Preview tables as you build them: Take out the guesswork by pre-
viewing your table as you select variables and table options with a simple drag-and-drop interface
• Control your table output: Choose from a variety of formats to rep-resent multi-way information in a two-way table and generate the view you want
• Customize your table structure: Exclude specific categories, dis-play missing value cells and add subtotals to your table
• Use in-depth analyses: Run Chi-square, column proportions and column means tests, and add more insight to your tables by identify-ing differences, changes or trends in your data
• Automate frequent reports: Run large production jobs and com-plex table structures with ease to automatically build similar tables with new data
With IBM SPSS Custom Tables, you can: • Quickly create tables with a drag-and-drop interface• Preview tables as you create them to get it right the first time• Customize tables to make them easier for your audience
to understand
Build tables interactivelyGenerate the table you envision using the Graphical User Interface. You can easily work with output and present survey results by using nesting, stacking and multiple response categories, and handle missing values and change labels and formats—you can even include missing values in your results.
Specifications: Key Features
Graphical user interface• Simple drag-and-drop table builder interface allows you to
preview tables as you select variables and options• Single, unified table builder instead of multiple menu
choices and dialog boxes for different table types
Control contents• Create tables with up to three display dimensions: Rows
(stub), columns (banner) and layers• Nest variables to any level in all dimensions• Cross-tabulate multiple independent variables in the same
table• Display frequencies for multiple variables side-by-side with
tables of frequencies• Display all categories when multiple variables are included in
a table even if a variable has a category without responses• Display multiple statistics in rows, columns or layers
• Place totals in any row, column or layer• Create subtotals for subsets of categories of a categorical
variable • Perform calculations (e.g., sum, difference, percentage
difference) on output categories, and display the results in new fields created directly in Custom Tables output
– No limit on the number of calculated fields• Show significance test results directly in Custom Tables
output instead of in a separate table – No need to combine findings in a Word document – Complies with APA guidelines
• Control category display order and the ability to selectively show or hide categories
Statistics• Select from over 40 summary statistics• Calculate statistics for each cell, subgroup or table• Calculate percentages at any or all levels for nested variables• Calculate counts and percentages for multiple-response
variables based on the number of responses or the number of cases
• Select percentage bases for missing values to include or exclude missing responses
Play a quick demo Download datasheet and full specification

18 To order, call 1-800-543-2185 | ibm.com/spss
Create presentation-quality tables from IBM SPSS Statistics data—in a snap
Work with IBM SPSS Statistics Base seamlessly and easily
Drag and drop your variables on the table preview builder and see what your table looks like as you create it.
Customize your table to show the information you need. Add summary statistics, inferential stats and subtotals to make it easier to understand results.
Create your table and easily export your results
Add additional variables by dragging and placing them where you want.
Once all your variables are in place, push the “OK” button to create your final table. Apply the optional TableLooks for a more polished appearance.
Specifications: Key Features
Formatting controls• Sort categories by any summary statistic in the table• Hide the categories that make up subtotals—remove a
category from the table without removing it from the subto-tal calculation
• Directly edit any table element, including formatting and labels
• Sort tables by cell contents in ascending or descending order
• Automatically display labels instead of coded values• Specify minimum and maximum width of table columns
(overrides TableLooks)• Show a name, label, or both for each table variable• Display missing data as blank, zero, “.” or any other user-
defined term• Add titles and captions
• Output as IBM SPSS Statistics pivot tables• Specify corner labels• Customize labels for statistics• Display the entire label for variables, values and statistics• Choose from a variety of numerical formats• Apply pre-formatted TableLooks • Define the set of variables that are related to multiple
response data and save it with your data definition for sub-sequent analysis
• Use both long- and short-string elementary variables• Define an unlimited number of sets, or variables that can
exist in a set• Tests of significance:
– Chi-square – Column means – Column proportions
• Exclude categories from significance tests• Significance tests for multiple response variables• Syntax and printing formats• Simpler, easy-to-understand syntax• Syntax converter (for upgrade users) • Specify page layout: Top, bottom, left and right margins
and page length• Use the global break command to produce a table for each
value of a variable when the variable is used in a series of tables
System requirements • Requirements vary according to platform
Available on the following platforms: Windows, Mac, Linux
19 To order, call 1-800-543-2185 | ibm.com/spss
IBM® SPSS® Advanced StatisticsUse powerful techniques to analyze complex data
Created to provide you with more statistical power, IBM SPSS Advanced Statistics enables you to reach more accurate conclusions. Consider what it would be like to harness sophisticated univariate and multivariate analytical techniques and unleash them on your data.
You can reach more dependable conclusions with procedures designed to fit the inherent characteristics of data describing complex relation-ships. IBM SPSS Advanced Statistics provides a powerful set of sophis-ticated techniques designed to help you solve real-world problems, such as:
• Medical research: Analyze patient survival rates• Manufacturing: Assess production processes• Pharmaceutical: Report test results to the FDA• Market research: Determine product interest levels
It’s time to step up your analysis when you require multiple outcomes, want to measure outcomes over time, analyze data with hierarchical structure or estimate length of time until an event.
Break through the barrier between general analysis and advanced modeling, and begin reaping the rewards today.
With IBM SPSS Advanced Statistics, you can: • Move beyond basic analysis• Build flexible models using a wealth of model-building options• Achieve more accurate predictive models using a wide
range of modeling techniques
Specifications: Key Features
Generalized Linear Mixed Models (GLMM) Extends the linear model so that:
1) The target is linearly related to the factors and covariates through a specified link function, 2) The target can have a non-normal distribution, 3) The observations can be correlated. Generalized linear mixed models cover a wide variety of mod-els, from simple linear regression to complex multilevel mod-els for non-normal longitudinal data.
• Specify the subject structure for repeated measurements and how the errors of the repeated measurements are correlated
• Choose among the eight covariance types• Specify the target, optional offset and optional analysis
(regression) weight• Choose among the following probability distributions: bino-
mial, gamma, inverse Gaussian, multinomial, negative bino-mial, normal, Poisson
• Choose among the following link functions: identity, com-plementary log-log. log-link, log complement, logit, negative log-log, power, probit
GENLIN and GEEGENLIN and GEE procedures provide a unifying framework for a wide variety of model types. Together, they enable you to predict more types of outcomes than ever, including:
• Ordinal outcomes such as customer satisfaction• Outcomes that are a combination of discrete and continu-
ous outcomes, such as claim amount, with a Tweedie distribution
• Provide a common framework for the following outcomes: continuous outcomes, count data, event/trial data, claim data, ordinal outcomes, combination of discrete and continu-ous outcomes, and correlated responses within subjects
MIXEDExpands the general linear model used in the GLM procedure so that data can exhibit correlation and non-constant variability
• Fit the following types of models: – Fixed effects ANOVA model, randomized complete
blocks design, split-plot design, purely random effects model, random coefficient model, multilevel analysis, unconditional linear growth model, linear growth model with person-level covariate, repeated measures analysis, and repeated measures analysis with time-dependent covariate
• Use one of six covariance structures offered• Select from 11 non-spatial covariance types
GLMDescribe the relationship between a dependent variable and a set of independent variables
• Select univariate and multivariate lack-of-fit tests• Regression model• Fixed effect ANOVA, ANCOVA, MANOVA and MANCOVA• Random or mixed ANOVA and ANCOVA• Repeated measures: Univariate or multivariate• Doubly multivariate design
VARCOMPVariance component estimation
• Estimation methods: ANOVA MINQUE, maximum likelihood and restricted maximum likelihood
• Type I and Type III sums of squares for the ANOVA method• Choices of zero-weight or uniform-weight methods• Choices of ML and REML calculation methods• Save variance components estimates and covariance
matrices
LOGLINEAR and HILOGLINEAR (For a full description, see www.spss.com/statistics/advanced_statistics)
GENLOGFit log-linear and logit models to count data by means of a generalized linear model approach
• Model fit, using ML estimation under Poisson log-linear model and multinomial log-linear models
• Accommodate structural zeros• Generalized log-odds ratio facility tests the specific general-
ized log-odds ratios are equal to zero, and can print confi-dence intervals
• Diagnostic plots: Scatterplots and normal probability plots of residuals
System requirements • Requirements vary according to platform
Available on the following platforms: Windows, Mac, Linux
Play a quick demo Download datasheet and full specification

20 To order, call 1-800-543-2185 | ibm.com/spss
Comprehensive tools for today’s analystIBM SPSS Advanced Statistics meets the wide range of statistical needs of today’s analyst. With its wealth of features and capabilities, you will never be limited to basic analytical techniques again.
General linear models (GLM) multivariate: Gain more flexibility to describe the relationship between a dependent variable and a set of independent variables.
Linear mixed models (Mixed): Use the Mixed procedure to model means, variances, and covariances when working with nested-structure data or repeated measures data, including when there are different numbers of repeated measurements or different intervals for different cases, or both.
Survival analysis: Analyze event history and duration data to better understand events. IBM SPSS Advanced Statistics includes state-of-the-art survival procedures such as Kaplan-Meier and Cox Regression.
Variance component estimation (VARCOMP): Choose from a number of methods to estimate the variance component for each random effect in a mixed model.
Log-linear analysis: Fit log-linear and logit models to count data so you can easily model and predict your outcomes.
• Generalized Linear Mixed Models (GLMM): Allows more accurate models when predicting nonlinear outcomes (for example, what prod-uct a customer is likely to buy) by taking into account hierarchical data structures (customer nested with an organization)
• Interactive and improved visualizations enable a more intuitive expla-nation of model predictors and outcomes
1. Structure your data
A marketing group tests three campaigns to determine which promotion has the greatest effect on sales. First, the marketing group specifies the structure of the data with MarketID as the “subjects.”
2. Achieve more accurate models
Next, they specify units sold as the target variable.
3. Identify random effects
Market size, age of store location and promotion are selected as the fixed effects. MarketID is chosen as the random effect.
4. Analyze results using various methods
Output shows that promotion is signifi-cantly related to units sold. Specifically, promotion 1 has a higher amount of units sold than promotion 3 and promotion 2 has a lower number of units sold than promotion 3.
21 To order, call 1-800-543-2185 | ibm.com/spss
IBM® SPSS® RegressionMake better predictions using regression procedures
IBM SPSS Regression gives you an even wider range of statistics so you can get the most accurate response for specific data types. Do you build predictive models but find ordinary least squares regression too limiting? If so, IBM SPSS Regression can make your life easier.
Use IBM SPSS Regression for:
• Market research: Study consumer buying habits• Medical research: Study response to dosages• Loan assessment: Analyze good and bad credit risks• Institutional research: Measure academic achievement tests
Find the best predictor from dozens of possibilitiesApply more sophisticated models with IBM SPSS Regression’s wide range of nonlinear modeling procedures.
• Multinomial logistic regression (MLR): Predict categorical out-comes with more than two categories. Free of constraints such as yes/no answers, MLR allows you to model which factor predicts if the customer buys product A, B or C.
• Choose from four methods for choosing predictors: forward entry, backward elimination, forward stepwise and backward stepwise
– Stepwise function in MLR: Save time and easily find the best predictors for your data
– Use Score and Wald methods for a faster and more accurate conclusion for variable selection
– Apply a highly scalable, high-performance algorithm to handle big datasets
– Save time by specifying the reference category in your outcome variable in the user interface. You no longer need to recode the dependent variable set up in the desired reference category.
– Use Akaike Information Criterion (AIC) and Bayesian Informa-tion Criterion (BIC) to better assess model fit
With IBM SPSS Regression, you can: • Predict categorical outcomes with more than two categories• Easily classify your data into two groups• Gain more control over your model
• Binary logistic regression (BLR): Predict dichotomous variables such as buy or not buy, vote or not vote. This procedure offers many stepwise methods to select the main and interaction effects that best predict your response variable.
• Nonlinear regression (NLR) and constrained nonlinear regres-sion (CNLR): Get control over your model and your model expres-sion. These procedures give you two methods for estimating parameters of non-linear models.
• Weighted least square regression (WLS): Give more weight to measurements within a series
• Probit analysis (PROBIT): Analyze potency of responses to stimuli, such as medicine doses, prices or incentives. Probit evaluates the value of the stimuli using a logit or probit transformation of the pro-portion responding.
Specifications: Key Features
Multinomial logistic regression • Control the values of the algorithm-tuning parameters • Include interaction terms• Customize hypotheses by directly specifying null hypoth-
eses as linear combinations of parameters• Specify a dispersion scaling value • Build equations with or without a constant• Use a confidence interval for odds ratios• Save the following statistics: predicted probability, predicted
response category, probability of the predicted response category and probability of the actual response category
• Find the best predictor from dozens of possible predictors using stepwise functionality
• Use Score and Wald methods to quickly reach results with a large number of predictors
• Assess model fit• Diagnostics for the classification table
Binary logistic regression (BLR)• Forward/backward stepwise and forced entry modeling• Transform categorical variables by using deviation con-
trasts, simple comparison, difference (reverse Helmert) contrasts, Helmert contrasts, polynomial contrasts, com-parison of adjacent categories, user-defined contrasts or indicator variables
• Criteria for model building: probability of score statistic for entry, probability of Wald, or likelihood ratio statistic for removal
• Save the following statistics: Predicted probability and group, residuals, deviance values, logit, studentized and standardized residuals, leverage value, analog of Cook’s influence statistic and difference in Beta
• Export the model using XML
Constrained nonlinear regression• Save predicted values, residuals and derivatives• Choose numerical or user-specified derivatives
Nonlinear regression (NLR)• Specify loss function options• Use bootstrap estimates of standard errors
Weighted least squares (WLS)• Calculate weights based on source variable and Delta
values or apply from an existing series• Output for calculated weights: Log-likelihood functions for
each value of Delta; R, R2, adjusted R2, standard errors, analysis of variance and t tests of individual coefficient for Delta value with maximized log-likelihood function
• Display output in pivot tables
Play a quick demo Download datasheet and full specification

22 To order, call 1-800-543-2185 | ibm.com/spss
New York University—Making statistics relevant and easy to learnIBM® SPSS® Statistics keeps students engaged by allowing for “real world” problem solving with larger datasets
To find an instructional platform for teaching statistics that would de-emphasize formula manipulation and cumbersome calculations and promote the acquisition of a clear, conceptual understanding of—and appreciation for—statistical methods as they are applied in real-life settings.
Sharon L. Weinberg, Professor of Applied Statistics and Psychology, teaches applied statistics at New York University. Her approach to teaching this subject matter coincides with one of the key recommenda-tions of the 2005 Guidelines for Assessment and Instruction in Statistics Education (GAISE) Project, funded by the American Statistical Association, that the technology revolution “has changed the way statisticians work and should change what and how we teach.” (GAISE Report, 2005)
The software package chosen by Weinberg is IBM SPSS Statistics. Its advantages are that it reduces an emphasis on time-consuming computation; it frees the students to focus on conceptual understand-ing; it models statistical practice; and, in general, it enhances the teach-ing of her subject. The particular features of IBM SPSS Statistics that
support these advantages are its availability and student pricing; its ease of use for particular audiences; its ease of data entry and ability to import data in multiple formats; its dynamic linking between data, graphical and numerical analyses; its interactive and high speed capa-bilities; its versatility as an all-purpose tool for use throughout the course and beyond, in academic settings and industry; and its portability for classroom and home.
Weinberg finds IBM SPSS Statistics to be a “wonderful instructional platform” for students to learn what it means to be a data analyst. The user-friendly program takes “no effort” to master and allows students to focus on learning statistical concepts in the context of real data. Because “an analysis is only one click away with IBM SPSS Statistics,” Weinberg is able to engage students without the distraction that comes from having to manipulate formulas or learn complex software pro-gramming commands.
Powerful regression procedures help you find the best predictors
1. Build predictive models
Predict the presence or absence of a characteris-tic/ outcome based on values of a set of predictor variables In this example, a wireless telephone service provideri is interested in identifying dissatisfied customers so they can intervene before they defect and switch to a competitor.
2. Predict categorical outcomes
The parameter estimates table summarizes the effect of each predictor. The ratio of the coefficient to its standard error, squared, equals the Wald statistic. If the significance level of the Wald statistic is small (less than 0.05), then the parameter is different from 0. Parameters with significant negative coefficients decrease the likelihood of that response category with respect to the reference category. Parameters with positive coefficients increase the likelihood of that response category.
Specifications: Key Features
Two-stage least squares (2SLS)• Structural equations and instrumental variables• Control for correlations between predictor variables and
error terms• Display output in pivot tables
Probit• Transform predictors: Base 10, natural or user-specified
base• Natural response rate estimates or specified• Algorithm control parameters: Convergence, iteration limit
and heterogeneity criterion probability• Statistics: Frequencies, fiducial confidence intervals, relative
median potency, test of parallelism, plots of observed pro-bits or logits
• Display output in pivot tables
System requirements • Requirements vary according to platform
Available on the following platforms: Windows, Mac, Linux

23 To order, call 1-800-543-2185 | ibm.com/spss
IBM® SPSS® Missing ValuesBuild better models when you fill in the blanks
When you ignore or exclude missing data, you risk obtaining biased or insignificant results. Use IBM SPSS Missing Values to impute your missing data and draw more valid conclusions.
IBM SPSS Missing Values is a critical tool for anyone concerned about data validity. You can easily examine your data to uncover missing data patterns. Then, estimate summary statistics and impute missing val-ues through statistical algorithms.
For example, improve survey questions that you’ve identified as possibly confusing based on observed missing data patterns. You can even determine if missing values for one variable are related to missing values of another with the percent mismatch of patterns table.
You might find that respondents who skip a question on income might also bypass a question about education level. Use this information to enhance the quality of your surveys in the future.
With IBM SPSS Missing Values, you can: • Overcome missing data issues• Use multiple imputation to replace missing data• Build models taking missing data into account
Reach more valid conclusions Replace missing values with estimates and increase the chance of receiving statistically significant results. Remove hidden bias from your data by replacing missing values with estimates to include all groups in your analysis—even those with poor responsiveness.
Specifications: Key Features
Analyze patterns • Display missing data and extreme cases for all cases and
all variables using the data patterns table – Display system-missing and three types of user-defined
missing values – Sort in ascending or descending order – Display actual values for specified Variables
• Display patterns of missing values for all cases that have at least one missing value using the missing patterns table
– Group similar missing value patterns together – Sort by missing patterns and variables – Display actual values for specified variables
• Determine differences between missing and non-missing groups for a related variable with the separate variance t test table
– t test, degrees of freedom, mean, p value and count• Show differences between present and missing data for
categorical variables using the distribution of categorical variables table
– Produce crosstabs showing product and missing data for each category of one variable by the other variables
• Assess how much missing data for one variable relates to the missing data of another variable using the percent mismatch of patterns table
– Sort matrices by missing value patterns or variables • Identify all unique patterns with the tabulated patterns table,
which summarizes each missing data pattern and displays the count for each pattern plus means and frequencies for each variable
– Display count and averages for each missing value pat-tern using the summary of missing value patterns table
Multiple Imputation • Specify which variables to impute and specify constraints
on the imputed values, such as minimum and maximum values. You can also specify which variables are used as predictors when imputing missing values of other variables.
• Impute values for categorical and continuous variables. Logistic regression is used for categorical variables and linear regression for continuous variables. Predictive mean matching is an option for continuous outcomes; this ensures that the imputed values are reasonable (within the range of the original data).
• Missing data pattern detection helps determine which imputation method to use
• Three imputation methods are offered: – Monotone: an efficient method for data that have a
monotone pattern of missingness – Fully conditional specification (FCS): an iterative Markov
Chain Monte Carlo (MCMC) method that is appropriate when the data have an arbitrary (monotone or no mono-tone) missing pattern
– Automatic: scans the data to determine the best imputa-tion method (monotone or FCS)
• Specify: – The number of imputations – The range of imputed values – Whether or not interaction effects are used when
imputing – Optionally, turn off imputation for variables that have a
higher percentage of missing values – Tolerance levels, to check for singularity
• You can also specify a variable containing analysis (regres-sion) weights. The procedure incorporates analysis weights in regression and classification models used to impute missing values. Analysis weights are also used in summa-ries of imputed values (e.g., mean, standard deviation and standard error).
• Display an overall summary of missingness in your data as well as an imputation summary and the imputation model for each variable whose values are imputed. You can obtain analysis of missing values by variable as well as tabulated patterns of missing values. Optionally, you can obtain descriptive statistics for imputed values.
• Graphically summarize missingness for cases, variables and individual data (cell) values
• Request an IBM SPSS Statistics data file containing imputed values and/or an FCS iteration history
• Multiple imputation datasets can be analyzed using sup-ported analysis procedures to obtain final (combined) parameter estimates that take into account the inherent uncertainty in the various sets of imputed values
Play a quick demo Download datasheet and full specification

24 To order, call 1-800-543-2185 | ibm.com/spss
A Model of HealthCenterstone Research Institute mines patient data with IBM SPSS predictive modeling to optimize treatment and enhance clinical outcomes
Centerstone’s network of more than 130 nonprofit community mental health locations in Indiana and Tennessee serves more than 75,000 people each year with illnesses ranging from depression to drug addic-tion to stress-related disorders. CRI’s objective is to help guide the Centerstone clinics by conducting clinical research on a variety of frequently seen illnesses, providing clinicians with actionable information for its clinical and business management practices.
Now, with the help of IBM® SPSS® Modeler, researchers at CRI are taking evidence-based medicine a step further: They are using direct feedback from patients to steadily improve Centerstone’s knowledge base and help clinicians understand which treatments have the most likelihood of being successful. It’s an alternative approach called practice-based evidence.
To analyze the data, CRI implemented IBM SPSS Modeler, a predictive analytics solution that reveals patterns and trends in data to better understand what factors influence outcomes. Researchers can use those patterns to build clinical decision support tools within the elec-tronic health record that generate individualized treatment recommen-dations for future clients. With the intelligence generated from the data, CRI has been able to help clinicians significantly improve patient out-comes – the center’s No. 1 priority – and lower costs.
“We know from health research literature that patients are only diag-nosed correctly 50 percent of the time at first pass,” Bennett explains. “On top of that, patients are only given the correct treatment about 50 percent of the time. That means we’re only achieving correct diagno-sis and treatment rates of about 25 percent at first pass. With IBM SPSS Modeler, we can increase that rate significantly and deliver more per-sonalized medicine.”
“ Our goal is to deliver personalized medicine based on real-world experience. IBM SPSS predictive modeling is a key tool to help us achieve that.” – Tom Doub, Chief Operating Officer, Centerstone Research Institute
Specifications: Key Features
Analysis• Supported analysis procedures for Multiple Imputation
(note: you must have purchased the proper module in which the procedure is located)
• Descriptive procedures: frequencies, descriptives, cross-tabs, correlations, non-parametric correlation, partial correlation
• Comparison of means: means, t test, non-parametric tests, one-way ANOVA, univariate ANOVA
• Models: General Linear Models, Generalized Linear Models, linear regression, multinomial logistic regression, binary logistic regression, discriminant analysis, ordinal regression, linear mixed models
• Survival analysis techniques: Cox regression
Pooling• Pooling of output: output is pooled using one of two levels
of pooling produces pooled parameters• Pooling Diagnostics
– Relative Increase in Variance: measure of relative vari-ability in parameter estimate across imputations
– Fraction of Missing Information: relative increase in vari-ance scaled as a proportion. A measure of uncertainty due to nonresponse.
– Relative Efficiency: efficiency of estimate for M imputa-tions relative to that for an infinite number of imputations
• Obtain Model PMML for pooled parameter estimates: Lin-ear regression, Generalized Linear Models, multinomial logistic regression, binary logistic regression, discriminant analysis, Cox Regression
System requirements • Requirements vary according to platform
Available on the following platforms: Windows, Mac, Linux

25 To order, call 1-800-543-2185 | ibm.com/spss
IBM® SPSS® ForecastingBuild expert time-series forecasts—in a flash
With IBM SPSS Forecasting, you can: • Support time-series analysis• Find the best model for your data using the Expert Modeler • Apply saved models to “what-if” scenarios to optimize
your decisions
Time-series analysis is the most powerful procedure you can use to analyze historical information, build models, predict trends, and forecast future events. IBM SPSS Forecasting is the best way to quickly create powerful forecasts with confidence. With better forecasts, long-term goals can be set—with insight on how to achieve them—based on your organization’s past performance and knowledge of your industry.
Unlike spreadsheet programs, IBM SPSS Forecasting has the advanced statistical techniques you need in order to work with time-series data. But you don’t need to be an expert statistician to use it. Regardless of your level of experience, you can analyze historical data and predict trends faster, and deliver information in ways that your organization’s decision makers can understand and use.
IBM SPSS Forecasting will help you find answers to tough questions:
• If I increase my advertising budget, how will it affect sales by product or region?
• How will increasing assembly line capacity affect production?• Will a change in fees affect the number of new customers we gain?• How will tuition increases affect enrollment?
If you’re new to building models from time-series data, IBM SPSS Forecasting helps you by:
• Generating reliable models, even if you’re not sure how to choose exponential smoothing parameters or ARIMA orders, or how to achieve stationarity
• Automatically testing your data for seasonality, intermittency and missing values, and selecting appropriate models
• Detecting outliers and preventing them from influencing parameter estimates
• Generating graphs showing confidence intervals and the model’s goodness of fit
If you’re experienced at forecasting, IBM SPSS Forecasting allows you to:
• Control every parameter when building your data model• Or use IBM SPSS Forecasting’s Expert Modeler recommendations
as a starting point or to check your work
Use IBM SPSS Forecasting to:
• Develop reliable forecasts quickly, regardless of the size of the data-set or number of variables
• Update and manage forecasting models efficiently• Reduce forecasting errors by automating appropriate model selec-
tion and parameters• Gain more control over choices affecting models, parameters and
output• Deliver high-resolution graphs and communicate results effectively
Specifications: Key Features
TSMODELModel a set of time-series variables by using the Expert Modeler or specifying the structure of an ARIMA or exponen-tial smoothing model
• Allow Expert Modeler to select the best-fitting predictor variables and models
– Limit search space to only ARIMA or only exponential smoothing models
– Treat independent variables as events • Specify custom ARIMA models
– Produces maximum likelihood estimates for seasonal and non-seasonal univariate models
– General or constrained models specified by autoregres-sive or moving average order, order of differencing, sea-sonal autoregressive, or moving average order, and seasonal differencing
– Two dependent variable transformations: Square root and natural log
– Automatically detect or specify outliers: Additive, level shift, innovational, transient, seasonal additive, local trend and additive patch
– Specify seasonal and nonseasonal numerator, denomi-nator and difference transfer function orders and trans-formations for each independent variable
• Specify custom exponential smoothing models – Four non-seasonal model types: Simple, Holt’s linear
trend, Brown’s linear trend and damped trend – Three seasonal model types: Simple seasonal, Winters’
additive and Winters’ multiplicative – Two dependent variable transformations: Square root
and natural log • Display forecasts, fit measures, Ljung-Box statistic,
parameter estimates and outliers by model • Generate tables and plots to compare statistics across all
models • Eight goodness of fit measures available: stationary R2, R2,
root mean square error, mean absolute percentage error, mean absolute error, maximum absolute percentage error, maximum absolute error and normalized BIC
Play a quick demo Download datasheet and full specification

26 To order, call 1-800-543-2185 | ibm.com/spss
Star PowerMarketCast leverages IBM® SPSS® Reports for Surveys to create actionable information for the entertainment industry
MarketCast is a leading research firm servicing the global entertainment industry. The company has consulted on hundreds of movie releases and television programs and is dedicated to providing strategic research and advice to maximize the impact and reach of its clients’ marketing resources. Services range from brand and segmentation studies to exit polls, advertising testing, recruited screenings and focus groups, track-ing studies, positioning analyses, home video volumetric forecasts, and many custom capabilities.
MarketCast needed to cross-tabulate huge volumes of data into a con-densed, easy-to-read format that could be readily used by internal report writers, while simultaneously reducing both project turnaround time and the high number of “cut and paste” errors
MarketCast implemented IBM SPSS Reports for Surveys, comple-menting its core analytics engine, IBM SPSS Statistics.
MarketCast turns massive amounts of survey data into actionable infor-mation in a fraction of the time it used to take using manual tools, and with fewer errors.
None of the products MarketCast had used previously could deliver that kind of flexibility. By contrast, the versatile Reports for Surveys prod-uct met the company’s needs perfectly; in fact, the use of this prod-uct to interconnect data across the organization has fuelled tremendous business growth. Says Breihan: “We’ve more than tripled our custom business over the last couple of years, and this success is on the back of what we’ve done with Reports for Surveys.”
This screenshot of the time-series modeler shows how it provides you with the ability to model multiple series simultaneously. Because the module presents results in an organized fashion, you can concentrate on the models that need closer examination.
This screenshot displaying a forecast for women’s apparel shows how you can automatically determine which model best fits your time-series and independent variables.
Specifications: Key Features
• Tables and plots of residual autocorrelation function (ACF) and partial autocorrelation function (PACF)
• Plot observed values, forecasts, fit value, confidence inter-vals for forecasts and confidence intervals for fit values for each series
• Filter output to fixed number or percentage of best or worst fitting models
• Save predicted values, lower confidence limits, upper confi-dence limits and noise residuals for each series back to the dataset
• Specify forecast period, treatment of user-missing values, and confidence intervals
• Export models to an XML file for later use by TSAPPLY
TSAPPLY• Apply saved models to new or updated data • Simultaneously apply models from multiple XML files cre-
ated with TSMODEL• Re-estimate model parameters and goodness of fit mea-
sures from the data or load from the saved model file• Selectively choose saved models to apply• Override the periodicity (seasonality) of the active dataset• Same output, fit measure, statistics and options as
TSMODEL• Export re-estimated models to an XML file
SEASONEstimates multiplicative or additive seasonal factors for peri-odic time series
• Multiplicative or additive model• Moving averages, ratios, seasonal and seasonal adjustment
factors, seasonally adjusted series, smoothed trend-cycle components and irregular components
SPECTRADecomposes a time series into its harmonic components, a set of regular periodic functions at different wavelengths or periods
• Produces/plots univariate or bivariate periodogram and spectral density estimate
• Bivariate spectral analysis• Smooth periodogram values with weighted moving averages• Spectral data windows available for smoothing: Tukey-Ham-
ming, Tukey, Parzen, Bartlett, equal weight, no smoothing and user-specified weights
• High-resolution charts available: Periodogram, spectral and cospectral density estimate, squared coherency, quadra-ture spectrum estimate, phase spectrum, cross-amplitude and gain
System requirements • Requirements vary according to platform
Available on the following platforms: Windows, Mac, Linux

27 To order, call 1-800-543-2185 | ibm.com/spss
Download datasheet and full specification
Play a quick demo
IBM® SPSS® BootstrappingEnsure the stability of your models
The models your organization creates drive important decisions. They may be used to shape public policy, to prevent the spread of disease or to determine a multi-million dollar investment. It’s important that your models are stable, so that they will produce accurate, reliable results. Bootstrapping is a useful technique for testing model stability, and IBM SPSS Bootstrapping makes it easy to do.
This module of IBM SPSS Statistics provides an efficient way to ensure your models are stable and reliable. It estimates the sampling distribution of an estimator by re-sampling with replacement from the original sam-ple. With IBM SPSS Bootstrapping, you can reliably estimate the stan-dard errors and confidence intervals of a population parameter like a mean, median, proportion, odds ratio, correlation coefficient, regres-sion coefficient and numerous others.
Reliable models for critical projectsWhen you require the most reliable model be created to predict an out-come or map a sample to a population, simply running the model once on the sample data on hand may not be the best approach because results are dependent on your sample data. Resampling with replace-ment will provide you with more accurate estimates of the reliability of your data.
In order to identify precisely how suitable your model is, you will want to bootstrap the model to assess its stability.
A complete view of your dataComputing a statistic on a large number of alternate datasets helps you determine the variability of that statistic. Through re-sampling, IBM SPSS Bootstrapping can create thousands of alternate versions of your dataset, providing a more accurate view of what is likely to exist in the population. (Its default setting is 1,000 samples but this setting can be modified upward or downward.) IBM SPSS Bootstrapping also helps you eliminate the outliers and anomalies that can degrade the accuracy or applicability of your analysis. As a result, you have a clearer view of your data for creating the model you are working with.
With IBM SPSS Bootstrapping, you can:• Quickly estimate the sampling distribution of an estimator• Eliminate outliers and anomalies that degrade accuracy• Bootstrap many analytical procedures
IBM SPSS Bootstrapping is available for installation as client-only soft-ware but, for greater performance and scalability, a server-based ver-sion is also available.
Through the IBM SPSS Bootstrapping dialog box, you can easily control the numbers of bootstrap samples, set a random number seed, specify confidence intervals and indicate if a simple or stratified method is appropriate.
Specifications
Key featuresIBM SPSS Bootstrapping provides the ability to bootstrap a number of analytical procedures found throughout the IBM SPSS Statistics product family, including:
Descriptive ProceduresIBM SPSS Statistics Base:
• Descriptives• Frequencies• Examine• Means• Crosstabs
• t tests• Correlations/nonparametric correlations• Partial correlations
Modeling ProceduresIBM SPSS Statistics Base:
• One-way• UNIANOVA• PLUM• Discriminant
IBM SPSS Advanced Statistics:• GLMM• GENLIN• Linear Mixed Models• Cox Regression
IBM SPSS Regression:• Regression• Nominal Regression• Logistic Regression
Available on the following platforms: Windows, Mac, Linux

What if … ... you could easily identify the best customers for a marketing campaign?
Today’s marketers understand the value of leveraging their data to gain insight into customer behavior and preferences. But that value is only delivered when the insight (and in the case of predictive analysis, the foresight based on customer propensities and predicted behavior) is turned into action at the point of customer contact.
IBM SPSS Predictive Analytics lets you embed improved decision-making and automation into CRM and other customer-facing sys-tems, based on data insights.
Find out how IBM SPSS Predictive Analytics can turn data into actions.

29 To order, call 1-800-543-2185 | ibm.com/spss
IBM® SPSS® Complex SamplesCorrectly and easily compute statistics for complex samples
If you’re working with complex sample designs, such as stratified, clus-tered or multistage sampling, you need specialized statistical techniques to account for the sample design and its associated standard error.
IBM SPSS Complex Samples has everything you need to correctly and easily compute statistics and their standard errors from complex sample designs.
You can apply it to:
• Survey research—Obtain descriptive and inferential statistics for survey data
• Market research—Analyze customer satisfaction data• Health research—Analyze large public-use datasets on public health
topics such as health and nutrition or alcohol use and traffic fatalities• Social science—Conduct secondary research on public survey
datasets• Public opinion research—Characterize attitudes on policy issues
In addition to giving you the ability to assess your design’s impact, this module also produces a more accurate picture of your data because subpopulation assessments consider other subpopulations.
With IBM SPSS Complex Samples, you can: • Get a more accurate picture of your data when working
with large-scale surveys• Achieve more statistically valid inferences for populations• Reach correct point estimates for statistics such as totals,
means and ratios, and obtain standard errors of these statistics
• Predict numerical and categorical outcomes from non-simple random samples
• Take up to three stages into account when analyzing data from a multistage design
Play a quick demo Download datasheet and full specification
IBM SPSS Complex Samples helps agencies drive better outcomes for public policy
Analyzing data for government agencies poses special challenges. For some projects, enough data exists so that obtaining a random sample for analysis is relatively straightforward. For other projects, however, if an analyst drew a simple random sample, there would probably be too few cases in some of the categories, because these conditions are relatively rare. Therefore, an analyst must oversample certain groups in which there are relatively few cases.
For example, if an analyst for a city public health department wanted to evaluate the effectiveness of several different substance abuse programs, there might not be enough cases in each age group, in each geographic area, for each treatment option being studied— resulting in some sub-groups being over-sampled. The procedures in IBM SPSS Complex Samples enable analysts to apply scientific sample designs in the sample selection process in order to reduce the risk of a distorted view of the population.
In addition, analysts can document how a sample was selected, so that subsequent evaluations can replicate the sample design—and obtain results that can be used to reliably identify trends and make predictions about future developments. This not only helps agencies evaluate the effectiveness of their programs but also anticipate and plan for future needs.

30 To order, call 1-800-543-2185 | ibm.com/spss
Incorporate complex sample designs into your data analysis
• More accurate analyses: Enables you to take up to three stages into account when analyzing data from a multistage design
• A more precise picture of your data: Unlike traditional statistics, subpopulation assessments consider other subpopulations
Only IBM SPSS Complex Samples makes understanding and working with your complex sample survey results easy. It is one of the most com-prehensive software programs available.
IBM SPSS Complex Samples provides you with everything you need to produce more accurate results …
• Logistic regression: Predict categorical outcomes (such as: Who is most likely to buy my product?) while taking the sample design into account to accurately identify groups
• Ordinal regression: Predict ordinal outcomes such as customer satisfaction (low, medium or high)
• General linear models: Predict numerical outcomes while taking the sample design into account
• Cox regression: Predict time to an event for samples drawn by complex sampling methods
• Intuitive Sampling Wizard: Guides you step-by-step through the process of designing and drawing a sample
• Easy-to-use Analysis Preparation Wizard: Helps prepare public-use datasets for analysis, such as the National Health Inventory Sur-vey data from the Centers for Disease Control and Prevention (CDC)
• Easier collaboration with colleagues: Easily share sampling and analysis plans
Use the following types of sample design information with IBM SPSS Complex Samples:
• Stratified sampling: Increase the precision of your sample or ensure a representative sample from key groups by choosing to sample within subgroups of the survey population. For example, subgroups might be a specific number of males or females or contain people in certain job categories, people of a certain age group and so on.
• Clustered sampling: Select clusters, which are groups of sampling units, for your survey. Clusters can include schools, hospitals or geo-graphic areas with sampling units that might be students, patients or citizens. Clustering often helps make surveys more cost-effective.
• Multistage sampling: Select an initial or first-stage sample based on groups of elements in the population; then create a second-stage sample by drawing a sub-sample from each selected unit in the first-stage sample. By repeating this option, you can select a higher-stage sample. For example, in a face-to-face survey, you might sample indi-viduals within households and city blocks.
Accurate analysis of survey data
Sampling PlanWizard
AnalysisPreparation Wizard
Plan files
Analyze data
Results
The accurate analysis of survey data is easy in IBM SPSS Complex Samples. Start with one of the wiz-ards (which one depends on your data source) and then use the interactive interface to create plans, analyze data and interpret results.
In particular, use the wizards to specify a sampling scheme (when collecting data) or to explain how a sample was drawn (when working with public-use data).
Each plan acts as a template and allows you to save all the decisions made when creating it. This saves time and improves accuracy for yourself and others who may want to use your plans with the data, either to replicate results or pick up where you left off.
Then utilize the procedures that have been specifi-cally developed for use with complex samples to predict numerical, ordinal and categorical out-comes or time to a specific event.
Specifications: Key Features
Complex Samples Plan (CSPLAN): Provides a common place to specify the sampling frame to create a complex sample design or analysis design used by procedures in IBM SPSS Complex Samples.
Complex Samples Selection (CSSELECT): Selects com-plex, probability-based samples from a population. It chooses units according to a sample design created through the CSPLAN procedure.
Complex Samples Descriptives (CSDESCRIPTIVES): Esti-mates means, sums and ratios, and computes their standard errors, design effects, confidence intervals and hypothesis tests.
Complex Samples Tabulate (CSTABULATE): Displays one-way frequency tables or two-way crosstabulations and asso-ciated standard errors, design effects, confidence intervals and hypothesis tests.
Complex Samples General Linear Model (CSGLM): Enables you to build linear regression, analysis of variance (ANOVA) and analysis of covariance (ANCOVA) models.
Complex Samples Ordinal (CSORDINAL): Performs regres-sion analysis on a binary or ordinal polytomous dependent variable using the selected cumulative link function.
Complex Samples Logistic Regression (CSLOGISTIC): Performs binary logistic regression analysis, as well as multi-nomial logistic regression analysis.
Complex Samples Cox Regression (CSCOXREG): Applies Cox proportional hazards regression to analysis of survival times—that is, the length of time before the occur-rence of an event.
System requirements • Requirements vary according to platform
Available on the following platforms: Windows, Mac, Linux

31 To order, call 1-800-543-2185 | ibm.com/spss
IBM® SPSS® Statistics ServerAnalyze “big data” and data in dispersed organizations
With IBM SPSS Statistics Server, you can:• Analyze massive data files faster • Support distributed offices in performing analytics efficiently• Improve analyst productivity
IBM SPSS Statistics Server offers all the features of IBM SPSS Statistics but with faster performance because the processing is centralized on the server machine. This eliminates the need to transfer data over the network, which saves time, improves productivity and enhances secu-rity. Analysts can work in their application of choice without any dis-ruption while waiting for a long-running job to complete and can initiate multiple jobs at the same time.
Faster performanceIBM SPSS Statistics Server provides faster performance across your enterprise when working with large datasets having multiple predictors. There is no limit on the number of CPUs or cores that an analytical pro-cedure can use, and no limit on the number of threads that can be used for multithreaded procedures. Operations like sorts and aggregates can be pushed back to the database, where they can be performed faster. Temporary files created by analytical procedures can be striped over multiple disks, which also speeds analytical processing. And with this latest release, creating pivot tables in the output is now two to three times faster than before. In addition, you can now run IBM SPSS Sta-tistics Server on your IBM System z machines using Linux for more powerful, enterprise-wide analysis.
“IBM SPSS Statistics represents another important step to satisfy the needs of business clients with innovations that help describe, explain and predict.”
—Alexander Vinogradov, PhD Associate Professor Social Sciences and Social Technologies Faculty National University–Kyiv-Mohila Academy Ukraine
Better security and standardizationBecause data is stored in a central location, standard processes can be enforced to ensure that all analysts are using the latest versions of a syntax or data file. Network administrators can use a single Admin-istrative Utility for working with IBM SPSS Statistics Server, IBM SPSS Modeler Server and IBM SPSS Collaboration and Deployment Services. Centralization also enhances security, helping you to better protect sensitive data and intellectual property.
Architected for scalabilityWhen integrated with IBM SPSS Collaboration and Deployment Ser-vices, Statistics Server can be clustered to provide network load bal-ancing and failover protection. This ensures that it can seamlessly scale from meeting the analytic needs of a single department to meeting those of hundreds and even thousands of users across the enterprise.
When you combine the strength of world-class analytical tools and techniques with the flexibility and speed of server functionality, you have a powerful solution for supporting better decision-making through-out your enterprise.
Specifications: System Requirements
Operating system • Microsoft Windows Server 2008 or 2003 (32-bit or 64-bit);
Sun Solaris, IBM AIX® (PowerPC), IBM System z® running Linux 64-bit only; HP-UX; Red Hat Enterprise Linux, Advanced Platform, SUSE Enterprise Linux or Classic Federation Server
Hardware• Minimum CPU: Two CPUs recommended, running 1 GHz
or higher• Memory: 4 GB RAM per expected concurrent user• Minimum free drive space: 500 MB for installation. Additional
space is required to run the program (for temporary files)• Other: A network adapter running the TCP/IP protocol
Available on the following platforms: Windows, Sun Solaris, Linux, IBM AIX, HP-UX, IBM zSeries Running Linux
Download datasheet and full specification
32 To order, call 1-800-543-2185 | ibm.com/spss
IBM® SPSS® Direct MarketingEasily identify the right contacts and improve campaign ROI
Maximizing your marketing programs in terms of both efficiency and impact is critical in today’s marketplace. Doing so by uncovering pat-terns in your customer data, however, can be a tedious process requir-ing highly specialized skills.
All-in-one marketing analysis With IBM SPSS Direct Marketing, you can analyze the success of your marketing tactics on your own. The intuitive user interface guides you through the whole process so that you can classify customers in a few easy steps, and the new Scoring Wizard makes it easy to build mod-els to score your data. After you run an analysis, the easy-to-understand, color-coded output is ready for export into Microsoft Excel.
Easily uncover customer groupsIBM SPSS Direct Marketing helps you analyze customer data in multiple ways so you can choose the approach that best meets your objectives. For example, classifying contacts based on similar demographic or behavioral characteristics can guide your acquisition strategies. Under-standing which groups have the greatest likelihood to respond to a cam-paign can help increase your return on investment. And performing recency-frequency-monetary value (RFM) analysis can give you insight into the lifetime value of your customers or donors.
With IBM SPSS Direct Marketing, you get the features you need to:
• Classify customers and prospects based on identifying charac-teristics: These include age, marital status, job function, where they live, etc. Segment prospects or customers into clusters, which are groups that share similar qualities and differ from others.
• Compare campaign performance: Test existing campaigns against new campaigns, collect your data and run a control package test. Use color coding to quickly see which test package would outper-form your control package.
• Create responder profiles: Generate profiles of those who responded to test campaigns. Use the prospect profiling tool to pin-point specific characteristics in the data, such as age, marital status and job functions.
With IBM SPSS Direct Marketing, you can:• Analyze response rates to marketing campaigns • Classify contacts according to common characteristics• Test and target specific customer or donor clusters• Connect to Salesforce.com to extract data, collect details
and perform analyses
• Generate propensity-to-purchase scores: Target customers most likely to respond to campaigns or offers, and generate XML files to score other data. This helps eliminate less active or unlikely custom-ers from your list.
• Analyze responses by postal code: Identify postal codes with high rates of response to your marketing campaigns. Even find the best location for adding an agency or a brick-and-mortar store.
• Refine individual customer lists: Use the improved scoring inter-face to write RFM scores, prospect profiles and response rates back to existing or new datasets. Quickly build targeted lists and adapt marketing strategies for each customer group.
IBM SPSS Direct Marketing helps you better understand your customer groups, identify the most active customers for your organization and maximize your ROI. Whether you’re launching or testing campaigns, looking to increase cross-sell and up-sell revenue, or planning to open a store, use IBM SPSS Direct Marketing to develop and execute suc-cessful marketing programs.
Specifications: Key Features
Analytical capabilities• Compute RFM scores from a dataset in which each row
contains the aggregated data for one customer or the data for one transaction
• Accept recency data in the form of a transaction date or the time interval since the transaction
• Generate scores indicating which contacts are most likely to respond to similar campaigns
• Create training and testing groups for diagnostic purposes• Recode the response field to represent positive or negative
responses • Cluster analysis works with continuous and categorical fields• Contact profiling works with nominal, ordinal, string or
numeric fields
Data output• Illustrate in an average monetary value chart how recency,
frequency and spending are related in the sample • Display counts and percentages of positive and negative
responses for each group and identify which are significant• Examine descriptions of each profile group, response rates
and cumulative response rates using Contact Profiles feature• Export all analytics to Excel• Leverage improved, descriptive text to help explain—in
everyday language—the output that results from executed procedures
User options• Write the computed scores (and ID variables, where neces-
sary) to the active dataset, a new dataset or to a file
• Append the RFM results directly to your data or a new data file to quickly identify and build lists of high-value customers
• Create descriptive profiles that indicate who responded to which previous campaigns
ZIP code response• Create a new dataset that contains response rates by
postal code• Choose general response rates based on N characters, three
digits, five digits or the complete value of a postal code
System requirements • Requirements vary according to platform
Available on the following platforms: Windows, Mac, Linux
Play a quick demo Download datasheet and full specification

33 To order, call 1-800-543-2185 | ibm.com/spss
Programmers can:• “Wrap” custom functionality and procedures from R and
Python in IBM SPSS Statistics syntax• Distribute wrapped packages via the Web or email
Non-Programmers can:• Gain access to custom procedures and functionality
developed by advanced users• Run wrapped packages in the IBM SPSS Statistics
environment
IBM SPSS Statistics Developer has all of the features found in other IBM SPSS Statistics products except for the statistical algorithms they con-tain. It provides a lower-priced option for users who need the power of IBM SPSS Statistics to support their R and Python functionality.
The R programming language is very flexible, and provides fine control over the way statistical functions are executed. However, it can be com-plex and difficult to wield and requires data to be held in memory, pre-venting it from being easily used with large datasets. Users of Python face similar challenges.
IBM SPSS Statistics Developer allows R and Python users to overcome the limitations of using these languages alone and integrates their efforts into an interface that also features robust data access, management, preparation and reporting tools.
IBM SPSS Statistics provides a complete framework into which users can place customized features and algorithms built using R and/or Python for their own use, or for deployment to users of any IBM SPSS Statistics module.
IBM® SPSS® DeveloperComplete flexibility to build customized functionality and procedures in R or Python, your way
Wrap and deploy custom functionality Within IBM SPSS Statistics Developer, any R package or Python func-tionality can be easily “wrapped” in IBM SPSS Statistics syntax. A wrapped package can then be invoked through IBM SPSS Statistics, and it can easily be given a dialog box interface that makes it indistin-guishable from any of IBM SPSS Statistics’ built-in dialogs. Furthermore, wrapped procedures can produce standard pivot tables in the style of IBM SPSS Statistics.
IBM SPSS Statistics Developer features the same Programmability Extension and Custom Dialog Builder features now present in all of the IBM SPSS Statistics modules. These features allow the advanced user to quickly share highly customized work with any user of any IBM SPSS Statistics module, complete with a user interface that they can make as complex or simple as they like.
An ideal platform for your solutions, IBM SPSS Statistics Developer gives statistical programmers a development platform on which to implement customized or unique analytical solutions that can be accessed and executed by anyone familiar with IBM SPSS Statistics. Available in 10 languages, IBM SPSS Statistics Developer includes all of the core functionality found in IBM SPSS Statistics except for IBM SPSS Statistics’ analytical procedures. This makes it the perfect “blank slate” on which advanced users can write their customized procedures.
Specifications: Key Features
Advantages for R programmers:• Simple and easy to learn how to wrap R packages and
algorithms• Easy to distribute via Web download or email• Custom Dialog Builder allows programmers to create spe-
cific interfaces that simplify users’ access to the functional-ity they have provided
• Makes their skills and expertise available to a far wider range of users in both academic and commercial worlds
Benefits to IBM SPSS Statistics users include:• Access to thousands of advanced algorithms and R
packages• Easy to install—just point IBM SPSS Statistics at the
wrapped package, and it installs automatically• Easy to use—packages are invoked through the standard
IBM SPSS Statistics interface or, for more advanced users, through IBM SPSS Statistics syntax
• Runs in the familiar IBM SPSS Statistics environment, which provides:
– Full access to IBM SPSS Statistics data handling functions
– The ability to work with larger datasets—no in-memory limitations
– Efficient production of more graphs and other forms of output
Pre-wrapped functions• Estimate a linear model and carry out the Breusch-Pagan
heteroscedasticity test, using the ncv.test function from the R car package
• Estimate conditional quantiles for a linear model, using the rq function from the R quantreg package
• Estimate a Rasch model for item response data, using the Rasch function from the R ltm package
• Estimate a linear regression model, robustly with an M estimator, using the rlm function from the R MASS package
• Estimate a regression model with optional fixed upper and/or lower bounds for the dependent variable, using the tobit function from the R AER package
• Calculate correlations for nominal, ordinal, and scal-evariables—accounting for the measurement levels of the variables—using the hector function from the R polycor package
• Create boxplots with different options from standard IBM SPSS Statistics boxplots, using the R boxplot function
System requirements• Requirements vary according to platform
Available on the following platforms: Windows, Mac, Linux
Download datasheet and full specification

34 To order, call 1-800-543-2185 | ibm.com/spss
IBM® SPSS® Neural Networks Discover complex relationships in your data more easily
With IBM SPSS Neural Networks, you can: • Explore data using non-linear data modeling tools • Uncover hidden connections in your data • Improve model performance IBM SPSS Neural Networks offers techniques that enable you to explore your data in new ways and, as a result, build more accurate and effec-tive predictive models.
A computational neural network is a set of non-linear data modeling tools consisting of input and output layers plus one or two hidden lay-ers. The connections between neurons in each layer have associated weights, which are iteratively adjusted by the training algorithm to mini-mize error and provide accurate predictions. You set the conditions under which the network “learns” and can finely control the training stopping rules and network architecture, or let the procedure auto-matically choose the architecture for you.
IBM SPSS Neural Networks provides a complementary approach to the statistical techniques available in IBM SPSS Statistics Base and its modules. From the familiar IBM SPSS Statistics interface, you can “mine” your data for hidden relationships, using either the Multilayer Perceptron (MLP) or Radial Basis Function (RBF) procedure. With either of these approaches, the procedure operates on a training set of data and then applies that knowledge to the entire dataset, and to any new data.
Get a greater return on your investment in data The data you already have holds opportunities you may not have fully realized. With the models created with IBM SPSS Neural Networks, you can discover relationships that you wouldn’t find using traditional,
linear statistical techniques. And you can do this almost automatically. You don’t have to do any programming—but you can still stay in con-trol of the process. You can influence the weighting of variables, specify details of the network architecture, select the type of model training desired and more. Once you have trained and validated your models, you can share results with others in graphs and charts.
How can you use IBM SPSS Neural Networks? You can combine neural network techniques with other statistical approaches to gain clearer insight in many areas.
• Market research – Create customer profiles – Discover customer preferences
• Database marketing – Segment your customer base – Optimize campaigns
• Financial analysis – Analyze applicants’ creditworthiness – Detect possible fraud
• Operational analysis – Manage cash flow – Improve logistics planning
• Healthcare – Forecast treatment costs – Perform medical outcomes analysis – Predict hospital length of stay
Specifications: Key Features
Multilayer Perceptron (MLP)• Fits an MLP neural network, which uses a feedforward
architecture• Can have multiple hidden layers• One or more dependent variables may be specified—
scale, categorical or a combination of these• EXCEPT subcommand excludes selected variables• RESCALE subcommand rescales covariates or scale
dependent variables• PARTITION subcommand specifies the method of parti-
tioning the active dataset into training, testing and holdout samples
• ARCHITECTURE subcommand specifies the network architecture
– The number of hidden layers – The activation function to use for all units in the hidden
layers – The activation function to use for all units in the output
layer
• CRITERIA subcommand is used to specify computational resources
• STOPPINGRULES subcommand specifies the rules that determine when to stop training the network
• MISSING subcommand controls whether user-missing values for categorical variables are treated as valid values
• PRINT subcommand indicates the tabular output to display and can be used to request a sensitivity analysis
• PLOT subcommand indicates the chart output to display• SAVE subcommand writes temporary variables to the
active dataset• OUTFILE subcommand saves XML format files containing
the synaptic weights
Radial Basis Function (RBF)• Fits an RBF network, which uses a feedforward, supervised
architecture • Has only one hidden layer• Trains the network in two stages and is faster than an MLP
network
• Subcommands listed for the MLP procedure (above) per-form similar functions for the RBF procedure, except that:
– When using the ARCHITECTURE subcommand, users can specify the Gaussian radial basis function used in the hidden layer: either Normalized RBF or Ordinary RBF
– When using the CRITERIA subcommand, users can specify the computation settings for the RBF proce-dures, specifying the hidden-unit overlapping factor that controls how much overlap occurs among the hidden units
System requirements• Requirements vary according to platform
Available on the following platforms: Windows, Mac, Linux
Play a quick demo Download datasheet and full specification

35 To order, call 1-800-543-2185 | ibm.com/spss
IBM® SPSS® Visualization Designer Easily create and share customized visualizations
With IBM SPSS Visualization Designer, you can:• Create compelling visualizations without programming skills • Share and reuse visualization templates within IBM SPSS products • Customize and brand your data visualizations
IBM SPSS Visualization Designer makes the creation of powerful and compelling data visualizations accessible to non-technical users. With an intuitive, drag-and-drop design interface, it eliminates the need for advanced programming skills. And because IBM SPSS Visualization Designer gives you the ability to create reusable chart/ graph templates, you can share your unique visualizations with a broad array of end users.
Use visualization templates directly within IBM SPSS products With IBM SPSS Visualization Designer, the templates you create are immediately available within supported IBM SPSS products such as IBM SPSS Modeler and IBM SPSS Statistics. IBM SPSS Visualization Designer can also directly access data from common databases as well as data stored within report services definitions in IBM SPSS Collabora-tion and Deployment Services.
Customize and brand your visualizations Easily create customized visualizations that reflect the branding and style standards of your organization. Or, if you are performing research for customers, make your findings more distinctive and engaging by design-ing charts and graphs that broadcast your clients’ corporate branding.
With IBM SPSS Visualization Designer, you don’t need extensive pro-gramming skills to conceive, create and share compelling visualizations.
Communicate data more effectively IBM SPSS Visualization Designer significantly expands your ability to communicate important data in a meaningful and understandable way. Tailor the format and style of your visualization to more effec-tively represent the results of an analysis.
This visualization shows a set of ocean temperature readings over a period of many years. Each month is shown as a radial boxplot, with the outliers colored to indicate in which year that unusual reading was taken.
Specifications: Key Features
• Easy creation of new visualizations for use within other IBM SPSS products (IBM SPSS Modeler and IBM SPSS Statistics)
• Create and apply custom styles to visualizations• Automatic suggestions of visualizations to fit your data• Data source support (delimiter separated, SPSS Data Files,
and relational databases including DB2, SQL Server, Ora-cle, and Sybase)
• Dozens of available built-in visualization templates • GUI interface to update/edit visualizations• Drag-and-drop interface to construct and visualize data• Factor many data elements with multi-faceted and multi-
dimensional visualizations
• Create advanced graphics using The Grammar of Graphics (Lee Wilkinson) principles using GPL syntax
• Includes support for the VisualizationML (visualization-markup language)
• Integration with IBM SPSS Collaboration and Deployment Services
• Export visualizations as images • Built-in sampling for large datasets
System requirements• Microsoft Windows 7 Enterprise and Professional (32- and
64-bit); Windows Vista Enterprise and Business (32- and 64-bit) SP1; or Windows XP Professional (32- and 64-bit) SP3
• Hardware: – Processor speed: 1.8GHz or higher – Memory: 512MB RAM (1GB recommended) – Available hard-drive space: 250MB or more – Web browser: Internet Explorer 7 or 8
Available on the following platforms: Windows
Download datasheet and full specification

36 To order, call 1-800-543-2185 | ibm.com/spss
IBM® SPSS® Exact Tests Reach accurate conclusions with small samples or rare occurrences
With IBM SPSS Exact Tests, you can: • Use smaller sample sizes and be confident of your results • Analyze rare occurrences in large datasets with more than 30 exact tests
IBM SPSS Exact Tests is the add-on module to turn to when you’d like to analyze rare occurrences in large databases or work more accurately with small samples. With more than 30 exact tests, you’ll be able to analyze your data where traditional tests fail, because you can use smaller sample sizes and be confident of your results. And now IBM SPSS Exact Tests operates on Mac and Linux platforms, as well as on Windows.
IBM SPSS Exact Tests has the tests and statistics you need, including:
• Exact p values • Monte-Carlo p values • Pearson Chi-square test • Linear-by-linear association test • Contingency coefficient • Uncertainty coefficient—symmetric or asymmetric • Wilcoxon signed-rank test • Cochran’s Q test • Binomial test
IBM SPSS Exact Tests ensures you’ll always have the right statistical test for your data. Because it is part of the IBM SPSS Statistics prod-uct line, you can count on beginning-to-end solutions for your model-ing and data analysis needs.
IBM SPSS Exact Tests is crucial to your research if you are:
• Operating with a small number of cases• Working with variables that have a high percentage of responses in
one category • Subsetting your data into fine breakdowns • Searching for rare occurrences in large datasets
In this example, even though there are only 10 cases, IBM SPSS Exact Tests helps you determine that a significant relationship exists.
Analyze small datasets and get more precise results.
Specifications
Tests and statisticsPearson Chi-square test, Likelihood ratio, and Fisher’s Exact
• Exact 1-tailed, 2-tailed p values for 2x2 table• Exact 2-tailed p values for general RxC table• Monte-Carlo (MC) 2-tailed p values and general RxC table
Linear-by-linear association• Exact 1- and 2-tailed p-values and exact point probability• MC 1- and 2-tailed p values and CIs
Contingency coefficient, Phi, Cramer’s V, Goodman and Kruskal Tau, Uncertainty coefficient—symmetric or asymmetric, Kappa, Gamma, Kendall’s Tau-b and Tau-c, Somers’ D—symmetric and asymmetric, Pearson’s R and Spearman correlation• Exact 2-tailed p values• MC 2-tailed p values and CIs
McNemar• Exact 1- and 2-tailed p values and point probability
Sign and Wilcoxon signed-rank• Exact 1- and 2-tailed p-value and point probability• MC 1- and 2-tailed p values and CIs
Marginal homogeneity• Asymptotic, exact, MC 1- and two 2-tailed p values and
point probability
2-Sample Kolmogorov-Smirnov• Exact 2-tailed p values, and point probability• MC 2-tailed p-values and CIs
Mann-Whitney U or Wilcoxon Rank-sum W• Exact 2-tailed p values, exact 1-tailed p values and
point probability• MC 1- and 2-tailed p values and CIs
Wald-Wolfowitz Runs• Exact 1-tailed p-value and point probability• MC 1-tailed p-value and CIs
Jonckheere-Terpstra• Asymptotic, exact, MC 1- and 2-tailed p-values and point
probability
System requirements• Requirements vary according to platform
Available on the following platforms: Windows, Mac, Linux
Download datasheet and full specification

37 To order, call 1-800-543-2185 | ibm.com/spss
IBM® SPSS® Categories Predict outcomes and reveal relationships through perceptual maps of categorical data
With IBM SPSS Categories, you can: • Visualize and explore complex categorical and numeric
data, as well as high-dimensional data • Understand information in large two-way and multi-
way tables • Use biplots, triplots and perceptual maps to see relationships
in your data
With the sophisticated features of IBM SPSS Categories in your toolbox, you are no longer hampered by categorical or highly dimensional data. These techniques ensure you have all the tools you need to easily ana-lyze and interpret your multivariate data and its relationships more com-pletely. For example, use IBM SPSS Categories to understand which characteristics consumers relate most closely to your product or brand, or to determine customer perception of your products compared to other products you or your competitors offer.
IBM SPSS Categories uses categorical regression procedures to predict the values of a nominal, ordinal or numerical outcome variable from a combination of numeric and (un)ordered categorical predictor variables. You can use regression with optimal scaling to describe, for example, how job satisfaction can be predicted from job category, geographic region and the amount of work-related travel.
Optimal scaling techniques quantify the variables in such a way that the Multiple R is maximized. Optimal scaling may be applied to numeric vari-ables when the residuals are non-normal or when the predictor variables are not linearly related with the outcome variable. Three new regulariza-tion methods—Ridge regression, the Lasso and the Elastic Net— improve prediction accuracy by stabilizing the parameter estimates. Automatic variable selection makes it possible to analyze high-volume datasets—more variables than objects. And by using the numeric scal-ing level, you can do regularization in regression by using the Lasso or the Elastic Net for your numeric data as well.
Present your results clearly using perceptual maps Use dimension reduction techniques to go beyond unwieldy tables to clearly see relationships in your data using revealing perceptual maps and biplots. Summary charts display similar variables or categories, pro-viding you with insight into relationships among more than two variables.
The data are a 2x5x6 table containing information on two genders, five age groups and six products. This plot shows the results of a two-dimensional multiple correspondence analysis of the table. Notice that products such as “A” and “B” are chosen at younger ages and by males, while products such as “G” and “C” are preferred at older ages.
The data are a 2x5x6 table containing information on two genders, five age groups and six products. This plot shows the results of a two-dimensional multiple correspondence analysis of the table. Notice that products such as “A” and “B” are chosen at younger ages and by males, while products such as “G” and “C” are preferred at older ages.
Specifications: Key Features
PREFSCAL • Multidimensional unfolding analysis • Read one or more rectangular matrices of proximities • Read weights, initial configurations, and fixed coordinates
PROXSCAL • Statistics: Iteration history, stress measures, stress decom-
position, coordinates of the common space, and object distances within the final configuration
• Plots: Stress plots, common space scatterplots, individual space weight scatterplots, and individual space scatterplots
CATPCA • Statistics: Frequencies, missing values, optimal scaling
level, mode, variance accounted for by centroid coordi-nates, vector coordinates, total per variable and per dimen-sion, component loadings for vector quantified variables, category quantifications and coordinates, iteration history
• Plots: Joint category plots, transformation plots, residual plots, projected centroid plots, object plots, biplots, triplots and component loadings plots
CORRESPONDENCE • Statistics: Correspondence measures; row and column
profiles; singular values; row and column scores; and iner-tia, mass
• Plots: Transformation plots, row point plots, column point plots and biplots
CATREG • Statistics: Frequencies, regression coefficients, ANOVA
table, iteration history and category quantifications • Plots: Correlations between untransformed formed predic-
tors, correlations between transformed predictors, residual plots and transformation plots
• Three regularization methods: Ridge regression, the Lasso and the Elastic Net
Play a quick demo Download datasheet and full specification

38 To order, call 1-800-543-2185 | ibm.com/spss
Using symmetrical normalization to produce a biplot, the researchers con-clude that a strong association does not exist in the sam-ple between non-drinking and nonsmoking, and there is a suggested association between drinking and level of smoking with relatively more drinkers in the high-smoking group.
Unleash the full potential of your data through optimal scaling and dimension reduction techniques Correspondence analysis (CORRESPONDENCE): Describe the relationships between two nominal variables in a low-dimensional space, while simultaneously describing the relationships between categories for each variable.
Categorical regression (CATREG): Predict the values of a categori-cal dependent variable from a combination of categorical independent variables. Optimal scaling techniques quantify the variables in such a way that the Multiple R is maximized. Regularization methods improve prediction accuracy by stabilizing the parameter estimates.
Multiple correspondence analysis (MULTIPLE CORRESPON-DENCE): Analyze a categorical multivariate data matrix for two or more nominal variables.
Categorical Principal Components Analysis (CATPCA): Use alter-nating least squares to generalize principal components analysis to accommodate variables of mixed measurement levels. Specify a trans-formation type of nominal, ordinal or numeric on a variable-by-vari-able basis.
Nonlinear canonical correlation (OVERALS): Use alternating least squares to generalize canonical correlation analysis. It allows more than one set of variables to be compared to one another on the same graph.
Proximity scaling (PROXSCAL): Takes a matrix of similarity and dis-similarity distances between observations in a high-dimensional space and assigns them to a position in a low-dimensional space in order for you to gain “spatial” understanding of how objects relate.
Preference scaling (PREFSCAL): Set up the Preference Scaling pro-cedure (PREFSCAL) in syntax to perform multidimensional unfolding on two sets of objects in order to find a map that represents the rela-tionships between these two sets of objects as distances between two sets of points.
1. Analyze differences between categories
Use correspondence analysis to easily display and analyze differences between categories. In this example, researchers present and analyze the two-dimension table relating staff group to smoking category in a particular workplace.
2. Incorporate supplementary information
Easily incorporate supplementary information on additional variables in IBM SPSS Categories. Here, additional informa-tion on alcohol consumption by staff group is known. These additional columns can be projected into the staff group by smoking category space.
3. Uncover associations and relationships
Specifications: Key Features
– Improve prediction accuracy by stabilizing the parameter estimates
– Analyze high-volume data (more variables than objects) – Obtain automatic variable selection from the predictor set – Write regularized models and coefficients to a new data-
set for later use• Two model selection and predictive accuracy assessment
methods: the .632 bootstrap and Cross Validation (CV) – Find the model that is optimal for prediction with the
.632(+) bootstrap and CV options – Obtain nonparametric estimates of the standard errors
of the coefficients with the bootstrap• Systematic multiple starts
MULTIPLE CORRESPONDENCE• Statistics: Model summary; history statistics, descriptive
statistics; discrimination measures; category quantifica-tions; inertia of the categories; contribution of the catego-ries to the inertia of the dimensions and contribution of the dimensions to the inertia of the categories; and iteration history
• Plots: Object points, category points (centroid coordinates), discrimination measures and transformation (optimal cat-egory quantifications against category indicators)
OVERALS• Statistics: Frequencies, centroids, iteration history, object
scores, category quantifications, weights, component load-ings, and single and multiple fit
• Plots: Object scores plots and category coordinates plots
System requirements• Requirements vary according to platform
Available on the following platforms: Windows, Mac, Linux
39 To order, call 1-800-543-2185 | ibm.com/spss
IBM® SPSS® Conjoint Discover what drives your customers’ purchase decisions
Thoroughly understand customer preferences, tradeoffs and price sensitivity with IBM SPSS Conjoint. Using conjoint analysis, you can uncover more information about how customers compare products in the marketplace and measure how individual product attributes affect consumer behavior. Armed with this knowledge, you can design, price and market products and services tailored to your customers’ needs. IBM SPSS Conjoint outputs its results to pivot tables, which:
• Provide better, more professional-looking and presentable charts • Offer more formatting options than text output • Can be exported to Microsoft Word, Excel or PowerPoint • Can be used by the SPSS Output Management System (OMS)
IBM SPSS Conjoint helps uncover answers to critical questions such as:
• Which features or attributes of a product or service drive the pur-chase decision?
• Which feature combinations will have the most success? • What marketplace segment is most interested in the product? • What marketing messages will most appeal to that segment? • What is the optimal price to charge customers for a product or
service? • Who are the closest competitors in the marketplace?
With IBM SPSS Conjoint, you can: • Identify product features important to new customers • Discover which product attributes are most important to
current customers • Determine the influence product attributes have on
customer preferences
Play a quick demo Download datasheet and full specification
Putting the Lid on ChurnXO communications uses IBM® SPSS® Statistics and Modeler to boost customer revenue retention by 60 percent
XO Communications needed a way to reduce customer churn, the rate at which subscribers switch to other telecommunications providers, because they knew it was more cost-effective to retain customers than to acquire new ones.
XO Communications deployed IBM SPSS Statistics and Modeler to identify at-risk customers, enabling client services agents to focus their proactive outbound “health check” calls.
Using IBM SPSS predictive analytics, XO and the SPSS team worked together to create an internal data mart, evaluated more than 500 poten-tial variables for predicting voluntary customer defection within 90 days, and built a multiple regression model on the 25 most relevant variables.
“By enabling our client services managers to prioritize their proactive outbound calls—basically, a ‘health check’ on the customer—we can cover more risk with our existing Client Services team,” says Taylor. “It’s been a very successful business model for us and has helped us organize our resources better.” Thanks to IBM SPSS, each manager can effectively monitor churn risk on up to 400 accounts; the company would otherwise need twice as many client services managers to achieve the same level of churn intervention through frequent contact and relationship building.
The churn reduction project has paid off handsomely. According to Taylor, “We have actually exceeded our initial goal.” Comparing the retention rate of at-risk customers who were proactively contacted by Client Services to a control group, the team estimates that it’s achiev-ing a 60 percent improvement in revenue retention rates which trans-lates into millions of dollars in annualized revenue protection. Says Taylor: “The key difference was using IBM SPSS to prioritize the Cli-ent Services workload.”

40 To order, call 1-800-543-2185 | ibm.com/spss
Find out how your product ranks with IBM SPSS Conjoint
• IBM SPSS Conjoint offers the procedures you need to plan, imple-ment and analyze efficient conjoint surveys. With these techniques, you can discover how respondents rank their preferences and prod-uct attributes.
• Orthoplan: Produces an orthogonal array of product attribute com-binations, dramatically reducing the number of questions you must ask while ensuring enough information to perform a full analysis.
• Plan cards: Print “cards” to elicit respondents’ preferences. Quickly generate cards that respondents can sort to rank alternative products.
• Conjoint procedure: Get results you can act on, such as which product attributes are important and at what levels they are most preferred. Plus, perform simulations that will tell you expected market shares for alternative products.
• Add IBM SPSS Conjoint to your competitive research and develop products and services that are more successful.
1. Save time and money with Orthoplan
IBM SPSS Conjoint takes you step by step through the process of setting up a product comparison.
Establish the parameters of your study with the Orthoplan design genera-tor. Orthoplan gives you an orthogonal array of alternative potential prod-ucts that combine differ-ent product features at specified levels. This saves you time and money by presenting a fraction of all possible alternatives.
2. Rank respondents’ preferences
IBM SPSS Conjoint quickly guides you through creating “plan cards” that respondents sort to rank their preferences of alternative products.
3. Generate charts
After you gather and input the data using your plan cards, IBM SPSS Conjoint performs an ordi-nary least squares analysis of preference or rating data. It then generates charts to simulate expected market shares. For instance, in this chart you can quickly see that subjects strongly consider package design and price as the most important.
Specifications: Key Features
Orthoplan—Generates orthogonal main effects fractional factorial designs• Specify the desired number of cards for the plan• Generate holdout cards to test the fitted conjoint model• Orthoplan can mix the training and holdout cards or can
stack the holdout cards after the training cards• Plan cards—A” utility procedure used to produce printed
cards for a conjoint experiment; the printed cards are used as stimuli to be sorted, ranked, or rated by the subjects
• Specify the variables to be used as factors and the order in which their labels are to appear in the output
• Choose a format – Listing-file format – Card format
• Conjoint—Performs an ordinary least squares analysis of preference or rating data
• Work with the plan file generated by plan cards or a plan file input
• Work with individual level rank or rating data• Provide individual level and aggregate results• Treat the factors in any of a number of ways; conjoint indi-
cates reversals• Experimental cards have one of three scenarios: Training,
holdout and simulation• Three conjoint simulation methods: Max utility; Bradley-
Terry-Luce (BTL); and logit
• Print results – Attribute importance – Utility (part worth) and standard error – Graphical indication of most-to least-preferred levels of
each attribute – Counts of reversals and reversal summary Pearson R for
training and holdout data – Kendall’s tau for training, holdout data simulation results
and simulation summary
System requirements• Requirements vary according to platform
Available on the following platforms: Windows, Mac, Linux

41 To order, call 1-800-543-2185 | ibm.com/spss
IBM® SPSS® Data CollectionGet an accurate view of people’s attitudes, preferences and opinions
In order to compete in today’s global marketplaces, organizations must continuously strive to obtain a better understanding of people’s atti-tudes, preferences, and opinions to help predict how they might behave in the future. It has now become vital to an organization to engage and collect feedback from people who have demands on their time and are becoming increasingly mobile. In order to keep up, organizations need a dynamic survey research platform that sup-ports the entire research process and can be deployed across mul-tiple channels.
Imagine being able to connect with your clients and constituents with a combination of social media, online surveys, phone interviews, in-person interviews, or paper-based surveys. For a data driven organi-zation, this task is essential to achieve a 360-degree view of your customers and clients.
IBM SPSS Data Collection can make all of this a reality. It can enable an organization to bridge the gap between how your respondents are behaving with why they behave the way that they do.
IBM SPSS Data Collection allows an organization to:
• Create a multi-modal survey, which will reach all constituents, regardless of language or location.
• Leverage predictive analytics and business intelligence capabilities through integration with IBM® SPSS® Statistics, IBM® SPSS® Mod-eler and IBM Cognos.
• Apply real-time analytics and score an attitudinal channel at the point of dialog.
IBM SPSS Data Collection provides the capabilities to capture insight to impact and drive decision making. It gives a holistic view of your key constituents by including predictive insight into their opinions, atti-tudes, and preferences. Create and field compelling surveys in any language through a secure and centralized framework.
Multiple deployment options ensure that Data Collection capabilities can be leveraged organizations of any size. In addition to the on- premises option, IBM offers Data Collection on Cloud, which is a fully hosted software as a service (SaaS) environment. This removes the need to invest in software licenses and infrastructure and allows orga-nizations to focus on creating captivating surveys.
Specifications
With this versatile software, you can capture the attention of potential respondents and provide the options they prefer to ensure that they complete your survey accurately.
Supports all question types, including:• Single response questions• Multiple response questions• Grid questions• True/False questions• Numeric questions• Text questions• Date/Time questions
Sophisticated validation to keep your data clean and accurate, including:• Go-to and conditional routing statements (if/then)• List-filtering• Skip-and-fill
Create a multi-modal survey:• Over the internet to desktop or mobile phone browsers• By telephone — voice or text messaging to mobile phones• Face-to-face using a tablet PC or paper forms• Adaptable to deliver content through mobile devices• Create secure logins and passwords for participants to use,
or for greater ease, embed them into the survey URL.• Use sophisticated survey management tools such as quota
and participant management rules.• Create interactive cross tabulations within the IBM SPSS
Data Collection environment to explore and share insights with internal or external clients
• Export to IBM SPSS Statistics or IBM SPSS Modeler to perform advanced analysis
• Publish captured attitudinal data using IBM Cognos Business Intelligence
System requirements • Requirements vary according to platform.
Available on the following platform: Windows
https://ibm.biz/BdxtVv
Download collateral material
Play a quick demo Download case study

42 To order, call 1-800-543-2185 | ibm.com/spss
IBM® Social Media AnalyticsCreate Relationships. Build Advocacy. Improve Loyalty.
IBM Social Media Analytics is IBM’s first purpose-built application for social media analytics. It is an application that leverages IBM’s leading research and software-based assets and combines these with the strength of its Business Analytics user experience and rich set of capabilities.
Why IBM Social Media Analytics?• It is the industry’s most scalable social media application• Provides an in-depth view to the degree of affinity between two
dimensions• Helps understand customer needs • Offers a window into evolving topics, which are a grouping of key
words providing a logical summary of discussions within collected data
• Evaluates corporate reputation and makes better evidence-based decisions
• It is the only application with a seamless glide to a robust Business Analytic environment
• Helps respond more quickly to customer requests and helps ensure a consistent brand experience across all channels
IBM SMA is now available as a SaaS version
With IBM Social Media Analytics, you can:• Grow your business • Enhance your brand reputation• Improve your customer experience
Listen, Measure and Analyze DataIBM SMA helps you gain a holistic view of your consumer by offering
• Highly scalable and robust analysis from multiple social media chan-nels, including Twitter, Facebook, product review sites, YouTube and internal corporate communities—among others
• Gain insight into top authors and identify clusters of commentary around key subject areas to better understand segment preferences, motivations and interests by social channels
• Analyze geo hotbeds of commentary to understand regions to target and engage
BBVA is a global group that offers individual and corporate customers a comprehensive range of financial and nonfinancial products and ser-vices. It enjoys a solid leadership position in the Spanish marketplace, where it first began its activities over 150 years ago. It also has a leading franchise in South America; it is the largest financial institution in Mexico, one of the 15 largest U.S. commercial banks, and one of the few organi-zations operating in China and Turkey. BBVA employs approximately 104,000 people in over 30 countries around the world, and has more than 47 million customers and 900,000 shareholders.
BBVA needed an online tool to detect possible risks to its reputation in order to increase positive feedback and customer satisfaction.
Cognos Consumer Insight gave BBVA the opportunity to address reputational challenges and continue to build on positive opinions.
BBVA seamlessly monitors and improves its online reputation Using IBM Cognos Consumer Insight
“What is great about this solution is that it helps us to focus our actions on the most important topics of online discussions and immediately plan the correct and most suitable reaction.” – Online Communication Department, BBVA
As a result, BBVA can now:
• Consistently respond to and gain insight into customer needs and feedback.
• Measure the success of its outputs and approaches to engaging stakeholders and customers.
• Show whether positive or negative sentiments have increased or not, looks for the source and reason of comments and helps make deci-sions and plans.

43 To order, call 1-800-543-2185 | ibm.com/spss
Are customers talking about the color of your new product or the great value for money? Do your employees rave about flex work hours or your great compensation package?
• Understand more than volume—learn why conversation is happen-ing using affinities between topics of conversation in social media.
• Anticipate new opportunities to engage audiences on specific sub-ject areas with the words and messages that resonate with and are specific to their interests and perspectives
• Evaluate campaign messaging by analyzing affinity contexts and associations with corporate and brand values to ascertain responsiveness and reaction to reputation, customer service and corporate social responsibility activities
Do you want to learn what discussions you don’t know are happening in social media? Are new topics just a blip on the social media radar or do they have staying power?
• Discover new topics emerging in the social space to deliver the most relevant campaigns
• Learn about potential issues and risks that are starting to gain traction in social media
• Gain insight into emerging trends as they change over time • Make evidence-based messaging decisions with analysis into
consumer and stakeholder sentiment; Assess with precision trends and changes in perception of your corporate reputation and reaction to campaigns
• Identify and target new social media channels to drive greater advocacy of your products and services with key influencers based on an analysis of sentiment
• Determine the effectiveness of your campaigns’ messages and their impact on consumers’ purchasing decisions, as well as the resonance and believability of their promise
Comprehensive Analytics
Analyze multiple external and internal corporate social channels to measure the effectiveness of your messages among your influencers, employees and consumers
Affinity Relationships
Understand the relationship between different areas of analysis and view the snippets that are associated with their intersection to gauge impact and identify future messages among key audiences
Evolving Topics
Capture discussion threads to ascertain related topics above and beyond your analysis
Sentiment
Analyze sentiment and filter by concepts, hot words and media sets—among others. Comparative analysis by com-paring positive, negative by comparing positive, negative, neutral, or ambivalent sentiment

44 To order, call 1-800-543-2185 | ibm.com/spss
Behavior
View reports that segment key social media information to provide insight into behavioral attributes.
Demographics
View reports that provide breakdowns on such things as author gender, author distribution by gender, gender by sentiment and gender by geography.
Evolving Topics
Rank evolving social media topics by such categories as trend-ing keywords, sentiment and hot words.
Login
Once logged in, users can navigate through available proj-ects, or start a new project, import or export an existing project, or learn more about the program.
Specifications: Key Features
• Comprehensive pre-packaged analysis of social media provided for areas such as: Sentiment, Influencer, Cover-age, Sources and Affinities
• Discovery of emerging discussion threads • Advanced analysis of topic affinities
• On-premise solution provides easy glide path to combine social media results as part of your broader management dashboards and as part of your advanced analytics solutions

45 To order, call 1-800-543-2185 | ibm.com/spss
IBM® Cognos® InsightPersonal analytics freedom—without compromise
Cognos Insight empowers all users to independently explore data, build scenario models and share insights without IT help.
Because it’s part of the IBM Cognos family, there is the flexibility to grow into Cognos Enterprise allowing for managed reporting, perfor-mance management, predictive capabilities and more. And you can start quickly by using IT governed Cognos BI and planning data as well as centrally authored reports.
You now have the agility you need today together with proven enter-prise IT values for the future.
That’s personal analytics freedom… without compromise.
Why Cognos Insight?With Cognos Insight, business users get all of the tools they need to solve individual or workgroup challenges on their own, without relying on IT assistance.
• Insight to Action• Only vendor to offer personal analytics and planning capabilities that
are extensible to workgroup and enterprise environments
With IBM Cognos Insight, you can:• Independently explore and visualize your data• Take insights to action• Share insights with work groups and Cognos users
• All users can independently create, consume and interact with plans or dashboards—no scripting required
• Make better decisions, take action by modifying plans, aligning resources and managing performance from the desktop.
• Growth path for the Future – Extend by publishing to workgroup or enterprise servers for scalable and governed deployment
– Integrates with broader business analytics including predictive analytics, managed reporting, performance management, etc.
Download IBM Cognos Insight Personal Edition for free from www.AnalyticsZone.com
Mueller Inc.
Founded in the 1930s and headquartered in Ballinger, Texas, Mueller is a leading retailer and manufacturer of pre-engineered metal buildings and metal roofing products. Today, the company sells its products directly to consumers all over the southwestern United States from 35 locations across Texas, New Mexico, Louisiana and Oklahoma.
Business need:Metal construction product manufacturer Mueller wanted to adopt a more a retail-driven business model—but driving change would require a better understanding of its operations and performance.
Solution:By harnessing a suite of analytics technologies, the company is now able to measure and improve sales performance, create effective busi-ness plans and gain deep insight into patterns and trends in its data.
A personal analytics solution that empowers users to explore, ana-lyze and share data on their desktops, Cognos Insight provides ad hoc data analysis and visualizations for solving problems and finding information without support from the analytics team.
Benefits:Shows sales teams how to improve performance, driving cultural change. Provides hourly insight into manufacturing processes, enabling greater efficiency. Identifies anomalous transactions, helping to com-bat fraud.
Mark Lack, Manager of Strategy Analytics and Business Intelligence at Mueller, “When we see a new opportunity to use technology to help us operate more intelligently and efficiently, we take it.”
With the help of business analytics software from IBM, Mueller has not only succeeded in adopting a new business model based on retail-centric, customer-focused manufacturing, but also become a truly information-driven enterprise.
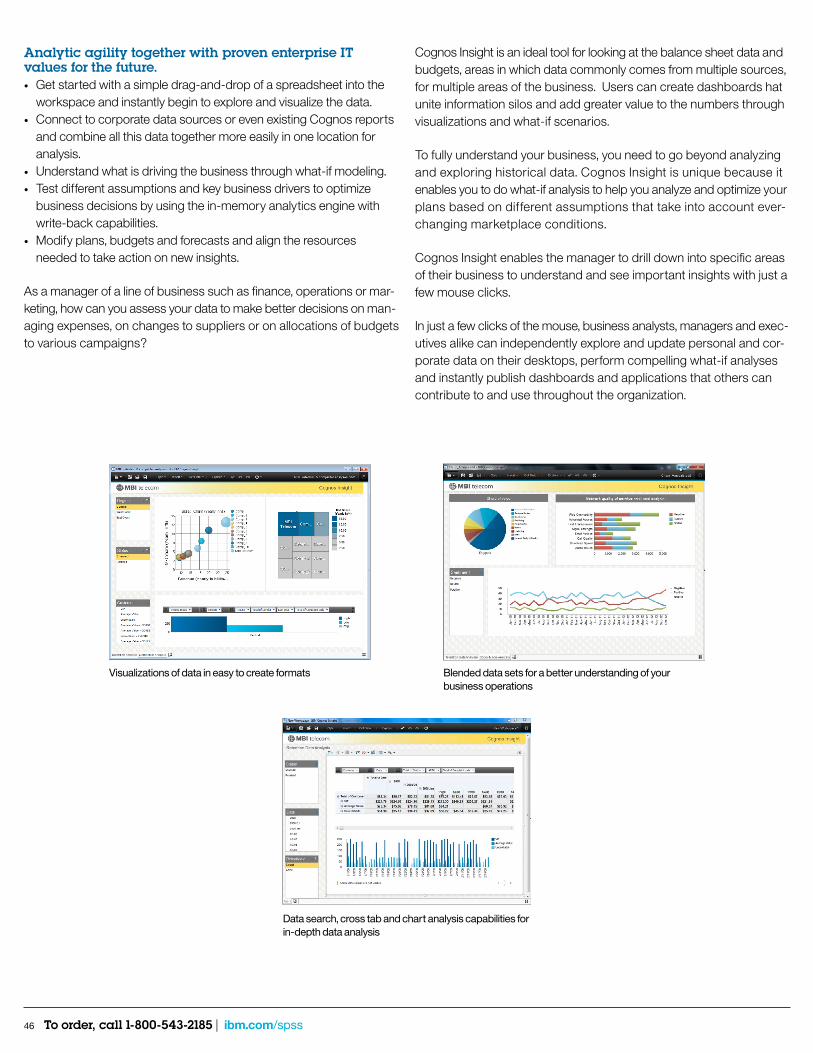
46 To order, call 1-800-543-2185 | ibm.com/spss
Analytic agility together with proven enterprise IT values for the future.• Get started with a simple drag-and-drop of a spreadsheet into the
workspace and instantly begin to explore and visualize the data.• Connect to corporate data sources or even existing Cognos reports
and combine all this data together more easily in one location for analysis.
• Understand what is driving the business through what-if modeling.• Test different assumptions and key business drivers to optimize
business decisions by using the in-memory analytics engine with write-back capabilities.
• Modify plans, budgets and forecasts and align the resources needed to take action on new insights.
As a manager of a line of business such as finance, operations or mar-keting, how can you assess your data to make better decisions on man-aging expenses, on changes to suppliers or on allocations of budgets to various campaigns?
Cognos Insight is an ideal tool for looking at the balance sheet data and budgets, areas in which data commonly comes from multiple sources, for multiple areas of the business. Users can create dashboards hat unite information silos and add greater value to the numbers through visualizations and what-if scenarios.
To fully understand your business, you need to go beyond analyzing and exploring historical data. Cognos Insight is unique because it enables you to do what-if analysis to help you analyze and optimize your plans based on different assumptions that take into account ever-changing marketplace conditions.
Cognos Insight enables the manager to drill down into specific areas of their business to understand and see important insights with just a few mouse clicks.
In just a few clicks of the mouse, business analysts, managers and exec-utives alike can independently explore and update personal and cor-porate data on their desktops, perform compelling what-if analyses and instantly publish dashboards and applications that others can contribute to and use throughout the organization.
Visualizations of data in easy to create formats Blended data sets for a better understanding of your business operations
Data search, cross tab and chart analysis capabilities for in-depth data analysis

47 To order, call 1-800-543-2185 | ibm.com/spss
IBM® Analytic AnswersCloud-based predictive insights for nontechnical business users
No analytics expertise? Budget constraints? No problemIBM Analytic Answers is a portfolio of cloud-based solutions that is designed to provide key predictive and prescriptive insights for better business decisions. No software license purchase, analytics expertise or infrastructure implementation is required.
Built and hosted on one of the leading analytics platforms and offered by subscription, the applications in the IBM Analytic Answers portfolio:
• Make predictions and recommendations at the individual level that can address key business problems for your specific industry.
• Use your data and are tailored to your business but are based on IBM’s analytics expertise to help get you up and running faster.
• Provide answers in a format you can read directly, easily integrate into business workflows or import into IBM Cognos® Insight for more detailed exploration of the analytical results.
The process is not complicated, involves no upfront investment and requires no statistics or modeling expertise. In fact, the solution provides the recommendations you need in just a few steps (Figure 1):
1. In an initial engagement, you provide historical data to IBM’s ana-lytic specialists who then use your data to build and customize pre-dictive models and analytic processes. This work is included with your Analytics Answers subscription.
2. After the initial setup is complete, you use your web browser to upload your latest data and Analytic Answers applies your models to make predictions and recommendations.
3. You download the insights and recommendations and apply this information to your business activities and operations.
You repeat Steps 2 and 3 as often as you like to get new and refreshed insights and recommendations.
Why Analytic Answers is right for youAnalytic Answers is an ideal solution for companies of any size who want the benefits of advanced analytics without making major capital invest-ments, hiring or engaging analytics experts, or taking the time and resources for a major infrastructure investment. It is cloud based, backed by IBM Lab Services and designed for you to get up and running quickly.
The Analytic Answers applicationsAnalytic Answers is a pay-as-you-go model that enables you to answer a specific business question quickly. The portfolio currently includes:
• Analytic Answers for Retail Purchase Analysis and Offer Targeting. Better understand customer purchases and design targeted promo-tions and recommendations with the best chance for success.
• Analytic Answers for Insurance Renewals. Keep policyholders loyal while making more efficient use of retention expenditures.
• Analytic Answers for Prioritized Collections. Make informed deci-sions about how best to pursue outstanding debts and which debts to write off.
• Analytic Answers for Student Retention. Take the steps necessary to encourage at-risk students to stay enrolled.
• Analytic Answers for Donor Contribution Growth. Predict the likeli-hood that current and potential donors will pledge a donation, how much are they likely to contribute, and how to maximize their generosity.
• Analytic Answers for Telco Churn Prevention. Discover which of your telco subscribers are likely to leave for another carrier, and which incentive you can extend to keep them loyal.
Additional solutions for various industries are in development.
Analytic Answers provide insights and recommendations in just a few steps.
Play a quick demo Visit the product page

Simplify your search for insight... IBM Analytic Answers is a portfolio of subscription-based, cloud apps that deliver action-able predictive/ prescriptive information directly to the line of business for specific busi-ness questions. Subscribers upload data and download results via a simple web-based user interface; no analytics expertise is necessary. The results offer predictions and rec-ommendations at the level of individual cases.
IBM SPSS Software as a Service (SaaS) solutions deliver a fully hosted service in which IBM provides and manages both the software and the technical infrastructure—so that you can focus on your core business without worrying about hardware, software, staff-ing levels or ongoing maintenance costs.
IBM SPSS SaaS gives you all the advantages of a hosted solution—without upfront investment of a traditional software license.
IBM Analytical Decision Management offers an effective method for optimizing and automating business decisions in today’s growing and dynamic environment by com-bining some of IBM SPSS foundational predictive technologies. This SaaS offering allows you to get up and running quickly and make smarter decisions sooner.
SPSS Data Collection SaaS allows you to quickly begin authoring and managing your online, phone, and face-to-face data collection projects. This SaaS offering gives you freedom to create, program, and field your projects, and to access Web-based reports to analyze the results via a browser-based connection.
Our fee structure allows you to stay within your budget. And you may even qualify for IBM financing.
To learn more about our SaaS solutions, contact us at 1-800-543-2185.

49 To order, call 1-800-543-2185 | ibm.com/spss
IBM® SPSS® Text Analytics for Surveys Easily make your survey text responses usable in quantitative analysis
With IBM SPSS Text Analytics for Surveys, you can: • Gain greater analytical value from your text responses • Save time by automating the creation of categories and
the categorization of responses • Save money by eliminating or reducing the need for out-
side coding services
With IBM SPSS Text Analytics for Surveys, you can gain full value from text responses—without the drudgery and expense associated with manual coding. Specifically designed for survey text, this product is based on our automated natural language processing (NLP) software technologies. Using this software, you can automate the creation of cat-egories and categorization of responses to transform unstructured sur-vey data into quantitative data—without having to read text responses word-for-word.
You can get better out-of-the-box results in the English-language ver-sion by using pre-built Text Analysis Packages (TAPs) designed for cat-egorizing customer, product or employee satisfaction surveys. New TAPs are also available for evaluating opinions on advertising, on bank-ing satisfaction and on brand awareness.
Two versions of IBM SPSS Text Analytics for Surveys are available for separate purchase: one for analyzing English, Dutch, French, German and Spanish survey text; and a second for analyzing Japanese text.
When you use IBM SPSS Text Analytics for Surveys, you are empowered to gain greater insight from text responses using these capabilities:
• Dictionary-based text-extraction technology: This product ships with libraries and resources to automate concept extraction. You can easily customize these libraries by adding topic-specific terms to match your needs.
• Proven linguistic technologies: This product is based on natural language processing (NLP) technologies that enable you to quickly create categories and reliably categorize responses.
Create conditional rules to enhance categorization: Use extraction results and Boolean operators to categorize responses based on more complex information and filter erroneous responses.
• Visualization capabilities aid category refinement: Use bar charts, Web graphs and Web tables to quickly reveal which catego-ries contain concurrent responses. Then decide whether to combine certain categories or to create new ones that better account for shared responses.
• Re-use and share categories: Export categories for use by others in new projects to save time and ensure reliability across the same or similar studies.
• Export results to IBM SPSS Statistics or Excel: Analyze and graph results in other software for use in decision making.
Specifications
Key features • Import data from: IBM SPSS Statistics (SAV), IBM SPSS
Data Collection (MDD), Excel (XLS), Excel (XLSX) for Office 2007 and ODBC-compliant databases
Extract key concepts • A Project Wizard makes setup easier • Extract terms, types and patterns automatically • Create categories automatically (or manually if desired) • Use pre-built categories and resources (Text Analytics
Packages or TAPs) for customer/employee/ product satis-faction surveys*
• New! TAPs are available for evaluating opinions on advertis-ing, on banking satisfaction and on brand awareness*
• Supports the reuse of categories created in other programs • Use linguistic algorithms and a semantic network to auto-
matically create categories and categorize responses
• New! IBM SPSS Semantic Network supports hundreds of general themes for enhanced category building*
• Create conditional rules to categorize responses by using extraction results and Boolean operators
• Allows the “force-in”/“force-out” of responses into/out of categories without changing the category definition
Refine results • Categorize responses manually by dragging terms, types
and responses within the interface • Sort categories by relevance • View response co-occurrence by using a category bar
chart, Web graph or Web table • Use “flags” to mark responses as complete or to follow-up • Profile categories by overlaying reference variables onto bar
charts • Print category lists and some visualizations
Export results Export data from:
• IBM SPSS Statistics (SAV) and Excel (XLS)
Share resources • Share project files that contain extracted results, categories
and linguistic resources • Export categories and definitions for reuse by others in new
projects
Dictionaries (customizable) • Type Dictionary: Supports the grouping of similar terms • Substitution Dictionary: Groups similar terms under a target
name • Exclude Dictionary: Contains terms to be ignored during
extraction
Download datasheet and full specification

50 To order, call 1-800-543-2185 | ibm.com/spss
Get reliable results faster with automated features
Import survey text responses Import text responses from a variety of sources, including IBM SPSS Statistics, Microsoft Excel, the IBM SPSS Data Collection product fam-ily and any ODBC-compliant database program.
Extract key concepts Extract key concepts automatically from responses to an open-ended question. The software creates a list of terms, types and patterns.
Simply click the “Extract” button (lower-left pane) to automatically extract con-cepts from the text responses. Automatic color coding identifies which terms have been extracted and identifies their type. Positive items are green; negative ones are red. The Data pane shows the full text of all responses to the question.
Create categories and categorize text responses Automatically create categories and categorize responses using term derivation, term inclusion, a semantic network or frequency. Also, cat-egorize responses manually by dragging terms, types and responses within the interface.
Click the “Create Catego-ries based on Linguistics” button at the upper left to automatically create cat-egories and categorize responses.
Refine categories Visualization capabilities enable you to quickly see which categories share responses. This can help you to refine categories manually.
A Web graph showing which categories share responses enables the user to decide whether to com-bine certain categories or to create new ones that better account for shared responses.
Export results for analysis and graphing When you are satisfied with your categories, you can export results either as dichotomies or as categories. These can be used to cre-ate tables and graphs, either separately or in combination with other survey data.
Export results to IBM SPSS Statistics to cre-ate cross-tabs or whatever your analysis requires.
Results can also be exported to IBM SPSS Statistics to cre-ate graphs that communicate survey findings.
Specifications
Libraries• Survey Library: Contains resources related to pattern rules
and types, as well as a predefined list of synonyms and excluded terms (proprietary)
• Project Library: Stores dictionary changes for a particular project
• Core Library: Contains reserved Type Dictionaries for Per-son, Location, Product and Organization
• Budget Library: Contains a built-in type for words or phrases that represent qualifiers and adjectives
• Opinions Library: Contains seven built-in types that group terms for qualifiers and adjectives
• New! Additional libraries are available for banking, emoti-cons, finance and slang
System requirements• For Microsoft Windows 7 Enterprise and Professional (32-
and 64-bit); Windows Vista Ultimate, Enterprise, Business, Home Premium, and Home Basic (32- and 64-bit) SP1; or Windows XP Professional (32- and 64-bit) SP3
• Japanese language version supports Microsoft Windows 7 Enterprise and Professional (32-bit); Windows Vista Ulti-mate, Enterprise, Business, Home Premium, and Home Basic (32-bit) SP1; or Windows XP Professional and Home Edition (32-bit) SP3
• Hardware: – Processor: Intel Pentium-class; 3 GHz recommended – Monitor: 1024 x 768 (SVGA) resolution – Memory: 512 MB RAM minimum (1 GB for Japanese
language version); 1 GB or more for large datasets (2 GB for Japanese language version)
– Minimum free space: 800 MB minimum (1 GB for the Japanese language version); more recommended for larger datasets
* Indicates an exclusive feature of the English-language version
Available on the following platforms: Windows

51 To order, call 1-800-543-2185 | ibm.com/spss
IBM® SPSS® SamplePower®
Save time, effort and money by finding the appropriate sample size for your study
With IBM SPSS SamplePower, you can: • Easily find the optimal sample size • Quickly perform “What if” analyses to find the sample size
under various sets of assumptions
Whether you’re an advanced or beginning statistician or researcher, you’ll easily identify the appropriate sample size—every time—for any research criteria. Strike the right balance among confidence level, statistical power, effect size and sample size by using IBM SPSS SamplePower.
What’s new in IBM SPSS SamplePower Work Faster With the New Easy Interface In addition to the classic interface, IBM SPSS SamplePower offers you the option of an easy interface that can perform the more common procedures. This interface prompts you with a series of simple questions, offering as much or as little assistance as you’d like at each step. It then provides an executive summary of the rationale for the sample size, as well as a detailed report.
Control Costs with New Means Tests for Cluster-Randomized Trials Use this two-level test for situations such as patients within hospitals or students within schools. The test automatically finds the most cost-effective allocation ratio.
Present your results clearly Once you’ve found a sample size, you’ll want to share your results with clients or colleagues. IBM SPSS SamplePower gives you three fast and easy ways to share results.
“I cannot believe the time IBM SPSS SamplePower saves and how easy it is to use.”—Mandel Bellmore, PhD, President, Block, McGibony, Bellmore & Assoc., Health and Hospital Consultants
Communicate your results clearly using IBM SPSS SamplePower tools • Use the report tool, and a complete report is displayed on the
screen. You have the flexibility to embed the report in a word processor document to create convincing proposals.
• Support your results with embedded tables. The table tool presents results as a table showing power and precision at select sample sizes. Easily view how sample size affects power or precision. Plus, you can embed this table in a document for informative presentations.
• The graph tool generates graphs relating power to sample size. The resulting graphs make it easier to see how sample size affects power. You can also include charts in documents.
Specifications
Key features • Find power as a function of effect size and sample size • Find sample size needed to yield a given level of power • Find precision as a function of sample size (for select
procedures) • Display Cohen’s effect-size conventions (for select
procedures)
Two interfaces • “Classic” interface for experienced users allows you to
quickly enter data, modify parameters and find the appro-priate sample size
• “Easy” interface that prompts you with a series of simple questions—providing an executive summary of the ratio-nale for the sample size and a detailed report*
Working with results • Pivot tables • New export and print options, including export to Excel • Export graphs as WMF, EMF, BMP and Word or PowerPoint
Statistical tests
Means • One-sample and paired t tests when mean equals zero or
equals a specified value • Precision • t test for two independent groups with variance known and
unknown
Proportions • One-sample test that proportion = 0.50 or specific value • 2x2 for independent samples • 2x2 for paired samples (McNemar) • ANOVA • One-way Analysis of Variance and Analysis of Covariance
Regression • Templates for study design • Error model
Logistic regression• One continuous predictor or two continuous predictors• One categorical predictor with two or more levels
Download datasheet and full specification

52 To order, call 1-800-543-2185 | ibm.com/spss
Get precise results faster with flexible, efficient tools IBM SPSS SamplePower is packed with features that make finding accurate sample sizes easy. For starters, choose from two different interfaces. If you’re familiar with power analysis, the classic interface allows you to quickly enter data, modify parameters and find the appro-priate sample size. If you’re new to power analysis, the new “easy” inter-face prompts you with a series of simple questions and then provides an executive summary of the rationale for the sample size, as well as a detailed report.
IBM SPSS SamplePower’s interactive guide leads you smoothly through your analysis. The guide explains terms and takes you through the steps necessary to determine an effective sample size.
IBM SPSS SamplePower’s tables and graphs allow you to easily assess how different combinations of your research parameters (such as proposed sample size, alpha levels and duration) affect your statisti-cal power.
IBM SPSS SamplePower’s Find N tool finds the sample size for the default power setting in one click. You also have the flexibility to choose different power-size settings to compare results.
Perform analysis in minutes
The “easy” interface prompts you with a series of simple questions and provides an executive summary of the rationale for the sample size, as well as a detailed report.
Compare results before you begin your research
The Stored Scenarios tool gives you optimum control over the flow of your research. You can vary Alpha level, power, effect size or sample size in the main screen and store your results as you continue. This illustration shows how the sample size varies as other settings, such as Alpha, are changed.
See how your research criteria will affect power
IBM SPSS SamplePower’s tables and graphs allow you to easily assess how different combinations of your research parameters (such as proposed sample size, Alpha levels and duration) affect your statistical power.
Find sample sizes in one click
IBM SPSS SamplePower’s Find N tool finds the sample size for the default power setting in one click. You also have the flexibility to choose different power-size settings to compare results.
Specifications
Survival analysis• Accrual options: Subjects entered prior to first study inter-
val, subjects entered during study at constant rate, and accrual varies
• Hazard rate options: Constant and varies• Attrition rate options: No attrition, constant rate and rate
varies
Cluster-randomized trials*• One level of clustering (for example, patients within hospitals)
and one level of treatment (for example, Treated vs. Control)• Find the optimal (most cost-effective) allocation ratio • Equivalence tests• Equivalence tests for means and for proportions
* Indicates a new feature in IBM SPSS SamplePower 3
System requirements• Microsoft Windows 2000, XP or Vista• XGA monitor• Pentium class processor• 105 MB drive space
Available on the following platform: Windows

53 To order, call 1-800-543-2185 | ibm.com/spss
IBM® SPSS® Amos Get your research noticed—take your analysis to the next level
With IBM SPSS Amos, you can: • Easily perform structural equation modeling (SEM) • Quickly create models to test hypotheses and confirm
relationships among observed and latent variables • Move beyond regression to gain additional insight
When you conduct research, you’re probably already using factor and regression analyses in your work. But what’s the next step in creating more precise models and confidence in your research?
SEM can take your research to the next levelStructural equation modeling (sometimes called path analysis) can help you gain additional insight into causal models and explore the interaction effects and pathways between variables. SEM lets you more rigorously test whether your data supports your hypothesis. You create more pre-cise models—setting your research apart and increasing your chances of being published.
IBM SPSS Amos makes structural equation modeling easyIBM SPSS Amos builds models that more realistically reflect complex relationships because any numeric variable, whether observed (such as non-experimental data from a survey) or latent (such as satisfaction and loyalty) can be used to predict any other numeric variable. Its rich, visual framework lets you easily compare, confirm and refine models.
Quickly build graphical models using IBM SPSS Amos’ simple drag-and-drop drawing tools. With the latest release, non-programmers can easily specify a model without drawing a path diagram by entering the model into a spreadsheet like table that can be modified. Models that used to take days to create are just minutes away from completion.
And once the model is finished, simply click your mouse and assess your model’s fit. Then make any modifications and print a presenta-tion-quality graphic of your final model.
Obtain Bayesian estimates of model parameters and other quantitiesBayesian analysis enables you to apply your subject-area expertise or business insight to improve estimates by specifying an informative prior distribution. Markov Chain Monte-Carlo (MCMC) is the underlying com-putational method for Bayesian estimation. The MCMC algorithm is fast and the MCMC tuning parameter can be adjusted automatically.
Perform estimation with ordered categorical and censored dataCreate a model based on non-numerical data without having to assign numerical scores to the data. Or work with censored data without hav-ing to make assumptions other than the assumption of normality. You can also impute numerical values for ordered-categorical and censored data. The resulting dataset can be used as input to programs that require complete numerical data.
Impute missing values or latent variable scoresChoose from three data imputation methods: regression, stochastic regression or Bayesian. Use regression imputation to create a single completed dataset. Use stochastic regression imputation or Bayesian imputation to create multiple imputed datasets. You can also impute missing values or latent variable scores.
Specifications: Key Features
Modeling capabilities• Create structural equation models with observed and latent
variables• Specify each individual candidate model as a set of equality
constraints on model parameters• Analyze data from several populations at once• Save time by combining factor and regression models into a
single model and then fit them simultaneously
Bayesian estimation• Fit models with ordered-categorical and censored data• Markov Chain Monte-Carlo (MCMC) simulation
Computationally intensive modeling• Evaluate parameter estimates with normal or non-normal
data using powerful bootstrapping options
Analytical capabilities and statistical functions• Determine probable values for missing or partially missing
data values in a latent variable model • Use full information maximum likelihood estimation in miss-
ing data situations for more efficient and less biased estimates
• Use a variety of estimation methods, including maximum likelihood, unweighted least squares, generalized least squares, Browne’s asymptotically distribution-free criterion and scale-free least squares
• Evaluate models using more than two dozen fit statistics, including Chi-square; AIC; Bayes and Bozdogan informa-tion criteria; Browne-Cudeck (BCC); ECVI, RMSEA and PCLOSE criteria; root mean square residual; Hoelter’s critical n; and Bentler-Bonett and Tucker-Lewis indices
• Bootstrapping of user-defined functions of the model parameters, using new User-Defined Estimands shortcut in Start menu [new feature]
Data imputation• Impute numerical values for ordered-categorical and cen-
sored data• Impute missing values and latent variable scores • Choose from three different methods: Regression, stochas-
tic regression and Bayesian
System requirements• Operating system: Microsoft Windows XP or Windows Vista• Memory: 256 MB RAM minimum• Minimum free drive space: 125 MB• Web browser: Internet Explorer 6
Available on the following platform: Windows
Download datasheet and full specification

54 To order, call 1-800-543-2185 | ibm.com/spss
IBM SPSS Amos makes structural equation modeling easy and accessible Structural equation modeling’s approach to multivariate analysis encompasses and extends standard methods—including regression, factor analysis, correlation and analysis of variance. IBM SPSS Amos makes SEM easy. It’s the perfect modeling tool for a variety of pur-poses, including market research, business planning and academic program evaluation.
1. Select a data file
Input data from a variety of file for-mats (IBM SPSS Statistics, Excel, text files, or many others). Select grouping variables and group values. Amos also accepts data in a matrix format if you’ve computed a correlation or covariance matrix.
2. Specify your model
Use drag-and-drop drawing tools to quickly specify your path diagram model. Click on objects in the path diagram to edit values, such as variable names and parameter values. Or simply drag variable names from the variable list to the object in the path diagram to specify variables in your model.
One of the benefits of Amos is that it helps document clearly the process used for the multivariate analysis, which helps academics doing research to get pub-lished, since the evidence for their conclusions is readily available to include.
3. Select analysis properties
Select the analysis prop-erties you wish to exam-ine, such as standardized estimates of parameters or squared multiple cor-relations. Constrain parameters for more precise models by directly specifying path coefficients.
4. View output
Amos output provides standardized or un-standardized estimates of covariances and regression weights as well as a variety of model fit measures. Hotlinks in the help system link to explanations of the analysis in plain English.
5. Assess your model’s fit
Make any modifications to your model and print publi-cation-quality output.

55 To order, call 1-800-543-2185 | ibm.com/spss
IBM® SPSS® Modeler Solve your toughest challenges with data mining
With IBM SPSS Modeler, you can: • Access, manipulate and model any type of data, from any
source, from within a single intuitive interface • Integrate predictive intelligence into your operational
processes • Proactively and repeatedly identify revenue opportunities
and reduce costs • Boost productivity through collaboration and improve scal-
ability and performance with server-based options
IBM SPSS Modeler is a powerful, versatile data and text mining work-bench that helps you gain unprecedented insight from your data. Its breadth and depth of techniques allows you to build predictive mod-els easily, efficiently and rapidly. Organizations use IBM SPSS Modeler to improve business outcomes in critical areas such as customer relation-ship management, marketing, fraud and risk mitigation, inventory man-agement and resource planning.
Gain fast, accurate insight IBM SPSS Modeler is designed with business users in mind, so you don’t need to be an expert in data mining to enjoy its benefits.
IBM SPSS Modeler’s intuitive graphical interface makes it easy to visual-ize the data-mining process, and how it all fits together. From this inter-face, you can easily access your operational data, regardless of its format, along with text, Web 2.0 and survey data. You can also read from and write to a Cognos® Business Intelligence environment, as well as integrate with IBM InfoSphere™ technology, so you can gain even more predictive intelligence and integrate it into your business processes.
IBM SPSS Modeler’s powerful automated data preparation helps you get your data ready for analysis in a single step, while automated model-ing takes the guesswork out of choosing an analysis method by apply-ing all relevant techniques with a single click. Data preparation and modeling are presented in an interactive, highly visual viewer that makes models easy to understand and communicate. Once models are cre-ated, you can apply them to new data to identify cross-sell/up-sell opportunities proactively, manage customer retention strategically and identify fraud before it happens.
Play a quick demo
Measuring the Impact of Social MediaUnited Stationers uses IBM SPSS Predictive Analytics to track success of social media initiatives
United Stationers Inc. is a leading North American wholesale distribu-tor of business products. The company stocks approximately 100,000 items—including a broad and deep selection of technology products, office products, office furniture, janitorial and break room supplies, and industrial products—from over 1,000 manufacturers. Its customers include more than 25,000 resellers, which in turn serve many geo-graphic markets and have a diverse end-consumer base.
United Stationers needed to interpret the data collected in two separate pilot programs that leverage social media: an internal initiative aimed at enhancing two-way communications through the use of an innova-tive social business platform, USSCo Connects; and an external “listening” program aimed at capturing mentions of the company in tweets, blogs, Facebook postings, and the like.
The company uses IBM SPSS Statistics to analyze, correlate, and interpret data from these pilot programs, making it possible to lever-age results for improved internal communications and enhanced business outcomes.
“We got information on who’s using the USSCo Connects platform, and how they were using it,” says John Hassman, director of analyt-ics at United Stationers. “We matched users with departments and tracked their overall usage of the tool in terms of time. We saw how many users were connecting with other users, how many messages they were sending, whether they were replying to messages, whether they were downloading documents from blogs, and much more.” All of this data was imported into Statistics for analysis, and some inter-esting results surfaced; for example, correlation analysis shows that people who posted blogs also tended to upload documents. Similar analysis of potential users who did not take advantage of USSCo Connects will be used to refine the communications strategy.
Understanding user behavior has helped United Stationers put the right content and features on its internal social media site to reduce one-off communications, increase group participation, and deliver a consistent marketing message to sales.

56 To order, call 1-800-543-2185 | ibm.com/spss
You can install the software on your desktop and begin mining your data right away. Full integration with IBM SPSS Statistics allows you to use not only use all of Modeler’s predictive capabilities, but also IBM SPSS Statistics data transformation, hypothesis testing and reporting capabilities to complement and enhance your modeling efforts.
Choose the IBM SPSS Modeler software that best meets your analy-sis needs:
• IBM SPSS Modeler Professional includes all of the tools needed to leverage your structured data—such as behaviors and interactions tracked in your CRM systems, demographics, purchasing behavior and sales data
• IBM SPSS Modeler Premium Goes beyond the analysis of struc-tured data to include unstructured data such as web activity, blog content, customer feedback, emails, articles, and more to create more accurate predictive models. New features include Entity Ana-lytics that further extends capabilities to resolve relationships between data originating from different sources to address issues with data quality and matching. Social Network Analysis facilitates the discovery of relationships among social entities and the implica-tions of these relationships on an individual’s behavior.
Server-based option for enterprise-level scalability Sometimes you need to go beyond the desktop to analyze millions of records or deploy data mining as a part of enterprise architecture. IBM SPSS Modeler Server, available for both IBM SPSS Modeler Professional and IBM SPSS Modeler Premium, provides client/server architecture, in-database mining, SQL pushback and batch processing. In-database mining exposes modeling algorithms in operational databases such as SQL, DB2 and Oracle and allows you to leverage database resources, vastly improving performance while enabling you to use the additional algorithms IBM SPSS Modeler provides. SQL pushback allows you to push data transformations and some key models directly into your oper-ational database, improving performance significantly by leveraging the power of the database for high-volume, mission-critical tasks.
IBM SPSS Modeler offers leading ease-of-use features such as automatic data preparation and automatic modeling, mak-ing it easy to build models that leverage single or multiple (ensemble) techniques.
IBM SPSS Modeler introduces the ability to read from and write to a Cognos Business Intelligence environment directly, helping ensure business analysts can leverage the same view of data across their analytical work and can easily integrate predictive intelligence into their Business Intelligence dashboards directly from the IBM SPSS Modeler interface.
IBM SPSS Modeler includes advanced, interactive visualization for mod-els that use a single technique, or ensemble models that combine tech-niques, making modeling results easy to understand and communicate.
IBM SPSS Modeler Premium adds the ability to integrate unstructured data (text) into modeling efforts; analysts can extract concepts and asso-ciated sentiment, visualize relationships between concepts and senti-ment and structure unstructured data for use in predictive models from a single interface.

57 To order, call 1-800-543-2185 | ibm.com/spss
IBM® SPSS® Modeler Premium Improve model accuracy with structured and unstructured data, entity analytics and social network analysis
Take a more in-depth look at IBM SPSS Modeler PremiumWith SPSS Modeler Premium, you can be more focused and agile in your planning and daily decision making because of its unique com-bination of capabilities. It enables you to have a better understanding of your organization, the environment in which you operate, your cus-tomers and other stakeholders. These capabilities include:
• Entity analytics. Organizations often combine multiple data sources. But what happens when there is no clear match between records? SPSS Modeler Premium’s entity analytics capabilities let you discover these relationships and deliver non-obvious identity and relationship awareness. It allows you to consolidate records where appropriate—or keep them separate. Entity analytics is critical for border security, detecting fraud and properly identifying criminal suspects. But it is also enormously useful for businesses wanting to avoid presenting different offers to the same person in a marketing campaign or to ensure that you are building accurate models.
• Social network analysis. Discover the relationships among social entities and the resulting implications of these relationships on an indi-vidual’s behavior. SPSS Modeler Premium’s social network analysis capabilities are particularly useful for those in telecommunications and other industries concerned about churn. You can identify groups, group leaders and whether others will churn based on their influ-ence. It consists of two capabilities that greatly enhance models to predict churn:
– Group analysis—Identify the groups in the data and who are their leaders.
– Diffusion analysis—Use existing churn information to deter-mine who the current churners are and what will influence them to leave.
• Big data analytics. IBM SPSS Modeler Premium easily integrates with IBM and non-IBM databases, allowing models to be deployed and scored with greater speed and efficiency. Data can be scored within the database and in real time against transactional data such as high volume sales, customer service and claims transactions.
• IBM Cognos software integration. Analysts can access structured data directly through Cognos Business Intelligence software to quickly and reliably evaluate the likelihood of specific outcomes. You can make predictive intelligence gleaned from a customer view that combines structured and unstructured data available to business users and all stakeholders who rely on Cognos dashboards.
• IBM Netezza® functionality. Perform in-database analytics within the Netezza appliance to build and deploy analytic applications that scale to sizes only addressable by supercomputers today.
Additionally, SPSS Modeler Premium can extract insights from text data, enabling organizations to:
• Receive faster, more accurate results when analyzing banking, insur-ance or advertising text, emoticons and slang with new industry-specific text analysis packages and templates.
• Create hierarchical categorization structures to organize concepts more logically and in greater detail.
• Import pre-defined categories, including hierarchical categories, annotations and keyword descriptors and export them to Excel.
• Save hierarchical categories for reuse with an enhanced semantic network grouping technique for category building.
• Extract text faster and more accurately, especially when working with large datasets, by leveraging new industry sensitive semantic networks and more efficient use of hardware.
• Define and test rules on sample text before applying them to your data, using the enhanced text link rule editor.
Download datasheet and full specification

58 To order, call 1-800-543-2185 | ibm.com/spss
Learning Healthy HabitsBJC School Outreach and Youth Development gains insight into effectiveness of health education programs using IBM® SPSS® Statistics
BJC School Outreach and Youth Development, a unit of BJC HealthCare, is dedicated to creating effective risk prevention programs for a mix of public, private and parochial schools in Missouri and Illinois. Each year, the organization’s 15-member team of health educators presents grade appropriate programs to some 80,000 K-12 students in 300 schools.
BJC School Outreach and Youth Development wanted to provide schools with meaningful intelligence about the effectiveness of its health curriculum, but was hampered by antiquated, in-house data analysis and reporting tools.
BJC School Outreach and Youth Development replaced its patchwork of spreadsheets with IBM SPSS Statistics, enabling the department to create detailed and flexible reports based on tens of thousands of student assessments a year.
IBM SPSS predictive analytics changed all that, enabling BJC School Outreach and Youth Development to compile, sort and analyze thou-sands of assessment forms with relative ease. “I’m able to focus more on what the data is telling us rather than directing my energy at mak-ing sure the reports are accurate,” Wilhold says. “Automated statistical analysis and tools take a lot of the headache out of data manipulation, building tables, and showing relevant graphics.”
The new analytical and reporting platform also improves BJC’s con-sultations with school administrators. “We can instantly pull reports when we have a meeting with partners to show them exactly where their students are with their test scores without going through the has-sle of trying to gather data and build a report,” Wilhold says. “We have specific pre-built reports to handle ad hoc requests from management and our school clients.”
Even more important, the solution is helping the organization achieve its primary goal of being of greater service to the community and con-tributing to the betterment of its collective health. “That’s really the key for us—to be able to see that we’re making a difference in the kids’ lives and having an impact on that classroom or school,” Wilhold says. “Predictive analytics helps us to see the big picture in a variety of ways, helping us build and maintain stronger partnerships with schools.”

59 To order, call 1-800-543-2185 | ibm.com/spss
IBM® SPSS® Modeler Professional Make better decisions through predictive intelligence
IBM SPSS Modeler Professional makes it easy to discover insights in your data so that you can proactively take advantage of opportunities and mitigate risks. This intuitive, visual data-mining workbench enables business users and professional analysts alike to quickly and easily access, prepare and model structured data to solve business chal-lenges. A graphical interface walks you through every step of the modeling process. By interacting with streams, analysts and business users can collaborate in adding business knowledge to the data- mining process, explore data more deeply and achieve faster results.
Streamline the data-mining processSPSS Modeler Professional is popular with analysts and business users alike. Its automated data preparation and modeling features enable non-analysts to produce accurate models quickly and easily without spe-cialized skills. While professional analysts can take advantage of the software’s advanced data preparation and predictive modeling capa-bilities to create the most sophisticated of streams.
Easily create and evaluate sophisticated models Choose from an array of pre-built algorithms to help you create mod-els visually and intuitively.
Classification algorithms: Make predictions or forecasts using tech-niques such as Decision Tree, Neural Networks, Logistic Regression, Time-Series, Support Vector Machines, Cox regression and more. Leverage automatic classification modeling for both binary and numeric outcomes.
Segmentation algorithms: Group people or detect unusual patterns with automatic clustering, anomaly detection and clustering neural network techniques. Use automatic classification to apply multiple algo-rithms with a single step and take the guesswork out of selecting the right technique.
Association algorithms: Discover associations, links or sequences using Apriori, CARMA and sequential association.
View models interactively and apply advanced analytical and visual-ization techniques to help you understand and communicate the results of your analysis. Then efficiently deploy insight and predictive models on a scheduled basis or in real time.
Optimize your current information technologiesWith its open and scalable architecture, SPSS Modeler makes the best use of your existing IT infrastructure. It integrates with your existing sys-tems, both when accessing data and when deploying results, so you don’t need to move data into and out of a proprietary format. Addition-ally, techniques such as in-database mining, SQL pushback, multi-threading, server clustering and in-database scoring help conserve resources, deliver results faster and reduce overall IT costs.
Follow a proven, repeatable processDuring every phase of the data mining process, SPSS Modeler sup-ports the de facto industry standard, the Cross-Industry Standard Process for Data Mining (CRISP-DM). This means users can focus on solving business problems through data mining, rather than on rein-venting a new process for every project. Individual Modeler projects can be efficiently organized using the CRISP-DM project manager.
CRISP DM is the cross-industry standard process for data mining. It is a vendor and industry neutral methodology that goes through six iterative steps.
Business Understanding Which focuses on understanding the project objectives and requirements from a business perspective Data Understanding The initial data collection and proceeds with activities in order to get familiar with the data, to identify data quality problems, to discover first insights into the data. Data Preparation Data preparation tasks are likely to be performed multiple times, and not in any prescribed order to construct the final data to be used for modeling Modeling This is where various modeling techniques are applied and often involves stepping back to the data preparation phase as more information comes to hand. Evaluation Before proceeding to final deployment of the model, it is important to more thor-oughly evaluate the model or models to be certain that they properly achieve busi-ness objectives. Deployment Depending on the requirements, the deployment phase can be as simple as gen-erating a report or perhaps implementing a repeatable data-mining process that is embedded into operational systems.
Download datasheet and full specification

Index
BBVA ................................................................................................................................................42
BJC School Outreach ........................... .................................................................................... 58
Centerstone Research Institute ............................................ .................................................24
Follow the path to improved outcomes............ ..................................................................... 4
Government scenario ..................................... ........................................................................... 29
IBM Analytic Answers ............ ....................................................................................................47
IBM Cognos Insight ............ ........................................................................................................ 45
IBM Social Media Analytics ......................................................................................................42
IBM SPSS Advanced Statistics ...................... ........................................................................ 19
IBM SPSS Amos ............................................ .............................................................................. 53
IBM SPSS Bootstrapping ............................... ..........................................................................27
IBM SPSS Categories .................................... ............................................................................37
IBM SPSS Complex Samples ................................................................................................ 29
IBM SPSS Conjoint ........................................ ............................................................................. 39
IBM SPSS Custom Tables .............................. ...........................................................................17
IBM SPSS Data Collection Data Entry ........... ......................................................................41
IBM SPSS Data Preparation ........................... ......................................................................... 13
IBM SPSS Developer ..................................... ............................................................................ 33
IBM SPSS Decision Trees .............................. .......................................................................... 15
IBM SPSS Direct Marketing .....................................................................................................32
IBM SPSS Exact Tests ................................... ........................................................................... 36
IBM SPSS Forecasting ................................... ............................................................................25
IBM SPSS Missing Values .............................. ......................................................................... 23
IBM SPSS Modeler ........................................ ............................................................................. 55
IBM SPSS Modeler Premium ......................... .........................................................................57
IBM SPSS Modeler Professional .................... ...................................................................... 59
IBM SPSS Neural Networks ........................... ........................................................................ 34
IBM SPSS Regression ................................................................................................................ 21
IBM SPSS SamplePower ............................... ............................................................................51
IBM SPSS Statistics ......................................... ............................................................................. 8
IBM SPSS Statistics Base .............................. .......................................................................... 10
IBM SPSS Statistics Server............................ ........................................................................... 31
IBM SPSS Text Analytics for Surveys ............ .................................................................... 49
IBM SPSS Training ........................................... ..............................................................................9
IBM SPSS Visualization Designer................... ....................................................................... 35
MarketCast ................................... .................................................................................................. 26
Memphis Police Department............................. ...................................................................... 15
Mueller Inc. ............ ......................................................................................................................... 45
New York University ......................................... ........................................................................... 22
United Stationers Inc. .................................................................. ............................................... 55
What’s new in IBM SPSS Statistics.................. .......................................................................6
Who uses IBM SPSS analytics? ....................... ....................................................................... 3
XO Communications ......................................... ......................................................................... 39
Move from analytics to predictive analytics The top five benefits of using IBM SPSS Statistics and IBM SPSS Modeler together:
• Move seamlessly between the two products• Include more types of data, including text, in your analyses• Tap into a wealth of modeling algorithms, plus automatic modeling• Test multiple modeling techniques on any issue—easily• Use a visual, secure, repeatable process
Ask your sales representative to show you how you can benefit.

YTZ03001-USEN-02 © Copyright IBM Corporation 2013


![Discgolf3 ps autosaved v22[1]](https://img.dokumen.tips/doc/110x75/589fda921a28abf06d8b6905/discgolf3-ps-autosaved-v221.jpg)