Embed Size (px)
Citation preview
Sprint NextelSprint Nextel2Q11 Earnings Conference Call
July 28, 2011
© 2011 Sprint© 2011 Sprint
Cautionary StatementThis presentation includes “forward-looking statements” within the meaning of the securities laws. The statements in this presentation regarding the business outlook, expected performance and f d l ki id ll th t t t th t t hi t i l f t f d l ki t t t Th d " ti t " " j t " "f t " "i t d " " t " "b li " "t t "forward-looking guidance, as well as other statements that are not historical facts, are forward-looking statements. The words "estimate," "project," "forecast," "intend," "expect," "believe," "target," "providing guidance" and similar expressions are intended to identify forward-looking statements. Forward-looking statements are estimates and projections reflecting management's judgment based on currently available information and involve a number of risks and uncertainties that could cause actual results to differ materially from those suggested by the forward-looking statements. With respect to these forward-looking statements, management has made assumptions regarding, among other things, customer and network usage, customer growth and retention, pricing, operating costs, the timing of various events and the economic and regulatory environment.
Future performance cannot be assured. Actual results may differ materially from those in the forward-looking statements. Some factors that could cause actual results to differ include:
• our ability to attract and retain subscribers;our ability to attract and retain subscribers;• the ability of our competitors to offer products and services at lower prices due to lower cost structures;• the effects of vigorous competition on a highly penetrated market, including the impact of competition on the price we are able to charge subscribers for services and equipment we provide and
our ability to attract new subscribers and retain existing subscribers; the overall demand for our service offerings, including the impact of decisions of new or existing subscribers between our postpaid and prepaid services offerings and between our two network platforms; and the impact of new, emerging and competing technologies on our business;
• the ability to generate sufficient cash flow to fully implement our network modernization plan, Network Vision, to improve and enhance our networks and service offerings, implement our business strategies and provide competitive new technologies;
• the effective implementation of Network Vision, including timing, technologies, and costs;• consummation of the LightSquared transaction and the associated financial benefits;g q ;• changes in available technology and the effects of such changes, including product substitutions and deployment costs;• our ability to obtain additional financing on terms acceptable to us, or at all; • volatility in the trading price of our common stock, current economic conditions and our ability to access capital;• the impact of unrelated parties not meeting our business requirements, including a significant adverse change in the ability or willingness of such parties to provide devices or infrastructure
equipment for our CDMA network, or Motorola Mobility, Inc.'s or Motorola Solutions Inc.'s ability or willingness to provide related devices, infrastructure equipment and software applications for our iDEN network;
• the costs and business risks associated with providing new services and entering new geographic markets; • the financial performance of Clearwire and its ability to develop, deploy and maintain its 4G network;t e a c a pe o a ce o C ea e a d ts ab ty to de e op, dep oy a d a ta ts G et o ;• the effects of mergers and consolidations and new entrants in the communications industry and unexpected announcements or developments from others in the communications industry; • unexpected results of litigation filed against us or our suppliers or vendors;• the impact of adverse network performance;• the costs or potential customer impacts of compliance with regulatory mandates including, but not limited to, compliance with the FCC's Report and Order to reconfigure the 800 MHz band;• equipment failure, natural disasters, terrorist acts or other breaches of network or information technology security;• one or more of the markets in which we compete being impacted by changes in political, economic or other factors such as monetary policy, legal and regulatory changes or other external factors
over which we have no control; and • other risks referenced from time to time in our filings with the Securities and Exchange Commission including in Part I Item IA “Risk Factors” of our annual report on Form 10-K for the year• other risks referenced from time to time in our filings with the Securities and Exchange Commission, including in Part I, Item IA Risk Factors of our annual report on Form 10-K for the year
ended December 31, 2010 and, when filed, Part II, Item 1A “Risk Factors” of our quarterly report on Form 10-Q for the quarter ended June 30, 2011.
Sprint Nextel believes these forward-looking statements are reasonable; however, you should not place undue reliance on forward-looking statements, which are based on current expectations and speak only as of the date of this release. Sprint Nextel is not obligated to publicly release any revisions to forward-looking statements to reflect events after the date of this release. The reader should not place undue reliance on forward-looking statements, which speak only as of the date of this release.
Clearwire’s second quarter 2011 results from operations have not yet been finalized. As a result, the amount reflected for Sprint’s share of Clearwire’s results of operations for the quarter ended June 30, 2011, is an estimate and, based upon the finalization of Clearwire’s results, may need to be revised if our estimate materially differs from Clearwire’s actual results. Changes in our estimate, if any,
© 2011 Sprint2
p y y g ywould affect the carrying value of our investment in Clearwire, net loss and basic and diluted loss per common share but would have no effect on Sprint’s operating income, OIBDA*, Adjusted OIBDA* or consolidated statement of cash flows.
*Non-GAAP Financial MeasuresSprint Nextel provides financial measures determined in accordance with accounting principles generally accepted in the United States (GAAP) and adjusted GAAP (non-GAAP). The non-GAAP financial measures reflect industry conventions, or standard measures of liquidity, profitability or performance commonly used by the investment community for comparability purposes. These measurements should be considered in addition to, but not as a substitute for, financial information prepared in accordance withGAAP. We have defined below each of the non-GAAP measures we use, but these measures may not be synonymous to similar measurement terms used by other companies.
Sprint Nextel provides reconciliations of these non-GAAP measures in its financial reporting. Because Sprint Nextel does not predict special items that might occur in the future, and our forecasts are developed at a level of detail different than that used to prepare GAAP-based financial measures, Sprint Nextel does not provide reconciliations to GAAP of its forward-looking financial measures.
Th d i thi t ti i l d th f ll iThe measures used in this presentation include the following:
OIBDA is operating income/(loss) before depreciation and amortization. Adjusted OIBDA is OIBDA excluding severance, exit costs, and other special items. Adjusted OIBDA Margin represents Adjusted OIBDA divided by non-equipment net operating revenues for Wireless and Adjusted OIBDA divided by net operating revenues for Wireline. We believe that Adjusted OIBDA and Adjusted OIBDAMargin provide useful information to investors because they are an indicator of the strength and performance of our ongoing business operations, including our ability to fund discretionary spending such as capital expenditures, spectrum acquisitions and other investments and our ability to incur and service debt. While depreciation and amortization are considered operating costs under GAAP, these expenses primarily represent non-cash current period costs associated with the use of long-lived tangible and definite-lived intangible assets. Adjusted OIBDA and Adjusted OIBDA Margin are calculations commonly used as a basis for investors, analysts and credit rating agencies to evaluate and compare the periodic and future operating performance and value of companieswithin the telecommunications industry.
Free Cash Flow is the cash provided by operating activities less the cash used in investing activities other than short-term investments and equity method investments during the period. We believe that Free Cash Flow provides useful information to investors, analysts and our management about the cash generated by our core operations after interest and dividends and our ability to fund scheduled debt maturities and other financing activities, including discretionary refinancing and retirement of debt andpurchase or sale of investments.
© 2011 Sprint
p
3
Customer Experience
• Unbeaten among major wireless carriers for Overall C-Sat, and best 3-year improvement of any company across all industries (ACSI)(ACSI)
• 14 consecutive quarters of Care C Sat• 14 consecutive quarters of Care C-Sat improvement (Advanis)
• Best ever Top and Bottom Box C-Sat (Advanis)
© 2011 Sprint4
Customer Experience (cont’d)
• Industry-best Call C-Sat (Vocalabs)
B t O ll C t S ti f ti D t• Best ever Overall Customer Satisfaction. Data Services CSAT unbeaten in the industry (Sprint Brand Third Party)Brand, Third Party).
• Best ever Postpaid Churn. Best 5 quarters in S i t hi t th l t fiSprint history were the last five.
• Best Prepaid Churn in almost 6 yearsest epa d C u a ost 6 yea s
• Best ever Calls per Customer
© 2011 Sprint5
Brand• Third consecutive quarter of > 1M Total Wireless Net Adds
• Seventh consecutive quarter of Sprint Brand positive NetSeventh consecutive quarter of Sprint Brand positive Net Adds
• Sprint Brand net port positive for fifth consecutive quarterp p p q
• Eighth consecutive quarter of Total Postpaid Net Add YoY improvementp
• Best ever ‘First Brand Preference’ and ‘Most Want to Investigate’g
• Most improved YoY Net Promoter Score (Sprint Brand, Third Party)
© 2011 Sprint6
Prepaid
• Best Churn in almost 6 years
• Second best Net Add Q2 ever Q
• Boost #1 in Customer Care for Non-Contract wireless service (JDPA)
© 2011 Sprint7
Green
• UL Environment Platinum certification -Samsung Replenish
• 2011 Sustainability Leadership Award -• 2011 Sustainability Leadership Award -International Electronics Recycling Conference and Expop
“A” grade for paper use from ForestEthics• “A” grade for paper use from ForestEthics
© 2011 Sprint8
Cash
• Positive Free Cash Flow*
• Second consecutive quarter of Operating Income
• Wireless Service Revenue increased sequentially and YoY for third consecutivesequentially and YoY for third consecutive quarter
• Largest YoY Postpaid ARPU improvement in over 7 years
© 2011 Sprint9
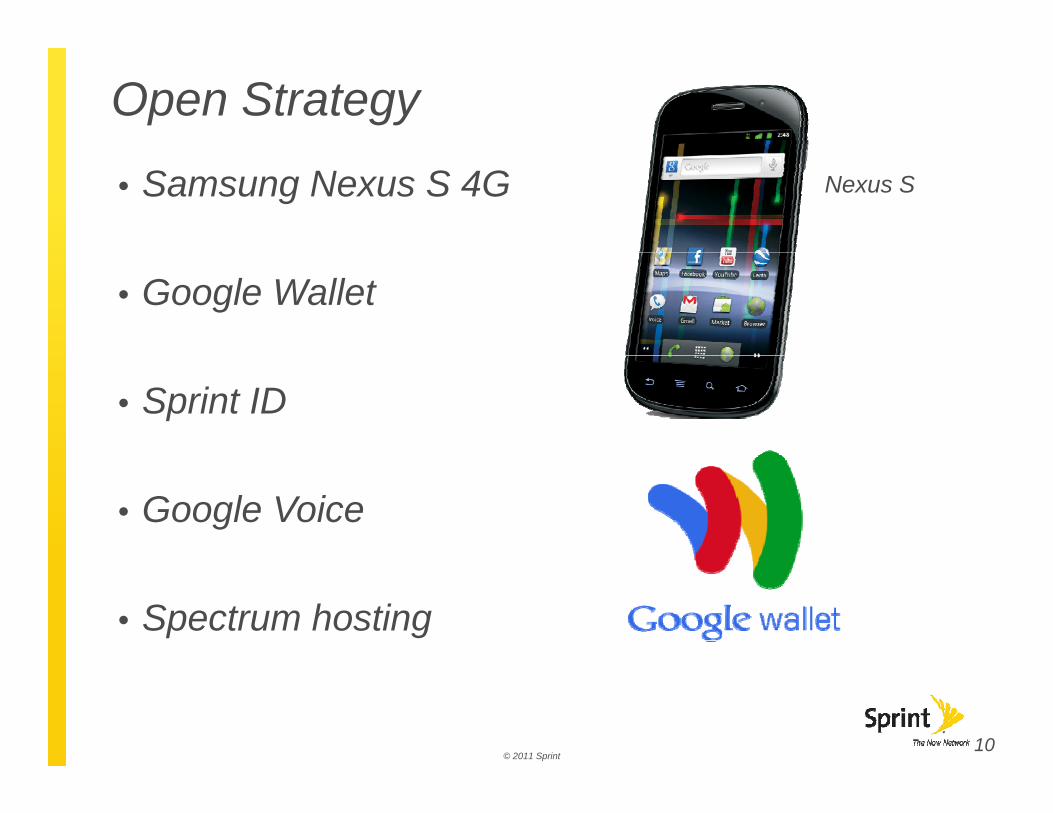
Open Strategy
• Samsung Nexus S 4G Nexus S
• Google Wallet
• Sprint ID
• Google Voice
• Spectrum hosting
© 2011 Sprint10
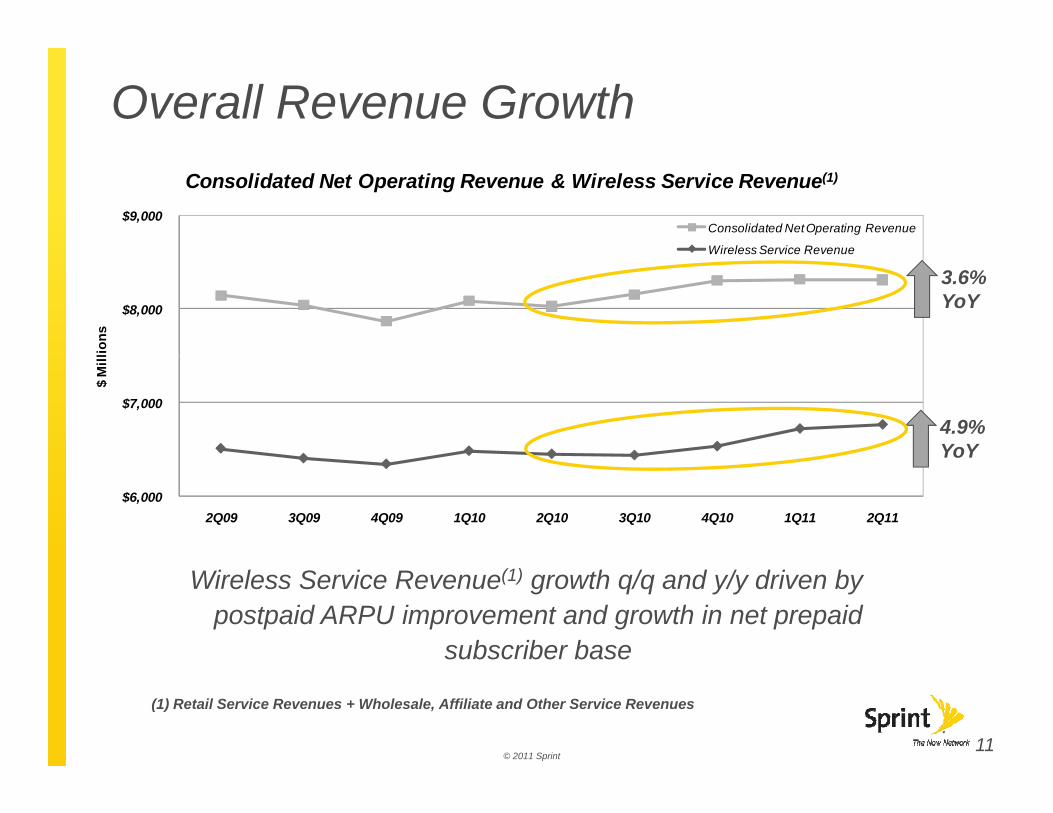
Overall Revenue Growth
$9,000
Consolidated Net Operating Revenue & Wireless Service Revenue(1)
Consolidated Net Operating Revenue
Wireless Service Revenue
$8,000
lions
Wireless Service Revenue
3.6%YoY
$7,000
$ M
ill
4.9%YoY
$6,000 2Q09 3Q09 4Q09 1Q10 2Q10 3Q10 4Q10 1Q11 2Q11
Wireless Service Revenue(1) growth q/q and y/y driven by postpaid ARPU improvement and growth in net prepaid
subscriber base
© 2011 Sprint
(1) Retail Service Revenues + Wholesale, Affiliate and Other Service Revenues
11
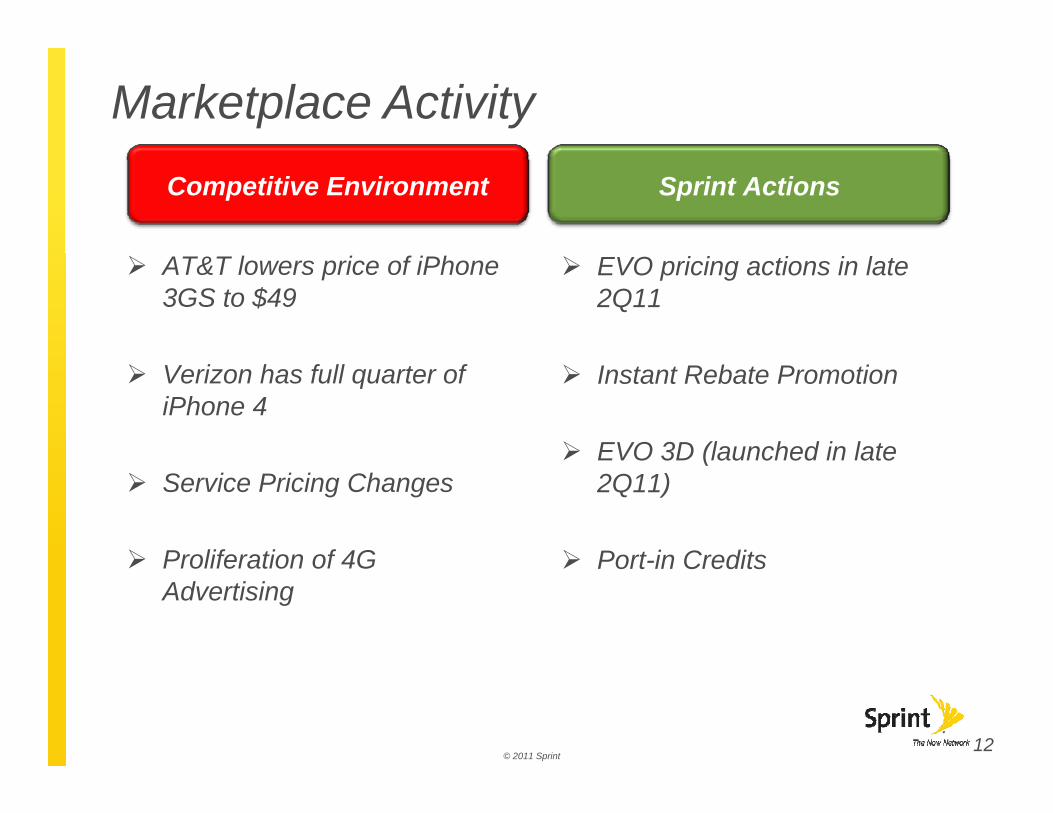
Marketplace ActivityCompetitive Environment Sprint Actions
AT&T lowers price of iPhone 3GS to $49
EVO pricing actions in late 2Q11
Verizon has full quarter of iPhone 4
Instant Rebate Promotion
EVO 3D (launched in late Service Pricing Changes
Proliferation of 4G
EVO 3D (launched in late 2Q11)
Port in Credits Proliferation of 4G Advertising
Port-in Credits
© 2011 Sprint12
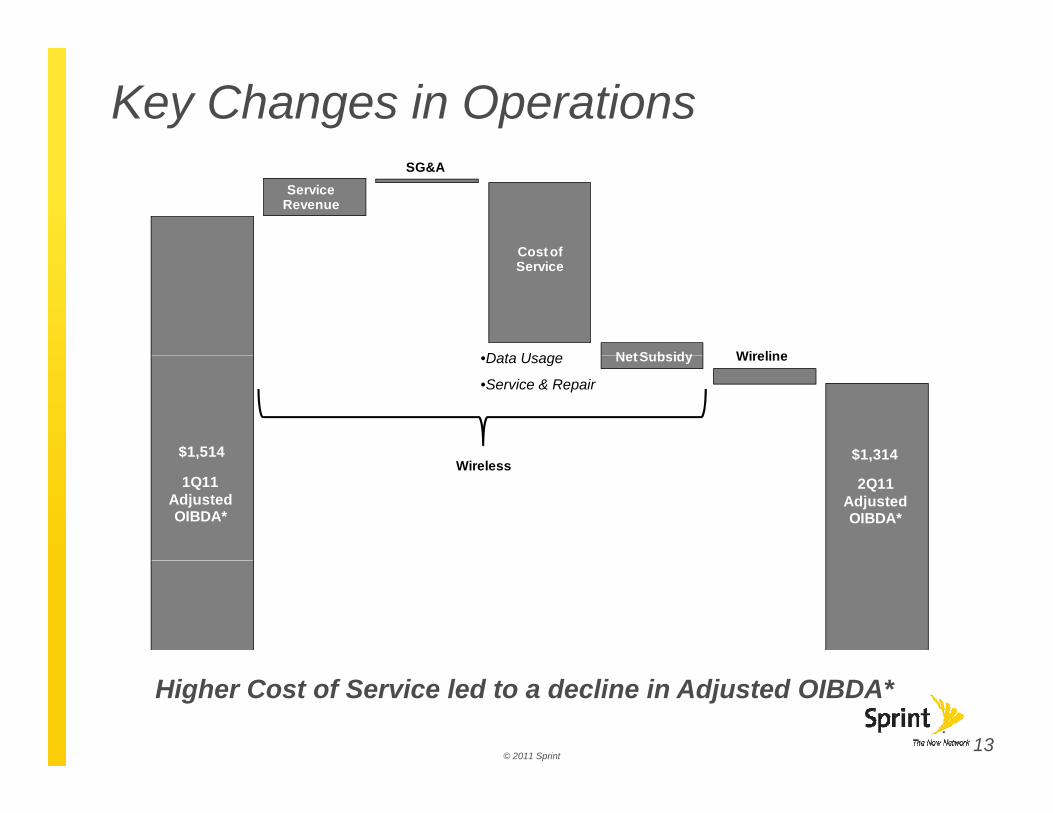
Key Changes in Operations Service
Revenue
SG&A
Cost of
Prepaid Contribution
Cost of Service
Net Subsidy WirelineData Usage Net Subsidy Wireline
$1,314$1,514
•Data Usage
•Service & Repair
1Q11Adjusted OIBDA*
2Q11 Adjusted OIBDA*
Wireless$1,314$ ,
© 2011 Sprint
Higher Cost of Service led to a decline in Adjusted OIBDA*
13
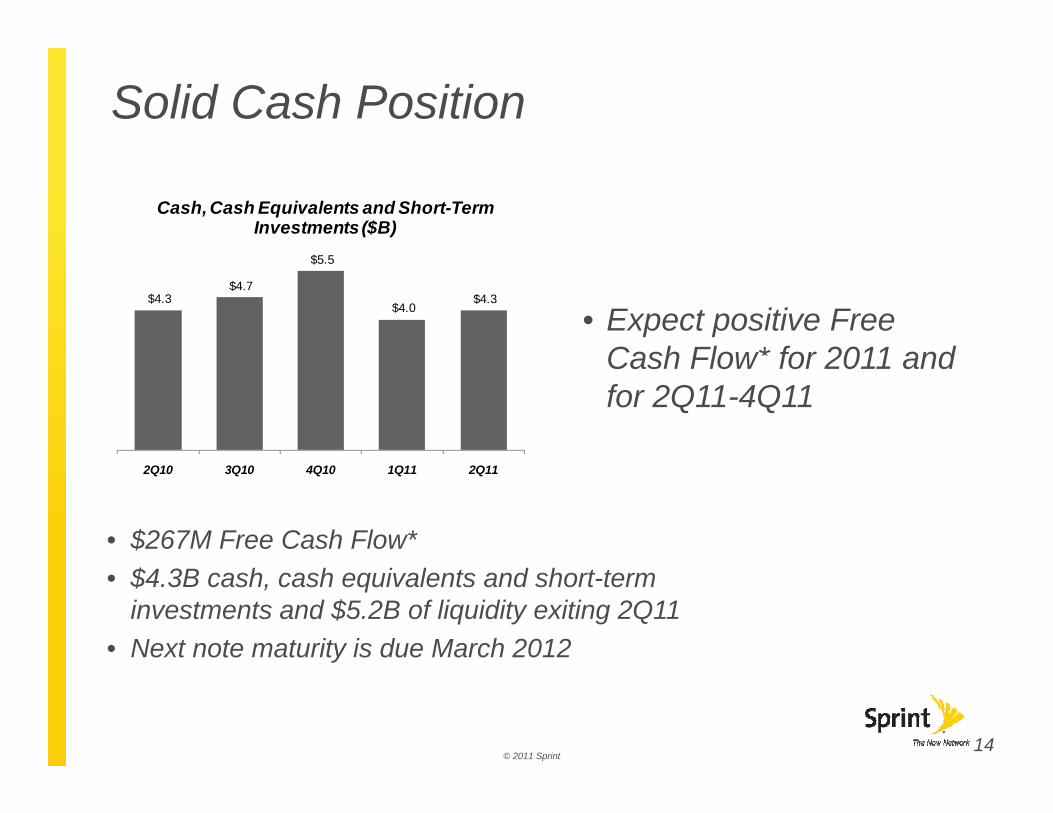
Solid Cash Position
Cash, Cash Equivalents and Short-Term Investments ($B)
• Expect positive Free Cash Flow* for 2011 and
$4.3 $4.7
$5.5
$4.0 $4.3
Cash Flow for 2011 and for 2Q11-4Q11
• $267M Free Cash Flow*
2Q10 3Q10 4Q10 1Q11 2Q11
• $4.3B cash, cash equivalents and short-term investments and $5.2B of liquidity exiting 2Q11
• Next note maturity is due March 2012
© 2011 Sprint14
Key Strategic Items
• Network Vision – Initial deployment in 4Q11
• Agreements with tower companies
• Analyst/Investor Day on October 7th to provide long-term 4G strategylong term 4G strategy
© 2011 Sprint15
Spectrum hosting agreement with LightSquared
• $9 billion in cash
• $4.5 billion in credits (if we choose to resell capacity)
• Expect positive Adjusted OIBDA* and margin impact over 11 year periodpac o e yea pe od
• Expect Free Cash Flow* benefit• Expect Free Cash Flow benefit
Protection contingencies
© 2011 Sprint
• Protection contingencies
16

Q&A
© 2011 Sprint17
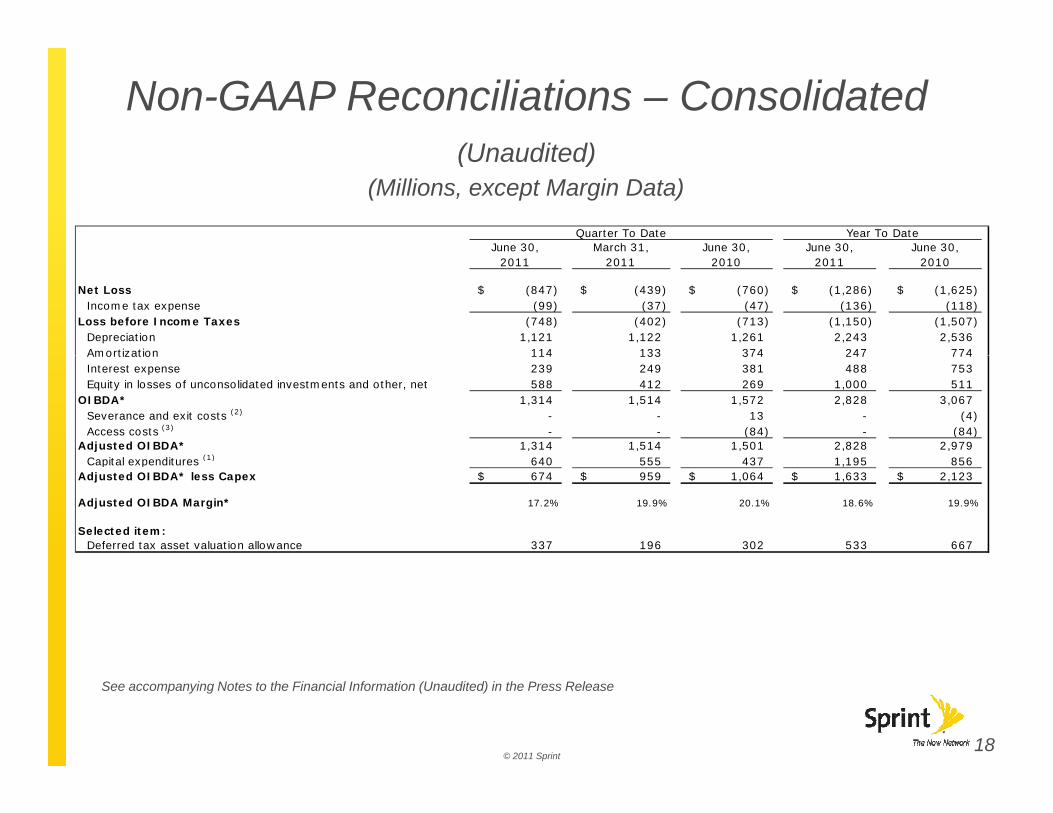
Non-GAAP Reconciliations – Consolidated(Unaudited)(Unaudited)
(Millions, except Margin Data)
Quarter To Date Year To DateJune 30, March 31, June 30, June 30, June 30,, , , , ,
2011 2011 2010 2011 2010
Net Loss (847)$ (439)$ (760)$ (1,286)$ (1,625)$ Income tax expense (99) (37) (47) (136) (118)
Loss before Income Taxes (748) (402) (713) (1,150) (1,507) Depreciation 1,121 1,122 1,261 2,243 2,536 Amortization 114 133 374 247 774 Amortization 114 133 374 247 774 Interest expense 239 249 381 488 753 Equity in losses of unconsolidated investments and other, net 588 412 269 1,000 511
OIBDA* 1,314 1,514 1,572 2,828 3,067 Severance and exit costs (2) - - 13 - (4) Access costs (3) - - (84) - (84)
Adjusted OIBDA* 1,314 1,514 1,501 2,828 2,979 C it l dit (1) 640 555 437 1 195 856 Capital expenditures (1) 640 555 437 1,195 856
Adjusted OIBDA* less Capex 674$ 959$ 1,064$ 1,633$ 2,123$
Adjusted OIBDA Margin* 17.2% 19.9% 20.1% 18.6% 19.9%
Selected item:Deferred tax asset valuation allowance 337 196 302 533 667
© 2011 Sprint18
See accompanying Notes to the Financial Information (Unaudited) in the Press Release
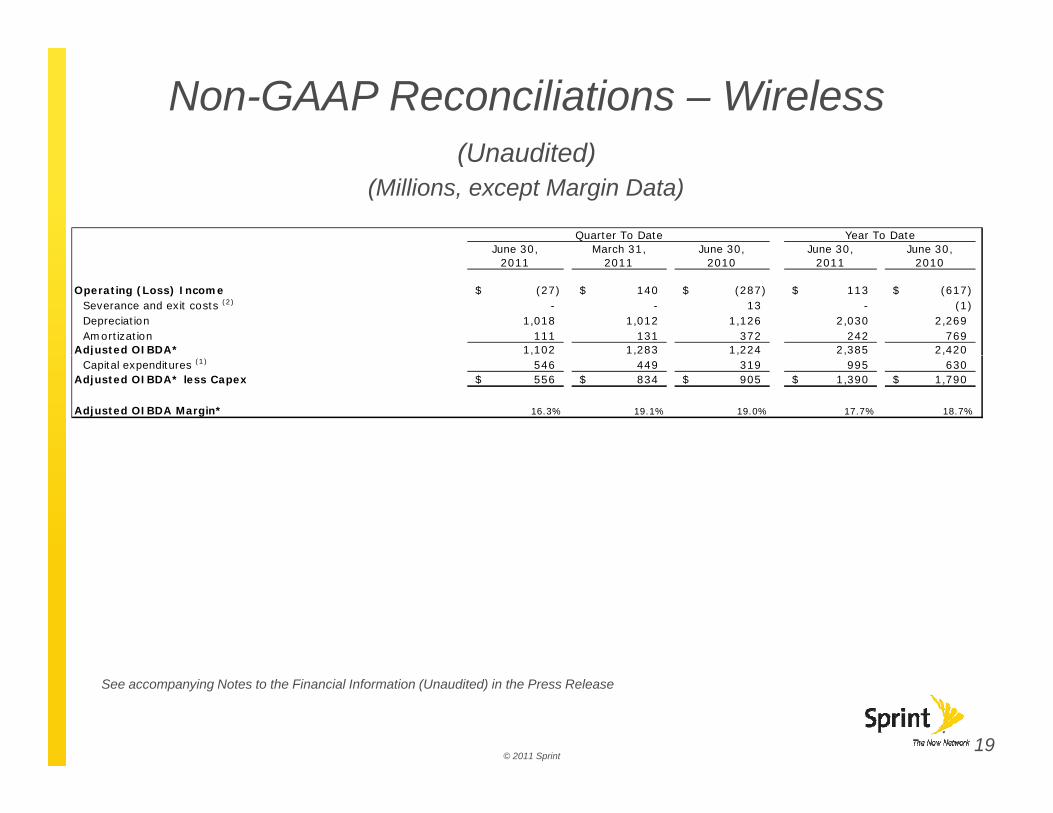
Non-GAAP Reconciliations – Wireless(Unaudited)(Unaudited)
(Millions, except Margin Data)
Quarter To DateJune 30, March 31, June 30, June 30, June 30,
Year To Dateu 30, a 3 , u 30, u 30, u 30,2011 2011 2010 2011 2010
Operating (Loss) Income (27)$ 140$ (287)$ 113$ (617)$ Severance and exit costs (2) - - 13 - (1) Depreciation 1,018 1,012 1,126 2,030 2,269 Amortization 111 131 372 242 769
Adjusted OIBDA* 1,102 1,283 1,224 2,385 2,420 jCapital expenditures (1) 546 449 319 995 630
Adjusted OIBDA* less Capex 556$ 834$ 905$ 1,390$ 1,790$
Adjusted OIBDA Margin* 16.3% 19.1% 19.0% 17.7% 18.7%
© 2011 Sprint19
See accompanying Notes to the Financial Information (Unaudited) in the Press Release
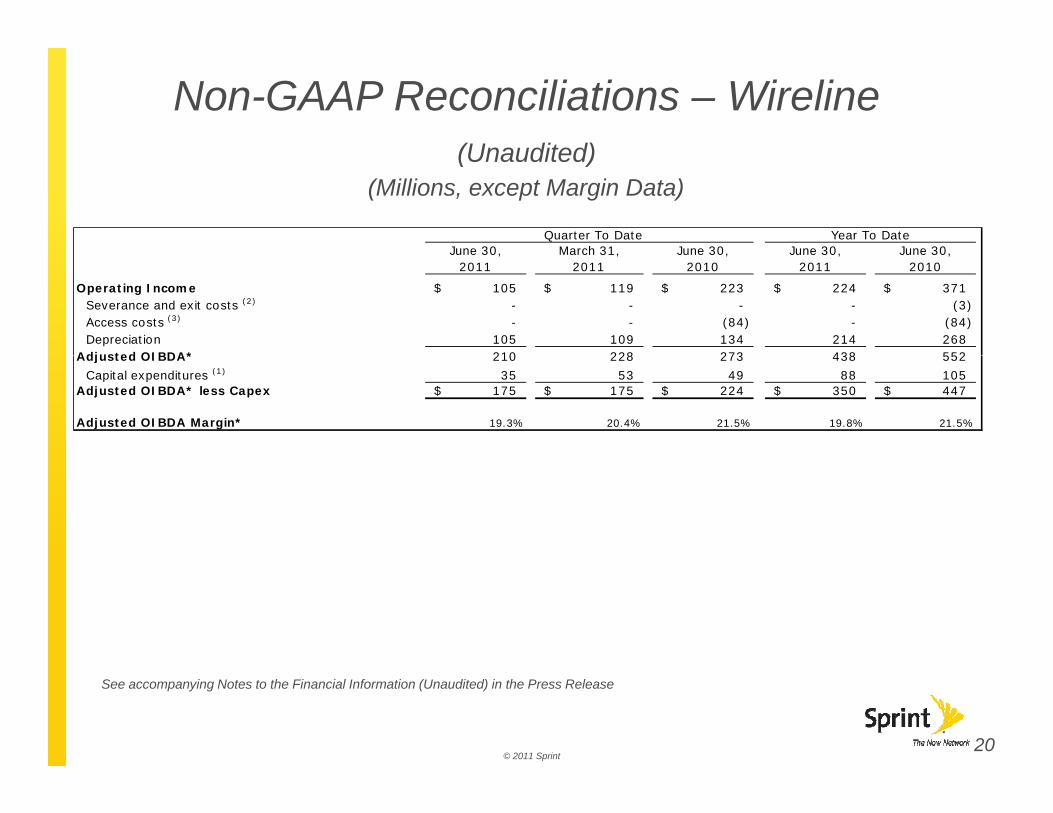
Non-GAAP Reconciliations – Wireline(Unaudited)(Unaudited)
(Millions, except Margin Data)
Quarter To DateJune 30 March 31 June 30 June 30 June 30
Year To DateJune 30, March 31, June 30, June 30, June 30,
2011 2011 2010 2011 2010
Operating Income 105$ 119$ 223$ 224$ 371$ Severance and exit costs (2) - - - - (3) Access costs (3) - - (84) - (84) Depreciation 105 109 134 214 268
Adjusted OIBDA* 210 228 273 438 552 Adjusted OIBDA* 210 228 273 438 552
Capital expenditures (1) 35 53 49 88 105 Adjusted OIBDA* less Capex 175$ 175$ 224$ 350$ 447$
Adjusted OIBDA Margin* 19.3% 20.4% 21.5% 19.8% 21.5%
© 2011 Sprint20
See accompanying Notes to the Financial Information (Unaudited) in the Press Release
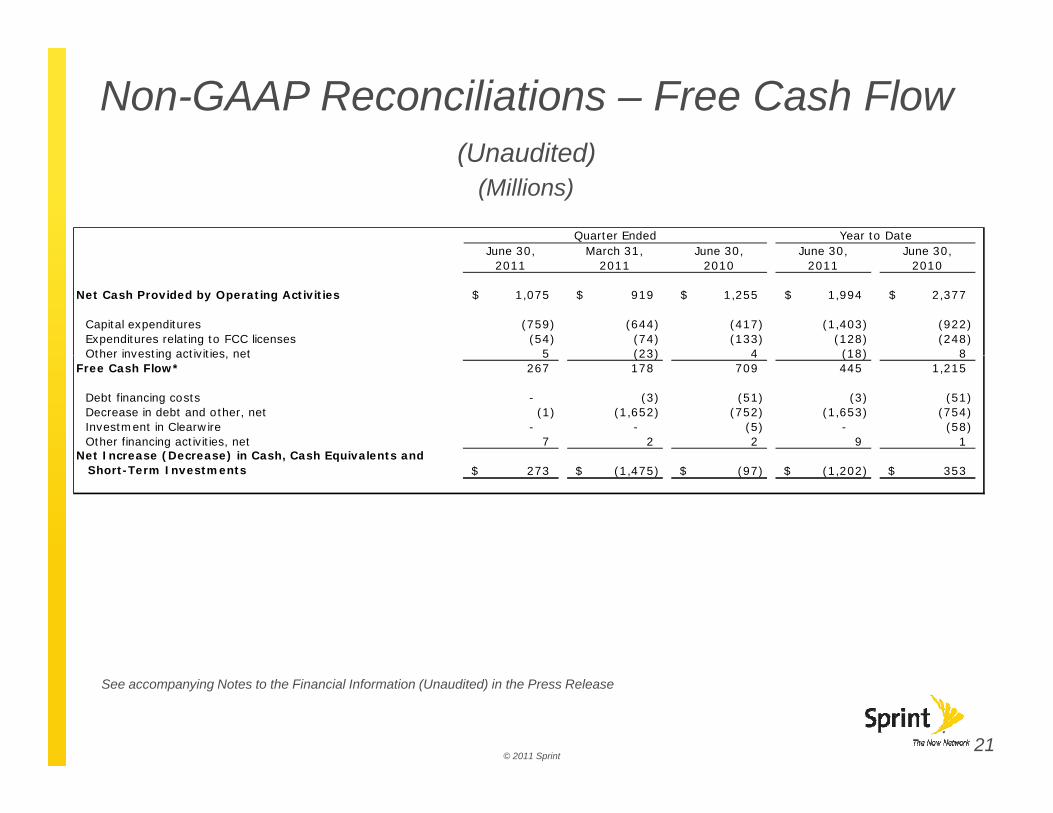
Non-GAAP Reconciliations – Free Cash Flow(Unaudited)(Unaudited)
(Millions)
Quarter Ended Year to DateJune 30 March 31 June 30 June 30 June 30June 30, March 31, June 30, June 30, June 30,
2011 2011 2010 2011 2010
Net Cash Provided by Operating Activities 1,075$ 919$ 1,255$ 1,994$ 2,377$
Capital expenditures (759) (644) (417) (1,403) (922) Expenditures relating to FCC licenses (54) (74) (133) (128) (248) Other investing activities net 5 (23) 4 (18) 8 Other investing activities, net 5 (23) 4 (18) 8
Free Cash Flow* 267 178 709 445 1,215
Debt financing costs - (3) (51) (3) (51) Decrease in debt and other, net (1) (1,652) (752) (1,653) (754) Investment in Clearwire - - (5) - (58) Other financing activities, net 7 2 2 9 1
Net Increase (Decrease) in Cash, Cash Equivalents andNet Increase (Decrease) in Cash, Cash Equivalents and Short-Term Investments 273$ (1,475)$ (97)$ (1,202)$ 353$
© 2011 Sprint21
See accompanying Notes to the Financial Information (Unaudited) in the Press Release