Embed Size (px)
Citation preview

Spring2019–EpigeneticsandSystemsBiologyDiscussionSession(EpigeneticsandEvolutionaryBiology)MichaelK.Skinner–Biol476/576Week16(April25)
EpigeneticsandEvolutionaryBiology
PrimaryPapers1. SoyerandO’Malley(2013)Bioessays35:696-7052. Skinner,etal.(2014)BMCGenomics15:3773. Artemov,etal.(2017)Mol.Bio.Evol.34(9):2203-134. McNew,etal.(2017)BMCEvolution17:183
DiscussionStudent45–Ref#1above
• Whatistheevolutionarysystemsbiologyreferredto?• Howcansystemsbiologyhelpunderstandevolution?
Student46–Ref#2above
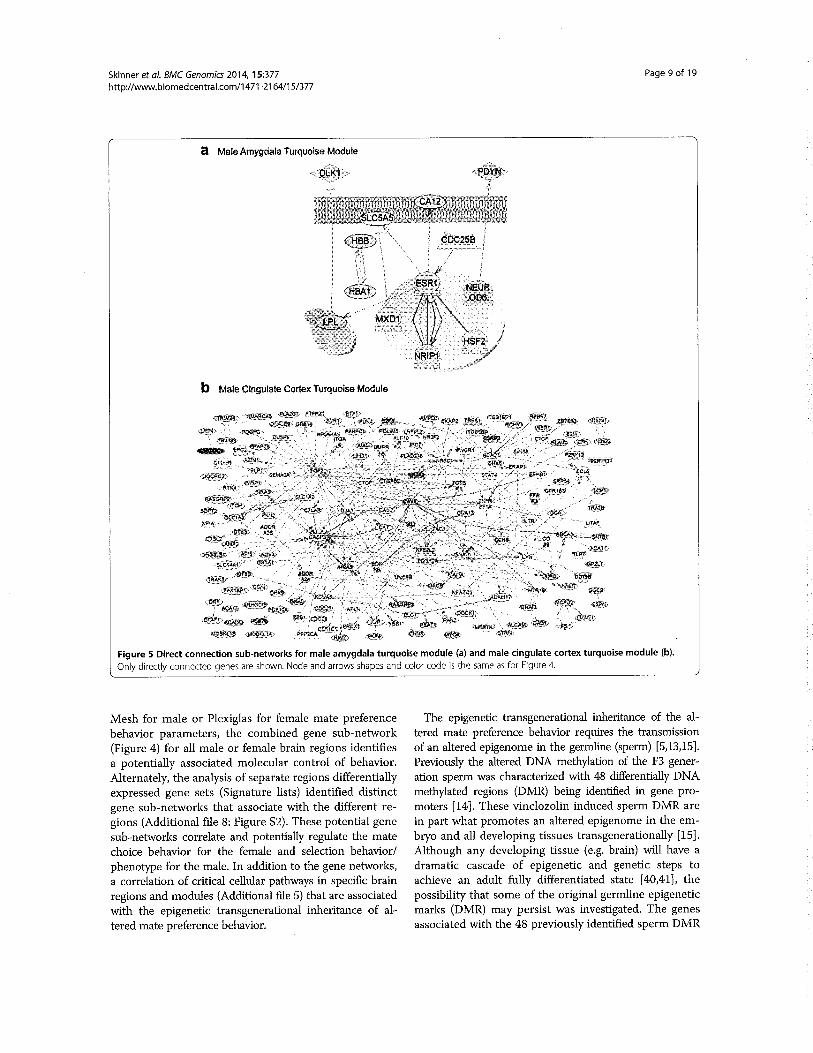
• Whatissexualselection?• Howdidepigenetictransgenerationalinheritancechangematepreference?• Doesthisprovideevidenceforenvironmentalinductionofepigenetictransgenerational
inheritanceandaroleinevolutionarybiology?Student47–Ref#3above
• Whatisthemodelsystemandphenotypicchange?• Whatepigeneticchangewasobserved?• Howdidtheepigeneticsandgeneticsintegrate?
Student48–Ref#4above
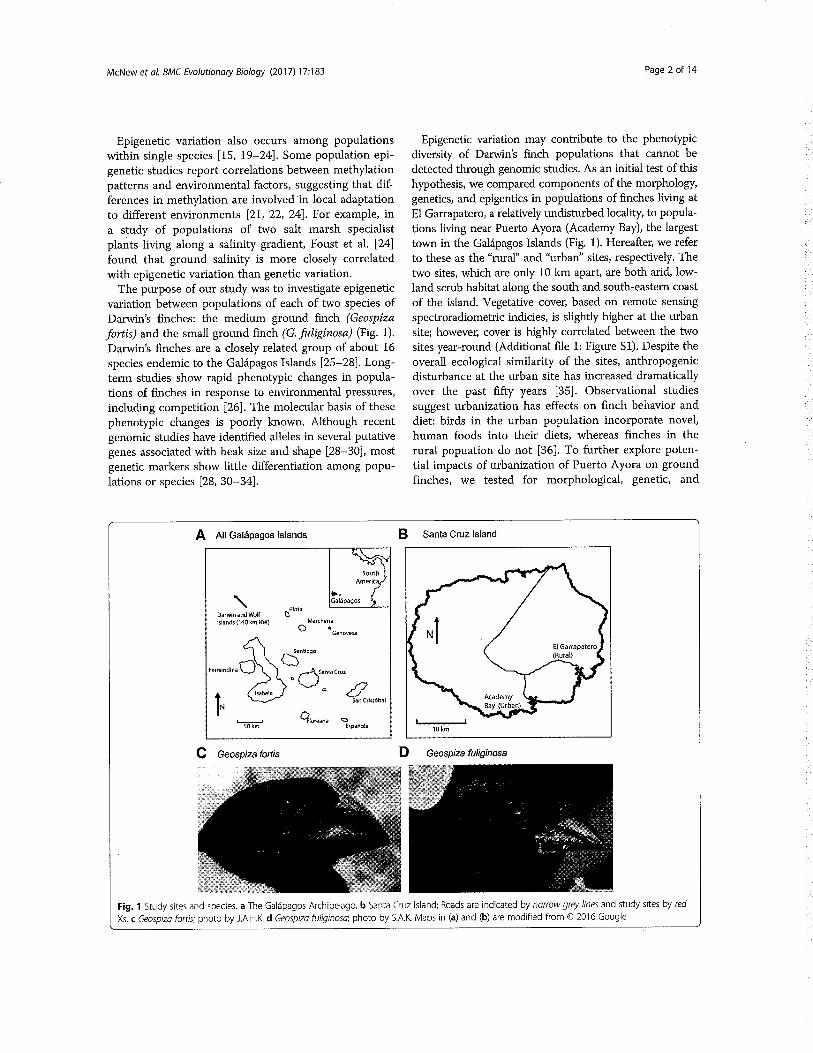
• Whatwastheexperimentaldesignandapproach?• Whatmolecularalterationswereobservedinwhatcelltypes?• Whatmolecularmechanismcanpromoterapidevolutionaryevents?
Prospects & Overviews
Evolutionary systems biology:What it is and why it matters
Orkun S. Soyer1) and Maureen A. O’Malley2)
Evolutionary systems biology (ESB) is a rapidly growing
integrative approach that has the core aim of generating
mechanistic and evolutionary understanding of geno-
type-phenotype relationships at multiple levels. ESB’s
more specific objectives include extending knowledge
gained from model organisms to non-model organisms,
predicting the effects of mutations, and defining the core
network structures and dynamics that have evolved to
cause particular intracellular and intercellular responses.
By combining mathematical, molecular, and cellular
approaches to evolution, ESB adds new insights and
methods to the modern evolutionary synthesis, and offers
ways in which to enhance its explanatory and predictive
capacities. This combination of prediction and explana-
tion marks ESB out as a research manifesto that goes
further than its two contributing fields. Here, we sum-
marize ESB via an analysis of characteristic research
examples and exploratory questions, while also making
a case for why these integrative efforts are worth
pursuing.
Keywords:.evolution; genotype-phenotype mapping; integration;
molecular networks; system dynamics
The emergence of ESB
At its most basic, evolutionary systems biology (ESB) is thesynthesis of system-level approaches to biological functionwith evolutionary explanations of multilevel properties.“System” in this context refers to dynamically interactingcomponents that produce behavior not revealed by analysesof isolated components. Cellular interactions of signaling,regulatory, and metabolic components are all considered assystems or networks that can display structural intricacies andnonlinear dynamics. ESB recognizes that the system-levelproperties of cellular networks are subject to evolutionarychange, and that evolved network properties will variouslyinfluence the future evolutionary course of the organism. It isthis interdependency between evolutionary processes andsystem properties that ESB aims to understand.
One of the earliest articles to describe ESB was publishedin 2005 [1]. While this overview and subsequent elaborations(e.g. [2]) were milestones in the development of ESB as aresearch programme, their scope was restricted to compara-tive analyses. Since 2005 ESB has flourished, to the extent thatcomparative methods currently constitute only one facet of itsdiverse research strategies (in fact, many discussions of ESBprefer to exclude this comparative work in favor of moredynamic accounts; we make a case for including it below).ESB also goes beyond existing efforts to merge molecularand evolutionary biology (e.g. [3]). Those projects aim tounderstand evolutionary processes in the narrower context ofindividual genes and structure of their protein products,whereas ESB is committed to studying phenotypes as theresults of evolving intracellular interaction networks (Fig. 1).At present, only a few ESB researchers refer self-consciously totheir work with the label “evolutionary systems biology”(see [4]). However, this situation is changing as increasingnumbers of evolutionarily minded, systems-focused research-ers forge connections between a range of research questions(e.g. [5, 6]).
In contrast to some views of ESB, which suggest it isdefined by a specific research agenda [1, 2, 7], we see thedistinguishing capacity of ESB as its ability to integratetheoretical tools, experimental methods, and extensive data-sets within an evolutionary framework. This integration is
DOI 10.1002/bies.201300029
1) Warwick Centre for Synthetic Biology, School of Life Sciences, Universityof Warwick, Coventry, UK
2) Department of Philosophy, University of Sydney, Sydney, NSW, Australia
Corresponding authors:Orkun S. SoyerE-mail: [email protected] A. O’MalleyE-mail: [email protected]
696 www.bioessays-journal.com Bioessays 35: 696–705,� 2013 WILEY Periodicals, Inc.
Review
essays

occurring in a highly pragmatic manner, and is driven bythe core ambition of ESB practitioners to develop closerinsight into evolving genotype-phenotype mappingsacross different biological scales (Fig. 1). Researchers withthis goal seize upon tools and datasets as they becomeavailable (e.g. dynamical models, gene-knockout studies,flux balance analyses, in silico evolution, reverse engineer-ing, comparative omics data; Fig. 2) to address questions asold as biology or to reformulate new ones in light of system-level insight.
Some readers may find this description of ESB toomethodologically inclusive. It could be argued that to be aviable research approach, ESB should be more restricted inwhat it does and does not do. But methodological flexibility
and a wide investigative agenda are what characterize manynew movements in biology (e.g. systems biology itself);historically, molecular biology was not the product of aprecisely organized research agenda [8]. It seems unlikelyto us that biological research programmes come about asthe planned products of rational intellectual design andsocial engineering. Instead, they emerge from communitiesof researchers as piecemeal responses to the needs andconstraints experienced in existing fields of research. ESB issuch a product. It may indeed resist any tight definitions,but as we will show, it has a synthesizing mission thatdistinguishes it from its contributing fields.
While systems biology may have initially overlookedevolution because modeling network dynamics is alreadydemanding enough, there are also explicit arguments againsttaking an evolutionary approach to systems biology. One ofthese is that to understand the organization of systems, anevolutionary perspective is irrelevant. While specific organi-zational features may have evolved to cope with environmen-tal perturbations, it is getting a grip on “how” these areimplemented at the molecular level rather than “why” thatis considered the important task (e.g. [9]). We will addressthis objection below by showing that organizational proper-ties have dimensions appropriately and necessarily addressedby ESB. Another argument for leaving evolutionary inquiriesout of systems biology might be that population geneticapproaches are sufficient to understand mutations andtheir effects. Again, we will show how the combination of
Figure 1. Systems under evolutionary forces. At the core of ESBlies the aim of achieving a deep mechanistic understanding ofgenotype-phenotype mappings in biological systems. While thesemappings can be drawn at different levels in different combinationsof ESB, a major area of interest is currently intracellular systems.These systems give rise to cellular physiology, which – in the caseof unicellular organisms – directly determines species’ interactionswith their environment and other organisms. These higher-levelinteractions are responsible for the fitness of organisms. Evolutionaryprocesses (i.e. neutral drift and adaptation) move populations ofthese organisms on this dynamic fitness landscape by altering theproperties of their intracellular systems. Credit: Arno Steinachercreated this figure.
....Prospects & Overviews O. S. Soyer and M. A. O’Malley
Bioessays 35: 696–705,� 2013 WILEY Periodicals, Inc. 697
Review
essays

evolutionary and systems biological analyses reveals furtherdimensions of mutational processes and leads to betterunderstanding of their evolutionary outcomes.
ESB research questions
Despite the diversity of methods used in ESB, there is abroadly unifying motivation that drives the approach. Themost general reason for why systems biology requires anevolutionary framework, and why evolutionary biologyshould concern itself with systems analyses, is as we havesuggested above: each will be a more complete science withthe other perspective taken into account. ESB integrates“how” and “why” questions about biological systems,and thus appeals to network biologists who want tounderstand not just how a system functions but why itfunctions in a particular way. This combination of predictive
and explanatory capacities is a distinct feature of ESB andwe will elaborate on it below. But more specifically, ESB hasa number of focused research objectives that set the agendafor different aspects of its practice, and it is these objectivesthat determine methodological combinations. We will outlinea range of these questions in relation to how they can beanswered.
Generalizations of network properties beyondmodel species
Usually, any systems-biological understanding of networkdynamics and structure is gained via modeling and experi-mentation with regard to a particular model system. Forexample, network modeling and experiments have shownthat signaling networks enabling chemotaxis in Escherichiacoli and osmoregulation in Saccharomyces cerevisiae displaytransient (i.e. adaptive) dynamics [10, 11]. While these andsimilar studies show how a particular physiological responseis enabled by specific system dynamics and structure, theycannot easily be generalized to other organisms. A whole raftof questions remains unanswered: Are the observed systemdynamics necessary for the physiological response? What arealternative molecular structures that have the same systemdynamics? Could these alternatives be realized under differentecological and evolutionary pressures? Answering thesequestions requires going beyond organism-specific systemsbiology with the help of evolutionary analyses. The evolu-tionary methods that are used to answer such questionsinclude experimental and mathematical comparison ofnetwork architecture and dynamics in different species(e.g. [12–14]), comparative genomic analyses at the network
Figure 2. A representation of methodological inputs into ESB. Thereis great variety in the methods and perspectives that can and docontribute to ESB, and this figure is merely indicative rather than anexhaustive list of contributions. The examples outlined in the textdepict various combinations of these methodological inputs, al-though no single ESB study is likely to combine all of them. It isimportant to note that the interaction between ESB and thesemethodological contributions is two-way, with new insights andinnovations achieved by ESB having feedback effects on thecontributing tools and methods. ESB itself is conceptualized as anopen interdisciplinary space produced by the integration of thesevarious approaches with evolutionary frameworks. Four ESB poten-tials are highlighted in that space: mechanistic, predictive, integrativeand multilevel capacities. Credit: Arno Steinacher created this figure.
O. S. Soyer and M. A. O’Malley Prospects & Overviews....
698 Bioessays 35: 696–705,� 2013 WILEY Periodicals, Inc.
Review
essays
level (e.g. [15, 16]), in silico evolution of network models(e.g. [17, 18]), and statistical inference and network recon-struction methods (e.g. [19]).
Determining the evolutionary forces behindnetwork-level patterns
Numerous studies have demonstrated global or recurringfeatures in cellular networks (e.g. [20]). These organizationalcharacteristics exist at different levels of the biologicalhierarchy and include specific connectivity distributions,the presence of modules and motifs, and biochemical features(e.g. cooperative binding, noise, and multifunctionalenzymes). Understanding the significance of these featuresrequires an account of the evolutionary forces that shapedthe networks in which these patterns were found. Inparticular, the observed features can be adaptive (e.g. theresult of specific selective pressures such as stabilizing orfluctuating selection [21]) or neutral (e.g. resulting fromgenetic drift [22]), or could have emerged due to a mixof these two forces (i.e. neutral mutations that becomeadaptive in new circumstances) [23]. Methods include insilico evolution of simple network models under adaptiveand neutral forces, comparison of network features fromdifferent species (e.g. with different population sizesgiving different roles to genetic drift, or different selectionpressures producing different network features), and popu-lation genetics.
Comprehensive understanding of mutationaleffects
Another theme in systems biology is predicting the effects ofmutations on particular functions of cellular networks (e.g.large-scale mutation or deletion studies such as thoseundertaken in S. cerevisiae [24]). Evolutionary biology, onthe other hand, aims to discern the role of mutational effectsin any evolutionary process. In general, systems biologyaddresses this research theme within the model-experimentcycle, while evolutionary biology addresses it by creatingsimplified models and evaluating their ability to captureexperimental observations [25]. ESB bridges these twomethodologies to produce a more comprehensive understand-ing of mutational effects. For example, sensitivity analysisover different network models has been used to gain insightinto the distribution of mutational effects on a specificproperty of system dynamics, such as the phase of oscillationin a circadian clock model [7, 26]. In the case of metabolism,mathematical models of optimal metabolite flows inmetabolicnetworks under a steady state assumption (metabolic flux-balance analysis (FBA [27]), have been used to predictphenotypes produced by single-enzyme deletions [6]. Experi-mental evolution can be combined with next-generationsequencing to characterize both the mutations and theirfitness effects (e.g. antibiotic resistance [28]). A valuablemethodological development in ESB would be establishing acycle between evolutionary experimentation and system-levelmodeling.
Extending systems biology to co-evolvedintercellular interactions
Contemporary molecular systems biology has until recentlyfocused on intracellular networks. Examining intercellularnetwork interactions in homogenous cultures of microorgan-isms (and between cells of multicellular organisms) has beencarried out in the context of metabolism (via exchangedmetabolites), quorum sensing, and the production of “publicgoods” such as scavenging enzymes or co-factors. In host-parasite interactions, heterogeneous cellular interactions canoccur via parasite-encoded genes that function in thenetworks of the host. Systems-biological study of thesecellular interactions does not necessarily require an evolu-tionary framework (e.g. applications of FBA to interactionsbetween two species [29, 30]). However, cellular interactionshave historically been studied to great effect in an evolution-ary context, particularly with regard to the co-evolutionarydynamics and evolution of social behavior in microbes [31].ESB is strategically well placed to combine networkapproaches with these broader evolutionary perspectives.
To sum up, the research questions driving ESB combinethose asked separately in evolutionary biology and systemsbiology. In addressing these questions, ESB integrates thetools and approaches of evolutionary biology and systemsbiology to achieve results that are more than additive: systemsbiology gains a more multilevel, explanatory perspective withthe incorporation of evolutionary timescales, while evolu-tionary biology is made more quantitative, predictive, andable to combine mathematical abstractions with mechanisticdetail. ESB research can therefore deliver insights not possiblefrom evolutionary or systems biology approaches applied inisolation. We will show more specifically how this works withtwo apt illustrations of ESB’s constructive dynamic.
ESB exemplified: Robustness, epistasis,and pleiotropy
While there are large numbers of ESB studies to choose from(e.g. [5]), we will use as exemplars two areas of research thatnot only illuminate ESB-in-action, but also deal with some ofthe resistance to ESB we mentioned above. Robustness refersto a system’s ability to maintain its output in the face ofperturbations. It has been demonstrated for several pheno-types via gene knockout studies [24] and metabolic fluxmeasurements [32]. These elegant systems-biological studieswere descriptive, however, and could not explain theevolutionary significance of robustness; nor could they makepredictions about which evolved systems should be expectedto display this property [33]. While several theoretical studieshave attempted to address these questions (e.g. [34, 35]), morecomplete insights have come from recent ESB work thatamalgamates population genetics, network-level dynamicalmodels, genomic analyses, flux-balance models, and in silicoevolution.
These studies point to plausible selective pressures thatwould generate robustness against gene deletion in gene-regulatory and metabolic networks [36–39]. Selection for
....Prospects & Overviews O. S. Soyer and M. A. O’Malley
Bioessays 35: 696–705,� 2013 WILEY Periodicals, Inc. 699
Review
essays
stable gene-expression patterns under recombination resultsin the evolution of robustness as a product of networkconnectivity [40] and the emergence of epistatic interactionsamong nodes [36, 37]. In the case of metabolic networks,selection for biomass production from variable resources(i.e. fluctuating selection) leads to the evolution of robustnetworks with overlapping metabolic routes and multifunc-tional enzymes [38]. These mechanistic determinants ofrobustness fit closely the findings of flux-redistributionexperiments [32]. Additional ESB studies combining genomicdata and FBA add support to claims that robustness dependson environmental conditions [39, 41].
These novel insights into the mechanistic determinantsand evolutionary drivers of network-level robustness cameabout by synthesizing the methods of systems and evolution-ary biology. Mechanistic findings complement systems-biology studies that aim to decipher the overall structure,dynamics, and function of metabolic networks (e.g. [32]). Theimproved understanding of the evolutionary forces involvedhas generated valuable predictions, including the hypothesesthat gene-regulatory networks harbor genes able to buffer theeffects of mutations [36], and that metabolic robustness inmicrobes parallels the evolutionary and ecological exposureof those organisms to fluctuating environments [38, 39, 41].
Epistasis (multiple genes or mutations producing pheno-typic effects that deviate from a simple additive model) andpleiotropy (in which one gene or mutation affects multiplephenotypic traits) are crucial aspects of genotype-phenotyperelationships [42, 43]. In ESB, the systematic application ofFBA to genome-scale metabolic models of yeast reveals thatepistasis commonly takes place between functional modulesof genes [44]. This finding shifts the focus from interactionsoccurring between individual genes to those occurringbetweenmodules. Subsequent expansion of the same analysisto many metabolic environments and multiple phenotypesshows that gene pairs in yeast can interact “incoherently”relative to different phenotypes (i.e. negatively in relation tosome phenotypes and positively in relation to others) [45].These discoveries would have been invisible to any perspec-tive based solely on individual interactions or simple models.Similarly, studies of system-level models of developmentalregulatory networks indicate that both the overall function ofa gene-regulatory network [46] and its gene-regulatorypatterns [47] can give rise to specific signatures of statisticalepistasis. The latter finding is potentially of high methodo-logical importance to evolutionary biology because it showsthat combining models of nonlinear network dynamics withcommonly used genetic methods, such as quantitative traitloci mapping, can greatly improve the performance of eachapproach [47, 48].
Network-level research into epistasis often inevitablyleads to insight into pleiotropic effects and interactions [49,50]. Investigations of genome-wide pleiotropic effects in yeast,nematodes, andmice indicate that pleiotropy, while occurringat a low rate, is highly modular and has an importantevolutionary role in the generation of adaptive complexityin organisms [51] (however, see [52]). Studies focused onsingle adaptive mutations with whole-network effects thusoffer general insight into pleiotropy as a mechanism ofevolution [53]. Ongoing ESB research seeks to clarify how
epistasis and pleiotropy enable or obstruct evolutionarychange at the network level, and whether these processes aresimply inevitable byproducts of network connectivity [45, 43].
From old to new questions in ESB
ESB is able to elaborate on existing answers to oldevolutionary questions as well as devise new system-levelevolutionary questions. An example of the former, in whichexisting questions are addressed by new ESB approaches, isfound in the fields of comparative genomics and evo-devo.An ESB extension of classic comparative genomics focuseson complete systems of interacting genes to decipher thevariance in the structure of these networks (i.e. what interactswith what) and the evolutionary history of those interac-tions [54, 16]. These comparisons also take into account theevolutionary dynamics of both genomic and cellular networkarchitecture [55–57].
The field of evo-devo has profited considerably fromcontemporary capacities for comparative network analysis,especially in regard to understanding the relationshipsbetween developmental processes and the evolution oftranscriptional regulatory networks (notably cis-regulatorynetworks) [58–60]. The integration of new datasets nowenables the incorporation of additional levels of regulation inthe study of evolving developmental processes. In particular,it is becoming increasingly feasible to examine the roles ofpost-transcriptional and post-translational regulation indevelopment [61]. Emerging ESB studies are already tryingto study these processes and their connections [62, 63].
But perhaps a more thoroughgoing integration is happen-ing in regard to the combination of comparative approacheswith theoretical tools such as dynamical modeling, mathe-matical inference, and in silico evolution [64]. This amalgam-ation has already allowed the prediction of underlyingregulatory networks from the analysis of phenotypic (i.e.gene expression) data in the model organism Drosophila [12].Some evo-devo proponents have argued that modeling thesenetworks dynamically merely confirms the results of existingqualitative experimental approaches but adds no additionalinsight (e.g. [65]). However, models that incorporate systemdynamics, network evolution, and phenotypic datasets havethe advantage of being able to examine directly genotype-phenotype mapping in diverse organisms [14, 66, 67], which issomething qualitative experimentation cannot do. Thesemodels have revealed that due to nonlinear interactions,knowledge of network structure is often not sufficient forunderstanding the function and dynamics of any particularnetwork (e.g. [68]). Such findings are emphasized by in silicoevolution studies, which find network dynamics rather thanstructure to be the determining and conserved features ofthe cellular networks underlying complex developmentalphenotypes (e.g. [17, 68–71]).
The capacity of ESB to reformulate or produce entirely newquestions about evolutionary dynamics in light of systemsbiology is clearly illustrated by the study of noise in biologicalsystems. Noisy dynamics arising at the cellular level canmanifest as phenotypic variance at the population level [72].This phenomenon raises questions about how noise might
O. S. Soyer and M. A. O’Malley Prospects & Overviews....
700 Bioessays 35: 696–705,� 2013 WILEY Periodicals, Inc.
Review
essays

affect evolutionary dynamics and which evolutionary con-ditions favor the selection of the underlying mechanisms. Thelatter question arises from the fact that noise levels themselvesare subject to tuning via evolutionary processes such as pointmutations in regulatory regions [73]. This interplay betweennoise, evolutionary dynamics, and systems behavior sets thestage perfectly for an integrative ESB approach. For example,there are indications from genomic analyses that certainfunctional gene classes exhibit significant increases inexpression noise [74]. This correlation can be explained bysystem-dynamic and population-genetic models that explorethe types of genotype-phenotype maps that could lead to theselection of increased expression noise [74, 75]. Further ESBstudies are exploring the phenotypic consequences of noiseand its impact on the evolutionary dynamics of metabolicnetworks [76].
In regulatory networks, noise combined with nonlineargene-regulatory dynamics can lead to the bimodal distributionof phenotypes (i.e. phenotype switching) in otherwiseisogenic populations [77, 78]. This is vividly illustrated inthe case of antibiotic resistance. In a genetically identicalpopulation of bacteria, high doses of antibiotics kill most butnot all organisms. Upon re-culturing, the surviving bacteriagive rise to a population that is natively affected by antibiotics[78]. These resistant cells are thus phenotypic rather thangenetic variants. Similar observations are made in the caseof sporulation and DNA-uptake pathways, where pathwayactivity shows a significant variance across the population [77,79]. While systems biology is still discovering the mechanisticbases of phenotypic variance [80], ESB provides a conceptualcontext in which to evaluate these findings [81–83]. Inparticular, a recent in silico study suggests that phenotypicswitching in a gene-regulatory system can emerge as abyproduct of the evolution of elevated nonlinearity, which isitself selected for its impact on noise and evolvability [84].Being able to examine phenotypic switching in laboratory-based experimental evolution [85] allows hypotheses aboutthe evolution of noise to be tested (e.g. regarding themutational steps toward the molecular mechanisms of noise).
Broadening the scope of ESB
ESB is developing rapidly in several directions. While some ofthese initiatives advance established research areas, othersset up new research agendas on the basis of methodologicalinnovations.
Expanding evolutionary and ecologicalframeworks
The cross-fertilization of different approaches in ESB isrebalancing the way in which evolution is understood toshape cellular networks. Rather than maintaining a divisionbetween adaptive and non-adaptive explanations, as oftenoccurs in evolutionary research, ESB analyses are showinghow both aspects are needed to explain evolved systems.Neutral processes can be understood to be co-dynamical withadaptive processes in network evolution [86]. For instance, in
the case of modularity, several studies indicate both adaptiveand neutral scenarios to be of importance for modularity’semergence. These investigations indicate the environmentaland evolutionary scenarios that can lead to the evolution ofmodularity: fluctuating selection in environments composedof modular tasks [21, 87], genetic drift [22], and stabilizingselection combined with selection for novel functions [88–90].
Although it will always be difficult to discern whichplausible scenario has produced particular network featuresin specific organisms, in silico evolution and system-levelmathematical models allow assessments of ecological andevolutionary conditions (such as fluctuating environmentsand population size) to be linked to network properties (andvice-versa). Rigorous evaluation of evolutionary scenarios canthereby incorporate comparative analyses of global networkstructures [15, 16, 54, 91], and together they can comprisesystem-based “reverse ecology” [92]. Reverse ecology in ESBaims to infer the historical ecologies of organisms fromfeatures of present-day cellular networks (rather thanfocusing on genetic loci as population genomics “reverseecology” does). ESB aspires toward an increased ability topredict the future evolution of organisms (particularly single-celled organisms) in response to novel selective pressures andenvironments. This outcome is already within grasp in thecase of metabolic networks [6].
Encompassing intercellular network evolution
Selective pressures imposed by the abiotic environment onbiological systems are only one component of ongoingevolutionary dynamics, which are always entwined withinterspecies interactions (Fig. 1). While emerging systems-biological approaches are now beginning to scrutinize theseinteractions at the level of their underlying intracellularnetworks, one strand of ESB aims to understand more fullythe effects of species interactions on network evolution. Forexample, the increasingly detailed characterization of parasitemanipulation of host networks, at the level of single proteinsand whole networks [93], has produced hypotheses about howsuch effects shape host network evolution [94]. Recent effortsto extend the application of FBA to species interactions dothis by combining computational analysis with experiments[29, 30, 95]. These applications permit an examination ofthe environmental conditions and co-evolutionary dynamicsthat enable species to co-exist in syntrophy.
Important open questions in this area of research includehow to understand the evolution and dynamics of diversemicrobial communities in the context of their intercellularnetworks, and how the network-level impact of host-parasiteinteractions can be captured more effectively. Taking anESB approach, combined with the increasing ability to probespecies interactions experimentally and genomically innatural contexts such as soil microcosms [96], expands thescope of how microbial communities are investigated. Inaddition, ESB studies that analyse cellular networks in light ofsocial evolution can assess the impact of competitive orcooperative interactions on these networks, and in turnpredict how they enable future competitive and cooperativedynamics [31].
....Prospects & Overviews O. S. Soyer and M. A. O’Malley
Bioessays 35: 696–705,� 2013 WILEY Periodicals, Inc. 701
Review
essays
Re-engineering networks in light of evolution
A major future contributor to ESB is likely to be syntheticbiology, which introduces an engineering approach to evolvedsystems. By accelerating the tinkering to which evolution hassubjected biological systems, and incorporating mathemati-cally redesigned features, synthetic biology can intervenein evolutionary processes and outcomes at the systems level.For example, synthetic circuits could be constructed totest hypotheses about intermediary states in the evolutionof specific cellular networks, or to measure the effect ofmutations in different genetic backgrounds.
Combining synthetic biology with experimental evolutioncould lead to an even greater capacity to test evolutionaryhypotheses. Exposing synthetic circuits to further evolutionunder a variety of conditions (e.g. fluctuating versus stableenvironments), or developing high-throughput techniquesto generate a diversity of circuits (e.g. [97]), allows theexamination of both the effects of specific network featureson future evolution and the role of environmental conditionson the outcome of network evolution. While recentexperimental evolution has produced detailed character-izations of the molecular steps toward specific evolutionarytrajectories and outcomes in natural systems (e.g. [98, 28]),combining experiments with synthetic biology and some ofthe theoretical approaches from ESB (e.g. dynamical networkmodels, flux balance analysis) should increase researchscope and depth.
Integrating ESB and biomedicine
The improved ability to specify how and why networks haveevolved will be particularly beneficial when the evolutionaryoutcomes relate to human health, as demonstrated by theinvestigation of the evolution of antibiotic resistance(e.g. [28]). So far, evolutionary medicine [99] and systemsor network medicine [100] have interacted very little, and bothare just nascent fields or even mere ambitions in the minds ofsome researchers. But it is very probable that many diseaseand treatment systems, from cancer to antibiotic resistance,are unlikely to be comprehended effectively or made tractablefor intervention without being modeled as dynamic evolvingsystems [101, 102]. Using mathematical modeling andsynthetic-biological constructions to predict, for example,how antibiotic resistance will evolve in relation to networkvulnerabilities to specific molecular interactions, would havesustainable therapeutic effects [103]. Drug development,foundering in many traditional approaches (especially whenrestricted to the selection of target molecules), may thusyield to a synthesis of evolutionary and systems biologicalapproaches because it steers drug development back to afocus on interactions within an evolving physiologicalcontext [104].
Synthesizing explanation and prediction
We mentioned above that a central aim of ESB is to producemechanistic and evolutionary understanding of genotype-
phenotype relations. Mechanistic explanations are causalaccounts of how certain outcomes occur in specific circum-stances. In the ESB case, the focus is on how particulargenotypic features produce certain phenotypic properties.Historically, molecular biology has offered qualitative mech-anistic explanations. One aspect of systems biology hasworked to make these explanations quantitatively mechanis-tic rather than primarily descriptive-predictive. Dynamicmathematical modeling and time-series data are crucial tosuch explanations. ESB goes one step further and attempts toembed quantitative mechanistic explanation (which in ErnstMayr’s terminology [105] is proximate explanation), withinultimate or evolutionary explanation.
Prediction has sometimes been suggested to be anachievement beyond the capacity of evolutionary biology(e.g. [105, 106, 107]). Although evolutionary biology isaccepted as explanatory, it has been placed at the ultimateend of the spectrum of explanation rather than the proximate,and the field has often been charged with untestability andpanadaptationism. Systems biology on the other hand hasfocused largely on description and prediction (i.e. character-izing systems and predicting fluctuations of that systemunder specific perturbation regimes). The aim to achieveboth ultimate and proximate explanation, combined withpredictiveness, is a major motivation of ESB. This does notmean its practitioners expect to find universal laws. Butthey do expect to find regularities that hold across a widerange of networks and organisms as a result of commonevolutionary processes, and there is good reason to thinkthat finding these will help explain and predict systembehavior. This is because evolutionary processes, despitebeing both stochastic and contingent, can leave stable tracesof their impact on system architecture and function. Thesetraces can then be linked back to evolutionary and ecologicalconditions. When this historical knowledge is combinedwith detailed mechanistic explanation, evolutionary trajecto-ries can be projected forward and sought in silico or in vitro.Evolutionary predictions will never be easy to formulate andconfirm, but ESB offers a platform for developing thepredictive aspects of evolutionary biology and in the process,refining how evolutionary prediction is understood (becauseof the necessity of taking into account contingency anduncertainty).
Some of the basis for predictive ESB is already establishedin metabolic network research [6]. These predictions currentlyfocus on detecting the effects of mutations on metabolicfunction, identifying environments from the structure andfunction of metabolic networks, and establishing causalconnections between structural features of metabolic net-works and ecological conditions. Extending this basicpredictive capacity will mean going beyond metabolicnetworks to other cellular interactions, by building predictivemodels based on explanations of the origins and diversity ofnetworks as they respond temporally to complex conditions.
Conclusions and outlook
We have presented ESB as an emerging but loosesynthesis of system approaches to biological phenomena
O. S. Soyer and M. A. O’Malley Prospects & Overviews....
702 Bioessays 35: 696–705,� 2013 WILEY Periodicals, Inc.
Review
essays

interpreted within an overarching evolutionary framework.However, there are numerous disciplinary and trainingbarriers to be overcome to enable researchers to contributeto ESB. From the perspective of many quantitative andmodeling-oriented biologists, evolutionary research consistsof historical narratives that are not “hard” science. Andfrom the evolutionary biologists’ perspective, their ownfield already has sufficiently rigorous methods at itsdisposal. ESB is in one sense a demonstration of theusefulness of thinking outside these disciplinary boxes –not to make researchers switch disciplinary allegiance butto enhance their own disciplinary achievements. For thisreason, we advocate a more integrative systems biologycurriculum – able to encompass evolutionary aspects ofsystems – at whatever educational levels system biology istaught.
Although we do not anticipate all evolutionary biologistsbecoming ESB advocates or all systems biologists signingup for evolutionary analyses, we do foresee that integrativeESB efforts will have increasing payoffs for difficultresearch questions. Describing, explaining, and predictinggenotype-phenotype relationships will obviously need agreat deal of experimental work to ground studies based ondynamic models and evolutionary simulations. However,if there is one thing molecular biology has learned inthe last decade it is that integrative combinations ofmodeling and experimental approaches are crucial tomore predictive and explanatory understandings of systems.All the caveats about modeling uncertainties, data short-comings and experimental intractability that apply tosystems biology apply to ESB. But as this review illustrates,many steps forward have been made and this is in partbecause the field is characterized more by research-driveninquiry than grand ambitions to create a new disciplinaryentity.
We must emphasize that we are neither claiming thatESB is a panacea to disciplinary shortcomings, nor that ithas all the right questions and answers. Instead, weare drawing attention to the broad phenomenon of ESB,rather than a specific strand here or there, because ofthe field’s general implications for the integration ofcertain modes of explanation and prediction. Even forscientists not interested in evolutionary or systems biology,these generalities are issues of scientific relevance. It maybe the case that ESB becomes so broad in its problemorientation and methodology that it cannot be demarcatedeven as a field, let alone a discipline: it could simply becomea general approach to the study of evolving biologicalsystems. This, we believe, would be more valuable than ifESB were to form a tightly bounded field with disciplinaryambitions.
AcknowledgementsWe thank our referees and editor for very helpful comments,and several colleagues for comments on a much earlierversion of this paper. MAO acknowledges support from theAustralian Research Council and University of Sydney inthe form of a Future Fellowship. We are grateful to ArnoSteinacher for creating the two figures.
References
1. Medina M. 2005. Genomes, phylogeny, and evolutionary systemsbiology. Proc Natl Acad Sci USA 102: 6630–5.
2. Koonin EV, Wolf YI. 2006. Evolutionary systems biology: links betweengene evolution and function. Curr Opin Biotechnol 17: 481–7.
3. Dean AM, Thornton JW. 2007. Mechanistic approaches to the study ofevolution: the functional synthesis. Nat Rev Genet 8: 675–88.
4. O’Malley MA. 2012. Evolutionary systems biology: historical andphilosophical perspectives on an emerging synthesis. In Soyer OS, ed;Evolutionary Systems Biology. NY: Springer. p. 1–28.
5. Soyer OS. ed; 2012. Evolutionary Systems Biology. NY: Springer.6. Papp B, Notebaart RA, Pal C. 2011. Systems-biology approaches for
predicting genomic evolution. Nat Rev Genet 12: 591–602.7. Loewe L. 2009. A framework for evolutionary systems biology. BMC
Syst Biol 3: 27.8. Morange M. 1998. A History of Molecular Biology. Cambridge MA:
Harvard University Press.9. Boogerd FC, Bruggeman FJ, Hofmeyr J-HS, Westerhoff HV. eds;
2007. Systems Biology: Philosophical Foundations. Amsterdam:Elsevier.
10. Alon U, Surette MG, Barkai N, Leibler S. 1999. Robustness in bacterialchemotaxis. Nature 397: 168–71.
11. Klipp E, Nordlander B, Kruger R, Gennemark P, et al. 2005.Integrative model of the response of yeast to osmotic shock. NatBiotechnol 23: 975–82.
12. Jaeger J, Surkova S, Blagov M, Janssens H, et al. 2004. Dynamiccontrol of positional information in the early Drosophila embryo. Nature430: 368–71.
13. Gao F, Davidson EH. 2008. Transfer of a large gene regulatoryapparatus to a new developmental address in echinoid evolution. ProcNatl Acad Sci USA 105: 6091–6.
14. Hoyos E, Kim K, Milloz J, Barkoulas M, et al. 2011. Quantitativevariation in autocrine signaling and pathway crosstalk in the Caeno-rhabditis vulval network. Curr Biol 21: 527–38.
15. Nikolaou E, Agrafioti I, Stumpf M, Quinn J, et al. 2009. Phylogeneticdiversity of stress signalling pathways in fungi. BMC Evol Biol 9: 44.
16. Wuichet K, Zhulin IB. 2010. Origins and diversification of a complexsignal transduction system in prokaryotes. Sci Signal 3: ra50.
17. Francois P, Hakim V, Siggia ED. 2007. Deriving structure fromevolution: metazoan segmentation. Mol Syst Biol 3: 154.
18. Goldstein RA, Soyer OS. 2008. Evolution of taxis responses in virtualbacteria: non-adaptive dynamics. PLoS Comput Biol 4: e1000084.
19. Thorne TW, Ho H-L, Huvet M, Haynes K, et al. 2011. Prediction ofputative protein interactions through evolutionary analysis of osmoticstress response in the model yeast Saccharomyces cerevisae. FungalGenet Biol 48: 504–11.
20. Alon U. 2007. Network motifs: theory and experimental approaches.Nat Rev Genet 8: 450–61.
21. Kashtan N, Alon U. 2005. Spontaneous evolution of modularity andnetwork motifs. Proc Natl Acad Sci USA 102: 13773–8.
22. Lynch M. 2007. The evolution of genetic networks by non-adaptiveprocesses. Nat Rev Genet 8: 803–13.
23. Wagner A. 2008. Neutralism and selectionism: a network-basedreconciliation. Nat Rev Genet 9: 965–74.
24. Giaever G, Chu AM, Ni L, Connelly C, et al. 2002. Functional profiling ofthe Saccharomyces cerevisiae genome. Nature 418: 387–91.
25. Orr HA. 2005. The genetic theory of adaptation: a brief history. Nat RevGenet 6: 119–27.
26. Akman OE, Rand DA, Brown PE, Millar AJ. 2010. Robustness fromflexibility in the fungal circadian clock. BMC Syst Biol 4: 88.
27. Feist AM, Herrgard MJ, Thiele I, Reed JL, et al. 2008. Reconstructionof biochemical networks in microorganisms. Nat Rev Microbiol 7:129–43.
28. Toprak E, Veres A, Michel J-B, Chait R, et al. 2012. Evolutionary pathsto antibiotic resistance under dynamically sustained drug selection. NatGenet 44: 101–5.
29. Klitgord N, Segre D. 2010. Environments that induce syntheticmicrobial ecosystems. PLoS Comput Biol 6: e1001002.
30. Bordbar A, Lewis NE, Schellenberger J, Palsson BØ, et al. 2010.Insight into human alveolar macrophage and M. tuberculosis inter-actions via metabolic reconstructions. Mol Syst Biol 6: 422.
31. Foster KR. 2011. The sociobiology of molecular systems. Nat RevGenet 12: 193–203.
32. Emmerling M, Dauner M, Ponti A, Fiaux J, et al. 2002. Metabolic fluxresponses to pyruvate kinase knockout in Escherichia coli. J Bacteriol184: 152–64.
....Prospects & Overviews O. S. Soyer and M. A. O’Malley
Bioessays 35: 696–705,� 2013 WILEY Periodicals, Inc. 703
Review
essays

33. de Visser JA, Hermisson J, Wagner GP, Meyers LA, et al. 2003.Perspective: evolution and detection of genetic robustness. Evolution57: 1959–72.
34. Wagner A. 2000. The role of population size, pleiotropy and fitnesseffects of mutations in the evolution of overlapping gene functions.Genetics 154: 1389–401.
35. Krakauer DC, Plotkin JB. 2002. Redundancy, antiredundancy, and therobustness of genomes. Proc Natl Acad Sci USA 99: 1405–9.
36. Bergman A, Siegal ML. 2003. Evolutionary capacitance as a generalfeature of complex gene networks. Nature 424: 549–52.
37. Azevedo RBR, Lohaus R, Srinivasan S, Dang KK, et al. 2006. Sexualreproduction selects for robustness and negative epistasis in artificialgene networks. Nature 440: 87–90.
38. Soyer OS, Pfeiffer T. 2010. Evolution under fluctuating environmentsexplains observed robustness in metabolic networks. PLoS ComputBiol 6: e1000907.
39. Harrison R, Papp B, Pal C, Oliver SG, et al. 2007. Plasticity of geneticinteractions in metabolic networks of yeast. Proc Natl Acad Sci USA104: 2307–12.
40. Siegal ML, Bergman A. 2002. Waddington’s canalization revisited:developmental stability and evolution. Proc Natl Acad Sci USA 99:10528–32.
41. Wang Z, Zhang J. 2009. Abundant indispensable redundancies incellular metabolic networks. Genome Biol Evol 1: 23–33.
42. Phillips PC. 2008. Epistasis – the essential role of gene interactionsin the structure and evolution of genetic systems. Nat Rev Genet 9:855–67.
43. Wagner GP, Zhang J. 2011. The pleiotropic structure of the genotype-phenotype map: the evolvability of complex organisms. Nat Rev Genet12: 204–13.
44. Segre D, Deluna A, Church GM, Kishony R. 2005. Modular epistasis inyeast metabolism. Nat Genet 37: 77–83.
45. Snitkin ES, Segre D. 2011. Epistatic interaction maps relative tomultiple metabolic phenotypes. PLoS Genet 7: e1001294.
46. Gutierrez J. 2009. A developmental systems perspective on epistasis:computational exploration of mutational interactions in model develop-mental regulatory networks. PLoS ONE 4: e6823.
47. Gjuvsland AB, Hayes BJ, Omholt SW, Carlborg O. 2007. Statisticalepistasis is a generic feature of gene regulatory networks.Genetics 175:411–20.
48. Landry CA, Rifkin SA. 2012. The genotype-phenotype mapsof systems biology and quantitative genetics: distinct but complemen-tary. In Soyer OS, ed; Evolutionary Systems Biology. NY: Springer.p. 371–98.
49. Moore JH, Williams SM. 2005. Traversing the conceptual dividebetween biological and statistical epistasis: systems biology and amoremodern synthesis. BioEssays 27: 637–46.
50. Tyler AL, Asselbergs FW, Williams SM, Moore JH. 2009. Shadows ofcomplexity: what biological networks reveal about epistasis andpleiotropy. BioEssays 31: 220–7.
51. Wang Z, Liao BY, Zhang J. 2010. Genomic patterns of pleiotropy andthe evolution of complexity. Proc Natl Acad Sci USA 107: 18034–9.
52. Hill WG, Zhang ZS. 2012. On the pleiotropic structure of the genotype-phenotype map and the evolvability of complex organisms. Genetics190: 1131–7.
53. Knight CG, Zitzmann N, Prabhakar S, Antrobus R, et al. 2006.Unraveling adaptive evolution: how a single point mutation affects theprotein coregulation network. Nat Genet 38: 1015–22.
54. Huvet M, Toni T, Sheng X, Thorne T, et al. 2011. The evolution of thephage shock protein response system: interplay between proteinfunction, genomic organization, and system function. Mol Biol Evol 28:1141–55.
55. Beltrao P, Trinidad JC, Fiedler D, Roguev A, et al. 2009. Evolution ofphosphoregulation: comparison of phosphorylation patterns acrossyeast species. PLoS Biol 7: e1000134.
56. Madan Babu M, Teichmann SA, Aravind L. 2006. Evolutionarydynamics of prokaryotic transcriptional regulatory networks. J Mol Biol358: 614–33.
57. Tan K, Shlomi T, Feizi H, Ideker T, et al. 2007. Transcriptionalregulation of protein complexes within and across species. Proc NatlAcad Sci USA 104: 1283–8.
58. Carroll SB. 2008. Evo-devo and an expanding evolutionary synthesis: agenetic theory of morphological evolution. Cell 134: 25–36.
59. Peter IS, Davidson EH. 2011. Evolution of gene regulatory networkscontrolling body plan development. Cell 144: 970–85.
60. Erwin DH, Davidson EH. 2009. The evolution of hierarchical generegulatory networks. Nat Rev Genet 10: 141–8.
61. Alonso CR, Wilkins AS. 2005. The molecular elements that underliedevelopmental evolution. Nat Rev Genet 6: 709–15.
62. Jensen LJ, Jensen TS, de Lichtenberg U, Brunak S, et al. 2006. Co-evolution of transcriptional and post-translational cell-cycle regulation.Nature 443: 594–7.
63. Chen K, Rajewsky N. 2007. The evolution of gene regulation bytranscription factors and microRNAs. Nat Rev Genet 8: 93–103.
64. Jaeger J, Irons D, Monk N. 2012. The inheritance of process: adynamical systems approach. J Exp Zool (Mol Dev Evol) 318B: 591–612.
65. Davidson EH. 2010. Emerging properties of animal gene regulatorynetworks. Nature 468: 911–20.
66. Manu, Surkova S, Spirov AV, Gursky VV, et al. 2009. Canalization ofgene expression in the Drosophila blastoderm by gap gene crossregulation. PLoS Biol 7: e1000049.
67. Salazar-Ciudad I, Jernvall J. 2010. A computational model of teethand the developmental origins of morphological variation. Nature 464:583–6.
68. Siegal ML, Promislow DE, Bergman A. 2007. Functional andevolutionary inference in gene networks: does topology matter?Genetica 129: 83–103.
69. Fujimoto K, Ishihara S, Kaneko K. 2008. Network evolution of bodyplans. PLoS ONE 3: e2772.
70. ten Tusscher KH, Hogeweg P. 2011. Evolution of networks for bodyplan patterning; interplay of modularity, robustness and evolvability.PLoS Comput Biol 7: e1002208.
71. Francois P, Siggia ED. 2010. Predicting embryonic patterning usingmutual entropy fitness and in silico evolution. Development 137:2385–95.
72. Eldar A, Elowitz MB. 2010. Functional roles for noise in genetic circuits.Nature 467: 167–73.
73. BlakeWJ, Balazsi G, Kohanski MA, Issacs FJ, et al. 2006. Phenotypicconsequences of promoter-mediated transcriptional noise.Mol Cell 24:853–65.
74. Zhang Z, Qian W, Zhang J. 2009. Positive selection for elevated geneexpression noise in yeast. Mol Syst Biol 5: 299.
75. Tanase-Nicola S, ten Wolde PR. 2008. Regulatory control and thecosts and benefits of biochemical noise. PLoS Comput Biol 4:e1000125.
76. Wang Z, Zhang J. 2011. Impact of gene expression noise on organismalfitness and the efficacy of natural selection.Proc Natl Acad Sci USA 108:E67–76.
77. Maamar H, Raj A, Dubnau D. 2007. Noise in gene expressiondetermines cell fate in Bacillus subtilis. Science 317: 526–7.
78. Balaban NQ, Merrin J, Chait R, Kowalik L, et al. 2004. Bacterialpersistence as a phenotypic switch. Science 305: 1622–5.
79. Veening J-W, Stewart EJ, Berngruber TW, Taddei F, et al. 2008. Bet-hedging and epigenetic inheritance in bacterial cell development. ProcNatl Acad Sci USA 105: 4393–8.
80. Levy SF, Ziv N, Siegal ML. 2012. Bet hedging in yeast byheterogeneous, age-correlated expression of a stress protectant. PLoSBiol 10: e1001325.
81. Levy SF, Siegal ML. 2012. The robustness continuum. In Soyer OS, ed;Evolutionary Systems Biology. NY: Springer. p. 431–452.
82. Kussell E, Kishony R, Balaban NQ, Leibler S. 2005. Bacterialpersistence: a model of survival in changing environments. Genetics169: 1807–14.
83. Salathe M, Van Cleve J, Feldman MW. 2009. Evolution of stochasticswitching rates in asymmetric fitness landscapes. Genetics 182:1159–64.
84. Kuwahara H, Soyer OS. 2012. Bistability in feedback circuits as abyproduct of evolution of evolvability. Mol Syst Biol 8: 564.
85. Beaumont HJ, Gallie J, Kost C, Ferguson GC, et al. 2009.Experimental evolution of bet hedging. Nature 462: 90–3.
86. Wagner A. 2011. The Origins of Evolutionary Innovations: A Theory ofTransformative Change in Living Systems. NY: Oxford University Press.
87. Parter M, Kashtan N, Alon U. 2008. Facilitated variation: how evolutionlearns from past environments to generalize to new environments. PLoSComput Biol 4: e1000206.
88. Soyer OS. 2007. Emergence and maintenance of functional modules insignaling pathways. BMC Evol Biol 7: 205.
89. Hintze A, Adami C. 2008. Evolution of complex modular biologicalnetworks. PLoS Comput Biol 4: e23.
90. Espinosa-Soto C, Wagner A. 2010. Specialization can drive theevolution of modularity. PLoS Comput Biol 6: e1000719.
91. Borenstein E, Kupiec M, Feldman MW, Ruppin E. 2008. Large-scalereconstruction and phylogenetic analysis of metabolic environments.Proc Natl Acad Sci USA 105: 14482–7.
O. S. Soyer and M. A. O’Malley Prospects & Overviews....
704 Bioessays 35: 696–705,� 2013 WILEY Periodicals, Inc.
Review
essays

92. Levy R, Borenstein E. 2012. Reverse ecology: from systems toenvironments and back. In Soyer OS, ed; Evolutionary Systems Biology.ed; NY: Springer. p. 329–45.
93. Bhavsar AP, Guttman JA, Finlay BB. 2007. Manipulation of host-cellpathways by bacterial pathogens. Nature 449: 827–34.
94. Salathe M, Soyer OS. 2008. Parasites lead to evolution ofrobustness against gene loss in host signaling networks. Mol SystBiol 4: 202.
95. Hillesland KL, Stahl DA. 2010. Rapid evolution of stability andproductivity at the origin of a microbial mutualism. Proc Natl Acad SciUSA 107: 2124–9.
96. Gomez P, Buckling A. 2011. Bacteria-phage antagonistic coevolutionin soil. Science 332: 106–9.
97. Wang HH, Issacs FJ, Carr PA, Sun ZZ, et al. 2009. Programming cellsby multiplex genome engineering and accelerated evolution. Nature460: 894–8.
98. Woods RJ, Barrick JE, Cooper TF, Shrestha U, et al. 2011. Second-order selection for evolvability in a large Escherichia coli population.Science 331: 1433–6.
99. Williams GC, Nesse RM. 1991. The dawn of Darwinianmedicine.QRevBiol 66: 1–22.
100. Barabasi AL, Gulbahce N, Loscalzo J. 2011. Network medicine: anetwork-based approach to human disease. Nat Rev Genet 12: 56–68.
101. Gatenby RA, Gillies RJ, Brown JS. 2010. Evolutionary dynamics ofcancer prevention. Nat Rev Cancer 10: 526–7.
102. Baquero F, Coque TM, de la Cruz F. 2011. Ecology and evolution astargets: the need for novel eco-evo drugs and strategies to fightantibiotic resistance. Antimicrob Agents Chemother 55: 3649–60.
103. Palmer AC, Kishony R. 2013. Understanding, predicting andmanipulating the genotypic evolution of antibiotic resistance. Nat RevGenet 14: 243–8.
104. Pujol A, Mosca R, Farres J, Aloy P. 2010. Unveiling the role ofnetwork and systems biology in drug discovery. Trends Pharmacol Sci31: 115–23.
105. Mayr E. 1961. Cause and effect in biology. Science 134: 1501–6.106. Peters RH. 1976. Tautology in evolution and ecology.AmNat 110: 1–12.107. Gould SJ. 1990. Wonderful Life: The Burgess Shale and the Nature of
History. London: Hutchinson Radius.
....Prospects & Overviews O. S. Soyer and M. A. O’Malley
Bioessays 35: 696–705,� 2013 WILEY Periodicals, Inc. 705
Review
essays


Genome-Wide DNA Methylation Profiling RevealsEpigenetic Adaptation of Stickleback to Marine andFreshwater Conditions
Artem V. Artemov,*,1 Nikolai S. Mugue,2 Sergey M. Rastorguev,3 Svetlana Zhenilo,1 Alexander M. Mazur,1
Svetlana V. Tsygankova,3 Eugenia S. Boulygina,3 Daria Kaplun,1 Artem V. Nedoluzhko,3
Yulia A. Medvedeva,1,4 and Egor B. Prokhortchouk*,1
1Department of Vertebrate Genomics and Epigenomics, Institute of Bioengineering, Research Center of Biotechnology RAS, Moscow, Russia2Russian Federal Research Institute of Fisheries and Oceanography, Moscow, Russia3National Research Center ‘Kurchatov Institute’, Moscow, Russia4Department of Computational Biology, Vavilov Institute of General Genetics, RAS, Moscow, Russia
*Corresponding authors: E-mails: [email protected]; [email protected].
Associate editor: Connie Mulligan
Abstract
The three-spined stickleback (Gasterosteus aculeatus) represents a convenient model to study microevolution—adaptation to a freshwater environment. Although genetic adaptations to freshwater environments are well-studied,epigenetic adaptations have attracted little attention. In this work, we investigated the role of DNA methylation in theadaptation of the marine stickleback population to freshwater conditions. DNA methylation profiling was performed inmarine and freshwater populations of sticklebacks, as well as in marine sticklebacks placed into a freshwater environmentand freshwater sticklebacks placed into seawater. We showed that the DNA methylation profile after placing a marinestickleback into fresh water partially converged to that of a freshwater stickleback. For six genes including ATP4A ionpump and NELL1, believed to be involved in skeletal ossification, we demonstrated similar changes in DNA methylationin both evolutionary and short-term adaptation. This suggested that an immediate epigenetic response to freshwaterconditions can be maintained in freshwater population. Interestingly, we observed enhanced epigenetic plasticity infreshwater sticklebacks that may serve as a compensatory regulatory mechanism for the lack of genetic variation in thefreshwater population. For the first time, we demonstrated that genes encoding ion channels KCND3, CACNA1FB, andATP4A were differentially methylated between the marine and the freshwater populations. Other genes encoding ionchannels were previously reported to be under selection in freshwater populations. Nevertheless, the genes that harborgenetic and epigenetic changes were not the same, suggesting that epigenetic adaptation is a complementary mechanismto selection of genetic variants favorable for freshwater environment.
Key words: epigenetics, DNA methylation, stickleback, adaptation, evolution, water salinity, marine, freshwater, fish,phenotypic variation, ion pumps
IntroductionThe three-spined stickleback (Gasterosteus aculeatus) is animportant model in the study of adaptive evolution. Thespecies can survive in environments with a large variety ofsalinity, such as river estuaries and the brackish waters of theBaltic Sea (McCairns and Bernatchez 2010; Guo et al. 2015;Konijnendijk et al. 2015). Successful colonization of differentenvironmental conditions involves rapid adaptation to fac-tors such as a sharp change in temperature, salinity, otherpredators, and parasites (Barrett et al. 2011; Lescak et al. 2015).
Isolated freshwater populations of sticklebacks are believedto originate by separation from the marine population. Manyindependent acts of river and lake colonization by marinesticklebacks have been reported (Jones et al. 2012), makingit possible to study a wide variety of evolutionary trajectoriesof adaptation to freshwater. Parallel adaptation between
independently formed freshwater populations to a new hab-itat occurs by increasing the frequency of certain freshwateralleles that preexist at low frequency in the marine population(Hohenlohe et al. 2012; Jones et al. 2012). Adaptation to het-erogeneous environmental conditions, such as the Baltic Sea,and to the freshwater lakes and creeks have similar genomicmechanisms (Roesti et al. 2014; Guo et al. 2015). They operatewithin genomic loci that contain mainly regulatory sequencesrather than protein-coding regions (Jones et al. 2012). Theplasticity of gene expression in response to changing environ-mental conditions is likely to help the three-spined stickle-back colonize a wide range of habitats (McCairns andBernatchez 2010; Morris et al. 2014).
High salt conditions represent a major challenge for livingorganisms because they cause DNA double-strand breaks andcell senescence (Dmitrieva and Burg 2007; Dmitrieva et al. 2011).
Article
� The Author 2017. Published by Oxford University Press on behalf of the Society for Molecular Biology and Evolution.All rights reserved. For permissions, please e-mail: [email protected]
Mol. Biol. Evol. 34(9):2203–2213 doi:10.1093/molbev/msx156 Advance Access publication May 10, 2017 2203
Dow
nloaded from https://academ
ic.oup.com/m
be/article-abstract/34/9/2203/3813257 by Washington State U
niversity user on 08 April 2019

It has been reported that marine invertebrates have nu-merous DNA breaks due to high salt conditions (Dmitrievaet al. 2006). It is therefore of fundamental interest to ex-plore the mechanisms of how organisms adapt to differentosmotic conditions.
Several studies revealed genetic aspects of Gasterosteusaculeatus freshwater adaptation. Terekhanova and colleagues(Terekhanova et al. 2014) defined divergence islands as re-gions with a significant shift of allele frequency between ma-rine and freshwater populations, which are presumably underselection in freshwater populations. Some divergence is-lands harbored genes that are believed to be associatedwith freshwater adaptation, such as ion transporters.Notably, some of the divergence islands lacked genes,suggesting their regulatory potential as enhancers.Reduction of the pelvic apparatus characteristic tomany freshwater populations was shown to be causedby the loss of a tissue-specific enhancer of the Pitx1gene (Chan et al. 2010). Among the genomic loci, associ-ated with freshwater adaptation reported in (Jones et al.2012), noncoding regulatory changes appeared to bepredominant.
Even though genetic components are important to adap-tation to osmotic conditions, various organisms can switchbetween sea and freshwater habitats within one generation,suggesting that epigenetic mechanisms, such as histone mod-ifications, regulation by microRNA (Rastorguev et al. 2016),and DNA methylation (Varriale 2014) might be involved inadaptation. There are several examples when variations inphenotypic traits are accompanied by minimum genetic di-versity, but a significant level of epigenetic diversity.Noteworthy examples include bats (Liu et al. 2012, 2015)and plants (Gao et al. 2010; Yi et al. 2010). A study inArctic charr (Salvelinus alpinus) revealed that seawater expo-sure induced changes in DNA methylation and peroxynitriteformation in gills (Norman et al. 2014). In a study aimed tounderstand the functionality of miRNA in stickleback adap-tation to freshwater environments, ten miRNAs were foundin divergence islands and two miRNAs contained SNPs withshifted allele frequencies between the freshwater and themarine populations (Rastorguev et al. 2016). DNA methyla-tion was shown to be associated with phenotypic variabilitybetween complete and low lateral plate morphs in the fresh-water stickleback population (Smith et al. 2015). Discovereddifferentially methylated regions (DMRs, mostly intergenic)were associated with genes having potentially adaptive func-tions, including cardiovascular development, growth, andneuromuscular development. However, the study was fo-cused only on freshwater fish and epigenetic adaptation towater salinity has not been studied yet.
High levels of genetic variation within a population mayimpose a high probability of adaptation of the population to anew environment. However, isolation of a small populationinevitably leads to decreased genetic diversity. Yet, to providea substrate for natural selection in a new environment, apopulation should demonstrate a certain amount of diversity.Such diversity may be achieved by epigenetic variations, sincegenetically inherited propensity to phenotypic variability,
even with no change in the mean phenotype, substantiallyincreases fitness (Feinberg and Irizarry 2010). The idea of anevolutionary benefit of increased epigenetic variability is for-mulated as the epigenetic plasticity hypothesis.
In this work, we performed whole-genome DNA meth-ylation profiling of marine and freshwater sticklebacks, aswell as sticklebacks moved for 4 days from a marine en-vironment to a freshwater environment and vice versa.We investigated the role of DNA methylation in theshort-term (4 days of exposure to a foreign environment)and long-term (differences between marine and freshwa-ter populations) adaptation to changed salinity. Wecompared the differences in DNA methylation betweenmarine and freshwater populations with genetic adapta-tions of a freshwater population studied in (Terekhanovaet al. 2014). To confirm that changes in DNA methylationhave a functional effect, we also investigated the expres-sion of the genes associated with differentially methyl-ated regions in the same sample groups.
Results
Changes in Water Salinity Have an Impact on DNAMethylation in SticklebacksTo explore the role of DNA methylation in adaptation tofreshwater conditions, we studied the following samplegroups: i) marine sticklebacks kept in marine water, theirnatural habitat (M@M); ii) freshwater sticklebacks kept infreshwater (F@F); iii) marine sticklebacks incubated in freshwater for 4 days (M@F); iv) freshwater sticklebacks incubatedin marine water for 4 days (F@M), (fig. 1).
DNA methylation was profiled in gills because this organcomes into direct contact with the surrounding water and islikely to be highly affected by osmotic stress. Three compar-isons were performed between the studied groups of individ-uals to discover differential methylation between marine andfreshwater populations of sticklebacks in water with naturalsalinity (M@M vs. F@F), methylation changes induced byplacing a marine stickleback into a freshwater environment(M@M vs. M@F) and methylation changes induced by plac-ing a freshwater stickleback into a marine environment (F@Fvs. F@M). We found 61, 245 and 26 DMRs for the three listedcomparisons (M@M vs. F@F, M@M vs. M@F, F@F vs. F@M,respectively), (Supplementary fig. S1A, SupplementaryMaterial online). Two DMRs were validated with bisulfitetreatment followed by Sanger sequencing (Supplementaryfig. S2, Supplementary Material online). The number ofDMRs discovered in each comparison did not reflect the dif-ference between groups: MM and MF groups were the mostsimilar but had the highest amount of DMRs if comparedagainst each other (Supplementary fig. S3, SupplementaryMaterial online). Instead, more DMRs were discovered be-tween groups having low within-group variance.
Most of the DMRs we discovered were located withinannotated genes or within 1 kb from gene boundaries(Supplementary fig. S4, Supplementary Material online),even though genes and gene flanks occupy no more than aquarter of the genome. Nevertheless, the observed significant
Artemov et al. . doi:10.1093/molbev/msx156 MBE
2204
Dow
nloaded from https://academ
ic.oup.com/m
be/article-abstract/34/9/2203/3813257 by Washington State U
niversity user on 08 April 2019

enrichment of DMRs within genes (p(Binomial) between2*10�30 and 10�5) can be explained by increased CpG densityin the genic regions and in the regions profiled by RRBS ratherthan by the functional role of DMRs. We associated the DMRswith genes (see Materials and Methods). We called a genedifferentially methylated (DMG) if it was linked to at least oneDMR. We detected 40, 151 and 16 DMGs for M@M vs. F@F,M@M vs. M@F, and F@F vs. F@M comparisons, respectively(Supplementary fig. S1B, Supplementary Material online).
We also validated functional changes in expression of thegenes associated with DMRs by RNA-seq. Out of 11 DMGsthat were differentially expressed between marine and fresh-water populations (M@M vs. F@F), eight genes had expres-sion changes in line with the direction of change in DNAmethylation: seven genes were hypomethylated and upregu-lated, one gene was hypermethylated and downregulated.This result indicated that, in general, DNA methylation wasassociated with repressed transcription.
Some of the observed DMRs were located in gene bodieswhich can be explained by increased GC content in exons andthe bias of RRBS towards GC- and CpG-rich sequences. DMRswithin gene bodies can occur at intergenic enhancers or atalternative promoters—in this case we would expect an in-crease of gene expression following hypomethylation of aDMR. Alternatively, DNA methylation can be changed be-cause of altered transcription elongation in gene body—inthis case increased expression is expected to cause increase in
DNA methylation. Therefore, we observe negative correlationbetween DNA methylation and expression only in some ofthe detected DMGs.
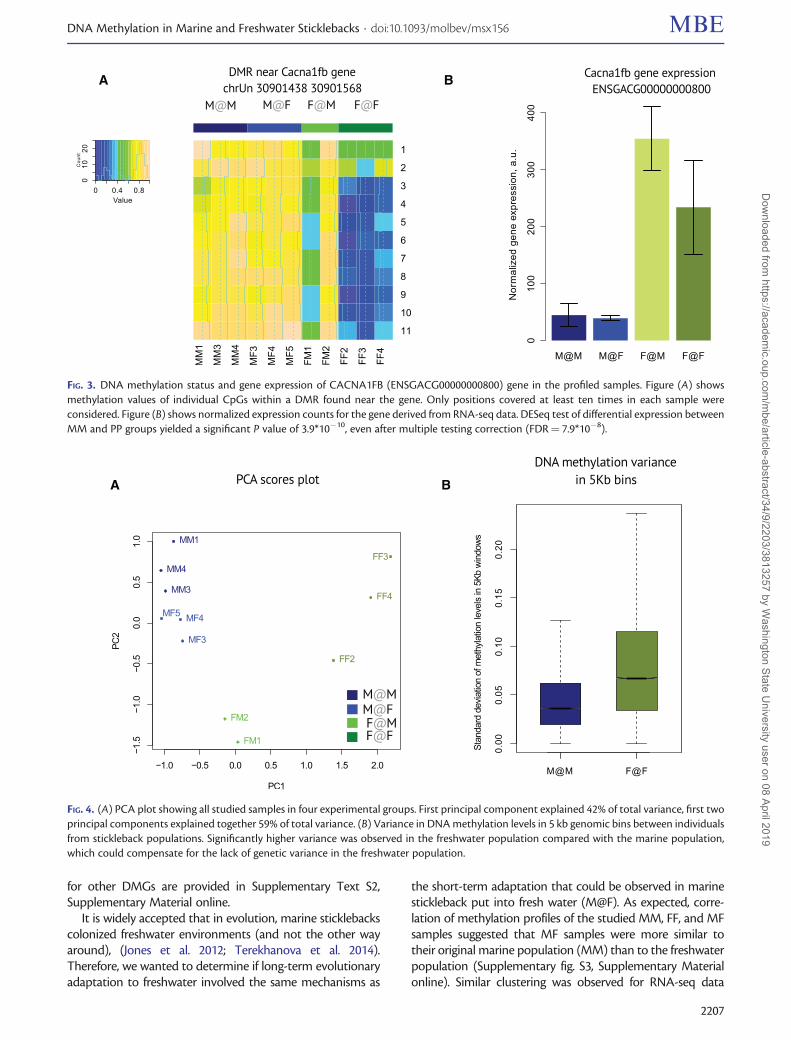
Ion Channels, Membrane Proteins and RegulatoryGenes Are Differentially Methylated between Marineand Freshwater SticklebacksTo investigate long term evolutionary adaptation, wecompared M@M to F@F (MMFF). A list of DMGs forMMFF consisted of 40 genes (Supplementary fig. S1B,Supplementary Material online). Gene category enrichmentanalysis revealed that the genes differentially methylated inthe freshwater stickleback (F@F) population, as comparedwith the marine (M@M) population, were significantly en-riched for ion channels and transmembrane proteins (fig. 2A).In fact, all the categories discovered were associated withmembrane-bound proteins. The discovered ion channels in-cluded CACNA1FB (ENSGACG00000000800)—calciumchannel, voltage-dependent, L type, alpha 1F subunit, Hþ/Kþ exchanging ATPase ATP4A (ENSGACG00000008911)and potassium voltage-gated channel KCND3 (ENSGACG00000000195), as well as gap junction protein GJA3(ENSGACG00000001367). In figure 3A, we summarized themethylation changes in individual CpGs in the DMR associ-ated with one of these ion channels, CACNA1FB. A coordi-nated decrease in methylation was observed in each CpGwithin the DMR in the freshwater population (FF) compared
FIG. 1. Experimental design. DNA methylation was profiled in four conditions: marine stickleback in marine and freshwater environment,freshwater stickleback in freshwater and marine environment. Differentially methylated regions were found between marine and freshwatersticklebacks in their respective natural habitats. These methylation changes were compared with the immediate changes caused by placing marinesticklebacks into a freshwater environment. Additionally, a similar comparison was made to find DNA methylation changes after placingfreshwater sticklebacks into a sea environment.
DNA Methylation in Marine and Freshwater Sticklebacks . doi:10.1093/molbev/msx156 MBE
2205
Dow
nloaded from https://academ
ic.oup.com/m
be/article-abstract/34/9/2203/3813257 by Washington State U
niversity user on 08 April 2019

with the marine population (MM). Moreover, we showedthat expression of CACNA1FB was significantly higher inthe freshwater population than the marine population(fig. 3B, P value of differential expression between MM and
PP groups 3.9*10�10, FDR 7.9*10�8). The direction of changesin DNA methylation and gene expression were in line with acommon concept that DNA methylation in gene promoterswas negatively correlated with gene expression. Similar figures
A
B
FIG. 2. GO categories enrichment plot for genes associated with DMRs between (A) marine and freshwater populations; (B) marine population inits native environment and marine sticklebacks placed into fresh water. X-axis shows enrichment P value according to Fisher exact test (loga-rithmic scale). Only categories with more than one differentially methylated gene were considered.
Artemov et al. . doi:10.1093/molbev/msx156 MBE
2206
Dow
nloaded from https://academ
ic.oup.com/m
be/article-abstract/34/9/2203/3813257 by Washington State U
niversity user on 08 April 2019
for other DMGs are provided in Supplementary Text S2,Supplementary Material online.
It is widely accepted that in evolution, marine sticklebackscolonized freshwater environments (and not the other wayaround), (Jones et al. 2012; Terekhanova et al. 2014).Therefore, we wanted to determine if long-term evolutionaryadaptation to freshwater involved the same mechanisms as
the short-term adaptation that could be observed in marinestickleback put into fresh water (M@F). As expected, corre-lation of methylation profiles of the studied MM, FF, and MFsamples suggested that MF samples were more similar totheir original marine population (MM) than to the freshwaterpopulation (Supplementary fig. S3, Supplementary Materialonline). Similar clustering was observed for RNA-seq data
A B
FIG. 3. DNA methylation status and gene expression of CACNA1FB (ENSGACG00000000800) gene in the profiled samples. Figure (A) showsmethylation values of individual CpGs within a DMR found near the gene. Only positions covered at least ten times in each sample wereconsidered. Figure (B) shows normalized expression counts for the gene derived from RNA-seq data. DESeq test of differential expression betweenMM and PP groups yielded a significant P value of 3.9*10�10, even after multiple testing correction (FDR¼ 7.9*10�8).
A B
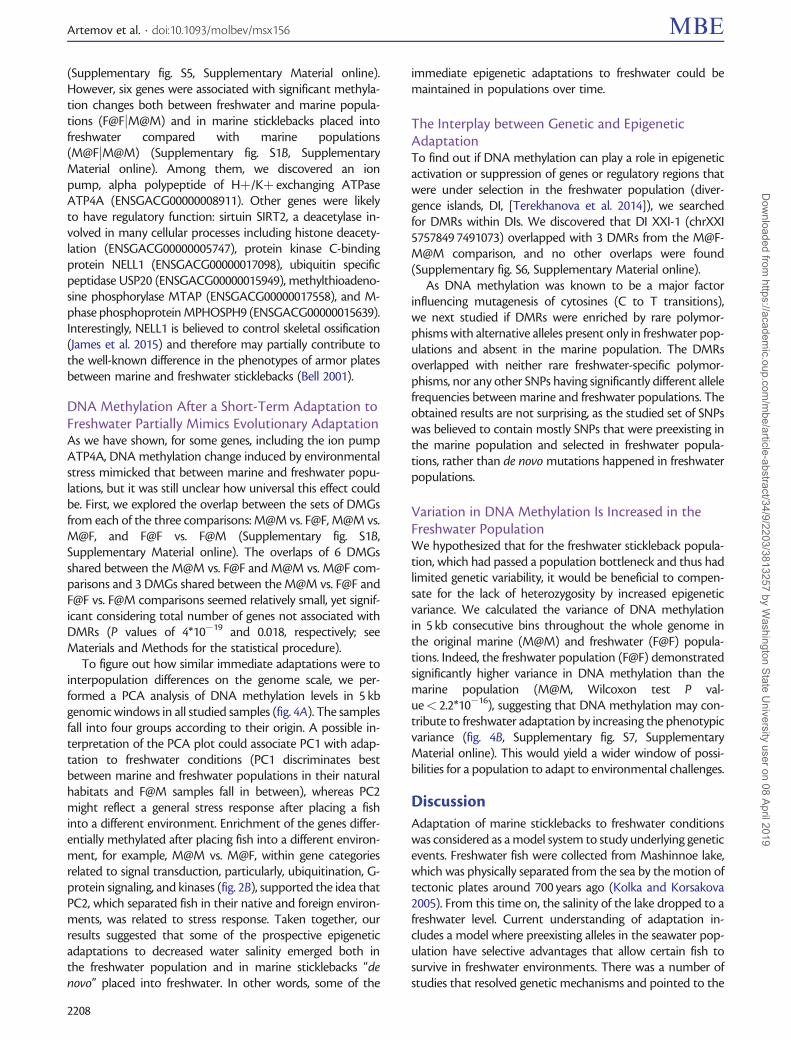
FIG. 4. (A) PCA plot showing all studied samples in four experimental groups. First principal component explained 42% of total variance, first twoprincipal components explained together 59% of total variance. (B) Variance in DNA methylation levels in 5 kb genomic bins between individualsfrom stickleback populations. Significantly higher variance was observed in the freshwater population compared with the marine population,which could compensate for the lack of genetic variance in the freshwater population.
DNA Methylation in Marine and Freshwater Sticklebacks . doi:10.1093/molbev/msx156 MBE
2207
Dow
nloaded from https://academ
ic.oup.com/m
be/article-abstract/34/9/2203/3813257 by Washington State U
niversity user on 08 April 2019
(Supplementary fig. S5, Supplementary Material online).However, six genes were associated with significant methyla-tion changes both between freshwater and marine popula-tions (F@FjM@M) and in marine sticklebacks placed intofreshwater compared with marine populations(M@FjM@M) (Supplementary fig. S1B, SupplementaryMaterial online). Among them, we discovered an ionpump, alpha polypeptide of Hþ/Kþ exchanging ATPaseATP4A (ENSGACG00000008911). Other genes were likelyto have regulatory function: sirtuin SIRT2, a deacetylase in-volved in many cellular processes including histone deacety-lation (ENSGACG00000005747), protein kinase C-bindingprotein NELL1 (ENSGACG00000017098), ubiquitin specificpeptidase USP20 (ENSGACG00000015949), methylthioadeno-sine phosphorylase MTAP (ENSGACG00000017558), and M-phase phosphoprotein MPHOSPH9 (ENSGACG00000015639).Interestingly, NELL1 is believed to control skeletal ossification(James et al. 2015) and therefore may partially contribute tothe well-known difference in the phenotypes of armor platesbetween marine and freshwater sticklebacks (Bell 2001).
DNA Methylation After a Short-Term Adaptation toFreshwater Partially Mimics Evolutionary AdaptationAs we have shown, for some genes, including the ion pumpATP4A, DNA methylation change induced by environmentalstress mimicked that between marine and freshwater popu-lations, but it was still unclear how universal this effect couldbe. First, we explored the overlap between the sets of DMGsfrom each of the three comparisons: M@M vs. F@F, M@M vs.M@F, and F@F vs. F@M (Supplementary fig. S1B,Supplementary Material online). The overlaps of 6 DMGsshared between the M@M vs. F@F and M@M vs. M@F com-parisons and 3 DMGs shared between the M@M vs. F@F andF@F vs. F@M comparisons seemed relatively small, yet signif-icant considering total number of genes not associated withDMRs (P values of 4*10�19 and 0.018, respectively; seeMaterials and Methods for the statistical procedure).
To figure out how similar immediate adaptations were tointerpopulation differences on the genome scale, we per-formed a PCA analysis of DNA methylation levels in 5 kbgenomic windows in all studied samples (fig. 4A). The samplesfall into four groups according to their origin. A possible in-terpretation of the PCA plot could associate PC1 with adap-tation to freshwater conditions (PC1 discriminates bestbetween marine and freshwater populations in their naturalhabitats and F@M samples fall in between), whereas PC2might reflect a general stress response after placing a fishinto a different environment. Enrichment of the genes differ-entially methylated after placing fish into a different environ-ment, for example, M@M vs. M@F, within gene categoriesrelated to signal transduction, particularly, ubiquitination, G-protein signaling, and kinases (fig. 2B), supported the idea thatPC2, which separated fish in their native and foreign environ-ments, was related to stress response. Taken together, ourresults suggested that some of the prospective epigeneticadaptations to decreased water salinity emerged both inthe freshwater population and in marine sticklebacks “denovo” placed into freshwater. In other words, some of the
immediate epigenetic adaptations to freshwater could bemaintained in populations over time.
The Interplay between Genetic and EpigeneticAdaptationTo find out if DNA methylation can play a role in epigeneticactivation or suppression of genes or regulatory regions thatwere under selection in the freshwater population (diver-gence islands, DI, [Terekhanova et al. 2014]), we searchedfor DMRs within DIs. We discovered that DI XXI-1 (chrXXI5757849 7491073) overlapped with 3 DMRs from the M@F-M@M comparison, and no other overlaps were found(Supplementary fig. S6, Supplementary Material online).
As DNA methylation was known to be a major factorinfluencing mutagenesis of cytosines (C to T transitions),we next studied if DMRs were enriched by rare polymor-phisms with alternative alleles present only in freshwater pop-ulations and absent in the marine population. The DMRsoverlapped with neither rare freshwater-specific polymor-phisms, nor any other SNPs having significantly different allelefrequencies between marine and freshwater populations. Theobtained results are not surprising, as the studied set of SNPswas believed to contain mostly SNPs that were preexisting inthe marine population and selected in freshwater popula-tions, rather than de novo mutations happened in freshwaterpopulations.
Variation in DNA Methylation Is Increased in theFreshwater PopulationWe hypothesized that for the freshwater stickleback popula-tion, which had passed a population bottleneck and thus hadlimited genetic variability, it would be beneficial to compen-sate for the lack of heterozygosity by increased epigeneticvariance. We calculated the variance of DNA methylationin 5 kb consecutive bins throughout the whole genome inthe original marine (M@M) and freshwater (F@F) popula-tions. Indeed, the freshwater population (F@F) demonstratedsignificantly higher variance in DNA methylation than themarine population (M@M, Wilcoxon test P val-ue< 2.2*10�16), suggesting that DNA methylation may con-tribute to freshwater adaptation by increasing the phenotypicvariance (fig. 4B, Supplementary fig. S7, SupplementaryMaterial online). This would yield a wider window of possi-bilities for a population to adapt to environmental challenges.
DiscussionAdaptation of marine sticklebacks to freshwater conditionswas considered as a model system to study underlying geneticevents. Freshwater fish were collected from Mashinnoe lake,which was physically separated from the sea by the motion oftectonic plates around 700 years ago (Kolka and Korsakova2005). From this time on, the salinity of the lake dropped to afreshwater level. Current understanding of adaptation in-cludes a model where preexisting alleles in the seawater pop-ulation have selective advantages that allow certain fish tosurvive in freshwater environments. There was a number ofstudies that resolved genetic mechanisms and pointed to the
Artemov et al. . doi:10.1093/molbev/msx156 MBE
2208
Dow
nloaded from https://academ
ic.oup.com/m
be/article-abstract/34/9/2203/3813257 by Washington State U
niversity user on 08 April 2019
alleles that change their frequency upon this adaptation(Jones et al. 2012; Terekhanova et al. 2014). However, littleis known on how the stickleback epigenome responds toaltered salinity. We aimed to detect changes in DNA meth-ylation in fish living at different salt concentrations.
Similarly to previously discovered selection-driven geneticalterations between marine and freshwater populations, theepigenetic changes which we found in this study were asso-ciated with transmembrane proteins and particularly ionpumps. Differentially methylated genes included a calciumchannel CACNA1FB, a potassium channel KCND3, an Hþ/Kþ exchanging ATPase ATP4A and a gap junction proteinGJA3. Strikingly, genetic studies of marine and freshwatersticklebacks discovered functionally similar genes, such as po-tassium channel KCNH4 (Jones et al. 2012) and an ion-exchanging ATPase ATP1A1 (Terekhanova et al. 2014).Nevertheless, the sets of genes that were affected geneticallyand epigenetically did not overlap. This fact supported theidea that genetic and epigenetic adaptations represent inde-pendent mechanisms, which are both necessary for environ-mental adaptation. Moreover, it suggested that the observedepigenetic differences did not arise solely in cis due to differ-ent genetic backgrounds of fish populations. However, ourmodel does not exclude a possibility that DNA methylation isaffected by genetic background in trans.
Remarkably, the differences in DNA methylation betweenthe marine and the freshwater populations had a significantsimilarity to the changes in DNA methylation that were in-duced by short-term exposure of marine fish to freshwaterenvironment. A significant overlap of the DMGs found inboth of those two comparisons included an ion pump(ATP4A) and several regulatory genes. Differential methyla-tion in one of these genes, NELL1, could potentially affectskeletal ossification and explain the difference in the pheno-types of armor plates between marine and freshwater stick-lebacks (Bell 2001; James et al. 2015). Alteration of DNAmethylation in the genes that were differentially methylatedin both comparisons might represent an initial response tofreshwater conditions, which cannot be substituted by otherevolutionary changes and thus the difference remains be-tween the populations. However, the current data are notsufficient to distinguish if the methylation pattern character-istic to marine or freshwater populations is inherited throughmeiosis or results from permanent exposure to freshwater ormarine environment.
The genes that were differentially methylated after placinga marine stickleback into freshwater were enriched with stressresponse and signal transduction genes, which resembled theresponse of other organisms to osmotic stress. In particular,we observed differential methylation of the genes involved inubiquitination and autophagy, such as ubiquitin-specific pep-tidase USP16, ubiquitin carboxyl-terminal esterase L3 UCHL3,ubiquitin conjugating enzyme E2 E1 UBE2E1, as well asmitogen-activated protein kinase kinase kinase 4 (MAP3K4)which is believed to be activated in response to stress, includ-ing osmotic stress. Previously, osmotic stress was shown tocause accumulation of polyubiquitinated proteins throughactivation of p38 MAPK kinases which in turn inhibited
proteasome activity (Whitmarsh and Davis 2007; Lee et al.2010). Hypermethylation of MAP3K4 kinase and hypomethy-lation of uchl3 observed in marine sticklebacks placed intofreshwater could in principle reduce protein ubiquitinationlevel and serve as an adaptation to osmotic stress.
DNA methylation can potentially contribute to gene inac-tivation in two ways: on one hand, de novo methylated re-gions mark genes with altered expression, on the other hand,methylated cytosines are targets for increased (up to 5-fold)cytosine-uracil-thymine mutability through deamination(Cooper and Krawczak 1989). On a population level, DNAmethylation was also shown to greatly influence cytosinemutation rate in humans (Xia et al. 2012). Thus, changes inDNA methylation in germline cells presumably had a poten-tial to become fixed in the genome upon sea to freshwateradaptation, which could theoretically lead to increased abun-dance of C> T transitions between sea (C) and freshwater(T) sticklebacks among C’s that are de novo methylated infreshwater fish. However, we found no overlap between poly-morphisms that have differential allele frequencies in marineand freshwater sticklebacks and DMRs in any of the threecomparisons. This observation does not disprove the hypoth-esis that DNA methylation could facilitate genetic silencing ofgenes by increasing the mutation rate of methylated CpGs intheir regulatory regions, as the studied polymorphisms re-flected selection rather than mutagenesis. Due to low samplesizes, current studies are unable to fetch polymorphisms withlow minor allele frequencies. Therefore, most mutational ef-fects are likely to be lost.
In Feinberg and Irizarry (2010), a new concept of variablymethylated regions (VMRs) was defined as regions in whichDNA methylation varies stochastically across the population,even within the same tissue and even in isogenic mice. In aconventional model, marine sticklebacks represent a geneticreservoir that gives rise to a freshwater population with min-imal genetic diversity, but with a capability to live both at highand low salt concentrations. We formulated a hypothesis thata population challenged by minimal genetic diversity mightadapt to a new environment and maintain a certain level ofphenotypic variation by having a high level of epigenetic var-iability. Hence, we expected to see higher variance of DNAmethylation in the freshwater population compared with themarine population. Indeed, figure 4B confirms this statement.In an attempt to find a mechanism driving higher epigeneticvariance in the freshwater population, we checked whethergenomic loci that were reported by Terekhanova et al. (2014)and served as landmarks of the genetic component of adap-tation included genes that were responsible for chromatinarchitecture or DNA methylation. However, we found nochromatin regulators among the genes within the regionsunder selection. Genetics that could underlie higher epige-netic plasticity in freshwater sticklebacks still remains unclear.
Materials and Methods
Sample CollectionTen freshwater three-spined sticklebacks were collectedin the Mashinnoye Lake, Republic of Karelia, Russia, in
DNA Methylation in Marine and Freshwater Sticklebacks . doi:10.1093/molbev/msx156 MBE
2209
Dow
nloaded from https://academ
ic.oup.com/m
be/article-abstract/34/9/2203/3813257 by Washington State U
niversity user on 08 April 2019

June–July 2014. The same number of marine three-spinedsticklebacks were collected in the Kandalaksha Gulf Coast(15 km from the railway station Poyakonda, Republic ofKarelia, Russia; water salinity of 26 promille) during thesame time frame. To ensure equal physiological states ofthe fish, only males in breeding dress were collected.
To explore the immediate epigenetic response of a stick-leback to changes in osmotic conditions of the environment,five marine fish were kept for 4 days in fresh water (M@F) and,vice versa, five freshwater fish were kept for 4 days in marinewater (F@M, water salinity of 26 promille). We chose the ex-posure time to let the epigenome adapt to marine or fresh-water conditions. It has been shown that for a cell line it takesup to 24 h to establish epigenome changes after exposure tohigh salt conditions (Dmitrieva et al. 2011). We hypothesizedthat it could take longer for the organism tissue to adapt,therefore we chose 4 days as a period of exposure to a differentsalinity conditions. It should be noted that control samples(M@M, F@F) were kept in the water with native salinity forthe same time period to equal captivity stress influence.
Library Preparation, RRBS Sequencing and DataProcessingControl fish were kept in their native habitats (marine sam-ples in marine water (M@M), freshwater samples in freshwater (F@F)) to equal captivity stress influence. After 4days of exposure, DNA was isolated from gills (an organthat is directly exposed to water is likely to be highly affectedby osmotic stress) using a standard method of DNA extrac-tion from animal tissue (phenol-chloroform). The concentra-tion of DNA in the samples was measured using a Nanodropspectrophotometer (Supplementary table S2, SupplementaryMaterial online).
Three individual fish from each of the four experimentalconditions were taken for bisulfite sequencing(Supplementary table S2, Supplementary Material online).DNA methylation was profiled by reduced representationbisulfite sequencing (RRBS). Two micrograms of genomicDNA from three-spined stickleback samples of G. aculeatusof (Supplementary table S2, Supplementary Material online)and 4 ng of lambda phage DNA were digested using 60 UMspI (Fermentas, USA) in 50ml at 37�� for 18–24 h, followedby QIAquick purification (Qiagen, Germany). The end of thedigested DNA was repaired, and an adenine was added to the30 end of the DNA fragments according to the Illumina stan-dard end repair and add_A protocol (Illumina, USA).Preannealed forked Illumina adaptors containing 50-methylcytosine instead of cytosine were ligated to bothends of DNA fragments using standard Illumina adaptor liga-tion protocol (Illumina, USA). Ligated fragments were thenseparated by 2% agarose gel (Sigma-Aldrich, USA). Fragmentsbetween 170 and 350 bp, (includes adaptor length), were se-lected and cut from the gel. DNA from gel slices were purifiedusing the Qiagen Gel Extraction Kit (Qiagen, Germany). Thesodium bisulfite treatment and subsequent clean-up of sizeselected DNA was performed with the EZ DNAMethylationTM Kit (ZymoResearch, USA) according to themanufacturer’s instructions. The bisulfite-treated DNA
fragments were amplified using PCR and the following reac-tion: 5ml of eluted DNA, 1ml of NEB PE PCR two primers (1.0and 2.0), and 45ml Platinum PCR Supermix (Invitrogen, USA).The amplification conditions were as follows: 5 min at 95 �C,30 s at 98 �C then 15 (10 s at 98 �C, 30 s at 65 �C, 30 s at72 �C), followed by 5 min at 72 �C. The PCR reaction waspurified by MinElute PCR Purification Kit (Qiagen), and finalreduced representation bisulfite library was eluted in 15ml EBbuffer. The concentration of the final library was measuredusing the Agilent 2100 Bioanalyzer (Agilent Technologies,USA). The library was sequenced on Illumina 2500 platformaccording to standard Illumina cluster generation and se-quencing protocols. 100-bp single-end reads were generated.
Reads were mapped to gasAcu1 reference genome (aug-mented with the genomic sequence of lambda phage) withBismark software (Krueger and Andrews 2011). As the spiked-in phage DNA was unmethylated, the methylation level ofcytosines in lambda phage DNA profiled in the experimentserved as a measure of how incomplete the bisulfite conver-sion was. The observed methylation levels of 0.30–0.65% forall sample except FM3 suggested that bisulfite conversion was99.35–99.70% complete (Supplementary table S3,Supplementary Material online, “RRBS” sheet). However, forFM3 sample bisulfite conversion appeared to be incomplete(41%). This sample from the FM experimental group wasexcluded from the analysis after quality control. Individualsamples from each experimental groups were treated as bio-logical replicates. With bsseq R package (Hansen et al. 2012),we found individual differentially methylated CpG’s and dif-ferentially methylated regions (DMRs). Default parameters forbsseq were used: minimal coverage per CpG 10, t-statisticscutoff 4.6, minimal mean methylation difference betweengroups 0.1, minimal number of CpGs per DMR 3. IndividualDMRs were visualized to inspect methylation frequencies andread coverage per individual CpGs in individual samples.RRBS produced data for each CpG dinucleotide, thus givinginformation with single nucleotide resolution. To enhancethe statistical power of the analysis, instead of looking forindividual CpG dinucleotides which altered methylation level,we searched for differentially methylated regions (DMRs) thatcontain at least three CpG and demonstrate at least 10%difference in methylation. ENSEMBL gene annotation (version81) was used to find genes localized no further than 1 kb fromdifferentially methylated sites.
To estimate the false discovery rate (FDR) of the DMRdiscovery procedure, we applied a permutation approach.In every iteration, we randomly selected two groups of threesamples each and ran the DMR discovery procedure, whichwould find differentially methylated regions between thosetwo groups. We excluded the cases in which any of the twopermuted groups was equal to one of the experimentalgroups (e.g., all samples in a permuted group came fromthe MM group). The procedure was repeated 100 times.This procedure yielded a median of 20 DMRs per iterationbetween permuted groups of samples, which can be used asan expected number of false discoveries. Considering thatsamples from all experimental groups were used for permu-tations, we compared the expected number of false
Artemov et al. . doi:10.1093/molbev/msx156 MBE
2210
Dow
nloaded from https://academ
ic.oup.com/m
be/article-abstract/34/9/2203/3813257 by Washington State U
niversity user on 08 April 2019

discoveries to the average number of real DMRs discovered inthe MMFF and MMMF comparisons. We only considered thecomparisons in which a group of three samples was com-pared with a group of three samples (i.e., MMFF and MMMF)as a lower number of samples in an experimental group (e.g.,two samples in the FM group) can affect the number of thediscovered DMRs. Based on these considerations, the FDR canbe estimated on the level of 0.07 (20 expected false discoveriesvs. 153 real hits).
For DMR validation, genomic DNA from gills was purifiedusing a standard procedure of DNA extraction from animaltissue (phenol-chloroform). Bisulfite conversion was per-formed by EZ DNA methylation Kit (Zymo Research) accord-ing to the manufacturer’s instructions. After bisulfiteconversion, selected regions were amplified by the followingpairs of primers:
TTGGATCCGTTTGGTATGTAATTATATTTGGT and
TTGAATTCACTACTACGAAATAAATAACACCC;
TTGGATCCTGATTGAATATGTAGTATGTAGTT and
TTGAATTCAACTCAACTACAACTCAATA.
PCR products were cloned to the T-vector. For each regionten clones were sequenced by Sanger and analyzed. The twoprofiled regions appeared to be differentially methylated inSanger sequencing (Fisher’s exact test P values were<2.2*10�16
and 2.3*10�9; Supplementary fig. S2, Supplementary Materialonline). We also used DNA methylation values profiled bySanger sequencing to validate precision of RRBS profiling forindividual CpGs. Overall correlation of methylation rate pro-filed by RRBS and Sanger for individual CpGs in correspondingsample groups was 0.900 (P value¼ 2*10�9).
To describe how the DMRs were localized with respect togenes and gene flanks, we calculated the number of DMRswithin genes, the number of DMRs located no further than1 kb from a gene and the number of DMRs in intergenicregions. We also estimated the total genomic length of genicregions, gene flanks, and intergenic region. A backgroundprobability of a DMR to appear within a gene or a gene flankunder a null hypothesis of no enrichment was estimated as afraction of the total length of genic regions and gene flanks inthe genome. We performed a binomial test to estimate if theDMRs were enriched within genes and gene flanks.
We annotated the DMRs with respect to known stickle-back genes. In particular, we searched for all differentiallymethylated regions (DMR) within 1kb upstream and 1kbdownstream of all annotated genes. We considered a geneto be differentially methylated (DMG) if it had a DMR nofurther than 1 kb from it (Supplementary table S1,Supplementary Material online). Additionally, we provide av-erage DNA methylation within the 2 kb regions surrounding aTSS for each transcript (Supplementary table S4,Supplementary Material online).
DMGs were further used for gene category enrichmentanalysis. Annotation of genes related to GO categories wastaken from ENSEMBL database. Gene set enrichment analysiswas done as follows: for each category having at least one
gene in a gene set, we performed Exact Fisher’s test to check ifthe category is enriched in a given gene set.
To estimate the significance of overlap between two sets ofDMRs (e.g., M@M vs. F@F and M@M vs. M@F) under a strictassumption that most of DMRs were associated with genepromoters, the following test was performed. For each gene,we asked if a DMR from each of the two sets was associatedwith the gene. Next, we performed Fisher exact test to checkif presence of a DMR in one set was associated with presenceof a DMR in the other set.
RNA Preparation and RNA SequencingFor RNA-seq, we used the same sample collection and treat-ment procedure as described for bisulfite sequencing. Fourfish from each of the four experimental groups were taken fortranscriptome analysis. Gills were isolated and fixed withIntactRNAVR reagent (Evrogen).
Total RNA was extracted from the samples with Trisolreagent according to the manufacturer’s instructions(Invitrogen). Quality was checked with the BioAnalyser andRNA 6000 Nano Kit (Agilent). PolyA RNA was purified withDynabeadsVR mRNA Purification Kit (Ambion). An Illuminalibrary was made from polyA RNA with NEBNextVR mRNALibrary Prep Reagent Set (NEB) according to the manual.Paired-end sequencing was performed on HiSeq1500 with 2� 75 bp read length. Approximately 25 million reads weregenerated for each sample.
Reads were mapped to gasAcu1 genome with tophat2software (version 2.1.0) (Kim et al. 2013). Number of RNA-seq reads, number of unmapped reads and mapping effi-ciency is summarized in Supplementary table S3,Supplementary Material online (“RNA-seq” sheet). Genemodels of nonoverlapping exonic fragments were takenfrom ENSEMBL 54 database. For each exonic fragment, totalcoverage by mapped reads in each sample was calculatedwith bedtools multicov tool (version 2.17.0). Total gene cov-erage was calculated as a sum of coverages of all nonoverlap-ping exonic fragments of a gene. Differential expressionanalysis was performed by applying default read count nor-malization and performing per-gene negative binomial tests,implemented in edgeR R package, with default parameters(Robinson et al. 2010). For each gene, the package providedboth P values and FDRs (P values after Benjamini-Hochbergmultiple testing corrections). Raw read counts and normal-ized read counts for each gene in each sample, as well asdifferential expression P values and fold-changes for MMFF,MMMF, and FFFM comparisons are provided inSupplementary table S5, Supplementary Material online.
Exploratory Statistical AnalysesPrincipal component analysis (PCA) was performed with astandard prcomp function in R. The genome was split into5 kb windows, a total amount of methylation-supportingreads and total coverage was calculated for each window,thus yielding a robust estimate of DNA methylation level.Methylation values for each bins were taken as input vari-ables, whereas each point in a multidimensional space repre-sented a stickleback individual.
DNA Methylation in Marine and Freshwater Sticklebacks . doi:10.1093/molbev/msx156 MBE
2211
Dow
nloaded from https://academ
ic.oup.com/m
be/article-abstract/34/9/2203/3813257 by Washington State U
niversity user on 08 April 2019

To estimate variation of DNA methylation, we calculatedDNA methylation levels in 5 kb windows the same way as forPCA analysis. Standard deviation of DNA methylation levelswas calculated for each genomic window within each stick-leback population. Distributions of obtained standard devia-tions were compared between populations, and eachpopulation contained the same amount of individualsprofiled.
To confirm that the observed difference in variance wasnot caused by different number of reads in samples, we per-formed read sampling. From each sample, we randomly se-lected the number of reads equal to the minimal number ofreads among all samples and repeated read mapping, meth-ylation calling and variance analysis as described above.
Data AvailabilityRRBS data was deposited to NCBI GEO under GSE82310study accession code.
Ethics StatementThis work was approved by ethical committee of ResearchCenter of Biotechnology RAS, Moscow, Russia
Supplementary MaterialSupplementary data are available at Molecular Biology andEvolution online.
AcknowledgmentsWe would like to acknowledge Nadezhda Terekhanova forproviding preprocessed allele frequencies data in sea andfreshwater populations from (Terekhanova et al. 2014) andfor meaningful discussion. We would like to thank Cailin Kellyfor editing the manuscript. We thank Prof KonstantinSkryabin for comprehensive assistance with this project.This work was supported by Russian Science Foundation(RSF) grant #14-24-00175.
ReferencesBarrett RDH, Paccard A, Healy TM, Bergek S, Schulte PM, Schluter D,
Rogers SM. 2011. Rapid evolution of cold tolerance in stickleback.Proc Biol Sci. 278:233–238.
Bell MA. 2001. Lateral plate evolution in the threespine stickleback:getting nowhere fast. Genetica 112–113:445–461.
Chan YF, Marks ME, Jones FC, Villarreal G Jr, Shapiro MD, Brady SD,Southwick AM, Absher DM, Grimwood J, Schmutz J, et al. 2010.Adaptive evolution of pelvic reduction in sticklebacks by recurrentdeletion of a Pitx1 enhancer. Science 327:302–305.
Cooper DN, Krawczak M. 1989. Cytosine methylation and the fate ofCpG dinucleotides in vertebrate genomes. Hum. Genet 83:181–188.
Dmitrieva NI, Burg MB. 2007. High NaCl promotes cellular senescence.Cell Cycle 6:3108–3113.
Dmitrieva NI, Cui K, Kitchaev DA, Zhao K, Burg MB. 2011. DNA double-strand breaks induced by high NaCl occur predominantly in genedeserts. Proc Natl Acad Sci U S A. 108:20796–20801.
Dmitrieva NI, Ferraris JD, Norenburg JL, Burg MB. 2006. The saltiness ofthe sea breaks DNA in marine invertebrates: possible implicationsfor animal evolution. Cell Cycle 5:1320–1323.
Feinberg AP, Irizarry RA. 2010. Evolution in health and medicine Sacklercolloquium: stochastic epigenetic variation as a driving force of
development, evolutionary adaptation, and disease. Proc NatlAcad Sci U S A. 107(Suppl 1):1757–1764.
Gao L, Geng Y, Li B, Chen J, Yang J. 2010. Genome-wide DNA methyl-ation alterations of Alternanthera philoxeroides in natural and ma-nipulated habitats: implications for epigenetic regulation of rapidresponses to environmental fluctuation and phenotypic variation.Plant Cell Environ 33:1820–1827.
Guo B, DeFaveri J, Sotelo G, Nair A, Meril€a J. 2015. Population genomicevidence for adaptive differentiation in Baltic Sea three-spined stick-lebacks. BMC Biol 13:19.
Hansen KD, Langmead B, Irizarry RA. 2012. BSmooth: from whole ge-nome bisulfite sequencing reads to differentially methylated regions.Genome Biol 13:R83.
Hohenlohe PA, Bassham S, Currey M, Cresko WA. 2012. Extensive link-age disequilibrium and parallel adaptive divergence across threes-pine stickleback genomes. Philos Trans R Soc Lond B Biol Sci.367:395–408.
James AW, Shen J, Zhang X, Asatrian G, Goyal R, Kwak JH, Jiang L, BengsB, Culiat CT, Turner AS, et al. 2015. NELL-1 in the treatment ofosteoporotic bone loss. Nat Commun. 6:7362.
Jones FC, Grabherr MG, Chan YF, Russell P, Mauceli E, Johnson J,Swofford R, Pirun M, Zody MC, White S, et al. 2012. The genomicbasis of adaptive evolution in threespine sticklebacks. Nature484:55–61.
Kim D, Pertea G, Trapnell C, Pimentel H, Kelley R, Salzberg SL. 2013.TopHat2: accurate alignment of transcriptomes in the presence ofinsertions, deletions and gene fusions. Genome Biol. 14:R36.
Kolka VV, Korsakova OP. 2005. Application of geological methods fordating of stone labyrinths on the White Sea coast. Proc MSTU15:349–356.
Konijnendijk N, Shikano T, Daneels D, Volckaert FAM, RaeymaekersJAM. 2015. Signatures of selection in the three-spined sticklebackalong a small-scale brackish water - freshwater transition zone. EcolEvol. 5:4174–4186.
Krueger F, Andrews SR. 2011. Bismark: a flexible aligner and methylationcaller for Bisulfite-Seq applications. Bioinformatics 27:1571–1572.
Lee S-H, Park Y, Yoon SK, Yoon J-B. 2010. Osmotic stress inhibits pro-teasome by p38 MAPK-dependent phosphorylation. J Biol Chem.285:41280–41289.
Lescak EA, Bassham SL, Catchen J, Gelmond O, Sherbick ML, von HippelFA, Cresko WA. 2015. Evolution of stickleback in 50 years onearthquake-uplifted islands. Proc Natl Acad Sci U S A.112:E7204–E7212.
Liu S, Sun K, Jiang T, Feng J. 2015. Natural epigenetic variation in bats andits role in evolution. J Exp Biol. 218:100–106.
Liu S, Sun K, Jiang T, Ho JP, Liu B, Feng J. 2012. Natural epigeneticvariation in the female great roundleaf bat (Hipposideros armiger)populations. Mol Genet Genomics 287:643–650.
McCairns RJS, Bernatchez L. 2010. Adaptive divergence between fresh-water and marine sticklebacks: insights into the role of phenotypicplasticity from an integrated analysis of candidate gene expression.Evolution 64:1029–1047.
Morris MRJ, Richard R, Leder EH, Barrett RDH, Aubin-Horth N, RogersSM. 2014. Gene expression plasticity evolves in response to coloni-zation of freshwater lakes in threespine stickleback. Mol Ecol.23:3226–3240.
Norman JD, Ferguson MM, Danzmann RG. 2014. An integrated tran-scriptomic and comparative genomic analysis of differential geneexpression in Arctic charr (Salvelinus alpinus) following seawaterexposure. J Exp Biol. 217:4029–4042.
Rastorguev SM, Nedoluzhko AV, Sharko FS, Boulygina ES, SokolovAS, Gruzdeva NM, Skryabin KG, Prokhortchouk EB. 2016.Identification of novel microRNA genes in freshwater and ma-rine ecotypes of the three-spined stickleback (Gasterosteusaculeatus). Mol Ecol Resour. Available from http://dx.doi.org/10.1111/1755-0998.12545.
Robinson MD, McCarthy DJ, Smyth GK. 2010. edgeR: a bioconductorpackage for differential expression analysis of digital gene expressiondata. Bioinformatics 26:139–140.
Artemov et al. . doi:10.1093/molbev/msx156 MBE
2212
Dow
nloaded from https://academ
ic.oup.com/m
be/article-abstract/34/9/2203/3813257 by Washington State U
niversity user on 08 April 2019

Roesti M, Marius R, Walter S. 2014. Natural selection: it’s a many-smallworld after all. Curr Biol. 24:R959–R962.
Smith G, Smith C, Kenny JG, Chaudhuri RR, Ritchie MG. 2015. Genome-wide DNA methylation patterns in wild samples of two morpho-types of threespine stickleback (Gasterosteus aculeatus). Mol BiolEvol. 32:888–895.
Terekhanova NV, Logacheva MD, Penin AA, Neretina TV, Barmintseva AE,Bazykin GA, Kondrashov AS, Mugue NS. 2014. Fast evolution fromprecast bricks: genomics of young freshwater populations of threes-pine stickleback Gasterosteus aculeatus. PLoS Genet. 10:e1004696.
Varriale A. 2014. DNA methylation, epigenetics, and evolution in verte-brates: facts and challenges. Int J Evol Biol. 2014:475981.
Whitmarsh AJ, Davis RJ. 2007. Role of mitogen-activated protein kinasekinase 4 in cancer. Oncogene 26:3172–3184.
Xia J, Han L, Zhao Z. 2012. Investigating the relationship of DNA meth-ylation with mutation rate and allele frequency in the human ge-nome. BMC Genomics 13(Suppl 8):S7.
Yi C, Zhang S, Liu X, Bui HTN, Hong Y. 2010. Does epigenetic polymor-phism contribute to phenotypic variances in Jatropha curcas L.?BMC Plant Biol. 10:259.
DNA Methylation in Marine and Freshwater Sticklebacks . doi:10.1093/molbev/msx156 MBE
2213
Dow
nloaded from https://academ
ic.oup.com/m
be/article-abstract/34/9/2203/3813257 by Washington State U
niversity user on 08 April 2019