Embed Size (px)
Citation preview

Spring 2016 MCAS/PARCC Results
For School Committee Meeting 10/5/2016
Prepared by Vy Vu, Data Specialist
1

Notes about the data
• In school year 2015-16, Milton Public Schools students participated in the Science MCAS in grades 5, 8, and 9.
• Grade 9 science MCAS is reported out by the state Department of Elementary and Secondary Education (DESE) a year later when students are in grade 10.
• The MCAS was also given to grade 10 students in ELA and Math, a high school graduation requirement.
• Additionally, in grades 3 to 8, students took the computer-based PARCC tests in ELA and Math.
• It is important to note that the state changed the ELA and Math assessments from MCAS to PARCC in 2014-15 for grades 3-8. Although PARCC remained in 2015-16, it is slightly different than the previous year, in that it was shortened from two sittings to one.
• In 2016-17 and going forward, the state will change the test again to MCAS 2.0, which will be a combination of MCAS, PARCC, and new items. 2

Notes about the data
• As this is designed to be a district level presentation, please note that district MCAS/PARCC results encompass all students assigned to the district, including any out-of-district placements.
• MCAS Warning/Failing category includes MCAS-Alt students regardless of their individual achievement level (Incomplete, Awareness, Emerging, or Progressing ).
• However, these MCAS-Alt students will still receive Composite Performance Index (CPI) points. – Incomplete = 25 CPI, Awareness = 50 CPI, Emerging = 75 CPI, and
Progressing = 100 CPI
– For certain disabilities, a score of Progressing may result in 75 CPI.
• DESE is not reporting out state results for PARCC this year, due to a majority of students (72% this year vs. 54% last year) taking PARCC over MCAS.
3

Accountability Determinations
• All Massachusetts districts and schools with sufficient data are classified into one of five accountability and assistance levels, with the highest performing in Level 1 and lowest performing in Level 5.
• In general, a district is classified into the level of its lowest performing school, unless the district was classified into Level 4 or 5 as a result of action by the Board of Elementary and Secondary Education.
• Massachusetts uses the Progress and Performance Index (PPI) to assess the improvement of each district and school toward its own targets. The PPI combines information about narrowing proficiency gaps, growth, and graduation and dropout rates into a single number.
• For a district or school to be considered to be making progress toward narrowing proficiency gaps, the cumulative PPI for both the "all students" group and “high needs” group must be 75 or higher.
4

2016 MPS Accountability
5

MPS Accountability Over Time
6
Progress and Performance Index (PPI) Accountability
2011-12 MCAS
2012-13 MCAS
2013-14 MCAS
2014-15 PARCC
2015-16 PARCC
District Level 1 Level 2 Level 2 Level 2 Level 2
Collicot Level 1 (87) Level 1 (90) Level 1 (93) Level 1 (95) Level 1 (Held
Harmless) (92)
Cunningham Level 1 (86) Level 2 (86) Level 2 (81) Level 2 (79) Level 2 (80)
Glover Level 1 (87) Level 1 (90) Level 2 (90) Level 2 (87) Level 2 (88)
Tucker Level 1 (64) Level 1 (68) Level 2 (62) Level 2 (66) Level 2 (59)
Pierce Level 1 (77) Level 2 (72) Level 2 (68) Level 2 (66) Level 2 (68)
MHS Level 1 (60) Level 1 (72) Level 2* (79) Level 1 (78) Level 2** (80)
(80) = percentile ranking indicating the school's overall performance relative to other schools that serve the same or similar grades in the state *due to MCAS participation rate of less than 95% of AfAm/Black students in Science **due to MCAS participation rate of less than 95% of students with disabilities

Looking at Overall Performance: Defining CPI
• CPI: The Composite Performance Index (CPI) is a 100-point index that assigns 100, 75, 50, 25, or 0 points to each student participating in MCAS and MCAS-Alternate Assessments (MCAS-Alt) based on their performance. – The total points assigned to each student are added together
and the sum is divided by the total number of students assessed. The result is a number between 0 and 100, which constitutes a district, school or group’s CPI for that subject and student group.
• The CPI is a measure of the extent to which students are progressing toward proficiency. A CPI of 100 means that all students are proficient or above.
• CPI measures the aggregate performance of a group of students and takes into account those who are proficient or above as well as those who are not yet proficient.
7

Understanding the Achievement Gap
8
Example: Take a group of G10 Students in ELA
Proficiency Goal: CPI = 100 for the group A CPI of 100 would mean that all students in this group taking the G10 ELA MCAS are proficient or higher. DESE has established a goal of reducing all proficiency gaps in half by 2017 based on 2011 CPI for all students and all subgroups.
Achievement Gap Goal: to reduce the CPI gap between subgroups and their counterparts.
Subgroup Counterpart Achievement (CPI) Gap
Econ Disadv CPI = 70
Non Econ Disadv CPI = 90
90 – 70 = 20 pts
SWD CPI = 60
Non SWD CPI = 90
90 – 60 = 30 pts
AfAm CPI = 80
White CPI = 95
95 –80 = 15 pts
Example: Econ Disadv group increases its CPI to 80 by moving a lot of students from Warning into Needs Improvement and Proficient. But its counterpart, Non Econ Disadv, also increases its CPI to 100 by moving all students from Needs Improvement into Proficient. The gap between this particular subgroup is still 20. Since we’re only looking at the gap, even if a subgroup makes improvement, if that improvement doesn’t outpace the performance of the counterpart group, the gap won’t necessarily close.

ELA TEST RESULTS
9

How did MPS perform in ELA over time?
10
2011 CPI 2012 CPI 2013 CPI 2014 CPI 2015 CPI 2016 CPI
MHS - G10 ELA 96.8 99.1 99.6 98.9 99.1 99.1
Pierce - G8 ELA 97.4 97.1 95.4 95.7 97.0 96.3
Pierce - G7 ELA 95.6 94.4 93.8 96.3 91.0 93.0
Pierce - G6 ELA 92.1 92.9 94.8 94.9 92.1 92.3
District - G5 ELA 93.6 93.2 94.2 93.1 93.2 92.0
District - G4 ELA 90.5 91.1 88.5 86.4 88.1 89.6
District - G3 ELA 90.5 88.8 90.6 87.9 89.4 88.2
50
60
70
80
90
100
Composite Performance Index (CPI) Over Time: ELA

District G3 ELA Achievement Gap
11
CPI Gap CPI Gap CPI Gap CPI Gap CPI Gap CPI Gap
2011 (MCAS)
2012 (MCAS)
2013 (MCAS)
2014 (MCAS)
2015 (PARCC)
2016 (PARCC)
Low Income vs. Non Low Income 18.3 18.6 15.2 20.6
Econ Dis vs. Non Econ Dis 18.5 10.9
Students w/ Disabilities vs. Non Disabled
13.8 15.5 21.1 30.1 29.7 22.5
AfAm/Black vs. White 19.7 13.9 18.5 21 11.6 15.5
High Needs vs. Non High Needs 14.7 17.7 19.1 24.5
0
10
20
30
40
50
District G3 ELA: Difference in Performance of Subgroups and Their Counterparts
(District numbers include out-placement students)

District G4 ELA Achievement Gap
12
CPI Gap CPI Gap CPI Gap CPI Gap CPI Gap CPI Gap
2011 (MCAS)
2012 (MCAS)
2013 (MCAS)
2014 (MCAS)
2015 (PARCC)
2016 (PARCC)
Low Income vs. Non Low Income 17.3 22.3 23.6 21.4
Econ Dis vs. Non Econ Dis 25 17.9
Students w/ Disabilities vs. Non Disabled
18.3 19 22.8 24.9 34.2 33.6
AfAm/Black vs. White 16.8 24.7 20.2 28.6 24.5 21.8
High Needs vs. Non High Needs 18.1 20.1 21.3 22.3
0
10
20
30
40
50
District G4 ELA: Difference in Performance of Subgroups and Their Counterparts
(District numbers include out-placement students)

District G5 ELA Achievement Gap
13
CPI Gap CPI Gap CPI Gap CPI Gap CPI Gap CPI Gap
2011 (MCAS)
2012 (MCAS)
2013 (MCAS)
2014 (MCAS)
2015 (PARCC)
2016 (PARCC)
Low Income vs. Non Low Income 12.3 11.7 9.3 12.5
Econ Dis vs. Non Econ Dis 17 14.3
Students w/ Disabilities vs. Non Disabled
18.1 19.4 16.5 18.7 25.5 23.6
AfAm/Black vs. White 9.8 14.5 8.2 12.1 13 18.4
High Needs vs. Non High Needs 13.8 14.4 10.7 15.6
0
10
20
30
40
50
District G5 ELA: Difference in Performance of Subgroups and Their Counterparts
(District numbers include out-placement students)

G6 ELA Achievement Gap
14
CPI Gap CPI Gap CPI Gap CPI Gap CPI Gap CPI Gap
2011 (MCAS)
2012 (MCAS)
2013 (MCAS)
2014 (MCAS)
2015 (PARCC)
2016 (PARCC)
Low Income vs. Non Low Income 16.9 18.4 10.1 11
Econ Dis vs. Non Econ Dis 10.2 18.9
Students w/ Disabilities vs. Non Disabled
27.6 19.4 22.9 21.4 26.4 33.6
AfAm/Black vs. White 16.7 15.7 10 8.5 8.9 17.8
High Needs vs. Non High Needs 20.6 17 15.6 12.1
0
10
20
30
40
50
Pierce G6 ELA: Difference in Performance of Subgroups and Their Counterparts
G7 ELA Achievement Gap
15
CPI Gap CPI Gap CPI Gap CPI Gap CPI Gap CPI Gap
2011 (MCAS)
2012 (MCAS)
2013 (MCAS)
2014 (MCAS)
2015 (PARCC)
2016 (PARCC)
Low Income vs. Non Low Income 4.1 9.4 12.5 4.6
Econ Dis vs. Non Econ Dis 15.0 9.8
Students w/ Disabilities vs. Non Disabled
18 23.6 24.8 17.5 15.7 22.4
AfAm/Black vs. White 8.6 11.1 11.6 4.6 14.5 11.9
High Needs vs. Non High Needs 10.8 15.8 16.4 10.5
0
10
20
30
40
50
Pierce G7 ELA: Difference in Performance of Subgroups and Their Counterparts

G8 ELA Achievement Gap
16
CPI Gap CPI Gap CPI Gap CPI Gap CPI Gap CPI Gap
2011 (MCAS)
2012 (MCAS)
2013 (MCAS)
2014 (MCAS)
2015 (PARCC)
2016 (PARCC)
Low Income vs. Non Low Income 7.7 5.7 6.1 5.0
Econ Dis vs. Non Econ Dis 4.3 8.1
Students w/ Disabilities vs. Non Disabled
10.4 15.5 18.8 20.4 13.9 12.6
AfAm/Black vs. White 3.4 9.4 6.8 6.0 6.0 5.5
High Needs vs. Non High Needs 8.5 10.2 12.7 10.5
0
10
20
30
40
50
Pierce G8 ELA: Difference in Performance of Subgroups and Their Counterparts

G10 ELA Achievement Gap
17
CPI Gap CPI Gap CPI Gap CPI Gap CPI Gap CPI Gap
2011 2012 2013 2014 2015 2016
Low Income vs. Non Low Income 7.1 0.6 0.9 3.4
Econ Disadv vs. Non Econ Disadv 1.8 4
Students w/ Disabilities vs. Non Disabled
22.2 7.7 3.5 6.3 6.5 5.8
AfAm/Black vs. White 6.9 1.6 0.3 1.9 2 2.5
High Needs vs. Non High Needs 10.3 3.2 1.8 3.5 3.5 3.7
0
10
20
30
40
50
Milton High G10 ELA MCAS: Difference in Performance of Subgroups and Their Counterparts

MATH TEST RESULTS
18
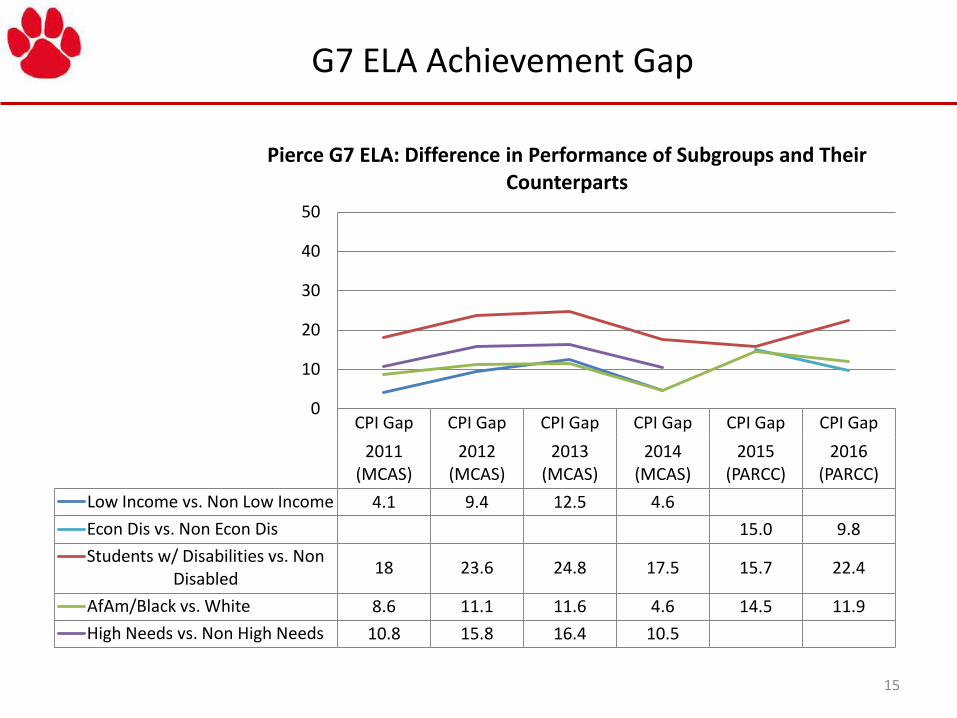
How did MPS perform in Math over time?
19
2011 CPI 2012 CPI 2013 CPI 2014 CPI 2015 CPI 2016 CPI
MHS - G10 Math 95.2 95.3 96.9 97.9 96.1 96.4
Pierce - G8 Math 88.3 87.9 86.5 85.5 91.8 91.1
Pierce - G7 Math 89.7 86.1 85.4 82.9 87.4 84.4
Pierce - G6 Math 88.3 92.2 93.1 91.8 87.9 88.4
District - G5 Math 93.1 92.9 92.9 90.8 93.2 92.9
District - G4 Math 89.8 91.5 88.3 90.4 90.3 91.5
District - G3 Math 92.6 90.0 93.6 93.3 94.6 93.3
50
60
70
80
90
100
Composite Performance Index (CPI) Over Time: Math

District G3 Math Achievement Gap
20
CPI Gap CPI Gap CPI Gap CPI Gap CPI Gap CPI Gap
2011 (MCAS)
2012 (MCAS)
2013 (MCAS)
2014 (MCAS)
2015 (PARCC)
2016 (PARCC)
Low Income vs. Non Low Income 22.1 18.6 16.9 25.9
Econ Disadv vs. Non Econ Disadv 10.1 13.2
Students w/ Disabilities vs. Non Disabled
11.8 15.5 18.9 21.4 20.5 19.0
AfAm/Black vs. White 19.4 13.4 15.3 21.8 9.4 9.4
High Needs vs. Non High Needs 14.4 16.9 16.8 19.6
0
10
20
30
40
50
District G3 Math: Difference in Performance of Subgroups and Their Counterparts
(District numbers include out-placement students)

District G4 Math Achievement Gap
21
CPI Gap CPI Gap CPI Gap CPI Gap CPI Gap CPI Gap
2011 (MCAS)
2012 (MCAS)
2013 (MCAS)
2014 (MCAS)
2015 (PARCC)
2016 (PARCC)
Low Income vs. Non Low Income 17 19.5 21.1 19.6
Econ Disadv vs. Non Econ Disadv 15.3 12.9
Students w/ Disabilities vs. Non Disabled
19.6 15.7 22.6 21.1 23.4 24.1
AfAm/Black vs. White 22.5 19.3 18.6 16.8 16.8 15.9
High Needs vs. Non High Needs 18.2 17.3 20.6 19.2
0
10
20
30
40
50
District G4 Math: Difference in Performance of Subgroups and Their Counterparts
(District numbers include out-placement students)

District G5 Math Achievement Gap
22
CPI Gap CPI Gap CPI Gap CPI Gap CPI Gap CPI Gap
2011 (MCAS)
2012 (MCAS)
2013 (MCAS)
2014 (MCAS)
2015 (PARCC)
2016 (PARCC)
Non Low Income vs. Low Income 16.2 14.8 18.7 18.6
Non Econ Disadv vs. Econ Disadv 17 17.8
Non Disabled vs. Students w/ Disabilities
17.1 20.6 23.5 20.5 25.5 21.7
White vs. AfAm/Black 11.6 19.5 15.8 17.3 13 14.7
Non High Needs vs. High Needs 16 15.7 17.3 19.3
0
10
20
30
40
50
District G5 Math: Difference in Performance of Subgroups and Their Counterparts
(District numbers include out-placement students)

G6 Math Achievement Gap
23
CPI Gap CPI Gap CPI Gap CPI Gap CPI Gap CPI Gap
2011 (MCAS)
2012 (MCAS)
2013 (MCAS)
2014 (MCAS)
2015 (PARCC)
2016 (PARCC)
Non Low Income vs. Low Income 17.9 17.6 15.1 19.7
Non Econ Disadv vs. Econ Disadv 18.7 28.4
Non Disabled vs. Students w/ Disabilities
32.2 22.1 27.1 25 33 32.9
White vs. AfAm/Black 24 14.9 17.1 16.4 27 24.7
Non High Needs vs. High Needs 26 17.5 19.2 17.8
0
10
20
30
40
50
Pierce G6 Math: Difference in Performance of Subgroups and Their Counterparts
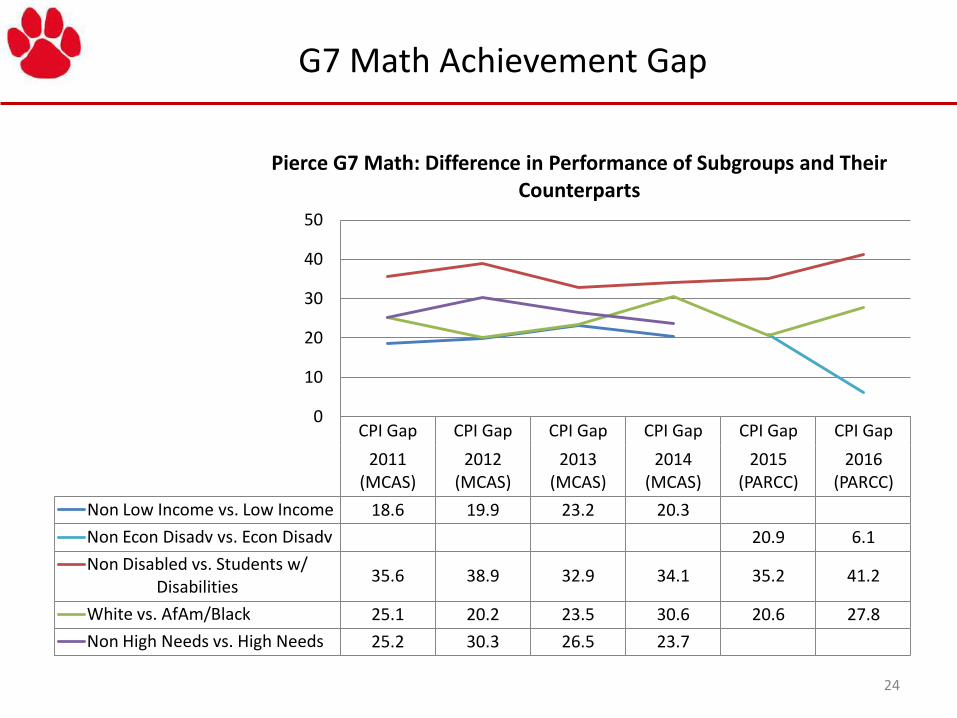
G7 Math Achievement Gap
24
CPI Gap CPI Gap CPI Gap CPI Gap CPI Gap CPI Gap
2011 (MCAS)
2012 (MCAS)
2013 (MCAS)
2014 (MCAS)
2015 (PARCC)
2016 (PARCC)
Non Low Income vs. Low Income 18.6 19.9 23.2 20.3
Non Econ Disadv vs. Econ Disadv 20.9 6.1
Non Disabled vs. Students w/ Disabilities
35.6 38.9 32.9 34.1 35.2 41.2
White vs. AfAm/Black 25.1 20.2 23.5 30.6 20.6 27.8
Non High Needs vs. High Needs 25.2 30.3 26.5 23.7
0
10
20
30
40
50
Pierce G7 Math: Difference in Performance of Subgroups and Their Counterparts

G8 Math Achievement Gap
25
CPI Gap CPI Gap CPI Gap CPI Gap CPI Gap CPI Gap
2011 (MCAS)
2012 (MCAS)
2013 (MCAS)
2014 (MCAS)
2015 (PARCC)
2016 (PARCC)
Low Income vs. Non Low Income 20.9 23.8 17.4 17.7
Econ Dis vs. Non Econ Dis 11.1 17.4
Students w/ Disabilities vs. Non Disabled
28.1 30 35 28.3 28.6 30.2
AfAm/Black vs. White 14.2 25.5 21.7 22.1 18.1 16.6
High Needs vs. Non High Needs 26 26.9 25.3 22.1
0
10
20
30
40
50
Pierce G8 Math: Difference in Performance of Subgroups and Their Counterparts

G10 Math Achievement Gap
26
CPI Gap CPI Gap CPI Gap CPI Gap CPI Gap CPI Gap
2011 2012 2013 2014 2015 2016
Low Income vs. Non Low Income 9.9 4.3 6.9 3.5
Econ Disadv vs. Non Econ Disadv 1.3 9.5
Students w/ Disabilities vs. Non Disabled
23.5 23.6 19.3 5.3 19.6 17.3
AfAm/Black vs. White 9.1 10.5 3.1 5.2 9.9 11.7
High Needs vs. Non High Needs 11.5 11.8 12.5 5 8.9 10.2
0
10
20
30
40
50
Milton High G10 Math MCAS: Difference in Performance of Subgroups and Their Counterparts

SCIENCE TEST RESULTS
27

How did MPS perform in Science over time?
28
2011 CPI 2012 CPI 2013 CPI 2014 CPI 2015 CPI 2016 CPI
MHS - G10 STE 91.2 93.2 94.5 98.4 95.5 96.1
Pierce - G8 STE 76.6 77.9 73.2 76.8 80.4 80.5
Collicot - G5 STE 83.1 85.7 89.5 89.9 91.7 87.9
Cunningham - G5 STE 86.4 90 88 85.4 88.6 85.5
Glover - G5 STE 86.7 88.8 93 91.1 84.1 92.4
Tucker - G5 STE 80.7 78.1 82.5 80.7 83.2 75.4
50
60
70
80
90
100
Composite Performance Index (CPI) Across Available MCAS Results

District G5 Science Achievement Gap
29
CPI Gap CPI Gap CPI Gap CPI Gap CPI Gap CPI Gap
2011 2012 2013 2014 2015 2016
Low Income vs. Non Low Income 19.3 25 16.6 10.1
Econ Disadv vs. Non Econ Disadv 21.9 23.1
Students w/ Disabilities vs. Non Disabled
20.4 22.2 21.2 13.9 27.5 24.5
AfAm/Black vs. White 21.7 23.1 19.8 10.4 21.6 16.6
High Needs vs. Non High Needs 21.4 20.9 18.3 12.2 22.3 26.3
0
10
20
30
40
50
District G5 STE: Difference in Performance of Subgroups and Their Counterparts
(District numbers include out-placement students)
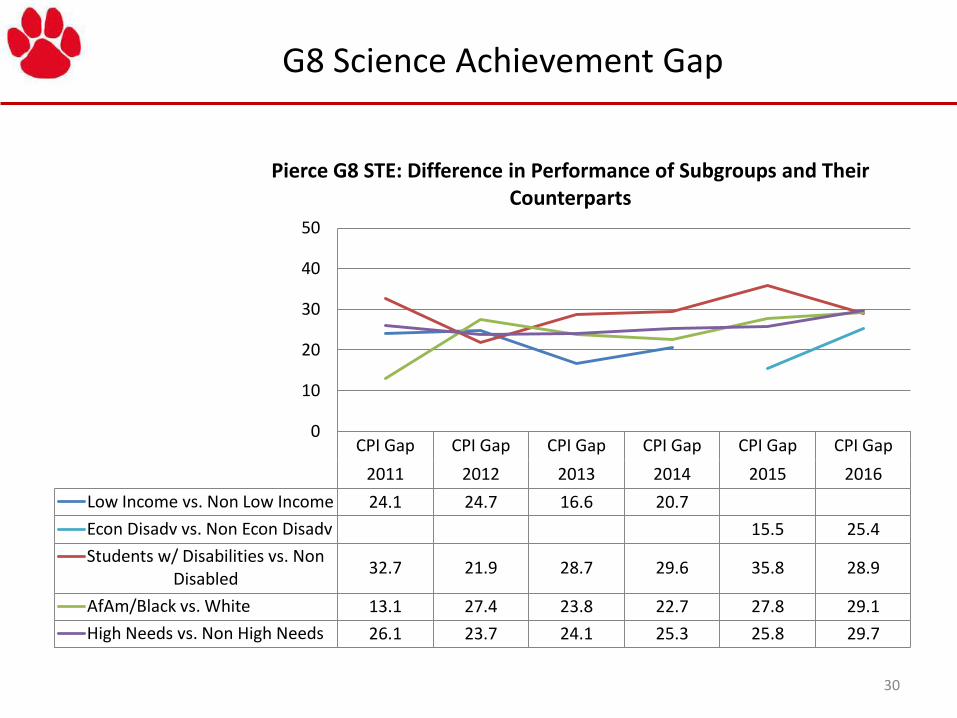
G8 Science Achievement Gap
30
CPI Gap CPI Gap CPI Gap CPI Gap CPI Gap CPI Gap
2011 2012 2013 2014 2015 2016
Low Income vs. Non Low Income 24.1 24.7 16.6 20.7
Econ Disadv vs. Non Econ Disadv 15.5 25.4
Students w/ Disabilities vs. Non Disabled
32.7 21.9 28.7 29.6 35.8 28.9
AfAm/Black vs. White 13.1 27.4 23.8 22.7 27.8 29.1
High Needs vs. Non High Needs 26.1 23.7 24.1 25.3 25.8 29.7
0
10
20
30
40
50
Pierce G8 STE: Difference in Performance of Subgroups and Their Counterparts

G10 Science Achievement Gap
31
CPI Gap CPI Gap CPI Gap CPI Gap CPI Gap CPI Gap
2011 2012 2013 2014 2015 2016
Low Income vs. Non Low Income 10.6 4.7 12.5 3.4
Econ Disadv vs. Non Econ Disadv 1.3 10
Students w/ Disabilities vs. Non Disabled
27.5 15.7 23 2.4 16.7 13.1
AfAm/Black vs. White 12.6 8.1 6.1 2.2 10.9 9
High Needs vs. Non High Needs 14.1 7.3 18 3.7 11.1 9.2
0
10
20
30
40
50
Milton High G10 STE: Difference in Performance of Subgroups and Their Counterparts

2016 District CPI Comparisons
PARCC scores highlighted in blue; otherwise MCAS
Mil-ton
Brain-tree
Brook-line
Can-ton
Hing-ham
Need-ham
New-ton
Sha-ron
Wal-pole
Well-esley
West-wood
G3 – 8 ELA 91.7 95.0 - 92.5 - - 94.5 95.1 92.7 - 96.0
G3 – 8 Math 90.3 90.7 - 88.2 - - 91.6 94.4 88.7 - 91.7
G5 Science 86.1 89.6 86.4 82.1 94.7 88.3 86.4 93.1 92.9 89.9 92.0
G8 Science 79.5 85.4 83.6 82.4 84.7 86.9 81.7 84.2 79.6 88.3 78.0
G10 Science 95.7 95.3 95.9 95.9 98.7 96.9 97.6 98.6 99.3 96.6 97.5
G10 ELA 98.8 99.0 98.4 99.4 99.6 99.6 99.3 99.1 93.1 98.8 99.1
G10 Math 96.1 98.1 96.7 94.9 98.0 97.1 98.0 98.4 96.8 97.2 98.3
Demographic Profile
# Students 4,100 5,700 7,600 3,300 4,300 5,600 12,700 3,500 3,900 5,000 3,200
% White 70% 76% 56% 71% 92% 80% 65% 62% 83% 73% 83%
% High Needs*
23% 36% 32% 24% 17% 20% 32% 22% 24% 22% 23%
Metco? No Yes Yes No Yes Yes Yes Yes Yes Yes No
32 * High Needs includes the following subgroups: economically disadvantaged, students with disabilities, and English Language Learners. Highlighted columns indicate communities that are demographically similar to Milton.

% Proficient/Meeting Expectations or Above Over Time
33
MCAS (Proficient + Advanced) PARCC (Level 4+5) 2012 2013 2014 2015 2016
State District
% Points District Leading State State District
% Points District Leading State State District
% Points District Leading State State District
% Points District Leading State
State (only avail for MCAS, not PARCC) District
Trans. Median SGP**
Change in District % 2015 to 2016
ELA03 61% 71% 10 57% 71% 14 58% 69% 11 54% 68% 14 62% - -6 ELA04 57% 78% 21 53% 71% 18 54% 65% 11 57% 74% 17 78% 63.0 +4 ELA05 61% 82% 21 65% 87% 22 64% 82% 18 63% 75% 12 77% 51.0 +2 ELA06 66% 81% 15 67% 85% 18 68% 85% 17 60% 70% 10 73% 41.0 +3 ELA07 71% 85% 14 71% 84% 13 72% 91% 19 61% 66% 5 68% 35.0 +2 ELA08 81% 91% 10 78% 86% 8 79% 88% 9 64% 74% 10 75% 47.0 +1 ELA10* 88% 95% 7 91% 97% 6 90% 95% 5 91% 97% 6 92% 95% 46.0 -2
MAT03 61% 76% 15 67% 84% 17 69% 83% 14 55% 74% 19 71% - -3 MAT04 51% 74% 23 52% 67% 15 52% 72% 20 48% 72% 24 77% 55.0 +5 MAT05 57% 82% 25 61% 82% 21 60% 79% 19 55% 75% 20 73% 49.5 -2 MAT06 60% 82% 22 60% 83% 23 60% 79% 19 53% 65% 12 65% 28.0 0 MAT07 51% 68% 17 52% 67% 15 50% 65% 15 45% 68% 23 59% 54.0 -9 MAT08 52% 73% 21 54% 71% 17 52% 68% 16 53% 76% 23 74% 53.5 -2 MAT10* 78% 87% 9 80% 91% 11 79% 90% 11 79% 90% 11 78% 88% 52.5 -2
STE05* 52% 64% 14 51% 70% 19 53% 63% 10 51% 67% 16 47% 63% - -4 STE08* 43% 48% 5 39% 41% 2 42% 48% 5 42% 53% 10 41% 55% - +2 STE10* 69% 82% 13 71% 84% 13 71% 93% 22 72% 86% 14 73% 87% - +1 * MCAS all years ** Expected Student Growth Percentile is between 40 and 60.

% Meeting Expectations or Above, Elementary
34
PARCC (Level 4+5) 2015 2016 Change in
School % 2015 to
2016 ELA % Level 4+5
Trans. Median SGP
% Level 4+5
Trans. Median SGP
CO ELA03 77% - 62% - -15
CU ELA03 61% - 52% - -9
GL ELA03 73% - 77% - +4
TU ELA03 59% - 56% - -3
CO ELA04 77% 65.0 91% 64.0 +14
CU ELA04 75% 58.0 82% 67.0 +7
GL ELA04 83% 65.0 79% 68.0 -4
TU ELA04 57% 56.0 59% 46.0 +2
CO ELA05 80% 47.0 80% 56.0 0
CU ELA05 76% 61.0 75% 47.0 -1
GL ELA05 75% 51.0 89% 51.0 +14
TU ELA05 71% 79.0 58% 55.0 -13
PARCC (Level 4+5) 2015 2016 Change in
School % 2015 to
2016 MATH % Level 4+5
Trans. Median SGP
% Level 4+5
Trans. Median SGP
CO MAT03 81% - 69% - -12
CU MAT03 66% - 61% - -5
GL MAT03 78% - 87% - +9
TU MAT03 68% - 65% - -3
CO MAT04 81% 69.0 80% 55.0 -1
CU MAT04 71% 50.0 85% 74.0 +14
GL MAT04 67% 45.0 78% 53.0 +11
TU MAT04 66% 69.0 66% 40.0 0
CO MAT05 76% 54.0 73% 44.0 -3
CU MAT05 78% 50.0 76% 55.0 -2
GL MAT05 77% 59.0 77% 57.0 0
TU MAT05 70% 55.0 64% 46.0 -6
SCIENCE 2015 2016 Change in School % 2015 to 2016
MCAS (Proficient + Advanced)
CO STE05 77% 63% -14
CU STE05 68% 63% -5
GL STE05 61% 77% +16
TU STE05 67% 46% -21

G3 ELA % Meeting Expectations or Above, Subgroups
35
48
%
33
%
40
%
45
%
44
%
78
%
76
%
74
%
72
%
64
%
38
%
37
%
38
%
42
%
33
%
76
%
76
%
73
%
71
%
65
%
37
%
24
%
23
%
24
% 34
%
25
%
30
%
60
% 7
1%
7
1%
6
9%
6
9%
6
2%
0%
10%
20%
30%
40%
50%
60%
70%
80%
90%
100%
20
12
(n
=48
) 2
01
3 (
n=3
3)
20
14
(n
=42
) 2
01
5 (
n=3
6)
20
16
(n
=46
)
20
12
(n=2
38
) 2
01
3 (n
=27
6)
20
14
(n=2
53
) 2
01
5 (n
=23
8)
20
16
(n=2
61
)
20
12
(n
=42
) 2
01
3 (
n=4
3)
20
14
(n
=37
) 2
01
5 (
n=3
1)
20
16
(n
=31
)
20
12
(n=2
89
) 2
01
3 (n
=30
5)
20
14
(n=2
91
) 2
01
5 (n
=29
1)
20
16
(n=3
12
)
20
12
(n
=62
) 2
01
3 (
n=4
6)
20
14
(n
=60
) 2
01
5 (
n=4
5)
20
16
(n
=63
)
20
12
(n=1
2)
20
13
(n
=10
) 2
01
4 (
n=7
) 2
01
5 (
n=6
) 2
01
6 (
n=1
2)
20
12
(n=3
31
) 2
01
3 (n
=34
8)
20
14
(n=3
28
) 2
01
5 (n
=32
2)
20
16
(n=3
43
)
Afr. Amer./Black
. White . Low income (Economically Disadvantaged in 2015, 2016)
. Non-Low Income
(Non Econ Dis in 2015, 2016)
. Students w/disabilities
. ELL and Former ELL (no results shown for
subgroups less than 10)
. All Students
Milton District: Percent of Students in Advanced/Proficient in Grade 3 ELA MCAS/PARCC

Conclusion
• Strengths – MPS consistently outperforms the state in all tested subject
areas.
– The high school has maintained a very high level of performance, achieving a Composite Performance Index (CPI) of close to or above 95 for all its tested subjects (G10 STE, G10 ELA, and G10 Math) for the past five years.
– There are pockets where achievement gaps are decreasing (students with disabilities gap in Science, economically disadvantaged gap in elementary ELA).
• Challenges – Though there is no clear pattern in the performance of
subgroups at large, it is clear there are still achievement gaps.
– G3 ELA proficiency in the district has declined.
36
District - Next Steps
• Our district has taken up a more robust, data-driven approach to curriculum work at every level. – First year all teachers at the elementary and middle schools are
provided with internal/state assessments results for every child – Culture shift around using data to identify learning needs and
strategies to address those needs
• Every year, we refine our common assessments to ensure alignment with new standards and state expectations. – Piloting new writing assessments in elementary schools – Providing PD on newly adopted Science standards
• Having common planning time at all levels to allow for more focus on curriculum work. – First year elementary schools have common planning time with
curriculum coordinators/principals – Critical investment!
37