Embed Size (px)
Citation preview

Spreadsheet Applications for Materials ScienceMike Meier April 23, 2003
1
Figure 1 Microstructure of C26000 alloy after annealing: a) 1 hour at 450°C, b) 1 hour at 550°C, c) 2 hours at 750°C.
Spreadsheet Applications for Materials ScienceGrain Growth Kinetics of the C26000 AlloyIntroductionThe C26000 alloy is also known as C260 (or simply 260), alpha brass, 70/30, and cartridge brass.It has many uses in architectural, electrical, hardware, munitions and plumbing industries. C26000has a nominal composition of 70 w% copper and 30 w% zinc. It is a single phase alloy (", bcc) upto its solidus at 915°C.
Because C26000 is a single phase alloy it is not considered heat treatable, but it can be strengthenedby cold working and softened by annealing. The high work hardening rate of this alloy means coldworking can increase the yield strength dramatically, from 75 MPa in the fully annealed conditionto over 450 MPa in the full-hard condition. Along with this increase in strength comes a decreasein ductility, from 68% down to 5%. Recovery annealing will restore a small amount of ductilitywith little change in strength and hardness. Annealing that results in recrystallization can extendthe ductility considerably and can more than halve the hardness and strength. Further annealing willlead to grain growth which can produce further decreases in strength and increases in ductility, butcan also lead to a lower fracture toughness and, if grain size is too large, to an undesirable orangepeal surface following subsequent forming.
C26000, a single-phase alloy, offers an opportunity to study the grain growth behavior of a relativelysimple material that is also widely used in industry. Modeling using spreadsheets and the analysisof data from experiments will be used to see if ideal grain growth behavior is observed in this alloy.
Grain Growth KineticsEssentially, grain growth involves atoms from one grain crossing the boundary to join the adjacentgrain. As a result the first grain becomes smaller and the second grain larger. There may be anumber of factors driving this process, including the reduction in grain boundary surface area, strain,
2
(1)
(2)
(3)
(4)
curvature of the boundaries, magnetic fields, and chemical potential gradients. Boundary migrationcan be slow and steady but it has also been known to be very sudden, where one boundary canquickly sweep across a neighboring grain. Over the years many studies of recrystallization and graingrowth have been made. From these studies a number of rules about grain growth have beenformulated. These rules, as listed by Burke and Turnbull [1] are:
C Grain growth occurs by grain boundary migration and not by the coalescence of neighboringgrains as do water droplets.
C Grain boundary migration is discontinuous or jerky and its direction may suddenly change.
C One grain may grow into a neighboring grain on one side while it is being consumed fromanother side.
C The rate of consumption of a grain frequently becomes more rapid as the grain is about todisappear.
C A curved grain boundary usually migrates towards its center of curvature.
C When grain boundaries in a single phase meet at angles other than 120 degrees, the grainincluded by the more acute angle will be consumed so that the angles approach 120 degrees.
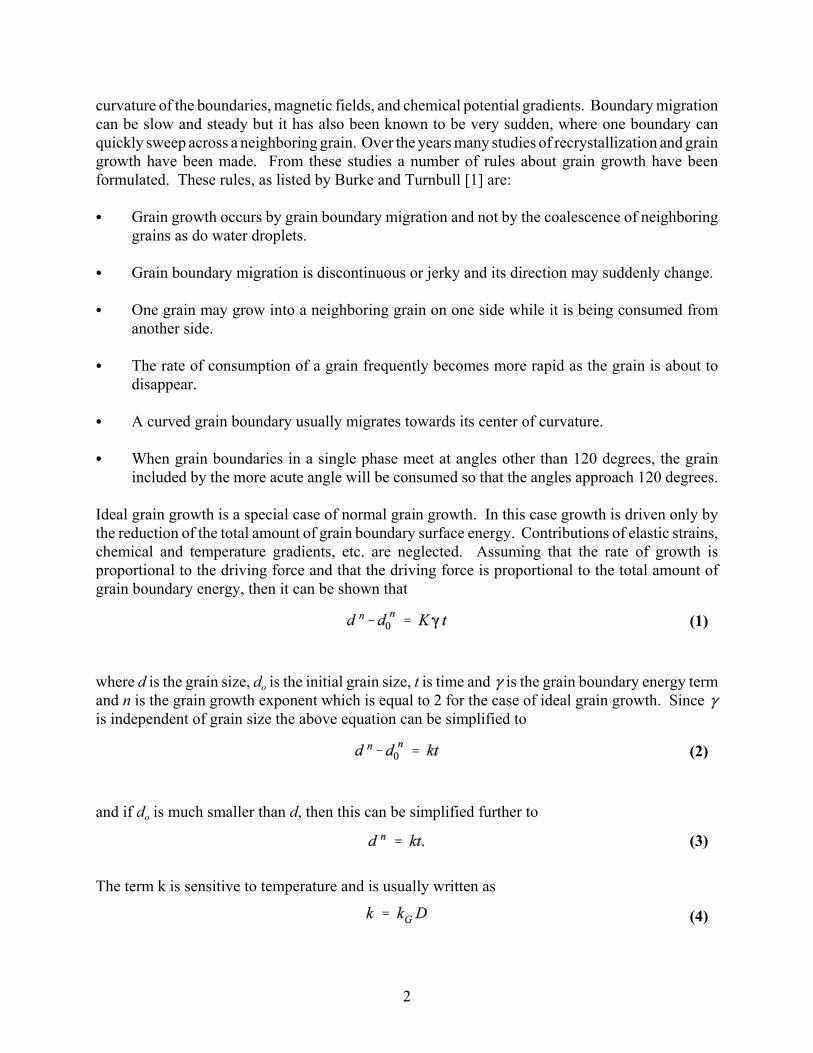
Ideal grain growth is a special case of normal grain growth. In this case growth is driven only bythe reduction of the total amount of grain boundary surface energy. Contributions of elastic strains,chemical and temperature gradients, etc. are neglected. Assuming that the rate of growth isproportional to the driving force and that the driving force is proportional to the total amount ofgrain boundary energy, then it can be shown that
where d is the grain size, do is the initial grain size, t is time and ( is the grain boundary energy termand n is the grain growth exponent which is equal to 2 for the case of ideal grain growth. Since (is independent of grain size the above equation can be simplified to
and if do is much smaller than d, then this can be simplified further to
The term k is sensitive to temperature and is usually written as
3
where D is the diffusivity. In ideal grain growth the activation energy Q for grain boundary mobilityis equal to that for diffusion. Values which vary from 0.3 to 2.5 times that for diffusion, however,have been reported. Also, the ideal t½ dependence is not always observed. Normally, lower valuesare observed. Minor amounts of impurities can decrease the rate of boundary migration significantlyand increase the activation energy somewhat. Also, contributions to the total driving force can comefrom several other sources; surface energy, elastic energy, stored energy of deformation, magneticfields, and temperature and composition gradients. Nevertheless, ideal grain growth has beenobserved in ultra-pure metals at temperatures near the melting point.
Spreadsheet ExercisesThe following exercises will take you from some preliminary issues related to grain growth throughthe analysis of actual data from experiments performed on the C26000 alloy. They start with a lookat the diffusivity of Cu, Zn and Cu-Zn alloys, followed by modeling the ideal grain growth for thisalloy. The results from the modeling are then analyzed as if they were experimental results,providing an opportunity to develop and test your analysis procedure. Finally, grain growth datafrom actual annealing treatments are analyzed.
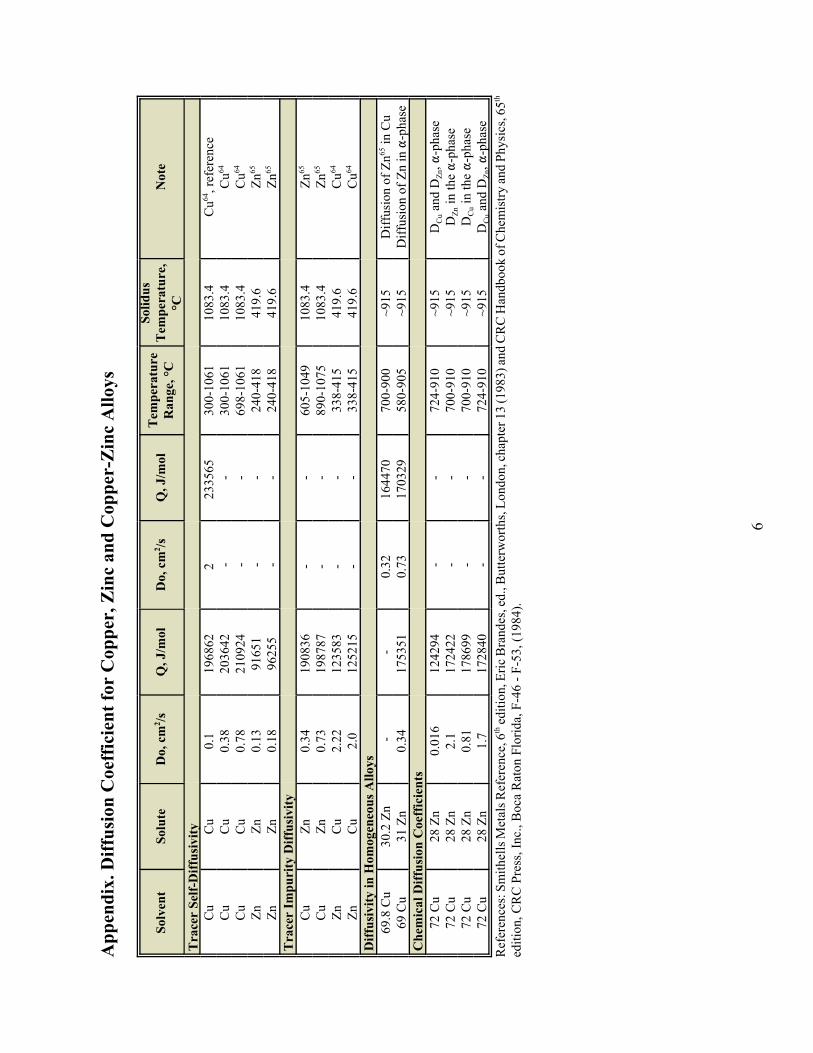
1. Diffusivity in the Cu-Zn systemIn this exercise you will look at the diffusivities that are relevant to the study of grain growth of theC26000 alloy. The appendix lists the diffusivities from a number of studies of Cu, Zn and Cu-Znalloys. Use this information to do the following:
C Calculate the diffusion rate at 500°C and the diffusion rate relative to the first entry in theappendix. Plot the log of the diffusivity for each solute/solvent combination using a bar chart.Experiment with different temperatures to see how the results change.
C Calculate the diffusivities for temperatures from 400°C (slightly above the typicalrecrystallization temperature) to 800°C (below the solidus). Plot the log of the diffusivity asa function of the versus inverse temperature.
Note the typical and range of values you get in the first set of calculations. From these results whatcan you say about the diffusivity of copper, zinc and copper/zinc alloys?
Review the plot generated in the second set of calculations. Do the slopes, which are proportionalto the activation energies, vary significantly? Which solute/solvent pairs do you find near the topof the plot, near the bottom, and in the middle?
Write a brief 1-2 page summary of what you learned about the diffusivity of copper, zinc andcopper/zinc alloys and the relevance to this study of the grain growth of the C26000 alloy.Copy/paste your plots into this report. Include a printout of your spreadsheet, scaled to fit on oneor two pages.
2. Modeling ideal grain growth of the C26000 alloyIn this exercise you will use the above equations to build a simple computer model for the ideal
4
grain growth of the C26000 alloy and to analyze the data as if it had come from an actualexperiment. Use this model to do the following:
C Calculate the grain size for heat treatments conducted at 400, 500, 600, 700 and 800°C and fortimes ranging from 0 to 12 hours in steps of 0.5 hours. Adjust the value of kG so that grainsizes up to a centimeter (quite large) can be obtained for the 12 hour, 800°C heat treatment.Also, experiment with the value of n and with the diffusivity.
C Plot the results in a standard xy plot that uses linear scaling for both the x and y axes.
C Plot the log of the grain size versus the log of the annealing time for all temperatures.Determine the value of n and the intercept from this plot.
C Plot the log of the grain size versus the inverse temperature for annealing times of 1, 2, 5 and10 hours. Determine the value of Q and the intercept from this plot.
C Optionally, plot log(dn/t) versus the inverse temperature for all annealing times. Again,determine the value of Q and the intercept from this plot.
C Compare the values of n, Q and the intercepts obtained from your analysis to those used in theequation for ideal grain growth.
Write a brief 1-2 page summary of what you learned about ideal grain growth of the C26000 alloyand on your ability to analyze the data as if it came from an actual experiment. Copy/paste yourplots into this report. Include a printout of your spreadsheet, scaled to fit on one or two pages.
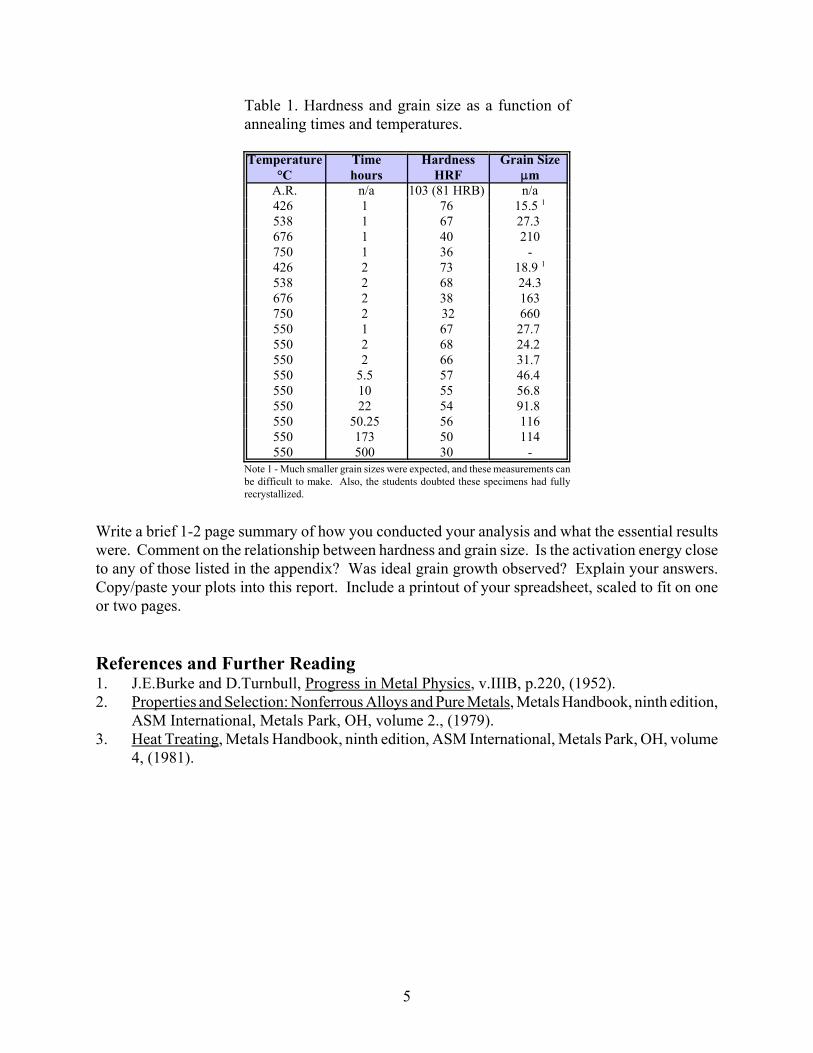
3. Analysis of the grain growth kinetics of the C26000 alloyIn this exercise you will analyze the results of an experiment performed by students in 1989. Thealloy studied was supplied in the half-hard condition. Samples measuring ½" square were cut fromc" thick plate and annealed in air at the temperatures and times listed in table 1. (All annealingtemperatures were above the recrystallization temperature.) They were then mounted, polished andetched using standard metallographic specimen preparation procedures. The microstructures wereanalyzed with the aid of optical microscopes and the grain sizes were measured using the mean-lineal intercept method. The grain sizes reported in table 1 are the equivalent grain diameters.
C Plot hardness as a function of grain size. Given the decrease in hardness from the as-receivedsample to the annealed samples, do you think the sample had recrystallized fully?
C Analyze the data in table 1 in terms of ideal grain growth. Create plots for each step in theanalysis. Determine the values of n, Q, and kGD0.
C Using the values of n, Q, and kGD0 determined in this work, calculate the grain size andcompare these to measured values by plotting measured -vs- calculated grain sizes.
5
Table 1. Hardness and grain size as a function ofannealing times and temperatures.
Temperature°C
Timehours
HardnessHRF
Grain Size:m
A.R. n/a 103 (81 HRB) n/a426 1 76 15.5 1
538 1 67 27.3 676 1 40 210750 1 36 -426 2 73 18.9 1
538 2 68 24.3676 2 38 163750 2 32 660550 1 67 27.7 550 2 68 24.2 550 2 66 31.7 550 5.5 57 46.4 550 10 55 56.8 550 22 54 91.8 550 50.25 56 116550 173 50 114550 500 30 -
Note 1 - Much smaller grain sizes were expected, and these measurements canbe difficult to make. Also, the students doubted these specimens had fullyrecrystallized.
Write a brief 1-2 page summary of how you conducted your analysis and what the essential resultswere. Comment on the relationship between hardness and grain size. Is the activation energy closeto any of those listed in the appendix? Was ideal grain growth observed? Explain your answers.Copy/paste your plots into this report. Include a printout of your spreadsheet, scaled to fit on oneor two pages.
References and Further Reading1. J.E.Burke and D.Turnbull, Progress in Metal Physics, v.IIIB, p.220, (1952).2. Properties and Selection: Nonferrous Alloys and Pure Metals, Metals Handbook, ninth edition,
ASM International, Metals Park, OH, volume 2., (1979).3. Heat Treating, Metals Handbook, ninth edition, ASM International, Metals Park, OH, volume
4, (1981).
6
App
endi
x. D
iffus
ion
Coe
ffic
ient
for
Cop
per,
Zin
c an
d C
oppe
r-Z
inc
Allo
ys
Solv
ent
Solu
teD
o, c
m2 /s
Q, J
/mol
Do,
cm
2 /sQ
, J/m
olT
empe
ratu
reR
ange
, °C
Solid
usT
empe
ratu
re,
°CN
ote
Tra
cer
Self-
Diff
usiv
ityC
uC
u0.
1 19
6862
2
2335
65
300-
1061
1083
.4C
u64, r
efer
ence
Cu
Cu
0.38
20
3642
-
-30
0-10
6110
83.4
Cu64
Cu
Cu
0.78
21
0924
-
-69
8-10
6110
83.4
Cu64
ZnZn
0.13
91
651
--
240-
418
419.
6Zn
65
ZnZn
0.18
96
255
--
240-
418
419.
6Zn
65
Tra
cer
Impu
rity
Diff
usiv
ityC
uZn
0.34
19
0836
-
-60
5-10
4910
83.4
Zn65
Cu
Zn0.
73
1987
87
- -
890-
1075
1083
.4Zn
65
ZnC
u2.
22
1235
83
- -
338-
415
419.
6C
u64
ZnC
u2.
0 12
5215
-
-33
8-41
541
9.6
Cu64
Diff
usiv
ity in
Hom
ogen
eous
Allo
ys69
.8 C
u30
.2 Z
n-
-0.
32
1644
70
700-
900
~915
Diff
usio
n of
Zn65
in C
u69
Cu
31 Z
n0.
34
1753
51
0.73
17
0329
58
0-90
5~9
15D
iffus
ion
of Z
n in
"-p
hase
Che
mic
al D
iffus
ion
Coe
ffic
ient
s72
Cu
28 Z
n0.
016
1242
94
--
724-
910
~915
DC
u and
DZn
, "-p
hase
72 C
u28
Zn
2.1
1724
22
--
700-
910
~915
DZn
in th
e "-
phas
e72
Cu
28 Z
n0.
81
1786
99
--
700-
910
~915
DC
u in
the "-
phas
e72
Cu
28 Z
n1.
7 17
2840
-
-72
4-91
0~9
15D
Cu a
nd D
Zn, "
-pha
seR
efer
ence
s: S
mith
ells
Met
als R
efer
ence
, 6th ed
ition
, Eric
Bra
ndes
, ed.
, But
terw
orth
s, Lo
ndon
, cha
pter
13
(198
3) an
d C
RC
Han
dboo
k of
Che
mis
try an
d Ph
ysic
s, 65
th
editi
on, C
RC
Pre
ss, I
nc.,
Boc
a R
aton
Flo
rida,
F-4
6 - F
-53,
(198
4).