Embed Size (px)
Citation preview
1
Spread of Viruses on a Computer Network
New Mexico Supercomputing Challenge
Final Report
March 31, 2015
Team Number: 63
Los Alamos Middle School
Team: Christie Djidjev
Teacher:
Project Mentors: Hristo Djidjev
Stephanie Djidjev
2
Table of Contents 1.0 Executive Summary 3
2.0 Problem Statement 4
3.0 Background Information 4
4.0 Methodology 5
4.1 Hypothesis 5
4.2 Modeling the virus infection 6
4.3 Test networks 7
5.0 Results 11
6.0 Conclusions 17
7.0 Significant Original Achievement 18
8.0 Future Work 18
9 Works Cited 19
10.0 Appendix 21
9.1 Acknowledgements 21
9.3 Program Code 22
3
1.0: Executive Summary
Computer viruses are a major issue to government, business, and individual
people today. We have been trying to better understand how viruses infect computer
networks by simulating the spread of viruses in networks of different structure. We want
to determine how the structure of the network affects the time in which the virus
infection dies out. Specifically, we measure how the diameter and the spectral radius of
the network impacts the speed of infection spread and disappearance. We used
NetLogo for our simulations and one of models in its library as a basis for our codes. In
that model, computers and connections are represented by nodes and links. There are
3 types of nodes: infected, susceptible, and resistant, where the type of node can
change during the simulation based on the types of its neighbors and random variables.
We encoded four network types for our experiments: star, complete, random and power
law networks. For each network type, we ran the simulation for five sizes: 200, 400,
600, 800, and 1000 nodes. For each network type and size we ran 10 simulations and
recorded the time and the number of ticks. We then computed the average for each
network type and size and analyzed the results. We observed that when a network has
a larger diameter, it does not take longer for the virus to disappear. However, when the
spectral radius is larger, the speed in which the virus gets eliminated does increase.
Hence, the spectral radius can be used to determine which network structures are more
resistant to virus spread.
4
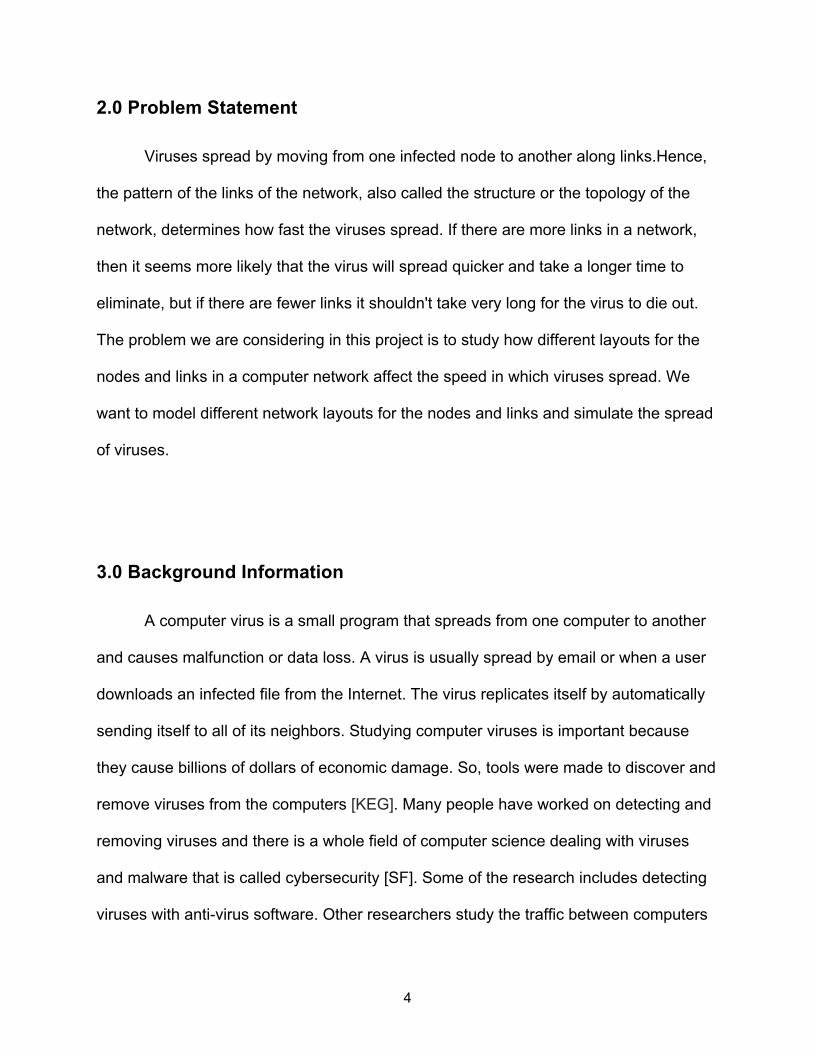
2.0 Problem Statement
Viruses spread by moving from one infected node to another along links.Hence,
the pattern of the links of the network, also called the structure or the topology of the
network, determines how fast the viruses spread. If there are more links in a network,
then it seems more likely that the virus will spread quicker and take a longer time to
eliminate, but if there are fewer links it shouldn't take very long for the virus to die out.
The problem we are considering in this project is to study how different layouts for the
nodes and links in a computer network affect the speed in which viruses spread. We
want to model different network layouts for the nodes and links and simulate the spread
of viruses.
3.0 Background Information
A computer virus is a small program that spreads from one computer to another
and causes malfunction or data loss. A virus is usually spread by email or when a user
downloads an infected file from the Internet. The virus replicates itself by automatically
sending itself to all of its neighbors. Studying computer viruses is important because
they cause billions of dollars of economic damage. So, tools were made to discover and
remove viruses from the computers [KEG]. Many people have worked on detecting and
removing viruses and there is a whole field of computer science dealing with viruses
and malware that is called cybersecurity [SF]. Some of the research includes detecting
viruses with anti-virus software. Other researchers study the traffic between computers
5
on a network to discover anomalies that may indicate virus activity. We are going to
study viruses by using computer simulation.
4.0 Methodology
We used NetLogo as a language to use for simulating the spread of viruses in a
network. We chose NetLogo because it is a convenient language for doing computer
simulations and it has a library of models that we can use while developing our codes.
We based our simulation code on one such existing model called Viruses on a Network
in the NetLogo library, which we updated with additional functionality. We modified the
model by allowing different network types as input. While the original code worked with
random geometric networks only, we modified it so that it can generate, display, and
simulate with different network types. With each network structure, we simulated the
spread of viruses in networks of different sizes and recorded the number of ticks and
the time it took for the virus to be extinguished. (Tick is a term used in NetLogo to
describe the current number of time-steps of the simulation.) We analyzed the data in
order to discover some relationship between the network structure and the number of
ticks until the virus is eliminated.
4.1 Our hypothesis
In this project, we want to find out how fast the virus is eliminated depending on
the graph’s structure. We conjecture that it depends on the diameter of the network
and/or the size of its spectral radius, namely, that greater the diameter/spectral radius,
the longer it will take for the virus to be extinguished. The diameter of the network is the
maximum distance between two nodes. It is relevant to know the diameter because the
6
larger it is, the longer it takes for the virus to spread. The spectral radius of a graph is
the spectral radius of its adjacency matrix. The spectral radius of a matrix is the largest
eigenvalue by the absolute value. As with the diameter, we think that the larger the
spectral radius, the longer it will take for the virus to be eliminated, because the longer it
will take for information to go from one side of the network to the other. Moreover, in
[GMT], a condition for the speed of virus die-out was found that relates the spectral
radius and infection rate with whether the duration of the virus infection is “short” or
“long.” In that paper [GMT], “short” means logarithmic and “long” means exponential.
Hence, their result cannot be used to predict which of two network types is more
resistant to a virus spread, but suggests that the spectral radius might be a relevant
characteristic. We are going to check to see if that is true or not.
4.2 Modeling the virus infection
To find out how the layout of the nodes and links affect the speed that the viruses
spread, we coded different models. We used Virus in A Network model from the
NetLogo library, which simulates the spread of viruses through a network. Each node
represents a computer, and we are modeling the progress of a computer virus through
this network. The links in the networks represent the connection between computers
and their neighbors. Each node may be one of these three states: susceptible, infected,
or resistant. Infected nodes are the ones that currently have the virus. They try to send it
to all their neighbors who are susceptible. Infected nodes have a recovery chance and
can either become susceptible again or resistant. A node can become resistant by a
resistance probability that is set in the model. The susceptible nodes are the nodes that
7
are vulnerable to the virus. When a neighbor of a susceptible node is infected, it can get
infected too depending on the virus spread probability, which is a parameter specified in
the model. When an infected node becomes resistant, it stays resistant, and it is not
possible for the virus to spread through its links.
4.3 Test networks
We will be using four different network types in our project; star network,
complete network, random network, and power law network.
4.3.1 Star Network
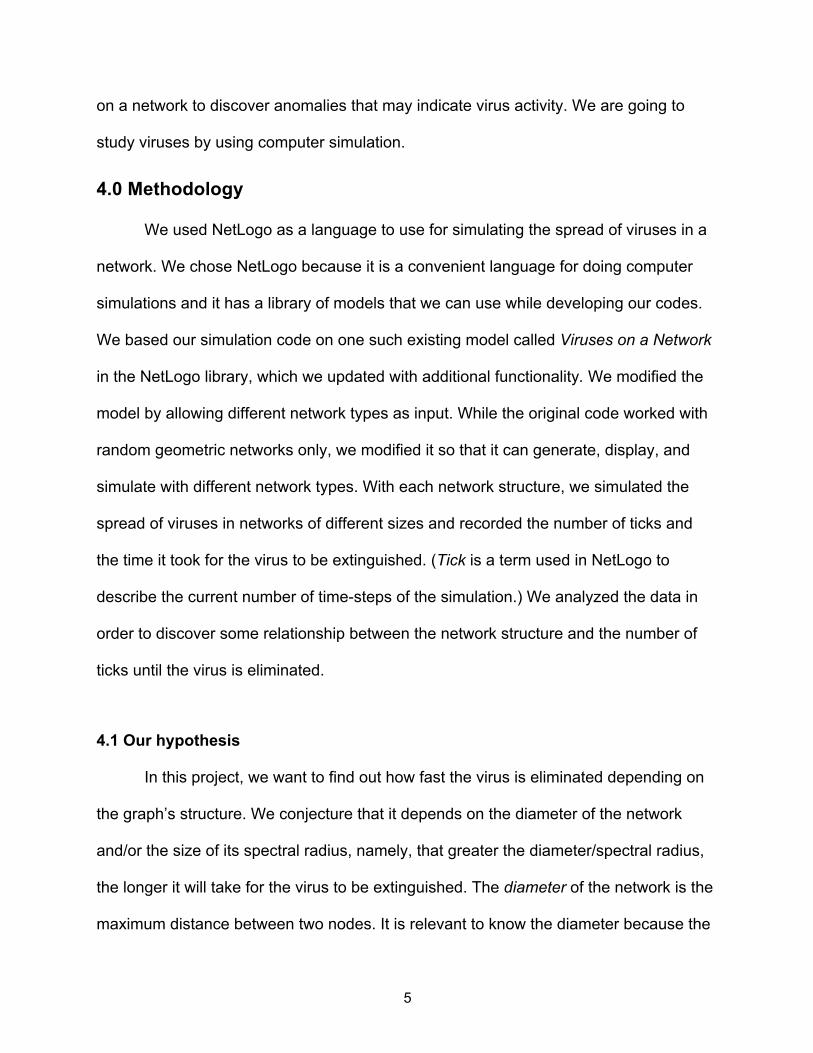
The first model we will use is the star network, which is a network that has one
node connected to every other node and there are no direct connections between the
other nodes. The node that is connected to all other nodes is called the central node.
We are interested in studying this network because it is one of the simplest kinds of
connected networks. It is simple because all the nodes except for the central node have
one neighbor. Star networks can help when analyzing more complex networks. For
instance, it is easier to understand the power law network because it is made up of
several star networks. Each one of these star networks consists of node a degree more
than one and all of its neighbors. Understanding the properties of each star network in
the power law network helps us understand it as a whole [GMT].
8
Figure 1. A star network.
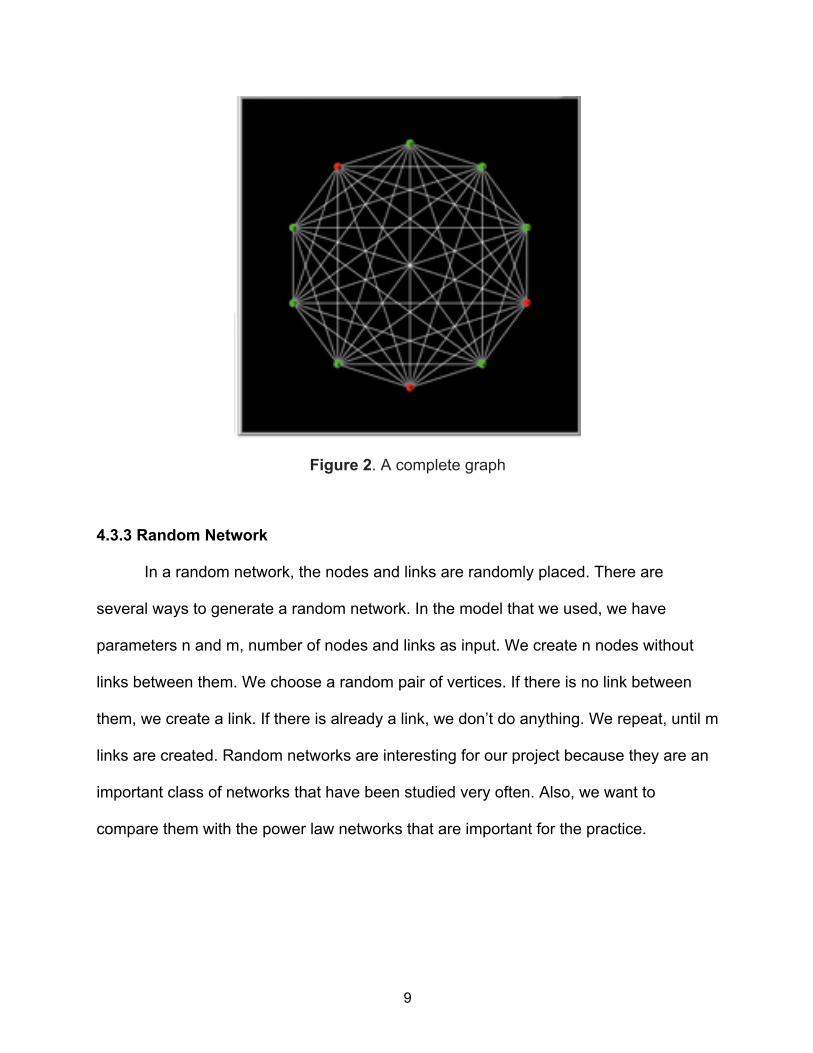
4.3.2 Complete Network
In the complete network each node is linked with every other node. Complete networks
are important because they are used in practice, For instance, large Border Gateway
Protocol (BGP) servers form a complete network [GMT]. BGP is a standard protocol for
exchanging information [EGC]. Also, complete networks are interesting to study
because they have the maximum possible number of links.
9
Figure 2. A complete graph
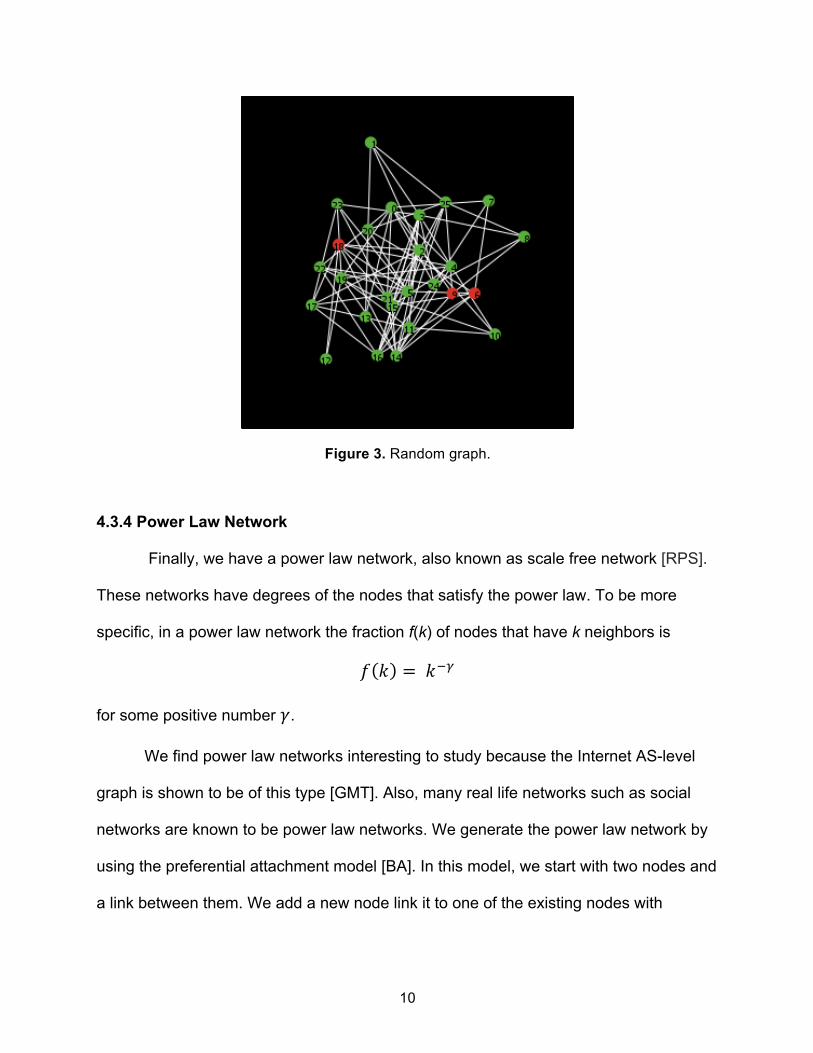
4.3.3 Random Network
In a random network, the nodes and links are randomly placed. There are
several ways to generate a random network. In the model that we used, we have
parameters n and m, number of nodes and links as input. We create n nodes without
links between them. We choose a random pair of vertices. If there is no link between
them, we create a link. If there is already a link, we don’t do anything. We repeat, until m
links are created. Random networks are interesting for our project because they are an
important class of networks that have been studied very often. Also, we want to
compare them with the power law networks that are important for the practice.
10
Figure 3. Random graph.
4.3.4 Power Law Network
Finally, we have a power law network, also known as scale free network [RPS].
These networks have degrees of the nodes that satisfy the power law. To be more
specific, in a power law network the fraction f(k) of nodes that have k neighbors is
𝑓 𝑘 = 𝑘!!
for some positive number 𝛾.
We find power law networks interesting to study because the Internet AS-level
graph is shown to be of this type [GMT]. Also, many real life networks such as social
networks are known to be power law networks. We generate the power law network by
using the preferential attachment model [BA]. In this model, we start with two nodes and
a link between them. We add a new node link it to one of the existing nodes with

11
probabilities proportional to their degrees. We continue until the required number of
nodes are created.
Figure 4. Power law graph.
5.0 Results
We performed several experiments in order to measure the time and the number
of ticks for each network type and size. For each network type we generated and did
simulations with network of size 200, 400, 600, 800, and 1,000 nodes since there is
randomness in how the virus will spread in a given network (because of the probabilities
used to determine if a node will get infected and when and whether it will become
resistant) and since some networks are random (the random and power law networks),
the simulation times may be quite different even for networks of the same size and type.
For that reason, we tested with each case 10 times. After getting the data from all
12
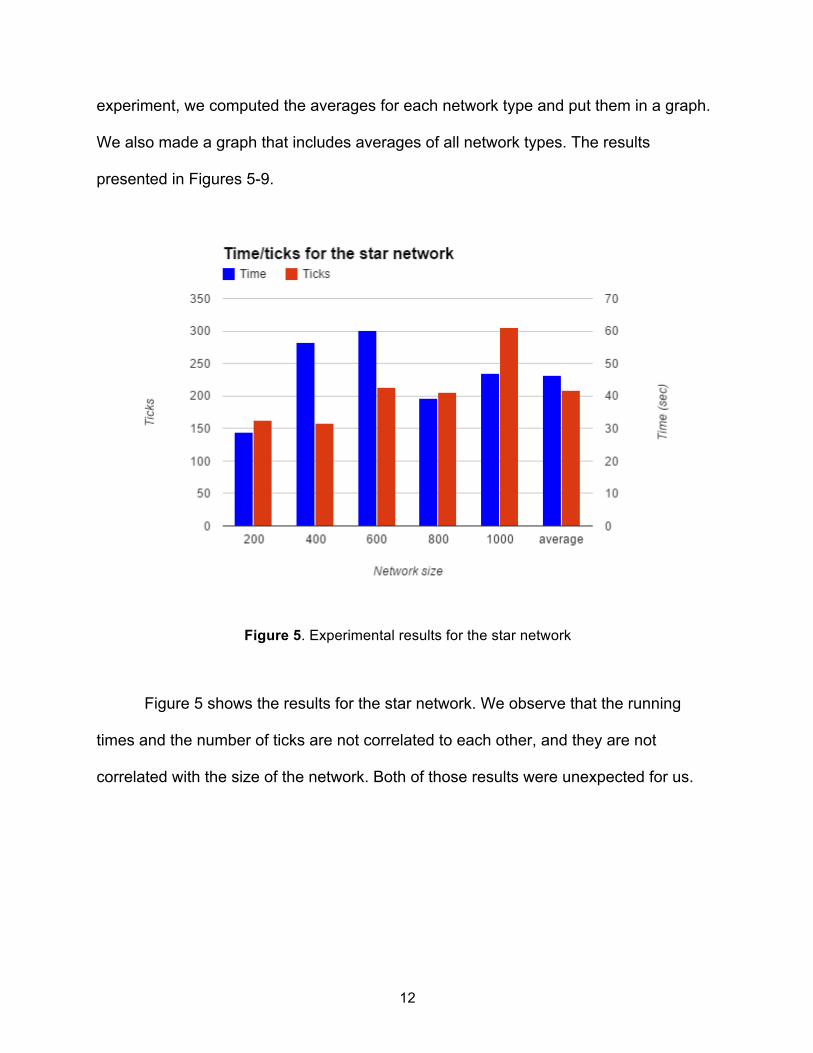
experiment, we computed the averages for each network type and put them in a graph.
We also made a graph that includes averages of all network types. The results
presented in Figures 5-9.
Figure 5. Experimental results for the star network
Figure 5 shows the results for the star network. We observe that the running
times and the number of ticks are not correlated to each other, and they are not
correlated with the size of the network. Both of those results were unexpected for us.
13
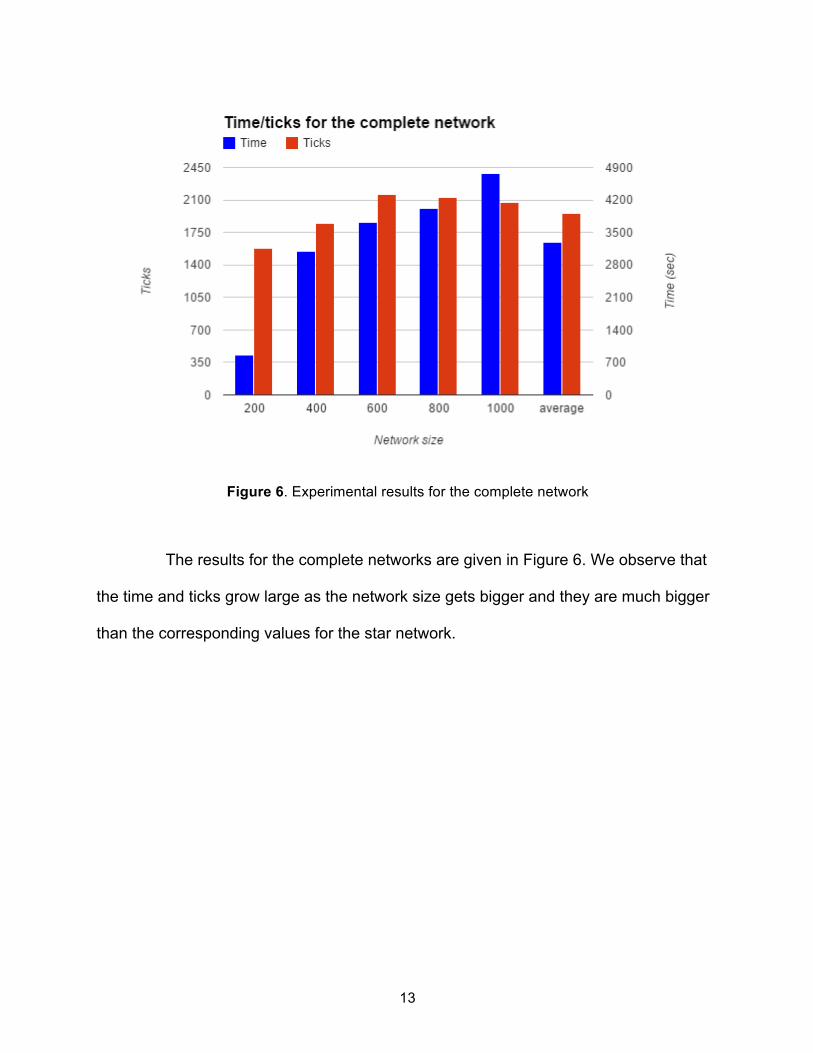
Figure 6. Experimental results for the complete network
The results for the complete networks are given in Figure 6. We observe that
the time and ticks grow large as the network size gets bigger and they are much bigger
than the corresponding values for the star network.
14
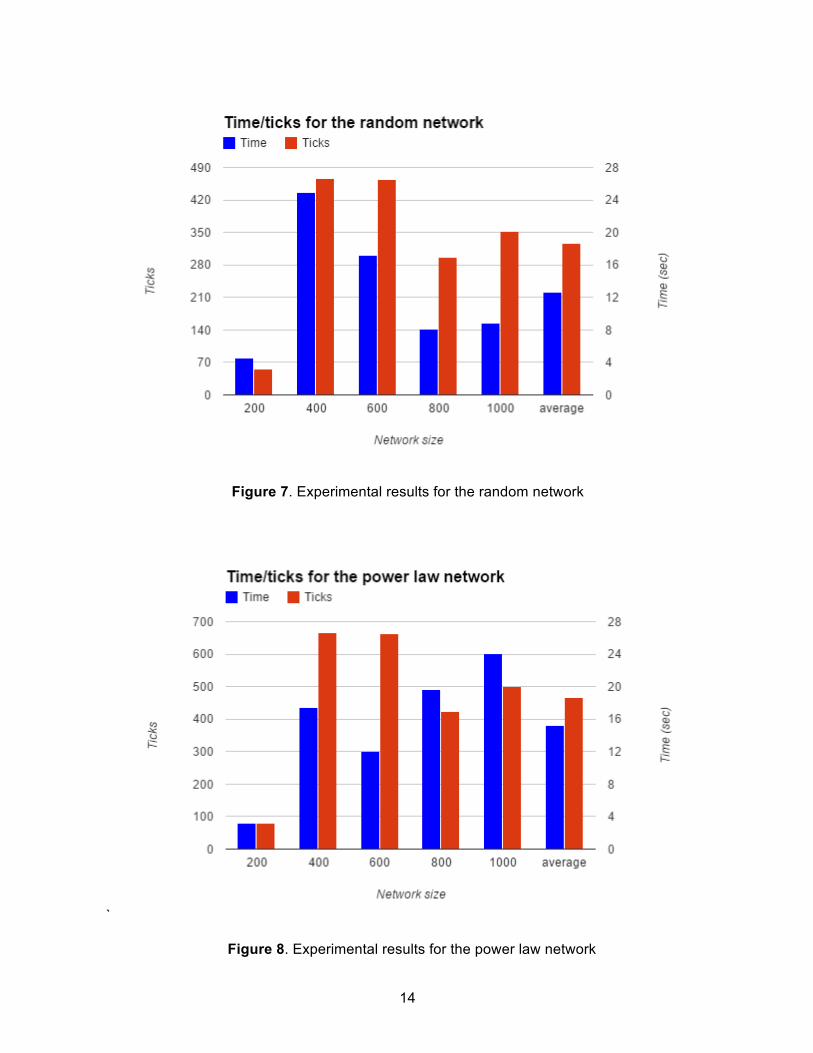
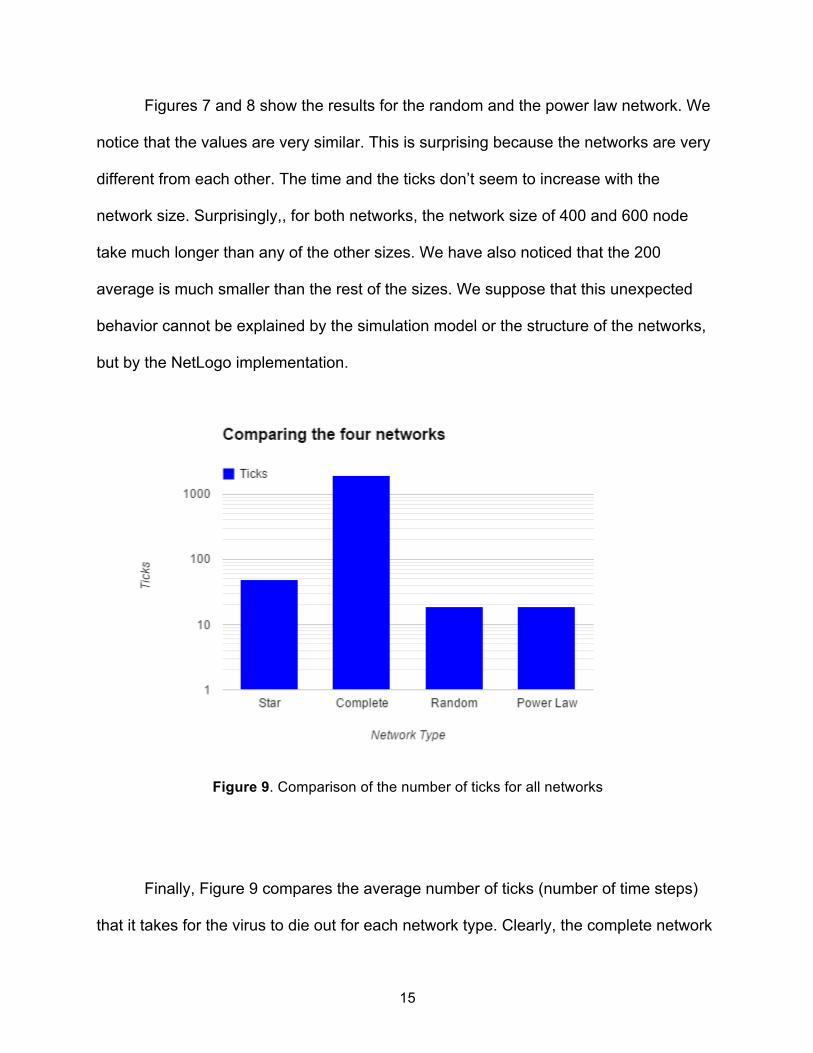
Figure 7. Experimental results for the random network
`
Figure 8. Experimental results for the power law network
15
Figures 7 and 8 show the results for the random and the power law network. We
notice that the values are very similar. This is surprising because the networks are very
different from each other. The time and the ticks don’t seem to increase with the
network size. Surprisingly,, for both networks, the network size of 400 and 600 node
take much longer than any of the other sizes. We have also noticed that the 200
average is much smaller than the rest of the sizes. We suppose that this unexpected
behavior cannot be explained by the simulation model or the structure of the networks,
but by the NetLogo implementation.
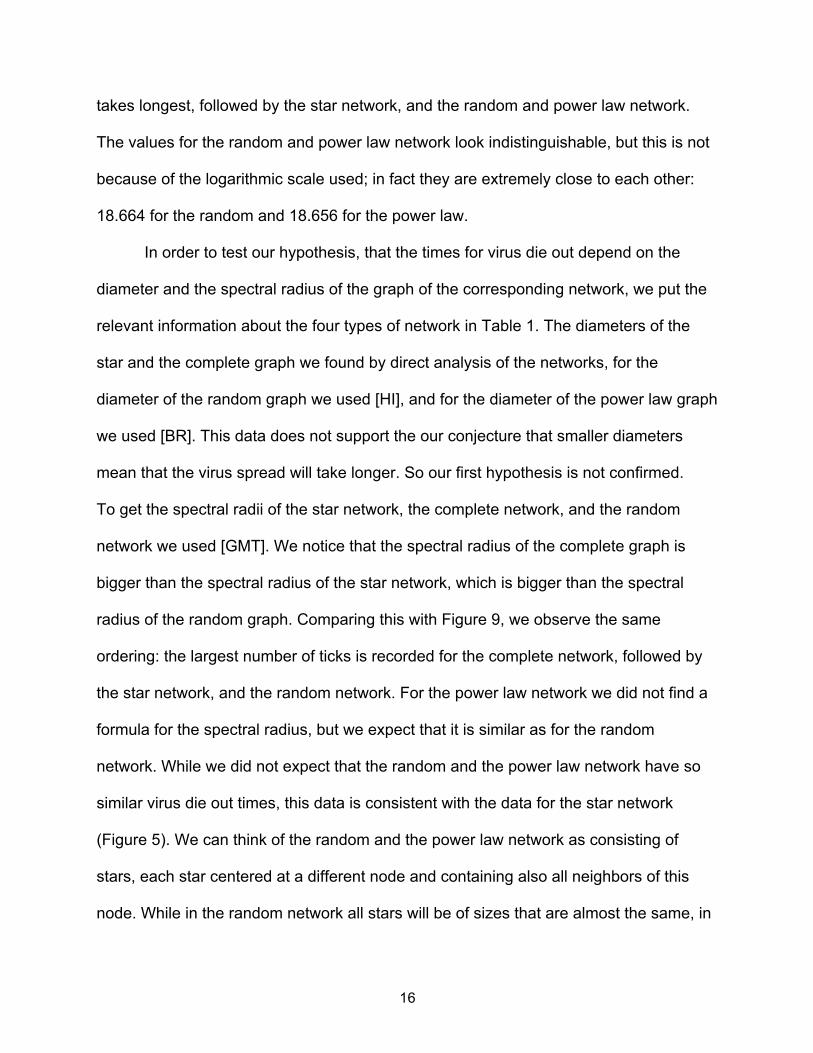
Figure 9. Comparison of the number of ticks for all networks
Finally, Figure 9 compares the average number of ticks (number of time steps)
that it takes for the virus to die out for each network type. Clearly, the complete network
16
takes longest, followed by the star network, and the random and power law network.
The values for the random and power law network look indistinguishable, but this is not
because of the logarithmic scale used; in fact they are extremely close to each other:
18.664 for the random and 18.656 for the power law.
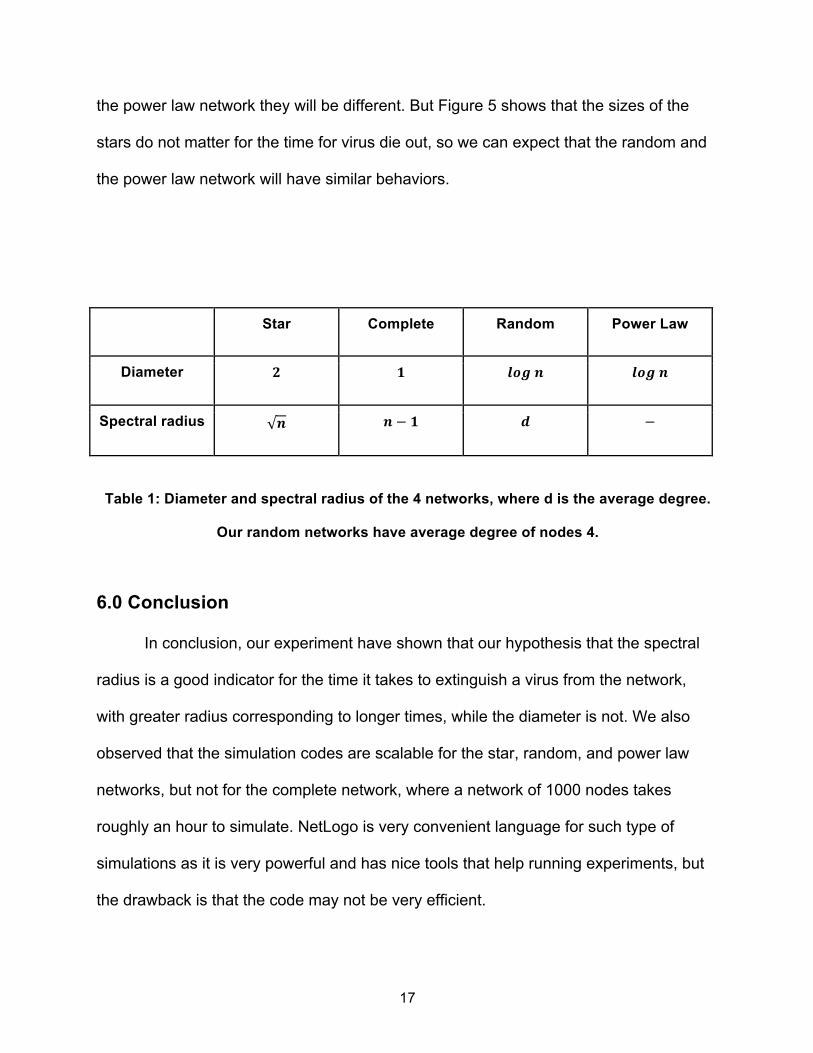
In order to test our hypothesis, that the times for virus die out depend on the
diameter and the spectral radius of the graph of the corresponding network, we put the
relevant information about the four types of network in Table 1. The diameters of the
star and the complete graph we found by direct analysis of the networks, for the
diameter of the random graph we used [HI], and for the diameter of the power law graph
we used [BR]. This data does not support the our conjecture that smaller diameters
mean that the virus spread will take longer. So our first hypothesis is not confirmed.
To get the spectral radii of the star network, the complete network, and the random
network we used [GMT]. We notice that the spectral radius of the complete graph is
bigger than the spectral radius of the star network, which is bigger than the spectral
radius of the random graph. Comparing this with Figure 9, we observe the same
ordering: the largest number of ticks is recorded for the complete network, followed by
the star network, and the random network. For the power law network we did not find a
formula for the spectral radius, but we expect that it is similar as for the random
network. While we did not expect that the random and the power law network have so
similar virus die out times, this data is consistent with the data for the star network
(Figure 5). We can think of the random and the power law network as consisting of
stars, each star centered at a different node and containing also all neighbors of this
node. While in the random network all stars will be of sizes that are almost the same, in
17
the power law network they will be different. But Figure 5 shows that the sizes of the
stars do not matter for the time for virus die out, so we can expect that the random and
the power law network will have similar behaviors.
Star Complete Random Power Law
Diameter 𝟐 𝟏 𝒍𝒐𝒈 𝒏 𝒍𝒐𝒈 𝒏
Spectral radius 𝒏 𝒏 − 𝟏 𝒅 −
Table 1: Diameter and spectral radius of the 4 networks, where d is the average degree.
Our random networks have average degree of nodes 4.
6.0 Conclusion
In conclusion, our experiment have shown that our hypothesis that the spectral
radius is a good indicator for the time it takes to extinguish a virus from the network,
with greater radius corresponding to longer times, while the diameter is not. We also
observed that the simulation codes are scalable for the star, random, and power law
networks, but not for the complete network, where a network of 1000 nodes takes
roughly an hour to simulate. NetLogo is very convenient language for such type of
simulations as it is very powerful and has nice tools that help running experiments, but
the drawback is that the code may not be very efficient.
18
7.0 Original Achievements
Our original achievement was to determine whether the diameter and the
spectral radius affect the speed in which the virus dies out. In our best knowledge,
nobody has studied such model for virus spread as ours and on these network types.
We found that NetLogo is very convenient language for this type of simulations,
both because of the language features and tools, as well as the library of models that is
available. NetLogo was fast enough to let us check our hypothesis, although for running
simulations on very large networks it may not be fast enough.
During our work on this project we have learned many things that we did not
know before. One thing we have found is that each run is different, even if the network
is the same, and we have to ran the experiment for each network type and number of
nodes multiple times and then take the average of the results.
8.0 Future Work
Although we have accomplished our achievements, much can still be done with
this project. Experimenting with various alternative network structures to see how the
behavior of the virus differs with other networks such as real-life network. Also, we can
extend this model by trying to model both the spread of viruses and countermeasures
by cyber defenders, like making certain nodes resistant.
19
9.0 Work Cited
[AJN] Aycock, John (2006). Computer Viruses and Malware. Springer.
[BA] A. Barabasi, R. Albert, "Emergence of scaling in random networks". Science 286
(5439): 509–51.
[BBB] B. Bollobás. Random Graphs, 2nd Edition. Cambridge Univer-sity Press, 2001.
[BR] B. Bollobás and O. Riordan. The Diameter of a Scale-Free Random Graph.
Combinatorica 24, 1 (January 2004), 5-34.
[BML] Brain, Marshall; Fenton, Wesley. How Computer Viruses Work, in
http://www.howstuffworks.com/virus.htm, accessed 12/10/2014.
[EGC] E.G. Coffman Jr., Z. Ge, V. Misra and D. Towsley. "Network resilience: exploring
cascading failures within BGP", Proc. 40th Annual Allerton Conference on
Communications, Computing and Control, October 2002.
[FFF] M. Faloutsos, P. Faloutsos and C. Faloutsos. "On power-law relationships of the
Internet topology", Proc. ACM Sigcomm, 1999.
[GMT] Ganesh, A.; Massoulie, L.; Towsley, D., "The effect of network topology on the
spread of epidemics," INFOCOM 2005. 24th Annual Joint Conference of the IEEE
Computer and Communications Societies. Proceedings IEEE , vol.2, no.,
pp.1455,1466 vol. 2, 13-17 March 2005
[HI] J. Hartline and N. Immorlica, What is the diameter of a random graph, in
theory.eecs.northwestern.edu/courses/socialnetworks101/files/Social_Networks_L
ecture4.pptx, accessed on 3/31/2015.
[KEG] Kaspersky, Eugene (November 21, 2005). "The contemporary antivirus industry
and its problems". SecureLight.
[KRK] Kurose, James F.; Ross, Keith W., (2012). Computer Networking (6th ed.),
Pearson Education.
20
[NHP] NetLogo home page, http://ccl.northwestern.edu/netlogo, accessed 12/10/2014.
[RPS] R. Pastor-Satorras and A. Vespignani. "Epidemic spreading in scale-free
networks," Physical Review Letters, 86 (2001), 3200– 3203.
[SF] P.W. Singer and A. Friedman. Cybersecurity and Cyberwar: What Everyone Needs to
Know, Oxford University Press; 1 edition (January 3, 2014).
21
10.0 Appendix
10.1 Acknowledgements
I would like to thank the organizers of the New Mexico Supercomputing
challenge for all their assistance. I would also like to thank my mentors and the NetLogo
models library for their codes and information.
22
10.2 Program Code
;;=============================================
;; Virus spread for Star networks in NetLogo
;; Adapted from Virus on a Network in the Models Library
;; Modified by Christie Djidjev
;; March 2015
;;=============================================
turtles-own
[ infected? ;; if true, the turtle is infectious
resistant? ;; if true, the turtle can't be infected
virus-check-timer ;; number of ticks since this turtle's last virus-check
]
to setup
clear-all setup-nodes
; setup-spatially-clustered-network
ask n-of initial-outbreak-size turtles
[ become-infected ] ask links [ set color white ] layout-radial turtles links (turtle 0) reset-ticks
reset-timer end
to setup-nodes
23
set-default-shape turtles "circle" cro number-of-nodes
[ set label who
set label-color black
fd 15
become-susceptible
set virus-check-timer random virus-check-frequency ] make-star number-of-nodes
end
to make-star [num-nodes] let counter1 0
let counter2 (counter1 + 1) while [counter2 < number-of-nodes] [ ask (turtle counter1) [create-link-with (turtle counter2)] set counter2 (counter2 + 1) ] set counter1 (counter1 + 1) end
to go
if all? turtles [not infected?] [ type count turtles type "," type ticks type "," print timer stop ] ask turtles
[ set virus-check-timer virus-check-timer + 1
if virus-check-timer >= virus-check-frequency
24
[ set virus-check-timer 0 ] ] spread-virus
do-virus-checks
tick
end
to become-infected ;; turtle procedure
set infected? true
set resistant? false
set color red
end
to become-susceptible ;; turtle procedure
set infected? false
set resistant? false
set color green
end
to become-resistant ;; turtle procedure
set infected? false
set resistant? true
set color gray
ask my-links [ set color gray - 2 ] end
to spread-virus
ask turtles with [infected?] [ ask link-neighbors with [not resistant?] [ if random-float 100 < virus-spread-chance
[ become-infected ] ] ] end
25
to do-virus-checks
ask turtles with [infected? and virus-check-timer = 0] [ if random 100 < recovery-chance
[ ifelse random 100 < gain-resistance-chance
[ become-resistant ] [ become-susceptible ] ] ] end
;;=============================================
;; Virus spread for the complete networks
;; Adapted from Virus on a Network in the Models Library
;; Modified by Christie Djidjev
;; March 2015
;;=============================================
turtles-own
[ infected? ;; if true, the turtle is infectious
resistant? ;; if true, the turtle can't be infected
virus-check-timer ;; number of ticks since this turtle's last virus-check
]
to setup
clear-all setup-nodes
; setup-spatially-clustered-network
26
ask n-of initial-outbreak-size turtles
[ become-infected ] ask links [ set color white ] reset-ticks
reset-timer end
to setup-nodes
set-default-shape turtles "circle" cro number-of-nodes
[ set label who
set label-color black
fd 15
become-susceptible
set virus-check-timer random virus-check-frequency ] make-mesh number-of-nodes
end
to make-mesh [num-nodes] let counter1 0
while [counter1 < number-of-nodes] [ let counter2 (counter1 + 1) while [counter2 < number-of-nodes] [ ask (turtle counter1) [create-link-with (turtle counter2)] set counter2 (counter2 + 1) ] set counter1 (counter1 + 1) ] end
27
to go
if all? turtles [not infected?] [ type count turtles type "," type ticks type "," print timer stop ] ask turtles
[ set virus-check-timer virus-check-timer + 1
if virus-check-timer >= virus-check-frequency
[ set virus-check-timer 0 ] ] spread-virus
do-virus-checks
tick
end
to become-infected ;; turtle procedure
set infected? true
set resistant? false
set color red
end
to become-susceptible ;; turtle procedure
set infected? false
set resistant? false
set color green
end
to become-resistant ;; turtle procedure
set infected? false
set resistant? true
28
set color gray
ask my-links [ set color gray - 2 ] end
to spread-virus
ask turtles with [infected?] [ ask link-neighbors with [not resistant?] [ if random-float 100 < virus-spread-chance
[ become-infected ] ] ] end
to do-virus-checks
ask turtles with [infected? and virus-check-timer = 0] [ if random 100 < recovery-chance
[ ifelse random 100 < gain-resistance-chance
[ become-resistant ] [ become-susceptible ] ] ] end
;;=============================================
;; Virus spread for the random networks
;; Adapted from Virus on a Network in the Models Library
;; Modified by Christie Djidjev
;; March 2015
;;=============================================
turtles-own
[
29
infected? ;; if true, the turtle is infectious
resistant? ;; if true, the turtle can't be infected
virus-check-timer ;; number of ticks since this turtle's last virus-check
]
to setup
clear-all setup-nodes
; setup-spatially-clustered-network
ask n-of initial-outbreak-size turtles
[ become-infected ] ask links [ set color white ] repeat 50
[ layout-spring turtles links 0.7(world-width / (sqrt number-of-nodes)) 1
] reset-ticks
reset-timer end
to setup-nodes
set-default-shape turtles "circle" cro number-of-nodes
[ set label who
set label-color black
fd 15
become-susceptible
set virus-check-timer random virus-check-frequency ] make-random number-of-nodes
30
end
to make-random [num-nodes] repeat 3 * num-nodes [ add-edge
] end
to add-edge
let node1 one-of turtles
let node2 one-of turtles
ask node1 [ ifelse link-neighbor? node2 or node1 = node2
;; if there's already an edge there, then go back
;; and pick new turtles
[ add-edge ] ;; else, go ahead and make it [ create-link-with node2 ] ] end
to go
if all? turtles [not infected?] [ type count turtles type "," type ticks type "," print timer stop ] ask turtles
[ set virus-check-timer virus-check-timer + 1
if virus-check-timer >= virus-check-frequency
[ set virus-check-timer 0 ]
31
] spread-virus
do-virus-checks
tick
end
to become-infected ;; turtle procedure
set infected? true
set resistant? false
set color red
end
to become-susceptible ;; turtle procedure
set infected? false
set resistant? false
set color green
end
to become-resistant ;; turtle procedure
set infected? false
set resistant? true
set color gray
ask my-links [ set color gray - 2 ] end
to spread-virus
ask turtles with [infected?] [ ask link-neighbors with [not resistant?] [ if random-float 100 < virus-spread-chance
[ become-infected ] ] ] end
to do-virus-checks
32
ask turtles with [infected? and virus-check-timer = 0] [ if random 100 < recovery-chance
[ ifelse random 100 < gain-resistance-chance
[ become-resistant ] [ become-susceptible ] ] ] end
;;=============================================
;; Virus spread for the power law networks
;; Adapted from Virus on a Network in the Models Library
;; Modified by Christie Djidjev
;; March 2015
;;=============================================
turtles-own
[ infected? ;; if true, the turtle is infectious
resistant? ;; if true, the turtle can't be infected
virus-check-timer ;; number of ticks since this turtle's last virus-check
]
to setup
clear-all setup-nodes
; setup-spatially-clustered-network
ask n-of initial-outbreak-size turtles
33
[ become-infected ] ask links [ set color white ] repeat 50
[ layout-spring turtles links 0.3 (world-width / (sqrt number-of-nodes)) 1
] reset-ticks
reset-timer end
to setup-nodes
set-default-shape turtles "circle" cro 1 [ set-attributes
] cro 1
[ set-attributes
create-link-with turtle 0
] cro number-of-nodes - 2
[ set-attributes
create-link-with find-partner ] end
to set-attributes
set label who
set label-color black
34
fd 15
become-susceptible
set virus-check-timer random virus-check-frequency end
to-report find-partner report [one-of both-ends] of one-of links
end
to go
if all? turtles [not infected?] [ type count turtles type "," type ticks type "," print timer stop ] ask turtles
[ set virus-check-timer virus-check-timer + 1
if virus-check-timer >= virus-check-frequency
[ set virus-check-timer 0 ] ] spread-virus
do-virus-checks
tick
end
to become-infected ;; turtle procedure
set infected? true
set resistant? false
set color red
end
to become-susceptible ;; turtle procedure
35
set infected? false
set resistant? false
set color green
end
to become-resistant ;; turtle procedure
set infected? false
set resistant? true
set color gray
ask my-links [ set color gray - 2 ] end
to spread-virus
ask turtles with [infected?] [ ask link-neighbors with [not resistant?] [ if random-float 100 < virus-spread-chance
[ become-infected ] ] ] end
to do-virus-checks
ask turtles with [infected? and virus-check-timer = 0] [ if random 100 < recovery-chance
[ ifelse random 100 < gain-resistance-chance
[ become-resistant ] [ become-susceptible ] ] ] end