Embed Size (px)
Citation preview

2007-01-2712
Spray Development, Flow Interactions and Wall Impingement in a Direct-Injection Spark-Ignition Engine
J. Serras-Pereira and P.G. Aleiferis University College London, UK
D. Richardson and S. Wallace Jaguar Advanced Powertrain Engineering, Coventry, UK
Copyright © 2007 Society of Automotive Engineers, Inc
ABSTRACT
Levels of liquid fuel impingement on in-cylinder surfaces in direct injection spark ignition engines have typically been higher than those in port-fuel injection engines due to in-cylinder injection and higher injection pressures. The result is typically an increase in the levels of un-burned hydrocarbons and smoke emissions which reduce the potential fuel economy benefits associated with direct injection engines. Although different injection strategies can be used to reduce these effects to some extent, full optimisation of the injection system and combustion process is only possible through improved understanding of spray development that can be obtained from optical engine investigations under realistic operating conditions. To this extent, the spray formation from a centrally mounted multi-hole injector was studied in a single-cylinder optical direct-injection spark-ignition engine under part-load conditions (0.5 bar intake plenum pressure) at 1500 RPM. A high-speed camera and laser illumination were used to obtain Mie-scattering images of the spray development on different in-cylinder planes for a series of consecutive engine cycles. The engine temperature was varied to reflect cold-start (20 °C) and fully warm (90 °C) engine conditions. A multi-component fuel (commercial gasoline) and a single-component fuel (iso-octane) were both tested and compared to investigate the effects of fuel properties on spray formation and wall impingement. An experimental arrangement was also developed to detect in-cylinder liquid fuel impingement using heat flux sensors installed on the cylinder liner. Two different injection strategies were tested; a typical single-injection strategy in the intake stroke to promote homogeneous mixture formation, as well as a triple-injection strategy around the same timing to assess the viability of using multiple-injection strategies to reduce wall impingement and improve mixture preparation. A sweep of different locations around the cylinder bore revealed the locations of highest fuel impingement levels which did not
correspond directly to the nominal spray plume trajectories as a result of spray-flow interactions. These results were analysed in conjunction with the observed effects from the parallel imaging investigation.
INTRODUCTION
Modern Direct-Injection Spark-Ignition (DISI) engines require continuous improvement in engine performance and driveability without an increase in legislated exhaust emission levels, particularly un-burnt hydrocarbons and smoke, which have typically been associated with this combustion system [1, 2]. One way of achieving this is through improved spray atomisation and mixture preparation which is a function not only of the spray formation process itself, but the interactions and mixing of the fuel with the in-cylinder flow. Increased injection pressures have improved the atomisation efficiency of modern injectors but result in higher spray penetration, leading to higher levels of liquid fuel wall impingement. Although multi-hole injectors provide an increased level of flexibility by optimising the targeting of individual spray plumes, the high momentum fuel plumes produced can still result in unwanted levels of localised surface wetting, even when fuel is injected early in the intake stroke (for homogeneous mode operation) and particularly at low-load conditions where sub-atmospheric in-cylinder pressures result in increased spray penetration. Achieving a reduction in the levels of liquid impingement on in-cylinder surfaces is therefore a significant and important requirement.
For homogeneous as well as stratified operating conditions, interactions with the in-cylinder flow field inevitably result in different spray development than that seen in a static injection rig, particularly at the spray tips, even with relatively low intake flow velocities under part-load conditions. Cyclic variations in the intake flow field can affect the spray development and wall impingement,

resulting in significant variability in the air-fuel ratio at the spark-plug location at ignition timing and, subsequently, in the combustion process, probably due to mechanisms that are different to those that have been quantified from observations on port-fuel-injection engines [3–5].
The current work seeks to examine the extent to which in-cylinder flow affects spray formation and wall impingement using different fuel types and injection strategies. The program of work aims to achieve this by:
• Performing high-speed imaging of the spray development in a DISI engine using two fuels, a multi-component commercial gasoline and iso-octane which is typically used for studies of mixture preparation and combustion in optical engines. This was done for two different engine temperatures to reflect cold-start (20 °C) and fully warm (90 °C) engine conditions.
• Using fast-response heat flux sensors mounted on the cylinder liner wall to detect impinging liquid fuel for a sweep of locations around the cylinder bore and to carry out cycle-by-cycle analysis of measured levels of heat flux and timing of liquid fuel impingement.
• Comparing ‘traditional’ single-injection strategies with multiple injections per cycle for homogeneous mode of engine operation.
A single-cylinder optical DISI engine was used to perform both the high-speed imaging of the fuel spray and the heat flux measurements, running at 1500 RPM part-load conditions (0.5 bar intake pressure).
EXPERIMENTAL ARRANGEMENT
OPTICAL ENGINE - Experiments were carried out with a 4-stroke single-cylinder DISI engine built by Ford (US) and adapted using a prototype cylinder head supplied from Jaguar Advanced Powertrain Engineering, UK. The 4-valve engine has similar bore and stroke geometry to that of a production V8 as outlined in Table 1. It should be noted here that in this paper 0° Crank Angle (CA) corresponds to intake Top Dead Centre (TDC) and crank-angle timings will be mainly presented with respect to that as After intake TDC (ATDC). A variety of optical access configurations are possible for this engine, mainly using:
• A piston crown window
• A full quartz cylinder liner
• A semi-optical liner set-up with a short quartz liner (~¼ stroke) that sits on a metal liner (~¾ stroke)
• A triangular pent-roof window
The different imaging planes and views possible with these arrangements are described in more detail later in this paper.
Table 1. Optical Engine Specifications.
Engine Base Type Jaguar V8
Cycle 4-Stroke
Cylinders 1
Valves 2 Intake, 2 Exhaust
Bore 89.0 mm
Stroke 90.3 mm
Compression Ratio 11.15:1
Maximum Speed 2500 RPM
Valve Timings IVO 24°, IVC 274° CA ATDC EVO 476°, EVC 6° CA ATDC
Fuel Injection System: The fuel injection system is comprised of a non-return ‘static piston’ pneumatic high-pressure pump. Thus, compressed air is supplied at ~4 bar to the pump via an in-house designed electronic regulator with filtering to produce 150 bar fluid pressure on the high pressure line to the injector. There is a 2 µm high pressure filter element on the pressure side with a 150 bar check valve in series. The check valve stops backflow under the static-piston reversal stroke which could otherwise reduce supply pressure by up to 10 bar during this period. Under typical low-load engine operation with continuous injection, the pump stroke frequency is of the order of 0.1 Hz with the reversal event lasting ~2 seconds. With the check valve installed, the reduction in line pressure during stroke reversal occurs only due to the injected liquid volume, which results in a gradual 3–4 bar maximum temporary drop in line pressure with minimal line pressure fluctuations.
Fuel Injector: The injector used is a vertical centrally mounted prototype with a six-hole nozzle in a close spacing arrangement with the spark plug. The nozzle holes are 0.5 mm in diameter at the exit and essentially consist of two groups of three nozzle holes. The six nozzle holes have different injection angles producing the spray pattern illustrated in Figures 1 and 2, where plumes 1 and 6 pass around the spark plug. There is an initial delay before fuel is seen at the injector tip, governed by the injector driver used.
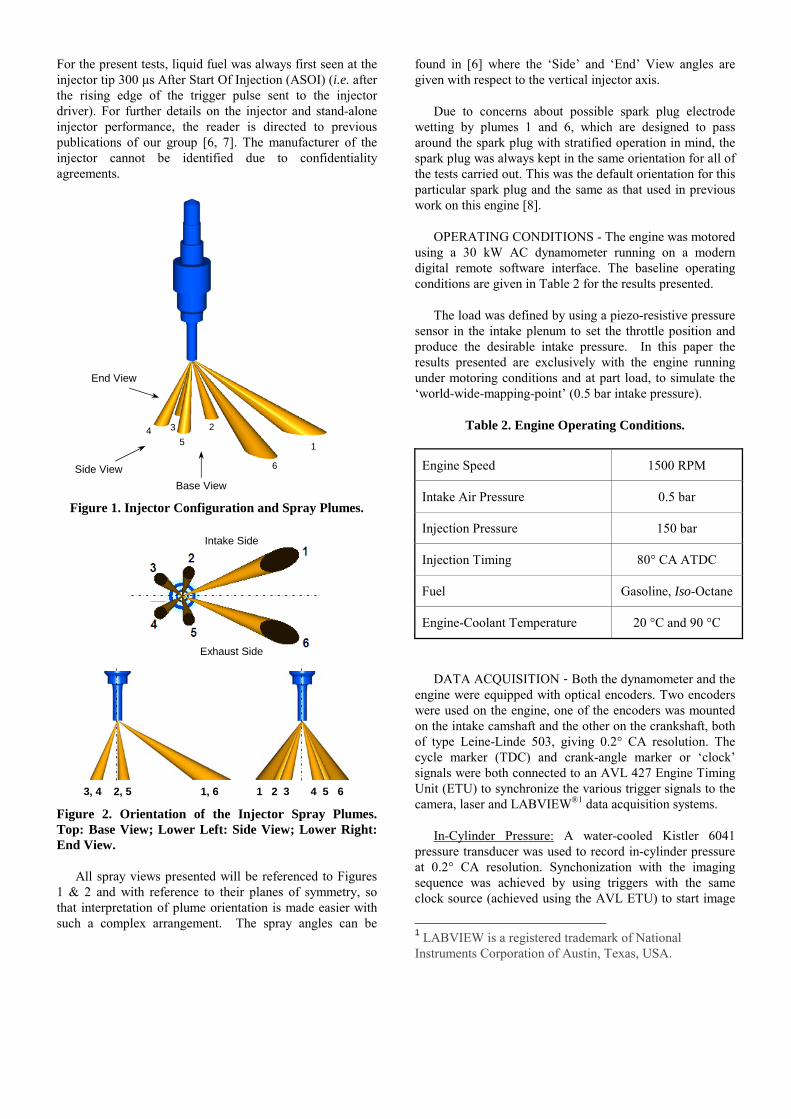
For the present tests, liquid fuel was always first seen at the injector tip 300 μs After Start Of Injection (ASOI) (i.e. after the rising edge of the trigger pulse sent to the injector driver). For further details on the injector and stand-alone injector performance, the reader is directed to previous publications of our group [6, 7]. The manufacturer of the injector cannot be identified due to confidentiality agreements.
Figure 1. Injector Configuration and Spray Plumes.
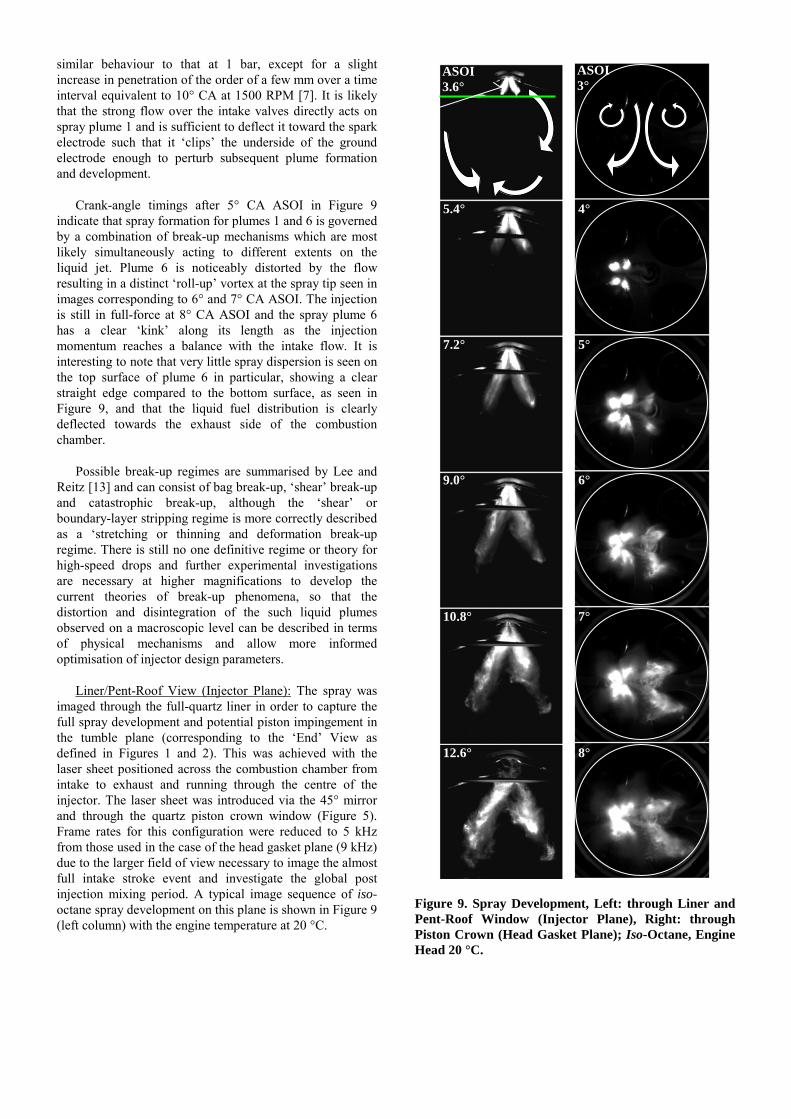
3, 4 2, 5 1, 6 1 2 3 4 5 6
Figure 2. Orientation of the Injector Spray Plumes. Top: Base View; Lower Left: Side View; Lower Right: End View.
All spray views presented will be referenced to Figures 1 & 2 and with reference to their planes of symmetry, so that interpretation of plume orientation is made easier with such a complex arrangement. The spray angles can be
found in [6] where the ‘Side’ and ‘End’ View angles are given with respect to the vertical injector axis.
Due to concerns about possible spark plug electrode wetting by plumes 1 and 6, which are designed to pass around the spark plug with stratified operation in mind, the spark plug was always kept in the same orientation for all of the tests carried out. This was the default orientation for this particular spark plug and the same as that used in previous work on this engine [8].
OPERATING CONDITIONS - The engine was motored using a 30 kW AC dynamometer running on a modern digital remote software interface. The baseline operating conditions are given in Table 2 for the results presented.
The load was defined by using a piezo-resistive pressure sensor in the intake plenum to set the throttle position and produce the desirable intake pressure. In this paper the results presented are exclusively with the engine running under motoring conditions and at part load, to simulate the ‘world-wide-mapping-point’ (0.5 bar intake pressure).
Table 2. Engine Operating Conditions.
Engine Speed 1500 RPM
Intake Air Pressure 0.5 bar
Injection Pressure 150 bar
Injection Timing 80° CA ATDC
Fuel Gasoline, Iso-Octane
Engine-Coolant Temperature 20 °C and 90 °C
DATA ACQUISITION - Both the dynamometer and the engine were equipped with optical encoders. Two encoders were used on the engine, one of the encoders was mounted on the intake camshaft and the other on the crankshaft, both of type Leine-Linde 503, giving 0.2° CA resolution. The cycle marker (TDC) and crank-angle marker or ‘clock’ signals were both connected to an AVL 427 Engine Timing Unit (ETU) to synchronize the various trigger signals to the camera, laser and LABVIEW®1 data acquisition systems.
In-Cylinder Pressure: A water-cooled Kistler 6041 pressure transducer was used to record in-cylinder pressure at 0.2° CA resolution. Synchonization with the imaging sequence was achieved by using triggers with the same clock source (achieved using the AVL ETU) to start image
1 LABVIEW is a registered trademark of National Instruments Corporation of Austin, Texas, USA.
Intake Side
Exhaust Side
1
2 3 4 5
6
Base View
End View
Side View

and data acquisition, by setting both systems in a ‘ready’ mode awaiting trigger signals.
IMAGE ACQUISITION – The following section outlines the imaging methodology used to obtain the in-cylinder spray imaging results. This was carried out using a high-speed camera with synchronised laser system to obtain crank-degree resolved information of spray formation and development. Using a modified piston which allowed imaging of the full cylinder bore - rather than that usually captured, corresponding to the piston crown window dimensions (~70% bore) - and which is discussed later in this paper, the arrangement also allowed spray impingement on the cylinder liner walls to be confirmed.
High-Speed Camera: The fuel spray was imaged using a high-speed CMOS camera (Photron APX-RS) at a frame rate of 9 kHz under most conditions, corresponding to 1º CA between frames at 1500 RPM. This was possible with an image resolution of 640×480 pixels, giving an optical resolution of ~160 µm per pixel. The camera has an internal memory of 2.15 GB which allowed up to 100 cycles to be captured in a single acquisition run with an imaging sequence of ~68 frames per cycle. It was possible to reduce the number of images acquired per cycle in order to increase the number of consecutively recorded cycles. The limit using one crank-angle degree resolution was found to be ~30–40 images per injection to allow enough detail of the injection and post-injection event to be captured, giving a total of ~150 cycles per acquisition run. The duration of downloading the camera memory was of approximately 5 minutes. Due to memory and processing time considerations it was finally decided to acquire 100 cycles for each test condition. The camera was coupled to a 60 mm Nikon lens with f2.8. The imaging set-up was optimized so that the camera and lens settings would suit imaging of the liquid spray using laser-sheet Mie Scattering.
For the full quartz cylinder liner configuration it was necessary to set the image resolution to a 512×1024 pixels so that piston stroke could be imaged nearly in its entirety and potential piston impingement recorded. To do this the camera frame rate had to be reduced to 5 kHz which at 1500 RPM resulted in a temporal resolution of 1.8° CA per imaged frame.
High-Speed Laser: Using standard sheet optics, the combustion chamber was ‘sliced’ with a New Wave Nd:YLF laser at 527 nm entering across the engine in the tumble and swirl planes as illustrated in Figures 3–5, using the available optical quartz cylinder liner ring, pent-roof and piston-crown windows. The thickness of the laser sheet produced was of the order of 1 mm. The Nd:YLF laser used is a diode-pumped high-repetition rate laser with double cavities each capable of 10 kHz Q-switch frequency. To guarantee uniform light intensity levels during acquisition
runs, the laser was run at highest power with both heads firing simultaneously at 9 kHz.
Two laser sheet positions were used to image two different planes from the piston crown (‘base view’, as shown earlier in Figure 1), using an installed 45° mirror located under the Bowditch piston. The two planes are shown in Figure 4, identified as ‘Head Gasket Plane’ and ‘Heat Flux Sensor Plane’. The latter plane corresponded to the location where heat flux sensors were installed in the engine to quantify spray impingement, as will be described in detail later. The height of the laser was adjusted in each case to allow the spray to be ‘sliced’ on these planes by the laser sheet and thus capture the ‘footprint’ of the spray plumes at two different axial locations. The head gasket plane was horizontal ~1 mm above the head gasket into the pent-roof and the heat flux plane was ~17 mm below the head gasket.
The spray was also sliced by the laser sheet on the tumble plane by guiding the laser to enter the cylinder vertically via the 45° mirror under the Bowditch piston and crossing the centre of the injector, thereby called ‘Injector Plane’, as shown in Figure 5. With reference to Figure 1, this plane of imaging corresponded to the ‘end view’ of the spray; due to the nozzle-hole arrangement, plumes 2 and 5 were mainly captured on the images.
Figure 3. Experimental Set-up for Spray Imaging through the Piston Crown.
Exhaust Intake

Figure 4. Laser-Sheet Locations for Imaging the Spray via the Piston Crown.
Figure 5. Laser-Sheet Location across the Center of the Injector for Imaging the Spray through the Full-Length Quartz Liner.
Spray Imaging: The set-up used to visualize the liquid phase of the fuel plumes through the piston quartz window has been shown in Figure 3. To control the flow of triggers to the camera, laser and LABVIEW® systems, the AVL ETU was used to turn the laser on during each cycle to image the fuel spray. The correct laser firing frequency was achieved by using the frame-rate TTL pulse train sync-output available from the camera, routed to external trigger input connectors at the laser interface. The laser was activated at injection timing and switched off after imaging acquisition was complete.
Injection Timing: The Injection timing used for early injection homogeneous mode was set quite early in the intake stroke (SOI 80° CA ATDC) to maximize the time available for evaporation before ignition. This must however be balanced by the need to avoid excessive liquid impingement on in-cylinder surfaces, particularly on the piston crown; therefore 80° CA ATDC was used as a compromise. With initial spray-tip velocities of about 80
m/s however, measured using 150 bar injection pressure [6, 7], liquid impingement on liner and piston surfaces is difficult to avoid, particularly at low in-cylinder pressures. The injection duration was set to 0.78 ms, corresponding to stoichiometric conditions for the part-load operation point used throughout this study.
Multiple Injections: In order to achieve control over multiple split injections, the AVL ETU was used with an inbuilt function linking two output trigger channels. The spacing between each split injection is ultimately limited by the response time of the particular injector and injector driver system. To be able to perform some form of comparison between single and multiple injections, a split injection strategy was devised to allow stoichiometric operation comprising of three shorter injections to deliver the same amount of fuel as the single injection and maintain the same operating point. In order to keep the time available for evaporation the same before ignition for both injection strategies, the multiple injection strategy was chosen to have an earlier start of injection to accommodate the increased delays in the injection system due to multiple triggering. The first injection was programmed to start at 60° CA ATDC, the second at 70° CA and the third at 80° CA ATDC (i.e. dwell time of 10° CA), with pulse durations of 0.25 ms, 0.28 ms and 0.25 ms respectively, such that the last injection pulse starts at the same time in the cycle as the single injection (Figure 6). The decision behind such a strategy is that using a single injection with such an early SOI would result in significant piston impingement due to the high piston position and the increased momentum of the longer single-injection spray plumes. Thus, the case is made that such an injection strategy is one potential method for reducing the levels of direct wall impingement and improving mixture preparation under conditions of homogeneous engine operation.
Figure 6. Multiple Injections versus Single Injection.
Inje
ctor
Pla
ne
Head Gasket Plane
Heat Flux Sensor Plane
Piston
Intake
Exhaust

SPRAY FORMATION AND FLOW EFFECTS
The spray was first imaged at room temperature and with the engine static to decouple the in-cylinder flow-field effects from the spray formation itself; iso-octane was used and the obtained images are shown in Figure 7. These show typical characteristics of high-pressure spray dynamics, with plumes 1 and 6 exhibiting the so-called ‘fishbone’ structure as a result of distribution of the smaller slow-moving droplets to the outside of the plume; this results from air-entrainment caused by high shear forces at the air-spray interface which set up recirculation zones that become wider with increasing distance from the nozzle. Similar observations have been also reported in other recent publications [9–11].
Figure 7. Spray Injection into Quiescent Combustion Chamber at Atmospheric Pressure, Iso-Octane.
Figure 8. Spray Injection at 1500 RPM with SOI 80° CA ATDC, 0.5 bar Intake Pressure, Iso-Octane.
The spray development in Figure 8 was captured for an injection timing of 80° CA ATDC with the engine now motoring at 1500 RPM under part load (0.5 bar intake pressure) and demonstrates the effect of the intake flow through the valves. The flow affects predominantly the two plumes, 1 and 6, that are directed towards the spark plug at a much larger angle to the vertical, in comparison to plumes 2 and 5 and plumes 3 and 4. Plumes 1 and 6 are therefore much more sensitive to the incoming flow which is dominated by the strong intake valve jet around this injection timing, peaking in intensity at ~90° CA ATDC as measured by Jarvis et al. [12] using Particle Image Velocimetry (PIV) in an engine of identical nominal geometry and with the same valve timings. The other plumes 2–5, are also affected by the intake flow but to a
lesser extent. The spray penetration is reduced for plumes 1 and 6 relative to the static condition due to strong spray-flow interactions which result in increased shear forces at the spray-air interfaces, enhance air entrainment into the spray and cause initial plume break-up, predominantly at the tips. On the other hand, the penetrations for plumes 2–5 increase because of the lower (sub-atmospheric) in-cylinder pressure and the reduced effect of the intake flow on the spray tips as a result of the much smaller geometrical angles of these plumes with respect to the vertical axis and in comparison to plumes 1 and 6.
The full effects of the in-cylinder flow during the injection period can be more clearly discerned from Figure 9 that shows high-speed images of spray development through both the piston crown and the quartz liner pent-roof window. Arrows have been drawn on the first image of each sequence in Figure 9 to show schematically the ‘mean’ in-cylinder flow in the engine as has been measured by PIV [12], to aid interpretation. These sequences of images are discussed below for each view individually.
Piston-Crown View (Head Gasket Plane): The imaging sequence on this plane is shown in Figure 9 (right column) for low engine temperature conditions (20 °C), using iso-octane fuel for 3°–8° CA ASOI. The upper limit of 8° CA was chosen as it represents the timing ASOI (for SOI 80° CA ATDC) for which the whole spray is last fully visible through the piston crown window. It can be seen that at 3° CA ASOI nothing is apparently imaged and this is indeed the case since none of the spray plumes have yet crossed the laser sheet that is positioned just above the head gasket, as illustrated by the horizontal thick line on the first image of the liner/pent-roof-view image sequence in the left column of Figure 9.
Spray plumes 2–5 first cross the laser sheet at 4° CA ASOI where the spray pattern is very similar to that expected from the nominal nozzle-hole design of Figure 2. Plumes 1 and 6 at this point are still above the laser sheet and are only just visible in the background. In the next crank angle increment (5° CA ASOI) these plumes become visible due to increased light scattered from a larger number of liquid droplets present in the combustion chamber as injection proceeds and are still mostly above the laser sheet, although the spray tip are just about touching the top of the sheet as indicated by the brighter tips relative to the rest of the plume. The effect of the intake flow on the shape of these plumes can already be clearly identified at this crank angle, particularly for plume 6, and it appears that some impingement on the lower side of the spark plug electrode is also occurring from plume 1. These effects are not seen under quiescent conditions, verified by imaging the spray in a static engine, Figure 7, nor do they appear to be an ambient pressure related effect, since sprays under sub-atmospheric conditions have also been imaged in a quiescent pressure chamber and have been found to exhibit
10° CA ASOI 5° CA ASOI
10° CA ASOI 5° CA ASOI
similar behaviour to that at 1 bar, except for a slight increase in penetration of the order of a few mm over a time interval equivalent to 10° CA at 1500 RPM [7]. It is likely that the strong flow over the intake valves directly acts on spray plume 1 and is sufficient to deflect it toward the spark electrode such that it ‘clips’ the underside of the ground electrode enough to perturb subsequent plume formation and development.
Crank-angle timings after 5° CA ASOI in Figure 9 indicate that spray formation for plumes 1 and 6 is governed by a combination of break-up mechanisms which are most likely simultaneously acting to different extents on the liquid jet. Plume 6 is noticeably distorted by the flow resulting in a distinct ‘roll-up’ vortex at the spray tip seen in images corresponding to 6° and 7° CA ASOI. The injection is still in full-force at 8° CA ASOI and the spray plume 6 has a clear ‘kink’ along its length as the injection momentum reaches a balance with the intake flow. It is interesting to note that very little spray dispersion is seen on the top surface of plume 6 in particular, showing a clear straight edge compared to the bottom surface, as seen in Figure 9, and that the liquid fuel distribution is clearly deflected towards the exhaust side of the combustion chamber.
Possible break-up regimes are summarised by Lee and Reitz [13] and can consist of bag break-up, ‘shear’ break-up and catastrophic break-up, although the ‘shear’ or boundary-layer stripping regime is more correctly described as a ‘stretching or thinning and deformation break-up regime. There is still no one definitive regime or theory for high-speed drops and further experimental investigations are necessary at higher magnifications to develop the current theories of break-up phenomena, so that the distortion and disintegration of the such liquid plumes observed on a macroscopic level can be described in terms of physical mechanisms and allow more informed optimisation of injector design parameters.
Liner/Pent-Roof View (Injector Plane): The spray was imaged through the full-quartz liner in order to capture the full spray development and potential piston impingement in the tumble plane (corresponding to the ‘End’ View as defined in Figures 1 and 2). This was achieved with the laser sheet positioned across the combustion chamber from intake to exhaust and running through the centre of the injector. The laser sheet was introduced via the 45° mirror and through the quartz piston crown window (Figure 5). Frame rates for this configuration were reduced to 5 kHz from those used in the case of the head gasket plane (9 kHz) due to the larger field of view necessary to image the almost full intake stroke event and investigate the global post injection mixing period. A typical image sequence of iso-octane spray development on this plane is shown in Figure 9 (left column) with the engine temperature at 20 °C.
Figure 9. Spray Development, Left: through Liner and Pent-Roof Window (Injector Plane), Right: through Piston Crown (Head Gasket Plane); Iso-Octane, Engine Head 20 °C.
4°
5°
6°
7°
8°
ASOI 3°
5.4°
7.2°
9.0°
10.8°
12.6°
ASOI 3.6°

Fuel Type and Temperature Effects: The ‘accuracy’ of experimental results with respect to reflection of real world in-cylinder engine phenomena and operating performance can be significantly affected by the use a ‘model’ or ‘control’ fuel, typically a single-component such as iso-octane, to represent standard commercial gasoline. The differences may arise from the distillation curves of the two fuels which can differ greatly as a result of the blended nature of standard gasoline [6, 7]. The gasoline used in the current study is predominantly based on various C8 hydrocarbons (~40% by volume). However, there are also a significant proportion of light fractions present with low boiling points, mainly pentanes which account for ~25% by volume (typical boiling point of ~36 °C), some hexanes ~10% by volume (typical boiling point ~68 °C), as well as a similar percentage of C7 hydrocarbons. The remainder consists of heavier components with typical boiling points well above 100 °C. The effect of engine operating temperatures on fuel spray formation, which can range from anything between 10 °C to 100 °C in mild climates in the cold-warm engine transition, is therefore of particular relevance to DISI engines, as changes in spray formation are felt immediately in terms of the quality of charge preparation due to the reduced times available for mixing.
To investigate these temperature effects on the spray formation and levels of wall impingement recorded, the engine was motored with engine head and cylinder liner temperature set to 90 °C at otherwise similar operating conditions of speed and load (1500 RPM, 0.5 bar intake pressure) using gasoline. Figure 10 shows the effect of increasing engine temperature on gasoline’s spray formation. The 20 °C case exhibits very similar spray formation to that of iso-octane’s shown earlier in Figure 9. This is expected because the temperature is below the boiling points of the lightest fractions. At 90 °C however, although iso-octane exhibits no major alteration in its spray formation (apart from increased evaporation rates at the spray tips), the gasoline spray is significantly affected in terms of absolute initial shape and subsequent development. Both plume pairs 2, 5 and 3, 4 participate in this so-called ‘spray collapse’, which results in the spray being drawn to the centre of the combustion chamber as shown in Figure 10. The maximum spray penetrations are reduced due to increased evaporation rates at the spray tips and once again a noticeable roll up of the plumes on the intake side of the combustion chamber is seen. A similar effect has been observed in a quiescent pressure chamber at equivalent temperature and pressure conditions [6, 7] which begs the question whether this is purely a spray effect or whether local in-cylinder conditions are contributing to further collapse and air entrainment in the spray boundaries. Such effects are expected to have implications on the levels of direct liquid fuel impingement on in-cylinder surfaces and potentially on the combustion itself due to differences in mixture homogeneity, although these have not been quantified in a firing engine yet by the current authors.
Figure 10. Spray Development through Liner and Pent-Roof Window (Injector Plane): Gasoline, Engine Head 20 °C (Left) and 90 °C (Right).
5.4°
7.2°
9.0°
10.8°
ASOI 3.6°
5.4°
7.2°
9.0°
10.8°
ASOI 3.6°
20 °C 90 °C

Figure 11. Spray Development through Liner from the Exhaust Side: Iso-Octane, Engine Head 50 °C.
Liquid Impingement on In-Cylinder Surfaces: For the investigation of liquid impingement, the ‘side’ view was imaged by placing the camera under the exhaust port. This allowed the three different plume pairs to be imaged simultaneously, as shown in Figure 11. The same injection timing was used for these tests as before (80° CA ATDC) and the images shown are for iso-octane with engine temperature of 50 °C, at part-load (0.5 bar intake pressure) and 1500 RPM. Direct locations of impingement can be seen on the piston crown, resulting mainly from plumes 2 and 5, with apparent liner impingement just below the head gasket plane mainly originating from plumes 1 and 6. These results were used to consider how to design necessary components for the placement of heat flux sensors around the cylinder liner in order to study the timing and magnitude of impingement. These considerations are discussed in detail in the following section.
SPRAY IMPINGEMENT AND HEAT FLUX
Piston Configuration: The potential location of main liquid wall impingement originating from plumes 1 and 6 was initially investigated by lowering the laser sheet in increments until the plumes were imaged crossing the sheet in the limits of the visible piston crown window area. The imaging study presented in previous sections of this paper was used as a guide for where this location would be. Image processing and calibration allowed the potential location of impingement to be identified in the area between 15 and 25 mm below the head gasket.
However, the main limitation of the imaging techniques used was in the optical access provided by the quartz piston crown window, which did not allow plumes 1 and 6 to be imaged close enough to the walls to detect actual impingement. As a result it was difficult to use this arrangement for the stated aims. However, after discussions with the Internal Combustion Engines Group at the University of Oxford (a member of the consortium for which this work is being carried out), a full-bore optical Perspex piston crown was made available, details of which can be found in [14]. This piston crown allowed imaging of the combustion chamber up to the cylinder walls by incorporating a concave surface into the underside of the piston crown that acted as a diverging lens. The proportion of newly visible area using this Perspex crown was significant and allowed the cylinder walls to be seen as demonstrated in Figure 12. Specifically, the intake valves can be fully seen with the full-bore Perspex piston crown, whereas substantial masking results from the metal crown with the quartz window insert of 65 mm in diameter (in comparison to the 89 mm bore). There is of course optical distortion in the images captured by use of this piston, but since the piston position is known for each image, it is relatively easy to reconstruct undistorted images. Discussion of further details on the design of the piston and its exact configuration and optical geometry are beyond the
9°
11°
13°
15°
17°
ASOI 7°

scope of the current publication and the reader is guided to [14] for more information.
Figure 12. Comparison of Fields of View between Quartz Piston (Left) and Perspex Piston (Right).
The same laser sheet technique was applied to image the fuel spray on the heat flux plane under motoring conditions using this enlarged field of view. A 3×3 mosaic of typical spray images captured with this arrangement at 15° CA ASOI is shown in Figure 13. It can be seen that apart from the four main plumes in the centre of the images (plumes 2–5 with reference to Figure 2), the two side plumes, 1 and 6, are now also visible as they cross the laser sheet very near the cylinder walls on the right-hand side of the images. This was confirmation that indeed some direct liquid impingement was occurring under these operating conditions and allowed the design and manufacture of the necessary components to be finalised.
Figure 13. Gasoline Sprays with Perspex Piston (Heat Flux Sensor Plane): 15° CA ASOI, Engine Head 20 °C.
Heat Flux Sensor: The levels of wall impingement were recorded using a fast-response heat flux sensor made by
Vatell Corporation, model HFM-7, together with a Vatell amplifier, model AMP-6 [15]. Similar sensors have been previously used by our group for the purpose of detection of liquid fuel impingement on the cylinder liner of PFI engines with open-valve injection [16, 17].
The sensor is based on thermocouple technology and essentially joins many thermocouple pairs in series to form a flat plate differential thermopile. This plate actually consists of a ceramic thermal resistance layer. Since the thermocouples are arranged in series, the total output voltage Vt of the thermopile is proportional to the number of thermocouples. The temperature difference across this thermopile then allows the heat flux to be determined, where the heat flux is proportional to the ceramic material’s thermal conductivity k and the temperature difference, but inversely proportional to thickness of the resistance layer t, i.e. q ∝ (k/t)Vt. Since the thermal conductivity of the ceramic material is a function of temperature, the sensor was initially calibrated at the factory.
Two measurements are made simultaneously with this type of sensor. The first is a temperature measurement obtained from a Resistance Temperature Sensor (RTS) element, consisting of a thin film deposited in a loop pattern around the outer edge of the sensor face. The second is a Heat Flux Sensor (HFS) measurement obtained from the thermopile that occupies most of the surface area on the sensor face (6.4 mm in diameter). This is not equivalent to a thermocouple signal as it acts as a differential source and therefore is not grounded [15]. The fastest sensor response time is of the order 16 μs if used uncoated as shown in Figure 14.
Figure 14. Heat Flux Sensor.
Heat Flux Liner: A short steel cylinder liner ring was designed to replace the short quartz liner used for the Mie scattering spray images, so that the ¾ stroke water-cooled cylinder liner could also be used. The advantage of having a removable ring in which to insert the heat flux sensors is that it gives effectively infinite flexibility of sensor positioning around the cylinder bore. Four sensor insert locations were initially machined at 18° spacings, defined by the necessary dimensions of the sensor and locking mechanism, and designed to allow simultaneous sensors to be used for monitoring more than one impingement location at a time; although nothing prevents further insert locations to be machined so that non-adjacent sensor location can be

investigated in the future, e.g. sensors at orthogonal positions.
Figure 15. Top: Steel Liner Ring with Mountings for Multiple Sensors; Bottom: Ring and Heat Flux Sensors Installed on the Engine.
Figure 16. Spray Image and Sensor Locations.
The steel liner with one sensor installed and three sensor blanks is shown already in position above the ¾ stroke water-cooled cylinder liner on the engine in Figure 15. The rotation of the ring in this case appears to be hindered by the columns supporting the engine head around the cylinder liner, although with a ring that holds only one sensor the flexibility is much improved. Since the region of interest was around where plumes 1 and 6 would be expected to impinge, initial sweeps of sensor locations around 140° of the cylinder bore were used to obtained heat flux measurements for different operating temperatures and fuel
types. The sensor locations which were used are shown in Figure 16 with a fuel spray image overlayed to aid interpretation. It can be seen that the injector is offset from the true centre of the combustion chamber and therefore the sensor locations in absolute angles around the bore will not correspond directly to the angles of the plumes (even for injection into a static engine).
Heat Flux Measurement: The RTS measurement is critical to proper heat flux measurement, because the HFS is temperature dependent. The RTS relies on the fact that the thin film resistance changes as a function of temperature. This function is close to linear for most temperatures of interest, although strictly speaking it is better described by a cubic polynomial. The function is characterized for each sensor at Vatell and takes the form:
dRcRbRaT +⋅+⋅+⋅= 23 (1) where:
T is the temperature [°C]
a, b, c, d are the coefficients of the polynomial
R is the electrical resistance of RTS [Ω]
The resistance of the RTS is related to the voltage output from the amplifier by:
0RGI
VRRTSRTS
RTS += (2)
where:
VRTS is the voltage output of the RTS amplifier channel [V], which may be positive or negative
IRTS is the excitation current through the RTS used to generate VRTS, equal to 1×10⁻⁴ [A] for Vatell amplifiers
GRTS is the amplifier gain for the RTS channel
The resistance value from equation (3) can then be entered into equation (1) to determine the temperature. Once the temperature, T, is known, the heat flux can be computed from:
hTg
GVq HFSHFS
+⋅=′′ (3)
where:
q’’ is the heat flux [W/cm2]
VHFS is the amplified voltage signal from the HFS [μV]

GHFS is the amplifier gain for the HFS channel
g, h are coefficients for the relationship between sensitivity and temperature
The sensor signal is proportional to the temperature difference between the participating media, in this case the liquid fuel or flow relative to the sensor face temperature. This means that the sensor must be kept at a different temperature to that of the fuel or flow and therefore a number of configurations were tested to allow investigation of the effect of different engine head temperatures on impingement levels. A baseline condition was initially selected to represent a typical test case in terms of potential fuel impingement with the engine head kept at 20 °C and the cylinder liner at 50 °C. This arrangement produced adequate heat flux signal levels and was used to compare levels of spray impingement on the liner for different fuels (mainly gasoline, iso-octane) and injection strategies (mainly single injection vs. multiple injections per cycle). A variety of other combinations of head and liner temperatures was further identified to study spray formation and wall impingement. Table 3 summarizes the different temperature arrangements used.
It should be noted here that the head coolant temperature effectively defines the temperature of the injector body (and the initial temperature of the fuel) since these are in direct metal/metal contact. For all conditions, the temperatures were allowed to stabilise so that enough head soak time (30–40 min) raised the fuel temperature in the fuel lines close to the injector, to levels that would be expected in real world conditions. However, the evaporation process has the effect of reducing the droplet temperature down to the ‘wet-bulb’ temperature resulting in substantial liquid cooling which has been measured to be of the order of 30 K in the first millisecond after injection, measured in a quiescent environment [18] under comparable conditions to those being considered in the current study. The presence of forced convection on this process is known to reduce the characteristic time scales such that a significant fuel temperature drop is likely to occur before impingement.
Table 3. Experimental Conditions for Heat Flux Measurements.
Head Temperature
[°C]
Lower Liner Temperature
[°C]
Sensor Temperature
[°C]
System Temperature Difference
[°C] 20 50 40 20 20 90 60 40 50 20 40 10 90 20 60 30 90 50 70 20
The effects of changing physical sensor temperature on the sensor sensitivity are corrected with the RTS measurement using the procedure outlined in previous paragraphs. However, if the effects of engine head temperature need to be investigated, direct comparisons should only be made with an arrangement that results in similar ‘system’ temperature differences i.e. temperature difference between sensor and engine head (Table 3). Initially, the results for different fuels are compared using the same experimental conditions and only then are results for different conditions analysed relative to one another.
Data Acquisition: The amplifier’s voltage signal was digitised using a LABVIEW®- based system with a sampling rate equivalent to the clock source of the crank-shaft encoder i.e. 45 kHz, or once every 22.2 μs (0.2° CA/sample) at 1500 RPM. For each test condition 200 consecutive cycles of data was recorded for four channels, cylinder pressure, a cycle TTL marker, the HFS signal and the RTS signal. To process the large amounts of data generated by such a large test matrix, a processing routine was written in MATLAB to batch process multiple files and perform read/write operations to simultaneously (a) correct the in-cylinder pressure signal with intake BDC pressure as the pegging pressure, (b) take the raw data and apply the necessary corrections using equations 1–3 and (c) calculate the following cycle statistics: mean, standard deviation (or Root Mean Square, RMS), as well as the Coefficient Of Variation, COV = RMS/Mean. Other routines were written as necessary in order to process the corrected data to extract detailed information for particular locations in the cycle, for example the maximum and minimum heat fluxes produced on a cycle-by-cycle basis and the corresponding statistics for these as well as the timings of peak heat flux during the cycle and corresponding statistics.
Baseline Heat Flux: The effects of spray formation and in-cylinder flow fields on the levels of wall impingement were investigated by performing a sweep of sensor locations around the cylinder bore. The sensor locations were chosen to be in 10° increments as this corresponded to ~7 mm arc lengths, close to the sensor face diameter of 6.4 mm. As such, each new and incremental sensor location effectively moved the sensor along the circumference by about one face diameter, so that effectively 100% of the cylinder bore surface area was covered in each location sweep performed for all conditions investigated.
The heat flux signal generated for each of the sensor locations around the cylinder bore under motoring conditions at 1500 RPM without injection is shown in Figure 17. Heat flux is seen to be fairly flat for most of the intake stroke except during the initial valve opening period due to the slight negative overlap with the valve timings used (Table 1). During compression the signal rises to reflect positive heat flow to the sensor face due to the increase in temperature of the in-cylinder mass. This signal

Figure 17. Mean Heat Flux Traces for Multiple Sensor Locations over Full Cycle without Injection, Engine Head at 20 °C and Cylinder Liner at 50 °C. rise can be seen to have two distinct peaks. The first peak occurs at ~320° CA ATDC where the piston position is ~2 mm vertically above the centre of the sensor face and the second occurs just before compression TDC, or at ~355° CA ATDC of intake. The expansion stroke results in a slight negative dip due to small amounts of blow-by typical with optical engines. The second positive peak occurs after EVO as the piston gradually rises towards TDC.
The heat flux trace was very repeatable on a cycle-by-cycle basis for motoring conditions without injection. The variations between sensor locations were also very small, as illustrated by the 15 signals falling on top of each other in Figure 17 to form a single line, especially during the region of interest in the early intake stroke and showing a noticeable change only during compression where results are not currently being sought.
Figure 18. Mean Heat Flux Traces for Multiple Sensor Locations over Full Cycle with Injection, Engine Head at 20 °C and Cylinder Liner at 50 °C.
Figure 19. Mean Heat Flux Traces for Multiple Sensor Locations from SOI to BDC, Engine Head at 20 °C and Cylinder Liner at 50 °C.
The recorded heat flux for a sweep of locations for motoring conditions with injection is shown in Figure 18 and also zoomed in the intake stroke in Figure 19. The steep negative heat flux results from direct impingement of liquid on the sensor face and maximum values can be seen to occur at the 40° bore location. In comparison to the motoring trace without injection, the higher negative dips around 500° CA ATDC are seen to occur only for sensor locations with high peaks of heat flux in the intake stroke, suggesting the presence of a fuel film on the sensor face at EVO which results in heat flow out of the sensor as a result of extra cooling. With reference to Figure 16, the heat flux signals in Figure 19 summarize the trends of impingement on the different locations around the bore.
The recorded values and timings of peak heat flux during the intake stroke for all locations will be analyzed in isolation in the following sections to allow relative differences in the magnitude of the heat flux signal to be appreciated. Since the period of interest in the cycle was any potential direct wall impingement just after injection, the results in the following sections are presented as averaged absolute values of peak heat flux recorded during the intake stroke over 200 consecutive cycles (thick bars) with superimposed corresponding levels of COV in the peak heat flux (thin bars).
Fuel Type and Temperature Effects: The calculated average values of peak heat flux at each bore location for the baseline test case of 20 °C engine head temperature and 50 °C liner temperature are shown in Figure 20 and 21 for gasoline and iso-octane, respectively. It can be observed that both fuels exhibit similar trends over most bore locations, especially in the range -20°–90°.
Gasoline appears to register a higher peak at the 40° bore location by ~18% relative to iso-octane, with the remaining locations recording relatively similar levels of

heat flux. This trend was consistently observed even when the cylinder liner was heated at higher temperatures than the baseline 50 °C temperature setting. The exact reasons for the observed behaviour of gasoline are not easy to identify but these can possibly be associated with the relative balance between the evaporation process of the lighter and heavier components present in gasoline. However, as the heat flux for locations 30° and 50° was very similar for both gasoline and iso-octane, no simple explanation can be currently provided for this and further investigations are necessary to fully explain these subtle fuel type effects. For example, high magnification imaging of spray impingement on the liner walls should reveal more details on the mechanisms involved and whether the measured levels of heat flux are mainly due to direct spray impingement or from contributions of both direct impingement and secondary atomisation/splashing.
Figure 20. Peak Heat Flux for Gasoline (Mean and COV) with Engine Head at 20 °C and Cylinder Liner at 50 °C.
Figure 21. Peak Heat Flux for Iso-Octane (Mean and COV) with Engine Head at 20 °C and Cylinder Liner at 50 °C.
The COV of peak heat flux can be used as a measure of the repeatability of the recorded signal over the 200 cycle sampling period. It can be seen that in absolute terms the levels of COV of the measured peak heat fluxes in Figures 20 and 21 are quite high, ranging from 38%–140%, which highlight the high levels of liquid impingement variability recorded by the sensor as a result of variability in the flow field, since the injection-to-injection variability has been found to be small in a quiescent pressure chamber [6]. Once again the trend is similar for both fuels, which may be expected at this temperature as spray formation and development is relatively unaffected and both sprays can be assumed to encounter a similar mean flow field over time.
An exception to the observation above appears to be the trend for the bore locations in the range between the exhaust valves (90°) and up to 120°, which exhibit increasing levels of COV for iso-octane. Analysis of the cycle-by-cycle data showed that for a very small number of cycles (about 2–4%), the recorded peak heat flux for iso-octane was significantly above the mean value of 0.25 W/cm2, with a typical value in the range ~1.5–3.5 W/cm2, that led to an increase in the COV relative to that calculated for gasoline. This was further checked by looking at the raw data for gasoline and confirming that indeed, for the acquired batch of 200 cycles, only one very high peak of ~1.5 W/cm2 was recorded, with the remainder all below 1 W/cm2, resulting in the lower COV value seen in Figure 20.
The sensor locations near the intake valves (i.e. bore locations -20°–20°) show the highest levels of COV for both fuels. This can be explained by the increased levels of spray-low interactions of spray plume 1 which by design is directed towards the incoming valve jet, thus experiencing the full effects of flow variations over the intake valves. This was confirmed by spray imaging using the full-bore Perspex piston.
The effect of fuel temperature on the magnitude of the heat flux signal was investigated by raising the engine head coolant temperature to 90 °C and using a separate cooling system to provide 20 °C cooling water to the cylinder liner and vice-versa. The effects are shown for the two imaged planes, the head gasket plane in Figure 22 and on the heat flux sensor plane in Figure 23, using the quartz piston. The spray plumes which are responsible for the wall impingement on the heat flux sensor plane, i.e. plumes 1 and 6, can be seen to widen and break up for gasoline in Figure 22 much more rapidly than at 20 °C, illustrated by the lower intensity values. The collapse of plumes 2–5 is also evident in Figure 22. For iso-octane the effect of increased engine head temperature is much less pronounced and only a slight difference in spray atomization can be observed, as a result of the increased evaporation rates at the air-fuel spray interfaces. More important is the observation that the four central plumes for iso-octane are still intact at 90 °C in Figure 23, whereas the gasoline

plumes have clearly collapsed and merged into a large area of spray ‘footprint’ in the centre of the piston window.
Figure 22. Spray Development for Iso-Octane and Gasoline with Engine Head Temperature 20 °C and 90 °C (Head Gasket Plane).
Figure 23. Spray Development for Iso-Octane and Gasoline with Engine Head Temperature 20 °C and 90 °C (Heat Flux Plane).
The initial gasoline spray tip penetration is also reduced, as mainly identified by the central plumes just about
showing in the first frame of the sequence at 7° CA ASOI. The effect of spray collapse is also recorded on the heat flux traces, as seen in Figures 24 and 25. Specifically, Figure 24 shows the measured heat flux for the combination of engine head temperature 20 °C and cylinder liner temperature 90 °C, whilst Figure 25 shows the measured heat flux for the combination of engine head temperature 90 °C and cylinder liner temperature 20 °C.
Figure 24. Mean Heat Flux Traces for Gasoline with Engine Head at 20 °C and Cylinder Liner at 90 °C (Sensor Locations -20°–60°).
Figure 25. Mean Heat Flux Traces for Gasoline with Engine Head at 90 °C and Cylinder Liner at 20 °C (Sensor Locations -20°–60°).
The effect of an engine head at 90° C was a drastic reduction in the apparent levels of impingement detection, nearly seven times less heat flux measured relative to cold head condition of 20 °C. Another detail on the heat flux trace which indicated reduced levels of impingement is the behaviour around EVO, where the negative dip is higher for the 20 °C engine head condition – similar behaviour to that identified earlier from the comparison between motoring heat flux traces with and without injection (Fig.17 and 18).
Gasoline Gasoline Iso-Octane
20 °C 90 °C 90 °CASOI 4°
ASOI 4°
ASOI 4°
6° 6° 6°
8° 8° 8°
Gasoline Gasoline Iso-Octane
20 °C 90 °C 90 °CASOI 7°
ASOI 7°
ASOI 7°
9° 9° 9°
12° 12° 12°

Figure 26. Peak Heat Flux for Gasoline (Mean and COV) with Engine Head at 20 °C and Cylinder Liner at 90 °C.
Figure 28. Peak Heat Flux for Gasoline (Mean and COV) with Engine Head at 90 °C and Cylinder Liner at 20 °C.
Figure 27. Peak Heat Flux for Iso-Octane (Mean and COV) with Engine Head at 20 °C and Cylinder Liner at 90 °C.
Figure 29. Peak Heat Flux for Iso-Octane (Mean and COV) with Engine Head at 90 °C and Cylinder Liner at 20 °C.
When the peaks of heat flux that occur after the start of injection in the intake stroke were analysed for each sensor location for cold (20 °C) and hot (90 °C) engine head conditions, it can be seen that for the low temperature conditions the trends for both heat flux and the COV of heat flux are very similar for the two fuels, as shown in Figures 26 and 27. In Figure 26, gasoline shows again a higher peak heat flux at the location of maximum impingement (40° bore location) compared to iso-octane, as also discussed earlier for Figures 20– 21.
The effect of increased engine head temperature is shown for the two fuels in Figures 28 and 29. The levels of recorded peak heat flux are significantly affected for gasoline relative to iso-octane all around the bore for the locations studied. The COV in peak heat flux for the collapsed gasoline spray is generally similar to that of the un-collapsed iso-octane for most bore locations (10°–120°), but much lower on the intake valve side (-20°–0°), implying consistently near-zero impingement for gasoline in this area
at the higher engine temperature. Details of the spray formation and development process obtained from the images in the previous section support this because the partial collapse of the gasoline spray plumes at 90 °C engine head temperature results in near total loss of forward momentum for plume 1.
For iso-octane at 90 °C engine head temperature, analysis of the cyclic data showed that although the mean heat flux was only 2.3 W/cm2 for the -10° bore location, about 4% of the cycles exhibited peak heat flux between 10–20 W/cm2 and another 8% of the cycles exhibited peaks between 5–10 W/cm2. The effect of this was a significant increase in the calculated RMS which then resulted in a much larger COV at this location. The same trend was identified for the two adjacent locations, -20° and 0°. These results show that although the mean values of peak heat flux decrease for iso-octane at 90 °C, there can still be significant fuel impingement on the cylinder wall on a cycle-by-cycle basis.

Figure 30. Timing of Peak Heat Flux for Gasoline (Mean and COV) with Engine Head at 20 °C and Cylinder Liner at 90 °C.
Figure 32. Timing of Peak Heat Flux for Gasoline (Mean and COV) with Engine Head at 90 °C and Cylinder Liner at 20 °C.
Figure 31. Timing of Peak Heat Flux for Iso-Octane (Mean and COV) with Engine Head at 20 °C and Cylinder Liner at 90 °C.
Figure 33. Timing of Peak Heat Flux for Iso-Octane (Mean and COV) with Engine Head at 90 °C and Cylinder Liner at 20 °C.
Timing of Peak Heat Flux: The average timing of the peak heat flux and corresponding COV, was calculated to further study the spray impingement at each bore location, for the 200-cycle batch acquired for each test case. The timing of fuel arrival on the cylinder walls is shown for all the sensor locations in Figures 30–33. The results suggest that gasoline and iso-octane behave similarly at 20 °C and appear to experience similar flow interactions which result in nearly identical timings of peak heat flux in Figures 30 and 31. Once again the effect of temperature on spray development for gasoline and iso-octane is demonstrated in Figures 32 and 33, where iso-octane shows at 90 °C timings of impingement similar to those at 20 °C for bore locations -20°–80°, whereas gasoline shows a consistent increase on the order 5°–15° CA for all bore locations in the range -20°–80°. The delayed timing of peak heat flux at the extreme bore locations 90°–120° for both fuels at 90 °C was analysed by examining the cyclic data. It was found that although low levels of average fuel impingement were calculated for these locations, with no clearly defined peak of heat flux, the raw data showed a large scatter in the
timings of small peaks on a cycle-by-cycle basis, resulting in delayed timings of fuel impingement. The values of COV in the timing of peak heat flux can be a direct measure of flow-field effects on the spray. These are seen to be very similar in both magnitude and trend for the two fuels at 20°. For 90 °C, the COV of timing of peak heat flux was generally higher (particularly for gasoline), except for the bore locations 100°–120°.
Injection Strategy: A multiple injection strategy was used to investigate the effectiveness of shortening the injection pulse on reducing overall gasoline penetration distances and improving the overall mixture preparation quality. Such strategies are becoming possible with current injector technologies and their potential benefits have been recently reported in the literature [19]. The injection pulses used were very small and approached the limit of the capabilities of the current injection hardware. Three short pulses (0.25 ms, 0.28 ms and 0.25 ms) were used in sequence with a dwell time of 10° CA and start of first injection at 60° CA ATDC. The spray plumes produced can

be seen at a timing just prior to the end of each injection for all three injections in Figure 34.
The effect of multiple injections on liquid impingement is seen to be very significant, even at 20 °C engine head temperature, by comparing the heat flux signal shown in Figure 35 to that shown earlier for single injection at the same conditions in Figure 18. The magnitude of the signal is reduced by up to 5 times for the triple injection case compared to the single injection case at the locations of maximum impingement. Although levels of impingement are clearly lower, the heat flux sensor can be seen to record the arrival of liquid from the three separate injections at the 40° location, as indicated by the three increasing peaks of heat flux between 60° CA and 120° CA ATDC. The effects of multiple injections on liquid impingement are seen to be comparable to the effects of raising the engine temperature to 90 °C for single-injection strategy. The peak heat fluxes in Figure 36 also show good agreement with the effects observed from increased engine head temperature, both in terms of magnitude and COV (only locations -20°–0°, 20°–60° and 90° were sampled for triple injection).
Figure 34. Gasoline Spray Images for Triple Injection (Head Gasket Plane): 5° CA ASOI, Engine Head 20 °C.
Figure 35. Mean Heat Flux Traces for Gasoline with Triple-Injection Strategy, Engine Head at 20 °C and Cylinder Liner at 50 °C (Sensor Locations -20°–60°).
Figure 36. Peak Heat Flux for Gasoline (Mean and COV) with Triple-Injection Strategy, Engine Head at 20 °C and Cylinder Liner at 50 °C.
CONCLUSIONS
An extensive spray imaging investigation was carried out for different in-cylinder planes to characterize the spray development from a multi-hole injector with injection pressure 150 bar and to study liquid fuel impingement on in-cylinder surfaces in a running DISI engine. The behaviour of gasoline and iso-octane sprays were compared for engine temperature of 20 °C and 90 °C under motoring conditions at 1500 RPM and 0.5 bar intake pressure. The use of a full-bore optical Perspex piston [14] allowed visualization of the full cylinder bore as opposed to the typical 60–70% bore areas possible using standard piston-crown quartz-window inserts in optical engines. This piston allowed the spray plumes to be tracked from the beginning of injection through to the extremes of the cylinder bore to identify potential locations of wall impingement.
Fast-response heat flux sensors were mounted on the cylinder liner in the ring reversal region, 17 mm below TDC position, to detect liquid fuel impingement observed from the parallel spray imaging investigation. Fuel type and temperature effects were quantified in terms of the levels of heat flux signal recorded. A multiple injection strategy using three split injections of smaller amounts of fuel, but maintaining the overall injected mass the same as for single injection, was investigated to assess its effectiveness in reducing the levels of wall impingement.
The conclusions of this study may be summarized as follows:
• The spray produced from a high-pressure multi-hole injector can be affected by the intake flow over the valves as soon as 5° CA ASOI for injection timings during the intake stroke, even under part-load conditions and is seen to depend on the angles of
1st Injection 2nd Injection 3rd Injection

interaction between the flow field and the spray plumes, which define the momentum balance between flow and spray. The particular orientation of one plume pair (nozzle holes 1 and 6) for the tested injector showed that they were particularly sensitive to such effects for injection timings coinciding with the highest flow velocities over the intake valves. This had a clear effect on the plume directionality and break-up compared to that observed under quiescent conditions or for the other plume pairs under the same conditions.
• Spray plumes 2–5 were found to be more robust to flow effects than plumes 1 and 6 showing no visible deviations from the theoretical cone angle in the vertical injector axis, although the presence of in-cylinder flow increased air entrainment into the individual plumes and reduced the break-up length, indicated by recirculating vortices seen at the spray tips at ~10° CA ASOI.
• The dominant influence of engine-head temperature on spray development (20 °C vs. 90 °C) was confirmed for gasoline, as the latter is significantly affected when the fuel temperature is raised significantly above that of the lowest boiling point components. No such effects were seen for single-component iso-octane since the fuel temperature never reached its boiling point.
• Direct impingement locations were identified on the cylinder liner close to the ring reversal region and on the piston crown for part-load motoring operation. Heat flux sensors installed in the cylinder liner at these locations showed similar behaviour for gasoline and iso-octane at 20 °C engine head temperature. At 90 °C though, at the liner location of maximum spray impingement, iso-octane showed a reduction in the peak heat flux signal of about 15%, whilst for gasoline the reduction was nearly 85% at as a result of significant spray collapse.
• The trend of the coefficient of variation in the peak heat flux recorded for different locations around the cylinder bore was nearly identical for iso-octane and gasoline at 20 °C engine head temperature, with values varying by only 2–3%. At 90 °C the trends were again similar for both fuels, although the values for iso-octane were lower for most sensor locations except for those closer to the intake valves, which showed very high levels of cyclic variability. This was due to just a few cycles producing much higher levels of impingement than the mean, shifting the standard deviation over the 200-cycle batch analysed.
• The timings of peak heat flux were similar for gasoline and iso-octane with 20 °C engine head temperature. However, at 90 °C the spray collapse for gasoline resulted in delayed spray impingement by nearly 5° CA
in comparison to non-collapsed conditions, a nearly 33% increase in the time taken for fuel to be detected by the sensors on the liner walls ASOI.
• The coefficient of variation in the timing of peak heat flux was similar for gasoline and iso-octane with 20 °C engine head temperature, but generally higher for gasoline at 90 °C. The latter was found to be a result of the very low levels of heat flux that registered with the collapsed gasoline sprays at 90 °C in comparison to those of iso-octane and to the levels recoded for both fuels at 20 °C engine head temperature.
• A triple-injection strategy was used with gasoline at 20 °C engine temperature conditions and this was found to result in reduction of the heat flux signal by about 80% compared to typical single-injection strategies. The reduction is comparable to the effect of increasing the engine temperature from cold to fully warm conditions, suggesting that this injection strategy can be a likely candidate for cold-start engine operation to reduce the levels of impingement and potentially smoke and un-burned hydrocarbon emissions before engine warm-up.
Future work will concentrate on performing optical measurements and heat-flux experiments under firing engine conditions and enabling high magnification imaging of the fuel injection process to determine in detail the mechanisms involved during spray formation and flow interaction, wall impingement and after impingement.
ACKNOWLEDGMENTS
The authors would like to thank Roger Cracknell and Harold Walmsley at Shell Global Solutions (UK) Ltd. for fuel supplies, technical and financial support and Jaguar Advanced Powertrain Engineering for injector supplies and continued technical and financial support, as well as the Engineering and Physical Sciences Research Council (EPSRC) in the UK for financial support under grant GR/S58850/01.
REFERENCES
1. Li, J., Huang, Y., Alger, T.F., Mathews, R.D., Hall, M.J., Stanglmaiser, R.H., Roberts, C.E., Dai, W. and Anderson, R.W., “Liquid Fuel Impingement on In-Cylinder Surfaces as a Source of Hydrocarbon Emissions from Direct Injection Gasoline Engines”, Journal of Engineering and Gas Turbines and Power, Vol. 123, pp. 659–668, 2001.
2. Zhao, F., Lai, M.C. and Harrington, D., “Automotive Spark-Ignited Direct Injection Gasoline Engines”, Progress in Energy and Combustion Science, Vol. 25, pp. 437–562, 1999.
3. Aleiferis, P.G., Taylor, A.M.K.P., Ishii, K. and Urata, Y., “The Nature of Early Flame Development in a

Lean-Burn Stratified-Charge Spark-Ignition Engine”, Combustion and Flame, Vol. 136, pp. 283–302, 2004.
4. Aleiferis, P.G., Taylor, A.M.K.P., Ishii, K. and Urata, Y., “The Relative Effects of Fuel Concentration, Residual Gas Fraction, Gas Motion, Spark Energy and Heat Losses to the Electrodes in a Lean-Burn Spark-Ignition Engine”, Journal of Automobile Engineering (Proceedings of IMechE, Part D), Vol. 218, pp. 411–425.
5. Aleiferis, P.G., Hardalupas, Y., Taylor, A.M.K.P., Ishii, K. and Urata,Y., “Flame Chemiluminescence Studies of Cyclic Combustion Variations and Air-to-Fuel Ratio of the Reacting Mixture in a Lean-Burn Stratified-Charge Spark-Ignition Engine”, Combustion and Flame, Vol. 136, pp. 72–90.
6. Van Romunde, Z. and Aleiferis, P.G., “Effect of Operating Conditions and Fuel Volatility on Development and Variability of Sprays from Gasoline Direct Injection Multi-Hole Injectors”, Atomization and Sprays, in Press, 2007.
7. van Romunde, Z., Aleiferis, P.G., Cracknell, R. and Walmsley, H., “Effect of Fuel Properties on Spray Development from a Multi-Hole DISI Engine Injector”, SAE 2007 Powertrain & Fluid Systems Conference and Exhibition, October 29–31, Chicago, USA, Paper 2007-01-4032, 2007.
8. Serras-Pereira, J., Aleiferis, P.G., Richardson, D. and Wallace, S., “Mixture Preparation and Combustion Variability in a Spray-Guided DISI engine”, SAE 2007 Powertrain & Fluid Systems Conference and Exhibition, October 29–31, Chicago, USA, Paper 2007-01-4033, 2007.
9. Mitroglou, N., Nouri, J.M., Yan, Y., Gavaises, M. and Arcoumanis, C., “Spray Structure Generated by Multi-hole Injectors for Gasoline Direct-injection Engines”, SAE Paper 2007-01-1417.
10. Skogsberg, M., Dahlander, P, Lindegren, R., Denbratt, I., “Effects of Injector Parameters on Mixture Formation for Multi-Hole Nozzles in A Spray-Guided Gasoline DI Engine”, SAE Paper 2005-01-0097, 2005.
11. Nauwerck, A., Pfeil, J., Velji, A., Spicher, U., and Richter, B., “A Basic Experimental Study of Gasoline Direct Injection at Significantly High Injection Pressures”, SAE Paper 2005-01-0098, 2005.
12. Jarvis, S., Justham, T., Clarke, A., Garner, C.P., Hargrave, G.K., Richardson, D., “Motored SI IC Engine In-Cylinder Flow Field Measurement Using time Resolved Digital PIV for Characterisation of Cyclic Variation”, SAE Paper 2006-01-1044, 2006.
13. Lee, C.S. and Reitz, R.D., “Effect of Liquid Properties on the Break-Up Mechanism of High-Speed Liquid Drops”, Atomization and Sprays, Vol. 11, pp. 1–19, 2001.
14. Ma, H., Steven, R., Marshall, S., Wang, X. and Stone, R., “A Full Bore Bowditch Piston Imaging System with Digital Control, Capture and Image Processing”, SAE
World Congress and Exposition, April 14–17, 2008, Detroit, USA, Submitted Abstract, 2007.
15. Vatell Corporation HFM-7, Heat Flux Sensor Documentation and Manuals, 2004.
16. Taylor, G., “Measurement of Liquid Fuel within the Cylinder of a Spark-Ignition Engine”, PhD Thesis, University College London, University of London, 2005.
17. Ioannou, M. and Nightingale, C.J.E., "Application of Heat Flux Sensors to Detect the Presence of Liquid Fuel on the Cylinder Wall of a Firing SI Engine", SAE Paper 2000-01-2841, 2000.
18. Beyrau, F., Weikl, M.C., Schmitz, I., Seeger, T. and Leipertz, A., “Locally Resolved Investigation of the Vaporization of GDI Sprays Applying Different Laser Techniques”, Atomization and Sprays, Vol. 16, pp. 319–330, 2006.
19. Stach, T., Schlerfer, J. and Vorbach, M., “New Generation Multi-Hole Fuel Injector for Direct-Injection SI Engines – Optimisation of Spray Characteristics by Means of Adapted Injector Layout and Multiple Injections”, SAE Paper 2007-01-1404, 2007.
ABBREVIATIONS
ATDC After intake Top Dead Centre ASOI After Start Of Injection BDC Bottom Dead Centre COV Coefficient Of Variation EOF End Of Fuel EVC Exhaust Valve Closure EVO Exhaust Valve Open IVC Intake Valve Closure IVO Intake Valve Open PIV Particle Image Velocimetry RMS Root Mean Square RPM Revolutions Per Minute SOI Start Of Injection SOF Start Of Fuel CONTACT
Author for correspondence:
Dr. Pavlos Aleiferis Department of Mechanical Engineering University College London Torrington Place London WC1E 7JE United Kingdom E-mail: [email protected]