Embed Size (px)
Citation preview

THE ADOT ALTERNATIVE FUELS STUDY
October 1,1989

CONTENTS
...................................................................................... EXECUTIVE SUMMARY lii
. I INTRODUCTION ........................................................................................... 1 A . House Bill 21 15 ....................................................................................... 1 B . Senate Bill 1360 ....................................................................................... 1 C . House Bill 2206 ........................................................................................ 2
II . PROGRAM DESIGN ..................................................................................... 3
A . Pilot Study ................................................................................................ 3 B . Driveability Study .................................................................................. 6
Ill . IMPLEMENTATION ..................................................................................... 7
IV . RESULTS ...................................................................................................... 9 A . Drlveabilliy ............................................................................................ 9 B . Mileage ................................................................................................... 10 C . Emissions .............................................................................................. 10 D . Cost ........................................................................................................ 13
APPENDIX
I . Summary of Problems for Controlled Test Vehicles ............................................................................................................... 4
II . Analysis of ADOT Emissions Study .......................................................... 46
Ill . DEQ Emissions Analysis .......................................................................... 113
. IV Mechanics Report .................................................................................. 125
V . Vehicle and Fuel Type ............................................................................. 137
LIST OF TABLES
I . Vehicle I.D. Numbers by Fuel Type ............................................................. 4
I1 . Mileage Comparisons ................................................................................ 11

EXECUTIVE SUMMARY
The Arizona State Legislature in 1987 passed several comprehensive clean air bills. Two of these bills, House Bill 21 15 and Senate Bill 1360, mandated that the Arizona Department of Transportation conduct a pilot program on portions of the ADOT fleet. The purpose of this propam was to determine the cost of maintaining a vehicle operating on clean-bumg fuel, the effect on the miles per gallon of these vehicles, the availability of clean-burning fuels, and the impact of these fuels on motor vehicles emissions. This program was extended for a second year under H.B. 2206, (1988).
The department selected ninety vehicles for the pilot program. Three maintenance camp fueling facilities in Phoenix and one in Tucson were converted to dispense an ethanol blend, a methanol blend, and an MTl3E blend. In addition, other selected vehicles were converted to compressed natural gas and propane. Contracts were made with appropriate vendors for a supply of fuel.
In the test period detailed records were kept regarding each of the selected fuel types. Based on this test several findings were determined.
There were no reported cases of vehicle failure, no cases of plugged fuel filters, and no fuel hose deterioration documented as a result of using any of the test fuels. One exception was the methanol blend when the fuel quality deteriorated due to lengthy stora e. There was no indication in the mileage comparisons that an particular f fuel ad a significant advantage throughout the entue range of ve icles. No conclusions as to fuel efficiency were evident from the data collected.
i:
There were no increased maintenance costs directly related to the use of alternative fuels. While there was no significant difference found in tailpipe emissions for the various fuel types, except for CNG, and except for an overall increase in emissions of oxides of nitrogen, it should be noted that statistical significance is influenced by a number of variables. In this pilot project, these variables include vehicle type, vehicle use, maintenance practices, fuel type, ambient temperature conditions, and unique vehicle operating characteristics. Given the presence of this range of variables, the lack of statistical significance is not considered unusual in a test of this complexity.
The differences in results obtained in the ADOT Field Test and the DEQ Laboratory Tests resented in Appendix III are not unusual and in, fact should be H expected. The D Q testing procedure was designed to detect changes in emissions during vehicle operatin cles which could not be examined in the testing procedures used by ADO %.%ese more so histicated rocedures became available P P to state researchers only after the DEQ aboratory acilities were completed in February, 1989, and almost 1 112 years after the fieId test was started.

ADOT ALTERNATIVE F'UELS STUDY
In 1987, during the first regular session of the 38th legislature, several bills were passed pertainin to the broad sub'ect of clean air. Additional legislation requiring continued ADO f involvement in & e fleet and emissions testing of clean-burning fuel was passed in the second session of the 38th legislature.
HOUSE BILL 2115
One of these bills, House Bill 2115, mandated that the Arizona Department of Transportation undertake a ilot rogram to test certain clean-burning fuels in part of ADOTs fleet. A.R.S. 41-!083.b., Sec. 3 was added and reads as follows:
Sec. 3. p e ~ a m e n t o f tramuortation pilot proiect on clean-buminn -fuels: re~ort; definition A. The department of transportation shdl conduct a pilot project to determine the cost and effect of using clean-burning fuels in motor vel~icles. The department sliall designate certain department of transportation motor velzicles wlricit will be operated with clean-burning fuels and monitor the motor veiiicles to determine, among other
1. rhiy he cost of maintaining a motor vehicle operated with clean-bumingjirel 2 The effect of the miles pergallon of a motor veiricle operated with clean-burning
fuels. 3. The availability of clean-burning fuel 4. The impact of clean-burningfuels on motor vehicle emissions. B. Tile department shall submit a' report of its findings to the president of the senate and the speaker of the house of representatives on or before October 1, 1988. The report shall include a recommendation on the feasibility of using clean-buming fuels in public or private motor vehicles on a local or stateside bask. C. For the purpose of thk section, '%lean-burning fuels" includes compressed natural gas, liquid propane gas or a blend ofgasoline and ethyl alcohol or methyl dcoitoL
SENATE BILL 1360
A companion bill to H.B. 2115 was the corn rehensive Clean Air legislation E contained S.B. 1360. Among other things, t e bill mandated that the Department of Transportation carry out certain driveability studies. Section 32 states, in part that:
The sta!c..shall conduct a srudy of ten percent of their non-diesel..vehicle fleets operating in non-attainment areas... to determine how these vehicles perform in respect to driveability, h g clean-burning frrelr... Vehicles chosen slid1 be representative of the entire respective fleet.

Each Study shall be conducted for a one-year penend beginning October 1, 1987. The depattment shaU submit a report of the findhgs to the president of the senate and the speaker of the house of representatives on or befire November 1,1988
HOUSE BILL 2206
This legislation, which became effective in June of 1988, required the Department of Transportation to conduct a ilot roject and fleet study on the use of oxygenated
?%I g. and other clean-burning fuels. s dl states, in part, that:
A. The department of transportation shall conduct a project to determine the cost and effect of using oxy enated fuelr, compressed natural gas and liguified propane gas in motor vehicles. f i e department shad designate certain department of tramportation motor vehicles to determine, among other thlngs: 1. The cost of maintaining a motor vehicle operated with such fuels. 2 The effect on the miles per gallon of a motor vehicle operated with such fuels. 3. The avaiZability of such &Lr. 4. The impact of such fuels on motor vehicle emissions. B. In conducting the project prescribed by sub section A of this section the department shall test compressed natwd gas, liguified propane gar, blends o gasoline with
t f methanol, blendr of gasoline with ethanol and blends o gasoline wit methyl tertiary butyl ether in order to evaluate the impact of such fue on motor vehicle emissions. The department shall select the number and type of vehicles tested pursuant to this section in such a manner as to produce scientifcalIy and stdcalZy valid results. Fuels used shall be analyzed with respect to all properties specifid in section 41-2083. The department of environmental quaIity pursuant to section 49-553 shall conduct the emissions testutg required by this section C. The department shall coordinate all testing done under section 49-405 to ensure that information is gathered and reported on a uniform and scientificdZy sound basis. Tlae department shall adopt rules to govern the testing in accordance with the standards set forth in this section D. The department shall gather and report information showing the amounts and types of oxygenated fuels which are being sold or used within this state and shall report the information as provided in subsection F of this section E. The department may hire consultmrts in order to design, execute and coordinate the tests required by subsecttons B and C of this section F. The department shall submit reports of its studies and findin s under this section and the information reported pursuant to sections 49-405 and 49-4 d 6 to the president of the senafe, the speaker of the house of representatives and the air quality compliance advkory committee established wsumrt to section 49-403 on or before October 1, 1988 and on or before October 1 o L h year thereafrer. The department shall report the information required by subsection D of this section to the president of the senate, the speaker of the house of representatives and the air Quality compliance adviiory committee established pursuartl to section 49-403 each month commencing at the end of the third month afrer the month in which thk section becomes effective
The remainder of this report contains information relating to the design of the pilot program, implementation of the rogram, and the results derived from the tests. %, Also included are results of the veability study.
2

11. PROGRAM DESIGN
The design of the pilot ro am was established through a series of meetings within various sections of &f with legislators and other interested parties in the private sector. Assistance in the develo ment of the program was also obtained P through a contract with a statistical consu tant. The program was designed in order to minimize the effect on ADOTs nonnal o erations and still provide appropriate
l? data on mileage, maintenance costs, driveabi ty and exhaust ermssions.
PILOT STUDY
The following seven points sequentially describe the procedures used in ADOTs program of vehicle testing:
1. The following five types of alternative fuels were selected for the pilot program:
Ethan01 Blend
Methanol Blend
Methyl Tertiary Butyl Ether Blend (MTBE)
Compressed Natural Gas (CNG)
.Propane (LPG)
2. Test vehicles were selected so that identical groups (vehicle make, model and year) could be assigned to each of the five test fuels. Six different grou s of vehicles were selected, and three different vehicles of each model were assigne f to each fuel. There were 90 test vehicles with 18 vehicles tested on each of the five fuels. (The results of this selection process are shown in Table I.)
3. Three li uid-type fueling stations at ADOT maintenance yards in the \ metropolitan P o e m are were selected for dispensing the three liquid alternate fuel blends. Contracts were ne otiated with sup lien of propane and compressed natural as to provide these els, because fa ties for stomg and dispensing the 'f t fuels di not exlst at ADOTs facilities.
& 4. Each group of 18 vehicles was assigned to a fueling site and to a type of fuel.
5. Each vehicle used in the test was tuned to factory s ecifications and operated in normal service for a three-month period. This was a one, using unIeaded fuel, to establish comparative baseline data on miIeage, emissions and dnveability. Monthly emission tests and daily log sheets completed by the vehicles' operators were the primary data sources.

.. .I. . ..
TABLE I
t - - . . . ...
Fuel Type 1 1
( Vehicle ~ y p e l Type I Type I1 Srpe I11 Type IV T-YPe V
Type C
Type D
-.
Type E
Type f
V e h i c l e ID#'s B328, B347, B353, B416, B418 to f u e l at d i f f e r e n t alternate f u e l pump each time.
I VEHICLE ICENTIFICATION NUMBERS BY F'UEL TYPE
6. After the three-month baseline period, the three ADOT fueling sites were converted to clean-burning fuel. Eighteen vehicles were converted to propane, and eighteen vehicles were converted to compressed natural gas.
7. The data on emissions, fuel use, driveability, and maintenance were entered into a computer data base for use in analysis at the end of the study period.
The matrix design of the experiment was such that vehicles could be omitted without impacting the validity of the e eriment. Ideally, the data for each cell in the matrix would be available to ai 7 in statistical analysis. However, it was recognized that with 90 operators, an emissions testing lab over which the department had no control, and a number of data entry people, human errors undoubtedly would occur.
The experiment was designed to take advantage of ADOTs fueling facilities and work locations throughout the Phoenix metropolitan area. It should be clearly understood that the experiment was a field test and differs greatly from laboratory experiments within a totally controlled environment. In order to prevent rmsinte~retations of the study's design or conclusions, it is appropriate to review some thmgs this experiment was l l ~ t designed to accomplish.
First, the e eriment used on1 vehicles available within the existing ADOT fleet. Therefore, ? t e vehicles are 19 ll 0 or newer, of American make, and are maintained under a fleet maintenance program. This group of vehicles should not be viewed as representative of the general fleet of privately-owned vehicles in Arizona.
Second, the ADOT vehicles were used as the normally are in ADOTs everyday work environment. This environment is not d e same as that for vehicles used in commuter traffic or in other uses commonly associated with private vehicles in the metropolitan area.
Third, no effort was made to duplicate maintenance practices which might commonly occur to privately-owned vehicles.
Fourth, the experiment was designed primarily as a field test. Laboratory emissions test were performed on a select grou of the test vehicles as a means to verify the
other than a field evaluation. P field observations. Overall, the resu ts of this study should not be interpreted as

DRIVEABILITY STUDY
The expanded driveability stud basically utilized the same daily lo information produced in the more controlle d' test of the pilot study. In addition, i f ormation was obtained from all vehicles using one of the three fueling stations dis ensing clean- burning fuel. To obtain an even wider utilization, part of the fueling ! acility located at the Grant Road maintenance camp in Tucson was converted to clean-burning fuel, and data was collected from all vehicles utilizing this facility.
Fuel usage by this lar e and diverse group was consistent with expectations of such a field test. Occasional k y, operators would use conventional fuel; and conversely, state vehicles from other localities occasionally would be filled with test fuel. This added a dimension to the program which was not designed but which has not been discouraged.
The vehicles were operated during the three-month baseline period on gasoline, and the drivers completed daily log sheets throughout the period. Without this baseline period, no valid comparisons of the vehicles' performance could be made.

m. IMPLEMENTATION
After completion and acceptance of the rogram's design, work started on the identification of vehicles and fueling sites. yn order to minimize the impact on the normal use of vehicles, fueling sites were identified first. Three sites were selected in the Phoenix metropolitan area: Duran o, West Georgia and Recker Road. In addition, the Grant Road maintenance yar f was selected in Tucson.
Existing vehicle usage was next analyzed, and vehicles were identified which would use the respective fueling sites throughout the study period. Those vehicles which would be converted to either propane or compressed natural gas were also identified. These vehicles were gven a status code identifier to allow their activity to be traced through the computer system located within the ADOT Equipment Section. All fueling, maintenance and mileage data were traced both through the daily log sheets completed by the drivers and through the Equipment Section's computer records.
When the fueling sites were identified, the baseline testing procedure began. Daily were desi ed and printed, arrangements were made for emissions P testin driver's wi lop$. Hamilton est facility on 7th Street, and meetings were held at various
ADO$ 1 ocations to familiarize drivers and supervisors with the testing program and to solicit their cooperation
All 90 of the pilot study's vehicles were tuned to factory specifications for the purpose of gathering baseline data on unleaded asoline. While this process was
&, B ongoin , preparations continued for the testing o the clean-burning fuels. Each of
the fue ' g facilities were analyzed to determine the compatibility of the tanks and dispensin equipment with oxygenated Necessary fuels. Repairs or alterations were made an a by md-December each fueling facility was ready to handle the test fuels.
Next, bid sheets were prepared by ADOT Purchasing to acquire the gasoline blends and arrangements were made to purchase propane on an as-needed basis from several suppliers. A contract was negotiated with Southwest Gas to obtain the needed compressed natural gas.
The bid process for the gasoline blends proved somewhat disappointing when ody three finns responded with offers to sell the ethanol blend, two responded to furnish the MTBE blend and no one responded regarding methanol. Because the first bid call s ecified an oxinol blend for methanol, it was decided tci t y a second time with spe d cations for any blend meeting the EPA waiver. Agam, no response was received for the methanol blend.
Contracts for delive of the ethanol and MTBE blends were negotiated while 2' members of the Purc asing Department, the Equipment Section, and the Arizona Transportation Research Center contacted various su liers and producers of both methanol and blended fuels with methanol. A supp ?' y of methanol-blended fuel finally was located in Texas, and arrangements for purchase were conducted. Due to transportation costs, this fuel was relatively expensive to acquire.

Throughout this same period bidding and contracting was undertaken for the conversion of vehicles to pro ane and corn ressed natural gas. Vehicle conversion be an in mid-December 1987f)and all 36 ve cles had been converted by January 22, 19 8 8.
gi
Delivery of the oxy enated fuel with the receipt of the ethanol shipment. 'ih e MTE3E 17 and 18. Due to the difficulty in obtaining gasoline was not made on this fuel type until January 26, 1988. delive schedules, it
final analysis. =i was decided that emissions data for the month of January would not e used in the
Using emission test data starting in February ensured that no unusual or "cross- fueled data was used. Overall accuracy of the results were improved, therefore, through the elimination of possible incorrect data caused by unforeseen confusion during the transition period between baseline and oxygenated fuel.
The use of the test fuels continued through August of 1989 with monthly emissions tests bein performed throughout the period. Additionally, beginning in February of 1989, f e Arizona Department of Environmental Quality tested a representative group of vehicles in their newly commissioned emissions testing laboratory. These tests were more extensive and much better controlled than the field tests and were undertaken for comparative purposes.

W. RESULTS
Based on the data collected in the pilot program, results were determined on driveability, mileage, emissions and cost of operating the test vehicles.
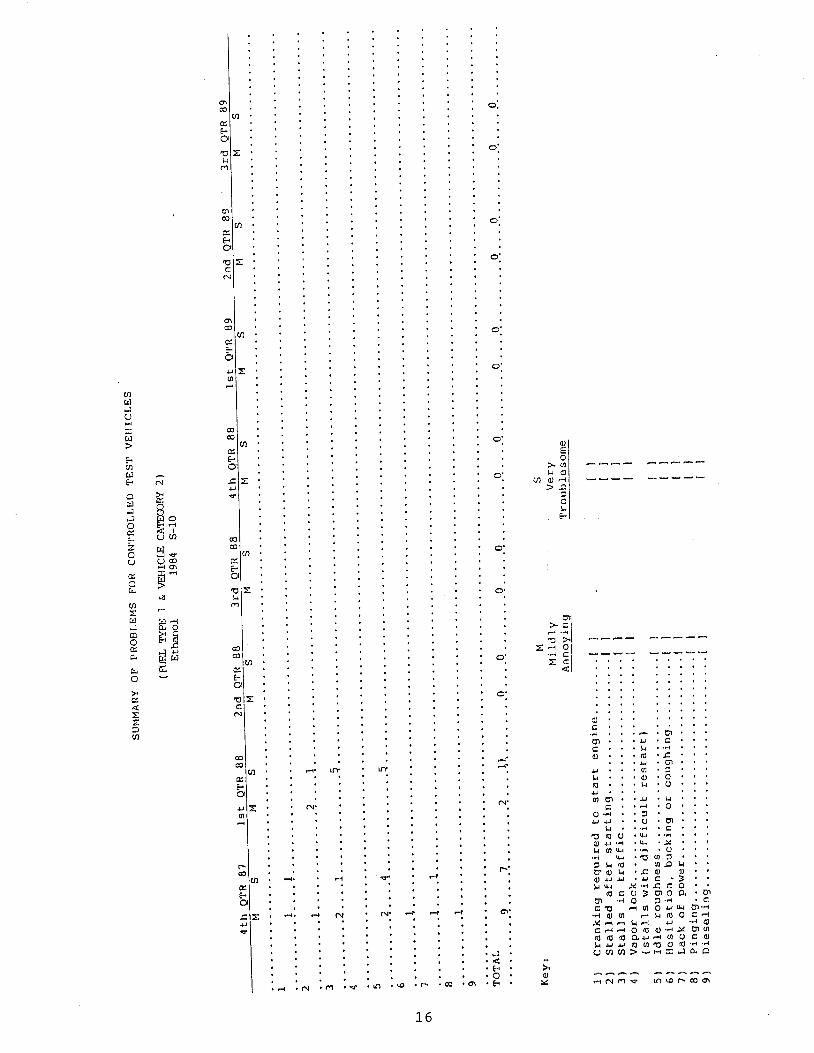
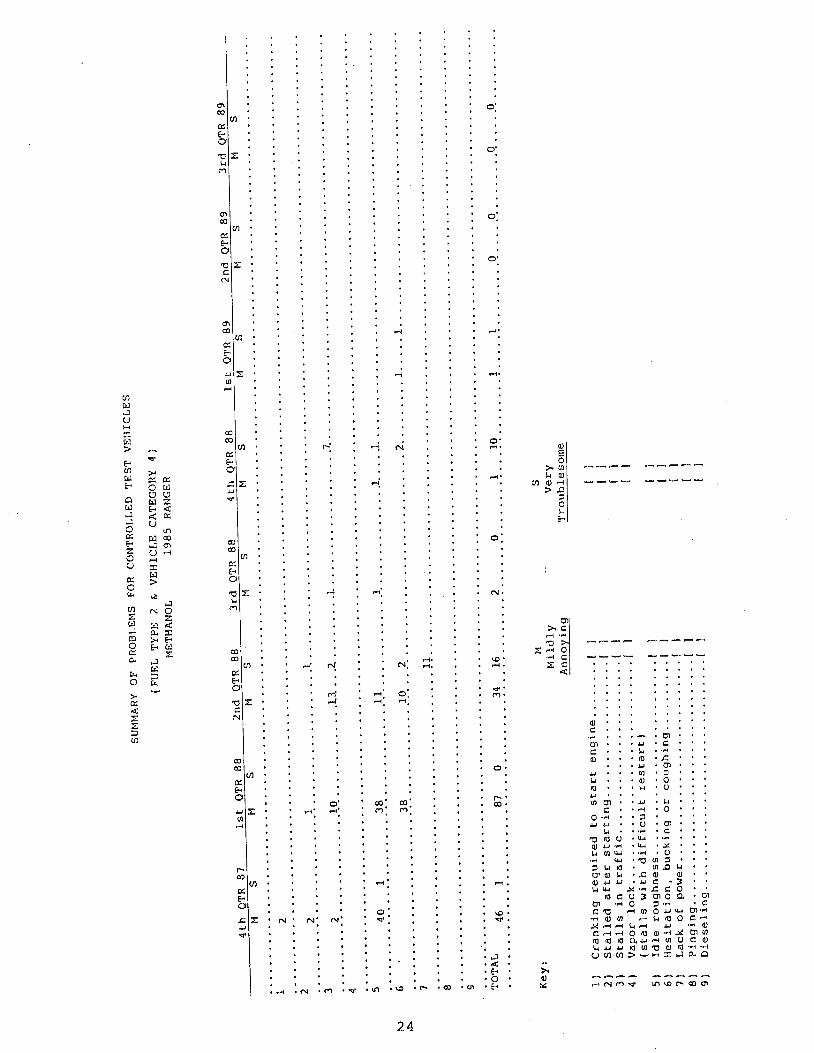
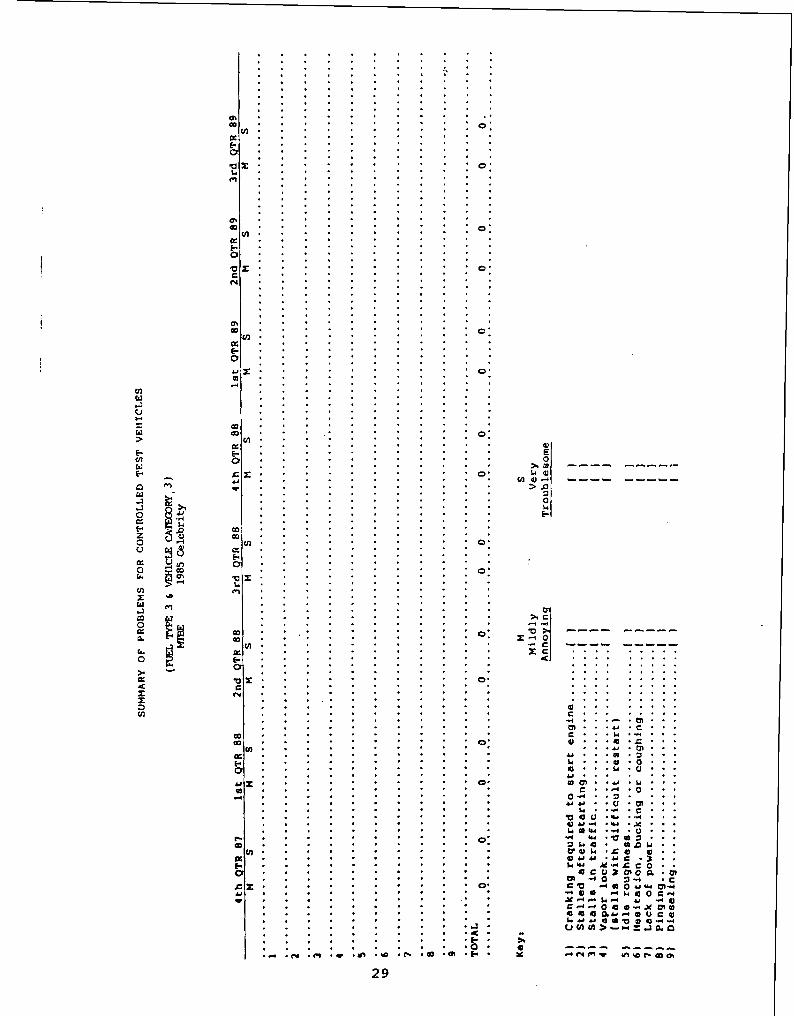
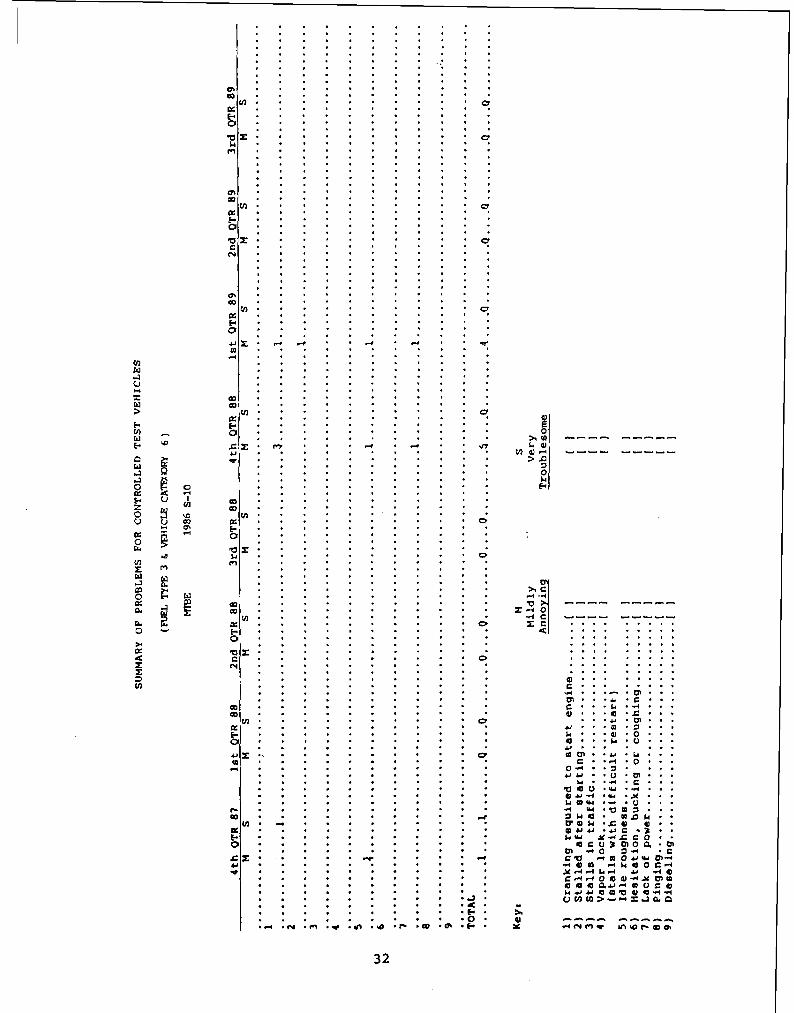
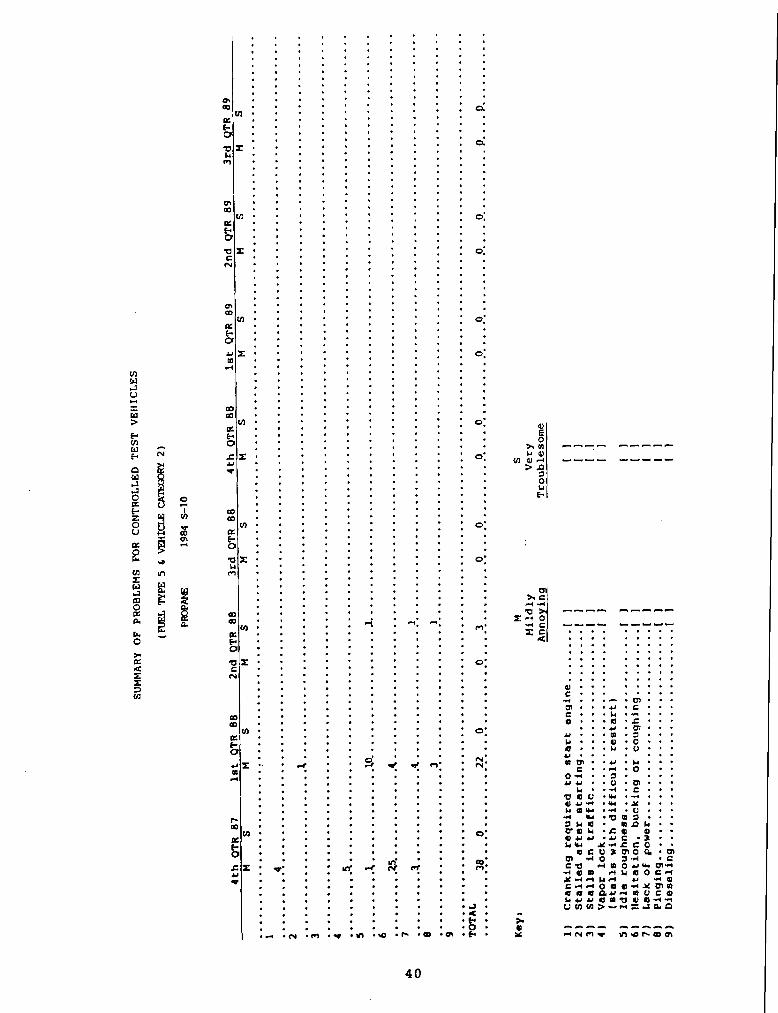
Data concerning vehicle performance was obtained from daily log sheets corn leted
symptoms commonly associated with fuel-related performance. P by drivers. These entries described the frequency and severity of each o nine
These nine symptoms are listed, and a summary of their occurrence is for both baseline and test fuel operation in Appendix 1. Note that even on the baseline unleaded fuel, some vehicles consistently report problems, although drivers did not think the severity of the condition warranted sending the vehicle to the shop for repair. This occurred with some degree of regularity among a fleet of vehicles where no financial liability accrued to the driver if the vehicle was sent to the shop for repair. How often vehicles in the privately-owned fleet might be operated with known performance deficiencies is a matter of conjecture, but due to the financial burden of repair, it is expected that such occurrences would be more frequent and of longer durauon than was the case in the ADOT fleet. This hypothesis is supported by looking at the inconvenience associated with vehicle repair m terms of lost work time, travel distance and the uncertainty of vehicle availability as a result of repairs.
During the baseline test eriod, various performance anomalies were noted for each vehicle being observed f or driveability characteristics. These were then compared to any reported problems experienced during operation on clean-burning fuel.
A major find in^ of the field studv was that there were no reported cases of totd vehicle failure. no cases of pl ed fuel filters. and no hose or elastomer detenoration documented a$ a re of us in^ anv of the test fuels during the ~eriod from Januarv 1988 through Se~ternber 1989,
- - -
The driveability records received for the test vehicles have been summarized by fuel type and vehicle category. This summary is presented in Appendix 1.
In addition to the pilot study's test vehicles, beginning in January 1988 otber vehicles operated in the Phoenix area and an additional group in Tucson operated on clean- burning fuels. Vehicles from the Phoenix facility used the same fuel blend that was available in the Tucson facility, and for simplicity of repo* all data is presented together. Ninety-eigh t supplementary vehicles regularly subnutted driveabdity logs.

MILEAGE
Durin the operation of the pilot study test program, approximately 189,000 miles were k v e n on gasoline for baseline mileage, and an additional 742,000 miles were driven on the various test fuels. The results of the com utation of miles per gallon .F for each vehicle type and for each he1 are illustrated in able 11.
There is no indication in the mileage comparisons that any articular fuel had a
f R. significant advantage over the entire ran e of vehicles. The ve lcIes reported in this study are operated as part of the ADO fleet, and any differences in mileage may be attributed to the manner in which they were operated during the course of the two year observation eriod. Therefore, the observed reduction m fuel economy on R the alternative fuels s ould be interpreted with caution.
EMISSIONS
Early in the emissions testing rogram, even while testing for baseline values, several observations were ma d' e by the investigating team. First, successive emissions test on the same vehicle often gave carbon monoxide or hydrocarbon concentrations which were different from previous readings on the same automobile. While this is not necessarily an unusual situation, it creates the potential for wide variance and therefore requires a much larger sample size for any statistical reliability.
Because the fleet of vehicles used in this study is involved in a major, ongoing construction program, there were instances when the operators were unable to bring the vehicles to the testing facility. Thus, over the two year duration of the study, it was fairly certain that all ninety vehicles would not complete the program and that others would be missing observations. Seventy-nine of the 90 test vehicles completed enough testin sequences to be used statistically. several others had B partial data but had su ficient observations to be helpful. This created some roblems for statistical comparison, because equal observations were not available or all vehicles. f
Only one testing device for nitrogen oxides was available for use. This created a condition of vulnerability; and several times during the testing sequence, the equipment failed and was out of service. This added to the problem of incomplete data and unequal cell size for the statistical analysis.
Analysis of the emission data was an extremely corn Iex undertaking due to the lack of equal cell sizes and the large variance in the 1 ata. An attempt was made to reduce the statistical variance by removing data which represented unusually large or small recorded observations. This effort resulted in a possible bias in the data because there were more unusually large observations to be removed. Also, automobiles may uccasionally operate in a high olIution mode, and to remove those observations may well generate false relia 1 ility in the data and seriously

I
Table I1
Vehicle ~~~e~ - Basel ine ALT Fuel
i 2 Y E l L D Basel ine
I ALT Fuel
Basel ine I TvDe I I
ALT Fuel
I T V D ~ D I Basel ine I ALT Fuel I
T V D ~ E 1 Basel ine I I ALT Fuel
I T V D ~ F Basel ine ALT Fuel
Appendix IV
Fuel Type 1
Type I Type I1 Type I11 Type I V Type V
MILEAGE COMPARISONS

understate automotive pollution levels when those vehicles operated under everyday driving conditions. Since the performance of alternative fuels in terms of emissions can only be evaluated in this study by analyzin the data gathered, it is important to note several factors which seem to create wi 8 e variation in the recorded emissions data and which make arriving at a definitive concIusion very difficult.
First, repetitive tests on the same vehicle are often radicdly different. This source of variation seems to come from the inherent operating characteristics of vehicles themselves.
Secondly, groups of vehicles composed of an identical mix of vehicles often exhibited significantly different test results.
Thirdly, vehicle e had a significant impact on emissions. This might be expected but since these 'T 1 80 and newer vehicles supposedly meet EPA specifications for emissions, a smaller difference between vehicle type would seem logical.
Fourthly, there was an observed seasonal variation in tailpipe emissions with the highest levels occumng during winter and mid-summer months.
In general, and as previously mentioned, definitive conclusions were difficult to formulate. However, among the alternative fuels tested, CNG performed well throu hout (with the exception of oxides of nitro en) and that performance may % baseline testing period.
B have een partly due to the rather high level o observed ermssions during the
AU fuels exhibited an increase in nitrogen oxides and it appears that a marginal reduction in carbon monoxide at idle is of average data resented in the statisticians contains a !kl analysis of the emissions over the entire testing
period.
In addition, the Department of Environmental Quality processed a subset of the ADOT test vehicles through their newly acquired emssions laboratory. Their report is attached as A endix III and supports reductions in carbon monoxide based on average data. R e data in their report also exhibits high variation in some cases and makes the ap lication of statistical methods rather difficult. Their conclusions are therefore ! ased on averaged data.
The basic distinction between the ADOT and DEQ tests stems from a difference in the time and condition under which the emission samples were gathered. The ADOT procedure basically sampled exhaust emissions under steady state idle and steady state cruise conditions. This procedure was utilized because no testing facilities were available in the Phoenix area which had the capability of performing more elaborate tests at the time the study began in October of 1987.

With the completion of the DEQ lab in 1989, the capability existed to do a limited number of tests over a simulated driving cycle. Accordingly, these simulations covered the entire ran e of driving conditions including cold starts, acceleration, cruise, deceleration an c! idle.
COST During the entire course of the Alternate Fuel Stud , every repair relating to fuel d systems of the test vehicles was identified in the quipment Section's computer system. These i t em have been extracted and are attached to the report as Appendix IV.
The uilot studv did not identify anv increased maintenance cost directly related t~ use of alternative fueb. The one-time conversion costs of the vehicles to
compressed natural gas and ropane were not considered maintenance and. the costs
omitted. 1 associated with the use of t e deteriorated methanol blend, as noted below, were
Replacement of fuel-related items such as fuel pumps and filters fre uently occur as % routine maintenance on high-mileage vehicles when a reduced fuel ow is noted in the shop testing procedure. Such a condition in a vehicle with 60,000 to 80,000 miles is not unusual; and in those instances where it did occur, department mechanics could not determine that the cause was related to the type of fuel used.
One roblem did surface with regard to the storage characteristics of the methanol blen c r tested in the pilot project. This fuel, when stored underground in a partially filled tank for a four month period exhibited a loss of vapor pressure and an increased residual gum content. Subsequent use of this fuel in some ADOT vehicles caused operational problems and gummed fuel injectors as indicated in the Appendix IV mechamcs re orts. Therefore use of this fuel blend where long term storage is likely should not g e recommended.
Because of ADOTs favorable experience with the five clean-burning fuels from both a driveability and maintenance perspective, ADOT converted the remainder of its fleet in the non attainment areas to oxygenated fueIs early in 1989. No problems have been experienced as a result of this conversion.

Appendix I.
Summary of Problems for Controlled Test Vehicles

. . . . I . . . . . . . . . . . . . . . . . . . . . . . . . . . a . . . . I . . . . I . . . . . . I .
a m . . . . . . . . . . . . . . . . ma ' . . . .
. . a . . . , . . . . a . . . . . . . . . . . . . . . . . . . . . . . . . . . . . . . . . . . . . . . . .
4. . . . . . . . . . . . . . . . . . . . . . . . . . . . . . . . . . . . . . . . . . . . . *. . . . . . . . . . . . . . . . . . . . . . . . . . . . . . Q: 0': m: . . . . . .
. . . . . . . . . . . . 1 . . . . . . . # .
. I .
I . .
, . a . . . . . . . . . , a , .
. . a * , a , . . . . . a , . . , , . . . . . . . . a . . . . . . . . . . . . . . . . . . . . . . . a . . . . . . . . . . . . . . . . . a , . . . . . . ,f,. . . . . . I .
' N' : 2: . . . . . . . . . . . . . . . . : O: . . . . . . . In- . d. . . . . . . . . . . . . . . . .
L I . . ' a! 0 . . . . b u . . .
"2::: 0 4 . - 7 U U . . 0

. . a .
. . a . . . . .
. , a .
. . a . . . . . . . . . . . . . . . . . m . . . ( I ) . . . .
a m : : : : p . . . . 0 : : " . . ;=: : : : P ) . . . . . . . . . . . . . . . . . . . . . . . .
. . . . . . . 51. C ; : -: 4: . . a
N . . . . . a , . . . . . . . . . . . . . . . . .
m . . . . ( I ) ' . m . . - : : a . . . . g : : : : . . . : . ": 00 . , r ( . . . . . . . . . . . . . . . . . . . .
. . a . Q ) . . . . ( I ) . . . . . d: : . . & . . . .
. . . O : " ' . . . Z Z : . . .
1 : ; z z : : : : m . . . . . . . . . . . . I ; : : : ( D . " . ( I ) . . . .
: : : -: * . . " Q . . . .
. . . . . . . . . . . . . . . . m . . . . ( I ) . . . .
m ' . . . a , . . . g : : : : . . . . u Z : a : r: d . . . . . . . . . . . . . . . . . . . . . . . . . . . m . . . . a m : : : : b . . . .
O : " ' . . . 2 s : : : : CI w . . . . . . . . . . . . . . . . . . . . . . . . . . . . . . . . .
.d .N .m .*

. . . . . . . . . .
. . a . . . . . . . . . . . . . . . . . . , a
1 . . . . . . . . . . . . a , . . . . . . a . . . . . . . . . . . . . . . . . . . . . . . . . . . . . . . . . . . . . . . . . . . . . . . . . a . . . . . . . . . . . . . . . . . . . . . . . . . . . . . , . . . . . . . . . a . . . . . . . . . . . . I . .
, . . . . . . . . . . , . a . . . . . . . # . . . . . . . , . . . . . , . . . . . a . . . . . . . . . . . . . . . . . , . . . . . . . . . . . . . . . . . . . . . . . . . . . . . . . . . . . . . . . . . . . . . . . . . . . . . . . . . . . . . . . . . . . . . . . . . . . . . . . . . . . . . . . . . . . . . . . . . . . . . . . . . . . . . . . . . . . . . . . . . . . . . . . . . . . . . . . . . . . . . . . N. . . . . . . . . . . . . . . . . . . * . . . . . . .P .OD .OI
I : : :
I . . .
m Q ) . . . I", I . . .
. . I . . . I : : :
. . . I . . . I . . .
. . I . . .

. . . . . . . . . . . . . . . . . . . . . . . . . . . . . . . . . . . . . . . . . . . . . . . . a " ' : . . . . . . b , . . . . . .
a : : : : : : :
. . . . . . . . . . . . . . . . . . . . . . . . . . . . . . . . . . . . . . . . . . . . . . . . . . . . . . . . . . . . . . . . . . . . . , , . . . . . . . . . . . , . , . . . . . . . . . . . . . . 9 . .
. . a . . . . . . . . . . VI. w . . . . . . . . . . . . . . . . . . . . . . . . . . . . . . . . . . . . . . . . . . . . . n. . . . . . . . . . . . . . . . . . . . . . . . . . .
.VI ..a .-
&, . . . p ) - 0 . . . 9 . . 'I, - 0 . . . &, . . . . . . . O P P : . U * b - . - e .,-I . o . . . 0.44. #= I . . . .

SUM
MA
RY
OF
PR
OB
LE
MS
FOR
CO
NT
RO
LL
ED
TEST
VE
llIC
LE
S
(RIE
L T
YPE
1
6
MII
CL
E CATM;ORY 6)
FR
WJa
19
86 S
-10
4th
OTR
87
le
t QTR
88
2
nd
QTR
88
3
rd QTR
88
4
th QTR
88
l
et
OTR
89
2
nd
QTR
89
3
rd QTR 89
M
S
M
S
M
S
M
S
M
S
M S
M S
M
S
....
....
....
....
....
....
....
....
....
....
....
....
....
....
....
....
....
....
....
....
....
....
....
....
....
....
....
....
....
....
....
....
....
TO
TA
L
0
0
24
2
32
0
21
0
0
0
0 0
0 0
0 0
....
....
....
....
....
....
....
....
....
....
....
....
....
....
....
....
....
....
....
....
....
....
....
....
....
....
....
....
....
....
....
....
....
Key
: M
M
ild
ly
. .
An
no
yin
g
....
....
C
ran
kin
g r
eq
uir
ed
to
st
ar
t e
ng
ine
1
1 ..
....
....
....
....
. S
tall
ed
af
te
r e
tar
tin
g
I 1
....
....
....
....
....
. S
ta
ll
s i
n t
ra
ff
ic..
. I
1 ..
....
....
....
....
....
....
....
. V
ap
or
loc
k
I I
(s
ta
ll
s w
ith
di
ff
ic
ul
t
re
st
ar
t)
..
....
....
....
....
....
...
Id
le r
ou
gh
ne
ss..
I
1 ..
....
....
li
es
ita
tio
n,
bu
ck
ing
o
r c
ou
gh
ing
[
1 L
ack
o
f p
ov
er ...
......
......
......
......
.(
1 P
ing
ing
....
....
....
....
....
....
....
....
. I 1
Die
ee
lin
g. ..
....
....
....
....
....
....
....
. I
s V
ery
T
rou
ble
som
e

SUMMARY OF PROBLEMS FOR CONTROLLED TEST VEIIICLES
(m
TYPE
2 6 V
MIC
LE
CA
?cm
RY
1)
4th QTR 87
1st QTR 88
2nd QTR 88
3rd QTR 88
4th QTR
88
1st QTR 89
2nd QTR 89
3rd QTR 89
n s
n s
M
s M
s M
S
M
S
M S
M S
..
....
....
....
,...
....
....
....
....
..._
....
..-.
....
-.*.
..-.
....
....
..,.
....
.,..
....
....
..,.
-..*
..-.
..*.
-...
*..-
....
..-.
....
.-..
.*..
..
1 11
11
...............................................-..-....~.*...-.........~......l.........l..*.Z......,..J....-...*.....~*......*..,.....
Key:
M Mildly
Annoying
Cranking required to start engine ..
....
.. 1
1 Stalled after starting ..
....
....
....
....
. I 1
Stalls in traffic ....
....
....
....
....
....
I 1
Vapor lock......................
........
.( 1
(stalls with difficult reatart)
Idle roughness ..
....
....
....
....
....
....
. I 1
Heeitation, bucking or coughing... ..
....
.I 1
Lack of power ..
....
....
....
....
....
....
.. I
1 Pinging. .
....
....
....
....
....
....
....
....
. I
Dieseling .
....
....
....
....
....
....
....
....
1
5
Very
Troublesome


SUM
MA
RY
OF PROBLEMS
FOR
C
ON
TR
OL
LE
D TEST V
EH
ICL
ES
(FU
EL
TYPE
2 6 V
EHIC
LE CA'ECXXY
3)
FE
li(A
pa
L
1985
CE
LE
BR
IlY
4th
QTR
87
let
QTR
8
8
2nd
QTR
8
8
3rd
Q
TR
8
8
4th
QTR
88
1
st
OT
R
89
2n
d
QT
R
89
3
rd
QT
R
89
U
S
H
S
M S
M
S
M S
M S
H
S
M
S
....
....
....
....
....
....
..,.
....
....
....
....
....
....
-~..
..*.
....
....
.*..
....
,--.
....
.*..
..--
....
....
...-
.-..
...*
....
..-.
....
**..
...-
TOTAL
3 2
2
3 0
12
13
2 71
0
0
. . . . . .
. . . .f .
. . .I..
. . . . . .
P.. . .
?. . .
. . . . .
. . . .
. . . . . . .
. . . . . .
. , . . .
. . . . . . .
, - .Y
.. - .
. . . .
. * . . . . .
. . . .
. . . .
. * . .
. . , . .
, . . .
. . - -
. . . .
. . . .
. . . .
* . . .
. . . .
.
Key:
M n
ild
ly
. -
An
noy
in
q
Cra
nk
ing
r
eq
uir
ed
t
o a
tar
t e
ng
ine
........I 1
Sta
lle
d a
ft
er
etarting...................[
I S
ta
lls
in
tr
af
fic
.........................
1 V
ap
or
lock .................................
1 (
at
all
s w
ith
dif
fic
ult
re
ata
rt)
I
dle
ro
ug
hn
ess
....
....
....
....
....
....
....
1
He
sit
ati
on
, b
uc
kin
g
or
co
ug
hin
g ..
....
....
I 1
Lac
k
of
po
wer
.............................
I P
ing
ing
....
....
....
....
....
....
....
....
..I
1 D
ies
eli
ng
.................................
1
5
Ve
ry
Tro
ub
leso
me

. . . . . . . . . . . . . . . . . . . . . . . . . . . . . . . . . . . . . . . . . . . . . . . . . . . . . . I : : : : : : : : .., . . . L. . . . . . . . 0 . . . u . C C . . . , , . - r . . . . p I . . . a . r . . . . . . . a . m . . u . . . ( P . I . . . . . I., . . . a . o ~ . . . ~ . ~ ' . . u s . . . . . .
' b . ' . . . =::I: - 0 . 0 4 ..zm . , . . u u . . o . m . . . &, r . 4 . c . . - 4 0 12 1;;. - . . . . u u - . L l m u .4 . U . . 4 u - 0 0 1 . . 1 L l a . 0 0 L . . P O Ll .C a pl . . o u u . u c . a . . * u X - l C C O . .
9 C U 3 0 0 P . c n 01 " 0 2- . C c a - c B O U u l O l . d " 0 0 - 4 L l o o c d X A d t - 4 u * Q C ~ A O O C 1 4 Y O l Q 9 0 4 P u ~ m u C o 4 u u O m Q g q - r - 4 OUIfn>--,,Po -
*r 0 ---- ----- x - m n t ~ ~ D - Q Q I


SU
MM
AR
Y OF PROBLEMS FOR CONTROLLED TEST VEllICLES
4th QTR 87
let
QTR 88
2nd OTR 88
3rd QTR 88
4th Q
TR 88
1st
OT
R
89
2nd QTR 89
3rd QTR 89
U S
M S
M S
M
S
M
S
M
S
M S
M
S
TOTAL
...
....
....
. ...
......
.Q ....
A.. ..
... .Q
.. ..
P.. ..
... ..4. ... P.. ..
....
.o..
.P.. ..
... -
0..
.. .P.. ..
....
.o.. .
-. 0.
. ..
....
-0..
. -0.. ..
....
.o..
..
-0..
H
Mildly
Annoying
....
....
Cranking required to start engine
l I
Stalled after starting ..
....
....
....
....
. I I
....
....
....
....
....
....
Stalls in traffic
I 1
Va
po
r lock ..
....
....
....
....
....
....
....
. I
1 (stalls with dlff icult restart)
Idle
roughness .
....
....
....
....
....
....
...
I Ileaitation, bucking or c
oughing ..
....
....
l 1
....
....
....
....
....
....
....
Lack of power
I I
Pinging ..
.,..
....
....
....
....
....
....
....
I 1
Dieseling ..
....
....
....
....
....
....
....
.. 1
I
S
Ve
ry
Troublesome

SUM
MAR
Y O
F
PR
OB
LE
MS
FOR
CONTROLLED
TE
ST
VE
llIC
LE
S
(RIEL
TY
PE
3 b
VM
ICIE
CA
TW;O
RY
2)
MBE
1984
S
-10
4th
OTR
87
le
t Q
TR
88
2n
d
QTR
8
8
3rd
Q
TR
8
8
4th
OTR
8
8
1s
t Q
TR
8
9
2nd
Q
TR
8
9
3rd
QTR
8
9
H
S
H
S
H
S
M
S
M
S
M
S
M
S
M
S
....
....
....
....
....
....
....
....
....
....
....
....
....
....
....
....
....
....
....
....
....
....
....
....
....
....
....
....
....
....
....
....
....
TOTAL
0 ..
....
... .6
.. . .
Q ..
....
... .t
o.. . -0
.. ..
....
.o ..
.. .O..
..
... .I
$ ..
... b
2. ...
.. -1
. ...
P.. .
....
. -6.
. ..
-0.. ..
... .o
...
....
....
... .
? ..
.. .Q ...
....
...
H
HI
ldly
A
nn
oy
ing
....
....
1
)
Cr
an
kin
g
re
qu
ire
d
to
sta
rt
en
gin
e
1 )
....
....
....
....
..
2)
S
tall
ed
aft
er
sta
rti
ng
. [
I 3
) S
ta
lla
in
t
ra
ff
ic ..
....
....
....
....
....
.. 1
I ..
....
....
....
....
....
....
....
. 4
V
ap
or
loc
k
I 1
(e
ta
lls
wit
h d
iffi
cu
lt
re
st
ar
t)
5
)
Id
le
ro
ug
hn
ess
....
....
....
....
....
....
... I
1 6
)
Ile
ait
ati
on
. b
uc
kin
g o
r c
ou
gh
ing
...
....
...I
I ..
....
....
....
....
....
..
7)
L
ack
o
f p
ow
er
...,
[
1 8
)
Pin
gin
g ..
....
....
....
....
....
....
....
....
1 9
)
Die
se
lin
g ..
....
....
....
....
....
....
....
..
1 I
S
Very
Tro
ub
leso
me
V1
5 : - - W > e ffl W P
0 W J -1
8 * z 0 U
a e V1 z W -1 m Z a L 0
r a C I L: 3 V1
0s . . a . - . . . U Y ,, . :2 : : I : : v a u .u, . * . . . U U 4 . w . Y . . . I d m u .4 . u . . . - 1 b Q u r : g m a ' . ' m n L l . . PO, b4 . C 4 a . . Q u o . u c .) . . blw X - I K c 0 . .
a c u s g z a :g rn 4 0 C O r ( * o u w D l r l
* Q Q r ( * a o c * Y A d L $ r ( u 4 g C d d 0 a 0 4 2 m a Q ~ ~ P U O Q U C P I Iduu a m - m a 4 4 O U ) m > - u = a & a

. . . . . . . . . . . . . . . . . . . . . . . . . . . . . . . . . . . . . . . . Q I ' . . . , . . . " Q . , . . , . . . . .
V ) ' . . . . . ' " . C: . . . . . . . . . . 6 . . . . . . . . . . a : : : : : : : : : : u ' : : : : : : : ' . . . . . rn I

SUM
MAR
Y O
F
PR
OB
I.E
MS
FOR
CO
N'r
RO
LL
ED
'P
EST
VE
llIC
LE
S
(FU
EL
TY
PE 3
6 V
MIC
IE C
A- 5)
4th
QT
R
87
1
st
QT
R
88
2
nd
Q
TR
8
8
3rd
O
TR
88
4
th QTR
88
1
st O
TR
89
2
nd
Q
TR
8
9
3rd
QTR
89
w s
n
s M
s
M
s H
S
M
s
M S
C
( S
....
....
....
....
....
....
....
....
....
....
....
....
....
....
....
....
....
....
....
....
....
....
....
....
....
....
....
....
....
....
....
....
....
TO
TA
L
7 13
1
. . . . . . , .
. . . . .
. . . . .
. . . .
. . ,9 . .
. . . .
. . . .
. . . .
Q . .
. . . .O
. . .
. . . .
.2Q2. . .
. P. . .
. . . .
.29
. . . .4
8. .
. . . .
. .Q , . .
. -20. . . .
. . . -
0 . . .
. .a
. . . .
. . . .
a . .
, , -0
. . . .
. . . .
. .
M
Mil
dly
A
nn
oy
inj
-
Cr
an
kin
g
re
qu
ire
d
to
st
ar
t e
ng
ine
....
....
( 1
Sta
lle
d a
fte
r s
tar
tin
g ..
....
....
....
....
. 1
1 S
ta
lls
in
tr
af
fic
....
....
....
....
....
....
I I
Va
po
r lo
ck
................................
I (
st
al
ls
wit
h d
iff
icu
lt r
es
ta
rt
)
Idle
ro
ug
hn
ess
....
....
....
....
....
....
... I
I
Ite
sit
ati
on
. b
uc
kin
g
or
co
ug
hin
g ..........I 1
La
ck of
po
we
r..
. ..
....
....
....
....
....
... 1
I
Pin
gin
g ..
....
....
....
....
....
....
....
....
I I
Die
se
lin
g ...
....
....
....
....
....
....
....
.I 1
5
Ver
y
Tro
ub
leso
me
QI
p,
@
. . . . . . . . . . . . . . . . . . . . . . . . . . . . . . . . . . . . . . . . . . . . . . . . . . . . . . . . . . . . . . . . . . . . . . . . . . . . . . . . . . . . . . . . . . . . . . . . . . . . Q . . . . . . . . . . . V ) . . , " e r ; . . . . . . . . . . e . . . . . . . . . . O : . - . ' . . " ' . . . . . . . a . : : a . . . . . . . . . . . . . . .
I . . . . . . . . . . . . . . . . . . . . . . . . . . . . . . . . . . . . . . . . . . . . . . . . . . . . . . . . . . . Q I . . . . . . . . . . . . . . . . . . . . . . . . . . . . a m : : m . . . . . . . . . . . . . . . . . . . . . . . . . 0 : : . . . . . . . . (.,
m r(
V1 W -1
U, x W Q > I3
2 ; ! i5 J n E z g u & aD O Y a U U r n
. I " .a
V) r r ? 0 4 . 1
2 Ir. a m 0 - * a 4 I p, I 3 111
(II - Q
m
u
: : I : : : : : . . . . . . . . . . . . . . . . . . . . . . . . . . . . . . . . . . . . . . . . . . . . . . . . . . . . . . Q I . . ' . . " . ' Q . . . . . . . . . . . . . a ' " : . . . . . . . E . . . . . . . . . Q : : : : : : : : : u : 1 " . ;I : . . . . . . . . .
. . . . . . . a . . . . . . . . . . . . . . . . . . . . . . . . . . . . . . . . . . . . . . . . . . . . . . . . . . . . . . . . . . . . . . m : : - ' * * * ' * . . . . . . . . .
0 : ; : : : : : : :
5 : : : : - . : : : . . . . . . . . . . . . . . . . . . . . . . . . . . . . . . . . . . . . . . . . . . . . . . . . . . . . . . . . . . m . . . . . . . . . . . . . . . . . . . . . . . : : . . . . . . . . 5 : . . . . . . . . . . . . . . . . . z = ; : : : : : : : : p , . . . . . . . . . . . . . . . . . . . . . . . . . . . . . . . . . . . . . . . . . . . . . . . . . . . . . . . . . . . . . . . . . . . . . . . . . . . . . . . . . : . . . . . . . . h . . . . . . . .
. . . . . . . . o : m * . . . - * - a ' : : ; : : : : : : . . . . . . . . . . . . . . . . . . . . . . . . . . . . . . . . . . . . . . . . . . . . . . . . . . . . . . . . . . . . . . . . . . . . . . . . . . . . . . . . a m : . . . . . . . . . . . . . . . . . a : : : : : : : : : u r . . . . . . . . a . . . . . . . . . . . . . . . . . . . . . . . . . . . . . . . . . . . . . . . . . . . . . . . . . . . . . . . . . . . . . . . . . . . . . . . . . . . . . . . . . .
m . - . . . . . . . . . . . . . . . . E . . . . . . . . a
* : : : : : : : : : c z : : " : : : : . . . . . . . . . . . . . . . . . . . . . . . . . . . . . . . . . . . . . . . . . . . . . . . . . . . . . . . . . . . . . . . . . . . . . . . .
a n .N .n .- . F * W .m


SUM
MA
RY
OF
PR
OB
LE
MS
FOR
C
ON
TR
OL
LE
D
TE
ST
V
EH
ICL
ES
( FUEL T
YPE
4
& V
EHIC
LE
CA
IU;O
RY
2
)
RX;
1984
S
.10
4th
QT
R
87
1st
QT
R
88
2
nd
Q
TR
8
8
3rd
QT
R
88
4
th Q
TR
8
8
1s
t Q
TR
8
9
2n
d
QT
R
89
3
rd Q
TR
8
9
U
S
H
S
M
S
M
S
M
S
M
S
H
S
H
S
....
....
....
....
....
....
....
....
....
....
9...
..?
....
....
....
..2
....
....
...,
....
....
....
L..
....
....
....
4..
..2
...-
..-
....
-..
....
....
....
8
....
....
....
....
....
....
....
....
....
....
....
....
....
....
....
....
....
....
....
....
....
....
....
....
....
....
....
....
....
....
....
....
...
9 ....
....
....
....
....
....
....
....
....
....
....
....
....
....
....
-...
....
....
....
....
....
....
...-
....
.,.,
....
....
....
..~
~-.
....
....
....
...
TO
TA
L
Key
: M
M
ild
ly
An
no
yin
g
Cra
nk
ing
re
qu
ire
d to
sta
rt
en
gin
e ..
....
.. l
1 S
tall
ed
af
te
r s
ta
rt
in
g ..
....
....
....
....
.I
1 S
ta
ll
s i
n t
ra
ff
ic
....
....
....
....
....
....
. 1
Vap
or
loc
k.
....
....
....
....
....
....
,...
..I
1 (
st
al
ls
wit
h d
if
fi
cu
lt
r
es
ta
rt
)
Id
le r
ou
gh
ne
ss
...
....
....
....
....
....
....
. 1
He
sit
ati
on
, b
uc
kin
g o
r c
ou
gh
ing
....
....
..I
I L
ac
k
of
po
we
r ..
....
....
....
....
....
....
... 1
Pin
gln
g ...
....
....
....
....
....
....
....
...
1 D
ies
eli
ng
....
....
....
....
....
....
....
...
1
5
Ve
ry
Tro
ub
les
om
e

. . . . . . . . . . . . . . . . . . . . . . . . . . . QI m . . . . . s a , .
E m : : : : : : : : : e . , , . . . . . . 0 : : : : : : : : : X d : : : . . . . . . . . . ", . . . . . . . . . . . . . . . . . . . . . . . . . . . . . . . . . . . . . . . . . . . . . 0 \ . . . . . . . . . . . . . . . . . * E m : : : : : : : : : e . . . . . . . . . a : : : : : : : : :
. . . . . . . . . . . . . . . . . . . . . . . . . . . . . . . . . . . . . . . . . . . . . . V ) " " . . . . .
a , . . . . . . . . . . . . t i . .
O : : : : : : : : : . . . . . . . .. : . . . . . . . II) . . . . . . . . . C( . . . . . . . . . . . . . . . . . . . . . . . . . . .

.. - a , . . . . . . am..&, .$, . . . c . .d . o . . . . . . 0 .4 u u : :: : 0 . , . . m . 4 . c . . .
a a o .u .-I - . -

SUMMARY OF PROBLEMS FOR CONTROLLED TEST VEIIICLES
4th
QT
R 87
let
QTR 88
2nd QTR 88
3rd QTR 88
4th QTR 88
1st OTR
89
2nd QTR 89
3rd QTR 89
H
S
H
S
M
S
M
S
M S
M S
M
S
M
S
....
....
....
....
....
....
....
....
....
....
....
....
....
....
....
....
....
.*..
,.-.
....
*...
..-.
...*
....
.,..
....
-...
.*..
,-..
....
...-
....
-..-
....
....
....
....
....
....
....
....
....
....
,.,.
....
....
....
....
....
....
....
.,.-
....
....
.*..
.,..
...-
....
.**.
....
..,-
....
....
**..
....
....
TOTAL
69
0
7 12
0
3 2
3 5
3 0
0 0
0
0
0 ..
....
....
....
....
....
....
....
....
....
..-.
....
....
..--
-.-.
....
....
..,.
..-.
-...
....
....
..,.
..-.
...-
....
..*.
....
....
....
....
..*.
....
..
Key:
M
Mildly
Annoying
Cranking required to start engine ...
....
.I
1 Stalled after starting ..
....
....
....
....
. 1 1
Stalle in traffic... ..
....
....
....
....
... I
1 Vapor lock ..
....
....
....
....
....
....
....
. I I
(stalls with difficult restart)
Idle roughneee ...
....
....
....
....
....
....
. I
Hesitation, bucking or coughing ..
....
....
[ 1
Lack of power. .
....
....
....
....
....
....
...
1 Pinging .
....
....
....
....
....
....
....
....
..
I Dieseling ..
....
....
....
....
....
....
....
.. 1
5
Very
Troublesome

SUM
MA
RY
OF PROBLEMS FOR CONTROLLED TEST VEHICLES
(NE
L T
YPE
4
6
VM
ICL
E C
AT
EG
XY
6)
4th QTR 87
1st QTR 88
2nd QTR 88
3rd QTR 88
4th QTR 88
1st
QTR 89
2nd QTR 89
3rd QTR 89
n s
M
s M
s
M
s M
s
M
s M
s
H
s ..
....
....
....
....
....
....
....
....
....
....
....
....
....
....
....
....
....
....
....
....
....
....
....
....
....
....
....
....
....
....
....
....
..
1
....
....
....
....
....
....
....
....
....
....
....
....
....
....
....
....
...
....
....
....
....
....
....
....
. ...
......
......
......
... .9.
.. .?
. -4
..
2 ..
. ......................... 11
I
....
....
....
. ..
....
....
....
....
....
....
....
....
....
....
....
....
....
....
....
....
....
....
....
....
....
. 3
....
...
......
......
......
.... 5
....
....
....
....
....
....
....
....
....
....
....
....
....
....
....
....
....
....
....
....
....
....
....
....
....
..
4 ....
....
....
....
....
....
....
....
....
....
....
....
....
....
....
....
....
....
....
....
....
....
....
....
....
....
....
....
....
....
....
....
....
s TOTAL
2 0
0 0
0
0
4 0
0 0
0
0 ...
......
.9 ... -
9.. .
..... .
v.. . .
is. .
....
....
....
....
....
....
....
....
....
....
....
....
....
....
....
....
....
....
....
....
....
....
....
....
...
Key:
M
Mildly
. -
Annoy i
nq
....
....
Cranking required to start engine
1 1
..................
Stalled after starting.
I 1
....
....
....
....
....
...
Stalla in traffic
.I
1 ...
......
......
......
......
....
Vapor lock
I I
(stalls with difficult restart)
....
....
....
....
....
....
...
Idle roughness
1 I
....
....
..
Hesitation, bucking or coughing
I 1
..
....
....
....
....
....
....
..
Lack of power
I I
Pinging ..
....
....
....
....
....
....
....
....
1 I
Dieseling ...
....
....
....
....
....
....
....
..
1
S
Very
Troublesome

u . . a m C '
0 4 . U U .
t . P O 0 uu--r L. ID* 4 L( J L I Q D . m t o u u & Y I
a C m -4 c u 4 a e x c r n C rl r( a a a & U Y u VI Vl
SU
MM
AR
Y
OF
PR
OB
LE
MS
FO
R C
ON
TR
OL
LE
D
TE
ST
V
EH
ICL
ES
(RJE
L TYPE 5
b V
MIC
LE
CA
WZX
XY
2
)
PRO
PAN
E 19
84 S
-10
4th
QTR
87
l
et
QTR
88
2
nd
Q
TR
8
8
3rd
QTR
8
8
4th
QT
R
88
1
st
QT
R
89
2
nd
Q
TR
8
9
3rd
Q
TR
89
H
S
H
S
H
S
H
S
M
S
M
S
H
S
H
S
....
....
....
....
....
....
.t..
....
...,
....
...*
....
....
....
.,..
...,
-...
....
.*..
....
...,
....
..-.
....
-...
....
....
....
..*.
..*.
-...
.-.-
.*..
5 ..
....
....
....
....
. ..
....
....
I. ............. 10
J......................................................................................
6 ......
.... ZS.
..
....
....
... 4
....
....
....
....
....
....
....
....
....
....
....
....
....
....
....
....
....
....
....
....
....
....
....
....
....
....
..
TOTAL
38
0 22
0
0
3 0
0
0
0 0
0 ..
....
....
....
....
....
....
....
....
....
....
....
....
..,.
....
....
....
....
....
....
....
....
....
....
....
*.O
....
P..
.*..
....
P.*
..P
....
*..
,.-.
Key:
M
Hil
dly
. .
An
no
y i
nq
....
..
Cra
nk
ing
re
qu
ire
d
to
st
ar
t e
ng
ine
.,
[ 1
Sta
lle
d a
ft
er
sta
rti
ng
....
....
....
....
... I
1 S
tall
s i
n t
raff
ic..
....
...
....
....
....
... [
1 V
apo
r lo
ck
....
...,
..
....
....
....
....
....
. I
1 (
st
al
ls
wit
h d
iff
icu
lt r
es
tar
t)
Id
le r
ou
gh
ne
ss
....
....
....
....
....
....
... I
I ..
....
....
Il
ee
ita
tio
n,
bu
ck
ing
o
r c
ou
gh
ing
I
I L
ack
o
f p
ow
er.
....
....
...
......
......
....
I I
Pin
gin
g ..
....
....
....
....
....
....
....
....
[ 1
Die
se
lin
g ..
....
....
....
....
....
....
....
.. 1
1
S
Very
Tro
ub
leso
me

r c ) . . . . . . . . . . . . . . . . . . . . . . . . . . . . . . . . . . . . . . . . . . QI . . . . . . . ( I ) . . ' . , . .
, . . e. rl. f-. a " : . . . . . . & . . . . . . . . O : : : : : : : : N' . . ' 4' d. . . . . . . c N . . . . . . . . . . . . . . . . . . . . . . . . . . . . . . . . . . . . . . . . . . m . . . . . ( D . . . . . . .
. . . . . a m : : ' . . " 6 . . - . . . . . . . . . . 0
:,&,. . . . . . d. . N. 3. d. Q). . . . . . ; = : :
- . . . a . . . . VI . . . . . . . . . . . . . . W -1 . . . . . . . . . . . . . . z . . . . . . a ..- - O D . . . , . , . W m . . . . , . . > U , " . . . "
L Z : . . . . , , . . . . . . . . E. & 0) W L. 0 : : : : : : : E. m . . . . . . u c r : . o . ' .
v . . . . . . . . . . . . q ; . . . . . . . . . . . . . . . . . . . . . 0 P . . . . . . . E d 3 a a f : : :,:,:
: : . m. . d. *. . . . . . V . . . . . . . E.
e a : : : : : : : 2 ~ : : . . . m . ~ . a . . . . . . . . . . . . Z m ", . . . . . . .
U . . . . . . . . . . . . . . S E g . . . . . . . . . . . . . . . . . . . . . Q B * Q . . . . . . . PI
e I n : : : : : : 0 - 6 . . . . . . . * O : : : : : : : z 4 7 : - : : ? r p, . . . . . . . r . . . . . . . 3 . . . . . . . In . . . . . . . . . . . . . . . . . . . . . Q . . . . . . .
Q . . . . . . u ) . . N . N . . . . . . . . . . g : . . . . . . . . . . . O : : * * - * -
u : N : V I : : : m d . . . . . . . . . . . . . . . . . . . . . . . . . . . . . . . . . . . . . . . . . . P . . . . . . . Q . . . . .
M . . . . . . . LZ: . . . . . . fi . . . . . . . O : - * * " - - . . . . . . 5 2 : : : N : : : ? . . . . . . . . . . . . . . . . . . . . . . . . . . . . . . . . . . . . . . . . . . . . . . . . . . . . . . . . .- .N .m .- .a .O .C
. . . PI.
. . . . . . . . . . . . . . . . . . . . . . . . . . . . . . . . . . . . . . . . . . . . . . . . . . . . . . 0 1 . . . . . . . . c . . . . . . . . 4 . . .- . m . . . m . . .u .c . . . c . . . c 1 . + . . , P ) . . . m . r . , , . .u . m . . . u . . . a . g . . . b . . . @ . O . . . 0 . . . C I & , . . . : O : : : a m . .u . * . . .
c . . 4 . a . . . O . d . . Z . . . . u" L , . . r l ' . " : m : ' . c . . m m u .lu . * . . . m u - 4 .lu . x . . . L, m u .d . u . . . rl *, : Q m a . . . 1 b O V Q Ll ' C Q D b 01 m . . . . a u u . u r - 3 . . Ctu x-rlt C 0 . .
4 c 0 3 m o a . P P - 4 0 1-4 .c C Q 4 m o u l u m - 4 + o m ~ b l m O E - 4 X r l d r r d u 4 g C d r l 0 0 Q - 4 Y m0) 0 m ~ P u r l Q U c Q k U U Q W 0 Q 1 . d r ( V V I V I > - u r ~ L n .. *
Q ---- - e m - - Y mrO*oDgr

. . . . . . . . . . . . . . . . . . . . . . . . . . . . . . . . . . . . . . . . . . . . . . . . . . . . . . P ) . . . . . . . . C . . . . . . . . 4 . . . - . m . . . 0 , . . , , J . C . . . C . ' . M . . 4 . . , a * . . m . z . . . . . .&, . m . . . U . . . r n . J , . . * . . . O ) . o . . . Q . . .&, ' 0 . ' . &, . . . . . . . a m :
. r . r r . . c . d . O . . .
a * . . ) . . . a u r . . U . 0 , . . .
I., . . 4 . C . . . Q ~ O .r . - A * a *
Q U . 4 .U . x . . . h a w ' 4 . u . . .
ul : Q m 3 - . . J L I O rnPh a c u . L Q - g : : 9 ) Y Y . Y C *ul X 4 C C 0 ' '
a c u ~ m o a - a P 4 0 2.4 ' C c m r ( I D o u u m 4 d a m r ( u ~ 0 c - 1 Y -4dhc( u 4 0 c - d o a o . . r x m a 4 9 e a u c r m 0 c ~ L U U 4PDv P ) Q - 4 U V ) V I > - u s ~ P n

SUM
MA
RY
OF
PR
OB
LE
MS
FOR
C
ON
TR
OL
LE
D
TE
ST
VE
llIC
LE
S
( RIEL W
E 5 6
VE
HIC
LE
CA
'Ea3
RY
5 )
PEQ
PAN
E 19
80 C
-10
4th
QT
R
87
le
t Q
TR
88
2
nd
Q
TR
88
3
rd Q
TR
8
8
4th
OTR
8
8
1st
QTR
8
9
2n
d Q
TR
89
3
rd Q
TR
89
n s
n S
M
S
M
S
M S
M
S
M
S
H
S
TOTAL
192
0
0
15
0
0
0
4 0
0 0
0
0
. .. . . . .
, ... . .
.. . .. . . .
.. . .
. . . . . . . . .. .
. . . .
. * *
. . . .
. . . .
. . . .o
.. . .
. . . . . -.
. . . - -.
. . . .
. . . .
. .. .
. .. *.
. .
. - -.
. . . *.
. .
. .-.
. . . .
*. . . .
. . . .
. . . . .
. . . -
- -.
Key
r M
M
ild
ly
An
no
yin
g
Cra
nk
ing
re
qu
ire
d to
sta
rt
en
gin
e. ....... 1
1 S
tall
ed
af
te
r e
tar
tin
g ..
....
....
....
....
. I I
Sta
lle
in
tr
af
fi
c ..
....
....
....
....
....
...
1 V
ap
or
loc
k ..
......
......
......
......
......
1
(s
ta
ll
s w
ith
di
ff
ic
ul
t r
es
tar
t)
Id
le r
ou
gh
ne
ae
.. ..
......
......
......
.....
I 1
He
sit
ati
on
, b
uc
kin
g o
r c
ou
gh
ing
....
....
.. 1
1 L
ac
k o
f power....
....
....
....
....
....
....
. 1
Pin
gin
g ..
....
....
....
....
....
....
....
....
1 I
Die
se
lin
g ...
......
......
......
......
.....
I 1
5
Very
Tro
ub
leso
me

---- ----- . . . . . . . . . . . . . . . . . . . . . . . . . . . . . . . . . . . . . . . . . . . . . . . . . . . . . . . . . . . . . . . . . . . . . . . . g : : : : : : : : .., . . .- . m . . . m . . . u # C . . . . .&, . * . . . ;: . . a , = . . . . .,, . m . . . C , . . . 1 1 1 . 3 . ' . * . . . p I . o . . . a ' .&, , . . . : O : : : 1110. ',, . h . . . o z : :; 1 0
- . . . u u . . u 'a,. . .
h . . * a t . . . Q ~ U .u - 4 . . . U U r ( . w .Y . . . h r n U .-I . U . . . 4 Y( . - m a . . . 1 h 4 ' D Q h . E Q 6 P k . a u r . r c .$ : : C l l v Y 4 E C 0 . '
O C U ~ ~ O P e m m 4 0 1-4 . c c w r ( P I O U l u O ) - 4 - * a m - L I a o c r l Y - 4 r l h - I u 4 0 C 4 4 0 a mm a a a a u c ( r v c o h u u a m ~ o a * ~ O V ) U ) > - u = ~ & n

SUMMARY OF PROBLEMS FOR CONTROLLED TEST V
EHICLES
MIBE 6
98 MIXED l
YP
E VMICLES
4th QTR 87
1st QTR 88
2nd QTR 88
3rd QTR 88
4th QTR 88
1st OTR 89
2nd QTR 89
3rd QTR 89
n s
H
s M
S
H
S
M
S
H
S
n s
n s
....
....
....
....
....
....
....
....
....
....
....
....
....
....
....
....
....
....
....
....
....
....
....
....
....
....
....
....
....
....
....
....
....
1
39
2 61
2 13
1
8
6
1
2
2
....
....
....
....
....
....
....
....
....
....
....
....
....
....
....
....
....
....
....
....
....
....
....
....
....
....
....
....
....
....
....
....
....
2
7
1
12
2 2
3
4 1
1
1
....
....
....
....
....
....
....
....
....
....
....
....
....
....
....
....
....
....
....
....
....
....
....
....
....
....
....
....
....
....
....
....
....
3
2 3
4
1
1
2 2
1
....
....
....
....
....
....
....
....
....
....
....
....
....
....
....
....
....
....
....
....
....
....
....
....
....
....
....
....
....
....
....
....
....
4
16
1
1 1
44
13
1 ..
....
....
....
....
....
....
....
....
....
....
....
....
....
....
....
....
....
....
....
....
....
....
....
....
....
....
....
....
....
....
....
....
..
5 14
7
84
7
27
1
11
6
2
4 ..
....
....
....
....
....
....
....
....
....
....
....
....
....
....
....
....
....
....
....
....
....
....
....
....
.. ?
!.
....
....
.*..
....
..*.
....
. ..
..
a
6 25
15
73
14
16
43
26
10
2
m
....
....
....
....
....
....
....
....
....
... ?
? ...
....
....
....
....
....
....
. ?P
J .........! .
...?
..
..
....
....
....
....
....
....
....
....
....
....
. 7
7 36
9
6 60
1 1
2
2
3
3
....
....
....
....
....
....
....
....
....
....
....
....
....
....
....
....
....
..
....
....
....
....
....
....
....
....
....
... ?!.
....
....
....
....
. ,I?.
9
5
3 1
2
1
....
....
....
....
....
....
....
....
....
....
....
....
....
....
....
....
....
....
....
....
....
....
....
....
....
....
....
....
....
....
....
....
....
TOTAL
113
30
272
41
186
141
61
31
2 18
......
......
......
......
......
......
......
... ?*
....
....
....
....
....
....
....
....
....
....
... ?
....
....
. !? .-
-.?
....
....
0-...? ..
....
....
.
Keys
M
Mildly
. -
Annoying
....
....
Cranking required to start engine
1 ..
....
....
....
....
. Stalled after etarting
1 1
....
....
....
....
..
Stall.
in traffic......
[ 1
....
....
....
....
. Vapor lock..............
I 1
(atalla with difficult restart)
Idle roughness ..
....
....
....
....
....
....
. I 1
....
....
..
Heeitation, bucking or coughing
I 1
Lack of power. ..
....
....
....
....
....
....
. I
1 Pinging.. ..
....
....
....
....
....
....
....
.. 1
1 Dieseling. .
....
....
....
....
....
....
....
..
1
s Very
Troublesome

Appendix I I .
Analysis of ADOT Emissions Study

STATISTICAL ANALYSIS OF ALTERNATE ENERGY FUELS
Prepared by
Maralou De Nicholas, Ph.D. Center for Advanced Research in Transportation
Arizona State University
November 1989

STATISTICAL ANALYSI8 OF ALTERNATE ENERGY FUELS
The initial database consisted of emissions test results for 90 vehicles. Data from two vehicles were eliminated due to identifiable mechanical defects. Vehicles were also eliminated from analysis if pretest measurements were absent. Mean emissions readings by individual vehicle identification number are presented in Appendix A.
Carbon Monoxide (CO)
Data from 79 vehicles were used in the carbon monoxide analysis. Analysis tables for CO are presented in Appendix B. Vehicles averaged 2.28 emissions tests using gasoline and 12.33 tests using alternate fuels. Due to a few missing data points, vehicles averaged 2.09 measurements of CO at load using gasoline and only 9.62 measurements using alternate fuels. It was discovered that the five fuel groups differed significantly on CO in the gasoline phase of the study (idle: E(4,169) = 2.70; load: F(4,169) = 2.73, both E < .05) . This can partially be explained - by different performance by the six vehicle types (E(5,168) = 4.25, E = .001 at idle; no significant effect for load) , but is thought to be primarily due to the substantial variation individual vehicles are known to display in emissions testing. On the average, CO at idle increased from .17 to .20 and CO at load increased from .19 to .29. Neither of these measures was statistically significant, although the effects were marginal (E(4,1116) = 2.26, E = .061 for idle; E(4,980) = 2.05, E = .085 for load) .
Each fuel type was then analyzed individually. The CO means for each fuel group are displayed in Table 1. As can be seen, only compressed natural gas showed a statistically significant change in CO, The decrease is apparent under both idle and load conditions. This effect, however, is probably due to the fact that the pretest averages for the CNG group are unusually high.
In order to minimize seasonal variation, an analysis was performed on data for the months of October through December only. Average CO emissions at idle and at load for each fuel type are depicted in Figures 1 and 2. Overall, a significant decrease in CO at idle was found, from .I668 to .I344 (E(4,309) = 3.19, E < .05). This effect is thought to be due to the significant variation in pretest measurements for the five fuel groups (E(4,69) = 2.70, E < .05). Results for CO at load reveal an average increase from .19 to .28, although this change is not statistically significant (E(4,304) = 2.06, E = .09).

Table 1. Mean carbon monoxide levels by fuel type.
................................................................. CO at Idle CO at Load
Fuel Type .................... .................... Gasoline A1 t Fuel Gasoline A l t Fuel .................................................................
Ethanol .254 .I40 .I74 . 4 19
Methanol .068 .255 .095 .253
CNG .332 .125* .579 .148**
Propane .090 .281 .088 .I23

Figure 1
CO IDLE
FUEL TYPE
CCISOLINE
El ALT FUEL
*October through December only

Figure 2
0 . 6
0 . 5
0.4
- CO LOAD 8 . 3
O GQSOLINE
El ALT FUEL
8.2
0.1
8 ETHQNOL METHCINOL MTBE CNC PROPQNE
FUEL TYPE
*October through December only

Hydrooarbons (BC)
Data from 79 vehicles were used in the hydrocarbon at idle analysis; these vehicles averaged 2.16 measurements using gasoline and 12.33 measurements using alternate fuels. Due to a substantial amount of missing data for hydrocarbons at load, only 11 vehicles were used in this analysis, averaging 1.36 tests on gasoline and 6 tests using alternate fuels. Statistical analysis tables for HC are presented in Appendix C. The five fuel groups did not differ significantly on either HC at idle (E(4,169) < 1, n.s.) or at load (E(4,lO) = 2.50, n.s.) in the gasoline phase of the study.
With the use of alternate fuels, hydrocarbons at idle increased from an average of 45.69 to a mean of 65.01. This change is statistically significant, F(4,1116) = 3.95, Q < .01. Hydrocarbons at load, however, decreased from an average of 141.53 to 73.23. This change is also significant (E(4,71) = 5.71, 2 < -001.
The HC means for each fuel group are displayed in Table 2. As can be seen, only propane showed a statistically significant increase in HC at idle. Compressed natural gas was the only fuel to show a significant reduction in HC under load conditions; this effect, however, is probably due to the large pretest average for the CNG group.
Analysis for the months of October through December revealed a significant difference for hydrocarbons at idle, F(4,309) = 6.25, E c .001. This difference represents an increase from 45.69 to 56.71. Results for hydrocarbons at idle by fuel type are depicted in Figure 3. A comparable analysis for HC at load could not be performed: due to an inadequate number of data points on this measure, the data matrix was incomplete.

Table 2. Mean hydrocarbon levels by fuel type.
................................................................. HC at Idle HC at Load
Fue l Type .................... .................... Gasoline Alt Fuel Gasoline Alt Fuel -----------------------------------------------------------------
Ethanol 42.448 40.359 98.333 60.471
Methanol 39.348 50.692 83.500 76.917
MTBE 50.485 40.427 100.500 79.571
CNG 57.074 69.589 266.250 73.083**
Propane 39.872 124.706* 97.000 81.000 ................................................................. *E < .025 **E < .O1

Figure 3
IDLE
P C IDLE BY FUEL TYPE <BEFORE/CIFTER)
'""T
ETHIINOL MEXHRNOL MTBE CNG FUEL TYPE
*October through December only
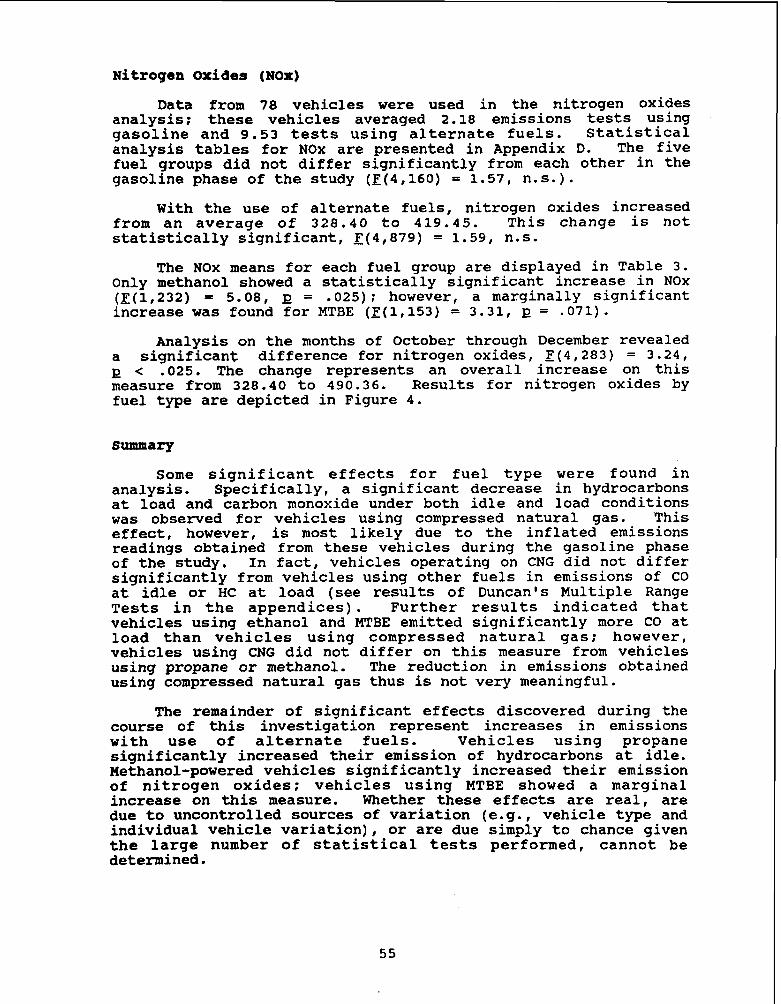
Nitrogen Oxides (NOx)
Data from 78 vehicles were used in the nitrogen oxides analysis; these vehicles averaged 2.18 emissions tests using gasoline and 9.53 tests using alternate fuels. statistical analysis tables for NOx are presented in Appendix D. The five fuel groups did not differ significantly from each other in the gasoline phase of the study (E(4,160) = 1.57, n.s.).
With the use of alternate fuels, nitrogen oxides increased from an average of 328.40 to 419.45. This change is not statistically significant, E(4,879) = 1.59, n.s.
The NOx means for each fuel group are displayed in Table 3. Only methanol showed a statistically significant increase in NOx (E(1,232) = 5.08, E = .025); however, a marginally significant increase was found for MTBE (E(1,153) = 3.31, E = .071).
Analysis on the months of October through December revealed a significant difference for nitrogen oxides, E (4,283) = 3.24, E < .025. The change represents an overall increase on this measure from 328.40 to 490.36. Results for nitrogen oxides by fuel type are depicted in Figure 4.
Some significant effects for fuel type were found in analysis. Specifically, a significant decrease in hydrocarbons at load and carbon monoxide under both idle and load conditions was observed for vehicles using compressed natural gas. This effect, however, is most likely due to the inflated emissions readings obtained from these vehicles during the gasoline phase of the study. In fact, vehicles operating on CNG did not differ significantly from vehicles using other fuels in emissions of CO at idle or HC at load (see results of Duncan's Multiple Range Tests in the appendices). Further results indicated that vehicles using ethanol and MTBE emitted significantly more CO at load than vehicles using compressed natural gas; however, vehicles using CNG did not differ on this measure from vehicles using propane or methanol. The reduction in emissions obtained using compressed natural gas thus is not very meaningful.
The remainder of significant effects discovered during the course of this investigation represent increases in emissions with use of alternate fuels. Vehicles using propane significantly increased their emission of hydrocarbons at idle. Methanol-powered vehicles significantly increased their emission of nitrogen oxides; vehicles using MTBE showed a marginal increase on this measure. Whether these effects are real, are due to uncontrolled sources of variation (e.g., vehicle type and individual vehicle variation), or are due simply to chance given the large number of statistical tests performed, cannot be determined.

Table 3. Mean nitrogen oxide levels by fuel type.
- - - --- --
Fuel Type Gasoline Alternate Fuel ................................................................. Ethanol 439.577 462.966
Methanol 283.326 458.079*
MTBE 273.710 435.419**
CNG 3 13.148 441.389
Propane 345.474 293.743 ................................................................. *E = .025 **E = .071

*October th rough December only
Figure 4
700-
6 00
588--
400
NOX
388--
200--
lee--
01
--
-- D G A S O L I N E
ETHANOL METHlNOL MTBE CNC PROPANE FUEL T Y P E

APPENDIX A
Average Emissions Readings by Vehicle

MEAN8 TABLE8 Carbon M o n o x i d e at I d l e
Variable Value Label Mean Std D e v Cases
VEEICLE TYPE 1
I DNO B7 19 YEAR 1 YEAR 2
I DNO B721 YEAR 1 YEAR 2
IDNO B726 YEAR 1 YEAR 2
I DNO B7 2 7 YEAR 1 YEAR 2
I DNO B729 YEAR 1 YEAR 2
I DNO B7 3 5 YEAR 1 YEAR 2
I DNO 3738 YEAR 1 YEAR 2
I DNO B741 YEAR 1 YEAR 2
I DNO B7 4 5 YEAR 1 YEAR 2
IDNO B74 6 YEAR 1 YEAR 2
IDNO B7 4 9 YEAR 1 YEAR 2
IDNO B750 YEAR 1 YEAR 2

IDNO YEAR YEAR
VEHICLE
I DNO YEAR YEAR
I DNO YEAR YEAR
I DNO YEAR YEAR
I DNO YEAR YEAR
I DNO YEAR YEAR
I DNO YEAR YEAR
I DNO YEAR YEAR
IDNO YEAR YEAR
IDNO YEAR YEAR
I DNO YEAR YEAR
I DNO YEAR YEAR
I DNO YEAR YEAR
B7 59
TYPE 2
B7 67
B768
B773
B792
B7 9 3
B794
B8 08
38 15
B8 17
B823
B827
B831

I DNO YEAR YEAR
IDNO YEAR YEAR
VEHICLE TYPE 3
A362 I D N O YEAR YEAR
IDNO YEAR YEAR
IDNO YEAR YEAR
I DNO YEAR YEAR
I DNO YEAR YEAR
IDNO YEAR YEAR
I DNO YEAR YEAR
IDNO YEAR YEAR
I D N O YEAR YEAR
I DNO YEAR YEAR
IDNO YEAR YEAR

IDNO YEAR YEAR
A482 .0665 .0594 17 .0200 .oooo 1 .0694 .0601 16
VEHICLE TYPE 4
I DNO B887 YEAR 1 YEAR 2
I DNO B888 YEAR 1 YEAR 2
I DNO B906 YEAR 1 YEAR 2
IDNO B9 3 4 YEAR 1 YEAR 2
IDNO B9 3 8 YEAR 1 YEAR 2
IDNO B94 3 YEAR 1 YEAR 2
I DNO BB7 0 YEAR 1 Y Ern 2
I DNO BB7 3 YEAR 1 YEAR 2
I DNO BB8 5 YEAR 1 YEAR 2
I DNO BC3 2 YEAR 1 YEAR 2
IDNO BC5 1 YEAR 1 YEAR 2
I DNO BC56 YEAR 1 YEAR 2

DNO BC65 YEAR YEAR
VEHICLE TYPE 5
B432 IDNO YEAR YEAR
I DNO YEAR YEAR
IDNO YEAR YEAR
I DNO YEAR YEAR
IDNO YEAR YEAR
I DNO YEAR YEAR
I DNO YEAR YEAR
IDNO YEAR YEAR
I DNO YEAR YEAR
IDNO YEAR YEAR
I DNO YEAR YEAR
I DNO YEAR YEAR

VEHICLE
I DNO YEAR YEAR
I DNO YEAR YEAR
IDNO YEAR YEAR
I DNO YEAR YEAR
I DNO YEAR YEAR
IDNO YEAR YEAR
I DNO YEAR YEAR
IDNO YEAR YEAR
I DNO YEAR YEAR
I DNO YEAR YEAR
I DNO YEAR YEAR
I DNO YEAR YEAR
IDNO YEAR YEAR
TYPE 6
B D 0 6
BD08
BD09
BD12
BD3 9
BD4 2
BD5 1
BD52
B D 5 5
BD57
B D 6 1
B D 6 4
B D 6 6

IDNO BD7 0 YEAR 1 YEAR 2
IDNO BD7 4 YEAR 1 YEAR 2

MEANS TABLES Carbon Monoxide a t Load
Variable Value Label Mean S t d Dev Cases
VEHICLE TYPE 1
I DNO B719 YEAR 1 YEAR 2
I DNO B721 YEAR 1 YEAR 2
I DNO YEAR YEAR
I DNO YEAR YEAR
I DNO YEAR YEAR
I DNO B735 YEAR 1 YEAR 2
IDNO B7 3 8 YEAR 1 YEAR 2
IDNO B74 1 YEAR 1 YEAR 2
IDNO B745 YEAR 1 YEAR 2
IDNO B746 YEAR 1 YEAR 2
IDNO B7 4 9 YEAR 1 YEAR 2
I DNO B7 50 YEAR 1 YEAR 2

I DNO B759 YEAR YEAR
VEHICLE
I DNO YEAR YEAR
I DNO YEAR YEAR
I DNO YEAR YEAR
I D N O YEAR YEAR
I DNO YEAR YEAR
I DNO YEAR YEAR
I DNO YEAR YEAR
I DNO YEAR YEAR
I DNO YEAR YEAR
I DNO YEAR YEAR
I D N O YEAR YEAR
I DNO YEAR YEAR
TYPE 2
B767
B768
B773
B792
B793
B794
B808
B815
B8 17
B823
B827
B83 1

I DNO 8 8 3 3 YEAR 1 YEAR 2
I DNO B835 YEAR 1 YEAR 2
VEHICLE TYPE 3
IDNO A362 YEAR 1 YEAR 2
I DNO A3 64 YEAR 1 YEAR 2
IDNO A427 YEAR 1 YEAR 2
IDNO A 4 3 1 YEAR 1 YEAR 2
IDNO A432 YEAR 1 YEAR 2
I DNO A439 YEAR 1 YEAR 2
IDNO A442 YEAR 1 YEAR 2
IDNO A445 YEAR 1 YEAR 2
IDNO A4 4 6 YEAR 1 YEAR 2
I DNO A450 YEAR 1 YEAR 2
IDNO A 4 7 0 YEAR 1 YEAR 2

IDNO YEAR YEAR
VEHICLE
I DNO YEAR YEAR
I DNO YEAR YEAR
IDNO YEAR YEAR
IDNO YEAR YEAR
IDNO YEAR YEAR
IDNO YEAR YEAR
IDNO YEAR YEAR
I DNO YEAR YEAR
I DNO YEAR YEAR
IDNO YEAR YEAR
IDNO YEAR YEAR
IDNO YEAR YEAR
TYPE 4
B 8 8 7
B 8 8 8
B 9 0 6
B9 3 4
B9 3 8
8943
BB7 0
BB7 3
BB8 5
BC3 2
BC51
BC56

IDNO YEAR YEAR
VEHICLE TYPE 5
B432 I DNO YEAR YEAR
IDNO YEAR YEAR
I DNO YEAR YEAR
I DNO YEAR YEAR
I DNO YEAR YEAR
I DNO YEAR YEAR
I DNO YEAR YEAR
I DNO YEAR YEAR
IDNO YEAR YEAR
IDNO YEAR YEAR
I DNO YEAR YEAR
IDNO YEAR YEAR

VEHICLE
I DNO YEAR YEAR
IDNO YEAR YEAR
IDNO YEAR YEAR
IDNO YEAR YEAR
I DNO YEAR YEAR
I DNO YEAR YEAR
IDNO YEAR YEAR
I DNO YEAR YEAR
I DNO YEAR YEAR
IDNO YEAR YEAR
I O N 0 YEAR YEAR
IDNO YEAR YEAR
IDNO YEAR YEAR
TYPE 6
BD06

I DNO B D 7 0 YEAR 1 YEAR 2
IDNO BD7 4 YEAR 1 YEAR 2
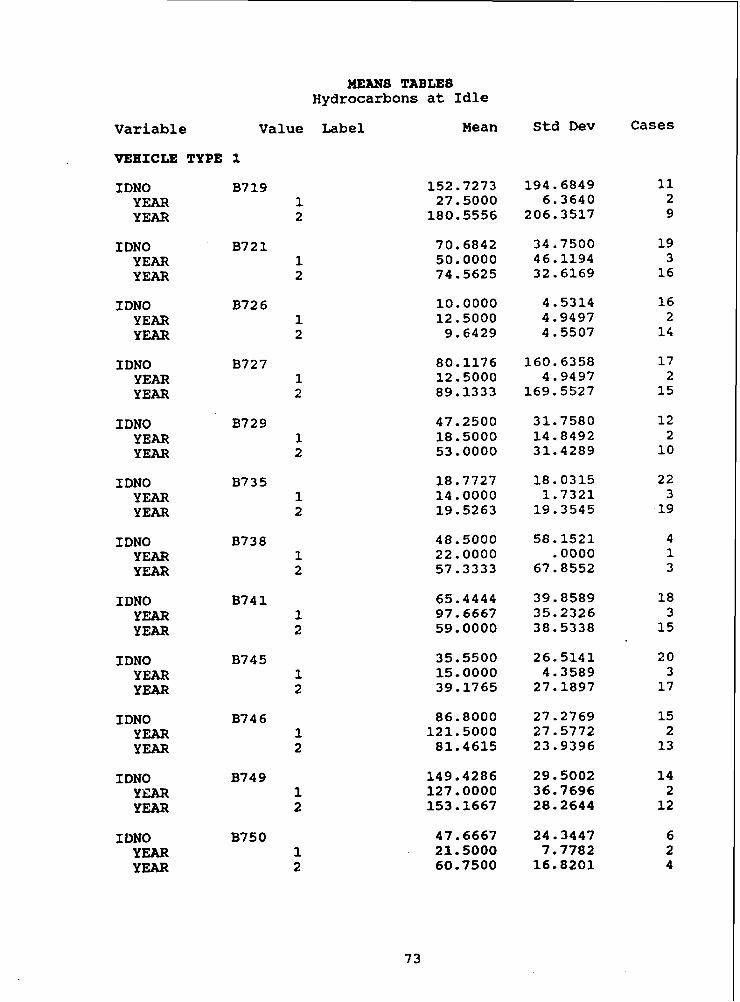
MEANS TABLES Hydrocarbons at Idle
Variable Value Label Mean Std Dev Cases
VEHICLE TYPE 1
I DNO B719 YEAR 1 YEAR 2
I DNO B7 2 1 YEAR 1 YEAR 2
IDNO B72 6 YEAR 1 YEAR 2
I DNO YEAR YEAR
I DNO YEAR YEAR
IDNO YEAR YEAR
I DNO B738 48.5000 YEAR 1 22.0000 YEAR 2 57.3333
IDNO B7 4 1 YEAR 1 YEAR 2
I DNO B745 YEAR 1 YEAR 2
I DNO B74 6 YEAR 1 YEAR 2
I DNO B749 YEAR 1 YEAR 2
I l lN0 B750 YEAR 1 YEAR 2

I DNO YEAR YEAR
VEHICLE TYPE 2
B7 67 IDNO YEAR YEAR
I DNO YEAR YEAR
I DNO YEAR YEAR
IDNO YEAR YEAR
IDNO YEAR YEAR
IDNO YEAR YEAR
IDNO YEAR YEAR
IDNO YEAR YEAR
I DNO YEAR YEAR
IDNO YEAR YEAR
IDNO YEAR YEAR
IDNO YEAR YEAR

I DNO YEAR YEAR
IDNO YEAR YEAR
VEHICLE TYPE 3
A362 I DNO YEAR YEAR
I DNO YEAR YEAR
I DNO YEAR YEAR
IDNO YEAR YEAR
IDNO YEAR YEAR
I DNO YEAR YEAR
I DNO YEAR YEAR
I DNO YEAR YEAR
I DNO YEAR YEAR
IDNO YEAR YEAR
IDNO YEAR YEAR

IDNO A482 YEAR 1 YEAR 2
VEHICLE TYPE 4
B887 I DNO YEAR YEAR
I DNO YEAR YEAR
I DNO YEAR YEAR
IDNO YEAR YEAR
I DNO YEAR YEAR
IDNO YEAR YEAR
l DNO YEAR YEAR
I DNO YEAR YEAR
I DNO YEAR YEAR
I DNO YEAR YEAR
I DNO YEAR YEAR
IDNO YEAR YEAR

I DNO BC65 YEAR 1 YEAR 2
VEHICLE TYPE 5
I DNO B4 3 2 YEAR 1 YEAR 2
I DNO B443 YEAR 1 YEAR 2
I DNO B476 YEAR 1 YEAR 2
I DNO B4 9 8 YEAR 1 YEAR 2
IDNO B504 YEAR 1 YEAR 2
IDNO B516 YEAR 1 YEAR 2
IDNO B530 YEAR 1 YEAR 2
I DNO B533 YEAR 1 YEAR 2
I DNO B549 YEAR 1 YEAR 2
IDNO B551 YEAR 1 YEAR 2
IDNO B625 YEAR 1 YEAR 2
I DNO B64 1 YEAR 1 YEAR 2

VEHICLE
I DNO YEAR YEAR
IDNO YEAR YEAR
I DNO YEAR YEAR
I DNO YEAR YEAR
I DNO YEAR YEAR
I DNO YEAR YEAR
IDNO YEAR YEAR
IDNO YEAR YEAR
I DNO YEAR YEAR
I DNO YEAR YEAR
IDNO YEAR YEAR
I DNO YEAR YEAR
IDNO YEAR YEAR
I DNO
TYPE 6
BD06
BD08
BD09
BD12
BD3 9
BD4 2
BD5 1
BD52
BD5 5
BD57
BD6 1
BD64
BD6 6
BD7 0
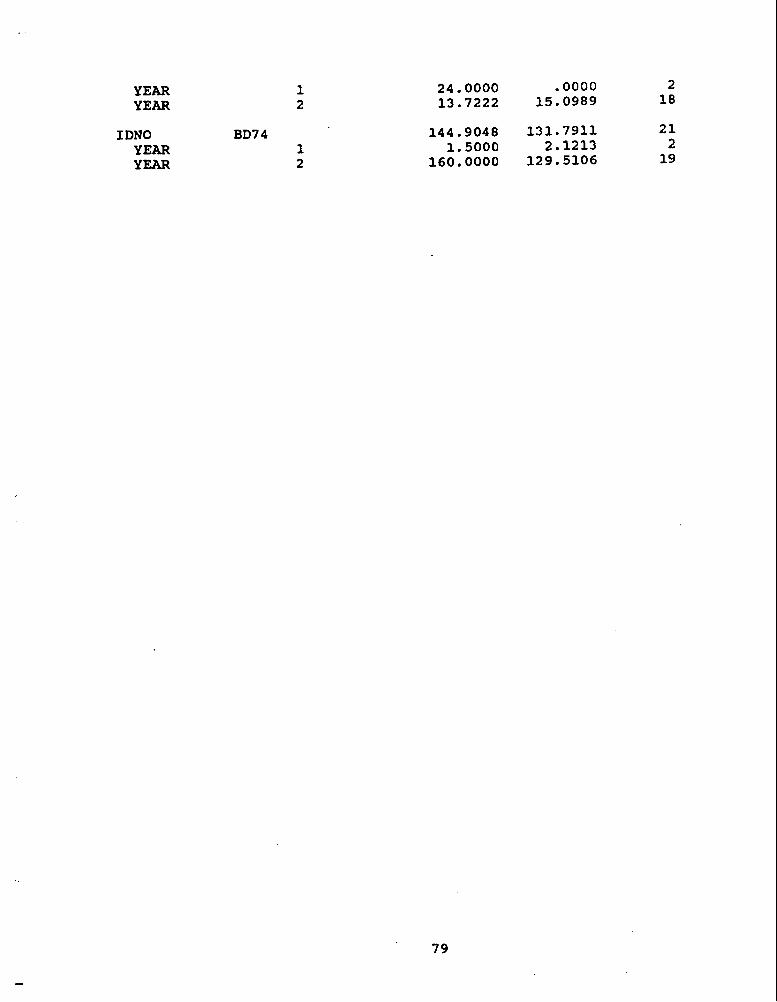
YEAR YEAR
I DNO BD7 4 YEAR 1 YEAR 2

MEANS TABLES Hydrocarbons a t Load
Cases Variable Value Label Mean Std Dev
VEHICLE TYPE 1
IDNO B 7 4 1 YEAR 1 YEAR 2
I DNO B 7 4 6 YEAR 1 YEAR 2
I DNO B 7 5 9 YEAR 1 YEAR 2
VEHICLE TYPE 3
I DNO A427 YEAR 1 YEAR 2
I DNO A 4 4 6 YEAR 1 YEAR 2
VEHICLE TYPE 4
I DNO B 8 87 YEAR 1 YEAR 2
I DNO BB7 0 YEAR 1 YEAR 2
I DNO BC5 1 YEAR 1 YEAR 2
VEHICLE TYPE 5
I DNO B 4 7 6 YEAR 1 YEAR 2
IDNO B 5 16 YEAR 1 YEAR 2

I DNO B551 YEAR 1 YEAR 2
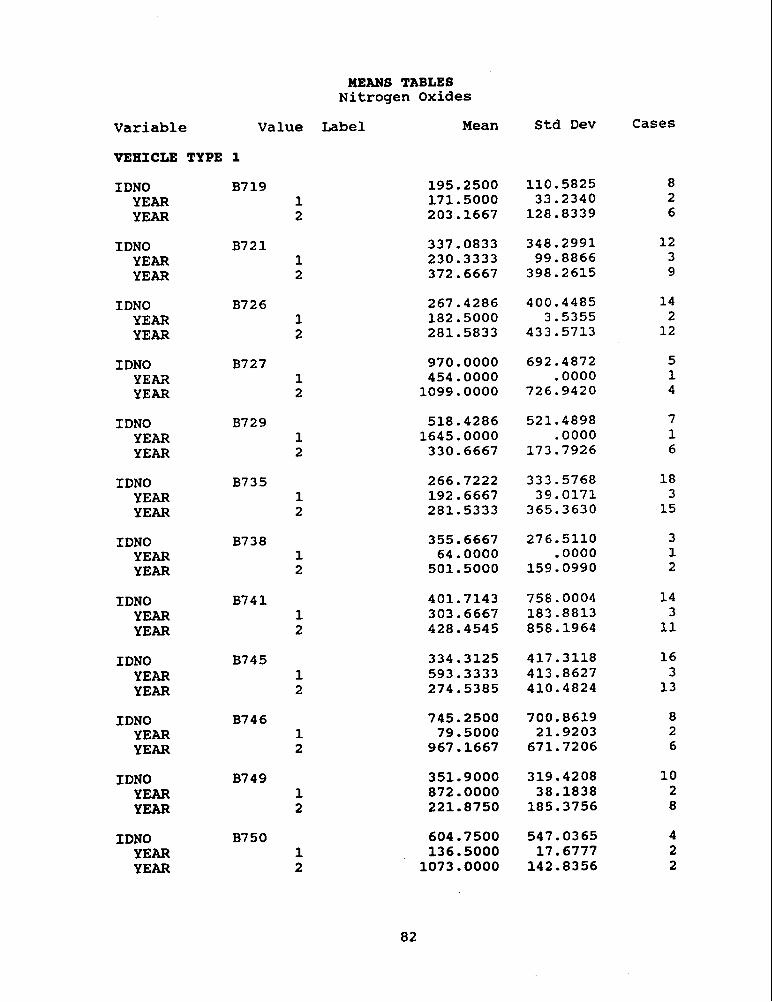
MEANS TABLES Nitrogen O x i d e s
S td D e v Cases Variable Value Label Mean
VEHICLE TYPE 1
IDNO B7 19 YEAR 1 YEAR 2
I DNO B721 YEAR 1 YEAR 2
I DNO B7 2 6 YEAR 1 YEAR 2
I DNO B7 2 7 YEAR 1 YEAR 2
I DNO B729 YEAR 1 YEAR 2
IDNO B7 3 5 YEAR 1 YEAR 2
IDNO B7 3 8 YEAR 1 YEAR 2
IDNO B74 1 YEAR 1 YEAR 2
I DNO B745 YEAR 1 YEAR 2
IDNO B746 YEAR 1 YEAR 2
I DNO B749 YEAR 1 YEAR 2
IDNO B750 YEAR 1 YEAR 2

I DNO B759 YEAR 1 YEAR 2
VEHICLE TYPE 2
IDNO B767 YEAR YEAR
I DNO YEAR YEAR
IDNO YEAR YEAR
I DNO YEAR YEAR
I DNO YEAR YEAR
IDNO YEAR YEAR
IDNO YEAR YEAR
IDNO YEAR YEAR
I DNO YEAR YEAR
IDNO YEAR YEAR
I DNO YEAR YEAR
IDNO YEAR YEAR

IDNO YEAR YEAR
I DNO YEAR YEAR
VEHICLE
I DNO YEAR YEAR
I DNO YEAR YEAR
I DNO YEAR YEAR
I DNO YEAR YEAR
IDNO YEAR YEAR
I DNO YEAR YEAR
I DNO YEAR YEAR
I DNO YEAR YEAR
IDNO YEAR YEAR
IDNO YEAR YEAR
IDNO YEAR YEAR
TYPE 3
A3 6 2

I DNO YEAR YEAR
VEHICLE TYPE 4
B887 IDNO YEAR YEAR
IDNO . YEAR YEAR
I DNO YEAR YEAR
I DNO YEAR YEAR
I DNO YEAR YEAR
I DNO YEAR YEAR
I DNO YEAR YEAR
IDNO YEAR YEAR
IDNO YEAR YEAR
IDNO YEAIZ YEAR
I DNO YEAR YEAR
I DNO YEAR YEAR

I DNO YEAR YEAR
VEHICLE
I DNO YEAR YEAR
I DNO YEAR YEAR
I DNO YEAR YEAR
I DNO YEAR YEAR
I DNO YEAR YEAR
I DNO YEAR YEAR
I DNO YEAR YEAR
I DNO YEAR YEAR
I DNO YEAR YEAR
IDNO YEAR YEAR
I DNO YEAR YEAR
TYPE 5
B443
B4 7 6
B4 9 8
B504
B516
B53 0
B53 3
B54 9
B55 1
B625
B64 1

VEHICLE
IDNO YEAR YEAR
I DNO YEAR YEAR
IDNO YEAR YEAR
I DNO YEAR YEAR
I DNO YEAR YEAR
I DNO YEAR YEAR
IDNO YEAR YEAR
I DNO YEAR YEAR
IDNO YEAR YEAR
I DNO YEAR YEAR
IDNO YEAR YEAR
IDNO YEAR YEAR
IDNO YEAR YEAR
TYPE 6
B D 0 6 1 2
B D 0 8 1 2
B D 0 9 1 2
B D 1 2 1 2
B D 3 9 1 2
BD4 2 1 2
B D 5 1 I 2
BD5 2 1 2
B D 5 5 1 2
BD5 7 1 2
BD6 1 1 2
B D 6 4 1 2
B D 6 6 1 2
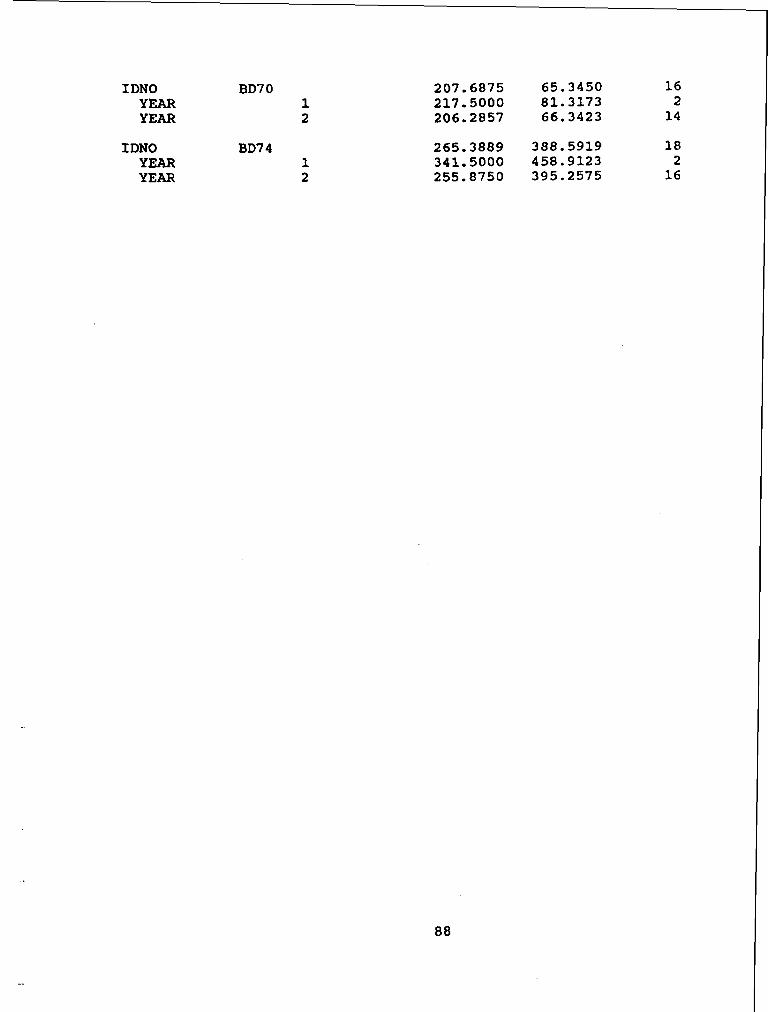
I DNO BD7 0 YEAR 1 YEAR 2
IDNO BD7 4 YEAR 1 YEAR 2

APPENDIX B
Statistical Analysis Tables Carbon Monoxide

STATISTICAL ANALYSIS OVER TIME (BEFORE/AFTER) C a r b o n Monoxide a t Id l e
GASOLINE (1987) - - - - - - - - - - C e l l Means and Standard D e v i a t i o n s V a r i a b l e .. COIDLE
FACTOR CODE Mean S t d . Dev.
FUELTY PE ETHANOL FUELTYPE METHANOL FUELTY PE MTBE FUE LTY PE CNG FUELTYPE PROPANE
F o r e n t i r e sample
ALTERNATE FUEL (1988-89) - - - - - - - - - - C e l l Means and Standard D e v i a t i o n s V a r i a b l e . . COIDLE
FACTOR CODE Mean Std. Dev.
FUELTY PE ETHANOL .140 .446 FUELTY PE METHANOL . 2 55 .809 FUELTYPE MTBE .I81 .7 10 FUELTYPE CNG .I25 .396 FUELTYPE PROPANE .281 .771
For e n t i r e sample .205 .670
- - - - - - - - - - * * ANALYSIS OF VARIANCE -- DESIGN 1 * *
- - - - - - - - - - * * ANALYSIS OF VARIANCE -- DESIGN 1 * *
T e s t s of S ign i f i cance fo r COIDLE us ing UNIQUE sums of squares Source of V a r i a t i o n SS Dl? M S F S i g of F
WITHIN CELLS CONSTANT RJELTYPE
Tests of S ign i f i cance for COIDLE us ing UNIQUE sums of squares Source of V a r i a t i o n SS D F M S F Sig of F
WITHIN CELLS 423.55 947 .45 CONSTANT 35.48 1 35.48 79.32 .OOO FUELTYPE 3.67 4 .92 2.05 .085

STATISTICAL ANALYSIS OVER TIME (BEFORE/AFTER) C a r b o n Monoxide a t L o a d
GASOLINE (1987) - - - - - - - - - - C e l l , M e a n s and Standard D e v i a t i o n s V a r i a b l e .. COLOAD
FACTOR CODE Mean Std. D e v .
FUELTYPE ETHANOL .I74 .304 2 9 FUELTYPE METHANOL .095 .I70 46 FUELTYPE MTBE .I96 ,313 3 3 FUELTY P E CNG .579 1.606 2 7 FUELTYPE PROPANE .088 .200 3 9
For e n t i r e sample .201 .682 174
- - - - - - - - - - * * ANALYSIS OF VARIANCE -- DESIGN 1 * *
T e s t s of S ign i f i cance f o r COLOAD using UNIQUE sums of squares Source of V a r i a t i o n S S DF M S F S i g of F
WITHIN CELLS 75.59 169 . 4 5 CONSTANT 8.59 1 8.59 19.21 .OOO FUELTY P E 4.89 4 1.22 2.73 ,031
ALTERNATE FUEL (1988-89) - - - - - - - - - - C e l l M e a n s and Standard D e v i a t i o n s V a r i a b l e .. COLOAD
FACTOR CODE Mean Std. Dev.
FUELTY PE ETHANOL .419 1.489 FUELTY PE METHANOL ,253 .789 FUELTYPE MTBE ,442 1.382 FUELTY P E CNG .I48 .367 E'UELTY PE PROPANE .I23 - .538
For e n t i r e s a m p l e .273 1.010
- - - - - - - - - - * * ANALYSIS OF VARIANCE -- DESIGN 1 * *
T e s t s of Signif icance f o r COLOAD u s i n g UNIQUE sums of squares Source of V a r i a t i o n SS DF M S F S i g of F
WITHIN C E U S 817.67 8 11 1.01 CONSTANT 60.61 1 60.61 60.11 .OOO FUELTY PE 13.47 4 3.37 3.34 .010

STATISTICAL ANALYSIS BY FUEL TYPE Carbon Monoxide at Idle
ETHANOL - - - - - - - - - - Cell Means and Standard Deviations Variable .. COIDLE
FACTOR CODE Mean Std. Dev. N
YEAR GASOLINE .254 .463 29 YEAR ALT FUEL .140 .446 19 5 For entire sample .I55 .449 2 2 4
- - - - - - - - - - * * ANALYSIS OF VARIANCE -- DESIGN 1 * * Tests of Significance for COIDLE using UNIQUE sums of squares Source of Variation SS DF MS F Sig of F
WITHIN CELLS 44.57 2 2 2 .20 CONSTANT 3.93 1 3.93 19.57 .OOO YEAR .33 1 .33 1.63 .203
- - - - - - - - - - METHANOL
Cell Means and Standard Deviations Variable .. COIDLE
FACTOR CODE Mean Std. Dev.
YEAR GASOLINE .068 .I70 YEAR ALT FUEL .255 .809 For entire sample .226 .749
- - - - - - - - - - * * ANALYSIS OF VARIANCE -- DESIGN 1 * * Tests of Significance for COIDLE using UNIQUE sums of squares Source of Variation SS DF MS F Sig of F
WITHIN CELLS 164.18 294 .56 CONSTANT 4.07 1 4.07 7.29 ,007 YEAR 1.36 1 1.36 2.43 .I20
- - - - - - - - - - HTBE
Cell Means and Standard Deviations Variable .. COIDLE
FACTOR CODE Mean Std. Dev.
YEAR GASOLINE .I89 .420 YEAR ALT FUEL ,181 .710 For entire sample .I83 .668 - - - - - - - - - -

* * ANALYSIS OF VARIANCE -- DESIGN 1 * * Tests of Significance for COIDLE using UNIQUE sums of squares Source of Variation SS DF MS F Sig of F
WITHIN CELLS 84.33 188 .45 CONSTANT 3.74 1 3.74 8.33 .004 YEAR .OO 1 . 00 .OO .954
- - - - - - - - - - CNG
Cell Means and Standard Deviations Variable .. COIDLE
FACTOR CODE Mean Std. Dev.
YEAR GASOLINE .332 .668 YEAR ALT FUEL .I25 .396 For entire sample .I57 .4 54
- - - - - - - - - - * * ANALYSIS OF VARIANCE -- DESIGN 1 * * Tests of Significance for COIDLE using UNIQUE sums of squares Source of Variation SS DF MS F Sig of F
WITHIN CELLS 34.40 171 .20 CONSTANT 4.75 1 4.75 23.61 .OOO YEAR .98 1 .98 4.86 .029
- - - - - - - - - - PROPANE
Cell Means and Standard Deviations Variable .. COIDLE
FACTOR CODE Mean Std. Dev.
YEAR GASOLINE .090 .I74 39 YEAR ALT FUEL .281 .771 2 04 For entire sample . ,251 .713 243
- - - - - - - - - - * * ANALYSIS OF VARIANCE -- DESIGN 1 * * Tests of Significance for COIDLE using UNIQUE sums of squares Source of Variation SS DF MS F Sig of F
WITHIN CELLS 121.79 241 .51 CONSTANT 4.52 1 4.52 8.95 .003 YEAR 1.20 1 1.20 2.37 .I25
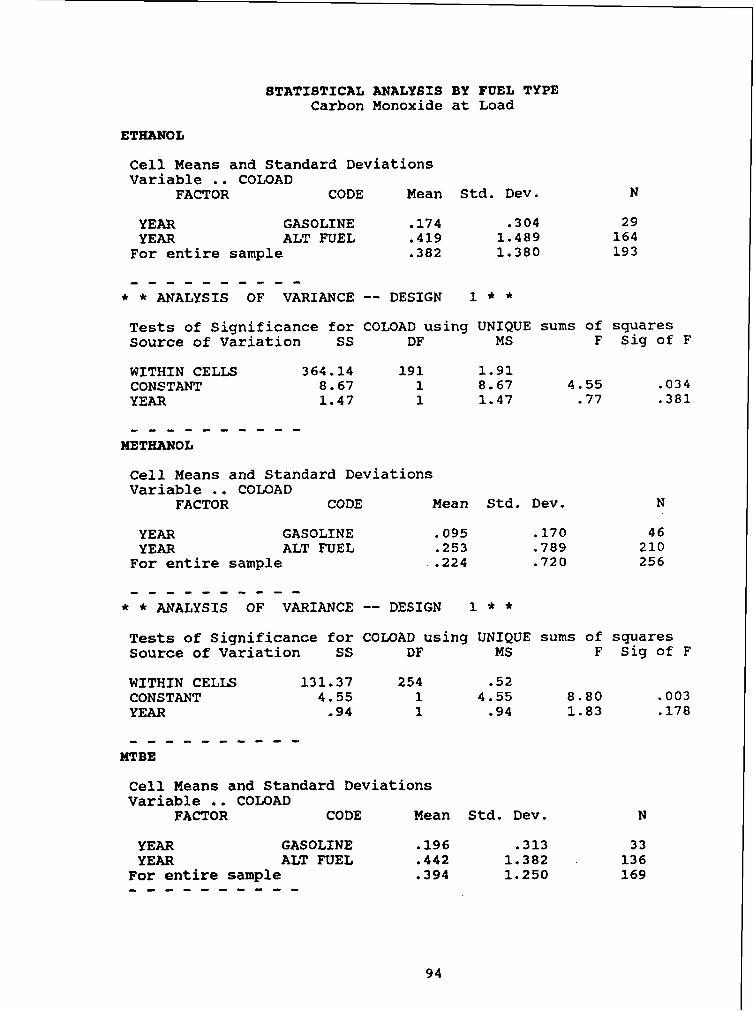
STATIBTICAL ANALYSIS BY FUEL TYPE Carbon Monoxide at Load
ETHANOL
Cell Means and Standard Deviations Variable .. COLOAD
FACTOR CODE Mean Std. Dev.
YEAR GASOLINE .I74 .304 2 9 YEAR ALT FUEL .419 1.489 164
For entire sample .382 1.380 193
- - - - - - - - - - * * ANALYSIS OF VARIANCE -- DESIGN 1 * * Tests of Significance for COLOAD using UNIQUE sums of squares Source of Variation SS DF MS F Sig of F
WITHIN CELLS 364.14 191 1.91 CONSTANT 8.67 1 8.67 4.55 ,034 YEAR 1.47 1 1.47 .77 .381
- - - - - - - - - - METHANOL
Cell Means and Standard Deviations Variable .. COLOAD
FACTOR CODE Mean Std. Dev.
YEAR GASOLINE .095 .I70 YEAR ALT FUEL .253 .789 For entire sample .224 .720
- - - - - - - - - - * * ANALYSIS OF VARIANCE -- DESIGN 1 * * Tests of Significance for COLOAD using UNIQUE sums of squares Source of Variation SS DF MS F Sig of F
WITHIN CELLS 131.37 254 .52 CONSTANT 4.55 1 4.55 8.80 .003 YEAR - 9 4 1 .94 1.83 .I78
- - - - - - - - - - MTBE
Cell Means and Standard Deviations Variable .. COLOAD
FACTOR CODE Mean Std. Dev.
YEAR GASOLINE .I96 .313 YEAR ALT FUEL .442 1.382
For entire sample .394 1.250 - - - - - - - - - -

Tests of Significance for COLOAD using UNIQUE sums of squares Source of Variation SS DF MS F Sig of F
WITHIN CELLS 260.81 167 1.56 CONSTANT 10.83 1 10.83 6.94 .009 YEAR 1.61 1 1.61 1.03 .312
CNG
Cell Means and Standard Deviations Variable . . COLOAD
FACTOR CODE Mean Std. Dev.
YEAR GASOLINE .579 1.606 YEAR ALT FUEL .I48 . 3 67 For entire sample .223 .757
- - - - - - - - - - * * ANALYSIS OF VARIANCE -- DESIGN 1 * * Tests of Significance for COLOAD using UNIQUE sums of squares Source of Variation SS DF MS F Sig of F
WITHIN CELLS 84.17 153 .55 CONSTANT 11.78 1 11.78 21.42 .OOO YEAR 4.13 1 4.13 7.50 .007
- - - - - - - - - - PROPANE
Cell Means and Standard Deviations Variable .. COLOAD
FACTOR CODE Mean Std. Dev.
YEAR GASOLINE .088 .200 39 YEAR ALT FUEL .I23 .538 178
For entire sample .I17 .494 2 17
- - - - - - - - - - * * ANALYSIS OF VARIANCE -- DESIGN 1 * * Tests of Significance for COLOAD using UNIQUE sums of squares Source of Variation SS DF MS F Sig of F
WITHIN CELLS 52.78 215 .25 CONSTANT 1.42 1 1.42 5.80 .017 YEAR .04 1 .04 .16 .694

STATISTICAL ANALYSIS FOR MONTXS OF OCTOBER THROUGH DECEMBER C a r b o n Monoxide a t I d l e
C e l l Means and Standard D e v i a t i o n s V a r i a b l e .. COIDLE
FACTOR CODE Mean Std. Dev.
FUELTYPE YEAR YEAR
FUELTYPE YEAR YEAR
FUELTY P E YEAR YEAR
F'UELTYPE YEAR YEAR
FUELTYPE YEAR YEAR
F o r e n t i r e
ETHANOL GASOLINE ALT FUEL
METHANOL GASOLINE ALT FUEL
MTBE GASOLINE ALT FUEL
CNG GASOLINE ALT FUEL
PROPANE GASOLINE ALT FUEL
sample
- - - - - - - - - - * * ANALYSIS O F VARIANCE -- DESIGN 1 * *
T e s t s of S ign i f i cance f o r COIDLE u s i n g UNIQUE s u m s of s q u a r e s Source of V a r i a t i o n SS DF M S F S ig of F
WITHIN CELLS 52.15 309 .17 CONSTANT 7.51 1 7.51 44.50 .OOO FUELTY P E .27 4 .07 .40 .805 YEAR .24 1 .24 1.45 .230 FUELTYPE BY YEAR 2.15 4 .54 3.19 .014 - - - - - - - - - -

STATISTICAL ANALYSIS FOR MONTHS OF OCTOBER THROUGH DECEMBER C a r b o n M o n o x i d e a t L o a d
- - - - - - - - - - C e l l M e a n s and Standard D e v i a t i o n s V a r i a b l e .. .COLOAD
FACTOR CODE M e a n Std. D e v .
FUELTYPE ETHANOL YEAR GASOLINE YEAR ALT FUEL
FUELTY P E METHANOL YEAR GASOLINE YEAR ALT FUEL
FUELTY P E MTBE YEAR GASOLINE YEAR ALT FUEL
FUELTY P E CNG YEAR GASOLINE YEAR ALT FUEL
FUELTYPE PROPANE YEAR GASOLINE YEAR ALT FUEL
For e n t i r e s a m p l e * ANALYSIS O F VARIANCE --
. 080
.I23
.260 DESIGN 1
T e s t s of S i g n i f i c a n c e f o r COLOAD using UNIQUE sums of squares Source of V a r i a t i o n S S D F MS F Sig of F
WITHIN CELLS 893.26 980 .91 CONSTANT 35.03 1 35.03 38.43 . 000 FUELTY P E 5.31 4 1.33 1.46 .213 YEAR .35 1 .35 -39 ,534 FUELTYPE BY YEAR 7.48 4 1.87 2.05 .085
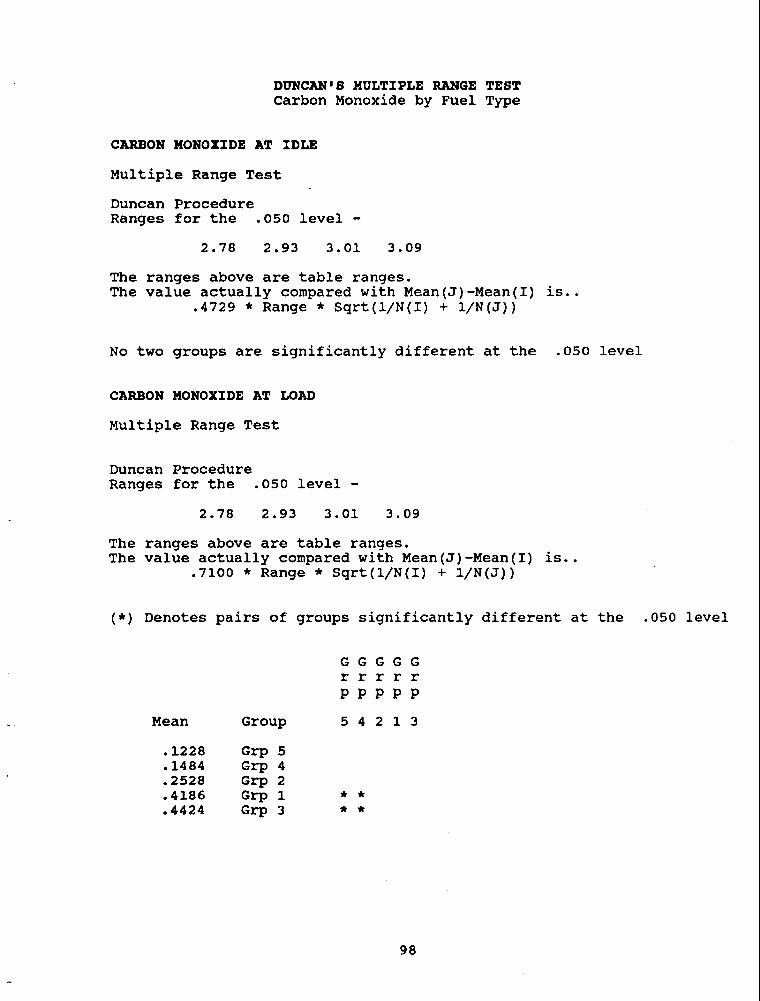
DUNCAN'S MULTIPLE RANGE TEST Carbon Monoxide by Fuel Type
CARBON HONOXIDE AT IDLE
Multiple Range Test
Duncan Procedure Ranges for the .050 level -
The ranges above are table ranges. The value actually compared with Mean(J)-Mean(1) is..
.4729 * Range * Sqrt(l/N(I) + l/N(J) )
No two groups are significantly different at the .050 level
CARBON MONOXIDE AT LOAD
Multiple Range Test
Duncan Procedure Ranges for the .050 level -
The ranges above are table ranges. The value actually compared with Mean(J)-Mean(1) is..
.7100 * Range * Sqrt(l/N(I) + l/N(J))
( * ) Denotes pairs of groups significantly different at the .050 level
G G G G G r r r r r P P P P P
Mean Group 5 4 2 1 3

APPENDIX C
Statistical Analysis Tables Hydrocarbons

STATISTICAL ANALYSIS OVER TIME (BEFORE/AFTER) H y d r o c a r b o n s a t Id le
GASOLINE (1987 ) - - - - - - - - - - C e l l M e a n s and Standard D e v i a t i o n s V a r i a b l e .. HCIDLE
. FACTOR CODE M e a n Std. D e v . N
FUELTY P E ETHANOL 42.448 42.736 29 FUELTY P E METHANOL 39.348 48.414 46 FUELTY P E MTBE 50.485 47.260 33 FUELTY P E CNG 57.074 71.800 27 FUELTY P E PROPANE 39.872 49.226 39
For e n t i r e s a m p l e 44.845 51.666 174
- - - - - - - - - - * * ANALYSIS O F VARIANCE -- DESIGN 1 * *
T e s t s of Signif icance f o r HCIDLE u s i n g UNIQUE sums of squares Source of V a r i a t i o n S S DF M S F Sig of F
WITHIN CELLS 454202.06 169 2687.59 CONSTANT 352170.81 1 352170.81 131.04 . O O O FUELTY P E 7608.75 4 1902.19 .71 .588
ALTERNATE FUEL (1988-89)
C e l l M e a n s and Standard D e v i a t i o n s V a r i a b l e .. HCIDLE
FACTOR CODE Mean Std. D e v . N
F'UELTY P E ETHANOL 40.359 .47.959 195 FUELTY P E METHANOL 50.692 82.920 250 FUELTY P E MTBE 40.427 46.184 157 FUELTY P E CNG 69.589 72.578 14 6 FUELTY P E PROPANE 124.706 209.233 2 04
For e n t i r e s a m p l e 65.641 117.528 952
- - - - - - - - - - * * ANALYSIS O F VARIANCE -- DESIGN 1 * *
T e s t s of S ign i f i cance f o r HCIDLE using UNIQUE sums of squares Source of V a r i a t i o n SS DF M S F Sig of F
WITHIN CELLS 12141816.26 947 12821.35 CONSTANT 3894754.98 1 3894755.0 303.77 .OOO F'UELTYPE 994284.88 4 248571.22 19.39 .OOO

BTATISTICAL ANALYSIS OVER TIME (BEFORE/AFTER) Hydrocarbons at Load
GASOLINE (1987)
Cell Means and Standard Deviations Variable .. HCLOAD
FACTOR CODE Mean Std. Dev.
F'UELTYPE ETHANOL 98.333 24.007 FUELTYPE METHANOL 83.500 31.820 FUELTYPE MTBE 100.500 16.842 F'UELTYPE CNG 266.250 165.423 FUELTYPE PROPANE 97.000 2.828 For entire sample 141.533 110.315
- - - - - - - - - - * * ANALYSIS OF VARIANCE -- DESIGN 1 * * Tests of Significance for HCLOAD using UNIQUE sums of squares Source of Variation SS DF MS F S i g of F
WITHIN CEUS 85118.92 10 8511.89 CONSTANT 227333.37 1227333.37 26.71 .OOO FUELTY PE 85252.82 4 21313.20 2.50 .lo9
- - - - - - - - - - ALTERNATE FUEL (1988-89) - - - - - - - - - - Cell Means and Standard Deviations Variable .. HCLOAD
FACTOR CODE Mean Std. Dev. N
FUELTYPE ETHANOL 60.471 41.772 17 FUELTYPE METHANOL 76.917 51.609 12 FUELTYPE MTBE 79.571 49.216 14 FUELTYPE CNG 73.083 31.079 12 FUELTYPE PROPANE 81.000 49.344 11 For entire sample 73.227 44.348 6 6
- - - - - - - - - - * * ANALYSIS OF VARIANCE -- DESIGN 1 * * Tests of Significance for HCLOAD using UNIQUE sums of squares Source of Variation SS DF MS F Sig of F
WITHIN CELLS 123679.50 61 2027.53 CONSTANT 354982.69 1 354982.69 175.08 .OOO FUELTY PE 4158.09 4 1039.52 .51 .727

STATISTICAL ANALYSIS BY FUEL TYPE Hydrocarbons at Idle
ETHANOL - - - - - - - - - - Cell Means and Standard Deviations Variable .. HCIDLE
FACTOR CODE Mean Std. Dev.
YEAR GASOLINE 42.448 42.736 29 YEAR ALT FUEL 40.359 47.959 195 For entire sample 40.629 47.231 224
- - - - - - - - - - * * ANALYSIS OF VARIANCE -- DESIGN 1 * * Tests of Significance for HCIDLE using UNIQUE sums of squares Source of Variation SS DF MS F Sig of F
WITHIN CELLS 497356.04 222 2240.34 CONSTANT 173109.67 1 173109.67 77.27 .OOO YEAR 110.20 1 110.20 .05 .825
- - - - - - - - - - METHANOL
Cell Means and Standard Deviations Variable .. HCIDLE
FACTOR CODE Mean Std. Dev.
YEAR GASOLINE 39.348 48.414 46 YEAR ALT FIJEL 50.692 82.920 250 For entire sample 48.929 78.601 296
- - - - - - - - - - * * ANALYSIS OF VARIANCE -- DESIGN 1 * * Tests of Significance for HCIDLE using UNIQUE sums of squares Source of Variation S S DF MS F Sig of F
WITHIN CELLS 1817531.72 294 6182.08 CONSTANT 314974.52 1 314974.52 50.95 .OOO YEAR 4999.79 1 4999.79 .81 .369
- - - - - - - - - - MTBE
Cell Means and Standard Deviations Variable .. HCIDLE
FACTOR CODE Mean Std. Dev.
YEAR GASOLINE 50.485 47.260 YEAR ALT FUEL 40.427 46.184 For entire sample 42.174 46.404

- - - - - - - - - - * * ANALYSIS OF VARIANCE -- DESIGN 1 * * Tests of Significance for HCIDLE using UNIQUE sums of squares Source of Variation SS DF MS F Sig of F
WITHIN CELLS 404212.65 188 2150.07 CONSTANT 225371.29 1 225371.29 104.82 .OOO YEAR 2758.62 1 2758.62 1.28 .259
- - - - - - - - - - CNG
Cell Means and Standard Deviations Variable .. HCIDLE
FACTOR CODE Mean Std. Dev.
YEAR GASOLINE 57.074 71.800 27 YEAR ALT FUEL 69.589 72.578 14 6 For entire sample 67.636 72.393 17 3
- - - - - - - - - - * * ANALYSIS OF VARIANCE -- DESIGN 1 * * Tests of Significance for HCIDLE using UNIQUE sums of squares Source of Variation SS DF MS F Sig of F
WITHIN CELLS 897839.19 171 5250.52 CONSTANT 365570.25 1 365570.25 69.63 .OOO YEAR 3568.86 1 3568.86 .68 . 4 11
- - - - - - - - - - PROPANE
Cell Means and Standard Deviations Variable .. HCIDLE
FACTOR CODE Mean Std. Dev.
YEAR GASOLINE 39.872 49.226 3 9 YEAR ALT FUEL 124.706 209.233 2 04 For entire sample 111.091 195.134 2 4 3
- - - - - - - - - - * * ANALYSIS OF VARIANCE -- DESIGN 1 * * Tests of Significance for HCIDLE using UNIQUE sums of squares Source of Variation SS DF MS F Sig of F
WITHIN CELLS 8979078.71 241 37257.59 CONSTANT 886809.54 1 886809.54 23.80 .OOO YEAR 235629.30 1 235629.30 6.32 .013

STATIBTICAL ANALYSIS BY FUEL TYPE Hydrocarbons at Load
ETHANOL - - - - - - - - - - Cell Means and Standard Deviations Variable .. HCLOAD
FACTOR CODE Mean Std. Dev. N
YEAR GASOLINE 98.333 24.007 3 YEAR ALT FUEL 60.471 41.772 17 For entire sample 66.150 41.502 20
- - - - - - - - - - * * ANALYSIS OF VARIANCE -- DESIGN 1 * * Tests of Significance for HCLOAD using UNIQUE sums of squares Source of Variation SS DF MS F . Sig of F
WITHIN CELLS 29070.90 18 1615.05 CONSTANT 64307.65 1 64307.65 39.82 .OOO YEAR 3655.65 1 3655.65 2.26 .I50
- - - - - - - - - - METHANOL
Cell Means and Standard Deviations Variable .. HCLOAD
FACTOR CODE Mean Std. Dev.
YEAR GASOLINE 83.500 31.820 YEAR ALT FUEL 76.917 51.609 For entire sample 77.857 48.346
- - - - - - - - - - * * ANALYSIS OF VARIANCE -- DESIGN 1 * * Tests of Significance for HCLOAD using UNIQUE sums of squares Source of Variation S S DF MS F Sig of F
WITHIN CELLS 30311.42 12 2525.95 CONSTANT 44114.58 1 44114.58 17.46 .001 YEAR 74.30 1 74.30 .03 .867
- - - - - - - - - - MTBE
Cell Means and Standard Deviations Variable .. HCLOAD
FACTOR CODE Mean Std. Dev.
YEAR GASOLINE 100.500 16.842 YEAR ALT FUEL 79.571 49.216
For entire sample 84.222 44.526
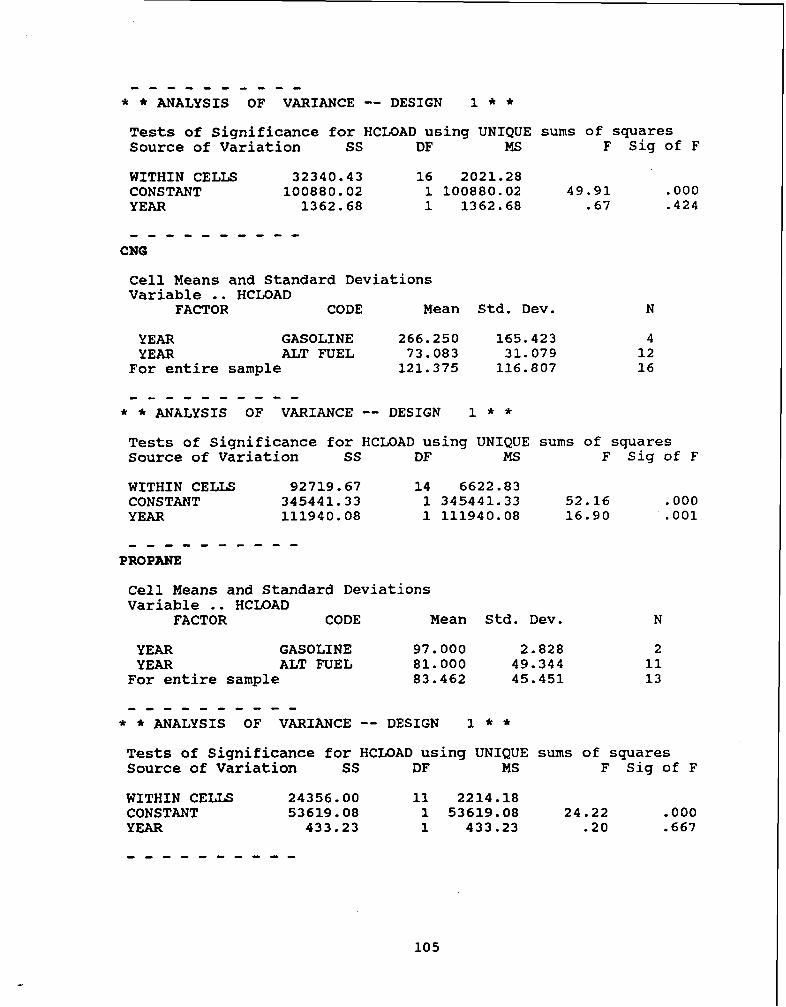
- - - - - - - - - - * * ANALYSIS OF VARIANCE -- DESIGN 1 * * Tests of Significance for HCLOAD using UNIQUE sums of squares Source of Variation SS Dl? MS F Sig of F
WITHIN CELLS 32340.43 16 2021.28 CONSTANT 100880.02 1 100880.02 49.91 .OOO YEAR 1362.68 1 1362.68 .67 .424
- - - - - - - - - - CNG
Cell Means and Standard Deviations Variable .. HCLOAD
FACTOR CODE Mean Std. Dev. N
YEAR GASOLINE 266.250 165.423 4 YEAR ALT FUEL 73.083 31.079 12
For entire sample 121.375 116.807 16
- - - - - - - - - - * * ANALYSIS OF VARIANCE -- DESIGN 1 * * Tests of Significance for HCLOAD using UNIQUE sums of squares Source of Variation SS DF MS F S i g of F
WITHIN CELLS 92719.67 14 6622.83 CONSTANT 345441.33 1 345441.33 52.16 .OOO YEAR 111940.08 1 111940.08 16.90 .001
- - - - - - - - - - PROPANE
Cell Means and Standard Deviations Variable .. HCLOAD
FACTOR CODE Mean Std. Dev.
YEAR GASOLINE 97.000 2.828 YEAR ALT FUEL 81.000 49.344 For entire sample 83.462 45.451
- - - - - - - - - - * * ANALYSIS OF VARIANCE -- DESIGN 1 * * Tests of Significance for HCIDAD using UNIQUE sums of squares Source of Variation SS Dl? MS F Sig of F
WITHIN C E U S 24356.00 11 2214.18 CONSTANT 53619.08 1 53619.08 24.22 .OOO YEAR 433.23 1 433.23 .20 .667

STATISTICAL ANALYSIS FOR MONTBS OF OCTOBER THROUGH DECEMBER Hydrocarbons at Idle
- - - c - - - - - -
C e l l Means and Standard Deviations Variable .. HCIDLE
FACTOR CODE Mean Std. Dev.
FUELTYPE YEAR YEAR
FUELTYPE YEAR YEAR
FUELTY PE YEAR YEAR
FUELTYPE YEAR YEAR
FUELTY PE YEAR YEAR
For entire
ETHANOL GASOLINE ALT FUEL
METHANOL GASOLINE ALT FUEL
MTBE GASOLINE ALT FUEL
CNG GASOLINE ALT FUEL
PROPANE GASOLINE ALT FUEL
sample
- - - - - - - - - - * * ANALYSIS OF VARIANCE -- DESIGN 1 * * Tests of Significance for HCIDLE using UNIQUE sums of squares Source of Variation SS DF MS F Sig of F
WITHIN CELLS 884361.83 309 2862.01 CONSTANT 791804.18 1 791804.18 276.66 .OOO FUELTY PE 63848.30 4 15962.07 5.58 .OOO YEAR 9133.42 1 9133.42 3.19 .075 FUELTYPE BY YEAR 71559.10 4 17889.77 6.25 .OOO

DUNCAN'S MULTIPLE RANGE TEST Hydrocarbons at Load by Fuel Type
Multiple Range Test
Duncan Procedure Ranges for the .050 level -
The ranges above are table ranges. The value actually compared with Mean(J)-Mean(1) is..
31.8397 * Range * Sqrt(l/N(I) + l / N ( J ) )
No two groups are significant.1~ Zirferent at the .050 level

APPENDIX D
Statistical Analysis Tables Nitrogen Oxides

BTATIBTICAL ANALYSIS OVER TIME (BEFORE/AFTER) N i t r o g e n O x i d e s
GASOLINE (1987) - - - - - - - - - - C e l l M e a n s and Standard D e v i a t i o n s V a r i a b l e .. NOX
FACTOR CODE M e a n Std. D e v .
FUELTY P E ETHANOL 439.577 380.675 26 FUELTYPE METHANOL 283.326 220.267 43 FUELTYPE MTBE 273.710 236.550 31 FUELTY P E CNG 313.148 221.181 2 7 FUELTY PE PROPANE 345.474 350.994 3 8
F o r e n t i r e s a m p l e 325.333 288.887 16 5
- - - - - - - - - - * * ANALYSIS O F VARIANCE -- DESIGN 1 * * T e s t s of Signif icance fo r NOX u s i n g UNIQUE s u m s of squares Source of V a r i a t i o n SS DF MS F S i g of F
W I T H I N CELLS 13169467.06 160 82309.17 CONSTANT 17414544.15 1 17414544 211.57 .OOO F'UELTY P E 517259.61 4 129314.90 1.57 .I85
ALTERNATE FUEL (1988-89)
C e l l M e a n s and Standard D e v i a t i o n s V a r i a b l e .. NOX
FACTOR CODE M e a n S td . D e v .
F'UELTY PE ETHANOL 462.966 457.785 147 FUELTY PE METHANOL 458.079 497.053 19 1 FUELTY PE MTBE 435.419 479.565 124 FUELTY P E CNG 441.389 430.223 95 FUELTYPE PROPANE 293.743 347.244 167
For e n t i r e s a m p l e 415.094 4 50.153 7 2 4
- - - - - - - - - - * * ANALYSIS O F VARIANCE -- DESIGN 1 * * T e s t s of S i g n i f i c a n c e f o r NOX u s i n g UNIQUE s u m s of squares Source of V a r i a t i o n SS DF MS F Sig of F
W I T H I N CELLS 143241123.4 719 199222.70 CONSTANT 119473246.5 1 119473246 599.70 .OOO FUELTY PE 3265976.25 4 816494.06 4.10 .003
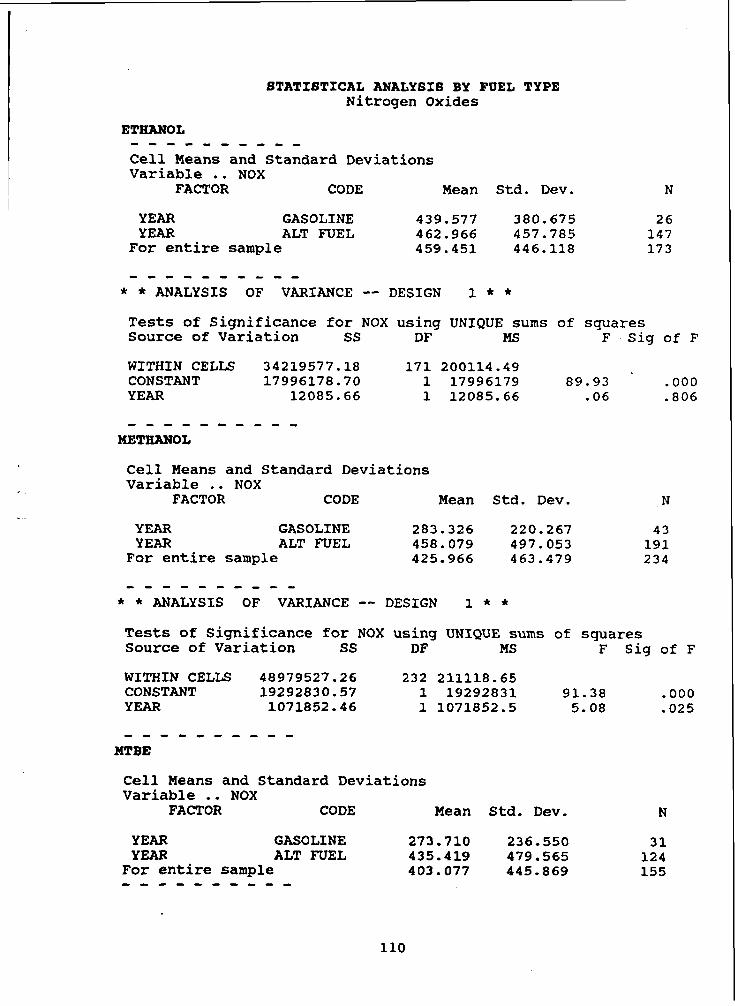
BTATXBTICAL ANALYSIB BY FUEL TYPE Nitrogen Oxides
ETHANOL - - - - - - - - - - Cell Means and Standard Deviations Variable .. NOX
FACTOR CODE Mean Std. Dev.
YEAR GASOLINE 439.577 380.675 26 YEAR ALT FUEL 462.966 457.785 147
For entire sample 459.451 446.118 17 3
- - - - - - - - - - * * ANALYSIS OF VARIANCE -- DESIGN 1 * * Tests of Significance for NOX using UNIQUE sums of squares Source of Variation SS Dl? MS F Sig of F
WITHIN CELLS 34219577.18 171 200114.49 CONSTANT 17996178.70 1 17996179 89.93 .OOO YEAR 12085.66 1 12085.66 .06 .806
- - - - - - - _ - - METHANOL
Cell Means and Standard Deviations Variable .. NOX
FACTOR CODE Mean Std. Dev. N
YEAR GASOLINE 283.326 220.267 4 3 YEAR ALT FUEL 458.079 497.053 191
For entire sample 425.966 463.479 234
- - - - - - - - - - * * ANALYSIS OF VARIANCE -- DESIGN 1 * *
Tests of Significance for NOX using UNIQUE sums of squares Source of Variation SS DF MS F Sig of F
WITHIN CELLS 48979527.26 232 211118.65 CONSTANT 19292830.57 1 19292831 91.38 .OOO YEAR 1071852.46 1 1071852.5 5.08 .025
- - - - - - - - - - MTBE
Cell Means and Standard Deviations Variable .. NOX
FACTOR CODE Mean Std. Dev. N
YEAR GASOLINE 273.710 236.550 31 YEAR ALT FUEL 435.419 479.565 12 4
For entire sample 403.077 445.869 155 - - - - - - - - - -

* * ANALYSIS OF VARIANCE -- DESIGN 1 * * Tests of Significance for NOX using UNIQUE sums of squares Source of Variation SS Dl? MS F Sig of F
WITHIN CELU 29966568.58 153 195859.93 CONSTANT 12471026.81 1 12471027 63.67 .OOO YEAR 648520.49 1 648520.49 3.31 .07.1
- - - - - - - - - - CNG
Cell Means and Standard Deviations Variable .. NOX
FACTOR CODE Mean Std. Dev.
YEAR GASOLINE 313.148 221.181 YEAR ALT FWEL 441.389 430.223 For entire sample 413.008 396.434
- - - - - - - - - - * * ANALYSIS OF VARIANCE -- DESIGN 1 * * Tests of Significance for NOX using UNIQUE sums of squares Source of Variation SS DF MS F Sig of F
WITHIN CELLS 18670610.00 120' 155588.42 CONSTANT 11969867.32 1 11969867 76.93 ,000 YEAR 345766.99 1 345766.99 2.22 .I39
- - - - - - - - - - PROPANE
Cell Means and Standard Deviations Variable .. NOX
FACTOR CODE Mean Std. Dev. N
YEAR GASOLINE 345.474 350.994 38 YEAR ALT FUEL 293.743 347.244 167 For entire sample 303.332 347.661 2 05
- - - - - - - - - - * * ANALYSIS OF VARIANCE -- DESIGN 1 * * Tests of Significance for NOX using UNIQUE sums of squares Source of Variation SS DF MS F Sig of F
WITHIN CELLS 24574307.40 203 121055.70 CONSTANT 12648579.4 1 1 12648579 104.49 . 000 YEAR 82842.04 1 82842.04 .68 .4 09

8TATISTICAL ANALYSIS FOR MONTHS OF OCTOBER THROUGH DECEMBER N i t r o g e n O x i d e s
- - - - - - - - - - C e l l M e a n s and Standard D e v i a t i o n s V a r i a b l e .. NOX
FACTOR CODE M e a n Std. D e v . N
F'UELTY PE YEAR YEAR
FUELTY PE YEAR YEAR
FUE LTY P E YEAR YEAR
FUELTY PE YEAR YEAR
R l E L T Y PE YEAR YEAR
For en t i re
ETHANOL GASOLINE A L T FUEL
METHANOL GASOLINE A L T FUEL
MTBE GASOLINE ALT FUEL
CNG GASOLINE A L T F U E L
PROPANE GASOLINE ALT FUEL
s a m p l e
- - - - - - - - - - * * ANALYSIS O F VARIANCE -- DESIGN 1 * *
T e s t s of Signif icance for NOX u s i n g UNIQUE sums of squares Source of V a r i a t i o n SS DF M S F s i g of F
W I T H I N C E L L S 48778053.67 283 172360.61 CONSTANT 45446486.91 1 45446487 263.67 .OOO FUELTY PE 673662.23 4 168415.56 .98 - 4 2 0 YEAR 1624863.31 1 1624863.3 9.43 .002 FUELTYPE BY YEAR 2234856.67 4 558714.17 3.24 .013

Appendix Il l .
Emissions Analysis Department of Environmental Quality

. ._ .. . 8 .
& ARIZONA DEPARTMENT OF ENVIRONMENTAL QUALITY q>., . 6s.
--.it: 6'
ROSE MOFFORD. GOVERNOR RAM)OLPH WOOD. DIRECTOR
C\ '.'q y4: / #
ADOT ALTERNATIVE N E L S FLEET -- P I I S S T O N ~ ~ ~ S T P-~OG~~LM'>. '*,
1 ' 1 - 1 3-.-. .'3 . . . . . By Frank W. Cox .. . . c,. .... :.. '.r
; , \$ '*'- ';':.; . . . , . '. .
Introduction
An i n c r e a s i n g p o p u l a t i o n ( b o t h human and v e h i c l e ) and c o r r e s p o n d i n g i n c r e a s e s i n v a r i o u s e n v i r o n m e n t a l p o l l u t a n t s h a s prompted t h e S t a t e o f Ar i zona t o e n a c t l e g i s l a t i o n e s t a b l i s h i n g c o n t r o l s and m a n d a t i n g r e s e a r c h a imed a t a b a t e m e n t . HB 2115 and SB 1360 mandated an a l t e r n a t i v e - f u e l s f l e e t s t u d y t o be pe r fo rmed by t h e A r i z o n a Depar tment of T r a n s p o r t a t i o n (ADOT), and HB 2206 mandated a v e h i c l e e m i s s i o n s s t u d y o f a r e p r e s e n t a t i v e p o r t i o n o f t h e ADOT f l e e t t o be pe r fo rmed by t h e A r i z o n a Depa r tmen t o f E n v i r o n m e n t a l Q u a l i t y (ADEQ).
The ADOT v e h i c l e f l e e t w a s p u t i n t o s e r v i c e i n O c t o b e r o f 1 9 8 7 u s i n g u n l e a d e d g a s o l i n e t o g a t h e r b a s e l i n e p e r f o r m a n c e and I & M e m i s s i o n d a t a . I n J a n u a r y o f 1988 t h e u s e o f t h e b a s e l i n e g a s o l i n e was d i s c o n t i n u e d and o p e r a t i o n on t h e v a r i o u s a l t e r n a t i v e f u e l s began . I n F e b r u a r y of 1989, a f t e r t h i r t e e n mon ths of o p e r a t i o n on t h e a l t e r n a t i v e f u e l s , t h e ADEQ E m i s s i o n s R e s e a r c h L a b o r a t o r y (ERL) began t e s t i n g s e l e c t e d ADOT f l e e t v e h i c l e s t o d e t e r m i n e t h e e f f e c t , i f a n y , o f t h e a l t e r n a t i v e f u e l s on e v a p o r a t i v e a n d e x h a u s t e m i s s i o n s as compared t o - t h e s e e m i s s i o n s g e n e r a t e d by t h e u s e o f u n l e a d e d g a s o l i n e .
T h i s r e p o r t c o n t a i n s t h e summarized d a t a o b t a i n e d from t h e ERL t e s t i n g and d i s c u s s i o n s o f t h i s d a t a a n d t h e test m e t h o d s .
Vehicles
The t e s t v e h i c l e f l e e t i s l i s t e d i n T a b l e 1. The o n l y v e h i c l e t y p e i n c l u d e d i n t h e ADOT f l e e t which w a s n o t tes ted was t h e 1984 C h e v r o l e t S10 p i c k u p . T h i s v e h i c l e t y p e w a s o m i t t e d f rom t h e t e s t f l e e t b e c a u s e of i ts s i m i l a r i t y t o t h e 1983 C h e v r o l e t S10 p i c k u p . I n o r d e r t o d i r e c t l y compare f u e l e f f e c t s , v e h i c l e s 1 t h r u 5 were tested w i t h u n l e a d e d g a s o l i n e and two d i s c r e e t o x y g e n a t e d f u e l s , o n e c o n t a i n i n g m e t h y l t e r t i a r y b u t y l e t h e r (MTBE) and t h e o t h e r c o n t a i n i n g e t h a n o l ( E t O H ) . V e h i c l e 6 was a gasol ine/CNG ( c o m p r e s s e d n a t u r a l g a s ) d u a l - f u e l e d v e h i c l e and was t e s t e d o n l y w i t h t h e s e two f u e l s ( n o o x y g e n a t e d f u e l s u b s t i t u t e d f o r t h e g a s o l i n e ) . V e h i c l e 7 had been c o n v e r t e d t o l i q u i d p e t r o l e u m g a s ( L P G ) , was f u e l d e d i c a t e d , and c o u l d n o t b e t e s t e d w i t h o t h e r f u e l s . The r e m a i n i n g v e h i c l e ( 8 ) was t e s t e d w i t h u n l e a d e d g a s o l i n e a n d w i t h a t h i r d o x y g e n a t e d f u e l c o n t a i n i n g m e t h a n o l (MeOH). V e h i c l e s 6,7, and 8 w e r e , w i t h r e s p e c t t o e m i s s i o n c o n t r o l s y s t e m and t o e n g i n e s i z e and c o n f i g u r a t i o n , s i m i l a r t o v e h i c l e s 5 , 4 , and 3 , r e s p e c t i v e l y .
The Depor~mcnt of f i v i r o n m c ~ a l Qmlify u An Equal Opporlumiry A//irmoliwe Acrion Employer.
600 North 40th Suecl
-
Phocnix. Arizona 85008
.

F u e l s
The o x y g e n a t e c o m p o s i t i o n s and Reid v a p o r p r e s s u r e s ( R V P ) o f t h e l i q u i d t e s t f u e l s w e r e :
RVP, psi O r i q i n a l A c t u a l
Composition (nominal)
1. Unleaded G a s o l i n e ( n e a t ) 2. G a s o l i n e / 11% MTBE 3 . G a s o l i n e / 10% E t O H 4 . G a s o l i n e / 5 % MeOH/52 TBA 2
Fuel Samples T e s t F u e l s
1. T h i s a p p a r e n t l y low RVP i s d i s c u s s e d l a t e r i n t h i s r e p o r t . 2 . A c t u a l l y e q u i v a l e n t t o " O x i n o l " ( A R C 0 t r a d e name) w i t h 4 . 7 5 %
MeOH/4.75% TBA. 3 . T h i s f u e l was n o t u s e d f o r t e s t i n g .
F u e l s a m p l e s were t a k e n from t h e s t o r a g e t a n k s a t t h e ADOT f u e l i n g d e p o t s . The c r i t e r i o n f o r a c c e p t a n c e f o r t e s t i n g was t h a t t h e R V P s o f t h e l i q u i d f u e l s b e s imi la r . F u e l s , 1 , 2 , and 3 were judged t o be a c c e p t a b l e , b u t t h e v a p o r p r e s s u r e o f t h e " O x i n o l " b l e n d was t o o low. The e n t i r e s u p p l i e s o f f u e l s 1 , 2 , and 3 w e r e t a k e n a s s i n g l e b a t c h e s of
. . t h e i n d i v i d u a l f u e l s d i r e c t l y f rom t h e ADOT s t o r a g e t a n k s i n t o 55- g a l l o n drums and i m m e d i a t e l y s e a l e d . The s t o r a g e t a n k s f rom which t h e test f u e l s were t a k e n w e r e t h e same a s t h o s e from which t h e o r i g i n a l s amples w e r e o b t a i n e d . The " O x i n o l " test f u e l was a c q u i r e d a f t e r t h e ADOT t o o k d e l i v e r y o f a new b a t c h . The v a p o r p r e s s u r e o f t h i s f u e l was w i t h i n t h e d e s i r e d r a n g e .
T e s t P r o c e d u r e s
Upon d e l i v e r y , e a c h v e h i c l e f u e l t a n k was removed and a d r a i n l i n e and t h e r m o c o u p l e were i n s t a l l e d . The d r a i n l i n e was e x t e n d e d t o t h e l o w e s t p o i n t o f t h e t a n k and t h e t h e r m o c o u p l e t o t h e m i d p o i n t be tween t h e t a n k bot tom a n d t h e f u e l s u r f a c e a t t h e 4 0 % n o m i n a l f u e l t a n k volume l e v e l . Each t a n k was t h e n p r e s s u r i z e d t o 3 p s i a i r . t o e n s u r e v a p o r t i g h t n e s s and r e i n s t a l l e d on t h e v e h i c l e .
Each v e h i c l e was c h e c k e d for e n g i n e vacuum l e a k s and f a u l t y s p a r k p l u g s and s p a r k p l u g w i r e s . These were t h e o n l y m a i n t e n a n c e i t e m s r e p l a c e d when f o u n d t o b e f a u l t y . Eng ine o p e r a t i n g p a r a m e t e r s w e r e a l s o checked a n d , e x c e p t i n g the LPG and CNG v e h i c l e s , set t o f a c t o r y s p e c i f i c a t i o n s . V e h i c l e p r e p a r a t i o n was comple t ed w i t h c h e c k s o f t h e e x h a u s t s y s t e m and i n s t a l l e d f u e l t a n k f o r l e a k s . T h i s was a c c o m p l i s h e d w i t h t h e i n s t r u m e n t bench h y d r o c a r b o n a n a l y z e r by a t t a c h i n g a 3 - p o r t v a l v e and
- s n i f f l i n e be tween t h e s a m p l e i n l e t a n d the a n a l y z e r .

A t t h e e n d o f t e s t i n g , t h e the rmocoup le was removed from t h e f u e l t a n k and t h e f i t t i n g s i n s t a l l e d f o r t h e the rmocoup le and d r a i n l i n e were capped.
With t h r e e e x c e p t i o n s , t o be d i s c u s s e d be low, t h e F e d e r a l T e s t P r o c e d u r e (FTP) was u s e d f o r a l l t es ts . The d e t a i l s o f t h e p r o c e d u r e a r e g i v e n i n t h e Code o f F e d e r a l R e g u l a t i o n s (CFR) T i t l e 4 0 , P a r t 861 S u b p a r t B. T h i s r e f e r e n c e a l s o g i v e s t h e d e t a i l s o f t h e r e q u i r e d e q u i p m e n t , c a l i b r a t i o n s , a n d c o n d i t i o n s .
One d e p a r t u r e f rom t h e FTP conce rned t h e a m b i e n t tes t t e m p e r a t u r e l i m i t s . The FTP r e q u i r e s t h a t t h e t e m p e r a t u r e t o which t h e v e h i c l e and tes t e q u i p m e n t a r e e x p o s e d be m a i n t a i n e d w i t h i n t h e l i m i t s , 68°F t o 86°F. S i n c e t h e a v a i l a b l e test f u e l s w e r e w i n t e r g r a d e ( v a p o r p r e s s u r e s a t t h e l o w e r end o f v o l a t i l i t y c l a s s D ) , t h e d e c i s i o n was made t o test a t l o w e r t h a n t h e s p e c i f i e d a m b i e n t t e m p e r a t u r e r a n g e . An a m b i e n t t e m p e r a t u r e r a n g e o f 5 1 ° F t o 69°F was c h o s e n ( a -17°F o f f s e t f rom t h e . FTP) b e c a u s e 1. i t was b e l i e v e d t o be t h e l o w e s t f e a s i b l e r a n g e a t wh ich t h e f a c i l i t y c o u l d b e m a i n t a i n e d , 2 . t h i s r a n g e more n e a r l y s i m u l a t e s w i n t e r t e m p e r a t u r e s i n Mar icopa c o u n t y , and 3 . t h e FTP s p e c i f i e d t e m p e r a t u r e s would r e s u l t i n u n r e a l i s t i c c a n i s t e r l o a d i n g d u r i n g t h e p r e t e s t s o a k p e r i o d .
The d i u r n a l ( o r h e a t b u i l d ) e v a p o r a t i v e (SHED) test i s i n t e n d e d t o measu re e v a p o r a t i v e l o s s e s d u r i n g a s i m u l a t e d d i u r n a l ( d a i l y I
m- t e m p e r a t u r e r i se . T e s t i n g a t l o w e r ambien t t e m p e r a t u r e s r e q u i r e d t h a t t h e t e m p e r a t u r e r a n g e f o r t h e f u e l h e a t b u i l d a l s o be l o w e r e d .
- - A c c o r d i n g l y , t h i s r a n g e w a s l o w e r e d 1 7 ° F f rom t h e FTP t o 43°F-67°F. The FTP h e a t b u i l d ramp was m a i n t a i n e d .
P r e c e d i n g the 12-36 h o u r s o a k p e r i o d p r i o r t o t e s t i n g , t h e FTP s t i p u l a t e s t h a t t h e f u e l t a n k b e d r a i n e d , t h e v e h i c l e r e f u e l e d t o t h e r e q u i r e d volume, and t h e n d r i v e n on t h e dynomometer a c c o r d i n g t o t h e Urban Dynomometer D r i v i n g S c h e d u l e (UDDS) a n d a t t h e v e h i c l e tes t w e i g h t a n d h o r s e p o w e r . The UDDS i s r e q u i r e d w i t h i n one hour of r e f u e l i n g . The FTP a l l o w s u p t o t h r e e a d d i t i o n a l p r e c o n d i t i o n i n g d r i v i n g c y c l e s , e a c h p r e c e d e d by a o n e h o u r s o a k p e r i o d .
S i n c e e a c h ADOT tes t f u e l w a s s i g n i f i c a n t l y d i f f e r e n t f rom t h e o t h e r s , and t o m i n i m i z e memory e f f e c t s , a t h r e e - d r i v i n g - c y c l e s c h e d u l e was a d o p t e d f o r p r e c o n d i t i o n i n g when t h e t e s t f u e l was d i f f e r e n t f rom t h e
-. p r e c e d i n g test . For b a c k - t o - b a c k tests w i t h t h e same fuel, t h e s i n g l e p r e c o n d i t i o n i n g d r i v i n g c y c l e was used . The t h r e e - d r i v i n g - c y c l e s c h e d u l e was:
i 1. d r a i n and r e f u e l 2 . U D D S d r i v i n g c y c l e w i t h i n o n e h o u r o f r e f u e l i n g 3 . t e n m i n u t e s o a k 4 . UDDS d r i v i n g c y c l e 5 . one hour s o a k 6. d r a i n and r e f u e l 7. UDDS d r i v i n g c y c l e .

The s o a k p e r i o d be tween t h e f i r s t and s e c o n d d r i v i n g c y c l e s w a s r e d u c e d t o t e n m i n u t e s t o c o n s e r v e t i m e and t h e e x t r a r e f u e l i n g was i n c l u d e d a s an added m e a s u r e t o m i n i m i z e memory e f f e c t s o f t h e p r e v i o u s f u e l .
The f u e l s e q u e n c e w a s random b e g i n n i n g o r e n d i n g t h e tes t series w i t h no p a r t i c u l a r f u e l . F o r t h e f i r s t t e s t , however , e a c h v e h i c l e was p r e c o n d i t i o n e d u s i n g t h e t h r e e - d r i v i n g - c y c l e s c h e d u l e .
A t l e a s t two tests were pe r fo rmed w i t h e a c h v e h i c l e / f u e l c o u p l e . A t h i r d tes t was p e r f o r m e d when ag reemen t be tween t h e d u p l i c a t e tes ts was judged t o b e i n a d e q u a t e o r when FTP l i m i t s w e r e exceeded t o a p o i n t c o n s i d e r e d t o be c a p a b l e o f p r o d u c i n g s i g n i f i c a n t e f f e c t s on tes t d a t a .
R e s u l t s and D i s c u s s i o n s
The r e s u l t s o f t h e e m i s s i o n s test program a r e p r e s e n t e d i n T a b l e 2 . E x c e p t i n g t h e SHED e m i s s i o n s f o r v e h i c l e B 5 4 5 i n t h e CNG mode, e a c h e m i s s i o n v a l u e i s t h e a r i t h m e t i c a v e r a g e o f a t leas t d u p l i c a t e t e s t s , and i n some c a s e s , t r i p l i c a t e tests . The number of v e h i c l e s was s m a l l and l i t t l e e f f o r t was e x e r t e d t o v e r i f y m e c h a n i c a l c o n d i t i o n o r e m i s s i o n c o n t r o l f u n c t i o n a l i t y . T h e r e f o r e , no s t a t i s t i c a l e v a l u a t i o n h a s been p e r f o r m e d t o d e t e r m i n e t h e s i g n i f i c a n c e o f d a t a m a g n i t u d e o r r e l a t i v i t y . T h i s d i s c u s s i o n is based upon a g e n e r a l i n t e r p r e t a t i o n of
. - t h e d a t a and t h e r e s u l t i n g c o n c l u s i o n s r e f l e c t t h e o p i n i o n o f t h e a u t h o r .
. - E v a p o r a t i v e e m i s s i o n s a r e p r i m a r i l y e f f e c t e d by 1. tes t temper i ture ( a n d t e m p e r a t u r e r a m p ) , 2 . f u e l c o m p o s i t i o n and v o l a t i l i t y , 3 . t h e t y p e and c o n d i t i o n o f t h e f u e l h a n d l i n g s y s t e m , .and 4 . t h e c o n f i g u r a t i o n and c o n d i t i o n o f t h e e v a p o r a t i v e e m i s s i o n c o n t r o l s . S i n c e b o t h a m b i e n t and h e a t b u i l d t e m p e r a t u r e s w e r e l o w e r e d by 1 7 ° F from t h e FTP, t h e SHED d a t a c a n o n l y be i n t e r n a l l y compared. The magn i tude o f t h e e v a p o r a t i v e e m i s s i o n s is s i g n i f i c a n t o n l y f o r compar i son o f t h e v a r i o u s f u e l s w i t h a s i n g l e v e h i c l e . R e l a t i v e d a t a c a n , however , be compared a c r o s s t h e v e h i c l e / f u e l m a t r i x . The f u e l v a p o r p r e s s u r e s g i v e n p r e v i o u s l y i n t h i s r e p o r t would l e a d t o a t e n t a t i v e c o n c l u s i o n t h a t t h e e v a p o r a t i v e e m i s s i o n s f rom t h e g a s o l i n e s h o u l d be l o w e r t h a n f rom t h e a l t e r n a t i v e l i q u i d f u e l s . The d a t a , however , d o n o t s u p p o r t t h i s c o n c l u s i o n . A t f a c e v a l u e , t h e d a t a i n d i c a t e t h a t e s s e n t i a l l y e q u i v a l e n t v a p o r s a r e e m i t t e d f rom t h e MTBE f u e l a s compared t o g a s o l i n e and l o w e r l e v e l s are e m i t t e d f rom t h e E t O H f u e l .
A number o f p a r a m e t e r s w h i c h i n f l u e n c e e v a p o r a t i v e e m i s s i o n s mus t be c o n s i d e r e d . F i r s t , R V P i s a measu re of v o l a t i l i t y a t lOOoF and t h e r a t e of v a p o r p r e s s u r e c h a n g e a s a f u n c t i o n of t e m p e r a t u r e i s n o t known f o r t h e tes t f u e l s . I n a d d i t i o n , t h e h i s t o r y and c o n d i t i o n o f t h e c o n t r o l c a n i s t e r s is n o t known, and t h e a v e r a g e r e p l i c a t e v a r i a t i o n o f a l l v e h i c l e / f u e l c o u p l e s was a b o u t 2 0 % , a v a r i a b i l i t y c o n s i s t e n t w i t h l i t e r a t u r e v a l u e s . These u n c e r t a i n t i e s l e a v e l i t t l e d o u b t t h a t no c o n c l u s i o n can be drawn w i t h r e s p e c t t o t h e e f f e c t of f u e l c o m p o s i t i o n upon e v a p o r a t i v e e m i s s i o n s .
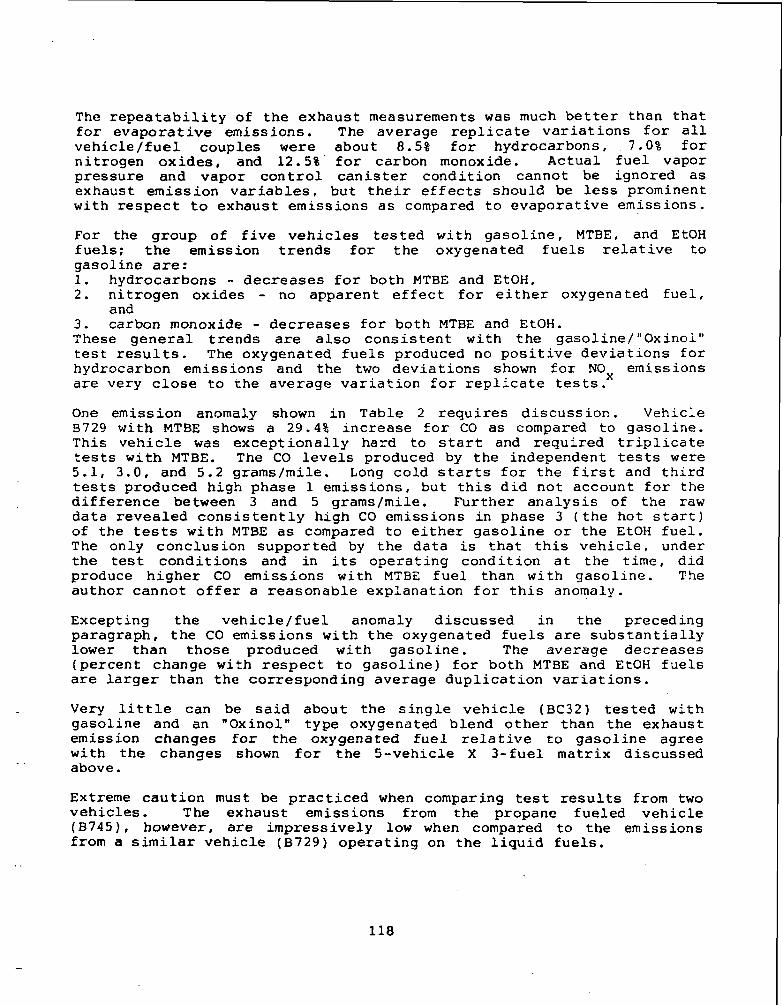
The r e p e a t a b i l i t y o f t h e e x h a u s t measurements was much b e t t e r t h a n t h a t f o r e v a p o r a t i v e e m i s s i o n s . The a v e r a g e r e p l i c a t e v a r i a t i o n s f o r a l l v e h i c l e / f u e l c o u p l e s were a b o u t 8 .5% f o r h y d r o c a r b o n s , 7 .0% f o r n i t r o g e n o x i d e s , and 12.5% f o r carbon monoxide. A c t u a l f u e l vapor p r e s s u r e and v a p o r c o n t r o l c a n i s t e r c o n d i t i o n canno t be i g n o r e d a s exhaus t e m i s s i o n v a r i a b l e s , b u t t h e i r e f f e c t s s h o u l d be less prominent w i t h r e s p e c t t o e x h a u s t e m i s s i o n s a s compared t o e v a p o r a t i v e e m i s s i o n s .
For t h e g r o u p of f i v e v e h i c l e s t e s t e d w i t h g a s o l i n e , MTBE, and E t O H f u e l s ; t h e e m i s s i o n t r e n d s f o r t h e oxygenated f u e l s r e l a t i v e t o g a s o l i n e a r e : 1. h y d r o c a r b o n s - d e c r e a s e s f o r bo th MTBE and EtOH, 2. n i t r o g e n o x i d e s - no a p p a r e n t e f f e c t f o r e i t h e r oxygenated f u e l ,
and 3 . carbon monoxide - d e c r e a s e s f o r b o t h MTBE and EtOH. These g e n e r a l t r e n d s a r e a l s o c o n s i s t e n t w i t h t h e g a s o l i n e / "Oxino l" test r e s u l t s . The oxygena ted f u e l s produced no p o s i t i v e d e v i a t i o n s f o r hydrocarbon e m i s s i o n s and t h e two d e v i a t i o n s shown f o r NOx e m i s s i o n s a r e v e r y c l o s e t o t h e a v e r a g e v a r i a t i o n f o r r e p l i c a t e t e s t s .
One e m i s s i o n anomaly shown i n T a b l e 2 r e q u i r e s d i s c u s s i o n . V e h i c l e B729 w i t h MTBE shows a 29.4% i n c r e a s e f o r CO a s compared t o g a s o l i n e . T h i s v e h i c l e was e x c e p t i o n a l l y h a r d t o s t a r t and r e q u i r e d t r i p l i c a t e tests w i t h MTBE. The CO l e v e l s produced by t h e i n d e p e n d e n t tes ts were 5.1, 3 .0 , and 5 . 2 g rams /mi le . Long c o l d s t a r t s f o r t h e f i r s t and t h i r d tes ts p r o d u c e d h i g h p h a s e 1 e m i s s i o n s , b u t t h i s d i d n o t a c c o u n t f o r t h e d i f f e r e n c e between 3 and 5 g rams /mi le . F u r t h e r a n a l y s i s of t h e raw d a t a r e v e a l e d c o n s i s t e n t l y h i g h CO e m i s s i o n s i n phase 3 ( t h e h o t s t a r t ) o f t h e tests w i t h MTBE as compared t o e i t h e r g a s o l i n e o r t h e E t O H f u e l . The o n l y c o n c l u s i o n s u p p o r t e d by t h e d a t a i s t h a t t h i s v e h i c l e , under t h e test c o n d i t i o n s and i n i t s o p e r a t i n g c o n d i t i o n a t t h e t i m e , d i d produce h i g h e r CO e m i s s i o n s w i t h MTBE f u e l than w i t h g a s o l i n e . The a u t h o r c a n n o t o f f e r a r e a s o n a b l e e x p l a n a t i o n f o r t h i s anomaly.
Excep t ing t h e v e h i c l e / f u e l anomaly d i s c u s s e d i n the p r e c e d i n g p a r a g r a p h , t h e CO e m i s s i o n s w i t h t h e oxygenated f u e l s a r e s u b s t a n t i a l l y lower t h a n t h o s e produced w i t h g a s o l i n e . The a v e r a g e d e c r e a s e s ( p e r c e n t change w i t h r e s p e c t t o g a s o l i n e ) f o r b o t h MTBE and EtOH f u e l s a r e l a r g e r t h a n t h e c o r r e s p o n d i n g a v e r a g e d u p l i c a t i o n v a r i a t i o n s .
Very l i t t l e can be s a i d a b o u t t h e s i n g l e v e h i c l e (BC32) t e s t e d w i t h g a s o l i n e and an "Oxino l" t y p e oxygenated b l e n d o t h e r t h a n t h e e x h a u s t emiss ion changes f o r t h e oxygenated f u e l r e l a t i v e t o g a s o l i n e a g r e e
. . w i t h t h e changes shown f o r t h e 5 - v e h i c l e X 3 - f u e l m a t r i x d i s c u s s e d above.
Extreme c a u t i o n must be p r a c t i c e d when comparing test r e s u l t s from two v e h i c l e s . The e x h a u s t e m i s s i o n s from t h e p ropane f u e l e d v e h i c l e (B745) , however, a r e i m p r e s s i v e l y low when compared t o t h e e m i s s i o n s from a s i m i l a r v e h i c l e (B729) o p e r a t i n g on t h e l i q u i d f u e l s .

The d u a l - f u e l e d gasoline/CNG v e h i c l e ( 8 5 4 5 ) e m i s s i o n s a r e n o t r e p r e s e n t a t i v e . T e s t r e s u l t s prompted an " a f t e r - t h e - f a c t " more d e t a i l e d i n s p e c t i o n o f t h e v e h i c l e . A p p a r e n t l y , a f a u l t y PCV v a l v e had caused e n g i n e o i l t o b e drawn i n t o t h e i n t a k e sys tem. Both t h e i n t a k e a i r f i l t e r and the e v a p o r a t i v e c o n t r o l c a n i s t e r were s a t u r a t e d w i t h e n g i n e o i l . Comparing e m i s s i o n s from t h i s v e h i c l e , a g a i n w i t h r e s e r v a t i o n s , t o t h o s e from a s i m i l a r v e h i c l e (B511) l e a d s t o t h e c o n c l u s i o n t h a t t h e d u a l - f u e l e d v e h i c l e was o p e r a t i n g f u e l r i c h w i t h g a s o l i n e and e x c e p t i o n a l l y f u e l r i c h w i t h CNG. The s i g n i f i c a n c e of t h e v e h i c l e B545 d a t a l i e s i n t h e i r v a l u e f o r d e m o n s t r a t i n g t h e h i g h e v a p o r a t i v e e m i s s i o n s a s s o c i a t e d w i t h an i n o p e r a t i v e c o n t r o l c a n i s t e r and t h e change i n e x h a u s t e m i s s i o n s a s s o c i a t e d w i t h f u e l r i c h o p e r a t i o n ( e x h a u s t NO is l o w e r e d , b u t HC and CO e m i s s i o n s i n c r e a s e ; a t some p o i n t , t o in? to le rab le l e v e l s ) .
I t i s w e l l known t h a t t h e compos i t ion of e x h a u s t hydrocarbon e m i s s i o n s is s i m i l a r t o t h e f u e l hydrocarbon compos i t ion . The methane f r a c t i o n s o f v e h i c l e B545 e x h a u s t hydrocarbon e m i s s i o n s w e r e c a l c u l a t e d and found t o a v e r a g e 7 . 9 % w i t h g a s o l i n e and 71.3% when t h e v e h i c l e was f u e l e d by CNG. The l a r g e i n c r e a s e i n t h e methane p o r t i o n of t h e hydrocarbon e m i s s i o n s i s i n d i c a t i v e o f a d e c r e a s e i n r e a c t i v i t y w i t h r e s p e c t t o a t m o s p h e r i c smog f o r m a t i o n .
T a b l e 2 a l s o c o n t a i n s v o l u m e t r i c f u e l economy (FE) v a l u e s . S i n c e t h e UDDS i n v o l v e s v e r y l i t t l e s t e a d y s t a t e o p e r a t i o n a t c r u i s e s p e e d s , t h e FE magni tude i s n o t d i r e c t l y r e l a t a b l e t o u s e r s e r v i c e . The v a l u e s i n t h e t a b l e s h o u l d , however , approx imate t h e f u e l economy o f t h e v e h i c l e s when o p e r a t e d i n p o p u l a t e d a r e a s . The v o l u m e t r i c FE g a i n s shown f o r MTBE ( 8 9 3 8 ) and f o r MTBE and E t O H (B511) r e s u l t e d from two ( o f t w e l v e ) anomalous e x h a u s t CO l e v e l s . C 0 2 was low f o r one of t h e d u p l i c a t e tests o f B938 w i t h M&E f u e l and h i g h f o r one o f t h e d u p l i c a t e fes ts o f B511 w i t h g a s o l i n e . The v o l u m e t r i c ene rgy c o n t e n t of t h e oxygenated f u e l s is s l i g h t l y less t h a n t h a t of g a s o l i n e and a s m a l l , c o r r e s p o n d i n g d e c r e a s e i n v o l u m e t r i c f u e l economy s h o u l d be e x p e c t e d . The 2 . 2 % a v e r a g e l o s s f o r t h e oxygenated f u e l s ( d i s r e g a r d i n g t h e v a l u e s d i s c u s s e d above) i s r e a s o n a b l e .
The v o l u m e t r i c f u e l economies f o r t h e v e h i c l e s o p e r a t i n g on gaseous f u e l s (CNG and LPG) a r e g i v e n i n g a s o l i n e e q u i v a l e n t s based upon t h e ene rgy consumed. The e n e r g y c h a r g e d e n s i t y w i t h i n t h e e n g i n e c a n n o t be m a i n t a i n e d w i t h c a r b u r e t e d gaseous f u e l s a s compared t o l i q u i d f u e l s [ t h e r e is a v o l u m e t r i c e f f i c i e n c y l o s s ) ; t h e r e f o r e , a f u e l economy l o s s is i n e v i t a b l e .
The f u e l economy b a s e d upon e n e r g y c o n t e n t i s g i v e n i n T a b l e 3 i n terms of BTU consumpt ion p e r m i l e t r a v e l e d . These d a t a show t h a t t h e r e i s l i t t l e , i f a n y , d i f f e r e n c e i n o p e r a t i n g e f f i c i e n c y a s s o c i a t e d w i t h the u s e of any o f t h e l i q u i d f u e l s , D i s r e g a r d i n g t h e t h r e e v a l u e s d i s c u s s e d e a r l i e r i n c o n j u n c t i o n w i t h v o l u m e t r i c f u e l economy, t h e a v e r a g e change i n f u e l - e n e r g y economy was + 0 . 4 % when t h e oxygenated f u e l s were u s e d .

summary
The Emissions Research Laboratory of t h e ADEQ t e s t e d e i g h t ( 8 ) s e l e c t e d v e h i c l e s from t h e ADOT a l t e r n a t i v e f u e l s f l e e t t o determine t h e e f f e c t of t h e a l t e r n a t i v e f u e l s upon evapora t ive and exhaust emiss ions . Dupl ica te tests were performed f o r a l l v e h i c l e / f u e l couples. Five ( 5 ) veh ic l e s were t e s t e d w i t h t h r e e ( 3 ) f u e l s (unleaded g a s o l i n e , gaso l ine / 11% MTBE, and gaso l ine / lO% e t h a n o l ) ; one ( I ) v e h i c l e was t e s t e d w i t h g a s o l i n e and gaso l ine /S% methanol/5% TBA; one ( 1 ) v e h i c l e ( d u a l - f u e l e d ) was t e s t e d wi th g a s o l i n e a n d CNG; and one 1 ) v e h i c l e ( d e d i c a t e d ) was t e s t e d w i t h LPG.
For t he 5 - v e h i c l e / 3 - f u e l test ma t r ix (and t e n t a t i v e l y t h e s i n g l e v e h i c l e w i t h g a s o l i n e / "Oxinolw ) the oxygenated f u e l e f f e c t s were: 1. no apparen t e f f e c t on evapora t ive emis s ions , exhaust NOx, . o r f u e l - energy economy; and 2. dec reases i n exhaus t HC, exhaus t CO, and volumet r ic f u e l economy, A mechanical problem ( a f a u l t y PCV v a l v e ) s eve re ly l i m i t e d t h e v a l u e of the d a t a ob ta ined from t h e gasoline/CNG dual - fue led v e h i c l e , bu t emiss ions from t h e ded ica t ed LPG v e h i c l e were impres s ive ly low.
FEC :mc
Attachments: Table 1
, , Table 2 Table 3

TABLE 1 TEST VEHICLE MATRIX
ENGINE FAMILY EMISSION CONTROL ADOT No.
1. 1986 C h e v r o l e t S10 GlG2-8T5HTR5 EGR/ PMP/OXD/CLS BD12
2. 1985 C h e v r o l e t C e l e b r i t y FlG2-8V8HGG9 EGR/3CL A44 6
3. 1985 Ford Ranger FFM2-8T2HKGO EGR/PMP/OXD/3CL 8938
4. 1983 C h e v r o l e t S10 DlG2-8T2H5C2 EGR/PMP/OXD B729
5. 1980 C h e v r o l e t C10 08Y2A EGR/OXD B511
O p t i o n a l *
6. 1980 C h e v r o l e t C10 0 8 Y 2 A EGR/OXD ( CNG ) B54 5
7. 1983 C h e v r o l e t S10 DlG2-8T2H5C2 EGR/PMP/OXD ( LPG) B745
8. 1985 Ford Ranger FFMZ-BT2HKGD EGR/PMP/OXD/ 3CL BC3 2
V e h i c l e s i n t h e o p t i o n a l c a t e g o r y t o be tested o n l y on b a s e g a s o l i n e and o n e a l t e r n a t i v e f u e l : CNG f o r 6 , LPG f o r 7 and methano l b l e n d f o r 8.

FUEL TYPE EVIFL."TIVE EliiBCST !!:! :! / ? a !
Shed css. i: Cho. HI: ~ r s . :! Chc. !)G: ens. Z C ~ P . CO !IT:.., 1 Lhc . 'lrh .I. 1. --
1935 CGEJRCLET tELEE?iTi (45C61
Gasoline 0.3 C.4 0.5 2.0 i 7. e
? T ? i 112 C. 3 2. 0 0.3 -2E.G 0.5 0.0 6.7 -!is: 17.2
E t h ~ n ~ l 105 0.2 -7- i d . 7 - 0 .3 -5: -2.f. I>, 5 0.9 7.a -2 .5 1 , : -:.i
-.. 0.3 - .-, E i h a r ~ l 101 u.? -22.4 :I. $ 1.1 -E.: F.5 -;A,; I?.: - 1 . - -.- ,
]4&5 i02Ln F.;!,sEc fE.7::)

FUEL TYPE EUAPIRATIVE El&,.Si :: ipz!>l:
- - HTEE 111 3.5 -2.9 3 . 9 -:l:l,!) 7 .4 6.0 II.4 -6.: 1 z . 7 t1.4
----------- 'Ail v a t ~ ~ ~ are a r i t h ~ e i l c a v e r a ? ~ o f at leis! t h o ::r!s. -- -:vaporative e s i s s i c n s are t r j n i n ~ l e s s for 3 c lgsed 5yc:es. S! !!:c i? f -
2 ; r i t y was c h e c t e j n i t b ope h ~ t s x k 10.5 G r x c $?itred!. JF:.! E C O C X ~ i n terns c! a vc!i:e 3f gasnl!~? z s x 2 i c i r . ; ee,er!.i
equiva!ent t g t h e propare c m r c c t l . 4:" ,,~.va!rnt .; e~?;oratlr~ E L I S I ~ X ~ 5;!1ile i n ! t ~ i": : X F , s k i : t?;: t l e
two !nc: sqskeas are intr;cs:ct. 'See fc:;t5!~ 3 leaerg!/ ~ x 1 : t l e n r t o the S?5 rrrr:.~!!. . T r , i L 7 . 4 iu~; 5::npe-l 1c.z: :: i:., 6.c 9; t y .2 i . l - ' r . ~ i ~ :
[ ; I !s*! - 7 , - 5 &; : i2ye , !?! ,;:!s?>?:ii k . . , : ; , - r . : *.?: . - . - . . . - .-.- ::i cec:?;::: r;?b~:stic. E::I~.
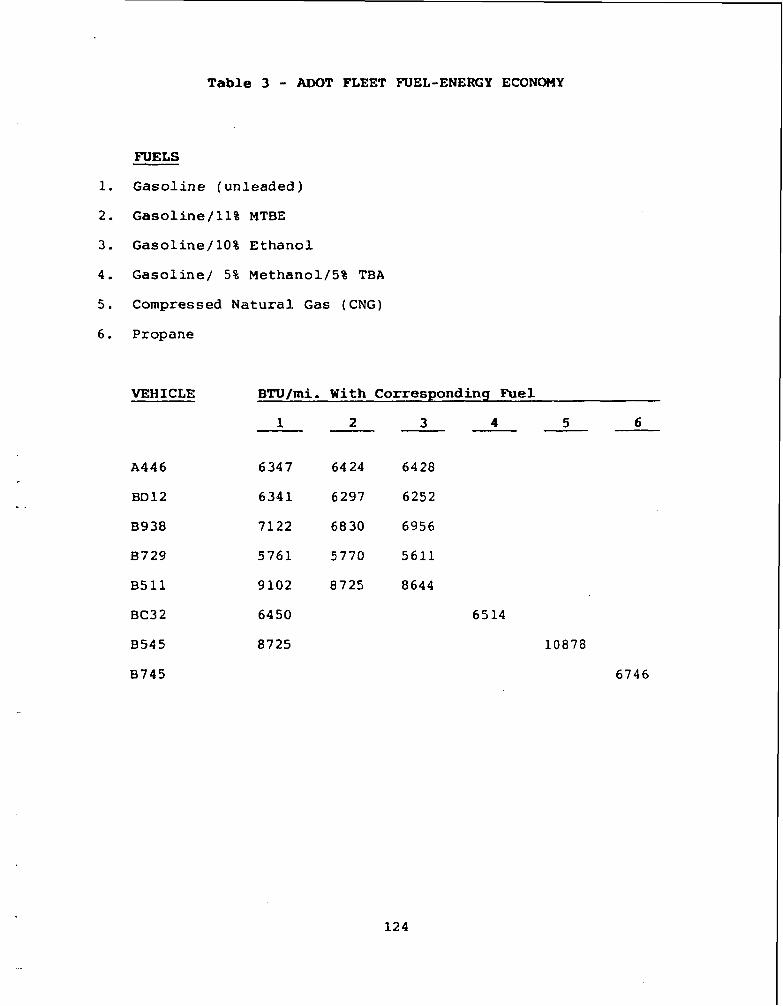
Table 3 - ADOT FLEET FUEL-ENERGY ECONOMY
FUELS
1. Gasoline (unleaded)
2. Gas 01 ine / 11 % MTBE
3. Gasoline/lO% Ethanol
4. Gasoline/ 5% Methanol/S% TBA
5. Compressed Natural Gas (CNG)
6. Propane
VEHICLE BTUfmi. With Correspondinq Fuel
1 2 3 4 5 6 - -

Appendix IV.
Mechanics Report

TO :
FROM :
A R I Z O N A D E P A R T M E N T O F T R A N S P O R T A T I O N
OFFICE MEMO O c t o b e r 4 , 1989
ROBERT E. PIKE R e s e a r c h P l a n n e r AZ T r R e s e a r c h C e n t e r (075-R)
LARRY L. K I N D R E D Au tomot ive Shop S u p e r v i s o r ( D - 1 ) Equipment S e r v i c e s (071-R)
SUBJECT: ALTERNATE FUEL PROGRAM
X L - 1 - Type I - E t h a n o l
D u r i n g o u r test p e r i o d t h i s l i q u i d f u e l h a d m i n i m a l p r o b l e m s .
XL-2 - Type 11- Methano l
D u r i n g o u r t e s t t h i s f u e l was t h e w o r s t o f them a l l . W e had p r o b l e m s w i t h i n j e c t o r s , f u e l pump and c a r b u r e t o r p r o b l e m s , p l u s s t a l l i n g o u t p rob lems .
XL-3 - Type I11 - MTBE
D u r i n g o u r t e s t period w e e x p e r i e n c e d v e r y m i n i m a l p r o b l e m s w i t h t h i s f u e l . I t mixed w e l l w i t h r e g u l a r a n d u n l e a d e d .
XNG - Type I V - N a t u r a l Gas
The i n c o n v e n i e n c y o f t he r e f ill s t a t i o n ( s ) p r o v e d t o be a p r o b l e m p l u s the f a c t t h a t d r ivers found i t easier t o f i l l u p w i t h r e g u l a r g a s and u s e i t r a t h e r t h a n t o t a k e t h e t i m e t o r e f i l l w i t h CNG.
XPG - Type V - L i q u i d P ropane
D u r i n g t h e tes t p e r i o d we e x p e r i e n c e d p r o b l e m s w i t h t h e 0-90 g a u g e s n o t work ing p r o p e r l y with e a c h o t h e r ( t a n k a n d d a s h ) . The c o s t o f r e p l a c e m e n t p a r t s w e r e e x p e n s i v e . Where o u r people w e r e r e q u i r e d to r e f i l l t h e i r v e h i c l e s p r o v e d v e r y i n c o n v e n i e n t . T h e r e was c o n s i d e r a b l e downtime.
LLK : cg
cc: J. West B. Brown
? e d 9 5 9 0 2/75 I. W U I ~ L V 8.m1.1 D. H a l a c h o f f


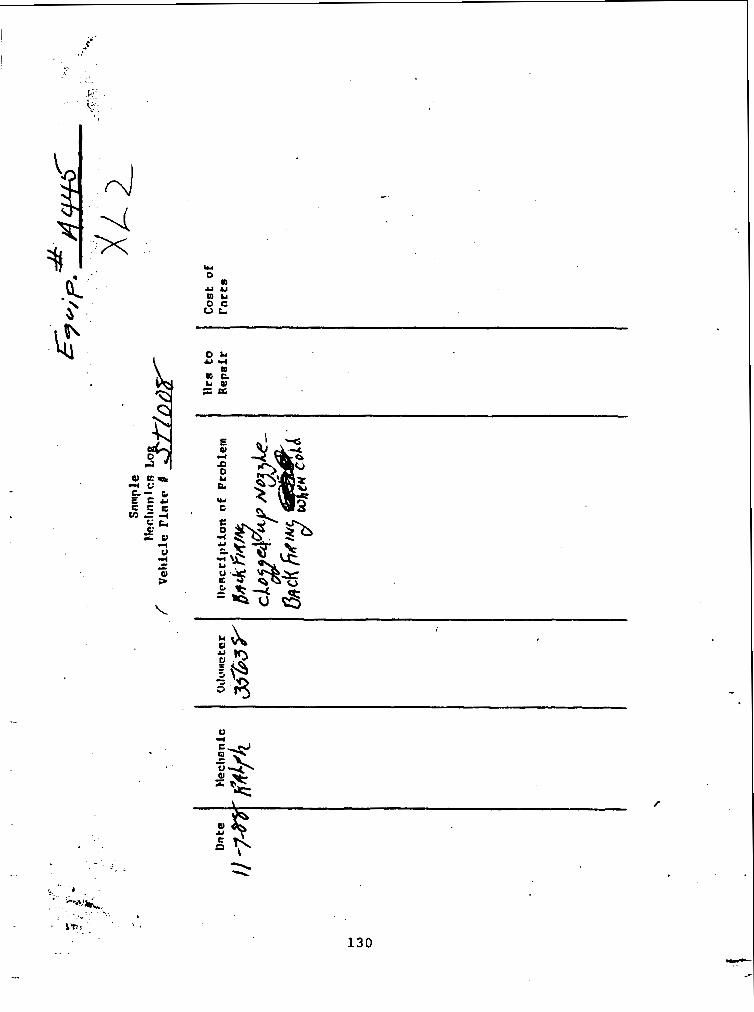

' " a 0 a -
u Y 4- 8 I*

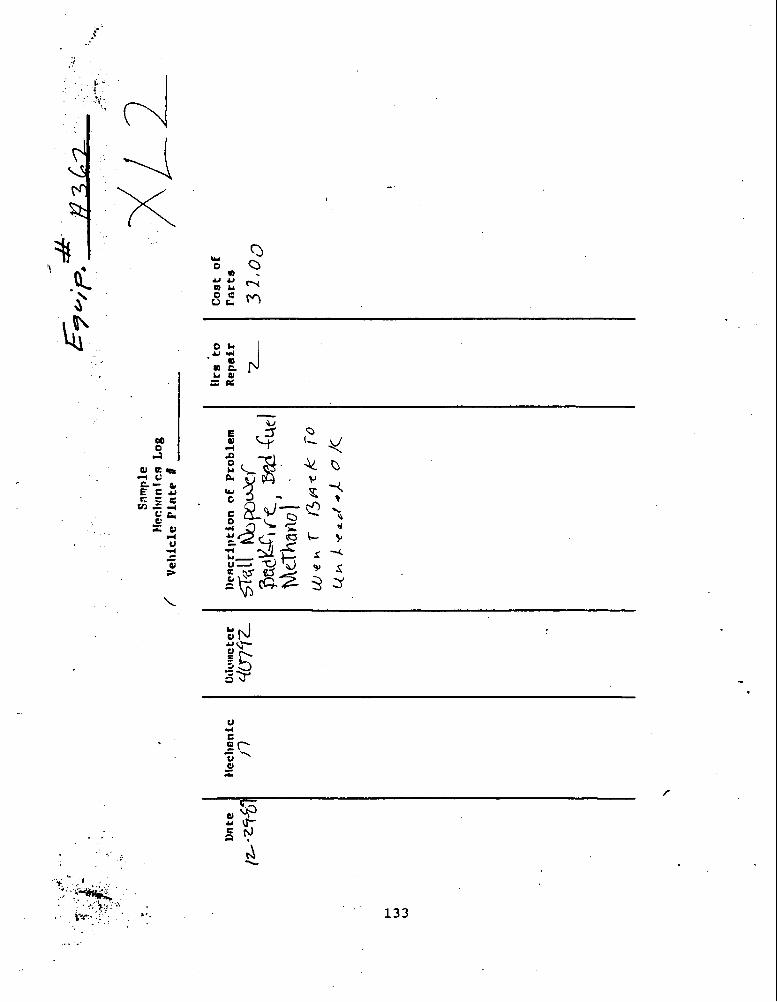

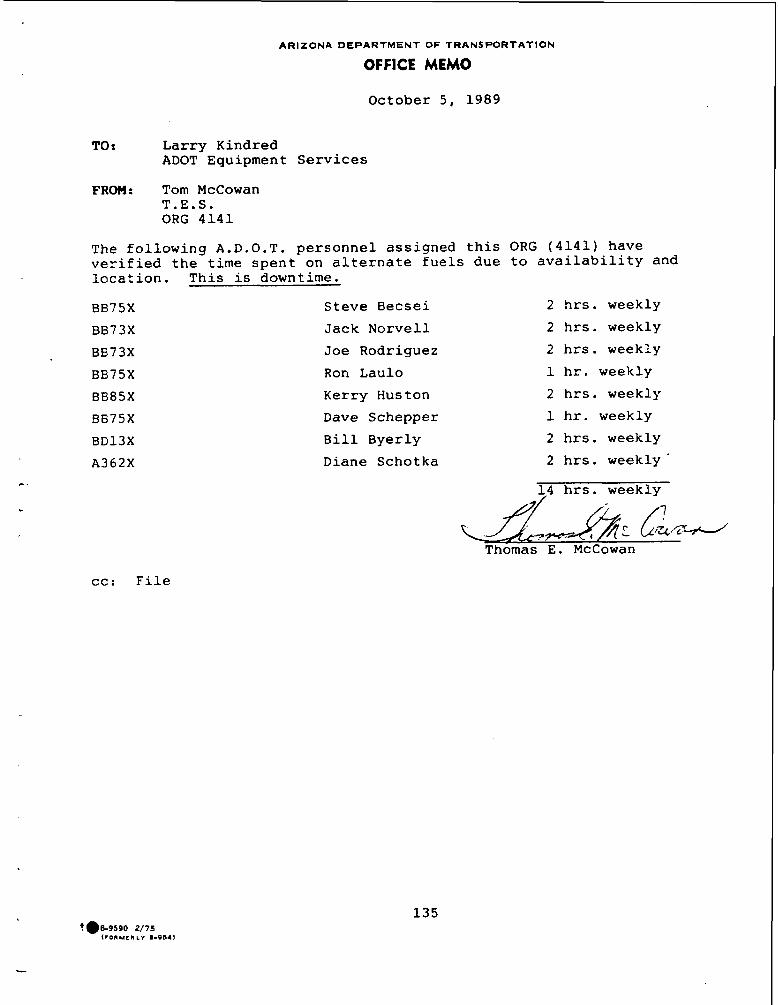
ARIZONA D E P A R T M E N T OF T R A N S P O R T A T l O N
OFFICE MEMO
October 5 , 1989
TO : Larry Kindred ADOT Equipment S e r v i c e s
FROM: Tom McCowan T .E .S . ORG 4 1 4 1
The fo l l owing A.D.O.T. p e r sonne l ass igned t h i s v e r i f i e d t h e t ime s p e n t on a l t e r n a t e f u e l s due l o c a t i o n . This i s downtime.
BB75X Steve Becsei
BB7 3X Jack Norve l l
BB7 3 X Joe Rodriguez
BB75X Ron Laulo
BB85X Kerry Huston
BB75X Dave Schepper
BD13X B i l l Byerly
A 3 6 2 X Diane Schotka
ORG ( 4 1 4 1 ) have t o a v a i l a b i l i t y and
2 h r s . weekly
2 h r s . weekly
2 h r s . weekly
1 h r . weekly
2 h r s . weekly
1 h r . weekly
2 h r s . weekly
2 h r s . weekly
5 4 h r s . weekly
cc: F i l e

Appendix V.
Vehicle and Fuel Type
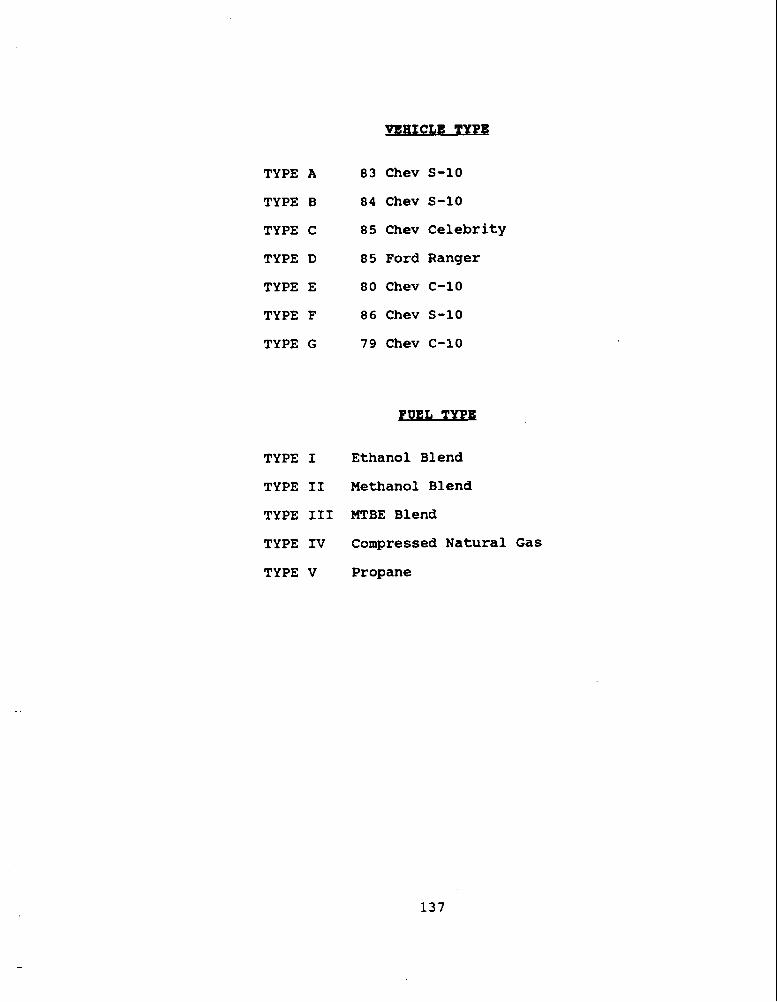
TYPE A 8 3 Chev S - 1 0
TYPE B 84 Chev S - 1 0
TYPE C 8 5 Chev c e l e b r i t y
TYPE D 8 5 F o r d R a n g e r
TYPE E 8 0 Chev C-10
TYPE F 8 6 Chev S - 1 0
TYPE G 7 9 Chev C-10
TYPE I E t h a n o l B l e n d
TYPE I1 Methanol B l e n d
TYPE 111 MTBE B l e n d
TYPE I V Compres sed N a t u r a l G a s
TYPE V P r o p a n e