Embed Size (px)
Citation preview

20
010 Poost-EActiv
lectiove Dut
Tabul
on Voty Mil
lations
oting Slitary
s of R
SurveSpou
Respon
ey of uses
nses

Additional copies of this report may be obtained from:
Defense Technical Information Center
ATTN: DTIC-BRR
8725 John J. Kingman Rd., Suite #0944
Ft. Belvoir, VA 22060-6218
Or from:
http://www.dtic.mil/dtic/order.html
Ask for report by ADA xxx xxx

DMDC Report No. 2011-31 July 2011
2010 POST-ELECTION VOTING SURVEY OF
ACTIVE DUTY MILITARY SPOUSES:
TABULATIONS OF RESPONSES
Defense Manpower Data Center Human Resources Strategic Assessment Program
1600 Wilson Boulevard, Suite 400, Arlington, VA 22209-2593

ii DMDC
Acknowledgments
Defense Manpower Data Center (DMDC) is indebted to numerous people for their assistance with the 2010 Post-Election Voting Survey of Active Duty Military Spouses (2010 PEV7), which was conducted on behalf of the Office of the Under Secretary of Defense for Personnel and Readiness (OUSD[P&R]). The survey program is conducted under the leadership of Timothy Elig, Director of the Human Resources Strategic Assessment Program (HRSAP).
Policy officials contributing to the development of this survey include Bob Carey and Paul Drugan (Federal Voting Assistance Program).
DMDC’s Program Evaluation Branch, under the guidance of Kristin Williams, Branch Chief, is responsible for the development of questionnaires used in the SOFS program. The lead survey design analysts were Rachel Lipari and Elizabeth Van Winkle. In addition, they designed the unique presentation of complex items used in this tabulation volume.
DMDC’s Personnel Survey Branch, under the guidance of David McGrath, Branch Chief, is responsible for sampling and weighting methods used in the SOFS program. Laverne Wright, Chief of Survey Operations, is responsible for survey database construction and archiving. The lead operations analyst on this survey was Dee Batra, SRA International, Inc. She used DMDC’s Statistical Analysis Macro to calculate the estimates presented in this tabulation volume. The lead sampling analysts on this survey were Eric Falk, DMDC, and Fawzi Al Nassir, SRA International, Inc. They used the DMDC Sampling Tool to plan the sample and develop weights for this survey. Susan Reinhold and Carole Massey provided programming support for the sampling and weighting tasks. Data Recognition Corporation (DRC) performed data collection and editing.
DMDC’s Survey Technology Branch, under the guidance of Frederick Licari, Branch Chief, is responsible for the distribution of datasets outside of DMDC and maintaining records on compliance with the Privacy Act and 32 CFR 219.
Jacqueline Malone, SRA International, Inc., formatted and assembled this tabulation volume using DMDC's Survey Reporting Tool. A team consisting of Elizabeth Van Winkle and Suzette Tassin, Consortium Research Fellow, completed quality control for this tabulation volume.

DMDC iii
Table of Contents
Page
Introduction to the Survey ............................................................................................ 1
Survey Methodology .................................................................................................... 4
Tabulation Procedures ................................................................................................. 7
References ................................................................................................................... 9
Tabulations of Responses .......................................................................................... 11
Survey Instrument .................................................................................................... 105
List of Tabulations by Question Number
Question Page
BACKGROUND INFORMATION
1. What is your marital status? ............................................................................ 12
2. Was your spouse serving on active duty on November 2, 2010? .................... 13
3. Were you a U.S. citizen on November 2, 2010? .............................................. 14
4. As of the November 2, 2010 election, what state or territory was your legal voting residence? Constructed item representing U.S. Census divisions ........................................................................................................... 15
5. As of November 2, 2010, did you live more than 50 miles from your legal voting residence? ............................................................................................ 16
6. Are you Spanish/Hispanic/Latino? ................................................................... 17
7. What is your race? .......................................................................................... 18
8. What was your age on November 2, 2010? .................................................... 19
9. On November 2, 2010, were you living in the United States/territories or overseas? ........................................................................................................ 20
10. As of November 2, 2010, how long had you been living in this country? ......... 21
2010 ELECTION
11. Did your state of legal voting residence provide voter registration verification Web sites?..................................................................................... 22
12. In 2010, were you registered to vote in the United States? ............................. 23

2010 Post-Election Voting Survey of Active Duty Military Spouses
iv DMDC
13. How interested or uninterested were you in the U.S. elections held on November 2, 2010? ......................................................................................... 24
14. During the past 6 years, did you usually vote in national, state, and local elections, or did you usually not vote? ............................................................. 25
15. Do you usually vote in {State and local elections} {National elections} ............ 26
16. During the months leading up to the election held on November 2, 2010, what were your voting plans? .......................................................................... 27
17. In the election held on November 2, 2010, did you definitely vote in person on election day, definitely mail or fax a completed absentee ballot on or before November 2, 2010, definitely not vote, or are you not completely sure whether you voted in that election? ....................................... 28
ABSENTEE BALLOTS
18. Even though you did not vote, did you request an absentee ballot for the November 2, 2010 election? ............................................................................ 29
19. When did you first request your absentee ballot for the November 2, 2010 election? {Options 1-9} .......................................................................... 30
19. When did you first request your absentee ballot for the November 2, 2010 election? {Options 10-15} ...................................................................... 31
20. Did you use the Federal Post Card Application (FPCA) to request your absentee ballot for the November 2, 2010 election? ....................................... 32
21. Did you obtain your Federal Post Card Application (FPCA) for the November 2, 2010 election from any of the following sources? ...................... 33
22. Did you receive notification from a local election official that your Federal Post Card Application (FPCA) had been ......................................................... 34
a. Received? ............................................................................................. 34
b. Rejected? .............................................................................................. 35
c. Accepted? ............................................................................................. 36
23. Did you receive your regular absentee ballot for the November 2, 2010 election? .......................................................................................................... 37
24. How did you obtain your regular absentee ballot in 2010? .............................. 38
25. When did you receive your regular absentee ballot for the November 2, 2010 election? ................................................................................................. 39
26. Did you complete and return your regular absentee ballot for the November 2, 2010 election? ............................................................................ 40
27. When did you complete and return your regular absentee ballot for the November 2, 2010 election? ............................................................................ 41
28. How satisfied or dissatisfied were you, in general, with the ............................. 42

2010 Post-Election Voting Survey of Active Duty Military Spouses
DMDC v
a. Process of registering to vote? ............................................................. 42
b. Process of requesting an absentee ballot? ........................................... 43
c. Absentee ballot delivery process? ........................................................ 44
d. Process of completing an absentee ballot? .......................................... 45
e. Process of returning an absentee ballot to local election official? ......... 46
f. The overall absentee voting process? .................................................. 47
29. Were you aware that you could use the Federal Write-In Absentee Ballot (FWAB) for the November 2, 2010 election? ................................................... 48
30. Did you use the Federal Write-In Absentee Ballot (FWAB) in the November 2, 2010 election? ............................................................................ 49
31. Did you obtain your Federal Write-In Absentee Ballot (FWAB) for the November 2, 2010 election from any of the following sources? ...................... 50
32. When did you complete and return the Federal Write-In Absentee Ballot (FWAB) for the November 2, 2010 election? ................................................... 51
VOTING ASSISTANCE
33. Were you aware that you could get information or assistance from an Installation Voter Assistance Officer/Unit Voting Assistance Officer (IVAO/UVAO)? ................................................................................................ 52
34. During 2010, did you receive voting information or assistance from an Installation Voter Assistance Officer/Unit Voting Assistance Officer (IVAO/UVAO)? ................................................................................................ 53
35. In 2010, what is the MAIN REASON you did not receive voting information or assistance from an Installation Voter Assistance Officer/Unit Voting Assistance Officer (IVAO/UVAO)? ................................................ 54
36. Were you aware of the Federal Voting Assistance Program (FVAP) Web site? ................................................................................................................. 55
37. In preparation for the 2010 primaries and general election, did you visit this Web site? .................................................................................................. 56
38. In 2010, what is the MAIN REASON you did not visit the Federal Voting Assistance Program (FVAP) Web site? ........................................................... 57
39. Were you aware the Voting Assistance Guide (VAG) was available to you? ................................................................................................................ 58
40. In preparation for the 2010 primaries and general election, did you refer to the 2010-11 Voting Assistance Guide (VAG) for information about registering to vote or requesting an absentee ballot? ...................................... 59
41. In 2010, what is the MAIN REASON you did not use the 2010-11 Voting Assistance Guide (VAG)? ................................................................................ 60

2010 Post-Election Voting Survey of Active Duty Military Spouses
vi DMDC
42. Were you aware of the Federal Voting Assistance Program (FVAP) toll-free telephone service? ................................................................................... 61
43. Did you use the Federal Voting Assistance Program (FVAP) toll-free telephone service to talk with a FVAP staff member in 2010? ......................... 62
44. In 2010, what is the MAIN REASON you did not use the Federal Voting Assistance Program's (FVAP) toll-free telephone service? ............................. 63
45. In preparation for the 2010 primaries and general election, did you visit the Federal Voting Assistance Program (FVAP) on Twitter, Facebook, and/or LinkedIn? .............................................................................................. 64
a. Twitter ................................................................................................... 64
b. Facebook .............................................................................................. 65
c. LinkedIn ................................................................................................ 66
OTHER SOURCES OF VOTING INFORMATION
46. Did you receive voting information from any of the following sources in 2010? .............................................................................................................. 67
a. State or local election official ................................................................ 67
b. Local television, radio, or print media ................................................... 68
c. Armed Forces Radio/TV ....................................................................... 69
d. Other U.S. civilian newspapers, magazines, radio, or TV ..................... 70
e. International television, radio, and print media ...................................... 71
f. My spouse ............................................................................................ 72
g. Family members (other than spouse) or friends ................................... 73
h. The Internet .......................................................................................... 74
i. Voting Assistance Officers (VAOs) ....................................................... 75
ELECTRONIC TRANSMISSION OF VOTING MATERIALS
47. From September 13 to November 2, 2010 did you have access to the following? ........................................................................................................ 76
a. Government Web sites other than FVAP (e.g., state or Federal .gov or .mil sites) ................................................................................... 76
b. Non-government Web sites (e.g., .com sites) ....................................... 77
c. Fax ........................................................................................................ 78
d. Printer ................................................................................................... 79
e. Scanner ................................................................................................ 80
f. DoD e-mail address .............................................................................. 81

2010 Post-Election Voting Survey of Active Duty Military Spouses
DMDC vii
g. Personal e-mail address ....................................................................... 82
48. During 2010, did you fax any of the following materials? ................................ 83
a. Federal Post Card Application (FPCA) ................................................. 83
b. Non-Federal Post Card Application request for absentee ballot ........... 84
c. Ballot ..................................................................................................... 85
d. Federal Write-In Absentee Ballot (FWAB) ............................................ 86
e. Other voting materials ........................................................................... 87
49. During 2010, did you e-mail any of the following materials?............................ 88
REASONS FOR NOT VOTING IN 2010 ELECTION
50. What was the MAIN reason you did not vote in the November 2, 2010 election? .......................................................................................................... 89
2008 ELECTION
51. Did you vote in the 2008 Presidential, U.S. Senate, and U.S. House of Representatives election? ............................................................................... 90
LOOKING FORWARD
52. If you were to need information about absentee voting in a future election, which of the following sources would best serve you? ...................... 91
53. If you were to vote using an absentee ballot in a future election, how would you prefer to receive the absentee ballot? ............................................ 92
54. If you were to vote using an absentee ballot in a future election, how would you prefer to return the absentee ballot? .............................................. 93
55. To what extent do you agree or disagree with the following statement? I am confident that completing and sending a ballot online via the Internet is safe, secure, and reliable ............................................................................. 94
FAMILY VOTING PATTERNS
56. As of the November 2, 2010 election, what state or territory was your spouse's legal voting residence? ..................................................................... 95
56. As of the November 2, 2010 election, do you know what state or territory was your spouse's legal voting residence? Constructed from Q56 ................ 96
57. As of November 2, 2010, did your spouse live more than 50 miles from his/her legal voting residence? ........................................................................ 97
58. As of November 2, 2010, was your spouse deployed or away from his/her permanent duty station? ............................................................................ 98

2010 Post-Election Voting Survey of Active Duty Military Spouses
viii DMDC
59. Did you relocate while your spouse was deployed? ........................................ 99
60. As of November 2, 2010, were you and your spouse living in the same residence? ..................................................................................................... 100
61. Not counting your spouse, do you have any family members, who were at least 18 years old on November 2, 2010? ................................................. 101
62. Did any of these family members live more than 50 miles from their legal voting residence on November 2, 2010, as a result of your spouse's active duty service? ....................................................................................... 102
63. How many of these family members lived more than 50 miles from their legal voting residence on November 2, 2010 as a result of your spouse's active duty service? ....................................................................................... 103
DMDC 1
2010 POST-ELECTION VOTING SURVEY OF ACTIVE DUTY MILITARY SPOUSES:
TABULATIONS OF RESPONSES
Introduction to the Survey
The Human Resources Strategic Assessment Program (HRSAP), Defense Manpower Data Center (DMDC), conducts both Web-based and paper-and-pencil surveys to support the personnel information needs of the Under Secretary of Defense for Personnel and Readiness (USD[P&R]). These surveys assess the attitudes and opinions of the entire Department of Defense (DoD) community on a wide range of personnel issues. While the primary sources of information for HRSAP are Status of Forces Surveys (SOFS), DMDC developed the Post-Election Voting Surveys in 2008. Post-Election Voting Surveys are conducted at the request of the Federal Voting Assistance Program (FVAP) office as required by the Uniformed and Overseas Citizens Absentee Voting Act of 1986 (UOCAVA), 42 USC 1973ff, as amended in November 2009 by the Military and Overseas Voter Empowerment Act (MOVE), for an evaluation of the effectiveness of assistance provided to UOCAVA voters for the 2010 federal office elections.
This report contains tabulations of responses from the Post-Election Voting Survey of Active Duty Military Spouses (2010 PEV7), conducted from December 20, 2010 through March 31, 2011. Active duty military members are covered by the Uniformed and Overseas Citizens Absentee Voting Act (UOCAVA). The UOCAVA population consists of the active duty members of the Army, Navy, Marine Corps, Air Force, and Coast Guard. The 2010 PEV7 targeted spouses of UOCAVA covered active duty members. This introduction (1) summarizes the survey content, (2) defines the total population surveyed and the subgroups used in tabulations of responses, (3) summarizes the survey methodology,1 and (4) provides details on how to use the tabulations. The tabulations and a copy of the survey items follow this introduction.2
Survey Content
The 2010 PEV7 was subdivided into the following ten areas: background information, the 2010 election, absentee ballots, voting assistance information, other sources of voting information, electronic transmission of voting materials, reasons for not voting in the 2010 election, the 2008 election, looking forward, and family voting patterns. Topics covered within the ten areas of the 2010 PEV7 are described below:
1. Background Information—Marital status, member’s active duty status, citizenship, state residency, geographic location on election day, time overseas, race/ethnicity, and age.
1 Details on survey methodology are reported by DMDC (2011b). 2 Refer to DMDC (2011a) to view a screen-shot version of the survey as it appeared on the Web.
2010 Post-Election Voting Survey of Active Duty Military Spouses
2 DMDC
2. 2010 Election—Availability of voter registration verification Web sites, voter registration status, voting interest, voting history, and voting behavior in the 2010 election.
3. Absentee Ballots—Absentee ballot requests; use of Federal Post Card Applications (FPCA); sources used to obtain FPCA; notification regarding submitted FPCA; receipt, completion, and return of absentee ballots; satisfaction with process of registering to vote and absentee voting process; use of the Federal Write-In Absentee Ballot (FWAB); sources used to obtain FWAB; and completion of the FWAB.
4. Voting Assistance Information—Use of and reasons for not using Installation/Unit Voting Assistance Officers; use of and reasons for not using the Federal Voting Assistance Program (FVAP) Web site; use of and reasons for not using the DoD 2010-11 Voting Assistance Guide; use of and reasons for not using the FVAP toll-free telephone service; and use of the FVAP information on Twitter, Facebook, and LinkedIn.
5. Other Sources of Voting Information—Use of other sources of voting information (e.g., state or local election officials, news media, spouse).
6. Electronic Transmissions of Voting Materials—Access to fax/e-mail and use of fax or e-mail to request absentee ballots and/or cast ballots.
7. Reasons for Not Voting in the 2010 Election—Main reason for not voting (e.g., too busy to vote, no candidate preference, could not register to vote).
8. 2008 Election—Voting behavior in the 2008 election.
9. Looking Forward—Best sources of information for future absentee voting; preference for receipt and return of absentee ballot for future elections; and confidence in the safety, security, and reliability of completing and sending absentee ballot via the Internet.
10. Family Voting Patterns—Geographic location of spouse and family members on Election Day.
Population and Reporting Categories
The target population for the 2010 PEV7 consisted of spouses of active duty members of the Army, Navy, Marine Corps, Air Force, and Coast Guard who have at least six months of service at the time the questionnaire is first fielded and who are below flag rank. Spouses of National Guard/Reserve members were excluded from the target population. In addition, for respondents to have remained eligible, they must have indicated that, at the time of the survey, they were a U.S. citizen and were currently married to an active duty member.

2010 Post-Election Voting Survey of Active Duty Military Spouses
DMDC 3
Survey results are presented for the total population and by a variety of reporting categories. To form the reporting categories for the tabulations, respondents were classified by survey self-report. If the self-reported data are missing, then DMDC’s Active Duty Master Edit File data, at the time of sampling, is used to impute a subgroup classification. Survey results are tabulated by member Service and paygrade; and spouse age, location, race/ethnicity, gender, absentee voter status, and voter registration status. Definitions for reporting categories follow:
Member Service—The categories include Army, Navy, Marine Corps, Air Force, and Coast Guard.
Member Paygrade—The Enlisted subgroup includes all enlisted paygrades (E1-E9). The Enlisted subgroup is broken into the E1 – E5 and E6 – E9 categories. The Officers subgroup is subdivided into W1 – W5, O1 – O3, and O4 – O6.
Spouse Age—Categories include 18 to 24 Years Old, 25 to 29 Years Old, 30 to 34 Years Old, 35 to 44 Years Old, and 45 Years Old or More.
Spouse Location—The primary classification distinguishes Overseas from US (Incl. Territories). US (Incl. Territories) include spouses located in the 50 states, the District of Columbia, Puerto Rico, and United States territories or possessions. Spouse location is also presented by age subcategories.
Spouse Race/Ethnicity—Respondents are classified based on self-reported categories consistent with requirements of the Standards for Maintaining, Collecting, and Presenting Federal Data on Race and Ethnicity (1997). Total Minority includes all persons marking one or more of the races other than White and/or marking that they are Spanish/Hispanic/Latino.
Spouse Gender—This category is self-explanatory.
Proximity to Voting Residence—Respondents are classified based on self-reported legal voting residence as defined in the UOCAVA). Absent includes spouses who indicated they lived more than 50 miles from their legal voting residence on November 2, 2010. Not Absent includes spouses who indicated they lived within 50 miles of their legal voting residence on November 2, 2010.
Voter Registration Status—Respondents are classified based on self-reported registration status. Registered to Vote includes spouses who indicated they were registered to vote in the United States in 2010.

2010 Post-Election Voting Survey of Active Duty Military Spouses
4 DMDC
Survey Methodology
The Web survey administration process began on December 20, 2010, with the mailout of notification letters to sample members. This notification letter explained why the survey was being conducted, how the survey information would be used, and why participation was important. Throughout the administration period, additional e-mail and postal reminders were sent to encourage survey participation. Data were collected from December 20, 2010 to March 31, 2011.
Single-stage, nonproportional stratified random sampling3 procedures were used. The sample consisted of 50,132 individuals drawn from the sample frame constructed from DMDC’s Active Duty Master Edit File. Respondents became ineligible if they indicated in the survey or by other contact (e.g., telephone calls to the data collection contractor) that their spouses were not on active duty as of the first day of the Web survey, December 20, 2010 (2,831, or 6% of the sample).
Completed surveys were defined as those in which (1) 50% or more of the survey questions were answered by participants who were identified as registered voters and (2) any questionnaire from participants that answered as non-registered voters. Completed surveys were received from 6,491 eligible respondents. The overall weighted response rate for eligible sample members, corrected for nonproportional sampling and nonlocation, was 14%.
Data were weighted using the industry standard three-stage process. This form of weighting produces survey estimates of population totals, proportions, and means (as well as other statistics) that are representative of their respective populations. Unweighted survey data, in contrast, are likely to produce biased estimates of population statistics. The three-stage process of weighting consists of the following steps:
Adjustment for selection probability—Probability samples such as the sample for this survey are selected from lists and each member of the list has a known nonzero probability of selection. For example, if a list contained 10,000 members in a demographic subgroup and the desired sample size for the subgroup was 1,000, one in every tenth member of the list would be selected. During weighting, this selection probability (1/10) is taken into account. The base, or first weight, used to adjust the sample is the reciprocal of the selection probability. In this example, the adjustment for selection probability (base weight) is 10 for members of this subgroup.
Adjustments for nonresponse—Some sampled members do not respond to the survey. Continuing the previous example, suppose only half of sample
3 In stratified random sampling, all members of a population are categorized into homogeneous groups. For example, spouses might be grouped by member paygrade and Service (e.g., all Army enlisted spouses in one group). Spouses are chosen at random within each group. Small groups are oversampled in comparison to their proportion of the population so there will be enough responses from small groups to analyze. Weights are used so that groups are correctly represented in the analyses.
2010 Post-Election Voting Survey of Active Duty Military Spouses
DMDC 5
members, 500, completed and returned a survey. Because the unweighted sample size would only be 500, weights are needed to project the sample up to the subgroup population total (10,000). In this case, the base-weighted respondents would sum to only 5,000 weighted respondents. To adjust for nonresponse, the base weights are multiplied by the reciprocal of the nonresponse rate. In this example, the base weight (10) is multiplied by the reciprocal of the nonresponse rate (2) to create a new weight of 20. The weighted sample sums to the subgroup population total of 10,000.
Adjustment to known population values—The first of the two previous weighting adjustments are applied according to the demographic groupings used in designing the subgroups for the sample. The second is based on population characteristics that are known to be related to whether a sample person responds to the survey. Because the sample design and adjustments for nonresponse cannot take into account all demographic differences related to who responds to a survey and how they respond, auxiliary information is used to increase the precision of survey estimates. For this reason, a final weighting adjustment is computed that reproduces population totals for important demographic groupings related to who responds to a survey and how they might answer the survey. Suppose in our example the population for the subgroup was 8,500 women and 1,500 men, but the nonresponse-adjusted weighted estimates from the respondents was 7,000 women and 3,000 men. To dampen this possible bias and reproduce known population totals, the weights would be adjusted by 1.21 for women and 0.5 for men so that the final weights for women and men would be 24.3 and 10 which would give unbiased estimates of the total and of women and men in the subgroup.
Table 1 (page 6) shows the number of respondents and the portion of total respondents in each reporting group. Also shown are the estimated number of members and the portion of total members in each reporting group. Differences in the percentages of respondents and population for the reporting categories reflect differences in the number sampled, as well as differences in response rates.

2010 Post-Election Voting Survey of Active Duty Military Spouses
6 DMDC
Table 1. Number of Respondents (Total) and Estimated Population by Reporting Categories
Respondents Estimated Population
Count Percent Totals Percent Max ME TOTAL 6,491 100% 724,194 ±9,007 100%
Army 2,004 31% 284,201 ±5,566 39% ±1 Navy 1,093 17% 153,315 ±4,961 21% ±1 Marine Corps 804 12% 85,332 ±3,922 12% ±1 Air Force 1,399 22% 178,243 ±3,253 25% ±1 Coast Guard 1,191 18% 23,103 ±315 3% ±1
MEMBER PAYGRADE Enlisted 3,220 50% 568,126 ±8,472 78% ±1
E1 – E5 1,664 26% 340,757 ±10,031 47% ±2 E6 – E9 1,556 24% 227,369 ±9,055 31% ±2
Officers 3,271 50% 156,068 ±3,060 22% ±1 W1 – W5 856 13% 16,302 ±380 2% ±1 O1 – O3 974 15% 67,966 ±2,425 9% ±1 O4 – O6 1,441 22% 71,800 ±1,827 10% ±1
AGE 18 to 24 Years Old 759 12% 150,167 ±9,183 21% ±2 25 to 29 Years Old 1,177 18% 187,568 ±10,953 26% ±2 30 to 34 Years Old 1,215 19% 152,953 ±9,884 21% ±2 35 to 44 Years Old 2,119 33% 177,811 ±8,719 25% ±2 45 Years Old or More 1,211 19% 54,631 ±5,204 8% ±1
LOCATION US (Incl. Territories) 5,185 80% 659,317 ±10,992 91% ±1
18 to 24 Years Old 593 9% 139,907 ±9,290 19% ±2 25 to 29 Years Old 944 15% 169,855 ±10,928 23% ±2 30 to 34 Years Old 1,021 16% 139,873 ±9,845 19% ±2 35 to 44 Years Old 1,727 27% 158,432 ±8,806 22% ±2 45 Years Old or More 894 14% 50,348 ±5,152 7% ±1
Overseas 1,294 20% 63,401 ±4,572 9% ±1 18 to 24 Years Old 166 3% 10,260 ±1,885 1% ±1 25 to 29 Years Old 230 4% 17,528 ±2,877 2% ±1 30 to 34 Years Old 192 3% 12,989 ±2,119 2% ±1 35 to 44 Years Old 388 6% 18,445 ±2,719 3% ±1 45 Years Old or More 314 5% 4,019 ±875 1% ±1
RACE/ETHNICITY Non-Hispanic White 4,335 67% 463,694 ±11,980 64% ±2 Total Minority 2,096 32% 254,810 ±11,394 35% ±2
GENDER Male 657 10% 77,376 ±8,119 11% ±2 Female 5,834 90% 646,817 ±11,019 89% ±2
PROXIMITY TO VOTING RESIDENCE Absent 3,847 59% 400,433 ±13,586 55% ±2 Not Absent 2,600 40% 318,246 ±13,776 44% ±2
VOTER REGISTRATION STATUS Registered to Vote 5,436 84% 580,126 ±12,865 80% ±2 Not Registered to Vote 1,036 16% 141,785 ±10,850 20% ±2

2010 Post-Election Voting Survey of Active Duty Military Spouses
DMDC 7
Tabulation Procedures
Tabulations4 for each question from the survey are shown on one page. To compress the width of columns in the tables, the response options are shown with a number or letter; then that number or letter is used as the column heading for the responses. The central feature of the tabulations is the percentage of members choosing the response options indicated by the column heading. Within a set of response options, percentages may not add to 100% due to rounding error.
Where an item lends itself to presentation as an average, that average is also shown as both a number estimate and in a bar chart. The averages lend themselves to a quick scan for reporting groups differing from other similarly defined groups. In some cases, the responses are averages of the numeric scales presented with the response options. Where there is a simple binomial response (e.g., yes/no), only one percentage is presented. In this case, the bar chart represents that percentage.
On each page of tabulations, the first column lists the reporting group shown in that row. The second column, Percent Responding, lists the portion of the reporting group represented in the estimates in that row. If this percentage is not 100, it may reflect item nonresponse, and the table note indicates that “Percent responding are active duty spouses who answered the question.” In most cases, however, not all questions will apply to every respondent. Where possible, the Web survey is programmed to skip respondents over questions that do not apply to them. For example, Q19 (When did you first request your absentee ballot for the November 2, 2010 election?) does not apply to those who marked in Q18 that they did not request an absentee ballot. The table note for this question indicates, “Percent responding are active duty spouses who answered the question and who definitely voted by mail, e-mail/fax, or online in the November 2, 2010 election (Q17) or who definitely did not vote but requested an absentee ballot for the election (Q18).”
Combining Information From Multiple Items
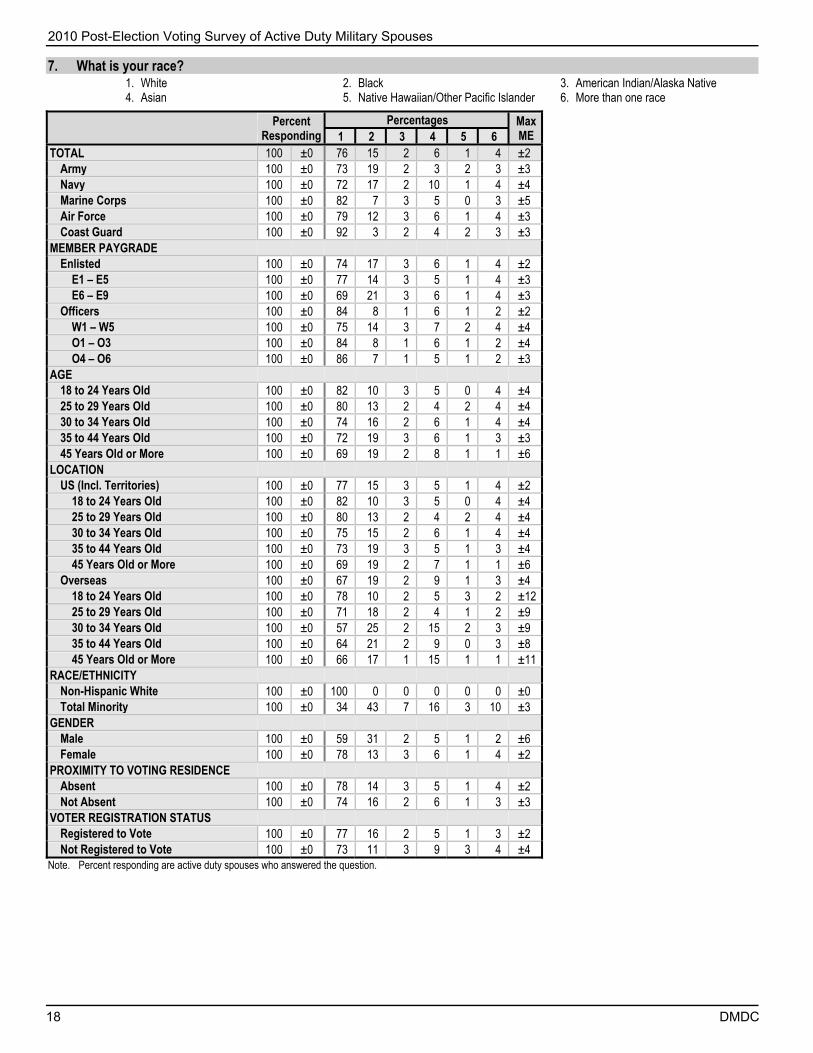
Tabulations in this volume generally present data for individual survey questions. There is one exception. In Q7, spouses are asked to mark one or more races. The tabulations show the percentage who responded that they were White, Black, American Indian/Alaska Native, Asian, and/or Native Hawaiian/Other Pacific Islander. Respondents who indicated more than one race are also shown in the percentage of More than one race. For example, if a respondent indicated they were Asian and White, they were counted in the percentage as Asian, White, and More than one race.
4 Details of data editing and preparation are provided by DMDC (2010a).

2010 Post-Election Voting Survey of Active Duty Military Spouses
8 DMDC
Margins of Error
The complex sample design required weighting to produce population estimates (e.g., percent male).5 Because of the weighting, conventional formulas for calculating the margin of error will overstate the reliability of the estimate. For this report, variance estimates were calculated using SUDAAN® PROC DESCRIPT (Research Triangle Institute, 2004).
By definition, sample surveys are subject to sampling error. Standard errors are estimates of the variance around population parameters, such as percentages or means, and are used to construct margins of error (i.e., confidence interval half-widths). Percentages and means in these tabulations are reported with margins of error based on 95% confidence intervals. In order to compress the data display, only the maximum margin of error (Max ME) for each reporting category is shown. That is, the tab volume shows only the largest margin of error for the percentages or means in each row. For each average shown in these tabulations, its margin of error is also printed.
The following reporting conventions are used:
“º” indicates that no one in any reporting group selected the response option,
NR indicates the estimate is Not Reportable and is suppressed because of low reliability. Estimates of low reliability are suppressed based on criteria defined in terms of nominal sample size (less than 5), effective sample size (less than 30), or relative standard error (greater than 0.225),
NA indicates the question was Not Applicable because the question did not apply to respondents in the reporting category based on answers to previous questions,
no Max ME is printed when all percentages in the row are shown as NR,
no margin of error is printed for an average when it is shown as NR.
5 As a result of differential weighting, only certain statistical software procedures, such as SUDAAN® PROC DESCRIPT, correctly calculate standard errors, variances, or tests of statistical significance for stratified samples. ® Copyright 2004 by Research Triangle Institute, P.O. Box 12194, Research Triangle Park, NC 27709-2194

2010 Post-Election Voting Survey of Active Duty Military Spouses
DMDC 9
References
DMDC. (2011a). 2010 Post-Election Voting Survey of Active Duty Military Spouses: Administration, datasets, and codebook (Report No. 2011-033). Arlington, VA: Author.
DMDC. (2011b). 2010 Post-Election Voting Survey of Active Duty Military Spouses: Statistical methodology report (Report No. 2011-032). Arlington, VA: Author.
Research Triangle Institute. (2004). SUDAAN® Language Manual, Release 9.0. Research Triangle Park, NC: Research Triangle Institute.
Standards for Maintaining, Collecting, and Presenting Federal Data on Race and Ethnicity, 62 Fed. Reg. 58781 (1997).


Tabulations of Responses

2010 Post-Election Voting Survey of Active Duty Military Spouses
12 DMDC
1. What is your marital status?
1. Married 2. Separated 3. Divorced 4. Widowed 5. Never married
Percent
Responding Percentages Max
ME 1 2 3 4 5 TOTAL 100 ±1 98 2 0º 0º 0º ±1
Army 100 ±1 98 2 0º 0º 0º ±2 Navy 100 ±1 98 2 0º 0º 0º ±2 Marine Corps 100 ±1 98 2 0º 0º 0º ±3 Air Force 100 ±1 99 1 0º 0º 0º ±2 Coast Guard 100 ±0 99 1 0º 0º 0º ±1
MEMBER PAYGRADE Enlisted 100 ±1 98 2 0º 0º 0º ±1
E1 – E5 100 ±0 98 2 0º 0º 0º ±2 E6 – E9 100 ±1 98 2 0º 0º 0º ±2
Officers 100 ±1 99 1 0º 0º 0º ±1 W1 – W5 100 ±1 99 1 0º 0º 0º ±2 O1 – O3 100 ±1 100 0 0º 0º 0º ±1 O4 – O6 100 ±1 99 1 0º 0º 0º ±2
AGE 18 to 24 Years Old 100 ±0 98 2 0º 0º 0º ±2 25 to 29 Years Old 100 ±1 98 2 0º 0º 0º ±2 30 to 34 Years Old 100 ±1 98 2 0º 0º 0º ±2 35 to 44 Years Old 100 ±1 98 2 0º 0º 0º ±2 45 Years Old or More 100 ±1 98 2 0º 0º 0º ±3
LOCATION US (Incl. Territories) 100 ±1 98 2 0º 0º 0º ±1
18 to 24 Years Old 100 ±0 98 2 0º 0º 0º ±2 25 to 29 Years Old 100 ±1 98 2 0º 0º 0º ±2 30 to 34 Years Old 100 ±1 98 2 0º 0º 0º ±2 35 to 44 Years Old 100 ±1 98 2 0º 0º 0º ±2 45 Years Old or More 100 ±1 98 2 0º 0º 0º ±3
Overseas 100 ±1 99 1 0º 0º 0º ±3 18 to 24 Years Old 100 ±0 99 1 0º 0º 0º ±3 25 to 29 Years Old 100 ±1 NR NR 0º 0º 0º ±0 30 to 34 Years Old 100 ±0 100 0 0º 0º 0º ±0 35 to 44 Years Old 100 ±1 100 0 0º 0º 0º ±1 45 Years Old or More 100 ±0 NR NR 0º 0º 0º ±0
RACE/ETHNICITY Non-Hispanic White 100 ±0 98 2 0º 0º 0º ±1 Total Minority 100 ±1 98 2 0º 0º 0º ±2
GENDER Male 100 ±1 98 2 0º 0º 0º ±3 Female 100 ±1 98 2 0º 0º 0º ±1
PROXIMITY TO VOTING RESIDENCE Absent 100 ±0 99 1 0º 0º 0º ±1 Not Absent 100 ±1 97 3 0º 0º 0º ±2
VOTER REGISTRATION STATUS Registered to Vote 100 ±1 98 2 0º 0º 0º ±1 Not Registered to Vote 100 ±1 97 3 0º 0º 0º ±3
Note. Percent responding are active duty spouses who answered the question. Respondents who were divorced, widowed, or never married (Q1) are excluded from this report. NR: Not reportable º Response option never endorsed.
2010 Post-Election Voting Survey of Active Duty Military Spouses
DMDC 13
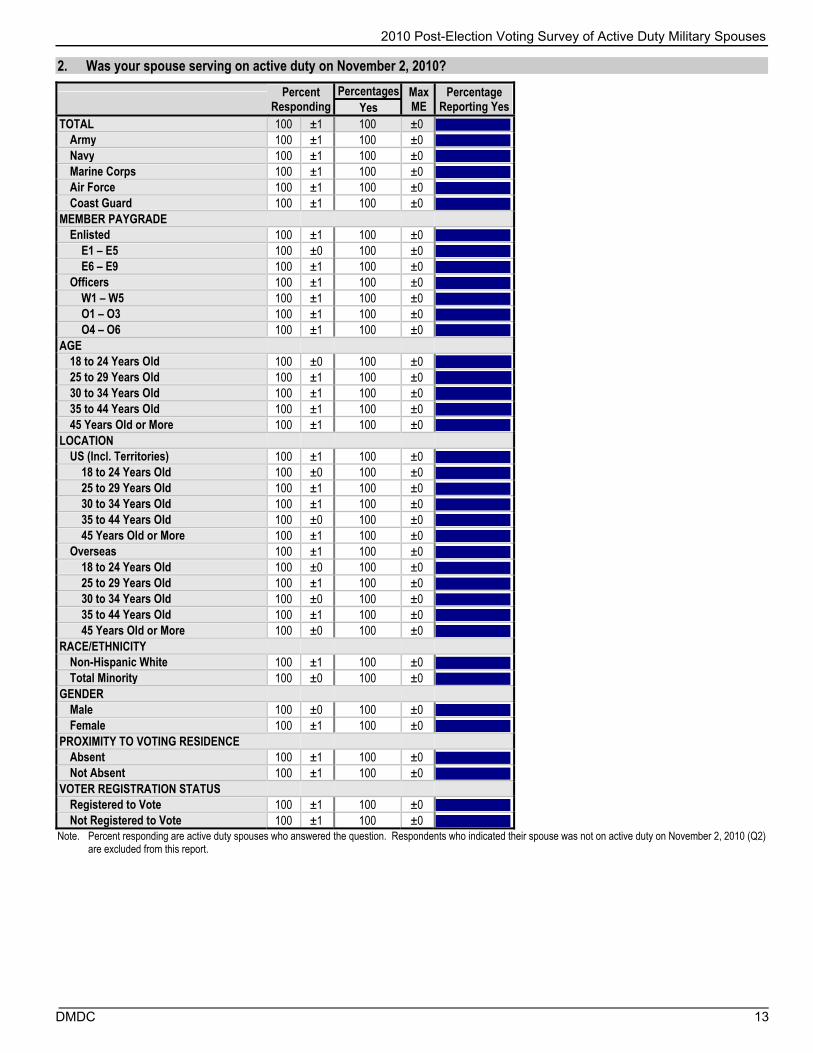
2. Was your spouse serving on active duty on November 2, 2010?
Percent
Responding Percentages Max
ME Percentage
Reporting Yes Yes TOTAL 100 ±1 100 ±0
Army 100 ±1 100 ±0 Navy 100 ±1 100 ±0 Marine Corps 100 ±1 100 ±0 Air Force 100 ±1 100 ±0 Coast Guard 100 ±1 100 ±0
MEMBER PAYGRADE Enlisted 100 ±1 100 ±0
E1 – E5 100 ±0 100 ±0 E6 – E9 100 ±1 100 ±0
Officers 100 ±1 100 ±0 W1 – W5 100 ±1 100 ±0 O1 – O3 100 ±1 100 ±0 O4 – O6 100 ±1 100 ±0
AGE 18 to 24 Years Old 100 ±0 100 ±0 25 to 29 Years Old 100 ±1 100 ±0 30 to 34 Years Old 100 ±1 100 ±0 35 to 44 Years Old 100 ±1 100 ±0 45 Years Old or More 100 ±1 100 ±0
LOCATION US (Incl. Territories) 100 ±1 100 ±0
18 to 24 Years Old 100 ±0 100 ±0 25 to 29 Years Old 100 ±1 100 ±0 30 to 34 Years Old 100 ±1 100 ±0 35 to 44 Years Old 100 ±0 100 ±0 45 Years Old or More 100 ±1 100 ±0
Overseas 100 ±1 100 ±0 18 to 24 Years Old 100 ±0 100 ±0 25 to 29 Years Old 100 ±1 100 ±0 30 to 34 Years Old 100 ±0 100 ±0 35 to 44 Years Old 100 ±1 100 ±0 45 Years Old or More 100 ±0 100 ±0
RACE/ETHNICITY Non-Hispanic White 100 ±1 100 ±0 Total Minority 100 ±0 100 ±0
GENDER Male 100 ±0 100 ±0 Female 100 ±1 100 ±0
PROXIMITY TO VOTING RESIDENCE Absent 100 ±1 100 ±0 Not Absent 100 ±1 100 ±0
VOTER REGISTRATION STATUS Registered to Vote 100 ±1 100 ±0 Not Registered to Vote 100 ±1 100 ±0
Note. Percent responding are active duty spouses who answered the question. Respondents who indicated their spouse was not on active duty on November 2, 2010 (Q2) are excluded from this report.

2010 Post-Election Voting Survey of Active Duty Military Spouses
14 DMDC
3. Were you a U.S. citizen on November 2, 2010?
Percent
Responding Percentages Max
ME Percentage
Reporting Yes Yes TOTAL 100 ±1 100 ±0
Army 100 ±1 100 ±0 Navy 100 ±1 100 ±0 Marine Corps 100 ±1 100 ±0 Air Force 99 ±1 100 ±0 Coast Guard 99 ±1 100 ±0
MEMBER PAYGRADE Enlisted 100 ±1 100 ±0
E1 – E5 99 ±1 100 ±0 E6 – E9 100 ±1 100 ±0
Officers 100 ±1 100 ±0 W1 – W5 99 ±1 100 ±0 O1 – O3 100 ±1 100 ±0 O4 – O6 100 ±1 100 ±0
AGE 18 to 24 Years Old 100 ±1 100 ±0 25 to 29 Years Old 99 ±1 100 ±0 30 to 34 Years Old 99 ±1 100 ±0 35 to 44 Years Old 100 ±1 100 ±0 45 Years Old or More 99 ±1 100 ±0
LOCATION US (Incl. Territories) 100 ±1 100 ±0
18 to 24 Years Old 100 ±1 100 ±0 25 to 29 Years Old 99 ±1 100 ±0 30 to 34 Years Old 99 ±1 100 ±0 35 to 44 Years Old 100 ±1 100 ±0 45 Years Old or More 99 ±1 100 ±0
Overseas 100 ±1 100 ±0 18 to 24 Years Old 100 ±0 100 ±0 25 to 29 Years Old 100 ±1 100 ±0 30 to 34 Years Old 100 ±0 100 ±0 35 to 44 Years Old 99 ±2 100 ±0 45 Years Old or More 100 ±1 100 ±0
RACE/ETHNICITY Non-Hispanic White 100 ±1 100 ±0 Total Minority 100 ±1 100 ±0
GENDER Male 100 ±1 100 ±0 Female 100 ±1 100 ±0
PROXIMITY TO VOTING RESIDENCE Absent 100 ±1 100 ±0 Not Absent 99 ±1 100 ±0
VOTER REGISTRATION STATUS Registered to Vote 100 ±1 100 ±0 Not Registered to Vote 99 ±1 100 ±0
Note. Percent responding are active duty spouses who answered the question. Respondents who were not U.S. citizens on November 2, 2010 (Q3) are excluded from this report.
2010 Post-Election Voting Survey of Active Duty Military Spouses
DMDC 15
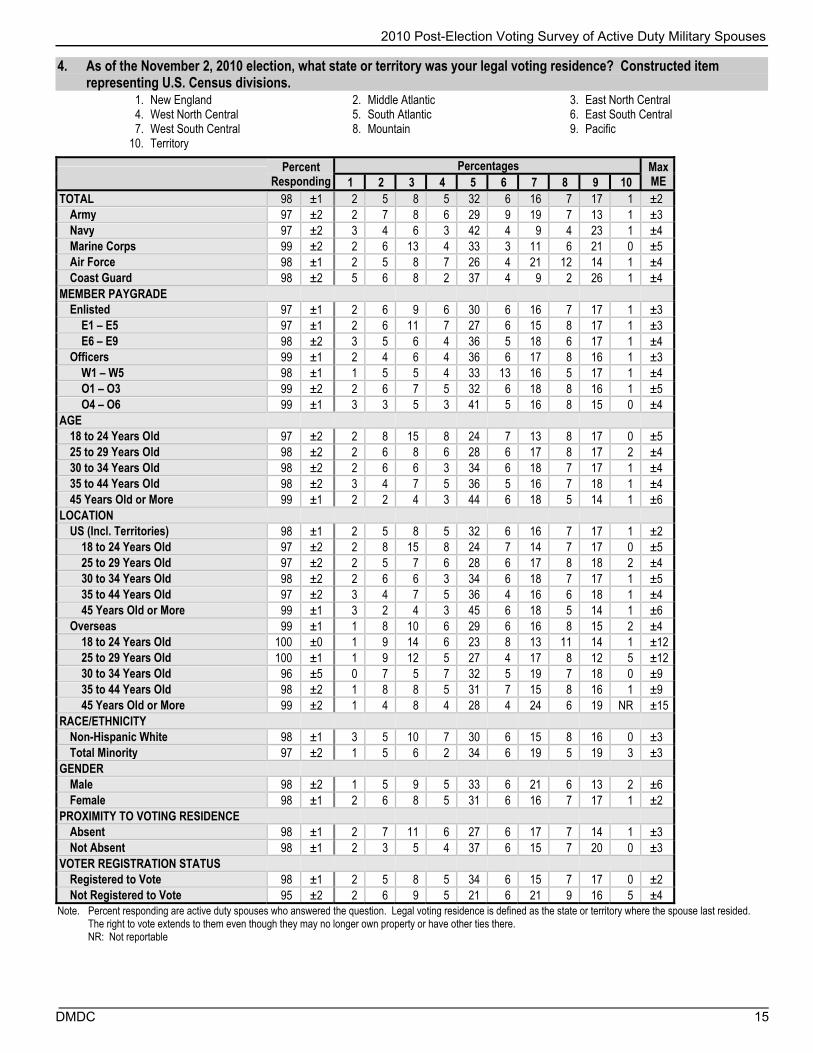
4. As of the November 2, 2010 election, what state or territory was your legal voting residence? Constructed item representing U.S. Census divisions.
1. New England 2. Middle Atlantic 3. East North Central 4. West North Central 5. South Atlantic 6. East South Central 7. West South Central 8. Mountain 9. Pacific
10. Territory
Percent Responding
Percentages Max ME 1 2 3 4 5 6 7 8 9 10
TOTAL 98 ±1 2 5 8 5 32 6 16 7 17 1 ±2 Army 97 ±2 2 7 8 6 29 9 19 7 13 1 ±3 Navy 97 ±2 3 4 6 3 42 4 9 4 23 1 ±4 Marine Corps 99 ±2 2 6 13 4 33 3 11 6 21 0 ±5 Air Force 98 ±1 2 5 8 7 26 4 21 12 14 1 ±4 Coast Guard 98 ±2 5 6 8 2 37 4 9 2 26 1 ±4
MEMBER PAYGRADE Enlisted 97 ±1 2 6 9 6 30 6 16 7 17 1 ±3
E1 – E5 97 ±1 2 6 11 7 27 6 15 8 17 1 ±3 E6 – E9 98 ±2 3 5 6 4 36 5 18 6 17 1 ±4
Officers 99 ±1 2 4 6 4 36 6 17 8 16 1 ±3 W1 – W5 98 ±1 1 5 5 4 33 13 16 5 17 1 ±4 O1 – O3 99 ±2 2 6 7 5 32 6 18 8 16 1 ±5 O4 – O6 99 ±1 3 3 5 3 41 5 16 8 15 0 ±4
AGE 18 to 24 Years Old 97 ±2 2 8 15 8 24 7 13 8 17 0 ±5 25 to 29 Years Old 98 ±2 2 6 8 6 28 6 17 8 17 2 ±4 30 to 34 Years Old 98 ±2 2 6 6 3 34 6 18 7 17 1 ±4 35 to 44 Years Old 98 ±2 3 4 7 5 36 5 16 7 18 1 ±4 45 Years Old or More 99 ±1 2 2 4 3 44 6 18 5 14 1 ±6
LOCATION US (Incl. Territories) 98 ±1 2 5 8 5 32 6 16 7 17 1 ±2
18 to 24 Years Old 97 ±2 2 8 15 8 24 7 14 7 17 0 ±5 25 to 29 Years Old 97 ±2 2 5 7 6 28 6 17 8 18 2 ±4 30 to 34 Years Old 98 ±2 2 6 6 3 34 6 18 7 17 1 ±5 35 to 44 Years Old 97 ±2 3 4 7 5 36 4 16 6 18 1 ±4 45 Years Old or More 99 ±1 3 2 4 3 45 6 18 5 14 1 ±6
Overseas 99 ±1 1 8 10 6 29 6 16 8 15 2 ±4 18 to 24 Years Old 100 ±0 1 9 14 6 23 8 13 11 14 1 ±12 25 to 29 Years Old 100 ±1 1 9 12 5 27 4 17 8 12 5 ±12 30 to 34 Years Old 96 ±5 0 7 5 7 32 5 19 7 18 0 ±9 35 to 44 Years Old 98 ±2 1 8 8 5 31 7 15 8 16 1 ±9 45 Years Old or More 99 ±2 1 4 8 4 28 4 24 6 19 NR ±15
RACE/ETHNICITY Non-Hispanic White 98 ±1 3 5 10 7 30 6 15 8 16 0 ±3 Total Minority 97 ±2 1 5 6 2 34 6 19 5 19 3 ±3
GENDER Male 98 ±2 1 5 9 5 33 6 21 6 13 2 ±6 Female 98 ±1 2 6 8 5 31 6 16 7 17 1 ±2
PROXIMITY TO VOTING RESIDENCE Absent 98 ±1 2 7 11 6 27 6 17 7 14 1 ±3 Not Absent 98 ±1 2 3 5 4 37 6 15 7 20 0 ±3
VOTER REGISTRATION STATUS Registered to Vote 98 ±1 2 5 8 5 34 6 15 7 17 0 ±2 Not Registered to Vote 95 ±2 2 6 9 5 21 6 21 9 16 5 ±4
Note. Percent responding are active duty spouses who answered the question. Legal voting residence is defined as the state or territory where the spouse last resided. The right to vote extends to them even though they may no longer own property or have other ties there. NR: Not reportable

2010 Post-Election Voting Survey of Active Duty Military Spouses
16 DMDC
5. As of November 2, 2010, did you live more than 50 miles from your legal voting residence?
Percent
Responding Percentages Max
ME Percentage
Reporting Yes Yes TOTAL 99 ±1 56 ±2
Army 99 ±1 56 ±4 Navy 99 ±1 49 ±4 Marine Corps 99 ±1 60 ±6 Air Force 100 ±1 60 ±4 Coast Guard 99 ±1 46 ±4
MEMBER PAYGRADE Enlisted 99 ±1 55 ±3
E1 – E5 99 ±1 60 ±3 E6 – E9 100 ±1 47 ±4
Officers 99 ±1 58 ±3 W1 – W5 99 ±1 53 ±4 O1 – O3 99 ±2 56 ±5 O4 – O6 100 ±1 60 ±5
AGE 18 to 24 Years Old 99 ±1 62 ±5 25 to 29 Years Old 99 ±1 59 ±4 30 to 34 Years Old 100 ±1 53 ±4 35 to 44 Years Old 99 ±1 52 ±4 45 Years Old or More 100 ±1 46 ±6
LOCATION US (Incl. Territories) 99 ±1 52 ±2
18 to 24 Years Old 99 ±1 60 ±5 25 to 29 Years Old 98 ±1 55 ±5 30 to 34 Years Old 100 ±1 50 ±5 35 to 44 Years Old 99 ±1 48 ±4 45 Years Old or More 100 ±1 41 ±6
Overseas 100 ±1 94 ±3 18 to 24 Years Old 99 ±3 92 ±9 25 to 29 Years Old 100 ±1 97 ±4 30 to 34 Years Old 100 ±0 92 ±9 35 to 44 Years Old 99 ±1 94 ±6 45 Years Old or More 100 ±1 98 ±2
RACE/ETHNICITY Non-Hispanic White 99 ±1 57 ±3 Total Minority 99 ±1 54 ±4
GENDER Male 100 ±1 64 ±6 Female 99 ±1 55 ±2
PROXIMITY TO VOTING RESIDENCE Absent 100 ±0 100 ±0 Not Absent 100 ±0 0 ±0
VOTER REGISTRATION STATUS Registered to Vote 100 ±1 54 ±2 Not Registered to Vote 98 ±2 64 ±5
Note. Percent responding are active duty spouses who answered the question.

2010 Post-Election Voting Survey of Active Duty Military Spouses
DMDC 17
6. Are you Spanish/Hispanic/Latino?
Percent
Responding Percentages Max
ME Percentage
Reporting Yes Yes TOTAL 100 ±1 14 ±2
Army 100 ±1 17 ±3 Navy 100 ±1 12 ±3 Marine Corps 100 ±1 17 ±5 Air Force 100 ±1 11 ±3 Coast Guard 100 ±1 14 ±3
MEMBER PAYGRADE Enlisted 100 ±1 16 ±2
E1 – E5 100 ±1 17 ±3 E6 – E9 100 ±1 14 ±3
Officers 100 ±1 9 ±2 W1 – W5 100 ±1 12 ±3 O1 – O3 99 ±1 10 ±4 O4 – O6 100 ±1 7 ±3
AGE 18 to 24 Years Old 100 ±1 15 ±4 25 to 29 Years Old 100 ±1 16 ±3 30 to 34 Years Old 100 ±1 15 ±4 35 to 44 Years Old 100 ±1 11 ±3 45 Years Old or More 100 ±1 11 ±4
LOCATION US (Incl. Territories) 100 ±1 14 ±2
18 to 24 Years Old 100 ±1 16 ±4 25 to 29 Years Old 100 ±1 16 ±4 30 to 34 Years Old 100 ±1 16 ±4 35 to 44 Years Old 100 ±1 11 ±3 45 Years Old or More 100 ±1 11 ±4
Overseas 100 ±1 15 ±4 18 to 24 Years Old 100 ±0 14 ±12 25 to 29 Years Old 100 ±1 21 ±10 30 to 34 Years Old 100 ±0 12 ±7 35 to 44 Years Old 99 ±2 12 ±7 45 Years Old or More 100 ±1 8 ±9
RACE/ETHNICITY Non-Hispanic White 100 ±1 0 ±0 Total Minority 100 ±1 40 ±4
GENDER Male 100 ±1 15 ±5 Female 100 ±1 14 ±2
PROXIMITY TO VOTING RESIDENCE Absent 100 ±1 14 ±2 Not Absent 100 ±1 14 ±3
VOTER REGISTRATION STATUS Registered to Vote 100 ±1 12 ±2 Not Registered to Vote 100 ±1 22 ±4
Note. Percent responding are active duty spouses who answered the question.
2010 Post-Election Voting Survey of Active Duty Military Spouses
18 DMDC
7. What is your race?
1. White 2. Black 3. American Indian/Alaska Native 4. Asian 5. Native Hawaiian/Other Pacific Islander 6. More than one race
Percent
Responding Percentages Max
ME 1 2 3 4 5 6 TOTAL 100 ±0 76 15 2 6 1 4 ±2
Army 100 ±0 73 19 2 3 2 3 ±3 Navy 100 ±0 72 17 2 10 1 4 ±4 Marine Corps 100 ±0 82 7 3 5 0 3 ±5 Air Force 100 ±0 79 12 3 6 1 4 ±3 Coast Guard 100 ±0 92 3 2 4 2 3 ±3
MEMBER PAYGRADE Enlisted 100 ±0 74 17 3 6 1 4 ±2
E1 – E5 100 ±0 77 14 3 5 1 4 ±3 E6 – E9 100 ±0 69 21 3 6 1 4 ±3
Officers 100 ±0 84 8 1 6 1 2 ±2 W1 – W5 100 ±0 75 14 3 7 2 4 ±4 O1 – O3 100 ±0 84 8 1 6 1 2 ±4 O4 – O6 100 ±0 86 7 1 5 1 2 ±3
AGE 18 to 24 Years Old 100 ±0 82 10 3 5 0 4 ±4 25 to 29 Years Old 100 ±0 80 13 2 4 2 4 ±4 30 to 34 Years Old 100 ±0 74 16 2 6 1 4 ±4 35 to 44 Years Old 100 ±0 72 19 3 6 1 3 ±3 45 Years Old or More 100 ±0 69 19 2 8 1 1 ±6
LOCATION US (Incl. Territories) 100 ±0 77 15 3 5 1 4 ±2
18 to 24 Years Old 100 ±0 82 10 3 5 0 4 ±4 25 to 29 Years Old 100 ±0 80 13 2 4 2 4 ±4 30 to 34 Years Old 100 ±0 75 15 2 6 1 4 ±4 35 to 44 Years Old 100 ±0 73 19 3 5 1 3 ±4 45 Years Old or More 100 ±0 69 19 2 7 1 1 ±6
Overseas 100 ±0 67 19 2 9 1 3 ±4 18 to 24 Years Old 100 ±0 78 10 2 5 3 2 ±12 25 to 29 Years Old 100 ±0 71 18 2 4 1 2 ±9 30 to 34 Years Old 100 ±0 57 25 2 15 2 3 ±9 35 to 44 Years Old 100 ±0 64 21 2 9 0 3 ±8 45 Years Old or More 100 ±0 66 17 1 15 1 1 ±11
RACE/ETHNICITY Non-Hispanic White 100 ±0 100 0 0 0 0 0 ±0 Total Minority 100 ±0 34 43 7 16 3 10 ±3
GENDER Male 100 ±0 59 31 2 5 1 2 ±6 Female 100 ±0 78 13 3 6 1 4 ±2
PROXIMITY TO VOTING RESIDENCE Absent 100 ±0 78 14 3 5 1 4 ±2 Not Absent 100 ±0 74 16 2 6 1 3 ±3
VOTER REGISTRATION STATUS Registered to Vote 100 ±0 77 16 2 5 1 3 ±2 Not Registered to Vote 100 ±0 73 11 3 9 3 4 ±4
Note. Percent responding are active duty spouses who answered the question.

2010 Post-Election Voting Survey of Active Duty Military Spouses
DMDC 19
8. What was your age on November 2, 2010?
1. 17 years old or younger 2. 18 to 24 years old 3. 25 to 29 years old 4. 30 to 34 years old 5. 35 to 44 years old 6. 45 years old or older
Percent
Responding Percentages Max
ME 1 2 3 4 5 6 TOTAL 100 ±1 0º 21 26 21 25 8 ±2
Army 100 ±1 0º 20 26 22 24 8 ±3 Navy 100 ±1 0º 17 26 20 28 9 ±4 Marine Corps 100 ±1 0º 39 26 15 16 3 ±5 Air Force 100 ±1 0º 17 26 23 27 7 ±3 Coast Guard 100 ±1 0º 13 24 22 29 11 ±4
MEMBER PAYGRADE Enlisted 100 ±1 0º 25 28 21 20 5 ±2
E1 – E5 100 ±1 0º 41 35 15 7 2 ±3 E6 – E9 100 ±1 0º 2 18 30 40 9 ±4
Officers 100 ±1 0º 4 17 21 40 18 ±3 W1 – W5 100 ±1 0º 2 12 24 44 18 ±4 O1 – O3 100 ±1 0º 8 35 29 22 5 ±4 O4 – O6 100 ±1 0º 0 1 13 57 30 ±4
AGE 18 to 24 Years Old 100 ±0 0º 100 0 0 0 0 ±0 25 to 29 Years Old 100 ±0 0º 0 100 0 0 0 ±0 30 to 34 Years Old 100 ±0 0º 0 0 100 0 0 ±0 35 to 44 Years Old 100 ±0 0º 0 0 0 100 0 ±0 45 Years Old or More 100 ±0 0º 0 0 0 0 100 ±0
LOCATION US (Incl. Territories) 100 ±1 0º 21 26 21 24 8 ±2
18 to 24 Years Old 100 ±0 0º 100 0 0 0 0 ±0 25 to 29 Years Old 100 ±0 0º 0 100 0 0 0 ±0 30 to 34 Years Old 100 ±0 0º 0 0 100 0 0 ±0 35 to 44 Years Old 100 ±0 0º 0 0 0 100 0 ±0 45 Years Old or More 100 ±0 0º 0 0 0 0 100 ±0
Overseas 100 ±1 0º 16 28 21 29 6 ±5 18 to 24 Years Old 100 ±0 0º 100 0 0 0 0 ±0 25 to 29 Years Old 100 ±0 0º 0 100 0 0 0 ±0 30 to 34 Years Old 100 ±0 0º 0 0 100 0 0 ±0 35 to 44 Years Old 100 ±0 0º 0 0 0 100 0 ±0 45 Years Old or More 100 ±0 0º 0 0 0 0 100 ±0
RACE/ETHNICITY Non-Hispanic White 100 ±1 0º 22 26 20 24 7 ±2 Total Minority 100 ±1 0º 18 25 23 26 8 ±3
GENDER Male 100 ±1 0º 8 26 21 29 16 ±6 Female 100 ±1 0º 22 26 21 24 7 ±2
PROXIMITY TO VOTING RESIDENCE Absent 100 ±1 0º 23 27 20 23 6 ±3 Not Absent 100 ±1 0º 18 24 22 26 9 ±3
VOTER REGISTRATION STATUS Registered to Vote 100 ±1 0º 18 25 22 27 8 ±2 Not Registered to Vote 100 ±1 0º 32 30 18 15 5 ±5
Note. Percent responding are active duty spouses who answered the question. Respondents who were not at least 18 years old (Q8) are excluded from this report. º Response option never endorsed.
2010 Post-Election Voting Survey of Active Duty Military Spouses
20 DMDC
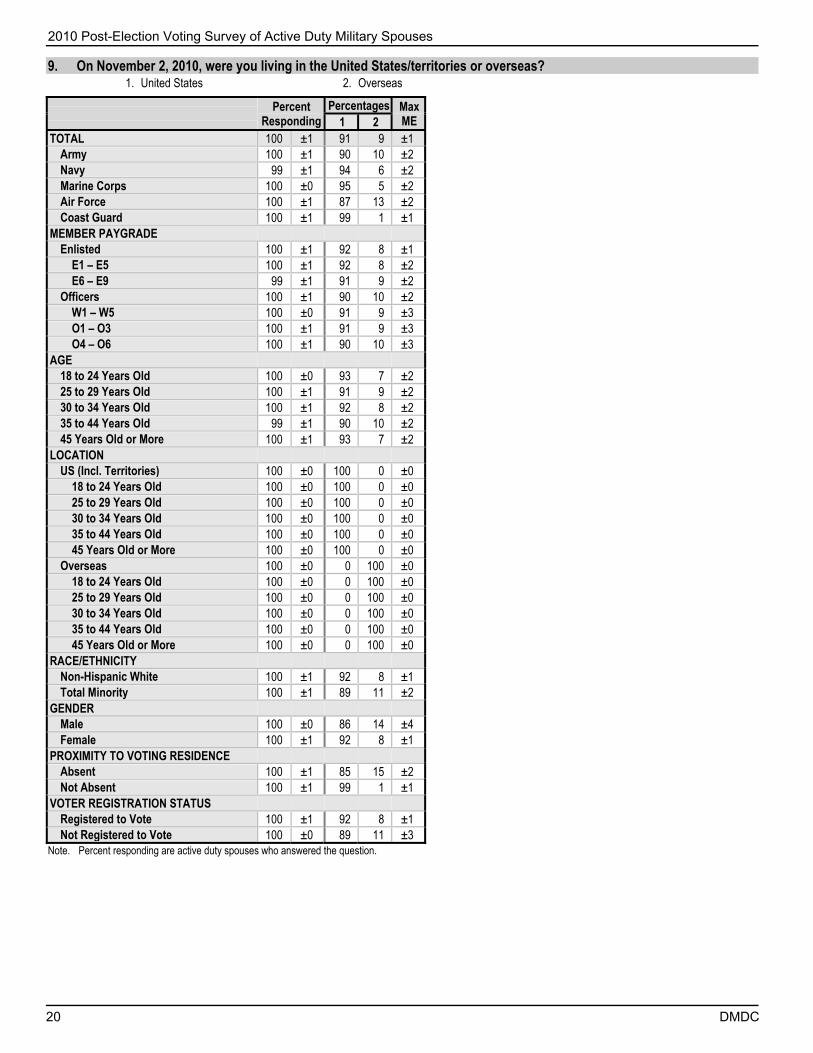
9. On November 2, 2010, were you living in the United States/territories or overseas?
1. United States 2. Overseas
Percent
Responding Percentages Max
ME 1 2 TOTAL 100 ±1 91 9 ±1
Army 100 ±1 90 10 ±2 Navy 99 ±1 94 6 ±2 Marine Corps 100 ±0 95 5 ±2 Air Force 100 ±1 87 13 ±2 Coast Guard 100 ±1 99 1 ±1
MEMBER PAYGRADE Enlisted 100 ±1 92 8 ±1
E1 – E5 100 ±1 92 8 ±2 E6 – E9 99 ±1 91 9 ±2
Officers 100 ±1 90 10 ±2 W1 – W5 100 ±0 91 9 ±3 O1 – O3 100 ±1 91 9 ±3 O4 – O6 100 ±1 90 10 ±3
AGE 18 to 24 Years Old 100 ±0 93 7 ±2 25 to 29 Years Old 100 ±1 91 9 ±2 30 to 34 Years Old 100 ±1 92 8 ±2 35 to 44 Years Old 99 ±1 90 10 ±2 45 Years Old or More 100 ±1 93 7 ±2
LOCATION US (Incl. Territories) 100 ±0 100 0 ±0
18 to 24 Years Old 100 ±0 100 0 ±0 25 to 29 Years Old 100 ±0 100 0 ±0 30 to 34 Years Old 100 ±0 100 0 ±0 35 to 44 Years Old 100 ±0 100 0 ±0 45 Years Old or More 100 ±0 100 0 ±0
Overseas 100 ±0 0 100 ±0 18 to 24 Years Old 100 ±0 0 100 ±0 25 to 29 Years Old 100 ±0 0 100 ±0 30 to 34 Years Old 100 ±0 0 100 ±0 35 to 44 Years Old 100 ±0 0 100 ±0 45 Years Old or More 100 ±0 0 100 ±0
RACE/ETHNICITY Non-Hispanic White 100 ±1 92 8 ±1 Total Minority 100 ±1 89 11 ±2
GENDER Male 100 ±0 86 14 ±4 Female 100 ±1 92 8 ±1
PROXIMITY TO VOTING RESIDENCE Absent 100 ±1 85 15 ±2 Not Absent 100 ±1 99 1 ±1
VOTER REGISTRATION STATUS Registered to Vote 100 ±1 92 8 ±1 Not Registered to Vote 100 ±0 89 11 ±3
Note. Percent responding are active duty spouses who answered the question.

2010 Post-Election Voting Survey of Active Duty Military Spouses
DMDC 21
10. As of November 2, 2010, how long had you been living in this country?
1. Less than 6 months 2. 6 months to less than 1 year 3. 1 year to less than 2 years 4. 2 years to less than 3 years 5. 3 years or more
Percent
Responding Percentages Max
ME 1 2 3 4 5 TOTAL 9 ±1 22 15 26 19 17 ±5
Army 9 ±2 27 15 24 14 21 ±9 Navy 5 ±2 22 16 26 17 20 ±12 Marine Corps 5 ±2 12 19 27 38 5 ±12 Air Force 12 ±2 17 15 30 23 14 ±7 Coast Guard 1 ±1 NR NR NR NR NR
MEMBER PAYGRADE Enlisted 8 ±1 19 16 26 20 19 ±6
E1 – E5 8 ±1 18 23 27 18 14 ±8 E6 – E9 9 ±2 20 9 25 22 24 ±9
Officers 10 ±2 30 12 28 17 13 ±8 W1 – W5 9 ±3 20 13 27 22 19 ±12 O1 – O3 9 ±3 33 14 27 15 11 ±15 O4 – O6 10 ±2 30 10 29 17 14 ±11
AGE 18 to 24 Years Old 7 ±2 23 24 31 15 6 ±13 25 to 29 Years Old 9 ±2 26 15 21 18 19 ±11 30 to 34 Years Old 8 ±2 17 15 33 25 10 ±10 35 to 44 Years Old 10 ±2 22 12 26 16 25 ±9 45 Years Old or More 7 ±2 18 7 19 32 24 ±16
LOCATION US (Incl. Territories) NA NA NA NA NA NA
18 to 24 Years Old NA NA NA NA NA NA 25 to 29 Years Old NA NA NA NA NA NA 30 to 34 Years Old NA NA NA NA NA NA 35 to 44 Years Old NA NA NA NA NA NA 45 Years Old or More NA NA NA NA NA NA
Overseas 98 ±2 22 15 26 19 17 ±5 18 to 24 Years Old 97 ±6 23 24 31 15 6 ±13 25 to 29 Years Old 97 ±6 26 15 21 18 19 ±11 30 to 34 Years Old 100 ±1 17 15 33 25 10 ±10 35 to 44 Years Old 99 ±1 22 12 26 16 25 ±9 45 Years Old or More 100 ±0 18 7 19 32 24 ±16
RACE/ETHNICITY Non-Hispanic White 8 ±1 21 16 29 19 15 ±6 Total Minority 11 ±2 22 14 24 20 20 ±8
GENDER Male 13 ±4 25 14 19 22 21 ±16 Female 8 ±1 21 16 28 19 16 ±5
PROXIMITY TO VOTING RESIDENCE Absent 15 ±2 21 15 27 20 17 ±5 Not Absent 1 ±1 NR 18 17 10 NR ±16
VOTER REGISTRATION STATUS Registered to Vote 8 ±1 22 15 26 21 16 ±6 Not Registered to Vote 11 ±2 21 16 27 15 21 ±11
Note. Percent responding are active duty spouses who answered the question and who were living overseas on November 2, 2010 (Q9). NR: Not reportable NA: Not applicable

2010 Post-Election Voting Survey of Active Duty Military Spouses
22 DMDC
11. Did your state of legal voting residence provide voter registration verification Web sites?
1. Yes 2. No 3. Don't know
Percent
Responding Percentages Max
ME 1 2 3 TOTAL 100 ±1 13 10 77 ±2
Army 100 ±1 13 11 76 ±3 Navy 100 ±1 14 10 76 ±4 Marine Corps 100 ±1 12 8 80 ±5 Air Force 100 ±1 13 9 78 ±3 Coast Guard 100 ±1 10 10 80 ±4
MEMBER PAYGRADE Enlisted 100 ±1 12 9 78 ±2
E1 – E5 100 ±1 11 8 81 ±3 E6 – E9 100 ±1 15 11 74 ±3
Officers 100 ±1 17 11 72 ±3 W1 – W5 100 ±0 16 10 74 ±4 O1 – O3 100 ±1 16 12 72 ±5 O4 – O6 100 ±1 18 11 72 ±4
AGE 18 to 24 Years Old 100 ±0 8 7 85 ±4 25 to 29 Years Old 100 ±1 10 9 80 ±4 30 to 34 Years Old 100 ±1 15 12 73 ±4 35 to 44 Years Old 100 ±1 16 11 73 ±3 45 Years Old or More 100 ±1 21 10 69 ±6
LOCATION US (Incl. Territories) 100 ±1 13 10 77 ±2
18 to 24 Years Old 100 ±0 8 7 85 ±4 25 to 29 Years Old 100 ±1 9 9 81 ±4 30 to 34 Years Old 100 ±1 15 12 73 ±4 35 to 44 Years Old 100 ±1 17 11 72 ±4 45 Years Old or More 100 ±1 21 10 69 ±6
Overseas 100 ±1 13 12 75 ±4 18 to 24 Years Old 100 ±0 5 8 87 ±9 25 to 29 Years Old 100 ±0 17 10 72 ±9 30 to 34 Years Old 100 ±0 15 11 73 ±9 35 to 44 Years Old 99 ±2 12 15 73 ±8 45 Years Old or More 100 ±0 18 12 69 ±11
RACE/ETHNICITY Non-Hispanic White 100 ±1 11 9 80 ±2 Total Minority 100 ±1 18 11 71 ±3
GENDER Male 100 ±0 21 13 66 ±6 Female 100 ±1 12 9 78 ±2
PROXIMITY TO VOTING RESIDENCE Absent 100 ±1 13 11 76 ±3 Not Absent 100 ±1 14 9 78 ±3
VOTER REGISTRATION STATUS Registered to Vote 100 ±1 15 10 75 ±2 Not Registered to Vote 99 ±1 7 8 85 ±4
Note. Percent responding are active duty spouses who answered the question.

2010 Post-Election Voting Survey of Active Duty Military Spouses
DMDC 23
12. In 2010, were you registered to vote in the United States?
Percent
Responding Percentages Max
ME Percentage
Reporting Yes Yes TOTAL 100 ±1 80 ±2
Army 100 ±1 80 ±3 Navy 100 ±1 80 ±4 Marine Corps 100 ±1 78 ±5 Air Force 100 ±1 82 ±3 Coast Guard 100 ±1 86 ±4
MEMBER PAYGRADE Enlisted 100 ±1 78 ±2
E1 – E5 100 ±1 74 ±3 E6 – E9 100 ±1 83 ±3
Officers 100 ±1 90 ±2 W1 – W5 100 ±1 85 ±3 O1 – O3 100 ±1 88 ±4 O4 – O6 100 ±1 93 ±3
AGE 18 to 24 Years Old 100 ±1 70 ±5 25 to 29 Years Old 100 ±1 77 ±4 30 to 34 Years Old 100 ±1 83 ±4 35 to 44 Years Old 100 ±1 88 ±3 45 Years Old or More 100 ±1 87 ±5
LOCATION US (Incl. Territories) 100 ±1 81 ±2
18 to 24 Years Old 100 ±1 70 ±5 25 to 29 Years Old 100 ±1 78 ±4 30 to 34 Years Old 100 ±1 84 ±4 35 to 44 Years Old 100 ±1 89 ±3 45 Years Old or More 100 ±1 87 ±5
Overseas 100 ±1 75 ±4 18 to 24 Years Old 100 ±0 66 ±11 25 to 29 Years Old 100 ±0 73 ±10 30 to 34 Years Old 99 ±2 76 ±9 35 to 44 Years Old 100 ±1 77 ±7 45 Years Old or More 100 ±1 85 ±9
RACE/ETHNICITY Non-Hispanic White 100 ±1 83 ±2 Total Minority 100 ±1 76 ±3
GENDER Male 99 ±1 74 ±6 Female 100 ±1 81 ±2
PROXIMITY TO VOTING RESIDENCE Absent 100 ±1 78 ±3 Not Absent 99 ±1 84 ±3
VOTER REGISTRATION STATUS Registered to Vote 100 ±0 100 ±0 Not Registered to Vote 100 ±0 0 ±0
Note. Percent responding are active duty spouses who answered the question.
2010 Post-Election Voting Survey of Active Duty Military Spouses
24 DMDC
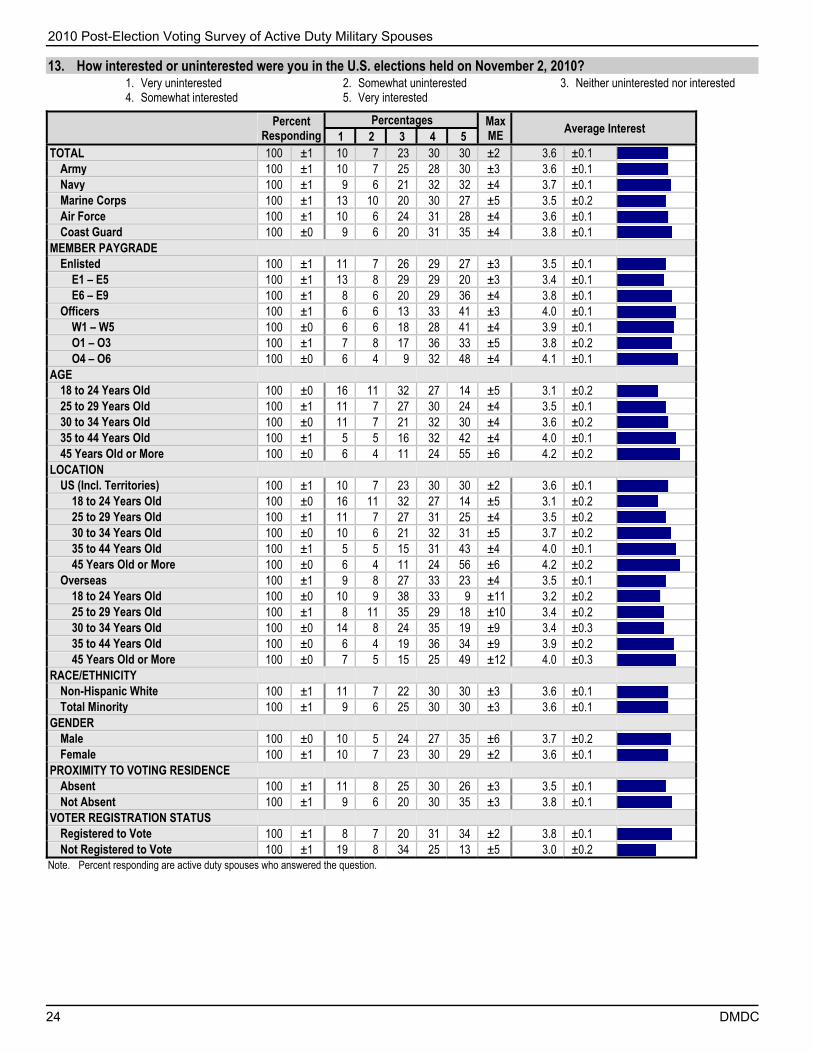
13. How interested or uninterested were you in the U.S. elections held on November 2, 2010?
1. Very uninterested 2. Somewhat uninterested 3. Neither uninterested nor interested 4. Somewhat interested 5. Very interested
Percent
Responding Percentages Max
ME Average Interest
1 2 3 4 5 TOTAL 100 ±1 10 7 23 30 30 ±2 3.6 ±0.1
Army 100 ±1 10 7 25 28 30 ±3 3.6 ±0.1 Navy 100 ±1 9 6 21 32 32 ±4 3.7 ±0.1 Marine Corps 100 ±1 13 10 20 30 27 ±5 3.5 ±0.2 Air Force 100 ±1 10 6 24 31 28 ±4 3.6 ±0.1 Coast Guard 100 ±0 9 6 20 31 35 ±4 3.8 ±0.1
MEMBER PAYGRADE Enlisted 100 ±1 11 7 26 29 27 ±3 3.5 ±0.1
E1 – E5 100 ±1 13 8 29 29 20 ±3 3.4 ±0.1 E6 – E9 100 ±1 8 6 20 29 36 ±4 3.8 ±0.1
Officers 100 ±1 6 6 13 33 41 ±3 4.0 ±0.1 W1 – W5 100 ±0 6 6 18 28 41 ±4 3.9 ±0.1 O1 – O3 100 ±1 7 8 17 36 33 ±5 3.8 ±0.2 O4 – O6 100 ±0 6 4 9 32 48 ±4 4.1 ±0.1
AGE 18 to 24 Years Old 100 ±0 16 11 32 27 14 ±5 3.1 ±0.2 25 to 29 Years Old 100 ±1 11 7 27 30 24 ±4 3.5 ±0.1 30 to 34 Years Old 100 ±0 11 7 21 32 30 ±4 3.6 ±0.2 35 to 44 Years Old 100 ±1 5 5 16 32 42 ±4 4.0 ±0.1 45 Years Old or More 100 ±0 6 4 11 24 55 ±6 4.2 ±0.2
LOCATION US (Incl. Territories) 100 ±1 10 7 23 30 30 ±2 3.6 ±0.1
18 to 24 Years Old 100 ±0 16 11 32 27 14 ±5 3.1 ±0.2 25 to 29 Years Old 100 ±1 11 7 27 31 25 ±4 3.5 ±0.2 30 to 34 Years Old 100 ±0 10 6 21 32 31 ±5 3.7 ±0.2 35 to 44 Years Old 100 ±1 5 5 15 31 43 ±4 4.0 ±0.1 45 Years Old or More 100 ±0 6 4 11 24 56 ±6 4.2 ±0.2
Overseas 100 ±1 9 8 27 33 23 ±4 3.5 ±0.1 18 to 24 Years Old 100 ±0 10 9 38 33 9 ±11 3.2 ±0.2 25 to 29 Years Old 100 ±1 8 11 35 29 18 ±10 3.4 ±0.2 30 to 34 Years Old 100 ±0 14 8 24 35 19 ±9 3.4 ±0.3 35 to 44 Years Old 100 ±0 6 4 19 36 34 ±9 3.9 ±0.2 45 Years Old or More 100 ±0 7 5 15 25 49 ±12 4.0 ±0.3
RACE/ETHNICITY Non-Hispanic White 100 ±1 11 7 22 30 30 ±3 3.6 ±0.1 Total Minority 100 ±1 9 6 25 30 30 ±3 3.6 ±0.1
GENDER Male 100 ±0 10 5 24 27 35 ±6 3.7 ±0.2 Female 100 ±1 10 7 23 30 29 ±2 3.6 ±0.1
PROXIMITY TO VOTING RESIDENCE Absent 100 ±1 11 8 25 30 26 ±3 3.5 ±0.1 Not Absent 100 ±1 9 6 20 30 35 ±3 3.8 ±0.1
VOTER REGISTRATION STATUS Registered to Vote 100 ±1 8 7 20 31 34 ±2 3.8 ±0.1 Not Registered to Vote 100 ±1 19 8 34 25 13 ±5 3.0 ±0.2
Note. Percent responding are active duty spouses who answered the question.

2010 Post-Election Voting Survey of Active Duty Military Spouses
DMDC 25
14. During the past 6 years, did you usually vote in national, state, and local elections, or did you usually not vote?
1. Usually voted 2. Usually did not vote
Percent
Responding Percentages Max
ME 1 2 TOTAL 100 ±1 57 43 ±2
Army 100 ±1 55 45 ±4 Navy 99 ±1 60 40 ±4 Marine Corps 100 ±1 53 47 ±6 Air Force 100 ±1 58 42 ±4 Coast Guard 100 ±1 66 34 ±4
MEMBER PAYGRADE Enlisted 100 ±1 52 48 ±3
E1 – E5 100 ±1 47 53 ±3 E6 – E9 99 ±1 60 40 ±4
Officers 100 ±1 75 25 ±3 W1 – W5 100 ±1 61 39 ±4 O1 – O3 99 ±1 70 30 ±5 O4 – O6 100 ±1 82 18 ±4
AGE 18 to 24 Years Old 99 ±1 41 59 ±5 25 to 29 Years Old 100 ±1 50 50 ±4 30 to 34 Years Old 99 ±1 60 40 ±4 35 to 44 Years Old 100 ±1 69 31 ±4 45 Years Old or More 100 ±1 77 23 ±6
LOCATION US (Incl. Territories) 100 ±1 57 43 ±2
18 to 24 Years Old 99 ±1 41 59 ±5 25 to 29 Years Old 100 ±1 50 50 ±4 30 to 34 Years Old 99 ±1 60 40 ±5 35 to 44 Years Old 100 ±1 70 30 ±4 45 Years Old or More 100 ±1 78 22 ±6
Overseas 100 ±1 58 42 ±5 18 to 24 Years Old 100 ±0 49 51 ±10 25 to 29 Years Old 99 ±2 53 47 ±9 30 to 34 Years Old 100 ±0 58 42 ±9 35 to 44 Years Old 99 ±2 65 35 ±8 45 Years Old or More 100 ±1 75 25 ±11
RACE/ETHNICITY Non-Hispanic White 100 ±1 58 42 ±3 Total Minority 100 ±1 54 46 ±4
GENDER Male 100 ±1 55 45 ±6 Female 100 ±1 57 43 ±2
PROXIMITY TO VOTING RESIDENCE Absent 100 ±1 54 46 ±3 Not Absent 100 ±1 61 39 ±3
VOTER REGISTRATION STATUS Registered to Vote 100 ±1 67 33 ±2 Not Registered to Vote 100 ±1 18 82 ±4
Note. Percent responding are active duty spouses who answered the question.
2010 Post-Election Voting Survey of Active Duty Military Spouses
26 DMDC
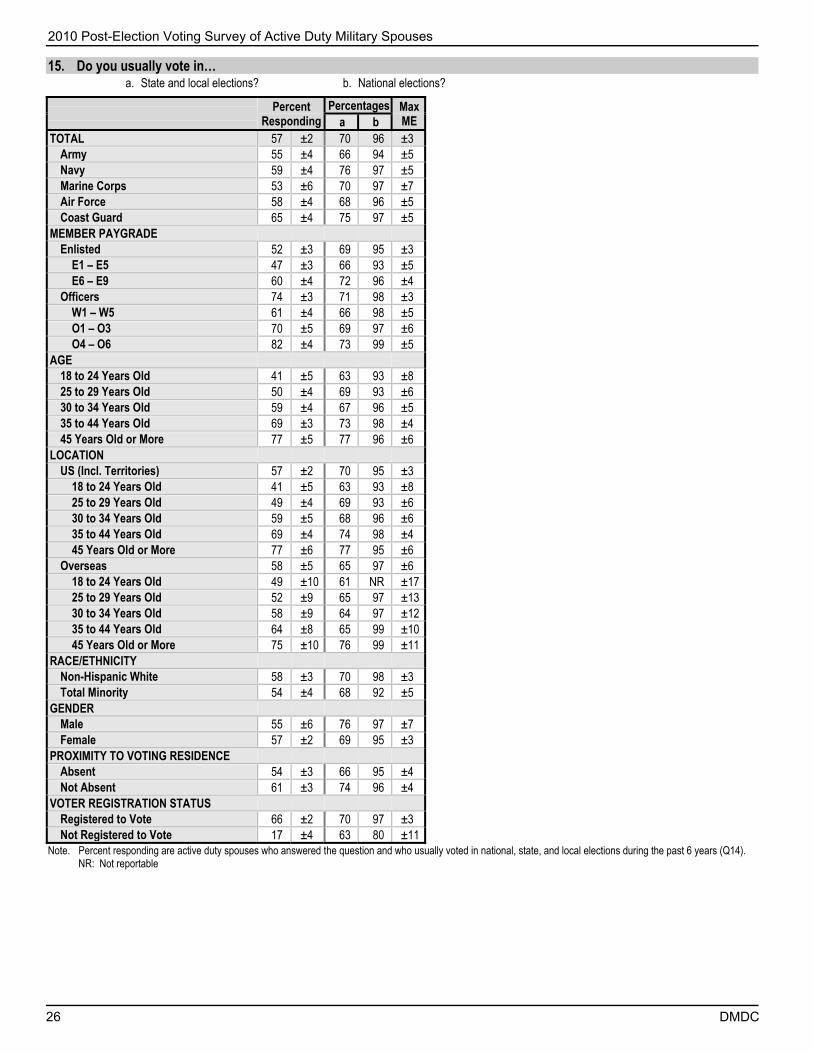
15. Do you usually vote in…
a. State and local elections? b. National elections?
Percent
Responding Percentages Max
ME a b TOTAL 57 ±2 70 96 ±3
Army 55 ±4 66 94 ±5 Navy 59 ±4 76 97 ±5 Marine Corps 53 ±6 70 97 ±7 Air Force 58 ±4 68 96 ±5 Coast Guard 65 ±4 75 97 ±5
MEMBER PAYGRADE Enlisted 52 ±3 69 95 ±3
E1 – E5 47 ±3 66 93 ±5 E6 – E9 60 ±4 72 96 ±4
Officers 74 ±3 71 98 ±3 W1 – W5 61 ±4 66 98 ±5 O1 – O3 70 ±5 69 97 ±6 O4 – O6 82 ±4 73 99 ±5
AGE 18 to 24 Years Old 41 ±5 63 93 ±8 25 to 29 Years Old 50 ±4 69 93 ±6 30 to 34 Years Old 59 ±4 67 96 ±5 35 to 44 Years Old 69 ±3 73 98 ±4 45 Years Old or More 77 ±5 77 96 ±6
LOCATION US (Incl. Territories) 57 ±2 70 95 ±3
18 to 24 Years Old 41 ±5 63 93 ±8 25 to 29 Years Old 49 ±4 69 93 ±6 30 to 34 Years Old 59 ±5 68 96 ±6 35 to 44 Years Old 69 ±4 74 98 ±4 45 Years Old or More 77 ±6 77 95 ±6
Overseas 58 ±5 65 97 ±6 18 to 24 Years Old 49 ±10 61 NR ±17 25 to 29 Years Old 52 ±9 65 97 ±13 30 to 34 Years Old 58 ±9 64 97 ±12 35 to 44 Years Old 64 ±8 65 99 ±10 45 Years Old or More 75 ±10 76 99 ±11
RACE/ETHNICITY Non-Hispanic White 58 ±3 70 98 ±3 Total Minority 54 ±4 68 92 ±5
GENDER Male 55 ±6 76 97 ±7 Female 57 ±2 69 95 ±3
PROXIMITY TO VOTING RESIDENCE Absent 54 ±3 66 95 ±4 Not Absent 61 ±3 74 96 ±4
VOTER REGISTRATION STATUS Registered to Vote 66 ±2 70 97 ±3 Not Registered to Vote 17 ±4 63 80 ±11
Note. Percent responding are active duty spouses who answered the question and who usually voted in national, state, and local elections during the past 6 years (Q14). NR: Not reportable

2010 Post-Election Voting Survey of Active Duty Military Spouses
DMDC 27
16. During the months leading up to the election held on November 2, 2010, what were your voting plans?
1. Did plan to vote 2. Did not plan to vote
Percent
Responding Percentages Max
ME 1 2 TOTAL 100 ±1 60 40 ±2
Army 100 ±1 60 40 ±4 Navy 99 ±1 63 37 ±4 Marine Corps 99 ±2 55 45 ±6 Air Force 100 ±1 60 40 ±4 Coast Guard 99 ±1 66 34 ±4
MEMBER PAYGRADE Enlisted 100 ±1 57 43 ±3
E1 – E5 99 ±1 50 50 ±3 E6 – E9 100 ±1 67 33 ±4
Officers 100 ±1 72 28 ±3 W1 – W5 100 ±1 69 31 ±4 O1 – O3 100 ±1 67 33 ±5 O4 – O6 100 ±1 78 22 ±4
AGE 18 to 24 Years Old 99 ±1 46 54 ±5 25 to 29 Years Old 99 ±1 54 46 ±4 30 to 34 Years Old 100 ±1 60 40 ±4 35 to 44 Years Old 100 ±1 74 26 ±3 45 Years Old or More 100 ±1 77 23 ±6
LOCATION US (Incl. Territories) 100 ±1 61 39 ±2
18 to 24 Years Old 99 ±1 46 54 ±5 25 to 29 Years Old 99 ±1 55 45 ±5 30 to 34 Years Old 100 ±1 61 39 ±5 35 to 44 Years Old 100 ±1 75 25 ±4 45 Years Old or More 100 ±1 78 22 ±6
Overseas 100 ±1 54 46 ±5 18 to 24 Years Old 100 ±0 43 57 ±10 25 to 29 Years Old 100 ±0 48 52 ±9 30 to 34 Years Old 99 ±2 47 53 ±9 35 to 44 Years Old 99 ±2 64 36 ±8 45 Years Old or More 99 ±1 80 20 ±8
RACE/ETHNICITY Non-Hispanic White 100 ±1 61 39 ±3 Total Minority 99 ±1 58 42 ±4
GENDER Male 100 ±1 59 41 ±6 Female 100 ±1 60 40 ±2
PROXIMITY TO VOTING RESIDENCE Absent 100 ±1 54 46 ±3 Not Absent 99 ±1 68 32 ±3
VOTER REGISTRATION STATUS Registered to Vote 100 ±1 68 32 ±2 Not Registered to Vote 99 ±2 27 73 ±5
Note. Percent responding are active duty spouses who answered the question.
2010 Post-Election Voting Survey of Active Duty Military Spouses
28 DMDC
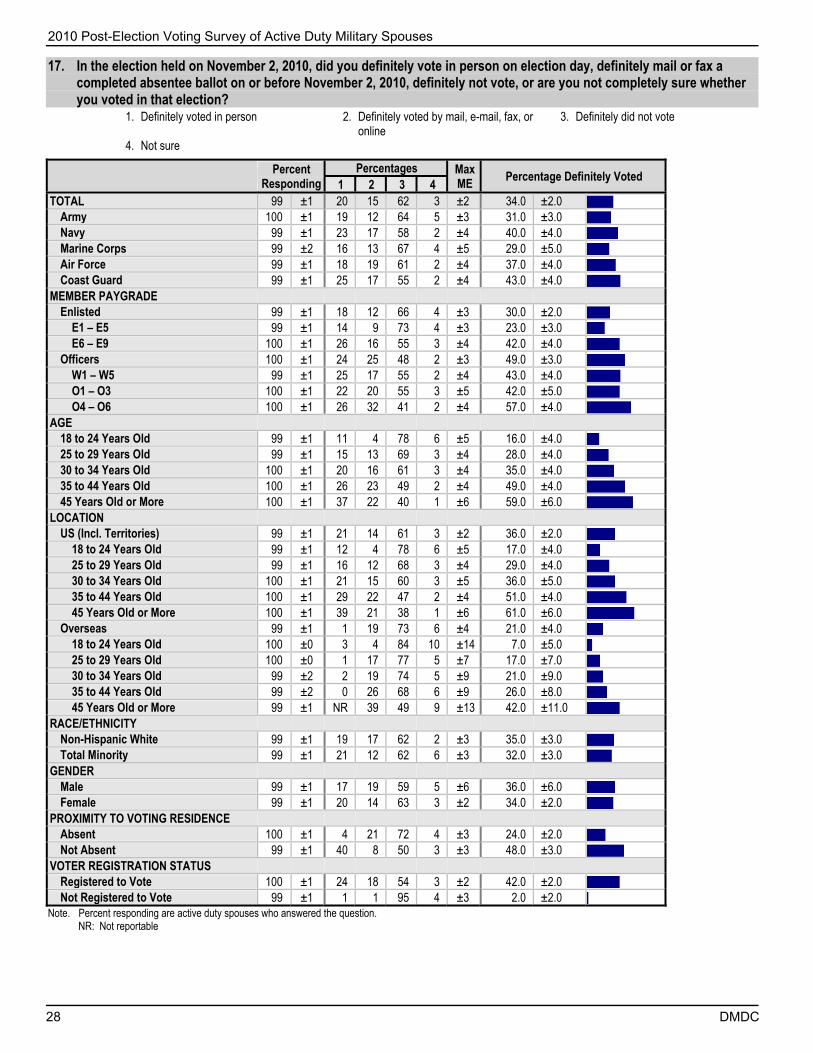
17. In the election held on November 2, 2010, did you definitely vote in person on election day, definitely mail or fax a completed absentee ballot on or before November 2, 2010, definitely not vote, or are you not completely sure whether you voted in that election?
1. Definitely voted in person 2. Definitely voted by mail, e-mail, fax, or online
3. Definitely did not vote
4. Not sure
Percent
Responding Percentages Max
ME Percentage Definitely Voted
1 2 3 4 TOTAL 99 ±1 20 15 62 3 ±2 34.0 ±2.0
Army 100 ±1 19 12 64 5 ±3 31.0 ±3.0 Navy 99 ±1 23 17 58 2 ±4 40.0 ±4.0 Marine Corps 99 ±2 16 13 67 4 ±5 29.0 ±5.0 Air Force 99 ±1 18 19 61 2 ±4 37.0 ±4.0 Coast Guard 99 ±1 25 17 55 2 ±4 43.0 ±4.0
MEMBER PAYGRADE Enlisted 99 ±1 18 12 66 4 ±3 30.0 ±2.0
E1 – E5 99 ±1 14 9 73 4 ±3 23.0 ±3.0 E6 – E9 100 ±1 26 16 55 3 ±4 42.0 ±4.0
Officers 100 ±1 24 25 48 2 ±3 49.0 ±3.0 W1 – W5 99 ±1 25 17 55 2 ±4 43.0 ±4.0 O1 – O3 100 ±1 22 20 55 3 ±5 42.0 ±5.0 O4 – O6 100 ±1 26 32 41 2 ±4 57.0 ±4.0
AGE 18 to 24 Years Old 99 ±1 11 4 78 6 ±5 16.0 ±4.0 25 to 29 Years Old 99 ±1 15 13 69 3 ±4 28.0 ±4.0 30 to 34 Years Old 100 ±1 20 16 61 3 ±4 35.0 ±4.0 35 to 44 Years Old 100 ±1 26 23 49 2 ±4 49.0 ±4.0 45 Years Old or More 100 ±1 37 22 40 1 ±6 59.0 ±6.0
LOCATION US (Incl. Territories) 99 ±1 21 14 61 3 ±2 36.0 ±2.0
18 to 24 Years Old 99 ±1 12 4 78 6 ±5 17.0 ±4.0 25 to 29 Years Old 99 ±1 16 12 68 3 ±4 29.0 ±4.0 30 to 34 Years Old 100 ±1 21 15 60 3 ±5 36.0 ±5.0 35 to 44 Years Old 100 ±1 29 22 47 2 ±4 51.0 ±4.0 45 Years Old or More 100 ±1 39 21 38 1 ±6 61.0 ±6.0
Overseas 99 ±1 1 19 73 6 ±4 21.0 ±4.0 18 to 24 Years Old 100 ±0 3 4 84 10 ±14 7.0 ±5.0 25 to 29 Years Old 100 ±0 1 17 77 5 ±7 17.0 ±7.0 30 to 34 Years Old 99 ±2 2 19 74 5 ±9 21.0 ±9.0 35 to 44 Years Old 99 ±2 0 26 68 6 ±9 26.0 ±8.0 45 Years Old or More 99 ±1 NR 39 49 9 ±13 42.0 ±11.0
RACE/ETHNICITY Non-Hispanic White 99 ±1 19 17 62 2 ±3 35.0 ±3.0 Total Minority 99 ±1 21 12 62 6 ±3 32.0 ±3.0
GENDER Male 99 ±1 17 19 59 5 ±6 36.0 ±6.0 Female 99 ±1 20 14 63 3 ±2 34.0 ±2.0
PROXIMITY TO VOTING RESIDENCE Absent 100 ±1 4 21 72 4 ±3 24.0 ±2.0 Not Absent 99 ±1 40 8 50 3 ±3 48.0 ±3.0
VOTER REGISTRATION STATUS Registered to Vote 100 ±1 24 18 54 3 ±2 42.0 ±2.0 Not Registered to Vote 99 ±1 1 1 95 4 ±3 2.0 ±2.0
Note. Percent responding are active duty spouses who answered the question. NR: Not reportable
2010 Post-Election Voting Survey of Active Duty Military Spouses
DMDC 29
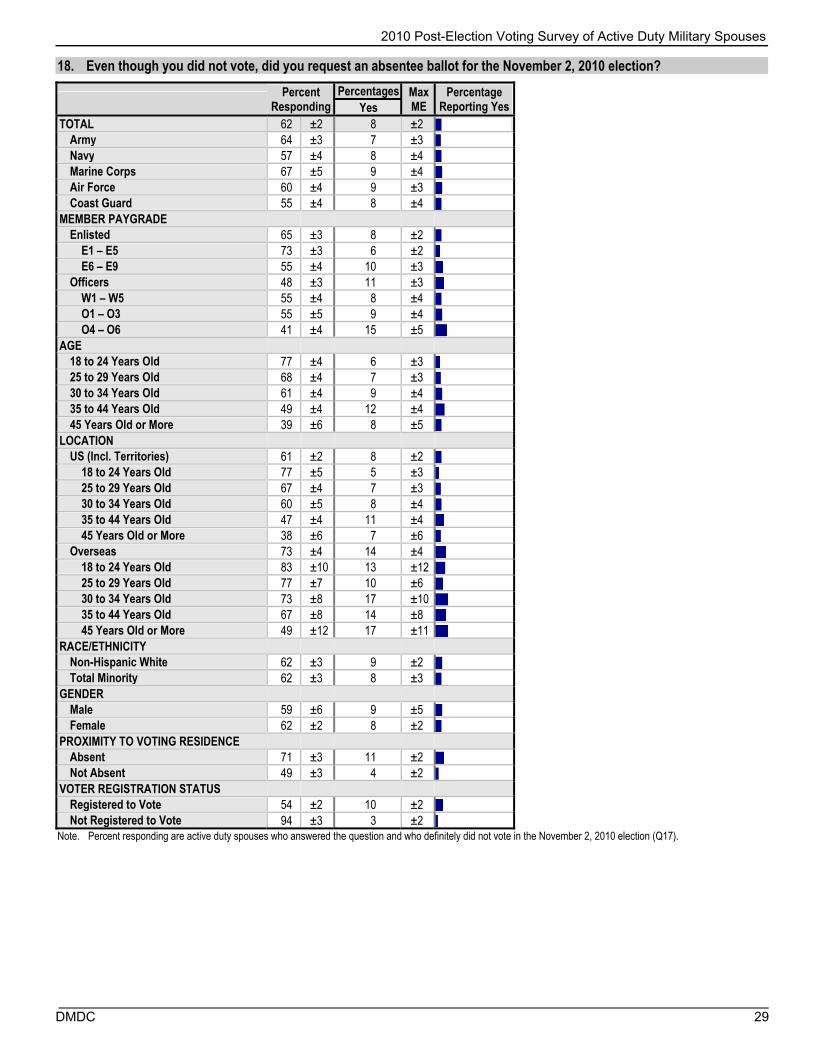
18. Even though you did not vote, did you request an absentee ballot for the November 2, 2010 election?
Percent
Responding Percentages Max
ME Percentage
Reporting Yes Yes TOTAL 62 ±2 8 ±2
Army 64 ±3 7 ±3 Navy 57 ±4 8 ±4 Marine Corps 67 ±5 9 ±4 Air Force 60 ±4 9 ±3 Coast Guard 55 ±4 8 ±4
MEMBER PAYGRADE Enlisted 65 ±3 8 ±2
E1 – E5 73 ±3 6 ±2 E6 – E9 55 ±4 10 ±3
Officers 48 ±3 11 ±3 W1 – W5 55 ±4 8 ±4 O1 – O3 55 ±5 9 ±4 O4 – O6 41 ±4 15 ±5
AGE 18 to 24 Years Old 77 ±4 6 ±3 25 to 29 Years Old 68 ±4 7 ±3 30 to 34 Years Old 61 ±4 9 ±4 35 to 44 Years Old 49 ±4 12 ±4 45 Years Old or More 39 ±6 8 ±5
LOCATION US (Incl. Territories) 61 ±2 8 ±2
18 to 24 Years Old 77 ±5 5 ±3 25 to 29 Years Old 67 ±4 7 ±3 30 to 34 Years Old 60 ±5 8 ±4 35 to 44 Years Old 47 ±4 11 ±4 45 Years Old or More 38 ±6 7 ±6
Overseas 73 ±4 14 ±4 18 to 24 Years Old 83 ±10 13 ±12 25 to 29 Years Old 77 ±7 10 ±6 30 to 34 Years Old 73 ±8 17 ±10 35 to 44 Years Old 67 ±8 14 ±8 45 Years Old or More 49 ±12 17 ±11
RACE/ETHNICITY Non-Hispanic White 62 ±3 9 ±2 Total Minority 62 ±3 8 ±3
GENDER Male 59 ±6 9 ±5 Female 62 ±2 8 ±2
PROXIMITY TO VOTING RESIDENCE Absent 71 ±3 11 ±2 Not Absent 49 ±3 4 ±2
VOTER REGISTRATION STATUS Registered to Vote 54 ±2 10 ±2 Not Registered to Vote 94 ±3 3 ±2
Note. Percent responding are active duty spouses who answered the question and who definitely did not vote in the November 2, 2010 election (Q17).

2010 Post-Election Voting Survey of Active Duty Military Spouses
30 DMDC
19. When did you first request your absentee ballot for the November 2, 2010 election? {Options 1-9}
1. July 2010 or earlier 2. First week in August 3. Second week in August 4. Third week in August 5. Fourth week in August 6. First week in September 7. Second week in September 8. Third week in September 9. Fourth week in September
Percent Responding
Percentages Max ME 1 2 3 4 5 6 7 8 9
TOTAL 19 ±2 6 2 1 0 1 3 2 1 2 ±2 Army 16 ±3 6 2 0 0 1 3 3 0 2 ±4 Navy 21 ±3 5 1 1 1 2 4 2 0 2 ±5 Marine Corps 18 ±4 7 1 1 0 0 2 1 0 2 ±8 Air Force 23 ±3 7 3 2 1 0 3 3 1 3 ±5 Coast Guard 21 ±3 9 3 1 0 0 3 0 1 2 ±6
MEMBER PAYGRADE Enlisted 17 ±2 5 1 0 1 1 2 2 0 2 ±3
E1 – E5 14 ±2 5 2 1 1 1 1 2 0 3 ±5 E6 – E9 21 ±3 6 1 0 0 1 4 2 0 2 ±4
Officers 30 ±3 9 3 2 0 1 5 3 1 2 ±4 W1 – W5 21 ±3 9 2 2 0 0 2 3 2 2 ±6 O1 – O3 24 ±4 7 2 2 0 2 4 3 1 1 ±7 O4 – O6 37 ±4 10 4 3 1 0 6 4 1 3 ±5
AGE 18 to 24 Years Old 9 ±3 0 1 NR NR 0 NR 3 NR NR ±10 25 to 29 Years Old 18 ±3 5 1 1 0 2 2 2 1 3 ±6 30 to 34 Years Old 21 ±3 6 2 1 0 1 3 2 1 3 ±6 35 to 44 Years Old 28 ±3 8 1 1 1 0 3 3 0 1 ±4 45 Years Old or More 25 ±5 11 5 3 0 0 8 2 1 2 ±9
LOCATION US (Incl. Territories) 19 ±2 6 2 1 0 1 3 2 0 2 ±3
18 to 24 Years Old 8 ±3 0 NR NR NR NR NR NR NR NR ±3 25 to 29 Years Old 17 ±3 5 1 2 0 3 2 2 0 3 ±6 30 to 34 Years Old 19 ±4 5 2 1 0 1 3 2 1 3 ±7 35 to 44 Years Old 27 ±4 9 1 1 0 0 4 2 0 1 ±4 45 Years Old or More 24 ±5 10 6 2 0 0 8 2 1 2 ±11
Overseas 29 ±4 7 3 1 1 2 3 3 2 4 ±5 18 to 24 Years Old 15 ±8 NR NR NR NR NR NR NR NR NR 25 to 29 Years Old 25 ±7 5 NR NR NR NR 3 5 NR 4 ±11 30 to 34 Years Old 32 ±9 10 NR NR NR 3 4 NR NR 2 ±14 35 to 44 Years Old 35 ±8 5 5 NR NR 0 2 5 1 5 ±9 45 Years Old or More 46 ±11 15 1 NR 0 1 6 2 3 1 ±16
RACE/ETHNICITY Non-Hispanic White 21 ±2 6 2 1 0 1 4 3 1 3 ±3 Total Minority 16 ±3 8 0 1 0 1 2 1 1 2 ±4
GENDER Male 24 ±5 5 2 1 0 0 4 6 2 0 ±8 Female 19 ±2 7 2 1 1 1 3 2 0 3 ±3
PROXIMITY TO VOTING RESIDENCE Absent 28 ±2 6 2 1 1 1 3 2 1 3 ±3 Not Absent 9 ±2 7 0 0 0 2 2 2 0 0 ±6
VOTER REGISTRATION STATUS Registered to Vote 24 ±2 6 2 1 0 1 3 2 1 2 ±2 Not Registered to Vote 3 ±2 NR NR NR NR NR NR NR NR 0 ±1
Note. Percent responding are active duty spouses who answered the question and who definitely voted by mail, e-mail/fax, or online in the November 2, 2010 election (Q17) or who definitely did not vote but requested an absentee ballot for the election (Q18). NR: Not reportable
2010 Post-Election Voting Survey of Active Duty Military Spouses
DMDC 31
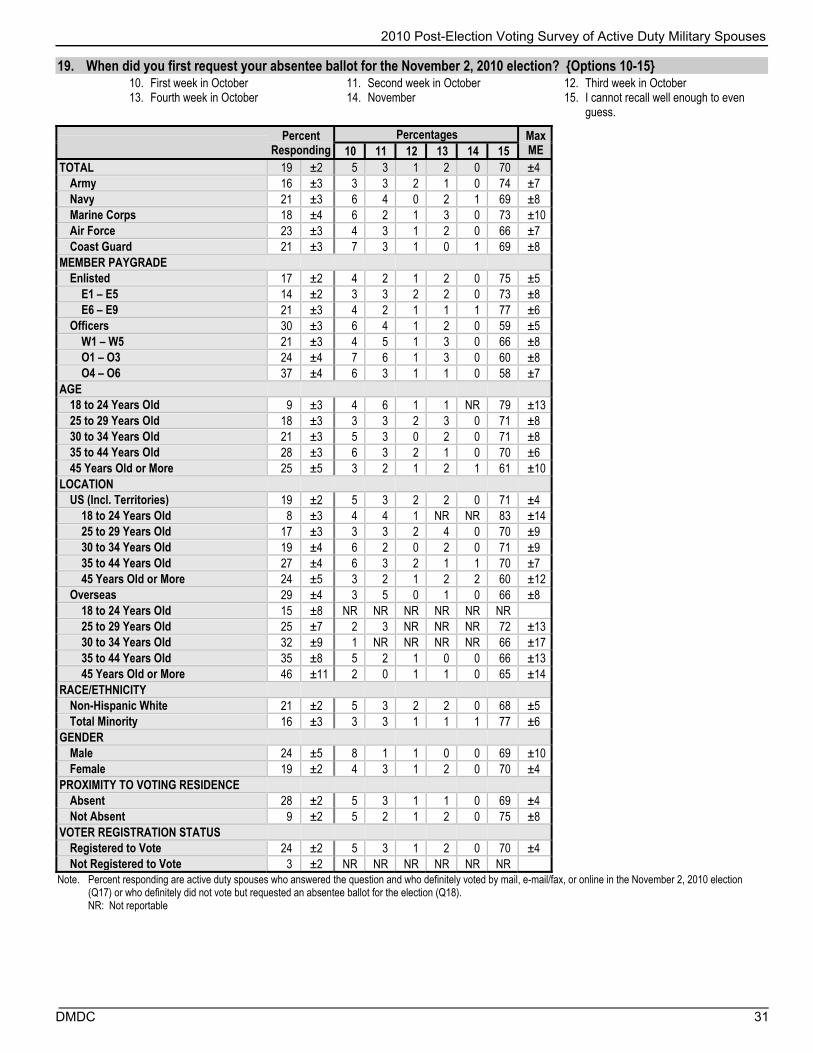
19. When did you first request your absentee ballot for the November 2, 2010 election? {Options 10-15}
10. First week in October 11. Second week in October 12. Third week in October 13. Fourth week in October 14. November 15. I cannot recall well enough to even
guess.
Percent Responding
Percentages Max ME 10 11 12 13 14 15
TOTAL 19 ±2 5 3 1 2 0 70 ±4 Army 16 ±3 3 3 2 1 0 74 ±7 Navy 21 ±3 6 4 0 2 1 69 ±8 Marine Corps 18 ±4 6 2 1 3 0 73 ±10 Air Force 23 ±3 4 3 1 2 0 66 ±7 Coast Guard 21 ±3 7 3 1 0 1 69 ±8
MEMBER PAYGRADE Enlisted 17 ±2 4 2 1 2 0 75 ±5
E1 – E5 14 ±2 3 3 2 2 0 73 ±8 E6 – E9 21 ±3 4 2 1 1 1 77 ±6
Officers 30 ±3 6 4 1 2 0 59 ±5 W1 – W5 21 ±3 4 5 1 3 0 66 ±8 O1 – O3 24 ±4 7 6 1 3 0 60 ±8 O4 – O6 37 ±4 6 3 1 1 0 58 ±7
AGE 18 to 24 Years Old 9 ±3 4 6 1 1 NR 79 ±13 25 to 29 Years Old 18 ±3 3 3 2 3 0 71 ±8 30 to 34 Years Old 21 ±3 5 3 0 2 0 71 ±8 35 to 44 Years Old 28 ±3 6 3 2 1 0 70 ±6 45 Years Old or More 25 ±5 3 2 1 2 1 61 ±10
LOCATION US (Incl. Territories) 19 ±2 5 3 2 2 0 71 ±4
18 to 24 Years Old 8 ±3 4 4 1 NR NR 83 ±14 25 to 29 Years Old 17 ±3 3 3 2 4 0 70 ±9 30 to 34 Years Old 19 ±4 6 2 0 2 0 71 ±9 35 to 44 Years Old 27 ±4 6 3 2 1 1 70 ±7 45 Years Old or More 24 ±5 3 2 1 2 2 60 ±12
Overseas 29 ±4 3 5 0 1 0 66 ±8 18 to 24 Years Old 15 ±8 NR NR NR NR NR NR 25 to 29 Years Old 25 ±7 2 3 NR NR NR 72 ±13 30 to 34 Years Old 32 ±9 1 NR NR NR NR 66 ±17 35 to 44 Years Old 35 ±8 5 2 1 0 0 66 ±13 45 Years Old or More 46 ±11 2 0 1 1 0 65 ±14
RACE/ETHNICITY Non-Hispanic White 21 ±2 5 3 2 2 0 68 ±5 Total Minority 16 ±3 3 3 1 1 1 77 ±6
GENDER Male 24 ±5 8 1 1 0 0 69 ±10 Female 19 ±2 4 3 1 2 0 70 ±4
PROXIMITY TO VOTING RESIDENCE Absent 28 ±2 5 3 1 1 0 69 ±4 Not Absent 9 ±2 5 2 1 2 0 75 ±8
VOTER REGISTRATION STATUS Registered to Vote 24 ±2 5 3 1 2 0 70 ±4 Not Registered to Vote 3 ±2 NR NR NR NR NR NR
Note. Percent responding are active duty spouses who answered the question and who definitely voted by mail, e-mail/fax, or online in the November 2, 2010 election (Q17) or who definitely did not vote but requested an absentee ballot for the election (Q18). NR: Not reportable

2010 Post-Election Voting Survey of Active Duty Military Spouses
32 DMDC
20. Did you use the Federal Post Card Application (FPCA) to request your absentee ballot for the November 2, 2010 election?
Percent
Responding Percentages Max
ME Percentage
Reporting Yes Yes TOTAL 19 ±2 27 ±4
Army 16 ±3 30 ±7 Navy 21 ±3 25 ±8 Marine Corps 18 ±4 27 ±10 Air Force 24 ±3 27 ±7 Coast Guard 21 ±3 24 ±8
MEMBER PAYGRADE Enlisted 17 ±2 30 ±5
E1 – E5 13 ±2 23 ±7 E6 – E9 21 ±3 36 ±7
Officers 30 ±3 22 ±4 W1 – W5 21 ±3 36 ±8 O1 – O3 23 ±4 20 ±7 O4 – O6 37 ±4 22 ±6
AGE 18 to 24 Years Old 9 ±3 18 ±14 25 to 29 Years Old 17 ±3 30 ±9 30 to 34 Years Old 21 ±4 33 ±9 35 to 44 Years Old 28 ±3 26 ±6 45 Years Old or More 25 ±5 22 ±9
LOCATION US (Incl. Territories) 19 ±2 26 ±4
18 to 24 Years Old 8 ±3 19 ±16 25 to 29 Years Old 16 ±3 30 ±10 30 to 34 Years Old 20 ±4 29 ±10 35 to 44 Years Old 27 ±4 23 ±6 45 Years Old or More 24 ±5 22 ±10
Overseas 29 ±4 38 ±8 18 to 24 Years Old 15 ±8 NR 25 to 29 Years Old 24 ±7 29 ±15 30 to 34 Years Old 32 ±9 57 ±16 35 to 44 Years Old 35 ±8 42 ±14 45 Years Old or More 46 ±11 23 ±10
RACE/ETHNICITY Non-Hispanic White 21 ±2 24 ±5 Total Minority 16 ±3 37 ±8
GENDER Male 24 ±5 31 ±11 Female 19 ±2 27 ±4
PROXIMITY TO VOTING RESIDENCE Absent 28 ±2 29 ±4 Not Absent 9 ±2 22 ±9
VOTER REGISTRATION STATUS Registered to Vote 23 ±2 27 ±4 Not Registered to Vote 3 ±2 NR
Note. Percent responding are active duty spouses who answered the question and who definitely voted by mail, e-mail/fax, or online in the November 2, 2010 election (Q17) or who definitely did not vote but requested an absentee ballot for the election (Q18). The FPCA (Standard Form 76) is a request for registration and a regular (as opposed to back-up) absentee ballot. NR: Not reportable
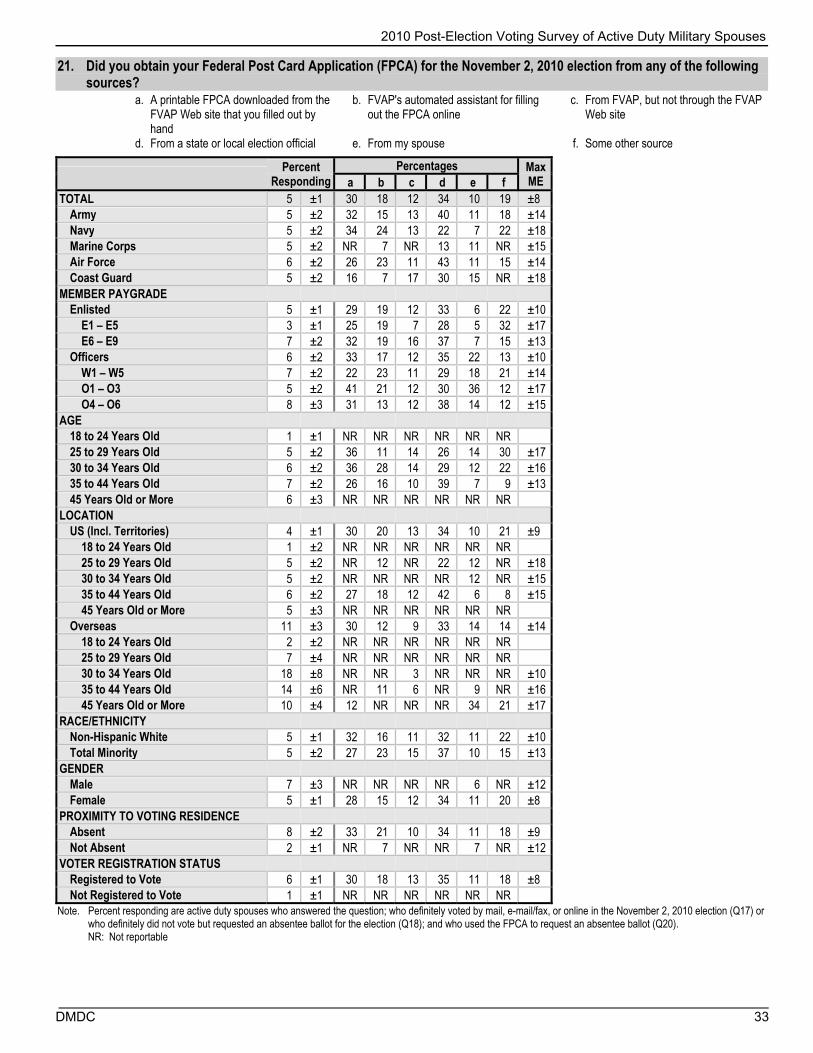
2010 Post-Election Voting Survey of Active Duty Military Spouses
DMDC 33
21. Did you obtain your Federal Post Card Application (FPCA) for the November 2, 2010 election from any of the following sources?
a. A printable FPCA downloaded from the FVAP Web site that you filled out by hand
b. FVAP's automated assistant for filling out the FPCA online
c. From FVAP, but not through the FVAP Web site
d. From a state or local election official e. From my spouse f. Some other source
Percent Responding
Percentages Max ME a b c d e f
TOTAL 5 ±1 30 18 12 34 10 19 ±8 Army 5 ±2 32 15 13 40 11 18 ±14 Navy 5 ±2 34 24 13 22 7 22 ±18 Marine Corps 5 ±2 NR 7 NR 13 11 NR ±15 Air Force 6 ±2 26 23 11 43 11 15 ±14 Coast Guard 5 ±2 16 7 17 30 15 NR ±18
MEMBER PAYGRADE Enlisted 5 ±1 29 19 12 33 6 22 ±10
E1 – E5 3 ±1 25 19 7 28 5 32 ±17 E6 – E9 7 ±2 32 19 16 37 7 15 ±13
Officers 6 ±2 33 17 12 35 22 13 ±10 W1 – W5 7 ±2 22 23 11 29 18 21 ±14 O1 – O3 5 ±2 41 21 12 30 36 12 ±17 O4 – O6 8 ±3 31 13 12 38 14 12 ±15
AGE 18 to 24 Years Old 1 ±1 NR NR NR NR NR NR 25 to 29 Years Old 5 ±2 36 11 14 26 14 30 ±17 30 to 34 Years Old 6 ±2 36 28 14 29 12 22 ±16 35 to 44 Years Old 7 ±2 26 16 10 39 7 9 ±13 45 Years Old or More 6 ±3 NR NR NR NR NR NR
LOCATION US (Incl. Territories) 4 ±1 30 20 13 34 10 21 ±9
18 to 24 Years Old 1 ±2 NR NR NR NR NR NR 25 to 29 Years Old 5 ±2 NR 12 NR 22 12 NR ±18 30 to 34 Years Old 5 ±2 NR NR NR NR 12 NR ±15 35 to 44 Years Old 6 ±2 27 18 12 42 6 8 ±15 45 Years Old or More 5 ±3 NR NR NR NR NR NR
Overseas 11 ±3 30 12 9 33 14 14 ±14 18 to 24 Years Old 2 ±2 NR NR NR NR NR NR 25 to 29 Years Old 7 ±4 NR NR NR NR NR NR 30 to 34 Years Old 18 ±8 NR NR 3 NR NR NR ±10 35 to 44 Years Old 14 ±6 NR 11 6 NR 9 NR ±16 45 Years Old or More 10 ±4 12 NR NR NR 34 21 ±17
RACE/ETHNICITY Non-Hispanic White 5 ±1 32 16 11 32 11 22 ±10 Total Minority 5 ±2 27 23 15 37 10 15 ±13
GENDER Male 7 ±3 NR NR NR NR 6 NR ±12 Female 5 ±1 28 15 12 34 11 20 ±8
PROXIMITY TO VOTING RESIDENCE Absent 8 ±2 33 21 10 34 11 18 ±9 Not Absent 2 ±1 NR 7 NR NR 7 NR ±12
VOTER REGISTRATION STATUS Registered to Vote 6 ±1 30 18 13 35 11 18 ±8 Not Registered to Vote 1 ±1 NR NR NR NR NR NR
Note. Percent responding are active duty spouses who answered the question; who definitely voted by mail, e-mail/fax, or online in the November 2, 2010 election (Q17) or who definitely did not vote but requested an absentee ballot for the election (Q18); and who used the FPCA to request an absentee ballot (Q20). NR: Not reportable

2010 Post-Election Voting Survey of Active Duty Military Spouses
34 DMDC
22. Did you receive notification from a local election official that your Federal Post Card Application (FPCA) had been... a. Received?
1. Yes 2. No 3. Do not recall
Percent
Responding Percentages Max
ME Percentage Reporting Yes
1 2 3 TOTAL 5 ±1 33 28 38 ±8 54.0 ±10.0
Army 5 ±2 33 33 34 ±14 NR Navy 5 ±2 29 26 NR ±18 NR Marine Corps 5 ±2 NR NR NR NR Air Force 6 ±2 41 28 32 ±14 60.0 ±17.0 Coast Guard 5 ±2 23 28 NR ±17 NR
MEMBER PAYGRADE Enlisted 5 ±1 34 29 37 ±10 54.0 ±13.0
E1 – E5 3 ±1 40 27 33 ±17 NR E6 – E9 7 ±2 30 30 40 ±13 NR
Officers 6 ±2 32 26 41 ±10 55.0 ±12.0 W1 – W5 7 ±2 40 33 27 ±14 55.0 ±16.0 O1 – O3 4 ±2 25 24 NR ±17 NR O4 – O6 8 ±3 35 26 39 ±15 NR
AGE 18 to 24 Years Old 1 ±1 NR NR NR NR 25 to 29 Years Old 5 ±2 36 25 39 ±17 NR 30 to 34 Years Old 6 ±2 30 25 45 ±16 NR 35 to 44 Years Old 7 ±2 34 31 35 ±13 52.0 ±15.0 45 Years Old or More 6 ±3 NR 21 NR ±15 NR
LOCATION US (Incl. Territories) 4 ±1 33 26 41 ±9 56.0 ±12.0
18 to 24 Years Old 1 ±2 NR NR NR NR 25 to 29 Years Old 5 ±2 NR 23 NR ±18 NR 30 to 34 Years Old 5 ±2 NR 17 NR ±17 NR 35 to 44 Years Old 6 ±2 31 30 39 ±15 NR 45 Years Old or More 5 ±3 NR 22 NR ±18 NR
Overseas 10 ±3 35 37 28 ±14 NR 18 to 24 Years Old 2 ±2 NR NR NR NR 25 to 29 Years Old 7 ±4 NR NR NR NR 30 to 34 Years Old 18 ±8 20 NR NR ±18 NR 35 to 44 Years Old 12 ±6 NR NR NR NR 45 Years Old or More 10 ±4 NR 18 34 ±17 NR
RACE/ETHNICITY Non-Hispanic White 5 ±1 34 27 39 ±10 56.0 ±13.0 Total Minority 5 ±2 33 30 37 ±13 52.0 ±15.0
GENDER Male 7 ±3 NR NR NR NR Female 5 ±1 33 27 41 ±9 55.0 ±11.0
PROXIMITY TO VOTING RESIDENCE Absent 8 ±2 36 29 35 ±9 56.0 ±11.0 Not Absent 2 ±1 NR NR NR NR
VOTER REGISTRATION STATUS Registered to Vote 6 ±1 35 28 38 ±8 56.0 ±10.0 Not Registered to Vote 1 ±1 1 NR NR ±4 NR
Note. Percent responding are active duty spouses who answered the question; who definitely voted by mail, e-mail/fax, or online in the November 2, 2010 election (Q17) or who definitely did not vote but requested an absentee ballot for the election (Q18); and who used the FPCA to request an absentee ballot (Q20). Those who indicated they do not recall are not are not included in "Percentage Reporting Yes." NR: Not reportable

2010 Post-Election Voting Survey of Active Duty Military Spouses
DMDC 35
22. Did you receive notification from a local election official that your Federal Post Card Application (FPCA) had been... b. Rejected?
1. Yes 2. No 3. Do not recall
Percent
Responding Percentages Max
ME Percentage Reporting Yes
1 2 3 TOTAL 5 ±1 3 61 37 ±8 4.0 ±7.0
Army 4 ±2 NR 68 29 ±15 NR Navy 5 ±2 3 NR NR ±7 5.0 ±12.0 Marine Corps 4 ±2 NR NR NR NR Air Force 6 ±2 NR 64 33 ±14 NR Coast Guard 4 ±2 NR NR NR NR
MEMBER PAYGRADE Enlisted 4 ±1 2 61 37 ±10 4.0 ±11.0
E1 – E5 3 ±1 NR 63 37 ±18 NR E6 – E9 7 ±2 4 60 36 ±13 NR
Officers 6 ±2 3 59 38 ±11 4.0 ±8.0 W1 – W5 7 ±2 6 71 23 ±15 NR O1 – O3 4 ±2 NR NR NR NR O4 – O6 7 ±2 0 61 39 ±16 0.0 ±2.0
AGE 18 to 24 Years Old 1 ±1 NR NR NR NR 25 to 29 Years Old 5 ±2 NR NR NR NR 30 to 34 Years Old 6 ±2 6 57 37 ±16 NR 35 to 44 Years Old 6 ±2 NR 65 33 ±13 NR 45 Years Old or More 4 ±2 1 NR NR ±3 1.0 ±5.0
LOCATION US (Incl. Territories) 4 ±1 3 58 39 ±10 5.0 ±9.0
18 to 24 Years Old 1 ±1 NR NR NR NR 25 to 29 Years Old 5 ±2 NR NR NR NR 30 to 34 Years Old 5 ±2 NR NR NR NR 35 to 44 Years Old 5 ±2 NR 62 35 ±16 NR 45 Years Old or More 4 ±2 1 NR NR ±4 2.0 ±6.0
Overseas 9 ±3 NR 72 28 ±13 NR 18 to 24 Years Old 2 ±2 NR NR NR NR 25 to 29 Years Old 7 ±4 NR NR NR NR 30 to 34 Years Old 17 ±8 NR NR NR NR 35 to 44 Years Old 11 ±5 NR NR NR NR 45 Years Old or More 7 ±3 NR NR NR NR
RACE/ETHNICITY Non-Hispanic White 5 ±1 2 60 38 ±10 3.0 ±9.0 Total Minority 5 ±2 4 61 35 ±14 NR
GENDER Male 6 ±3 NR NR NR NR Female 4 ±1 2 58 40 ±9 3.0 ±8.0
PROXIMITY TO VOTING RESIDENCE Absent 7 ±2 3 63 34 ±9 4.0 ±8.0 Not Absent 2 ±1 2 NR NR ±8 NR
VOTER REGISTRATION STATUS Registered to Vote 6 ±1 3 61 36 ±8 4.0 ±7.0 Not Registered to Vote 1 ±1 1 NR NR ±4 NR
Note. Percent responding are active duty spouses who answered the question; who definitely voted by mail, e-mail/fax, or online in the November 2, 2010 election (Q17) or who definitely did not vote but requested an absentee ballot for the election (Q18); and who used the FPCA to request an absentee ballot (Q20). Those who indicated they do not recall are not are not included in "Percentage Reporting Yes." NR: Not reportable

2010 Post-Election Voting Survey of Active Duty Military Spouses
36 DMDC
22. Did you receive notification from a local election official that your Federal Post Card Application (FPCA) had been... c. Accepted?
1. Yes 2. No 3. Do not recall
Percent
Responding Percentages Max
ME Percentage Reporting Yes
1 2 3 TOTAL 5 ±1 27 33 40 ±8 44.0 ±10.0
Army 4 ±2 34 40 26 ±15 NR Navy 5 ±2 16 29 NR ±17 NR Marine Corps 5 ±2 17 NR NR ±15 NR Air Force 6 ±2 31 30 39 ±15 NR Coast Guard 4 ±2 10 NR NR ±11 NR
MEMBER PAYGRADE Enlisted 5 ±1 26 35 39 ±10 42.0 ±13.0
E1 – E5 3 ±1 25 37 NR ±17 NR E6 – E9 7 ±2 26 34 39 ±13 44.0 ±16.0
Officers 6 ±2 29 28 43 ±11 50.0 ±12.0 W1 – W5 7 ±2 40 33 27 ±14 55.0 ±16.0 O1 – O3 4 ±2 22 24 NR ±17 NR O4 – O6 7 ±2 30 30 41 ±15 NR
AGE 18 to 24 Years Old 1 ±1 NR NR NR NR 25 to 29 Years Old 5 ±2 13 36 NR ±17 NR 30 to 34 Years Old 6 ±2 33 30 37 ±16 NR 35 to 44 Years Old 6 ±2 32 32 37 ±13 50.0 ±15.0 45 Years Old or More 5 ±2 NR 23 NR ±17 NR
LOCATION US (Incl. Territories) 4 ±1 28 31 41 ±9 47.0 ±12.0
18 to 24 Years Old 1 ±1 NR NR NR NR 25 to 29 Years Old 5 ±2 NR NR NR NR 30 to 34 Years Old 5 ±2 NR NR NR NR 35 to 44 Years Old 5 ±2 33 31 36 ±16 NR 45 Years Old or More 4 ±3 NR NR NR NR
Overseas 10 ±3 23 41 36 ±14 37.0 ±16.0 18 to 24 Years Old 2 ±2 NR NR NR NR 25 to 29 Years Old 7 ±4 NR NR NR NR 30 to 34 Years Old 17 ±8 NR NR NR NR 35 to 44 Years Old 13 ±6 NR NR NR NR 45 Years Old or More 8 ±4 NR NR 36 ±18 NR
RACE/ETHNICITY Non-Hispanic White 5 ±1 26 29 45 ±10 46.0 ±13.0 Total Minority 5 ±2 28 40 32 ±13 41.0 ±16.0
GENDER Male 7 ±3 NR NR NR NR Female 5 ±1 23 32 44 ±9 42.0 ±12.0
PROXIMITY TO VOTING RESIDENCE Absent 7 ±2 28 34 38 ±9 46.0 ±11.0 Not Absent 2 ±1 NR NR NR NR
VOTER REGISTRATION STATUS Registered to Vote 6 ±1 28 33 40 ±8 46.0 ±10.0 Not Registered to Vote 1 ±1 NR NR NR NR
Note. Percent responding are active duty spouses who answered the question; who definitely voted by mail, e-mail/fax, or online in the November 2, 2010 election (Q17) or who definitely did not vote but requested an absentee ballot for the election (Q18); and who used the FPCA to request an absentee ballot (Q20). Those who indicated they do not recall are not are not included in "Percentage Reporting Yes." NR: Not reportable

2010 Post-Election Voting Survey of Active Duty Military Spouses
DMDC 37
23. Did you receive your regular absentee ballot for the November 2, 2010 election?
1. Yes 2. No 3. Do not recall
Percent
Responding Percentages Max
ME Percentage Reporting Yes
1 2 3 TOTAL 20 ±2 73 19 8 ±4 80.0 ±4.0
Army 16 ±3 69 24 6 ±8 74.0 ±8.0 Navy 21 ±3 75 18 6 ±8 80.0 ±8.0 Marine Corps 19 ±4 68 20 11 ±11 77.0 ±11.0 Air Force 24 ±3 77 13 10 ±7 86.0 ±6.0 Coast Guard 21 ±3 80 13 7 ±8 86.0 ±8.0
MEMBER PAYGRADE Enlisted 17 ±2 69 21 10 ±5 76.0 ±6.0
E1 – E5 13 ±2 67 23 10 ±8 74.0 ±8.0 E6 – E9 21 ±3 70 20 10 ±7 78.0 ±7.0
Officers 30 ±3 83 13 3 ±4 86.0 ±4.0 W1 – W5 22 ±3 77 17 6 ±7 82.0 ±7.0 O1 – O3 24 ±4 79 16 5 ±8 83.0 ±8.0 O4 – O6 37 ±4 86 11 2 ±5 88.0 ±5.0
AGE 18 to 24 Years Old 8 ±3 47 37 16 ±16 NR 25 to 29 Years Old 18 ±3 71 20 10 ±9 78.0 ±9.0 30 to 34 Years Old 21 ±4 73 18 9 ±9 80.0 ±8.0 35 to 44 Years Old 28 ±3 78 16 6 ±6 83.0 ±6.0 45 Years Old or More 25 ±5 88 10 2 ±7 89.0 ±7.0
LOCATION US (Incl. Territories) 19 ±2 74 18 7 ±4 80.0 ±4.0
18 to 24 Years Old 8 ±3 NR NR 13 ±14 NR 25 to 29 Years Old 17 ±3 72 20 8 ±10 79.0 ±10.0 30 to 34 Years Old 20 ±4 74 16 9 ±9 82.0 ±9.0 35 to 44 Years Old 27 ±4 79 16 5 ±7 83.0 ±7.0 45 Years Old or More 24 ±5 89 10 2 ±8 90.0 ±8.0
Overseas 29 ±4 66 22 12 ±8 75.0 ±8.0 18 to 24 Years Old 15 ±8 NR NR NR NR 25 to 29 Years Old 24 ±7 59 22 19 ±15 72.0 ±17.0 30 to 34 Years Old 32 ±9 NR NR 4 ±8 NR 35 to 44 Years Old 35 ±8 73 17 10 ±13 81.0 ±12.0 45 Years Old or More 45 ±11 83 15 2 ±11 84.0 ±11.0
RACE/ETHNICITY Non-Hispanic White 21 ±2 77 17 6 ±5 82.0 ±5.0 Total Minority 16 ±3 65 23 12 ±8 74.0 ±8.0
GENDER Male 24 ±5 71 20 9 ±11 79.0 ±11.0 Female 19 ±2 74 19 8 ±4 80.0 ±4.0
PROXIMITY TO VOTING RESIDENCE Absent 28 ±2 72 20 8 ±5 78.0 ±5.0 Not Absent 9 ±2 78 14 8 ±9 84.0 ±9.0
VOTER REGISTRATION STATUS Registered to Vote 24 ±2 75 17 7 ±4 81.0 ±4.0 Not Registered to Vote 3 ±2 NR NR NR NR
Note. Percent responding are active duty spouses who answered the question and who definitely voted by mail, e-mail/fax, or online in the November 2, 2010 election (Q17) or who definitely did not vote but requested an absentee ballot for the election (Q18). Respondents who indicated they did not recall are excluded from the bar chart. NR: Not reportable
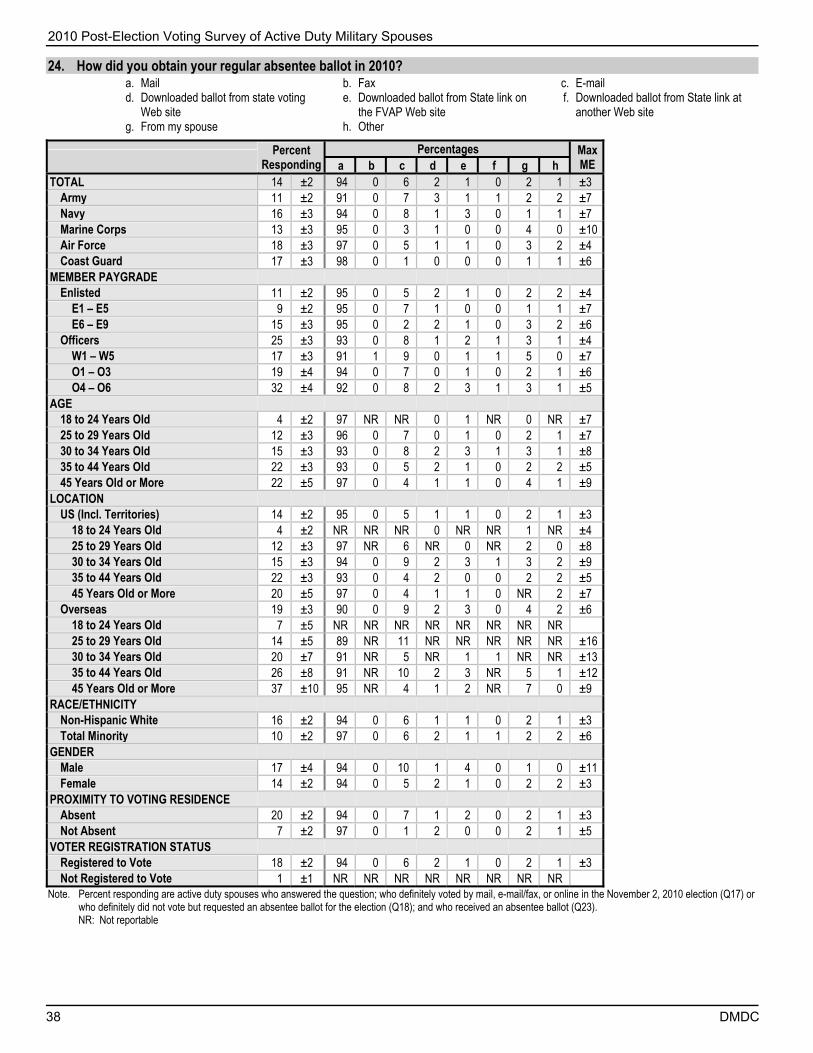
2010 Post-Election Voting Survey of Active Duty Military Spouses
38 DMDC
24. How did you obtain your regular absentee ballot in 2010?
a. Mail b. Fax c. E-mail d. Downloaded ballot from state voting
Web site e. Downloaded ballot from State link on
the FVAP Web site f. Downloaded ballot from State link at
another Web site g. From my spouse h. Other
Percent
Responding Percentages Max
ME a b c d e f g h TOTAL 14 ±2 94 0 6 2 1 0 2 1 ±3
Army 11 ±2 91 0 7 3 1 1 2 2 ±7 Navy 16 ±3 94 0 8 1 3 0 1 1 ±7 Marine Corps 13 ±3 95 0 3 1 0 0 4 0 ±10 Air Force 18 ±3 97 0 5 1 1 0 3 2 ±4 Coast Guard 17 ±3 98 0 1 0 0 0 1 1 ±6
MEMBER PAYGRADE Enlisted 11 ±2 95 0 5 2 1 0 2 2 ±4
E1 – E5 9 ±2 95 0 7 1 0 0 1 1 ±7 E6 – E9 15 ±3 95 0 2 2 1 0 3 2 ±6
Officers 25 ±3 93 0 8 1 2 1 3 1 ±4 W1 – W5 17 ±3 91 1 9 0 1 1 5 0 ±7 O1 – O3 19 ±4 94 0 7 0 1 0 2 1 ±6 O4 – O6 32 ±4 92 0 8 2 3 1 3 1 ±5
AGE 18 to 24 Years Old 4 ±2 97 NR NR 0 1 NR 0 NR ±7 25 to 29 Years Old 12 ±3 96 0 7 0 1 0 2 1 ±7 30 to 34 Years Old 15 ±3 93 0 8 2 3 1 3 1 ±8 35 to 44 Years Old 22 ±3 93 0 5 2 1 0 2 2 ±5 45 Years Old or More 22 ±5 97 0 4 1 1 0 4 1 ±9
LOCATION US (Incl. Territories) 14 ±2 95 0 5 1 1 0 2 1 ±3
18 to 24 Years Old 4 ±2 NR NR NR 0 NR NR 1 NR ±4 25 to 29 Years Old 12 ±3 97 NR 6 NR 0 NR 2 0 ±8 30 to 34 Years Old 15 ±3 94 0 9 2 3 1 3 2 ±9 35 to 44 Years Old 22 ±3 93 0 4 2 0 0 2 2 ±5 45 Years Old or More 20 ±5 97 0 4 1 1 0 NR 2 ±7
Overseas 19 ±3 90 0 9 2 3 0 4 2 ±6 18 to 24 Years Old 7 ±5 NR NR NR NR NR NR NR NR 25 to 29 Years Old 14 ±5 89 NR 11 NR NR NR NR NR ±16 30 to 34 Years Old 20 ±7 91 NR 5 NR 1 1 NR NR ±13 35 to 44 Years Old 26 ±8 91 NR 10 2 3 NR 5 1 ±12 45 Years Old or More 37 ±10 95 NR 4 1 2 NR 7 0 ±9
RACE/ETHNICITY Non-Hispanic White 16 ±2 94 0 6 1 1 0 2 1 ±3 Total Minority 10 ±2 97 0 6 2 1 1 2 2 ±6
GENDER Male 17 ±4 94 0 10 1 4 0 1 0 ±11 Female 14 ±2 94 0 5 2 1 0 2 2 ±3
PROXIMITY TO VOTING RESIDENCE Absent 20 ±2 94 0 7 1 2 0 2 1 ±3 Not Absent 7 ±2 97 0 1 2 0 0 2 1 ±5
VOTER REGISTRATION STATUS Registered to Vote 18 ±2 94 0 6 2 1 0 2 1 ±3 Not Registered to Vote 1 ±1 NR NR NR NR NR NR NR NR
Note. Percent responding are active duty spouses who answered the question; who definitely voted by mail, e-mail/fax, or online in the November 2, 2010 election (Q17) or who definitely did not vote but requested an absentee ballot for the election (Q18); and who received an absentee ballot (Q23). NR: Not reportable

2010 Post-Election Voting Survey of Active Duty Military Spouses
DMDC 39
25. When did you receive your regular absentee ballot for the November 2, 2010 election?
1. September or earlier 2. First week in October 3. Second week in October 4. Third week in October 5. Fourth week in October 6. November 7. I cannot recall well enough to even
guess
Percent
Responding Percentages Max
ME 1 2 3 4 5 6 7 TOTAL 14 ±2 12 16 6 4 6 1 56 ±5
Army 11 ±2 12 12 6 5 5 1 58 ±9 Navy 16 ±3 11 18 7 5 3 1 56 ±9 Marine Corps 13 ±3 16 16 8 1 6 0 54 ±13 Air Force 18 ±3 13 19 4 2 8 0 54 ±8 Coast Guard 17 ±3 10 15 13 8 5 0 49 ±9
MEMBER PAYGRADE Enlisted 11 ±2 11 15 5 3 6 1 60 ±7
E1 – E5 9 ±2 12 16 5 3 7 1 56 ±10 E6 – E9 15 ±3 9 13 5 3 5 1 64 ±8
Officers 25 ±3 15 18 9 5 6 0 48 ±6 W1 – W5 16 ±3 12 10 10 3 6 3 57 ±9 O1 – O3 19 ±4 16 17 12 6 6 0 43 ±9 O4 – O6 32 ±4 14 19 8 4 5 0 49 ±7
AGE 18 to 24 Years Old 4 ±2 NR NR 3 NR 6 1 NR ±11 25 to 29 Years Old 12 ±3 12 13 6 5 8 2 53 ±10 30 to 34 Years Old 15 ±3 8 13 8 5 3 0 63 ±10 35 to 44 Years Old 22 ±3 13 19 5 3 6 1 52 ±7 45 Years Old or More 22 ±5 16 18 8 1 4 0 52 ±11
LOCATION US (Incl. Territories) 14 ±2 11 16 6 4 6 1 57 ±5
18 to 24 Years Old 4 ±2 NR NR NR NR NR NR NR 25 to 29 Years Old 12 ±3 12 13 5 5 8 NR 55 ±11 30 to 34 Years Old 14 ±3 7 12 8 6 3 0 64 ±11 35 to 44 Years Old 21 ±3 12 19 5 4 6 1 53 ±8 45 Years Old or More 20 ±5 14 19 9 1 4 0 53 ±12
Overseas 19 ±3 18 16 9 2 5 2 49 ±11 18 to 24 Years Old 7 ±5 NR NR NR NR NR NR NR 25 to 29 Years Old 14 ±5 8 NR 15 NR 7 4 42 ±17 30 to 34 Years Old 20 ±7 19 14 NR NR 0 1 NR ±17 35 to 44 Years Old 26 ±8 NR 17 7 NR 4 1 NR ±13 45 Years Old or More 37 ±10 25 16 3 2 3 0 49 ±16
RACE/ETHNICITY Non-Hispanic White 16 ±2 12 18 8 3 6 1 52 ±6 Total Minority 10 ±2 12 10 2 4 4 1 65 ±9
GENDER Male 17 ±4 20 9 8 3 6 0 54 ±12 Female 14 ±2 11 17 6 4 6 1 56 ±5
PROXIMITY TO VOTING RESIDENCE Absent 20 ±2 13 15 6 4 5 1 56 ±5 Not Absent 7 ±2 10 21 7 3 6 0 53 ±11
VOTER REGISTRATION STATUS Registered to Vote 17 ±2 12 16 6 4 6 1 55 ±5 Not Registered to Vote 1 ±1 NR NR NR NR 0 NR NR ±4
Note. Percent responding are active duty spouses who answered the question; who definitely voted by mail, e-mail/fax, or online in the November 2, 2010 election (Q17) or who definitely did not vote but requested an absentee ballot for the election (Q18); and who received an absentee ballot (Q23). NR: Not reportable

2010 Post-Election Voting Survey of Active Duty Military Spouses
40 DMDC
26. Did you complete and return your regular absentee ballot for the November 2, 2010 election?
Percent
Responding Percentages Max
ME Percentage
Reporting Yes Yes TOTAL 14 ±2 90 ±3
Army 11 ±2 89 ±7 Navy 15 ±3 91 ±7 Marine Corps 13 ±3 82 ±13 Air Force 18 ±3 92 ±5 Coast Guard 17 ±3 87 ±9
MEMBER PAYGRADE Enlisted 11 ±2 88 ±5
E1 – E5 9 ±2 85 ±8 E6 – E9 15 ±3 91 ±6
Officers 25 ±3 92 ±3 W1 – W5 16 ±3 89 ±7 O1 – O3 19 ±4 92 ±6 O4 – O6 32 ±4 93 ±5
AGE 18 to 24 Years Old 4 ±2 NR 25 to 29 Years Old 12 ±3 88 ±8 30 to 34 Years Old 15 ±3 88 ±8 35 to 44 Years Old 22 ±3 92 ±4 45 Years Old or More 21 ±5 96 ±7
LOCATION US (Incl. Territories) 14 ±2 91 ±4
18 to 24 Years Old 4 ±2 NR 25 to 29 Years Old 12 ±3 89 ±9 30 to 34 Years Old 14 ±3 89 ±10 35 to 44 Years Old 22 ±3 93 ±5 45 Years Old or More 20 ±5 96 ±9
Overseas 19 ±3 82 ±7 18 to 24 Years Old 7 ±5 NR 25 to 29 Years Old 14 ±5 79 ±16 30 to 34 Years Old 20 ±7 NR 35 to 44 Years Old 26 ±8 89 ±12 45 Years Old or More 37 ±10 93 ±5
RACE/ETHNICITY Non-Hispanic White 16 ±2 90 ±4 Total Minority 10 ±2 89 ±7
GENDER Male 17 ±4 88 ±11 Female 14 ±2 90 ±4
PROXIMITY TO VOTING RESIDENCE Absent 20 ±2 91 ±4 Not Absent 7 ±2 87 ±9
VOTER REGISTRATION STATUS Registered to Vote 18 ±2 90 ±3 Not Registered to Vote 1 ±1 NR
Note. Percent responding are active duty spouses who answered the question; who definitely voted by mail, e-mail/fax, or online in the November 2, 2010 election (Q17) or who definitely did not vote but requested an absentee ballot for the election (Q18); and who received an absentee ballot (Q23). NR: Not reportable

2010 Post-Election Voting Survey of Active Duty Military Spouses
DMDC 41
27. When did you complete and return your regular absentee ballot for the November 2, 2010 election?
1. September or earlier 2. First week in October 3. Second week in October 4. Third week in October 5. Fourth week in October 6. November 7. I cannot recall well enough to even
guess
Percent
Responding Percentages Max
ME 1 2 3 4 5 6 7 TOTAL 13 ±2 4 9 12 6 19 5 45 ±5
Army 10 ±2 3 7 12 6 17 4 51 ±10 Navy 14 ±3 3 8 10 9 20 4 47 ±10 Marine Corps 10 ±3 2 9 13 3 28 9 36 ±16 Air Force 17 ±3 6 10 14 5 16 7 42 ±8 Coast Guard 14 ±3 1 10 12 9 23 7 38 ±9
MEMBER PAYGRADE Enlisted 10 ±2 3 7 11 6 19 4 51 ±7
E1 – E5 7 ±2 3 11 12 3 19 5 46 ±11 E6 – E9 14 ±3 2 4 9 8 19 3 54 ±9
Officers 22 ±3 5 11 15 7 19 7 37 ±6 W1 – W5 15 ±3 3 9 13 10 13 6 48 ±9 O1 – O3 17 ±3 5 11 13 6 23 5 36 ±10 O4 – O6 30 ±4 5 11 16 7 17 8 35 ±8
AGE 18 to 24 Years Old 3 ±2 NR NR NR NR NR NR NR 25 to 29 Years Old 11 ±3 4 9 6 3 21 8 48 ±11 30 to 34 Years Old 13 ±3 4 4 14 8 15 6 49 ±10 35 to 44 Years Old 20 ±3 4 9 15 6 19 4 43 ±8 45 Years Old or More 20 ±4 3 13 12 10 19 4 38 ±11
LOCATION US (Incl. Territories) 12 ±2 3 8 12 6 19 5 46 ±6
18 to 24 Years Old 3 ±2 NR NR NR NR NR NR NR 25 to 29 Years Old 10 ±3 4 9 6 2 21 9 49 ±12 30 to 34 Years Old 13 ±3 4 3 13 8 16 6 50 ±11 35 to 44 Years Old 20 ±3 4 9 15 6 19 4 44 ±8 45 Years Old or More 19 ±5 3 12 12 11 20 4 39 ±13
Overseas 15 ±3 5 13 16 8 14 5 39 ±13 18 to 24 Years Old 2 ±3 NR NR NR NR NR NR NR 25 to 29 Years Old 11 ±5 NR 13 NR NR NR NR NR ±17 30 to 34 Years Old 15 ±6 NR NR 18 NR 7 NR NR ±17 35 to 44 Years Old 23 ±8 3 10 NR 6 15 7 NR ±15 45 Years Old or More 33 ±10 9 NR 12 6 NR 4 34 ±16
RACE/ETHNICITY Non-Hispanic White 15 ±2 3 8 14 7 20 6 42 ±6 Total Minority 9 ±2 5 9 8 4 15 4 55 ±10
GENDER Male 15 ±4 8 12 14 5 14 2 45 ±15 Female 12 ±2 3 8 12 6 19 6 45 ±5
PROXIMITY TO VOTING RESIDENCE Absent 18 ±2 4 9 14 6 15 5 47 ±6 Not Absent 6 ±2 4 7 6 8 32 8 37 ±12
VOTER REGISTRATION STATUS Registered to Vote 16 ±2 4 9 12 6 19 5 45 ±5 Not Registered to Vote 0 ±1 NR NR NR NR NR NR NR
Note. Percent responding are active duty spouses who answered the question; who definitely voted by mail, e-mail/fax, or online in the November 2, 2010 election (Q17) or who definitely did not vote but requested an absentee ballot for the election (Q18); and who received, completed, and returned an absentee ballot (Q23/26). NR: Not reportable

2010 Post-Election Voting Survey of Active Duty Military Spouses
42 DMDC
28. How satisfied or dissatisfied were you, in general, with the... a. Process of registering to vote?
1. Very dissatisfied 2. Dissatisfied 3. Neither satisfied nor dissatisfied 4. Satisfied 5. Very satisfied
Percent
Responding Percentages Max
ME Average Satisfaction
1 2 3 4 5 TOTAL 19 ±2 4 3 19 34 40 ±4 4.0 ±0.1
Army 16 ±3 4 4 19 32 40 ±8 4.0 ±0.2 Navy 21 ±3 3 4 18 31 45 ±8 4.1 ±0.2 Marine Corps 18 ±4 7 5 18 32 38 ±11 3.9 ±0.3 Air Force 23 ±3 3 1 20 40 35 ±7 4.0 ±0.2 Coast Guard 21 ±3 3 3 15 31 48 ±8 4.2 ±0.2
MEMBER PAYGRADE Enlisted 16 ±2 4 3 21 35 37 ±6 4.0 ±0.2
E1 – E5 13 ±2 5 3 21 40 30 ±8 3.9 ±0.2 E6 – E9 21 ±3 4 3 20 30 43 ±7 4.1 ±0.2
Officers 30 ±3 3 3 15 34 45 ±5 4.2 ±0.1 W1 – W5 21 ±3 5 4 21 34 36 ±8 3.9 ±0.2 O1 – O3 24 ±4 3 5 12 35 46 ±9 4.2 ±0.2 O4 – O6 37 ±4 3 1 16 33 46 ±7 4.2 ±0.2
AGE 18 to 24 Years Old 8 ±3 3 7 30 43 18 ±16 3.7 ±0.3 25 to 29 Years Old 17 ±3 7 3 20 36 34 ±9 3.9 ±0.2 30 to 34 Years Old 20 ±3 3 4 23 29 41 ±9 4.0 ±0.2 35 to 44 Years Old 28 ±3 3 2 14 35 45 ±7 4.2 ±0.2 45 Years Old or More 25 ±5 1 2 14 31 53 ±10 4.3 ±0.2
LOCATION US (Incl. Territories) 18 ±2 4 3 20 33 40 ±5 4.0 ±0.1
18 to 24 Years Old 8 ±3 NR NR 30 NR 19 ±18 3.7 ±0.4 25 to 29 Years Old 17 ±3 8 3 21 33 34 ±10 3.8 ±0.3 30 to 34 Years Old 19 ±4 2 3 24 27 43 ±10 4.0 ±0.2 35 to 44 Years Old 27 ±4 2 2 15 35 45 ±7 4.2 ±0.2 45 Years Old or More 24 ±5 0 0 15 31 54 ±12 4.4 ±0.2
Overseas 28 ±4 5 5 13 42 35 ±8 4.0 ±0.2 18 to 24 Years Old 15 ±8 NR NR NR NR NR NR 25 to 29 Years Old 23 ±7 0 3 11 55 31 ±15 4.1 ±0.2 30 to 34 Years Old 31 ±9 4 8 19 NR 28 ±15 3.8 ±0.3 35 to 44 Years Old 35 ±8 10 1 8 36 45 ±15 4.1 ±0.4 45 Years Old or More 44 ±11 5 12 11 28 44 ±16 3.9 ±0.4
RACE/ETHNICITY Non-Hispanic White 21 ±2 4 3 17 35 41 ±5 4.1 ±0.1 Total Minority 16 ±3 5 3 22 34 36 ±8 3.9 ±0.2
GENDER Male 24 ±5 6 1 23 36 34 ±11 3.9 ±0.3 Female 19 ±2 4 3 18 34 41 ±5 4.0 ±0.1
PROXIMITY TO VOTING RESIDENCE Absent 28 ±2 4 4 21 35 36 ±5 3.9 ±0.1 Not Absent 9 ±2 1 1 10 33 55 ±10 4.4 ±0.2
VOTER REGISTRATION STATUS Registered to Vote 23 ±2 3 3 19 35 41 ±4 4.1 ±0.1 Not Registered to Vote 3 ±2 NR NR NR NR NR NR
Note. Percent responding are active duty spouses who answered the question and who definitely voted by mail, e-mail/fax, or online in the November 2, 2010 election (Q17) or who definitely did not vote but requested an absentee ballot for the election (Q18). NR: Not reportable

2010 Post-Election Voting Survey of Active Duty Military Spouses
DMDC 43
28. How satisfied or dissatisfied were you, in general, with the... b. Process of requesting an absentee ballot?
1. Very dissatisfied 2. Dissatisfied 3. Neither satisfied nor dissatisfied 4. Satisfied 5. Very satisfied
Percent
Responding Percentages Max
ME Average Satisfaction
1 2 3 4 5 TOTAL 19 ±2 6 6 21 32 35 ±4 3.8 ±0.1
Army 16 ±3 6 8 23 28 35 ±8 3.8 ±0.2 Navy 21 ±3 5 5 21 32 38 ±9 3.9 ±0.2 Marine Corps 18 ±4 10 9 22 31 28 ±11 3.6 ±0.3 Air Force 23 ±3 5 3 19 39 34 ±7 3.9 ±0.2 Coast Guard 20 ±3 5 5 13 33 45 ±9 4.1 ±0.2
MEMBER PAYGRADE Enlisted 16 ±2 7 6 23 32 33 ±6 3.8 ±0.2
E1 – E5 13 ±2 7 5 26 32 30 ±8 3.7 ±0.2 E6 – E9 21 ±3 8 6 19 32 35 ±7 3.8 ±0.2
Officers 29 ±3 4 6 17 34 39 ±5 4.0 ±0.2 W1 – W5 21 ±3 7 5 20 35 33 ±8 3.8 ±0.2 O1 – O3 24 ±4 3 8 15 33 41 ±9 4.0 ±0.2 O4 – O6 37 ±4 4 5 18 35 39 ±7 4.0 ±0.2
AGE 18 to 24 Years Old 8 ±3 9 8 36 28 19 ±16 3.4 ±0.4 25 to 29 Years Old 17 ±3 7 5 22 34 32 ±9 3.8 ±0.2 30 to 34 Years Old 20 ±3 5 7 23 32 33 ±9 3.8 ±0.2 35 to 44 Years Old 28 ±3 6 6 17 33 39 ±7 3.9 ±0.2 45 Years Old or More 25 ±5 2 4 14 33 47 ±11 4.2 ±0.2
LOCATION US (Incl. Territories) 18 ±2 6 6 21 31 36 ±5 3.8 ±0.1
18 to 24 Years Old 8 ±3 NR 7 NR 25 20 ±17 3.4 ±0.4 25 to 29 Years Old 16 ±3 8 5 22 32 33 ±10 3.8 ±0.3 30 to 34 Years Old 19 ±4 5 7 24 30 34 ±10 3.8 ±0.3 35 to 44 Years Old 27 ±4 5 6 17 32 39 ±7 3.9 ±0.2 45 Years Old or More 24 ±5 1 3 14 35 47 ±12 4.2 ±0.2
Overseas 28 ±4 7 6 18 39 30 ±8 3.8 ±0.2 18 to 24 Years Old 15 ±8 NR NR NR NR NR NR 25 to 29 Years Old 24 ±7 3 3 19 49 26 ±14 3.9 ±0.3 30 to 34 Years Old 31 ±9 4 10 18 NR 23 ±14 3.7 ±0.3 35 to 44 Years Old 34 ±8 12 3 18 31 36 ±17 3.8 ±0.4 45 Years Old or More 42 ±11 7 8 13 25 46 ±13 4.0 ±0.4
RACE/ETHNICITY Non-Hispanic White 21 ±2 6 7 21 30 36 ±5 3.8 ±0.2 Total Minority 15 ±3 6 4 21 37 31 ±8 3.8 ±0.2
GENDER Male 24 ±5 6 5 29 32 29 ±11 3.7 ±0.3 Female 19 ±2 6 6 20 32 36 ±4 3.9 ±0.1
PROXIMITY TO VOTING RESIDENCE Absent 27 ±2 7 7 22 33 32 ±4 3.8 ±0.2 Not Absent 9 ±2 3 2 16 32 46 ±10 4.2 ±0.2
VOTER REGISTRATION STATUS Registered to Vote 23 ±2 6 6 20 33 36 ±4 3.9 ±0.1 Not Registered to Vote 3 ±2 NR NR NR NR NR NR
Note. Percent responding are active duty spouses who answered the question and who definitely voted by mail, e-mail/fax, or online in the November 2, 2010 election (Q17) or who definitely did not vote but requested an absentee ballot for the election (Q18). NR: Not reportable
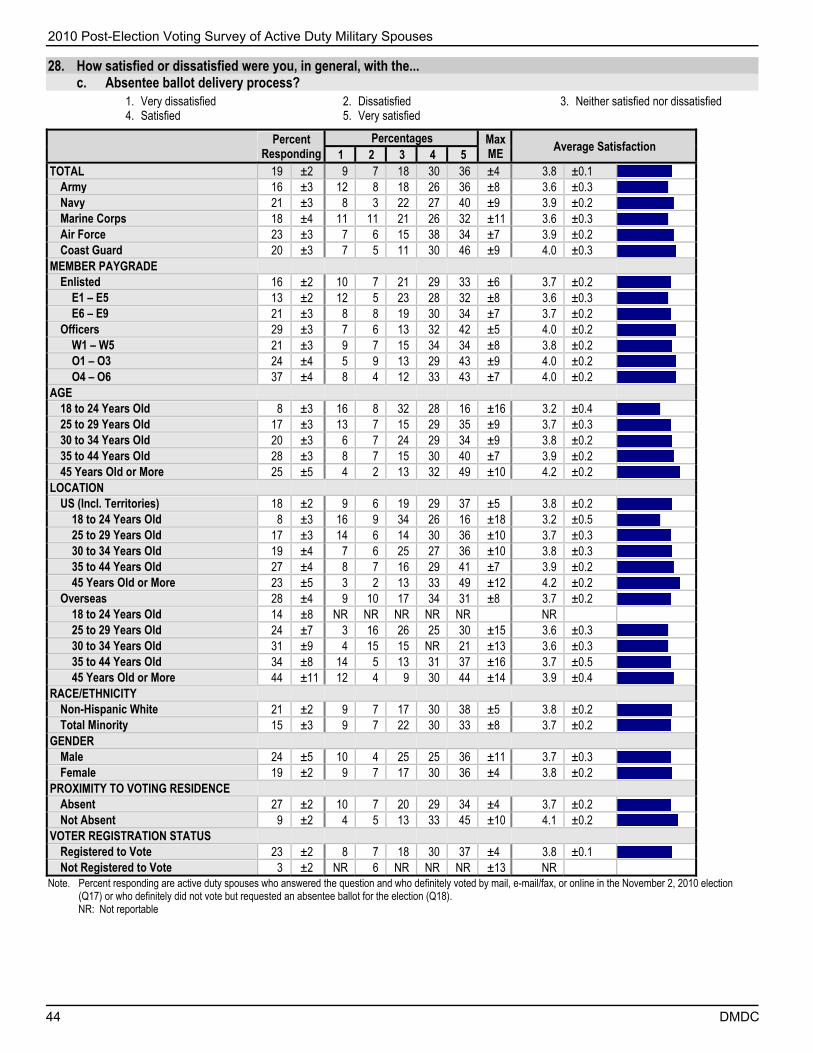
2010 Post-Election Voting Survey of Active Duty Military Spouses
44 DMDC
28. How satisfied or dissatisfied were you, in general, with the... c. Absentee ballot delivery process?
1. Very dissatisfied 2. Dissatisfied 3. Neither satisfied nor dissatisfied 4. Satisfied 5. Very satisfied
Percent
Responding Percentages Max
ME Average Satisfaction
1 2 3 4 5 TOTAL 19 ±2 9 7 18 30 36 ±4 3.8 ±0.1
Army 16 ±3 12 8 18 26 36 ±8 3.6 ±0.3 Navy 21 ±3 8 3 22 27 40 ±9 3.9 ±0.2 Marine Corps 18 ±4 11 11 21 26 32 ±11 3.6 ±0.3 Air Force 23 ±3 7 6 15 38 34 ±7 3.9 ±0.2 Coast Guard 20 ±3 7 5 11 30 46 ±9 4.0 ±0.3
MEMBER PAYGRADE Enlisted 16 ±2 10 7 21 29 33 ±6 3.7 ±0.2
E1 – E5 13 ±2 12 5 23 28 32 ±8 3.6 ±0.3 E6 – E9 21 ±3 8 8 19 30 34 ±7 3.7 ±0.2
Officers 29 ±3 7 6 13 32 42 ±5 4.0 ±0.2 W1 – W5 21 ±3 9 7 15 34 34 ±8 3.8 ±0.2 O1 – O3 24 ±4 5 9 13 29 43 ±9 4.0 ±0.2 O4 – O6 37 ±4 8 4 12 33 43 ±7 4.0 ±0.2
AGE 18 to 24 Years Old 8 ±3 16 8 32 28 16 ±16 3.2 ±0.4 25 to 29 Years Old 17 ±3 13 7 15 29 35 ±9 3.7 ±0.3 30 to 34 Years Old 20 ±3 6 7 24 29 34 ±9 3.8 ±0.2 35 to 44 Years Old 28 ±3 8 7 15 30 40 ±7 3.9 ±0.2 45 Years Old or More 25 ±5 4 2 13 32 49 ±10 4.2 ±0.2
LOCATION US (Incl. Territories) 18 ±2 9 6 19 29 37 ±5 3.8 ±0.2
18 to 24 Years Old 8 ±3 16 9 34 26 16 ±18 3.2 ±0.5 25 to 29 Years Old 17 ±3 14 6 14 30 36 ±10 3.7 ±0.3 30 to 34 Years Old 19 ±4 7 6 25 27 36 ±10 3.8 ±0.3 35 to 44 Years Old 27 ±4 8 7 16 29 41 ±7 3.9 ±0.2 45 Years Old or More 23 ±5 3 2 13 33 49 ±12 4.2 ±0.2
Overseas 28 ±4 9 10 17 34 31 ±8 3.7 ±0.2 18 to 24 Years Old 14 ±8 NR NR NR NR NR NR 25 to 29 Years Old 24 ±7 3 16 26 25 30 ±15 3.6 ±0.3 30 to 34 Years Old 31 ±9 4 15 15 NR 21 ±13 3.6 ±0.3 35 to 44 Years Old 34 ±8 14 5 13 31 37 ±16 3.7 ±0.5 45 Years Old or More 44 ±11 12 4 9 30 44 ±14 3.9 ±0.4
RACE/ETHNICITY Non-Hispanic White 21 ±2 9 7 17 30 38 ±5 3.8 ±0.2 Total Minority 15 ±3 9 7 22 30 33 ±8 3.7 ±0.2
GENDER Male 24 ±5 10 4 25 25 36 ±11 3.7 ±0.3 Female 19 ±2 9 7 17 30 36 ±4 3.8 ±0.2
PROXIMITY TO VOTING RESIDENCE Absent 27 ±2 10 7 20 29 34 ±4 3.7 ±0.2 Not Absent 9 ±2 4 5 13 33 45 ±10 4.1 ±0.2
VOTER REGISTRATION STATUS Registered to Vote 23 ±2 8 7 18 30 37 ±4 3.8 ±0.1 Not Registered to Vote 3 ±2 NR 6 NR NR NR ±13 NR
Note. Percent responding are active duty spouses who answered the question and who definitely voted by mail, e-mail/fax, or online in the November 2, 2010 election (Q17) or who definitely did not vote but requested an absentee ballot for the election (Q18). NR: Not reportable

2010 Post-Election Voting Survey of Active Duty Military Spouses
DMDC 45
28. How satisfied or dissatisfied were you, in general, with the... d. Process of completing an absentee ballot?
1. Very dissatisfied 2. Dissatisfied 3. Neither satisfied nor dissatisfied 4. Satisfied 5. Very satisfied
Percent
Responding Percentages Max
ME Average Satisfaction
1 2 3 4 5 TOTAL 19 ±2 5 3 22 32 38 ±4 3.9 ±0.1
Army 16 ±3 9 3 23 28 37 ±8 3.8 ±0.2 Navy 21 ±3 4 2 21 32 41 ±9 4.0 ±0.2 Marine Corps 18 ±4 6 5 29 23 37 ±12 3.8 ±0.3 Air Force 23 ±3 3 2 20 39 36 ±7 4.0 ±0.2 Coast Guard 21 ±3 1 2 22 28 48 ±9 4.2 ±0.2
MEMBER PAYGRADE Enlisted 16 ±2 6 3 26 30 35 ±6 3.8 ±0.2
E1 – E5 13 ±2 6 1 32 27 34 ±8 3.8 ±0.2 E6 – E9 21 ±3 6 5 21 33 36 ±7 3.9 ±0.2
Officers 29 ±3 4 2 15 36 44 ±5 4.1 ±0.1 W1 – W5 21 ±3 7 3 20 36 34 ±8 3.9 ±0.2 O1 – O3 24 ±4 1 2 18 36 43 ±9 4.2 ±0.2 O4 – O6 37 ±4 5 1 12 35 46 ±7 4.2 ±0.2
AGE 18 to 24 Years Old 8 ±3 7 NR 48 26 16 ±15 3.4 ±0.4 25 to 29 Years Old 17 ±3 7 2 24 29 38 ±9 3.9 ±0.3 30 to 34 Years Old 20 ±3 5 4 23 34 34 ±9 3.9 ±0.2 35 to 44 Years Old 27 ±3 5 3 17 33 42 ±7 4.1 ±0.2 45 Years Old or More 25 ±5 2 1 10 33 53 ±10 4.3 ±0.2
LOCATION US (Incl. Territories) 18 ±2 5 3 24 30 38 ±5 3.9 ±0.1
18 to 24 Years Old 8 ±3 NR NR NR 24 16 ±17 3.4 ±0.4 25 to 29 Years Old 16 ±3 8 2 25 27 37 ±10 3.8 ±0.3 30 to 34 Years Old 19 ±4 5 3 25 32 35 ±10 3.9 ±0.3 35 to 44 Years Old 26 ±4 4 3 19 32 43 ±7 4.1 ±0.2 45 Years Old or More 23 ±5 1 0 11 34 54 ±12 4.4 ±0.2
Overseas 28 ±4 7 4 14 40 35 ±8 3.9 ±0.2 18 to 24 Years Old 15 ±8 NR NR NR NR NR NR 25 to 29 Years Old 23 ±7 2 1 18 39 40 ±15 4.1 ±0.3 30 to 34 Years Old 31 ±9 4 7 12 NR 25 ±14 3.9 ±0.3 35 to 44 Years Old 34 ±8 10 3 11 37 39 ±16 3.9 ±0.4 45 Years Old or More 44 ±11 10 NR 8 28 48 ±13 4.0 ±0.4
RACE/ETHNICITY Non-Hispanic White 21 ±2 6 3 20 33 39 ±5 4.0 ±0.2 Total Minority 15 ±3 5 3 27 30 36 ±8 3.9 ±0.2
GENDER Male 24 ±5 6 3 26 30 35 ±11 3.9 ±0.3 Female 18 ±2 5 3 22 32 38 ±5 4.0 ±0.1
PROXIMITY TO VOTING RESIDENCE Absent 27 ±2 6 3 23 32 36 ±5 3.9 ±0.1 Not Absent 9 ±2 2 1 20 31 46 ±10 4.2 ±0.2
VOTER REGISTRATION STATUS Registered to Vote 23 ±2 5 3 21 32 39 ±4 4.0 ±0.1 Not Registered to Vote 3 ±2 NR 4 NR NR NR ±9 NR
Note. Percent responding are active duty spouses who answered the question and who definitely voted by mail, e-mail/fax, or online in the November 2, 2010 election (Q17) or who definitely did not vote but requested an absentee ballot for the election (Q18). NR: Not reportable

2010 Post-Election Voting Survey of Active Duty Military Spouses
46 DMDC
28. How satisfied or dissatisfied were you, in general, with the... e. Process of returning an absentee ballot to local election official?
1. Very dissatisfied 2. Dissatisfied 3. Neither satisfied nor dissatisfied 4. Satisfied 5. Very satisfied
Percent
Responding Percentages Max
ME Average Satisfaction
1 2 3 4 5 TOTAL 19 ±2 6 4 22 32 36 ±4 3.9 ±0.1
Army 16 ±3 9 5 23 28 35 ±8 3.7 ±0.2 Navy 21 ±3 5 1 22 32 40 ±9 4.0 ±0.2 Marine Corps 18 ±4 6 11 27 23 33 ±11 3.7 ±0.3 Air Force 23 ±3 4 2 20 39 35 ±7 4.0 ±0.2 Coast Guard 21 ±3 2 2 22 28 47 ±9 4.2 ±0.2
MEMBER PAYGRADE Enlisted 16 ±2 7 4 26 31 32 ±5 3.8 ±0.2
E1 – E5 13 ±2 8 2 29 28 32 ±8 3.7 ±0.2 E6 – E9 21 ±3 6 6 23 33 33 ±7 3.8 ±0.2
Officers 29 ±3 4 3 15 34 44 ±5 4.1 ±0.1 W1 – W5 21 ±3 8 6 21 33 32 ±8 3.8 ±0.2 O1 – O3 24 ±4 2 3 17 33 44 ±9 4.1 ±0.2 O4 – O6 37 ±4 5 2 13 35 45 ±7 4.1 ±0.2
AGE 18 to 24 Years Old 8 ±3 8 8 44 25 15 ±16 3.3 ±0.4 25 to 29 Years Old 17 ±3 10 3 21 32 33 ±9 3.7 ±0.3 30 to 34 Years Old 20 ±3 5 5 24 32 34 ±9 3.8 ±0.2 35 to 44 Years Old 28 ±3 5 3 19 33 41 ±7 4.0 ±0.2 45 Years Old or More 25 ±5 2 1 13 32 51 ±10 4.3 ±0.2
LOCATION US (Incl. Territories) 18 ±2 6 4 24 31 37 ±5 3.9 ±0.1
18 to 24 Years Old 8 ±3 NR 9 NR 22 16 ±17 3.3 ±0.4 25 to 29 Years Old 17 ±3 11 3 22 32 32 ±10 3.7 ±0.3 30 to 34 Years Old 19 ±4 5 4 25 30 36 ±10 3.9 ±0.3 35 to 44 Years Old 27 ±4 4 3 20 32 41 ±7 4.0 ±0.2 45 Years Old or More 24 ±5 1 1 14 32 52 ±12 4.3 ±0.2
Overseas 28 ±4 8 6 15 38 34 ±8 3.8 ±0.2 18 to 24 Years Old 15 ±8 NR NR NR NR NR NR 25 to 29 Years Old 23 ±7 6 5 15 35 39 ±15 4.0 ±0.3 30 to 34 Years Old 31 ±9 4 12 17 NR 21 ±14 3.7 ±0.3 35 to 44 Years Old 34 ±8 10 3 12 33 41 ±16 3.9 ±0.4 45 Years Old or More 44 ±11 10 2 8 33 47 ±13 4.1 ±0.4
RACE/ETHNICITY Non-Hispanic White 21 ±2 7 3 21 32 38 ±5 3.9 ±0.2 Total Minority 16 ±3 5 6 25 31 32 ±8 3.8 ±0.2
GENDER Male 24 ±5 6 4 26 28 36 ±11 3.8 ±0.3 Female 19 ±2 6 4 22 32 36 ±4 3.9 ±0.1
PROXIMITY TO VOTING RESIDENCE Absent 27 ±2 7 3 24 31 35 ±4 3.8 ±0.1 Not Absent 9 ±2 3 5 18 33 42 ±10 4.1 ±0.2
VOTER REGISTRATION STATUS Registered to Vote 23 ±2 6 4 21 32 37 ±4 3.9 ±0.1 Not Registered to Vote 3 ±2 NR 6 NR NR NR ±10 NR
Note. Percent responding are active duty spouses who answered the question and who definitely voted by mail, e-mail/fax, or online in the November 2, 2010 election (Q17) or who definitely did not vote but requested an absentee ballot for the election (Q18). NR: Not reportable

2010 Post-Election Voting Survey of Active Duty Military Spouses
DMDC 47
28. How satisfied or dissatisfied were you, in general, with the... f. The overall absentee voting process?
1. Very dissatisfied 2. Dissatisfied 3. Neither satisfied nor dissatisfied 4. Satisfied 5. Very satisfied
Percent
Responding Percentages Max
ME Average Satisfaction
1 2 3 4 5 TOTAL 19 ±2 7 6 19 34 34 ±4 3.8 ±0.1
Army 16 ±3 9 8 20 29 34 ±8 3.7 ±0.2 Navy 21 ±3 7 3 17 37 37 ±9 3.9 ±0.2 Marine Corps 18 ±4 11 6 25 25 32 ±11 3.6 ±0.3 Air Force 23 ±3 5 5 18 40 33 ±7 3.9 ±0.2 Coast Guard 21 ±3 5 6 14 30 45 ±9 4.0 ±0.2
MEMBER PAYGRADE Enlisted 16 ±2 8 6 22 32 32 ±5 3.7 ±0.2
E1 – E5 13 ±2 9 5 25 30 30 ±8 3.7 ±0.2 E6 – E9 21 ±3 8 7 19 34 33 ±7 3.8 ±0.2
Officers 30 ±3 5 5 13 36 40 ±5 4.0 ±0.2 W1 – W5 21 ±3 8 11 15 33 32 ±8 3.7 ±0.2 O1 – O3 24 ±4 3 8 14 32 42 ±9 4.0 ±0.2 O4 – O6 37 ±4 7 3 12 39 40 ±7 4.0 ±0.2
AGE 18 to 24 Years Old 8 ±3 7 11 41 26 16 ±16 3.3 ±0.4 25 to 29 Years Old 17 ±3 12 5 17 35 32 ±9 3.7 ±0.3 30 to 34 Years Old 20 ±3 6 7 22 33 32 ±9 3.8 ±0.2 35 to 44 Years Old 28 ±3 6 5 15 34 39 ±7 3.9 ±0.2 45 Years Old or More 25 ±5 3 2 11 36 49 ±11 4.3 ±0.2
LOCATION US (Incl. Territories) 18 ±2 7 6 20 32 35 ±5 3.8 ±0.2
18 to 24 Years Old 8 ±3 NR 10 NR 24 16 ±17 3.3 ±0.4 25 to 29 Years Old 16 ±3 14 5 17 33 32 ±10 3.7 ±0.3 30 to 34 Years Old 19 ±4 6 7 22 31 33 ±10 3.8 ±0.3 35 to 44 Years Old 27 ±4 5 5 16 34 40 ±7 4.0 ±0.2 45 Years Old or More 24 ±5 1 2 10 37 49 ±12 4.3 ±0.2
Overseas 28 ±4 8 7 14 40 31 ±8 3.8 ±0.2 18 to 24 Years Old 15 ±8 NR NR NR NR NR NR 25 to 29 Years Old 23 ±7 1 8 19 45 28 ±14 3.9 ±0.3 30 to 34 Years Old 31 ±9 5 6 16 NR 22 ±14 3.8 ±0.3 35 to 44 Years Old 34 ±8 14 5 10 34 37 ±16 3.8 ±0.5 45 Years Old or More 45 ±11 11 4 12 27 47 ±13 4.0 ±0.4
RACE/ETHNICITY Non-Hispanic White 21 ±2 7 6 17 33 36 ±5 3.8 ±0.2 Total Minority 16 ±3 7 5 23 34 31 ±8 3.8 ±0.2
GENDER Male 24 ±5 8 3 24 33 32 ±11 3.8 ±0.3 Female 19 ±2 7 6 18 34 35 ±4 3.8 ±0.1
PROXIMITY TO VOTING RESIDENCE Absent 28 ±2 8 6 19 34 32 ±5 3.8 ±0.2 Not Absent 9 ±2 2 4 17 33 44 ±10 4.1 ±0.2
VOTER REGISTRATION STATUS Registered to Vote 23 ±2 7 6 18 34 35 ±4 3.9 ±0.1 Not Registered to Vote 3 ±2 NR NR NR NR NR NR
Note. Percent responding are active duty spouses who answered the question and who definitely voted by mail, e-mail/fax, or online in the November 2, 2010 election (Q17) or who definitely did not vote but requested an absentee ballot for the election (Q18). NR: Not reportable
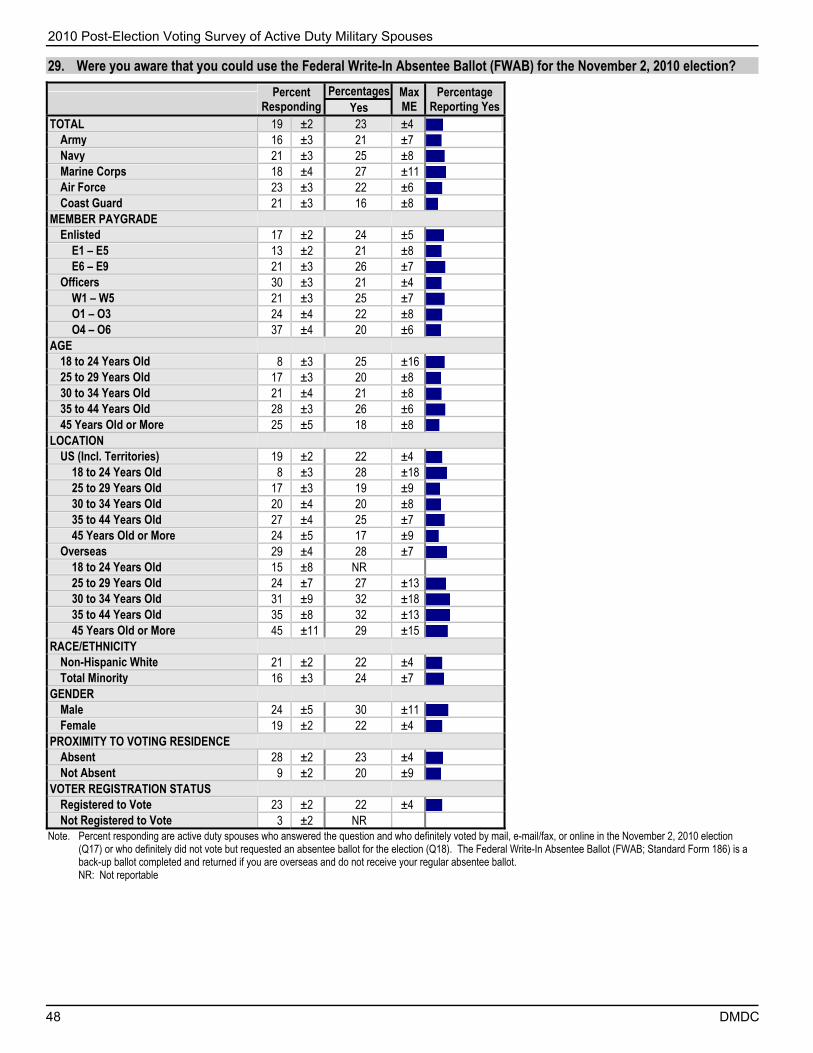
2010 Post-Election Voting Survey of Active Duty Military Spouses
48 DMDC
29. Were you aware that you could use the Federal Write-In Absentee Ballot (FWAB) for the November 2, 2010 election?
Percent
Responding Percentages Max
ME Percentage
Reporting Yes Yes TOTAL 19 ±2 23 ±4
Army 16 ±3 21 ±7 Navy 21 ±3 25 ±8 Marine Corps 18 ±4 27 ±11 Air Force 23 ±3 22 ±6 Coast Guard 21 ±3 16 ±8
MEMBER PAYGRADE Enlisted 17 ±2 24 ±5
E1 – E5 13 ±2 21 ±8 E6 – E9 21 ±3 26 ±7
Officers 30 ±3 21 ±4 W1 – W5 21 ±3 25 ±7 O1 – O3 24 ±4 22 ±8 O4 – O6 37 ±4 20 ±6
AGE 18 to 24 Years Old 8 ±3 25 ±16 25 to 29 Years Old 17 ±3 20 ±8 30 to 34 Years Old 21 ±4 21 ±8 35 to 44 Years Old 28 ±3 26 ±6 45 Years Old or More 25 ±5 18 ±8
LOCATION US (Incl. Territories) 19 ±2 22 ±4
18 to 24 Years Old 8 ±3 28 ±18 25 to 29 Years Old 17 ±3 19 ±9 30 to 34 Years Old 20 ±4 20 ±8 35 to 44 Years Old 27 ±4 25 ±7 45 Years Old or More 24 ±5 17 ±9
Overseas 29 ±4 28 ±7 18 to 24 Years Old 15 ±8 NR 25 to 29 Years Old 24 ±7 27 ±13 30 to 34 Years Old 31 ±9 32 ±18 35 to 44 Years Old 35 ±8 32 ±13 45 Years Old or More 45 ±11 29 ±15
RACE/ETHNICITY Non-Hispanic White 21 ±2 22 ±4 Total Minority 16 ±3 24 ±7
GENDER Male 24 ±5 30 ±11 Female 19 ±2 22 ±4
PROXIMITY TO VOTING RESIDENCE Absent 28 ±2 23 ±4 Not Absent 9 ±2 20 ±9
VOTER REGISTRATION STATUS Registered to Vote 23 ±2 22 ±4 Not Registered to Vote 3 ±2 NR
Note. Percent responding are active duty spouses who answered the question and who definitely voted by mail, e-mail/fax, or online in the November 2, 2010 election (Q17) or who definitely did not vote but requested an absentee ballot for the election (Q18). The Federal Write-In Absentee Ballot (FWAB; Standard Form 186) is a back-up ballot completed and returned if you are overseas and do not receive your regular absentee ballot. NR: Not reportable
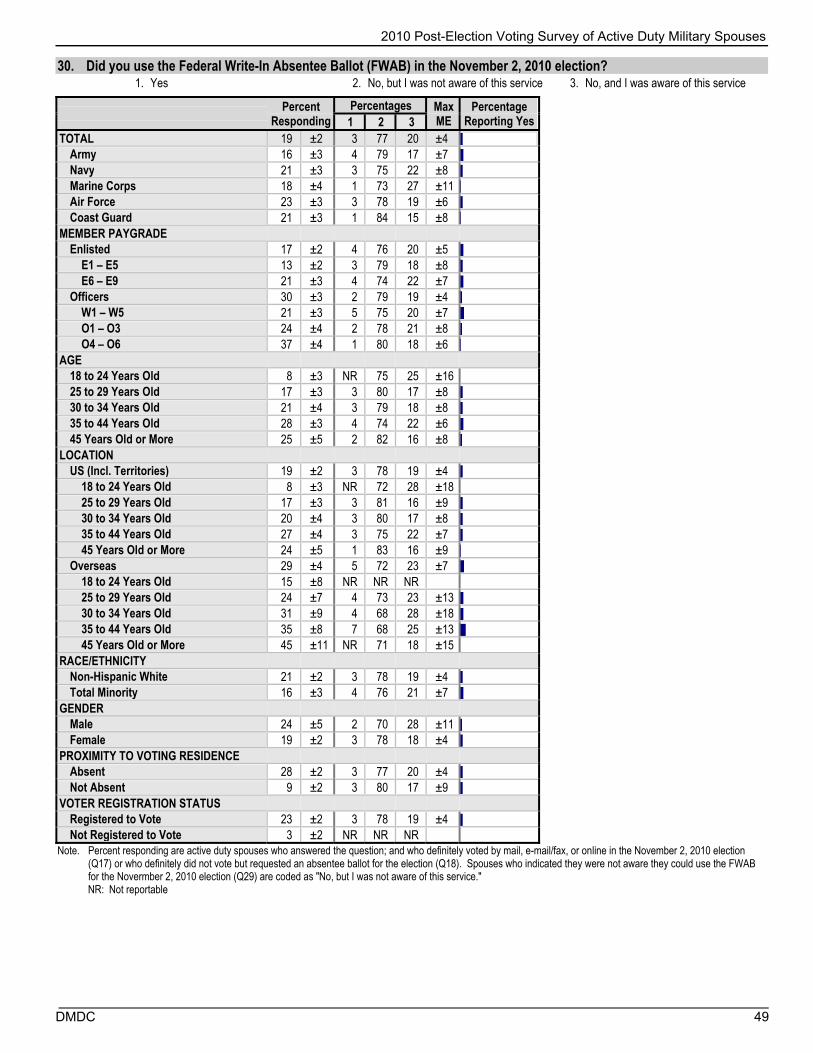
2010 Post-Election Voting Survey of Active Duty Military Spouses
DMDC 49
30. Did you use the Federal Write-In Absentee Ballot (FWAB) in the November 2, 2010 election?
1. Yes 2. No, but I was not aware of this service 3. No, and I was aware of this service
Percent
Responding Percentages Max
ME Percentage
Reporting Yes 1 2 3 TOTAL 19 ±2 3 77 20 ±4
Army 16 ±3 4 79 17 ±7 Navy 21 ±3 3 75 22 ±8 Marine Corps 18 ±4 1 73 27 ±11 Air Force 23 ±3 3 78 19 ±6 Coast Guard 21 ±3 1 84 15 ±8
MEMBER PAYGRADE Enlisted 17 ±2 4 76 20 ±5
E1 – E5 13 ±2 3 79 18 ±8 E6 – E9 21 ±3 4 74 22 ±7
Officers 30 ±3 2 79 19 ±4 W1 – W5 21 ±3 5 75 20 ±7 O1 – O3 24 ±4 2 78 21 ±8 O4 – O6 37 ±4 1 80 18 ±6
AGE 18 to 24 Years Old 8 ±3 NR 75 25 ±16 25 to 29 Years Old 17 ±3 3 80 17 ±8 30 to 34 Years Old 21 ±4 3 79 18 ±8 35 to 44 Years Old 28 ±3 4 74 22 ±6 45 Years Old or More 25 ±5 2 82 16 ±8
LOCATION US (Incl. Territories) 19 ±2 3 78 19 ±4
18 to 24 Years Old 8 ±3 NR 72 28 ±18 25 to 29 Years Old 17 ±3 3 81 16 ±9 30 to 34 Years Old 20 ±4 3 80 17 ±8 35 to 44 Years Old 27 ±4 3 75 22 ±7 45 Years Old or More 24 ±5 1 83 16 ±9
Overseas 29 ±4 5 72 23 ±7 18 to 24 Years Old 15 ±8 NR NR NR 25 to 29 Years Old 24 ±7 4 73 23 ±13 30 to 34 Years Old 31 ±9 4 68 28 ±18 35 to 44 Years Old 35 ±8 7 68 25 ±13 45 Years Old or More 45 ±11 NR 71 18 ±15
RACE/ETHNICITY Non-Hispanic White 21 ±2 3 78 19 ±4 Total Minority 16 ±3 4 76 21 ±7
GENDER Male 24 ±5 2 70 28 ±11 Female 19 ±2 3 78 18 ±4
PROXIMITY TO VOTING RESIDENCE Absent 28 ±2 3 77 20 ±4 Not Absent 9 ±2 3 80 17 ±9
VOTER REGISTRATION STATUS Registered to Vote 23 ±2 3 78 19 ±4 Not Registered to Vote 3 ±2 NR NR NR
Note. Percent responding are active duty spouses who answered the question; and who definitely voted by mail, e-mail/fax, or online in the November 2, 2010 election (Q17) or who definitely did not vote but requested an absentee ballot for the election (Q18). Spouses who indicated they were not aware they could use the FWAB for the Novermber 2, 2010 election (Q29) are coded as "No, but I was not aware of this service." NR: Not reportable

2010 Post-Election Voting Survey of Active Duty Military Spouses
50 DMDC
31. Did you obtain your Federal Write-In Absentee Ballot (FWAB) for the November 2, 2010 election from any of the following sources?
a. A printable FPCA downloaded from the FVAP Web site that you filled out by hand
b. FVAP's automated assistant for filling out the FPCA online
c. From some other contact with FVAP
d. Through military channels e. From a U.S. embassy or consulate f. From a state or local election official g. From an overseas organization or
company h. From a non-FVAP Web site i. From a military post office
j. From my spouse k. Some other source
Percent Responding
Percentages Max ME a b c d e f g h i j k
TOTAL 1 ±1 NR NR NR NR 1 NR NR 1 13 6 NR ±16 Army 1 ±1 NR NR NR NR NR NR NR NR NR NR NR Navy 1 ±1 NR NR NR NR NR NR NR NR NR NR NR Marine Corps 0 ±1 NR NR NR NR NR NR NR NR NR NR NR Air Force 1 ±1 NR NR 1 NR NR NR NR NR NR 0 1 ±5 Coast Guard 0 ±1 NR NR NR NR NR NR NR NR NR NR NR
MEMBER PAYGRADE Enlisted 1 ±1 NR NR 0 NR NR NR NR NR NR NR NR ±2
E1 – E5 0 ±1 NR NR NR NR NR NR NR NR NR NR NR E6 – E9 1 ±1 NR 0 0 NR NR NR NR NR NR NR NR ±3
Officers 0 ±1 NR NR NR NR NR NR NR NR NR NR NR W1 – W5 1 ±1 NR NR NR NR NR NR NR NR NR NR NR O1 – O3 0 ±1 NR NR NR NR NR NR NR NR NR NR NR O4 – O6 1 ±1 NR NR NR NR NR NR NR NR NR NR NR
AGE 18 to 24 Years Old NA NA NA NA NA NA NA NA NA NA NA NA 25 to 29 Years Old 1 ±1 NR NR NR NR NR NR NR NR NR NR NR 30 to 34 Years Old 1 ±1 NR NR NR NR NR NR NR NR NR NR NR 35 to 44 Years Old 1 ±1 NR NR 1 NR NR NR NR NR NR NR NR ±3 45 Years Old or More 1 ±1 NR NR NR NR NR NR NR NR NR NR NR
LOCATION US (Incl. Territories) 0 ±1 NR NR NR NR NR NR NR NR NR NR NR
18 to 24 Years Old NA NA NA NA NA NA NA NA NA NA NA NA 25 to 29 Years Old 0 ±1 NR NR NR NR NR NR NR NR NR NR NR 30 to 34 Years Old 1 ±1 NR NR NR NR NR NR NR NR NR NR NR 35 to 44 Years Old 1 ±1 NR NR NR NR NR NR NR NR NR NR NR 45 Years Old or More 0 ±1 NR NR NR NR NR NR NR NR NR NR NR
Overseas 1 ±1 NR NR 2 NR NR NR NR NR NR NR 1 ±6 18 to 24 Years Old NA NA NA NA NA NA NA NA NA NA NA NA 25 to 29 Years Old 1 ±2 NR NR NR NR NR NR NR NR NR NR NR 30 to 34 Years Old 0 ±1 NR NR NR NR NR NR NR NR NR NR NR 35 to 44 Years Old 2 ±3 NR NR NR NR NR NR NR NR NR NR NR 45 Years Old or More 5 ±6 NR NR NR NR NR NR NR NR NR NR NR
RACE/ETHNICITY Non-Hispanic White 1 ±1 NR NR 0 NR NR NR NR NR NR NR NR ±2 Total Minority 1 ±1 NR NR NR NR NR NR NR NR NR NR NR
GENDER Male 1 ±1 NR NR NR NR NR NR NR NR NR NR NR Female 1 ±1 NR NR NR NR 1 NR NR 1 NR 7 NR ±14
PROXIMITY TO VOTING RESIDENCE Absent 1 ±1 NR NR NR NR NR NR NR NR NR NR NR Not Absent 0 ±1 NR NR NR NR NR NR NR NR NR NR NR
VOTER REGISTRATION STATUS Registered to Vote 1 ±1 NR NR NR NR 1 NR NR 1 13 NR NR ±16 Not Registered to Vote 0 ±1 NR NR NR NR NR NR NR NR NR NR NR
Note. Percent responding are active duty spouses who answered the question; who definitely voted by mail, e-mail/fax, or online in the November 2, 2010 election (Q17) or who definitely did not vote but requested an absentee ballot for the election (Q18); and who used the FWAB in the election (Q30). NR: Not reportable NA: Not applicable
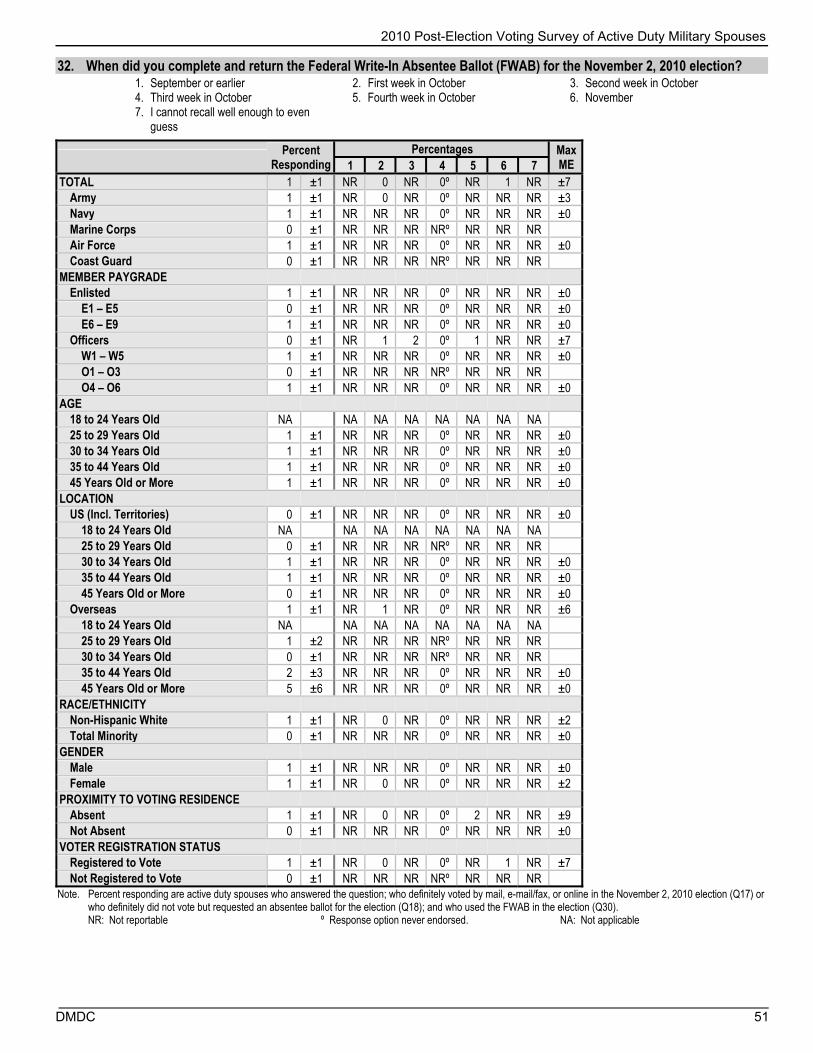
2010 Post-Election Voting Survey of Active Duty Military Spouses
DMDC 51
32. When did you complete and return the Federal Write-In Absentee Ballot (FWAB) for the November 2, 2010 election?
1. September or earlier 2. First week in October 3. Second week in October 4. Third week in October 5. Fourth week in October 6. November 7. I cannot recall well enough to even
guess
Percent
Responding Percentages Max
ME 1 2 3 4 5 6 7 TOTAL 1 ±1 NR 0 NR 0º NR 1 NR ±7
Army 1 ±1 NR 0 NR 0º NR NR NR ±3 Navy 1 ±1 NR NR NR 0º NR NR NR ±0 Marine Corps 0 ±1 NR NR NR NRº NR NR NR Air Force 1 ±1 NR NR NR 0º NR NR NR ±0 Coast Guard 0 ±1 NR NR NR NRº NR NR NR
MEMBER PAYGRADE Enlisted 1 ±1 NR NR NR 0º NR NR NR ±0
E1 – E5 0 ±1 NR NR NR 0º NR NR NR ±0 E6 – E9 1 ±1 NR NR NR 0º NR NR NR ±0
Officers 0 ±1 NR 1 2 0º 1 NR NR ±7 W1 – W5 1 ±1 NR NR NR 0º NR NR NR ±0 O1 – O3 0 ±1 NR NR NR NRº NR NR NR O4 – O6 1 ±1 NR NR NR 0º NR NR NR ±0
AGE 18 to 24 Years Old NA NA NA NA NA NA NA NA 25 to 29 Years Old 1 ±1 NR NR NR 0º NR NR NR ±0 30 to 34 Years Old 1 ±1 NR NR NR 0º NR NR NR ±0 35 to 44 Years Old 1 ±1 NR NR NR 0º NR NR NR ±0 45 Years Old or More 1 ±1 NR NR NR 0º NR NR NR ±0
LOCATION US (Incl. Territories) 0 ±1 NR NR NR 0º NR NR NR ±0
18 to 24 Years Old NA NA NA NA NA NA NA NA 25 to 29 Years Old 0 ±1 NR NR NR NRº NR NR NR 30 to 34 Years Old 1 ±1 NR NR NR 0º NR NR NR ±0 35 to 44 Years Old 1 ±1 NR NR NR 0º NR NR NR ±0 45 Years Old or More 0 ±1 NR NR NR 0º NR NR NR ±0
Overseas 1 ±1 NR 1 NR 0º NR NR NR ±6 18 to 24 Years Old NA NA NA NA NA NA NA NA 25 to 29 Years Old 1 ±2 NR NR NR NRº NR NR NR 30 to 34 Years Old 0 ±1 NR NR NR NRº NR NR NR 35 to 44 Years Old 2 ±3 NR NR NR 0º NR NR NR ±0 45 Years Old or More 5 ±6 NR NR NR 0º NR NR NR ±0
RACE/ETHNICITY Non-Hispanic White 1 ±1 NR 0 NR 0º NR NR NR ±2 Total Minority 0 ±1 NR NR NR 0º NR NR NR ±0
GENDER Male 1 ±1 NR NR NR 0º NR NR NR ±0 Female 1 ±1 NR 0 NR 0º NR NR NR ±2
PROXIMITY TO VOTING RESIDENCE Absent 1 ±1 NR 0 NR 0º 2 NR NR ±9 Not Absent 0 ±1 NR NR NR 0º NR NR NR ±0
VOTER REGISTRATION STATUS Registered to Vote 1 ±1 NR 0 NR 0º NR 1 NR ±7 Not Registered to Vote 0 ±1 NR NR NR NRº NR NR NR
Note. Percent responding are active duty spouses who answered the question; who definitely voted by mail, e-mail/fax, or online in the November 2, 2010 election (Q17) or who definitely did not vote but requested an absentee ballot for the election (Q18); and who used the FWAB in the election (Q30). NR: Not reportable º Response option never endorsed. NA: Not applicable

2010 Post-Election Voting Survey of Active Duty Military Spouses
52 DMDC
33. Were you aware that you could get information or assistance from an Installation Voter Assistance Officer/Unit Voting Assistance Officer (IVAO/UVAO)?
Percent
Responding Percentages Max
ME Percentage
Reporting Yes Yes TOTAL 76 ±2 22 ±2
Army 76 ±3 18 ±3 Navy 74 ±4 18 ±4 Marine Corps 79 ±5 14 ±5 Air Force 78 ±3 34 ±4 Coast Guard 72 ±4 13 ±4
MEMBER PAYGRADE Enlisted 77 ±2 20 ±2
E1 – E5 81 ±3 16 ±3 E6 – E9 71 ±3 28 ±4
Officers 73 ±3 28 ±3 W1 – W5 72 ±4 27 ±4 O1 – O3 74 ±4 21 ±5 O4 – O6 72 ±4 33 ±5
AGE 18 to 24 Years Old 82 ±4 13 ±4 25 to 29 Years Old 80 ±3 17 ±4 30 to 34 Years Old 76 ±4 22 ±4 35 to 44 Years Old 71 ±3 32 ±4 45 Years Old or More 62 ±6 37 ±7
LOCATION US (Incl. Territories) 75 ±2 20 ±2
18 to 24 Years Old 81 ±4 12 ±4 25 to 29 Years Old 79 ±4 15 ±4 30 to 34 Years Old 75 ±4 20 ±5 35 to 44 Years Old 69 ±4 30 ±4 45 Years Old or More 60 ±6 36 ±8
Overseas 91 ±3 36 ±5 18 to 24 Years Old 87 ±10 23 ±10 25 to 29 Years Old 93 ±4 31 ±9 30 to 34 Years Old 90 ±5 40 ±10 35 to 44 Years Old 93 ±5 45 ±9 45 Years Old or More 86 ±10 43 ±11
RACE/ETHNICITY Non-Hispanic White 78 ±2 20 ±2 Total Minority 73 ±3 24 ±4
GENDER Male 77 ±5 52 ±7 Female 76 ±2 18 ±2
PROXIMITY TO VOTING RESIDENCE Absent 91 ±2 25 ±3 Not Absent 57 ±3 16 ±3
VOTER REGISTRATION STATUS Registered to Vote 72 ±2 23 ±2 Not Registered to Vote 95 ±3 19 ±4
Note. Percent responding are active duty spouses who answered the question and who definitely voted by mail, e-mail/fax, or online in the November 2, 2010 election or who definitely did not vote (Q17). IVAOs and UVAOs are designated to provide accurate, non-partisan voting information and assistance to members of military units who wish to vote.

2010 Post-Election Voting Survey of Active Duty Military Spouses
DMDC 53
34. During 2010, did you receive voting information or assistance from an Installation Voter Assistance Officer/Unit Voting Assistance Officer (IVAO/UVAO)?
1. Yes 2. No, but I was not aware of this service 3. No, and I was aware of this service
Percent Responding
Percentages Max ME
Percentage Reporting Yes 1 2 3
TOTAL 76 ±2 8 78 14 ±2 Army 75 ±3 6 82 13 ±3 Navy 74 ±4 6 82 12 ±4 Marine Corps 79 ±5 4 86 10 ±5 Air Force 78 ±3 15 66 19 ±4 Coast Guard 72 ±4 4 87 10 ±4
MEMBER PAYGRADE Enlisted 77 ±2 8 80 12 ±2
E1 – E5 81 ±3 6 84 10 ±3 E6 – E9 70 ±3 12 72 16 ±4
Officers 73 ±3 7 73 20 ±3 W1 – W5 71 ±4 9 73 18 ±4 O1 – O3 74 ±4 6 79 15 ±5 O4 – O6 72 ±4 8 67 25 ±5
AGE 18 to 24 Years Old 82 ±4 3 87 10 ±4 25 to 29 Years Old 80 ±3 7 83 10 ±4 30 to 34 Years Old 76 ±4 10 78 12 ±4 35 to 44 Years Old 71 ±3 11 68 21 ±4 45 Years Old or More 62 ±6 9 63 27 ±7
LOCATION US (Incl. Territories) 75 ±2 7 80 13 ±2
18 to 24 Years Old 81 ±4 2 88 9 ±4 25 to 29 Years Old 79 ±4 7 85 9 ±4 30 to 34 Years Old 75 ±4 10 80 10 ±5 35 to 44 Years Old 69 ±4 10 70 19 ±4 45 Years Old or More 60 ±6 9 64 27 ±8
Overseas 91 ±3 13 64 23 ±5 18 to 24 Years Old 87 ±10 8 77 15 ±10 25 to 29 Years Old 93 ±4 13 69 18 ±9 30 to 34 Years Old 90 ±6 14 61 25 ±10 35 to 44 Years Old 93 ±5 17 55 28 ±9 45 Years Old or More 86 ±10 9 57 33 ±11
RACE/ETHNICITY Non-Hispanic White 78 ±2 7 80 14 ±2 Total Minority 73 ±3 10 76 14 ±4
GENDER Male 77 ±5 22 48 29 ±7 Female 76 ±2 6 82 12 ±2
PROXIMITY TO VOTING RESIDENCE Absent 91 ±2 9 75 15 ±3 Not Absent 57 ±3 5 84 11 ±3
VOTER REGISTRATION STATUS Registered to Vote 72 ±2 8 77 14 ±2 Not Registered to Vote 95 ±3 7 81 12 ±4
Note. Percent responding are active duty spouses who answered the question and who definitely voted by mail, e-mail/fax, or online in the November 2, 2010 election or who definitely did not vote (Q17). Spouses who indicated they were not aware they could get information or assistance from an IVAO/UVAO (Q33) are coded as "No, but I was not aware of this service."

2010 Post-Election Voting Survey of Active Duty Military Spouses
54 DMDC
35. In 2010, what is the MAIN REASON you did not receive voting information or assistance from an Installation Voter Assistance Officer/Unit Voting Assistance Officer (IVAO/UVAO)?
1. I did not need any voting information or assistance.
2. I was not interested in voting. 3. I did not have an IVAO/UVAO.
4. I did not know how to contact my IVAO/UVAO.
5. My IVAO/UVAO was not available when I needed assistance.
6. My IVAO/UVAO was not helpful when I needed assistance.
7. My IVAO/UVAO did not have the materials or information I needed.
8. I received my voting assistance elsewhere.
9. Some other reason.
Percent
Responding Percentages Max
ME 1 2 3 4 5 6 7 8 9 TOTAL 10 ±2 45 29 4 5 0 1 1 5 10 ±6
Army 9 ±2 41 27 6 4 0 1 2 6 12 ±10 Navy 9 ±3 43 24 8 7 0 NR NR 5 13 ±13 Marine Corps 8 ±3 36 NR 2 4 NR NR NR 9 8 ±17 Air Force 15 ±3 51 30 1 5 1 0 0 4 8 ±9 Coast Guard 7 ±2 56 27 0 NR NR 1 NR 1 7 ±15
MEMBER PAYGRADE Enlisted 9 ±2 38 34 5 5 1 0 1 5 11 ±7
E1 – E5 8 ±2 33 38 6 5 1 0 NR 4 10 ±11 E6 – E9 11 ±2 43 29 4 4 1 1 0 7 12 ±10
Officers 14 ±2 61 18 2 5 0 1 0 5 8 ±7 W1 – W5 13 ±3 46 28 1 5 NR NR NR 7 12 ±10 O1 – O3 11 ±3 47 27 2 10 NR 1 NR 4 9 ±14 O4 – O6 18 ±4 71 11 3 3 0 1 0 5 7 ±9
AGE 18 to 24 Years Old 8 ±3 30 45 NR 8 NR NR NR 1 7 ±16 25 to 29 Years Old 8 ±2 27 42 3 2 1 NR 0 7 15 ±14 30 to 34 Years Old 9 ±3 49 24 NR 4 1 1 0 10 8 ±13 35 to 44 Years Old 15 ±3 54 22 3 6 0 0 0 5 10 ±9 45 Years Old or More 17 ±4 59 15 NR 3 0 0 0 2 13 ±14
LOCATION US (Incl. Territories) 9 ±2 47 30 4 3 0 0 1 5 10 ±7
18 to 24 Years Old 8 ±3 31 NR NR 7 NR NR NR 0 NR ±18 25 to 29 Years Old 7 ±3 27 45 NR 1 NR NR NR 4 16 ±17 30 to 34 Years Old 8 ±3 52 24 0 4 NR 0 NR 12 7 ±15 35 to 44 Years Old 13 ±3 58 23 3 2 0 0 0 5 10 ±10 45 Years Old or More 16 ±5 60 15 NR 3 0 0 0 2 12 ±16
Overseas 21 ±4 36 23 5 13 3 1 0 6 13 ±12 18 to 24 Years Old 13 ±6 NR NR NR NR NR NR NR NR NR 25 to 29 Years Old 16 ±7 NR NR 2 6 NR NR NR NR 13 ±17 30 to 34 Years Old 23 ±8 NR 23 NR 7 NR NR NR 3 12 ±18 35 to 44 Years Old 27 ±7 40 17 4 23 NR NR NR 2 10 ±18 45 Years Old or More 28 ±9 53 14 0 5 1 1 0 7 20 ±18
RACE/ETHNICITY Non-Hispanic White 11 ±2 50 28 4 4 0 0 1 3 10 ±7 Total Minority 10 ±2 35 31 5 7 1 1 0 9 12 ±10
GENDER Male 23 ±5 43 24 8 4 0 0 0 9 12 ±12 Female 9 ±2 45 31 3 5 1 1 1 4 10 ±6
PROXIMITY TO VOTING RESIDENCE Absent 14 ±2 45 27 4 5 1 1 1 6 11 ±6 Not Absent 6 ±2 45 36 3 3 0 0 0 3 10 ±12
VOTER REGISTRATION STATUS Registered to Vote 10 ±2 53 21 3 5 1 1 1 5 10 ±6 Not Registered to Vote 11 ±3 12 61 6 4 0 0 0 NR 11 ±13
Note. Percent responding are active duty spouses who answered the question; who definitely voted by mail, e-mail/fax, or online in the November 2, 2010 election or who definitely did not vote (Q17); and who were aware they could, but did not receive voting information or assistance from an IVAO/UVAO (Q33/Q34). NR: Not reportable

2010 Post-Election Voting Survey of Active Duty Military Spouses
DMDC 55
36. Were you aware of the Federal Voting Assistance Program (FVAP) Web site?
Percent
Responding Percentages Max
ME Percentage
Reporting Yes Yes TOTAL 76 ±2 22 ±2
Army 75 ±3 20 ±3 Navy 74 ±4 21 ±4 Marine Corps 79 ±5 17 ±5 Air Force 78 ±3 31 ±4 Coast Guard 72 ±4 15 ±4
MEMBER PAYGRADE Enlisted 77 ±2 21 ±3
E1 – E5 81 ±3 18 ±3 E6 – E9 71 ±3 28 ±4
Officers 73 ±3 25 ±3 W1 – W5 72 ±4 25 ±4 O1 – O3 73 ±5 20 ±5 O4 – O6 73 ±4 30 ±5
AGE 18 to 24 Years Old 81 ±4 12 ±4 25 to 29 Years Old 80 ±3 20 ±4 30 to 34 Years Old 76 ±4 25 ±5 35 to 44 Years Old 71 ±3 29 ±4 45 Years Old or More 62 ±6 31 ±7
LOCATION US (Incl. Territories) 75 ±2 21 ±2
18 to 24 Years Old 81 ±4 11 ±4 25 to 29 Years Old 79 ±4 19 ±4 30 to 34 Years Old 75 ±4 23 ±5 35 to 44 Years Old 69 ±4 27 ±4 45 Years Old or More 60 ±6 29 ±8
Overseas 91 ±3 36 ±5 18 to 24 Years Old 87 ±10 20 ±9 25 to 29 Years Old 93 ±4 34 ±9 30 to 34 Years Old 90 ±6 39 ±10 35 to 44 Years Old 93 ±5 43 ±9 45 Years Old or More 86 ±10 45 ±12
RACE/ETHNICITY Non-Hispanic White 78 ±2 20 ±3 Total Minority 73 ±3 27 ±4
GENDER Male 77 ±5 51 ±7 Female 76 ±2 19 ±2
PROXIMITY TO VOTING RESIDENCE Absent 91 ±2 26 ±3 Not Absent 57 ±3 15 ±3
VOTER REGISTRATION STATUS Registered to Vote 72 ±2 24 ±2 Not Registered to Vote 95 ±3 17 ±4
Note. Percent responding are active duty spouses who answered the question and who definitely voted by mail, e-mail/fax, or online in the November 2, 2010 election or who definitely did not vote (Q17). The Federal Voting Assistance Program (FVAP) Web site, www.fvap.gov, provides voting-related information and resources.

2010 Post-Election Voting Survey of Active Duty Military Spouses
56 DMDC
37. In preparation for the 2010 primaries and general election, did you visit this Web site?
1. Yes 2. No, but I was not aware of this service 3. No, and I was aware of this service
Percent
Responding Percentages Max
ME Percentage
Reporting Yes 1 2 3 TOTAL 76 ±2 4 78 18 ±2
Army 75 ±3 4 80 16 ±3 Navy 73 ±4 5 79 15 ±4 Marine Corps 79 ±5 3 84 14 ±5 Air Force 78 ±3 5 69 25 ±4 Coast Guard 72 ±4 3 86 11 ±4
MEMBER PAYGRADE Enlisted 77 ±2 4 79 17 ±3
E1 – E5 81 ±3 3 83 14 ±3 E6 – E9 70 ±3 5 72 22 ±4
Officers 73 ±3 6 75 19 ±3 W1 – W5 72 ±4 7 75 17 ±4 O1 – O3 73 ±5 5 80 15 ±5 O4 – O6 73 ±4 7 70 23 ±5
AGE 18 to 24 Years Old 81 ±4 1 88 10 ±4 25 to 29 Years Old 80 ±3 4 80 17 ±4 30 to 34 Years Old 76 ±4 7 75 18 ±5 35 to 44 Years Old 71 ±3 6 71 23 ±4 45 Years Old or More 62 ±6 6 69 25 ±7
LOCATION US (Incl. Territories) 75 ±2 4 80 16 ±2
18 to 24 Years Old 81 ±4 1 89 9 ±4 25 to 29 Years Old 79 ±4 3 81 16 ±4 30 to 34 Years Old 75 ±4 7 77 17 ±5 35 to 44 Years Old 69 ±4 5 73 22 ±4 45 Years Old or More 59 ±6 5 72 23 ±8
Overseas 91 ±3 9 64 27 ±5 18 to 24 Years Old 87 ±10 2 80 18 ±9 25 to 29 Years Old 93 ±4 12 66 22 ±9 30 to 34 Years Old 90 ±6 6 61 33 ±10 35 to 44 Years Old 93 ±5 12 57 31 ±9 45 Years Old or More 86 ±10 10 55 35 ±12
RACE/ETHNICITY Non-Hispanic White 78 ±2 4 80 16 ±3 Total Minority 73 ±3 5 73 21 ±4
GENDER Male 77 ±5 10 49 41 ±7 Female 76 ±2 4 81 15 ±2
PROXIMITY TO VOTING RESIDENCE Absent 91 ±2 6 74 20 ±3 Not Absent 57 ±3 2 85 13 ±3
VOTER REGISTRATION STATUS Registered to Vote 72 ±2 5 76 19 ±2 Not Registered to Vote 94 ±3 2 84 14 ±4
Note. Percent responding are active duty spouses who answered the question and who definitely voted by mail, e-mail/fax, or online in the November 2, 2010 election or who definitely did not vote (Q17). Spouses who indicated they were not aware of the FVAP Web site (Q36) are coded as "No, but I was not aware of this service."

2010 Post-Election Voting Survey of Active Duty Military Spouses
DMDC 57
38. In 2010, what is the MAIN REASON you did not visit the Federal Voting Assistance Program (FVAP) Web site?
1. I did not need any voting information or assistance.
2. I was not interested in voting. 3. I did not have Internet access.
4. I did not know the Web site address. 5. I received my voting assistance elsewhere.
6. I did not think it would be useful.
7. Some other reason.
Percent
Responding Percentages Max
ME 1 2 3 4 5 6 7 TOTAL 13 ±2 35 39 2 1 5 2 16 ±5
Army 12 ±2 24 44 3 2 4 2 19 ±9 Navy 11 ±3 40 32 1 NR 3 3 19 ±12 Marine Corps 11 ±4 32 39 NR NR 8 NR 15 ±16 Air Force 20 ±3 42 38 1 0 5 2 13 ±8 Coast Guard 8 ±3 41 47 NR NR 3 2 4 ±14
MEMBER PAYGRADE Enlisted 13 ±2 30 43 2 1 4 2 17 ±6
E1 – E5 11 ±2 25 49 0 2 3 2 19 ±9 E6 – E9 16 ±3 36 38 3 0 6 2 15 ±9
Officers 14 ±2 50 25 2 1 6 4 13 ±7 W1 – W5 12 ±3 35 33 NR 2 9 4 17 ±10 O1 – O3 11 ±3 39 27 NR NR 7 9 10 ±13 O4 – O6 16 ±3 59 22 0 1 4 1 14 ±10
AGE 18 to 24 Years Old 8 ±3 18 47 4 1 4 1 25 ±17 25 to 29 Years Old 14 ±3 18 47 3 4 6 4 19 ±10 30 to 34 Years Old 14 ±3 34 45 NR 0 4 1 14 ±11 35 to 44 Years Old 16 ±3 49 29 0 0 4 3 14 ±9 45 Years Old or More 15 ±4 62 23 0 1 3 1 9 ±14
LOCATION US (Incl. Territories) 12 ±2 36 39 1 1 5 2 15 ±6
18 to 24 Years Old 8 ±3 19 NR NR 1 NR NR NR ±16 25 to 29 Years Old 13 ±3 19 47 NR 4 6 4 18 ±12 30 to 34 Years Old 13 ±3 37 43 NR NR 4 2 12 ±12 35 to 44 Years Old 15 ±3 49 30 0 0 4 3 14 ±10 45 Years Old or More 13 ±4 67 21 0 NR 2 0 9 ±16
Overseas 25 ±4 30 37 4 1 5 3 20 ±9 18 to 24 Years Old 16 ±7 NR NR NR NR NR NR NR 25 to 29 Years Old 21 ±7 17 41 NR NR 7 NR 22 ±16 30 to 34 Years Old 30 ±9 20 NR NR NR NR NR 23 ±15 35 to 44 Years Old 29 ±8 NR 27 NR NR 5 4 15 ±16 45 Years Old or More 30 ±9 48 18 NR NR 10 4 12 ±15
RACE/ETHNICITY Non-Hispanic White 12 ±2 42 33 1 2 5 2 16 ±7 Total Minority 15 ±3 24 49 3 0 4 2 16 ±8
GENDER Male 32 ±6 37 39 2 0 3 4 15 ±11 Female 11 ±2 34 39 2 2 5 2 16 ±6
PROXIMITY TO VOTING RESIDENCE Absent 18 ±2 35 37 2 2 4 3 18 ±6 Not Absent 7 ±2 35 44 2 0 8 NR 9 ±11
VOTER REGISTRATION STATUS Registered to Vote 13 ±2 41 31 2 1 6 3 16 ±6 Not Registered to Vote 13 ±3 7 73 2 1 0 1 16 ±11
Note. Percent responding are active duty spouses who answered the question; who definitely voted by mail, e-mail/fax, or online in the November 2, 2010 election or who definitely did not vote (Q17); and who were aware of but did not visit the FVAP Web site (Q36/Q37). NR: Not reportable

2010 Post-Election Voting Survey of Active Duty Military Spouses
58 DMDC
39. Were you aware the Voting Assistance Guide (VAG) was available to you?
Percent
Responding Percentages Max
ME Percentage
Reporting Yes Yes TOTAL 76 ±2 14 ±2
Army 75 ±3 14 ±3 Navy 73 ±4 12 ±4 Marine Corps 78 ±5 9 ±4 Air Force 78 ±3 20 ±4 Coast Guard 72 ±4 12 ±4
MEMBER PAYGRADE Enlisted 77 ±2 13 ±2
E1 – E5 81 ±3 11 ±3 E6 – E9 70 ±3 17 ±4
Officers 73 ±3 19 ±3 W1 – W5 71 ±4 19 ±4 O1 – O3 73 ±5 12 ±4 O4 – O6 72 ±4 24 ±5
AGE 18 to 24 Years Old 81 ±4 7 ±3 25 to 29 Years Old 81 ±3 11 ±3 30 to 34 Years Old 76 ±4 15 ±4 35 to 44 Years Old 71 ±3 20 ±4 45 Years Old or More 61 ±6 24 ±6
LOCATION US (Incl. Territories) 74 ±2 13 ±2
18 to 24 Years Old 80 ±4 7 ±4 25 to 29 Years Old 79 ±4 10 ±4 30 to 34 Years Old 75 ±4 15 ±4 35 to 44 Years Old 69 ±4 20 ±4 45 Years Old or More 59 ±6 23 ±7
Overseas 90 ±3 20 ±4 18 to 24 Years Old 86 ±10 10 ±7 25 to 29 Years Old 92 ±5 19 ±8 30 to 34 Years Old 89 ±6 18 ±8 35 to 44 Years Old 93 ±5 23 ±7 45 Years Old or More 84 ±10 31 ±10
RACE/ETHNICITY Non-Hispanic White 78 ±2 13 ±2 Total Minority 72 ±3 16 ±3
GENDER Male 76 ±5 34 ±7 Female 76 ±2 12 ±2
PROXIMITY TO VOTING RESIDENCE Absent 91 ±2 17 ±2 Not Absent 57 ±3 9 ±3
VOTER REGISTRATION STATUS Registered to Vote 72 ±2 15 ±2 Not Registered to Vote 94 ±3 11 ±3
Note. Percent responding are active duty spouses who answered the question and who definitely voted by mail, e-mail/fax, or online in the November 2, 2010 election or who definitely did not vote (Q17). The Department of Defense 2010-11 VAG provides state-by-state information about registering to vote and requesting an absentee ballot.
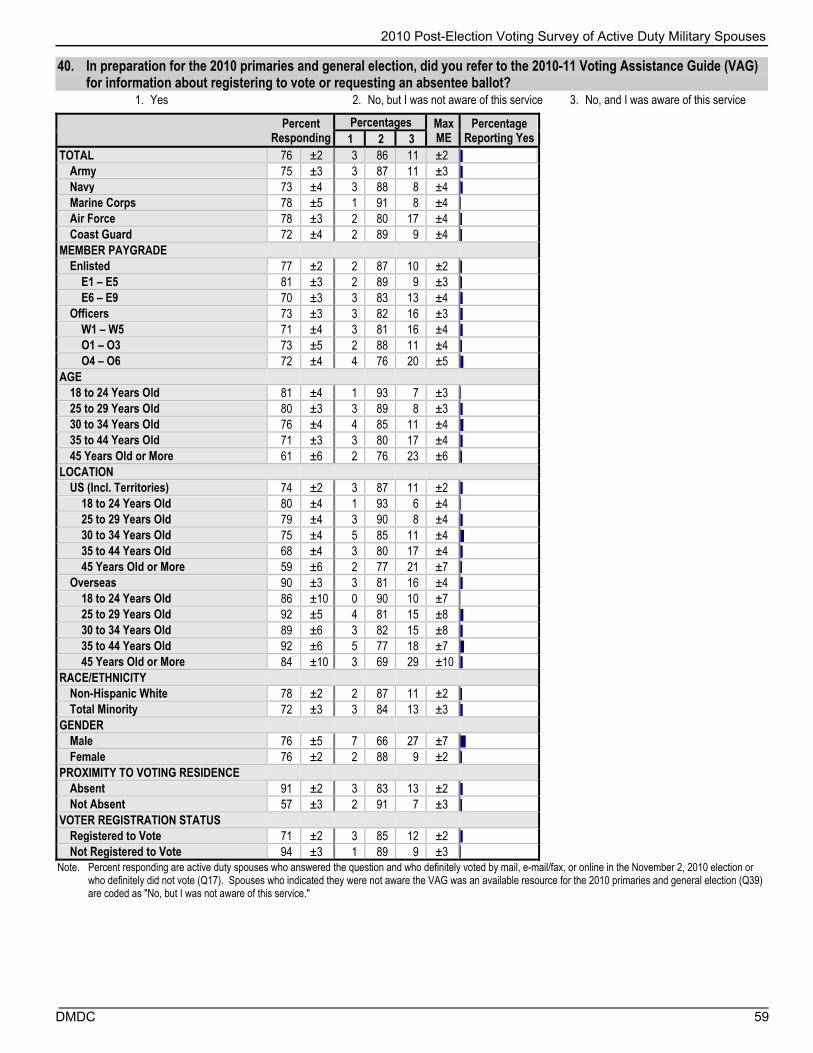
2010 Post-Election Voting Survey of Active Duty Military Spouses
DMDC 59
40. In preparation for the 2010 primaries and general election, did you refer to the 2010-11 Voting Assistance Guide (VAG) for information about registering to vote or requesting an absentee ballot?
1. Yes 2. No, but I was not aware of this service 3. No, and I was aware of this service
Percent Responding
Percentages Max ME
Percentage Reporting Yes 1 2 3
TOTAL 76 ±2 3 86 11 ±2 Army 75 ±3 3 87 11 ±3 Navy 73 ±4 3 88 8 ±4 Marine Corps 78 ±5 1 91 8 ±4 Air Force 78 ±3 2 80 17 ±4 Coast Guard 72 ±4 2 89 9 ±4
MEMBER PAYGRADE Enlisted 77 ±2 2 87 10 ±2
E1 – E5 81 ±3 2 89 9 ±3 E6 – E9 70 ±3 3 83 13 ±4
Officers 73 ±3 3 82 16 ±3 W1 – W5 71 ±4 3 81 16 ±4 O1 – O3 73 ±5 2 88 11 ±4 O4 – O6 72 ±4 4 76 20 ±5
AGE 18 to 24 Years Old 81 ±4 1 93 7 ±3 25 to 29 Years Old 80 ±3 3 89 8 ±3 30 to 34 Years Old 76 ±4 4 85 11 ±4 35 to 44 Years Old 71 ±3 3 80 17 ±4 45 Years Old or More 61 ±6 2 76 23 ±6
LOCATION US (Incl. Territories) 74 ±2 3 87 11 ±2
18 to 24 Years Old 80 ±4 1 93 6 ±4 25 to 29 Years Old 79 ±4 3 90 8 ±4 30 to 34 Years Old 75 ±4 5 85 11 ±4 35 to 44 Years Old 68 ±4 3 80 17 ±4 45 Years Old or More 59 ±6 2 77 21 ±7
Overseas 90 ±3 3 81 16 ±4 18 to 24 Years Old 86 ±10 0 90 10 ±7 25 to 29 Years Old 92 ±5 4 81 15 ±8 30 to 34 Years Old 89 ±6 3 82 15 ±8 35 to 44 Years Old 92 ±6 5 77 18 ±7 45 Years Old or More 84 ±10 3 69 29 ±10
RACE/ETHNICITY Non-Hispanic White 78 ±2 2 87 11 ±2 Total Minority 72 ±3 3 84 13 ±3
GENDER Male 76 ±5 7 66 27 ±7 Female 76 ±2 2 88 9 ±2
PROXIMITY TO VOTING RESIDENCE Absent 91 ±2 3 83 13 ±2 Not Absent 57 ±3 2 91 7 ±3
VOTER REGISTRATION STATUS Registered to Vote 71 ±2 3 85 12 ±2 Not Registered to Vote 94 ±3 1 89 9 ±3
Note. Percent responding are active duty spouses who answered the question and who definitely voted by mail, e-mail/fax, or online in the November 2, 2010 election or who definitely did not vote (Q17). Spouses who indicated they were not aware the VAG was an available resource for the 2010 primaries and general election (Q39) are coded as "No, but I was not aware of this service."

2010 Post-Election Voting Survey of Active Duty Military Spouses
60 DMDC
41. In 2010, what is the MAIN REASON you did not use the 2010-11 Voting Assistance Guide (VAG)?
1. I did not need any voting information or assistance.
2. I was not interested in voting. 3. I could not get a copy.
4. I received my voting assistance elsewhere.
5. Some other reason.
Percent
Responding Percentages Max
ME 1 2 3 4 5 TOTAL 9 ±1 38 42 1 6 13 ±6
Army 8 ±2 35 44 2 6 13 ±11 Navy 6 ±2 37 37 2 4 20 ±16 Marine Corps 6 ±3 27 NR NR NR NR ±18 Air Force 13 ±3 44 40 0 6 9 ±10 Coast Guard 7 ±2 43 40 0 5 12 ±15
MEMBER PAYGRADE Enlisted 8 ±2 34 47 1 6 13 ±8
E1 – E5 7 ±2 29 55 0 5 11 ±11 E6 – E9 9 ±2 39 38 2 6 15 ±11
Officers 11 ±2 50 29 0 8 12 ±8 W1 – W5 11 ±3 35 40 NR 10 15 ±11 O1 – O3 8 ±3 35 39 NR 14 13 ±16 O4 – O6 14 ±3 61 21 1 5 11 ±11
AGE 18 to 24 Years Old 5 ±2 NR NR NR NR NR 25 to 29 Years Old 7 ±2 21 59 NR 5 13 ±14 30 to 34 Years Old 8 ±3 38 45 1 5 12 ±14 35 to 44 Years Old 12 ±3 51 30 1 7 11 ±10 45 Years Old or More 14 ±4 52 24 2 12 10 ±14
LOCATION US (Incl. Territories) 8 ±2 39 42 1 6 12 ±7
18 to 24 Years Old 5 ±3 NR NR NR NR NR 25 to 29 Years Old 6 ±2 19 62 NR NR 11 ±17 30 to 34 Years Old 8 ±3 40 45 NR 2 13 ±15 35 to 44 Years Old 12 ±3 51 31 0 7 10 ±11 45 Years Old or More 13 ±4 55 21 1 13 10 ±16
Overseas 14 ±3 35 37 3 7 18 ±10 18 to 24 Years Old 9 ±5 NR NR NR NR NR 25 to 29 Years Old 14 ±6 NR NR NR NR 21 ±18 30 to 34 Years Old 14 ±6 NR NR NR NR NR 35 to 44 Years Old 17 ±6 NR 24 NR 5 18 ±16 45 Years Old or More 24 ±8 NR 26 NR 6 11 ±17
RACE/ETHNICITY Non-Hispanic White 8 ±2 45 37 1 6 12 ±8 Total Minority 10 ±2 28 49 1 7 14 ±10
GENDER Male 21 ±5 44 42 0 4 11 ±13 Female 7 ±1 36 42 1 7 13 ±7
PROXIMITY TO VOTING RESIDENCE Absent 12 ±2 42 37 1 7 14 ±7 Not Absent 4 ±2 27 58 0 6 9 ±14
VOTER REGISTRATION STATUS Registered to Vote 9 ±2 46 33 1 7 12 ±7 Not Registered to Vote 9 ±3 6 75 1 2 16 ±14
Note. Percent responding are active duty spouses who answered the question; who definitely voted by mail, e-mail/fax, or online in the November 2, 2010 election or who definitely did not vote (Q17); and who were aware of but did not refer to the VAG (Q39/Q40). NR: Not reportable

2010 Post-Election Voting Survey of Active Duty Military Spouses
DMDC 61
42. Were you aware of the Federal Voting Assistance Program (FVAP) toll-free telephone service?
Percent
Responding Percentages Max
ME Percentage
Reporting Yes Yes TOTAL 76 ±2 8 ±2
Army 75 ±3 8 ±2 Navy 73 ±4 8 ±3 Marine Corps 78 ±5 3 ±2 Air Force 78 ±3 13 ±3 Coast Guard 72 ±4 6 ±3
MEMBER PAYGRADE Enlisted 77 ±2 8 ±2
E1 – E5 81 ±3 7 ±2 E6 – E9 70 ±3 10 ±3
Officers 73 ±3 9 ±2 W1 – W5 71 ±4 12 ±4 O1 – O3 74 ±4 7 ±3 O4 – O6 72 ±4 10 ±4
AGE 18 to 24 Years Old 81 ±4 4 ±3 25 to 29 Years Old 80 ±3 8 ±3 30 to 34 Years Old 76 ±4 7 ±3 35 to 44 Years Old 71 ±3 12 ±3 45 Years Old or More 61 ±6 15 ±6
LOCATION US (Incl. Territories) 74 ±2 8 ±2
18 to 24 Years Old 81 ±4 4 ±3 25 to 29 Years Old 79 ±4 8 ±3 30 to 34 Years Old 75 ±4 7 ±3 35 to 44 Years Old 68 ±4 11 ±3 45 Years Old or More 59 ±6 14 ±6
Overseas 90 ±3 12 ±3 18 to 24 Years Old 86 ±10 5 ±6 25 to 29 Years Old 92 ±4 10 ±6 30 to 34 Years Old 89 ±6 15 ±9 35 to 44 Years Old 92 ±5 14 ±7 45 Years Old or More 85 ±10 16 ±8
RACE/ETHNICITY Non-Hispanic White 78 ±2 7 ±2 Total Minority 72 ±3 10 ±3
GENDER Male 76 ±5 22 ±6 Female 76 ±2 7 ±2
PROXIMITY TO VOTING RESIDENCE Absent 91 ±2 10 ±2 Not Absent 57 ±3 5 ±2
VOTER REGISTRATION STATUS Registered to Vote 71 ±2 9 ±2 Not Registered to Vote 94 ±3 6 ±3
Note. Percent responding are active duty spouses who answered the question and who definitely voted by mail, e-mail/fax, or online in the November 2, 2010 election or who definitely did not vote (Q17). The Federal Voting Assistance Program (FVAP) provides a toll-free telephone service from many countries that allows a caller to ask FVAP staff for voting information or assistance.

2010 Post-Election Voting Survey of Active Duty Military Spouses
62 DMDC
43. Did you use the Federal Voting Assistance Program (FVAP) toll-free telephone service to talk with a FVAP staff member in 2010?
1. Yes 2. No, but I was not aware of this service 3. No, and I was aware of this service
Percent Responding
Percentages Max ME
Percentage Reporting Yes 1 2 3
TOTAL 76 ±2 0 92 8 ±2 Army 75 ±3 0 92 8 ±2 Navy 73 ±4 1 92 7 ±3 Marine Corps 78 ±5 0 97 3 ±2 Air Force 78 ±3 0 87 12 ±3 Coast Guard 71 ±4 0 94 6 ±3
MEMBER PAYGRADE Enlisted 77 ±2 0 92 8 ±2
E1 – E5 81 ±3 0 93 7 ±2 E6 – E9 70 ±3 0 90 10 ±3
Officers 73 ±3 1 91 8 ±2 W1 – W5 71 ±4 1 88 11 ±4 O1 – O3 74 ±4 1 93 6 ±3 O4 – O6 72 ±4 0 90 10 ±4
AGE 18 to 24 Years Old 81 ±4 0 96 4 ±3 25 to 29 Years Old 80 ±3 0 92 8 ±3 30 to 34 Years Old 76 ±4 1 93 7 ±3 35 to 44 Years Old 71 ±3 0 88 12 ±3 45 Years Old or More 61 ±6 0 85 15 ±6
LOCATION US (Incl. Territories) 74 ±2 0 92 8 ±2
18 to 24 Years Old 81 ±4 0 96 4 ±3 25 to 29 Years Old 79 ±4 0 92 8 ±3 30 to 34 Years Old 75 ±4 1 93 6 ±3 35 to 44 Years Old 68 ±4 0 89 11 ±3 45 Years Old or More 59 ±6 0 86 14 ±6
Overseas 90 ±3 1 88 11 ±3 18 to 24 Years Old 86 ±10 0 95 5 ±6 25 to 29 Years Old 92 ±4 1 90 8 ±6 30 to 34 Years Old 88 ±6 0 86 14 ±9 35 to 44 Years Old 92 ±5 0 86 14 ±7 45 Years Old or More 85 ±10 0 84 15 ±8
RACE/ETHNICITY Non-Hispanic White 78 ±2 0 93 7 ±2 Total Minority 72 ±3 0 90 10 ±3
GENDER Male 76 ±5 0 78 21 ±6 Female 76 ±2 0 93 6 ±2
PROXIMITY TO VOTING RESIDENCE Absent 91 ±2 1 90 10 ±2 Not Absent 57 ±3 0 95 5 ±2
VOTER REGISTRATION STATUS Registered to Vote 71 ±2 0 91 9 ±2 Not Registered to Vote 94 ±3 0 94 6 ±3
Note. Percent responding are active duty spouses who answered the question and who definitely voted by mail, e-mail/fax, or online in the November 2, 2010 election or who definitely did not vote (Q17). Spouses who indicated they were not aware of the FVAP toll-free telephone service (Q42) are coded as "No, but I was not aware of this service."

2010 Post-Election Voting Survey of Active Duty Military Spouses
DMDC 63
44. In 2010, what is the MAIN REASON you did not use the Federal Voting Assistance Program's (FVAP) toll-free telephone service?
1. I did not need any voting information or assistance.
2. I was not interested in voting. 3. I did not know what it was for.
4. I did not know the telephone number. 5. I received my voting assistance elsewhere.
6. I could not get through.
7. A toll-free number is not available in the country where I live.
8. The time difference made it difficult to reach the Federal Voting Assistance Program (FVAP) during office hours.
9. Some other reason.
Percent Responding
Percentages Max ME 1 2 3 4 5 6 7 8 9
TOTAL 6 ±1 42 42 2 1 4 0º 0 2 7 ±8 Army 6 ±2 39 47 NR 1 1 0º 0 2 9 ±13 Navy 5 ±2 NR 24 4 NR 2 0º NR NR NR ±17 Marine Corps 2 ±1 NR NR NR 1 NR 0º NR NR 3 ±10 Air Force 10 ±3 40 47 NR NR 6 0º 0 1 4 ±12 Coast Guard 4 ±2 NR NR NR NR NR 0º NR NR NR ±0
MEMBER PAYGRADE Enlisted 6 ±2 39 44 2 2 4 0º 0 2 8 ±9
E1 – E5 6 ±2 32 54 NR 2 3 0º 0 3 6 ±12 E6 – E9 7 ±2 48 32 4 NR 4 0º 0 NR 9 ±13
Officers 6 ±2 54 35 0 1 6 0º 0 0 4 ±11 W1 – W5 8 ±2 49 33 NR 4 5 0º NR NR 8 ±13 O1 – O3 4 ±2 31 NR 1 NR NR 0º NR NR NR ±18 O4 – O6 7 ±3 69 24 NR NR 5 0º NR 0 2 ±16
AGE 18 to 24 Years Old 3 ±2 NR NR NR NR NR 0º NR 2 NR ±6 25 to 29 Years Old 6 ±2 17 61 NR NR 2 0º NR NR 11 ±15 30 to 34 Years Old 5 ±2 NR NR 0 1 NR 0º NR NR 1 ±7 35 to 44 Years Old 8 ±2 52 30 2 1 3 0º 1 0 10 ±12 45 Years Old or More 9 ±3 NR NR 0 0 4 0º NR NR 2 ±7
LOCATION US (Incl. Territories) 6 ±1 42 43 2 1 4 0º 0 1 6 ±9
18 to 24 Years Old 3 ±2 NR NR NR NR NR 0º NR NR NR ±0 25 to 29 Years Old 6 ±2 17 63 NR NR 2 0º NR NR 11 ±17 30 to 34 Years Old 4 ±2 NR NR NR NR NR 0º NR NR 1 ±4 35 to 44 Years Old 8 ±2 52 32 NR NR 3 0º NR NR 9 ±13 45 Years Old or More 8 ±4 NR NR 0 0 3 0º NR NR 2 ±9
Overseas 10 ±3 43 34 2 2 2 0º 2 4 11 ±14 18 to 24 Years Old 4 ±4 NR NR NR NR NR 0º NR NR NR ±0 25 to 29 Years Old 8 ±4 NR NR NR NR NR 0º NR NR NR ±0 30 to 34 Years Old 12 ±7 NR NR NR NR NR 0º NR NR NR ±0 35 to 44 Years Old 13 ±5 NR 17 NR NR 1 0º NR NR NR ±17 45 Years Old or More 13 ±6 NR NR NR NR NR 0º NR 3 4 ±8
RACE/ETHNICITY Non-Hispanic White 6 ±2 48 41 1 1 3 0º 0 1 4 ±10 Total Minority 7 ±2 34 45 2 1 4 0º 0 3 11 ±11
GENDER Male 16 ±5 49 42 NR 0 4 0º NR 2 4 ±15 Female 5 ±1 39 43 2 2 4 0º 0 2 8 ±9
PROXIMITY TO VOTING RESIDENCE Absent 9 ±2 43 39 2 2 4 0º 0 2 7 ±8 Not Absent 3 ±1 35 NR NR NR NR 0º NR NR 9 ±17
VOTER REGISTRATION STATUS Registered to Vote 6 ±1 48 38 0 2 5 0º 0 2 6 ±8 Not Registered to Vote 6 ±2 NR NR NR NR 1 0º NR 1 12 ±16
Note. Percent responding are active duty spouses who answered the question; who definitely voted by mail, e-mail/fax, or online in the November 2, 2010 election or who definitely did not vote (Q17); and who were aware of, but who did not use the FVAP toll-free telephone service (Q42/Q43). NR: Not reportable º Response option never endorsed.

2010 Post-Election Voting Survey of Active Duty Military Spouses
64 DMDC
45. In preparation for the 2010 primaries and general election, did you visit the Federal Voting Assistance Program (FVAP) on Twitter, Facebook, and/or LinkedIn?
a. Twitter
1. Yes 2. No, and I do not use this social networking site.
3. No, but I use this social networking site.
Percent
Responding Percentages Max
ME 1 2 3 TOTAL 72 ±2 0 85 15 ±2
Army 71 ±3 0 83 16 ±4 Navy 70 ±4 0 86 14 ±4 Marine Corps 74 ±5 0 85 15 ±6 Air Force 75 ±3 0 87 13 ±3 Coast Guard 67 ±4 0 89 11 ±4
MEMBER PAYGRADE Enlisted 72 ±2 0 84 16 ±3
E1 – E5 76 ±3 0 82 18 ±3 E6 – E9 66 ±4 0 87 13 ±3
Officers 71 ±3 0 90 10 ±3 W1 – W5 68 ±4 0 89 11 ±4 O1 – O3 71 ±5 0 88 12 ±4 O4 – O6 71 ±4 0 92 7 ±3
AGE 18 to 24 Years Old 76 ±4 0 81 19 ±5 25 to 29 Years Old 76 ±4 0 84 15 ±4 30 to 34 Years Old 72 ±4 0 87 13 ±4 35 to 44 Years Old 68 ±4 0 86 13 ±4 45 Years Old or More 58 ±6 0 94 6 ±4
LOCATION US (Incl. Territories) 71 ±2 0 85 15 ±2
18 to 24 Years Old 76 ±5 0 81 19 ±5 25 to 29 Years Old 75 ±4 0 85 15 ±4 30 to 34 Years Old 71 ±4 0 87 13 ±4 35 to 44 Years Old 66 ±4 0 86 14 ±4 45 Years Old or More 56 ±6 0 94 6 ±5
Overseas 86 ±3 0 86 13 ±4 18 to 24 Years Old 82 ±10 1 88 12 ±7 25 to 29 Years Old 88 ±5 0 82 18 ±10 30 to 34 Years Old 86 ±6 0 85 15 ±10 35 to 44 Years Old 88 ±6 0 89 10 ±7 45 Years Old or More 81 ±10 0 94 6 ±6
RACE/ETHNICITY Non-Hispanic White 75 ±2 0 87 13 ±2 Total Minority 67 ±3 0 82 17 ±4
GENDER Male 73 ±5 1 82 17 ±6 Female 72 ±2 0 86 14 ±2
PROXIMITY TO VOTING RESIDENCE Absent 87 ±2 0 85 15 ±3 Not Absent 53 ±3 0 86 14 ±4
VOTER REGISTRATION STATUS Registered to Vote 68 ±2 0 85 15 ±2 Not Registered to Vote 87 ±3 0 87 13 ±4
Note. Percent responding are active duty spouses who answered the question and who definitely voted by mail, e-mail/fax, or online in the November 2, 2010 election or who definitely did not vote (Q17).
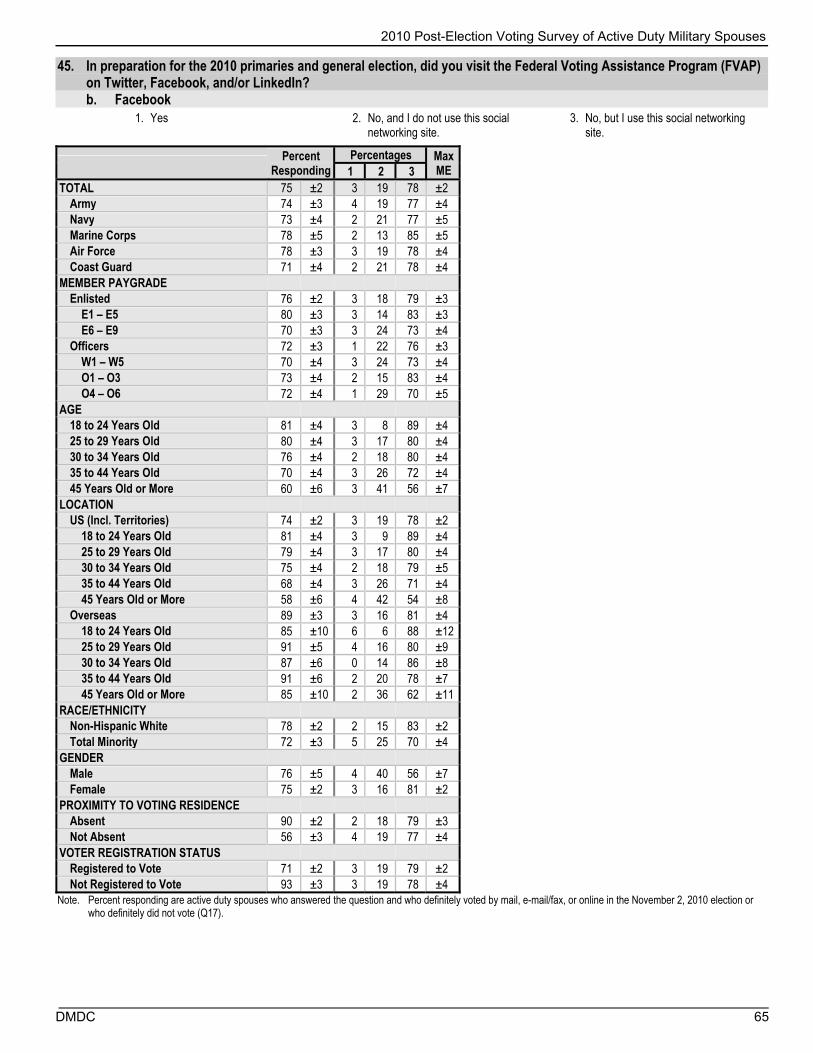
2010 Post-Election Voting Survey of Active Duty Military Spouses
DMDC 65
45. In preparation for the 2010 primaries and general election, did you visit the Federal Voting Assistance Program (FVAP) on Twitter, Facebook, and/or LinkedIn?
b. Facebook
1. Yes 2. No, and I do not use this social networking site.
3. No, but I use this social networking site.
Percent
Responding Percentages Max
ME 1 2 3 TOTAL 75 ±2 3 19 78 ±2
Army 74 ±3 4 19 77 ±4 Navy 73 ±4 2 21 77 ±5 Marine Corps 78 ±5 2 13 85 ±5 Air Force 78 ±3 3 19 78 ±4 Coast Guard 71 ±4 2 21 78 ±4
MEMBER PAYGRADE Enlisted 76 ±2 3 18 79 ±3
E1 – E5 80 ±3 3 14 83 ±3 E6 – E9 70 ±3 3 24 73 ±4
Officers 72 ±3 1 22 76 ±3 W1 – W5 70 ±4 3 24 73 ±4 O1 – O3 73 ±4 2 15 83 ±4 O4 – O6 72 ±4 1 29 70 ±5
AGE 18 to 24 Years Old 81 ±4 3 8 89 ±4 25 to 29 Years Old 80 ±4 3 17 80 ±4 30 to 34 Years Old 76 ±4 2 18 80 ±4 35 to 44 Years Old 70 ±4 3 26 72 ±4 45 Years Old or More 60 ±6 3 41 56 ±7
LOCATION US (Incl. Territories) 74 ±2 3 19 78 ±2
18 to 24 Years Old 81 ±4 3 9 89 ±4 25 to 29 Years Old 79 ±4 3 17 80 ±4 30 to 34 Years Old 75 ±4 2 18 79 ±5 35 to 44 Years Old 68 ±4 3 26 71 ±4 45 Years Old or More 58 ±6 4 42 54 ±8
Overseas 89 ±3 3 16 81 ±4 18 to 24 Years Old 85 ±10 6 6 88 ±12 25 to 29 Years Old 91 ±5 4 16 80 ±9 30 to 34 Years Old 87 ±6 0 14 86 ±8 35 to 44 Years Old 91 ±6 2 20 78 ±7 45 Years Old or More 85 ±10 2 36 62 ±11
RACE/ETHNICITY Non-Hispanic White 78 ±2 2 15 83 ±2 Total Minority 72 ±3 5 25 70 ±4
GENDER Male 76 ±5 4 40 56 ±7 Female 75 ±2 3 16 81 ±2
PROXIMITY TO VOTING RESIDENCE Absent 90 ±2 2 18 79 ±3 Not Absent 56 ±3 4 19 77 ±4
VOTER REGISTRATION STATUS Registered to Vote 71 ±2 3 19 79 ±2 Not Registered to Vote 93 ±3 3 19 78 ±4
Note. Percent responding are active duty spouses who answered the question and who definitely voted by mail, e-mail/fax, or online in the November 2, 2010 election or who definitely did not vote (Q17).

2010 Post-Election Voting Survey of Active Duty Military Spouses
66 DMDC
45. In preparation for the 2010 primaries and general election, did you visit the Federal Voting Assistance Program (FVAP) on Twitter, Facebook, and/or LinkedIn?
c. LinkedIn
1. Yes 2. No, and I do not use this social networking site.
3. No, but I use this social networking site.
Percent
Responding Percentages Max
ME 1 2 3 TOTAL 72 ±2 0 88 12 ±2
Army 70 ±3 0 88 12 ±3 Navy 71 ±4 0 86 14 ±4 Marine Corps 73 ±5 0 89 11 ±5 Air Force 75 ±3 1 90 10 ±3 Coast Guard 67 ±4 0 86 13 ±4
MEMBER PAYGRADE Enlisted 72 ±2 0 89 11 ±2
E1 – E5 76 ±3 0 89 11 ±3 E6 – E9 66 ±4 1 88 12 ±3
Officers 71 ±3 0 86 14 ±3 W1 – W5 67 ±4 0 90 10 ±3 O1 – O3 71 ±5 0 84 16 ±5 O4 – O6 71 ±4 0 88 12 ±4
AGE 18 to 24 Years Old 76 ±4 0 90 10 ±4 25 to 29 Years Old 77 ±4 0 88 11 ±4 30 to 34 Years Old 71 ±4 0 86 14 ±4 35 to 44 Years Old 68 ±4 0 87 13 ±3 45 Years Old or More 58 ±6 1 89 11 ±5
LOCATION US (Incl. Territories) 71 ±2 0 88 12 ±2
18 to 24 Years Old 75 ±5 0 90 10 ±4 25 to 29 Years Old 76 ±4 0 89 11 ±4 30 to 34 Years Old 70 ±4 0 87 13 ±4 35 to 44 Years Old 66 ±4 0 86 13 ±4 45 Years Old or More 56 ±6 1 88 11 ±6
Overseas 85 ±3 1 87 12 ±4 18 to 24 Years Old 82 ±10 0 91 9 ±7 25 to 29 Years Old 87 ±5 NR 81 16 ±11 30 to 34 Years Old 84 ±7 0 83 17 ±10 35 to 44 Years Old 87 ±6 0 92 7 ±5 45 Years Old or More 81 ±10 1 92 8 ±6
RACE/ETHNICITY Non-Hispanic White 75 ±2 0 89 11 ±2 Total Minority 66 ±3 1 87 13 ±3
GENDER Male 73 ±5 2 84 14 ±6 Female 72 ±2 0 89 11 ±2
PROXIMITY TO VOTING RESIDENCE Absent 86 ±2 0 88 11 ±2 Not Absent 53 ±3 0 88 12 ±3
VOTER REGISTRATION STATUS Registered to Vote 68 ±2 0 87 13 ±2 Not Registered to Vote 86 ±3 0 91 8 ±4
Note. Percent responding are active duty spouses who answered the question and who definitely voted by mail, e-mail/fax, or online in the November 2, 2010 election or who definitely did not vote (Q17). NR: Not reportable
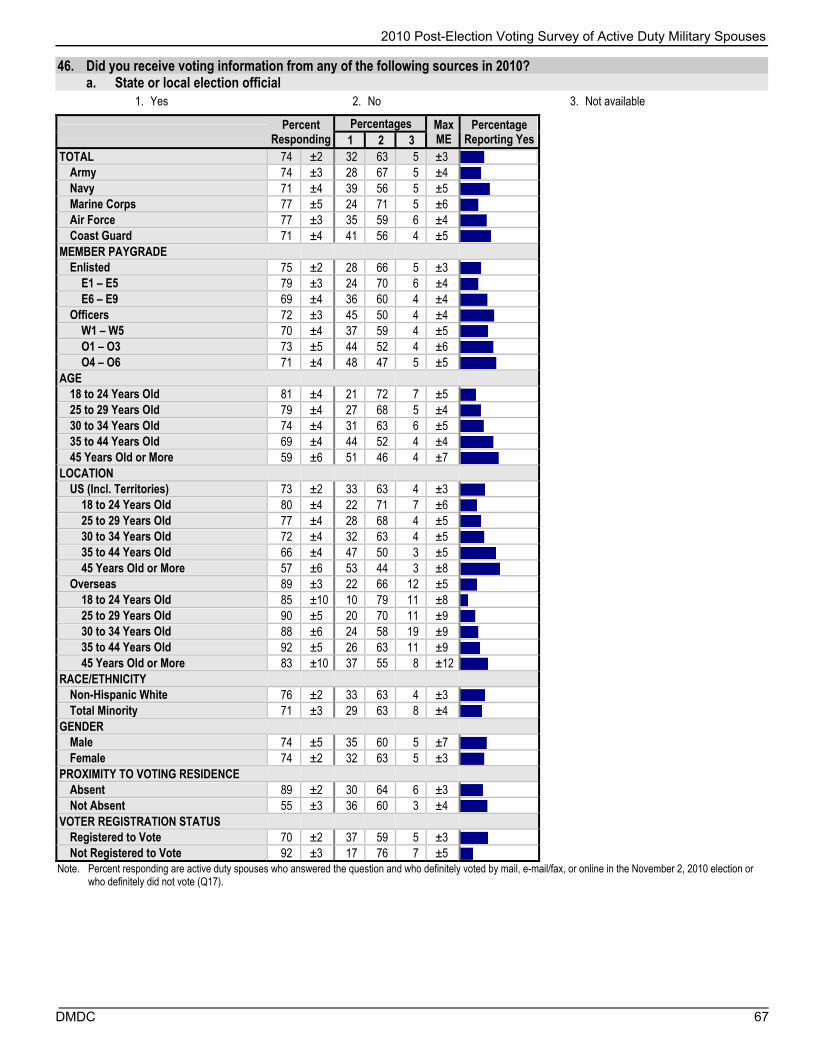
2010 Post-Election Voting Survey of Active Duty Military Spouses
DMDC 67
46. Did you receive voting information from any of the following sources in 2010? a. State or local election official
1. Yes 2. No 3. Not available
Percent
Responding Percentages Max
ME Percentage
Reporting Yes 1 2 3 TOTAL 74 ±2 32 63 5 ±3
Army 74 ±3 28 67 5 ±4 Navy 71 ±4 39 56 5 ±5 Marine Corps 77 ±5 24 71 5 ±6 Air Force 77 ±3 35 59 6 ±4 Coast Guard 71 ±4 41 56 4 ±5
MEMBER PAYGRADE Enlisted 75 ±2 28 66 5 ±3
E1 – E5 79 ±3 24 70 6 ±4 E6 – E9 69 ±4 36 60 4 ±4
Officers 72 ±3 45 50 4 ±4 W1 – W5 70 ±4 37 59 4 ±5 O1 – O3 73 ±5 44 52 4 ±6 O4 – O6 71 ±4 48 47 5 ±5
AGE 18 to 24 Years Old 81 ±4 21 72 7 ±5 25 to 29 Years Old 79 ±4 27 68 5 ±4 30 to 34 Years Old 74 ±4 31 63 6 ±5 35 to 44 Years Old 69 ±4 44 52 4 ±4 45 Years Old or More 59 ±6 51 46 4 ±7
LOCATION US (Incl. Territories) 73 ±2 33 63 4 ±3
18 to 24 Years Old 80 ±4 22 71 7 ±6 25 to 29 Years Old 77 ±4 28 68 4 ±5 30 to 34 Years Old 72 ±4 32 63 4 ±5 35 to 44 Years Old 66 ±4 47 50 3 ±5 45 Years Old or More 57 ±6 53 44 3 ±8
Overseas 89 ±3 22 66 12 ±5 18 to 24 Years Old 85 ±10 10 79 11 ±8 25 to 29 Years Old 90 ±5 20 70 11 ±9 30 to 34 Years Old 88 ±6 24 58 19 ±9 35 to 44 Years Old 92 ±5 26 63 11 ±9 45 Years Old or More 83 ±10 37 55 8 ±12
RACE/ETHNICITY Non-Hispanic White 76 ±2 33 63 4 ±3 Total Minority 71 ±3 29 63 8 ±4
GENDER Male 74 ±5 35 60 5 ±7 Female 74 ±2 32 63 5 ±3
PROXIMITY TO VOTING RESIDENCE Absent 89 ±2 30 64 6 ±3 Not Absent 55 ±3 36 60 3 ±4
VOTER REGISTRATION STATUS Registered to Vote 70 ±2 37 59 5 ±3 Not Registered to Vote 92 ±3 17 76 7 ±5
Note. Percent responding are active duty spouses who answered the question and who definitely voted by mail, e-mail/fax, or online in the November 2, 2010 election or who definitely did not vote (Q17).

2010 Post-Election Voting Survey of Active Duty Military Spouses
68 DMDC
46. Did you receive voting information from any of the following sources in 2010? b. Local television, radio, or print media
1. Yes 2. No 3. Not available
Percent
Responding Percentages Max
ME Percentage
Reporting Yes 1 2 3 TOTAL 74 ±2 47 47 6 ±3
Army 74 ±3 46 47 6 ±4 Navy 71 ±4 52 42 6 ±5 Marine Corps 76 ±5 46 48 6 ±6 Air Force 76 ±3 43 50 8 ±4 Coast Guard 71 ±4 55 43 3 ±5
MEMBER PAYGRADE Enlisted 75 ±2 46 48 6 ±3
E1 – E5 79 ±3 44 49 7 ±4 E6 – E9 68 ±4 49 45 6 ±4
Officers 71 ±3 51 43 7 ±4 W1 – W5 69 ±4 50 45 5 ±5 O1 – O3 73 ±5 52 43 5 ±6 O4 – O6 70 ±4 49 42 9 ±5
AGE 18 to 24 Years Old 81 ±4 43 50 7 ±6 25 to 29 Years Old 78 ±4 46 48 6 ±5 30 to 34 Years Old 73 ±4 45 49 6 ±5 35 to 44 Years Old 69 ±4 52 41 7 ±4 45 Years Old or More 59 ±6 54 42 4 ±7
LOCATION US (Incl. Territories) 73 ±2 50 45 5 ±3
18 to 24 Years Old 80 ±4 45 48 7 ±6 25 to 29 Years Old 77 ±4 49 46 4 ±5 30 to 34 Years Old 72 ±4 48 48 4 ±5 35 to 44 Years Old 66 ±4 57 38 5 ±5 45 Years Old or More 56 ±6 56 41 3 ±8
Overseas 88 ±3 19 62 19 ±5 18 to 24 Years Old 84 ±10 15 72 13 ±10 25 to 29 Years Old 88 ±6 20 63 17 ±10 30 to 34 Years Old 88 ±6 17 60 24 ±10 35 to 44 Years Old 91 ±6 20 61 19 ±9 45 Years Old or More 83 ±10 28 54 17 ±16
RACE/ETHNICITY Non-Hispanic White 76 ±2 48 46 6 ±3 Total Minority 71 ±3 44 48 8 ±4
GENDER Male 73 ±5 43 49 8 ±7 Female 74 ±2 47 47 6 ±3
PROXIMITY TO VOTING RESIDENCE Absent 88 ±2 40 52 8 ±3 Not Absent 55 ±3 61 36 3 ±4
VOTER REGISTRATION STATUS Registered to Vote 69 ±2 48 46 6 ±3 Not Registered to Vote 92 ±3 43 51 6 ±5
Note. Percent responding are active duty spouses who answered the question and who definitely voted by mail, e-mail/fax, or online in the November 2, 2010 election or who definitely did not vote (Q17).

2010 Post-Election Voting Survey of Active Duty Military Spouses
DMDC 69
46. Did you receive voting information from any of the following sources in 2010? c. Armed Forces Radio/TV
1. Yes 2. No 3. Not available
Percent
Responding Percentages Max
ME Percentage
Reporting Yes 1 2 3 TOTAL 74 ±2 11 76 14 ±2
Army 73 ±3 11 77 12 ±4 Navy 70 ±4 9 77 14 ±5 Marine Corps 76 ±5 8 81 12 ±5 Air Force 76 ±3 13 70 17 ±4 Coast Guard 70 ±4 4 82 14 ±4
MEMBER PAYGRADE Enlisted 74 ±2 11 76 13 ±3
E1 – E5 79 ±3 10 77 13 ±3 E6 – E9 68 ±4 12 75 14 ±4
Officers 71 ±3 10 73 17 ±3 W1 – W5 69 ±4 12 73 15 ±4 O1 – O3 72 ±5 9 77 13 ±5 O4 – O6 70 ±4 11 68 21 ±5
AGE 18 to 24 Years Old 80 ±4 9 81 10 ±5 25 to 29 Years Old 78 ±4 10 78 12 ±4 30 to 34 Years Old 73 ±4 10 76 14 ±5 35 to 44 Years Old 68 ±4 12 69 19 ±4 45 Years Old or More 58 ±6 13 70 17 ±7
LOCATION US (Incl. Territories) 72 ±2 7 78 15 ±2
18 to 24 Years Old 79 ±4 7 83 10 ±5 25 to 29 Years Old 77 ±4 6 81 13 ±4 30 to 34 Years Old 72 ±4 7 78 15 ±5 35 to 44 Years Old 66 ±4 8 71 21 ±5 45 Years Old or More 56 ±6 9 73 18 ±8
Overseas 88 ±3 42 53 5 ±5 18 to 24 Years Old 85 ±10 32 63 4 ±10 25 to 29 Years Old 90 ±5 44 51 5 ±10 30 to 34 Years Old 88 ±6 44 52 4 ±10 35 to 44 Years Old 90 ±6 43 52 6 ±9 45 Years Old or More 83 ±10 47 50 3 ±12
RACE/ETHNICITY Non-Hispanic White 76 ±2 9 77 14 ±3 Total Minority 70 ±3 13 73 14 ±4
GENDER Male 74 ±5 19 65 15 ±7 Female 74 ±2 9 77 14 ±2
PROXIMITY TO VOTING RESIDENCE Absent 88 ±2 12 75 12 ±3 Not Absent 55 ±3 7 77 17 ±4
VOTER REGISTRATION STATUS Registered to Vote 69 ±2 10 76 14 ±3 Not Registered to Vote 92 ±3 11 76 13 ±5
Note. Percent responding are active duty spouses who answered the question and who definitely voted by mail, e-mail/fax, or online in the November 2, 2010 election or who definitely did not vote (Q17).
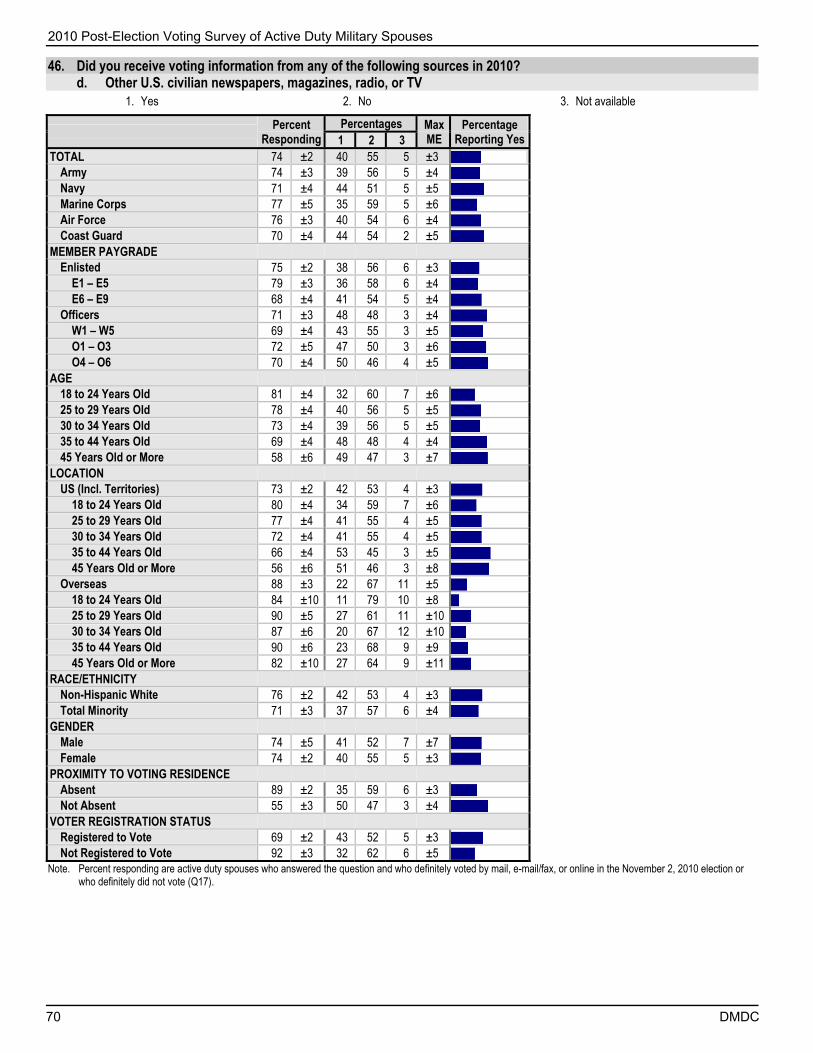
2010 Post-Election Voting Survey of Active Duty Military Spouses
70 DMDC
46. Did you receive voting information from any of the following sources in 2010? d. Other U.S. civilian newspapers, magazines, radio, or TV
1. Yes 2. No 3. Not available
Percent
Responding Percentages Max
ME Percentage
Reporting Yes 1 2 3 TOTAL 74 ±2 40 55 5 ±3
Army 74 ±3 39 56 5 ±4 Navy 71 ±4 44 51 5 ±5 Marine Corps 77 ±5 35 59 5 ±6 Air Force 76 ±3 40 54 6 ±4 Coast Guard 70 ±4 44 54 2 ±5
MEMBER PAYGRADE Enlisted 75 ±2 38 56 6 ±3
E1 – E5 79 ±3 36 58 6 ±4 E6 – E9 68 ±4 41 54 5 ±4
Officers 71 ±3 48 48 3 ±4 W1 – W5 69 ±4 43 55 3 ±5 O1 – O3 72 ±5 47 50 3 ±6 O4 – O6 70 ±4 50 46 4 ±5
AGE 18 to 24 Years Old 81 ±4 32 60 7 ±6 25 to 29 Years Old 78 ±4 40 56 5 ±5 30 to 34 Years Old 73 ±4 39 56 5 ±5 35 to 44 Years Old 69 ±4 48 48 4 ±4 45 Years Old or More 58 ±6 49 47 3 ±7
LOCATION US (Incl. Territories) 73 ±2 42 53 4 ±3
18 to 24 Years Old 80 ±4 34 59 7 ±6 25 to 29 Years Old 77 ±4 41 55 4 ±5 30 to 34 Years Old 72 ±4 41 55 4 ±5 35 to 44 Years Old 66 ±4 53 45 3 ±5 45 Years Old or More 56 ±6 51 46 3 ±8
Overseas 88 ±3 22 67 11 ±5 18 to 24 Years Old 84 ±10 11 79 10 ±8 25 to 29 Years Old 90 ±5 27 61 11 ±10 30 to 34 Years Old 87 ±6 20 67 12 ±10 35 to 44 Years Old 90 ±6 23 68 9 ±9 45 Years Old or More 82 ±10 27 64 9 ±11
RACE/ETHNICITY Non-Hispanic White 76 ±2 42 53 4 ±3 Total Minority 71 ±3 37 57 6 ±4
GENDER Male 74 ±5 41 52 7 ±7 Female 74 ±2 40 55 5 ±3
PROXIMITY TO VOTING RESIDENCE Absent 89 ±2 35 59 6 ±3 Not Absent 55 ±3 50 47 3 ±4
VOTER REGISTRATION STATUS Registered to Vote 69 ±2 43 52 5 ±3 Not Registered to Vote 92 ±3 32 62 6 ±5
Note. Percent responding are active duty spouses who answered the question and who definitely voted by mail, e-mail/fax, or online in the November 2, 2010 election or who definitely did not vote (Q17).

2010 Post-Election Voting Survey of Active Duty Military Spouses
DMDC 71
46. Did you receive voting information from any of the following sources in 2010? e. International television, radio, and print media
1. Yes 2. No 3. Not available
Percent
Responding Percentages Max
ME Percentage
Reporting Yes 1 2 3 TOTAL 73 ±2 17 71 13 ±2
Army 73 ±3 17 71 12 ±4 Navy 70 ±4 18 70 12 ±5 Marine Corps 76 ±5 15 70 15 ±6 Air Force 75 ±3 15 71 13 ±4 Coast Guard 69 ±4 16 73 11 ±5
MEMBER PAYGRADE Enlisted 74 ±2 16 71 13 ±3
E1 – E5 79 ±3 18 70 13 ±4 E6 – E9 68 ±4 14 73 13 ±4
Officers 70 ±3 17 71 12 ±4 W1 – W5 69 ±4 14 74 12 ±4 O1 – O3 72 ±5 20 71 9 ±5 O4 – O6 69 ±4 15 70 14 ±5
AGE 18 to 24 Years Old 80 ±4 19 68 13 ±5 25 to 29 Years Old 78 ±4 17 72 11 ±4 30 to 34 Years Old 73 ±4 16 72 13 ±5 35 to 44 Years Old 67 ±4 15 71 14 ±4 45 Years Old or More 58 ±6 17 69 14 ±7
LOCATION US (Incl. Territories) 72 ±2 17 70 13 ±3
18 to 24 Years Old 80 ±4 20 67 14 ±6 25 to 29 Years Old 77 ±4 17 72 11 ±5 30 to 34 Years Old 72 ±4 16 71 13 ±5 35 to 44 Years Old 65 ±4 16 69 15 ±5 45 Years Old or More 56 ±6 16 69 15 ±8
Overseas 88 ±3 14 78 8 ±4 18 to 24 Years Old 84 ±10 8 86 6 ±8 25 to 29 Years Old 90 ±5 18 75 7 ±10 30 to 34 Years Old 88 ±6 16 73 11 ±9 35 to 44 Years Old 90 ±6 11 81 7 ±7 45 Years Old or More 82 ±10 18 74 7 ±10
RACE/ETHNICITY Non-Hispanic White 75 ±2 17 71 12 ±3 Total Minority 70 ±3 16 71 13 ±4
GENDER Male 74 ±5 15 73 12 ±7 Female 73 ±2 17 70 13 ±3
PROXIMITY TO VOTING RESIDENCE Absent 88 ±2 16 72 12 ±3 Not Absent 55 ±3 18 68 14 ±4
VOTER REGISTRATION STATUS Registered to Vote 69 ±2 17 70 13 ±3 Not Registered to Vote 92 ±3 16 73 11 ±5
Note. Percent responding are active duty spouses who answered the question and who definitely voted by mail, e-mail/fax, or online in the November 2, 2010 election or who definitely did not vote (Q17).

2010 Post-Election Voting Survey of Active Duty Military Spouses
72 DMDC
46. Did you receive voting information from any of the following sources in 2010? f. My spouse
1. Yes 2. No 3. Not available
Percent
Responding Percentages Max
ME Percentage
Reporting Yes 1 2 3 TOTAL 74 ±2 26 70 4 ±2
Army 74 ±3 23 72 4 ±4 Navy 71 ±4 29 69 3 ±5 Marine Corps 77 ±5 27 67 6 ±6 Air Force 76 ±3 27 70 3 ±4 Coast Guard 71 ±4 29 70 2 ±5
MEMBER PAYGRADE Enlisted 75 ±2 23 73 4 ±3
E1 – E5 79 ±3 20 75 5 ±3 E6 – E9 68 ±4 27 70 3 ±4
Officers 71 ±3 37 60 2 ±4 W1 – W5 69 ±4 31 66 3 ±5 O1 – O3 72 ±5 37 61 2 ±6 O4 – O6 70 ±4 39 58 2 ±5
AGE 18 to 24 Years Old 81 ±4 19 75 5 ±5 25 to 29 Years Old 79 ±4 26 70 4 ±4 30 to 34 Years Old 73 ±4 25 71 4 ±5 35 to 44 Years Old 68 ±4 31 67 2 ±4 45 Years Old or More 59 ±6 34 65 2 ±7
LOCATION US (Incl. Territories) 73 ±2 26 70 4 ±3
18 to 24 Years Old 80 ±4 19 75 6 ±5 25 to 29 Years Old 78 ±4 26 69 5 ±5 30 to 34 Years Old 72 ±4 25 71 4 ±5 35 to 44 Years Old 66 ±4 32 66 2 ±5 45 Years Old or More 57 ±6 32 66 2 ±8
Overseas 87 ±3 24 72 4 ±5 18 to 24 Years Old 85 ±10 22 75 4 ±10 25 to 29 Years Old 89 ±5 23 74 3 ±9 30 to 34 Years Old 87 ±6 22 72 5 ±9 35 to 44 Years Old 89 ±6 24 73 3 ±9 45 Years Old or More 83 ±10 41 58 1 ±13
RACE/ETHNICITY Non-Hispanic White 76 ±2 29 68 3 ±3 Total Minority 70 ±3 20 74 5 ±4
GENDER Male 74 ±5 21 75 5 ±6 Female 74 ±2 27 70 4 ±3
PROXIMITY TO VOTING RESIDENCE Absent 89 ±2 26 70 4 ±3 Not Absent 55 ±3 26 70 4 ±4
VOTER REGISTRATION STATUS Registered to Vote 70 ±2 27 69 3 ±3 Not Registered to Vote 93 ±3 21 73 6 ±5
Note. Percent responding are active duty spouses who answered the question and who definitely voted by mail, e-mail/fax, or online in the November 2, 2010 election or who definitely did not vote (Q17).

2010 Post-Election Voting Survey of Active Duty Military Spouses
DMDC 73
46. Did you receive voting information from any of the following sources in 2010? g. Family members (other than spouse) or friends
1. Yes 2. No 3. Not available
Percent
Responding Percentages Max
ME Percentage
Reporting Yes 1 2 3 TOTAL 74 ±2 29 67 3 ±3
Army 73 ±3 30 66 4 ±4 Navy 71 ±4 30 67 3 ±5 Marine Corps 76 ±5 25 71 5 ±6 Air Force 76 ±3 29 68 3 ±4 Coast Guard 70 ±4 32 67 1 ±5
MEMBER PAYGRADE Enlisted 74 ±2 28 68 4 ±3
E1 – E5 79 ±3 27 68 4 ±4 E6 – E9 68 ±4 29 68 3 ±4
Officers 71 ±3 35 63 2 ±4 W1 – W5 69 ±4 30 67 2 ±5 O1 – O3 72 ±5 37 61 2 ±6 O4 – O6 70 ±4 34 64 2 ±5
AGE 18 to 24 Years Old 80 ±4 26 69 5 ±5 25 to 29 Years Old 79 ±4 30 66 4 ±5 30 to 34 Years Old 73 ±4 31 65 3 ±5 35 to 44 Years Old 68 ±4 30 68 2 ±4 45 Years Old or More 58 ±6 29 69 3 ±7
LOCATION US (Incl. Territories) 72 ±2 30 66 3 ±3
18 to 24 Years Old 80 ±4 26 69 5 ±6 25 to 29 Years Old 78 ±4 31 65 4 ±5 30 to 34 Years Old 72 ±4 33 64 3 ±5 35 to 44 Years Old 65 ±4 31 67 2 ±5 45 Years Old or More 56 ±6 28 69 3 ±8
Overseas 88 ±3 23 74 3 ±5 18 to 24 Years Old 84 ±10 27 72 2 ±10 25 to 29 Years Old 90 ±5 23 74 3 ±8 30 to 34 Years Old 87 ±6 15 80 5 ±8 35 to 44 Years Old 89 ±6 25 73 2 ±10 45 Years Old or More 82 ±10 27 69 3 ±17
RACE/ETHNICITY Non-Hispanic White 76 ±2 34 64 2 ±3 Total Minority 70 ±3 21 74 5 ±4
GENDER Male 73 ±5 21 75 4 ±7 Female 74 ±2 30 66 3 ±3
PROXIMITY TO VOTING RESIDENCE Absent 88 ±2 28 68 3 ±3 Not Absent 55 ±3 32 65 3 ±4
VOTER REGISTRATION STATUS Registered to Vote 69 ±2 32 65 3 ±3 Not Registered to Vote 92 ±3 21 74 5 ±5
Note. Percent responding are active duty spouses who answered the question and who definitely voted by mail, e-mail/fax, or online in the November 2, 2010 election or who definitely did not vote (Q17).

2010 Post-Election Voting Survey of Active Duty Military Spouses
74 DMDC
46. Did you receive voting information from any of the following sources in 2010? h. The Internet
1. Yes 2. No 3. Not available
Percent
Responding Percentages Max
ME Percentage
Reporting Yes 1 2 3 TOTAL 74 ±2 39 58 3 ±3
Army 73 ±3 39 58 3 ±4 Navy 71 ±4 42 56 2 ±5 Marine Corps 77 ±5 35 60 4 ±6 Air Force 76 ±3 40 58 3 ±4 Coast Guard 70 ±4 39 60 1 ±5
MEMBER PAYGRADE Enlisted 75 ±2 36 61 3 ±3
E1 – E5 79 ±3 35 61 4 ±4 E6 – E9 68 ±4 38 60 2 ±4
Officers 71 ±3 51 48 1 ±4 W1 – W5 69 ±4 38 60 2 ±5 O1 – O3 72 ±5 50 49 1 ±6 O4 – O6 71 ±4 54 45 1 ±5
AGE 18 to 24 Years Old 80 ±4 32 64 4 ±5 25 to 29 Years Old 78 ±4 39 58 3 ±5 30 to 34 Years Old 74 ±4 40 57 3 ±5 35 to 44 Years Old 68 ±4 45 54 1 ±4 45 Years Old or More 59 ±6 43 55 2 ±7
LOCATION US (Incl. Territories) 73 ±2 40 58 3 ±3
18 to 24 Years Old 80 ±4 32 64 4 ±6 25 to 29 Years Old 77 ±4 39 58 3 ±5 30 to 34 Years Old 73 ±4 41 56 3 ±6 35 to 44 Years Old 66 ±4 47 52 1 ±5 45 Years Old or More 57 ±6 42 56 2 ±8
Overseas 88 ±3 36 62 3 ±5 18 to 24 Years Old 84 ±10 30 69 1 ±10 25 to 29 Years Old 90 ±5 38 59 3 ±10 30 to 34 Years Old 87 ±6 33 64 3 ±10 35 to 44 Years Old 90 ±6 36 61 2 ±9 45 Years Old or More 81 ±10 46 52 2 ±13
RACE/ETHNICITY Non-Hispanic White 76 ±2 42 55 2 ±3 Total Minority 70 ±3 33 63 4 ±4
GENDER Male 74 ±5 44 53 4 ±7 Female 74 ±2 39 59 3 ±3
PROXIMITY TO VOTING RESIDENCE Absent 89 ±2 38 59 3 ±3 Not Absent 55 ±3 41 56 3 ±4
VOTER REGISTRATION STATUS Registered to Vote 70 ±2 42 55 2 ±3 Not Registered to Vote 92 ±3 30 66 4 ±5
Note. Percent responding are active duty spouses who answered the question and who definitely voted by mail, e-mail/fax, or online in the November 2, 2010 election or who definitely did not vote (Q17).
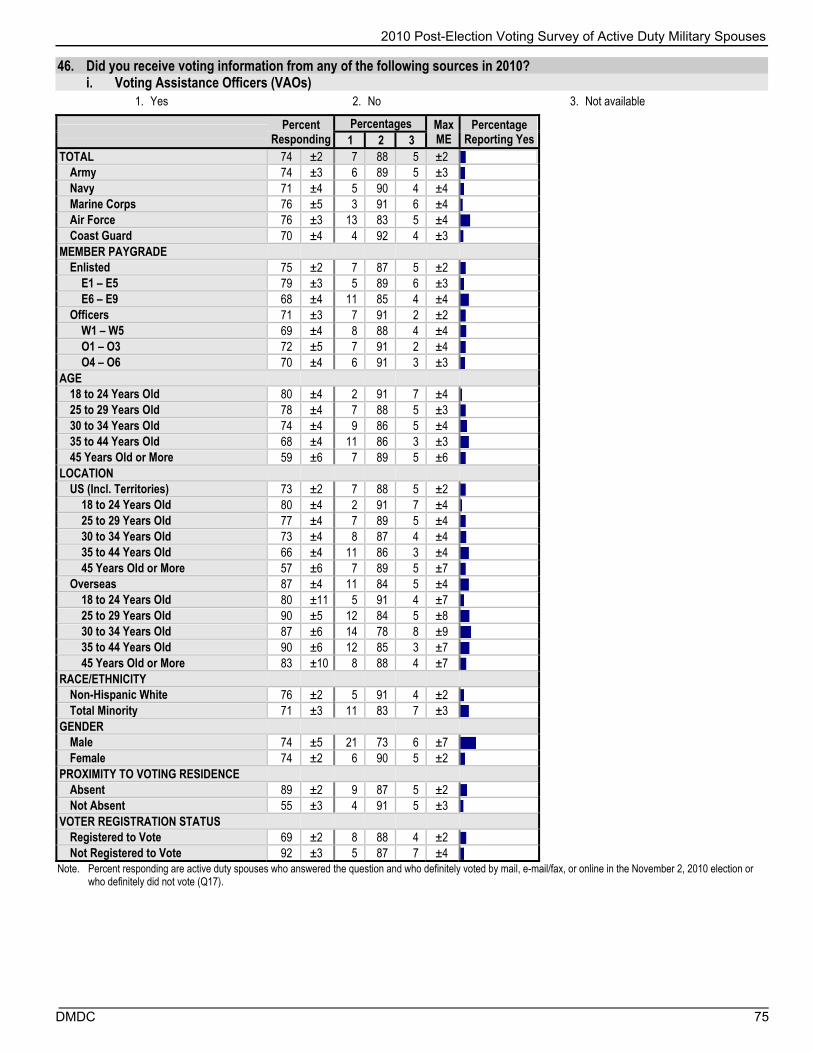
2010 Post-Election Voting Survey of Active Duty Military Spouses
DMDC 75
46. Did you receive voting information from any of the following sources in 2010? i. Voting Assistance Officers (VAOs)
1. Yes 2. No 3. Not available
Percent
Responding Percentages Max
ME Percentage
Reporting Yes 1 2 3 TOTAL 74 ±2 7 88 5 ±2
Army 74 ±3 6 89 5 ±3 Navy 71 ±4 5 90 4 ±4 Marine Corps 76 ±5 3 91 6 ±4 Air Force 76 ±3 13 83 5 ±4 Coast Guard 70 ±4 4 92 4 ±3
MEMBER PAYGRADE Enlisted 75 ±2 7 87 5 ±2
E1 – E5 79 ±3 5 89 6 ±3 E6 – E9 68 ±4 11 85 4 ±4
Officers 71 ±3 7 91 2 ±2 W1 – W5 69 ±4 8 88 4 ±4 O1 – O3 72 ±5 7 91 2 ±4 O4 – O6 70 ±4 6 91 3 ±3
AGE 18 to 24 Years Old 80 ±4 2 91 7 ±4 25 to 29 Years Old 78 ±4 7 88 5 ±3 30 to 34 Years Old 74 ±4 9 86 5 ±4 35 to 44 Years Old 68 ±4 11 86 3 ±3 45 Years Old or More 59 ±6 7 89 5 ±6
LOCATION US (Incl. Territories) 73 ±2 7 88 5 ±2
18 to 24 Years Old 80 ±4 2 91 7 ±4 25 to 29 Years Old 77 ±4 7 89 5 ±4 30 to 34 Years Old 73 ±4 8 87 4 ±4 35 to 44 Years Old 66 ±4 11 86 3 ±4 45 Years Old or More 57 ±6 7 89 5 ±7
Overseas 87 ±4 11 84 5 ±4 18 to 24 Years Old 80 ±11 5 91 4 ±7 25 to 29 Years Old 90 ±5 12 84 5 ±8 30 to 34 Years Old 87 ±6 14 78 8 ±9 35 to 44 Years Old 90 ±6 12 85 3 ±7 45 Years Old or More 83 ±10 8 88 4 ±7
RACE/ETHNICITY Non-Hispanic White 76 ±2 5 91 4 ±2 Total Minority 71 ±3 11 83 7 ±3
GENDER Male 74 ±5 21 73 6 ±7 Female 74 ±2 6 90 5 ±2
PROXIMITY TO VOTING RESIDENCE Absent 89 ±2 9 87 5 ±2 Not Absent 55 ±3 4 91 5 ±3
VOTER REGISTRATION STATUS Registered to Vote 69 ±2 8 88 4 ±2 Not Registered to Vote 92 ±3 5 87 7 ±4
Note. Percent responding are active duty spouses who answered the question and who definitely voted by mail, e-mail/fax, or online in the November 2, 2010 election or who definitely did not vote (Q17).

2010 Post-Election Voting Survey of Active Duty Military Spouses
76 DMDC
47. From September 13 to November 2, 2010 did you have access to the following? a. Government Web sites other than FVAP (e.g., state or Federal .gov or .mil sites)
1. Yes, on a regular basis 2. Yes, but not on a regular basis 3. No
Percent
Responding Percentages Max
ME 1 2 3 TOTAL 74 ±2 56 17 26 ±3
Army 73 ±3 56 19 26 ±4 Navy 71 ±4 52 16 32 ±5 Marine Corps 77 ±5 53 20 26 ±6 Air Force 76 ±3 62 16 23 ±4 Coast Guard 70 ±4 57 13 30 ±5
MEMBER PAYGRADE Enlisted 75 ±2 54 18 28 ±3
E1 – E5 79 ±3 52 19 29 ±4 E6 – E9 68 ±4 59 16 25 ±4
Officers 72 ±3 65 15 20 ±3 W1 – W5 68 ±4 58 14 28 ±5 O1 – O3 73 ±5 66 16 18 ±5 O4 – O6 71 ±4 65 14 21 ±5
AGE 18 to 24 Years Old 80 ±4 48 23 29 ±6 25 to 29 Years Old 79 ±4 61 16 23 ±5 30 to 34 Years Old 74 ±4 58 14 28 ±5 35 to 44 Years Old 68 ±4 59 16 25 ±4 45 Years Old or More 60 ±6 54 17 30 ±7
LOCATION US (Incl. Territories) 73 ±2 56 17 27 ±3
18 to 24 Years Old 80 ±4 48 23 29 ±6 25 to 29 Years Old 77 ±4 62 15 23 ±5 30 to 34 Years Old 73 ±4 58 14 28 ±5 35 to 44 Years Old 66 ±4 59 16 26 ±5 45 Years Old or More 58 ±6 53 17 30 ±8
Overseas 88 ±3 56 21 23 ±5 18 to 24 Years Old 81 ±11 45 26 29 ±11 25 to 29 Years Old 90 ±5 54 24 22 ±11 30 to 34 Years Old 87 ±6 57 19 24 ±10 35 to 44 Years Old 91 ±6 62 18 20 ±8 45 Years Old or More 83 ±10 59 12 29 ±15
RACE/ETHNICITY Non-Hispanic White 76 ±2 60 16 23 ±3 Total Minority 71 ±3 49 19 32 ±4
GENDER Male 75 ±5 67 16 17 ±7 Female 74 ±2 55 17 27 ±3
PROXIMITY TO VOTING RESIDENCE Absent 89 ±2 58 17 25 ±3 Not Absent 55 ±3 53 18 29 ±4
VOTER REGISTRATION STATUS Registered to Vote 70 ±2 60 16 23 ±3 Not Registered to Vote 92 ±3 45 20 36 ±5
Note. Percent responding are active duty spouses who answered the question and who definitely voted by mail, e-mail/fax, or online in the November 2, 2010 election or who definitely did not vote (Q17).
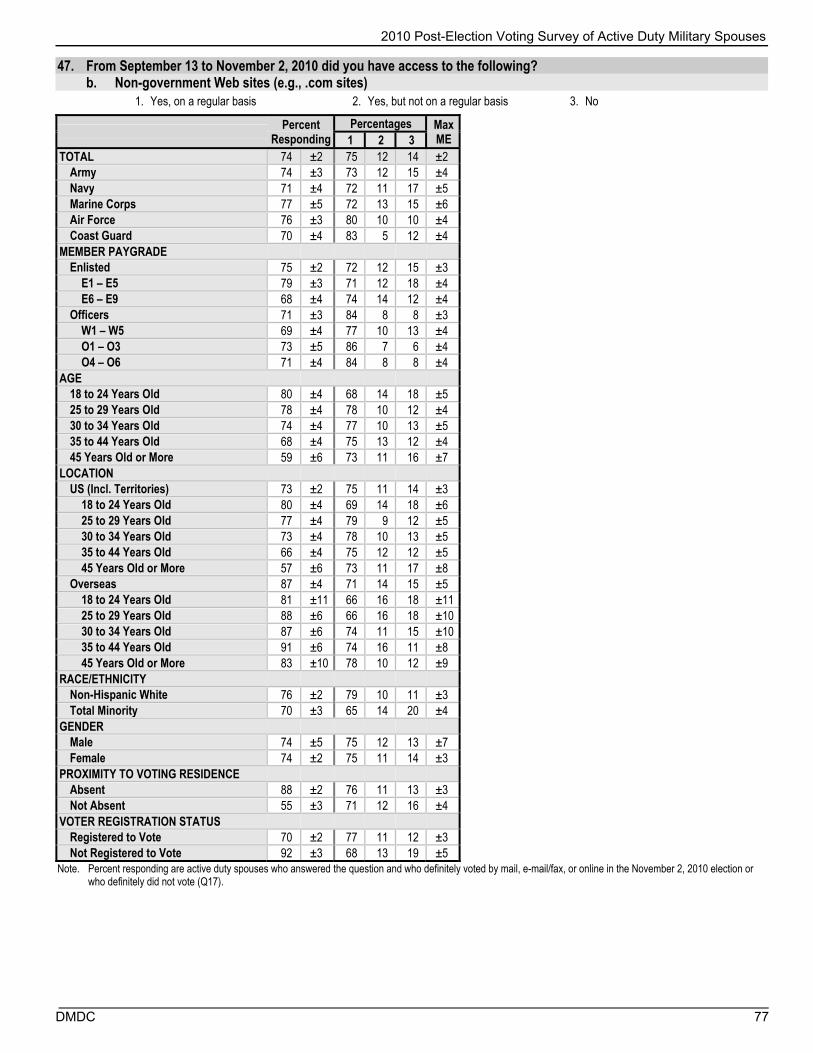
2010 Post-Election Voting Survey of Active Duty Military Spouses
DMDC 77
47. From September 13 to November 2, 2010 did you have access to the following? b. Non-government Web sites (e.g., .com sites)
1. Yes, on a regular basis 2. Yes, but not on a regular basis 3. No
Percent
Responding Percentages Max
ME 1 2 3 TOTAL 74 ±2 75 12 14 ±2
Army 74 ±3 73 12 15 ±4 Navy 71 ±4 72 11 17 ±5 Marine Corps 77 ±5 72 13 15 ±6 Air Force 76 ±3 80 10 10 ±4 Coast Guard 70 ±4 83 5 12 ±4
MEMBER PAYGRADE Enlisted 75 ±2 72 12 15 ±3
E1 – E5 79 ±3 71 12 18 ±4 E6 – E9 68 ±4 74 14 12 ±4
Officers 71 ±3 84 8 8 ±3 W1 – W5 69 ±4 77 10 13 ±4 O1 – O3 73 ±5 86 7 6 ±4 O4 – O6 71 ±4 84 8 8 ±4
AGE 18 to 24 Years Old 80 ±4 68 14 18 ±5 25 to 29 Years Old 78 ±4 78 10 12 ±4 30 to 34 Years Old 74 ±4 77 10 13 ±5 35 to 44 Years Old 68 ±4 75 13 12 ±4 45 Years Old or More 59 ±6 73 11 16 ±7
LOCATION US (Incl. Territories) 73 ±2 75 11 14 ±3
18 to 24 Years Old 80 ±4 69 14 18 ±6 25 to 29 Years Old 77 ±4 79 9 12 ±5 30 to 34 Years Old 73 ±4 78 10 13 ±5 35 to 44 Years Old 66 ±4 75 12 12 ±5 45 Years Old or More 57 ±6 73 11 17 ±8
Overseas 87 ±4 71 14 15 ±5 18 to 24 Years Old 81 ±11 66 16 18 ±11 25 to 29 Years Old 88 ±6 66 16 18 ±10 30 to 34 Years Old 87 ±6 74 11 15 ±10 35 to 44 Years Old 91 ±6 74 16 11 ±8 45 Years Old or More 83 ±10 78 10 12 ±9
RACE/ETHNICITY Non-Hispanic White 76 ±2 79 10 11 ±3 Total Minority 70 ±3 65 14 20 ±4
GENDER Male 74 ±5 75 12 13 ±7 Female 74 ±2 75 11 14 ±3
PROXIMITY TO VOTING RESIDENCE Absent 88 ±2 76 11 13 ±3 Not Absent 55 ±3 71 12 16 ±4
VOTER REGISTRATION STATUS Registered to Vote 70 ±2 77 11 12 ±3 Not Registered to Vote 92 ±3 68 13 19 ±5
Note. Percent responding are active duty spouses who answered the question and who definitely voted by mail, e-mail/fax, or online in the November 2, 2010 election or who definitely did not vote (Q17).

2010 Post-Election Voting Survey of Active Duty Military Spouses
78 DMDC
47. From September 13 to November 2, 2010 did you have access to the following? c. Fax
1. Yes, on a regular basis 2. Yes, but not on a regular basis 3. No
Percent
Responding Percentages Max
ME 1 2 3 TOTAL 74 ±2 29 22 49 ±3
Army 73 ±3 27 24 49 ±4 Navy 71 ±4 27 21 52 ±5 Marine Corps 77 ±5 25 23 52 ±6 Air Force 76 ±3 35 21 44 ±4 Coast Guard 70 ±4 33 20 47 ±5
MEMBER PAYGRADE Enlisted 74 ±2 27 22 51 ±3
E1 – E5 79 ±3 23 24 53 ±4 E6 – E9 68 ±4 34 20 46 ±4
Officers 71 ±3 35 24 42 ±4 W1 – W5 69 ±4 35 18 46 ±5 O1 – O3 73 ±5 31 27 41 ±6 O4 – O6 71 ±4 38 21 41 ±5
AGE 18 to 24 Years Old 80 ±4 19 23 58 ±6 25 to 29 Years Old 78 ±4 26 24 49 ±5 30 to 34 Years Old 74 ±4 33 22 45 ±5 35 to 44 Years Old 68 ±4 35 21 44 ±4 45 Years Old or More 60 ±6 36 15 48 ±7
LOCATION US (Incl. Territories) 73 ±2 29 22 48 ±3
18 to 24 Years Old 80 ±4 19 23 58 ±6 25 to 29 Years Old 77 ±4 27 24 49 ±5 30 to 34 Years Old 73 ±4 34 22 44 ±5 35 to 44 Years Old 66 ±4 36 22 42 ±5 45 Years Old or More 58 ±6 37 15 48 ±8
Overseas 87 ±3 24 24 52 ±5 18 to 24 Years Old 80 ±11 19 28 53 ±10 25 to 29 Years Old 90 ±5 20 28 52 ±10 30 to 34 Years Old 87 ±6 20 24 56 ±10 35 to 44 Years Old 91 ±6 31 18 51 ±8 45 Years Old or More 81 ±10 32 19 49 ±12
RACE/ETHNICITY Non-Hispanic White 76 ±2 29 23 48 ±3 Total Minority 70 ±3 28 22 51 ±4
GENDER Male 75 ±5 53 17 30 ±7 Female 74 ±2 26 23 51 ±3
PROXIMITY TO VOTING RESIDENCE Absent 88 ±2 30 23 47 ±3 Not Absent 55 ±3 27 21 52 ±4
VOTER REGISTRATION STATUS Registered to Vote 70 ±2 30 23 47 ±3 Not Registered to Vote 92 ±3 24 21 55 ±5
Note. Percent responding are active duty spouses who answered the question and who definitely voted by mail, e-mail/fax, or online in the November 2, 2010 election or who definitely did not vote (Q17).

2010 Post-Election Voting Survey of Active Duty Military Spouses
DMDC 79
47. From September 13 to November 2, 2010 did you have access to the following? d. Printer
1. Yes, on a regular basis 2. Yes, but not on a regular basis 3. No
Percent
Responding Percentages Max
ME 1 2 3 TOTAL 74 ±2 69 12 19 ±2
Army 74 ±3 70 13 18 ±4 Navy 71 ±4 66 12 23 ±5 Marine Corps 77 ±5 61 16 22 ±6 Air Force 76 ±3 74 11 15 ±4 Coast Guard 71 ±4 75 9 16 ±5
MEMBER PAYGRADE Enlisted 75 ±2 66 13 20 ±3
E1 – E5 79 ±3 63 15 23 ±4 E6 – E9 68 ±4 72 11 16 ±4
Officers 72 ±3 80 8 12 ±3 W1 – W5 68 ±4 76 9 15 ±4 O1 – O3 73 ±5 80 10 10 ±5 O4 – O6 71 ±4 81 7 12 ±4
AGE 18 to 24 Years Old 79 ±4 57 17 26 ±6 25 to 29 Years Old 79 ±4 70 14 16 ±4 30 to 34 Years Old 74 ±4 74 9 17 ±5 35 to 44 Years Old 69 ±4 74 11 15 ±4 45 Years Old or More 60 ±6 73 6 22 ±7
LOCATION US (Incl. Territories) 73 ±2 70 12 18 ±3
18 to 24 Years Old 79 ±4 57 17 26 ±6 25 to 29 Years Old 78 ±4 72 13 15 ±5 30 to 34 Years Old 73 ±4 75 8 17 ±5 35 to 44 Years Old 66 ±4 74 11 15 ±4 45 Years Old or More 58 ±6 74 5 22 ±8
Overseas 87 ±3 63 17 20 ±5 18 to 24 Years Old 81 ±11 48 28 24 ±11 25 to 29 Years Old 90 ±5 57 19 23 ±11 30 to 34 Years Old 86 ±6 67 13 20 ±11 35 to 44 Years Old 91 ±6 73 14 13 ±8 45 Years Old or More 83 ±10 63 13 24 ±17
RACE/ETHNICITY Non-Hispanic White 76 ±2 74 11 15 ±3 Total Minority 70 ±3 61 15 25 ±4
GENDER Male 74 ±5 72 9 18 ±7 Female 74 ±2 69 13 19 ±3
PROXIMITY TO VOTING RESIDENCE Absent 88 ±2 71 12 17 ±3 Not Absent 56 ±3 66 13 21 ±4
VOTER REGISTRATION STATUS Registered to Vote 70 ±2 73 11 16 ±3 Not Registered to Vote 92 ±3 58 17 25 ±5
Note. Percent responding are active duty spouses who answered the question and who definitely voted by mail, e-mail/fax, or online in the November 2, 2010 election or who definitely did not vote (Q17).
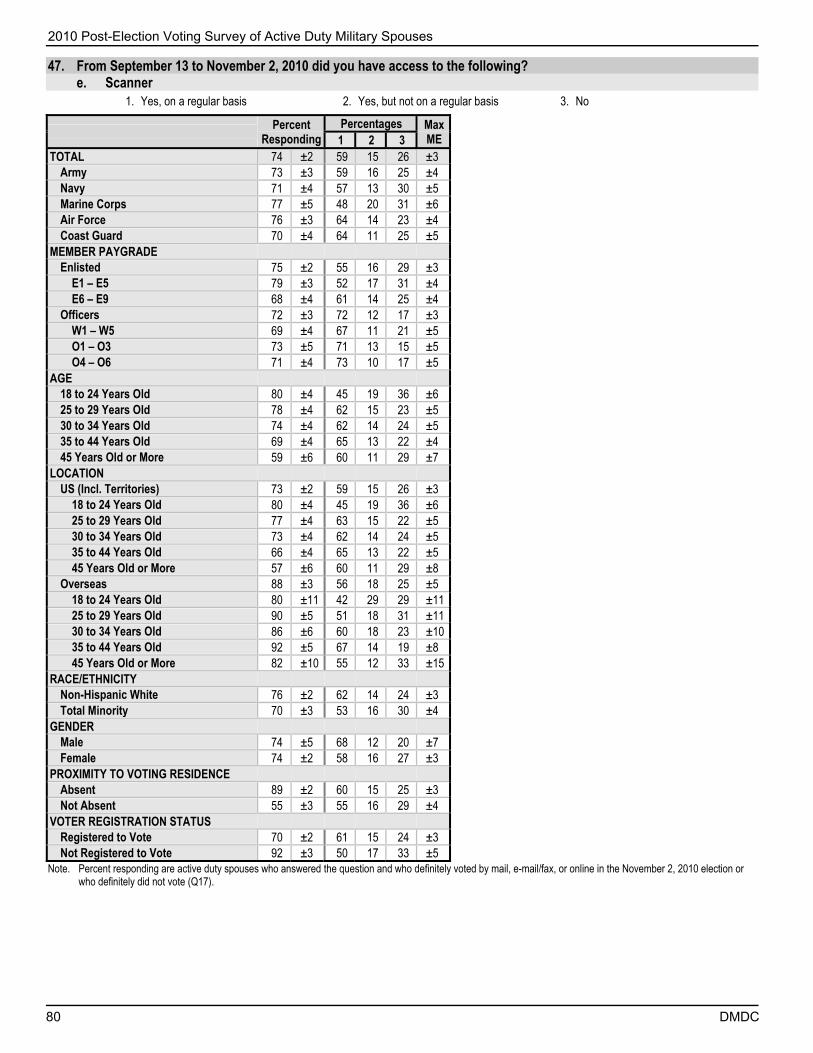
2010 Post-Election Voting Survey of Active Duty Military Spouses
80 DMDC
47. From September 13 to November 2, 2010 did you have access to the following? e. Scanner
1. Yes, on a regular basis 2. Yes, but not on a regular basis 3. No
Percent
Responding Percentages Max
ME 1 2 3 TOTAL 74 ±2 59 15 26 ±3
Army 73 ±3 59 16 25 ±4 Navy 71 ±4 57 13 30 ±5 Marine Corps 77 ±5 48 20 31 ±6 Air Force 76 ±3 64 14 23 ±4 Coast Guard 70 ±4 64 11 25 ±5
MEMBER PAYGRADE Enlisted 75 ±2 55 16 29 ±3
E1 – E5 79 ±3 52 17 31 ±4 E6 – E9 68 ±4 61 14 25 ±4
Officers 72 ±3 72 12 17 ±3 W1 – W5 69 ±4 67 11 21 ±5 O1 – O3 73 ±5 71 13 15 ±5 O4 – O6 71 ±4 73 10 17 ±5
AGE 18 to 24 Years Old 80 ±4 45 19 36 ±6 25 to 29 Years Old 78 ±4 62 15 23 ±5 30 to 34 Years Old 74 ±4 62 14 24 ±5 35 to 44 Years Old 69 ±4 65 13 22 ±4 45 Years Old or More 59 ±6 60 11 29 ±7
LOCATION US (Incl. Territories) 73 ±2 59 15 26 ±3
18 to 24 Years Old 80 ±4 45 19 36 ±6 25 to 29 Years Old 77 ±4 63 15 22 ±5 30 to 34 Years Old 73 ±4 62 14 24 ±5 35 to 44 Years Old 66 ±4 65 13 22 ±5 45 Years Old or More 57 ±6 60 11 29 ±8
Overseas 88 ±3 56 18 25 ±5 18 to 24 Years Old 80 ±11 42 29 29 ±11 25 to 29 Years Old 90 ±5 51 18 31 ±11 30 to 34 Years Old 86 ±6 60 18 23 ±10 35 to 44 Years Old 92 ±5 67 14 19 ±8 45 Years Old or More 82 ±10 55 12 33 ±15
RACE/ETHNICITY Non-Hispanic White 76 ±2 62 14 24 ±3 Total Minority 70 ±3 53 16 30 ±4
GENDER Male 74 ±5 68 12 20 ±7 Female 74 ±2 58 16 27 ±3
PROXIMITY TO VOTING RESIDENCE Absent 89 ±2 60 15 25 ±3 Not Absent 55 ±3 55 16 29 ±4
VOTER REGISTRATION STATUS Registered to Vote 70 ±2 61 15 24 ±3 Not Registered to Vote 92 ±3 50 17 33 ±5
Note. Percent responding are active duty spouses who answered the question and who definitely voted by mail, e-mail/fax, or online in the November 2, 2010 election or who definitely did not vote (Q17).
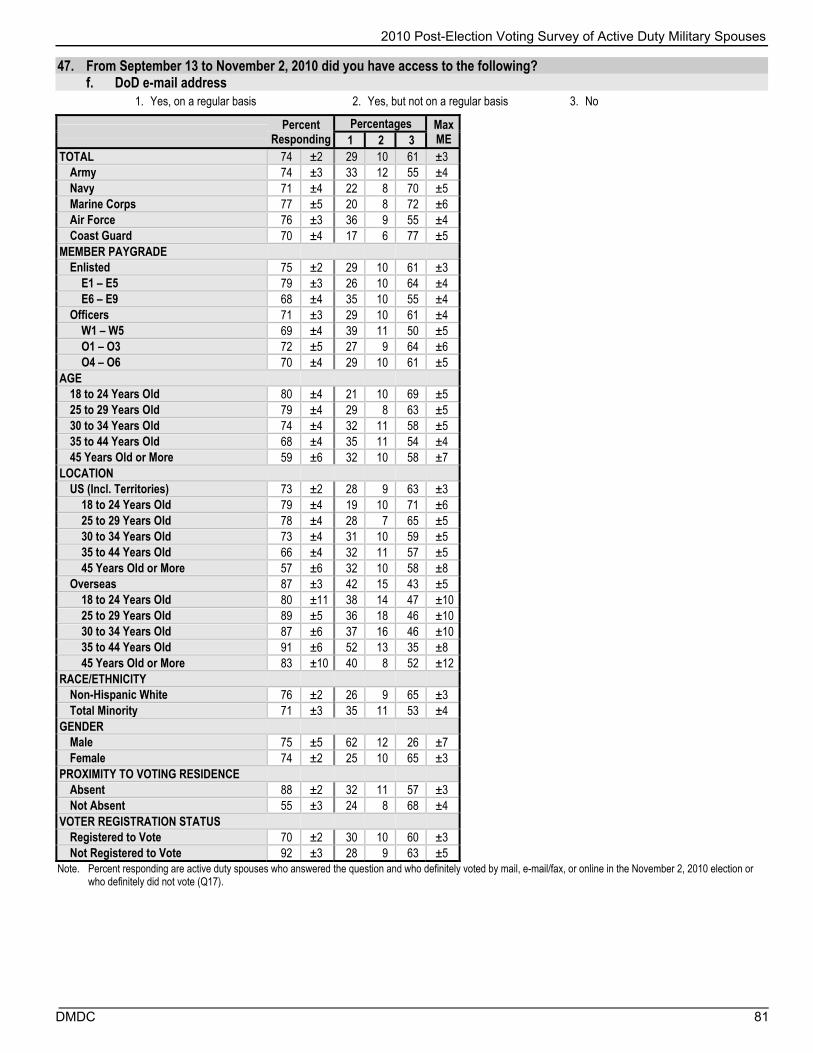
2010 Post-Election Voting Survey of Active Duty Military Spouses
DMDC 81
47. From September 13 to November 2, 2010 did you have access to the following? f. DoD e-mail address
1. Yes, on a regular basis 2. Yes, but not on a regular basis 3. No
Percent
Responding Percentages Max
ME 1 2 3 TOTAL 74 ±2 29 10 61 ±3
Army 74 ±3 33 12 55 ±4 Navy 71 ±4 22 8 70 ±5 Marine Corps 77 ±5 20 8 72 ±6 Air Force 76 ±3 36 9 55 ±4 Coast Guard 70 ±4 17 6 77 ±5
MEMBER PAYGRADE Enlisted 75 ±2 29 10 61 ±3
E1 – E5 79 ±3 26 10 64 ±4 E6 – E9 68 ±4 35 10 55 ±4
Officers 71 ±3 29 10 61 ±4 W1 – W5 69 ±4 39 11 50 ±5 O1 – O3 72 ±5 27 9 64 ±6 O4 – O6 70 ±4 29 10 61 ±5
AGE 18 to 24 Years Old 80 ±4 21 10 69 ±5 25 to 29 Years Old 79 ±4 29 8 63 ±5 30 to 34 Years Old 74 ±4 32 11 58 ±5 35 to 44 Years Old 68 ±4 35 11 54 ±4 45 Years Old or More 59 ±6 32 10 58 ±7
LOCATION US (Incl. Territories) 73 ±2 28 9 63 ±3
18 to 24 Years Old 79 ±4 19 10 71 ±6 25 to 29 Years Old 78 ±4 28 7 65 ±5 30 to 34 Years Old 73 ±4 31 10 59 ±5 35 to 44 Years Old 66 ±4 32 11 57 ±5 45 Years Old or More 57 ±6 32 10 58 ±8
Overseas 87 ±3 42 15 43 ±5 18 to 24 Years Old 80 ±11 38 14 47 ±10 25 to 29 Years Old 89 ±5 36 18 46 ±10 30 to 34 Years Old 87 ±6 37 16 46 ±10 35 to 44 Years Old 91 ±6 52 13 35 ±8 45 Years Old or More 83 ±10 40 8 52 ±12
RACE/ETHNICITY Non-Hispanic White 76 ±2 26 9 65 ±3 Total Minority 71 ±3 35 11 53 ±4
GENDER Male 75 ±5 62 12 26 ±7 Female 74 ±2 25 10 65 ±3
PROXIMITY TO VOTING RESIDENCE Absent 88 ±2 32 11 57 ±3 Not Absent 55 ±3 24 8 68 ±4
VOTER REGISTRATION STATUS Registered to Vote 70 ±2 30 10 60 ±3 Not Registered to Vote 92 ±3 28 9 63 ±5
Note. Percent responding are active duty spouses who answered the question and who definitely voted by mail, e-mail/fax, or online in the November 2, 2010 election or who definitely did not vote (Q17).

2010 Post-Election Voting Survey of Active Duty Military Spouses
82 DMDC
47. From September 13 to November 2, 2010 did you have access to the following? g. Personal e-mail address
1. Yes, on a regular basis 2. Yes, but not on a regular basis 3. No
Percent
Responding Percentages Max
ME 1 2 3 TOTAL 74 ±2 83 7 10 ±2
Army 74 ±3 83 7 10 ±4 Navy 72 ±4 81 7 13 ±4 Marine Corps 77 ±5 83 7 10 ±6 Air Force 76 ±3 86 8 7 ±3 Coast Guard 70 ±4 90 4 7 ±4
MEMBER PAYGRADE Enlisted 75 ±2 82 8 10 ±3
E1 – E5 79 ±3 81 8 11 ±3 E6 – E9 69 ±4 83 8 9 ±4
Officers 72 ±3 90 4 6 ±2 W1 – W5 69 ±4 86 5 9 ±4 O1 – O3 73 ±5 90 4 5 ±4 O4 – O6 71 ±4 90 4 6 ±4
AGE 18 to 24 Years Old 80 ±4 79 9 13 ±5 25 to 29 Years Old 79 ±4 85 7 8 ±4 30 to 34 Years Old 74 ±4 85 6 9 ±4 35 to 44 Years Old 69 ±4 85 7 8 ±3 45 Years Old or More 61 ±6 81 7 12 ±7
LOCATION US (Incl. Territories) 73 ±2 84 7 10 ±2
18 to 24 Years Old 79 ±4 79 8 13 ±5 25 to 29 Years Old 78 ±4 86 6 8 ±4 30 to 34 Years Old 73 ±4 85 6 8 ±4 35 to 44 Years Old 66 ±4 85 6 9 ±4 45 Years Old or More 59 ±6 80 7 13 ±8
Overseas 88 ±3 80 12 8 ±5 18 to 24 Years Old 81 ±11 74 19 7 ±13 25 to 29 Years Old 90 ±5 75 15 11 ±11 30 to 34 Years Old 87 ±6 81 8 11 ±11 35 to 44 Years Old 92 ±5 86 10 5 ±6 45 Years Old or More 83 ±10 85 5 9 ±8
RACE/ETHNICITY Non-Hispanic White 76 ±2 87 5 7 ±2 Total Minority 71 ±3 76 11 14 ±4
GENDER Male 75 ±5 76 11 14 ±7 Female 74 ±2 84 7 9 ±2
PROXIMITY TO VOTING RESIDENCE Absent 89 ±2 84 7 9 ±2 Not Absent 56 ±3 82 7 11 ±4
VOTER REGISTRATION STATUS Registered to Vote 70 ±2 86 7 8 ±2 Not Registered to Vote 93 ±3 77 9 14 ±5
Note. Percent responding are active duty spouses who answered the question and who definitely voted by mail, e-mail/fax, or online in the November 2, 2010 election or who definitely did not vote (Q17).

2010 Post-Election Voting Survey of Active Duty Military Spouses
DMDC 83
48. During 2010, did you fax any of the following materials? a. Federal Post Card Application (FPCA)
1. Yes, using the Federal Voting Assistance Program (FVAP) toll-free faxing service
2. Yes, but not using the Federal Voting Assistance Program (FVAP) toll-free faxing service
3. No
Percent Responding
Percentages Max ME
Percentage Reporting Yes 1 2 3
TOTAL 38 ±2 1 1 98 ±1 2.0 ±1.0 Army 37 ±4 0 2 98 ±2 2.0 ±2.0 Navy 34 ±4 1 0 98 ±3 2.0 ±3.0 Marine Corps 37 ±5 1 0 99 ±4 1.0 ±3.0 Air Force 42 ±4 1 2 97 ±3 3.0 ±3.0 Coast Guard 37 ±4 1 0 99 ±3 1.0 ±3.0
MEMBER PAYGRADE Enlisted 37 ±3 0 1 99 ±2 1.0 ±2.0
E1 – E5 37 ±3 0 0 99 ±2 1.0 ±2.0 E6 – E9 37 ±4 1 2 97 ±3 3.0 ±3.0
Officers 41 ±3 1 2 97 ±3 3.0 ±3.0 W1 – W5 37 ±4 1 1 98 ±4 2.0 ±3.0 O1 – O3 43 ±5 2 1 97 ±4 3.0 ±4.0 O4 – O6 41 ±4 0 3 96 ±5 4.0 ±4.0
AGE 18 to 24 Years Old 34 ±5 0 0 100 ±1 0.0 ±1.0 25 to 29 Years Old 40 ±4 1 1 99 ±3 1.0 ±3.0 30 to 34 Years Old 41 ±4 1 2 97 ±4 3.0 ±4.0 35 to 44 Years Old 38 ±4 1 2 97 ±3 3.0 ±3.0 45 Years Old or More 31 ±5 0 1 99 ±2 1.0 ±2.0
LOCATION US (Incl. Territories) 37 ±2 1 1 98 ±1 2.0 ±1.0
18 to 24 Years Old 34 ±5 0 0 100 ±1 0.0 ±1.0 25 to 29 Years Old 39 ±4 1 1 99 ±3 1.0 ±3.0 30 to 34 Years Old 41 ±5 1 2 97 ±4 3.0 ±4.0 35 to 44 Years Old 38 ±4 1 2 97 ±3 3.0 ±3.0 45 Years Old or More 30 ±6 0 0 100 ±1 0.0 ±1.0
Overseas 41 ±4 1 2 97 ±3 3.0 ±3.0 18 to 24 Years Old 37 ±9 NR 1 99 ±7 1.0 ±7.0 25 to 29 Years Old 42 ±9 NR NR NR NR 30 to 34 Years Old 38 ±9 1 4 95 ±12 5.0 ±11.0 35 to 44 Years Old 44 ±8 2 2 96 ±8 4.0 ±7.0 45 Years Old or More 41 ±11 2 NR 93 ±12 7.0 ±12.0
RACE/ETHNICITY Non-Hispanic White 39 ±3 1 1 98 ±2 2.0 ±2.0 Total Minority 35 ±3 1 2 97 ±2 3.0 ±2.0
GENDER Male 52 ±6 1 2 97 ±4 3.0 ±4.0 Female 36 ±2 1 1 98 ±1 2.0 ±1.0
PROXIMITY TO VOTING RESIDENCE Absent 47 ±3 1 1 98 ±2 2.0 ±2.0 Not Absent 26 ±3 1 1 98 ±3 2.0 ±3.0
VOTER REGISTRATION STATUS Registered to Vote 37 ±2 1 1 98 ±2 2.0 ±2.0 Not Registered to Vote 41 ±5 1 1 99 ±4 1.0 ±3.0
Note. Percent responding are active duty spouses who answered the question; who definitely voted by mail, e-mail/fax, or online in the November 2, 2010 election or who definitely did not vote (Q17); and who had access to a fax between September 13 and November 2, 2010 (Q47). NR: Not reportable

2010 Post-Election Voting Survey of Active Duty Military Spouses
84 DMDC
48. During 2010, did you fax any of the following materials? b. Non-Federal Post Card Application request for absentee ballot
1. Yes, using the Federal Voting Assistance Program (FVAP) toll-free faxing service
2. Yes, but not using the Federal Voting Assistance Program (FVAP) toll-free faxing service
3. No
Percent Responding
Percentages Max ME
Percentage Reporting Yes 1 2 3
TOTAL 38 ±2 0 2 98 ±2 2.0 ±2.0 Army 37 ±4 0 2 97 ±3 3.0 ±3.0 Navy 34 ±4 0 2 97 ±4 3.0 ±4.0 Marine Corps 37 ±5 1 0 99 ±4 1.0 ±3.0 Air Force 42 ±4 1 2 98 ±3 2.0 ±3.0 Coast Guard 37 ±4 1 1 98 ±3 2.0 ±3.0
MEMBER PAYGRADE Enlisted 37 ±3 0 2 98 ±2 2.0 ±2.0
E1 – E5 37 ±3 0 1 98 ±2 2.0 ±2.0 E6 – E9 37 ±4 0 2 97 ±3 3.0 ±3.0
Officers 41 ±3 1 1 98 ±3 2.0 ±3.0 W1 – W5 37 ±4 1 1 99 ±4 1.0 ±3.0 O1 – O3 43 ±5 2 1 97 ±5 3.0 ±5.0 O4 – O6 41 ±4 0 2 98 ±4 2.0 ±4.0
AGE 18 to 24 Years Old 34 ±5 0 1 99 ±4 1.0 ±4.0 25 to 29 Years Old 40 ±4 1 2 98 ±3 2.0 ±3.0 30 to 34 Years Old 41 ±4 1 3 97 ±4 3.0 ±4.0 35 to 44 Years Old 38 ±4 1 1 98 ±2 2.0 ±2.0 45 Years Old or More 31 ±5 0 1 99 ±2 1.0 ±2.0
LOCATION US (Incl. Territories) 37 ±2 0 2 98 ±2 2.0 ±2.0
18 to 24 Years Old 34 ±5 0 1 99 ±5 1.0 ±5.0 25 to 29 Years Old 39 ±4 1 2 97 ±4 3.0 ±4.0 30 to 34 Years Old 41 ±5 1 3 97 ±4 3.0 ±4.0 35 to 44 Years Old 38 ±4 0 1 98 ±3 2.0 ±3.0 45 Years Old or More 30 ±6 0 0 100 ±1 0.0 ±1.0
Overseas 41 ±4 1 2 97 ±3 3.0 ±3.0 18 to 24 Years Old 37 ±9 NR 3 97 ±8 3.0 ±8.0 25 to 29 Years Old 42 ±9 NR 1 99 ±7 1.0 ±7.0 30 to 34 Years Old 38 ±9 1 NR NR ±5 NR 35 to 44 Years Old 45 ±8 2 2 96 ±8 4.0 ±7.0 45 Years Old or More 41 ±11 0 NR NR ±0 NR
RACE/ETHNICITY Non-Hispanic White 40 ±3 0 2 98 ±2 2.0 ±2.0 Total Minority 35 ±3 1 1 98 ±2 2.0 ±2.0
GENDER Male 52 ±6 1 1 98 ±4 2.0 ±4.0 Female 36 ±2 0 2 98 ±2 2.0 ±2.0
PROXIMITY TO VOTING RESIDENCE Absent 47 ±3 1 2 98 ±2 2.0 ±2.0 Not Absent 26 ±3 0 2 98 ±3 2.0 ±3.0
VOTER REGISTRATION STATUS Registered to Vote 37 ±2 0 2 98 ±2 2.0 ±2.0 Not Registered to Vote 41 ±5 1 1 99 ±4 1.0 ±3.0
Note. Percent responding are active duty spouses who answered the question; who definitely voted by mail, e-mail/fax, or online in the November 2, 2010 election or who definitely did not vote (Q17); and who had access to a fax between September 13 and November 2, 2010 (Q47). NR: Not reportable
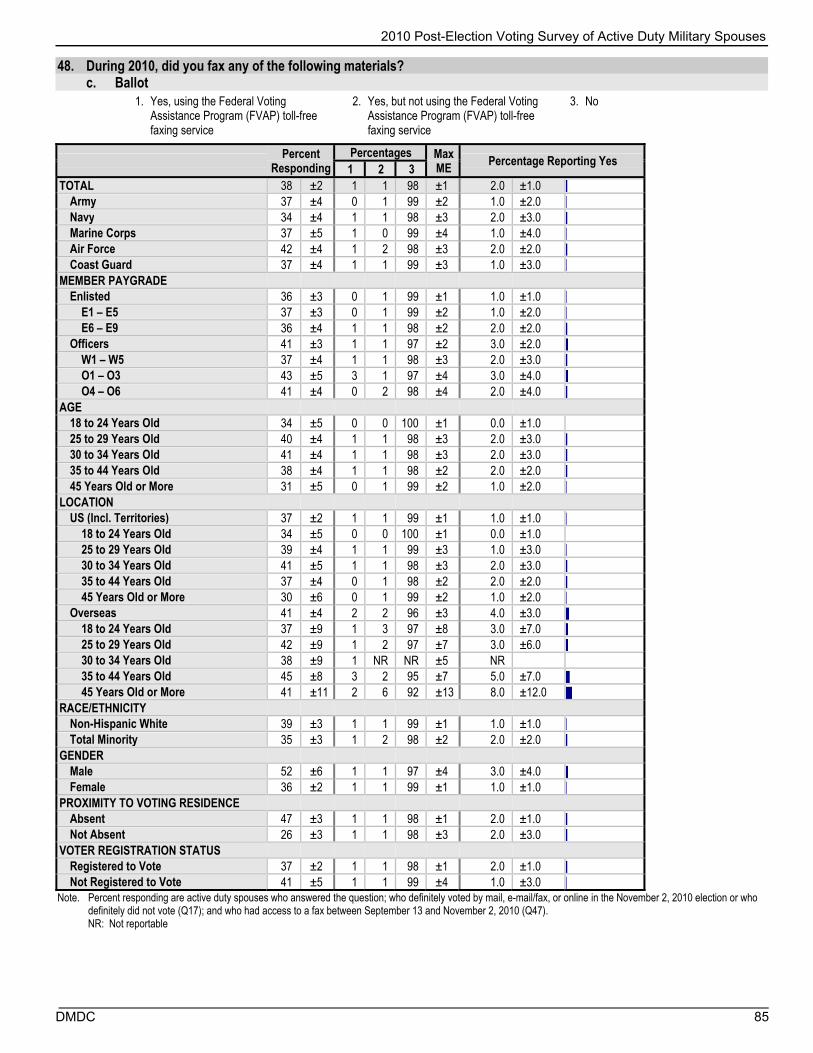
2010 Post-Election Voting Survey of Active Duty Military Spouses
DMDC 85
48. During 2010, did you fax any of the following materials? c. Ballot
1. Yes, using the Federal Voting Assistance Program (FVAP) toll-free faxing service
2. Yes, but not using the Federal Voting Assistance Program (FVAP) toll-free faxing service
3. No
Percent Responding
Percentages Max ME
Percentage Reporting Yes 1 2 3
TOTAL 38 ±2 1 1 98 ±1 2.0 ±1.0 Army 37 ±4 0 1 99 ±2 1.0 ±2.0 Navy 34 ±4 1 1 98 ±3 2.0 ±3.0 Marine Corps 37 ±5 1 0 99 ±4 1.0 ±4.0 Air Force 42 ±4 1 2 98 ±3 2.0 ±2.0 Coast Guard 37 ±4 1 1 99 ±3 1.0 ±3.0
MEMBER PAYGRADE Enlisted 36 ±3 0 1 99 ±1 1.0 ±1.0
E1 – E5 37 ±3 0 1 99 ±2 1.0 ±2.0 E6 – E9 36 ±4 1 1 98 ±2 2.0 ±2.0
Officers 41 ±3 1 1 97 ±2 3.0 ±2.0 W1 – W5 37 ±4 1 1 98 ±3 2.0 ±3.0 O1 – O3 43 ±5 3 1 97 ±4 3.0 ±4.0 O4 – O6 41 ±4 0 2 98 ±4 2.0 ±4.0
AGE 18 to 24 Years Old 34 ±5 0 0 100 ±1 0.0 ±1.0 25 to 29 Years Old 40 ±4 1 1 98 ±3 2.0 ±3.0 30 to 34 Years Old 41 ±4 1 1 98 ±3 2.0 ±3.0 35 to 44 Years Old 38 ±4 1 1 98 ±2 2.0 ±2.0 45 Years Old or More 31 ±5 0 1 99 ±2 1.0 ±2.0
LOCATION US (Incl. Territories) 37 ±2 1 1 99 ±1 1.0 ±1.0
18 to 24 Years Old 34 ±5 0 0 100 ±1 0.0 ±1.0 25 to 29 Years Old 39 ±4 1 1 99 ±3 1.0 ±3.0 30 to 34 Years Old 41 ±5 1 1 98 ±3 2.0 ±3.0 35 to 44 Years Old 37 ±4 0 1 98 ±2 2.0 ±2.0 45 Years Old or More 30 ±6 0 1 99 ±2 1.0 ±2.0
Overseas 41 ±4 2 2 96 ±3 4.0 ±3.0 18 to 24 Years Old 37 ±9 1 3 97 ±8 3.0 ±7.0 25 to 29 Years Old 42 ±9 1 2 97 ±7 3.0 ±6.0 30 to 34 Years Old 38 ±9 1 NR NR ±5 NR 35 to 44 Years Old 45 ±8 3 2 95 ±7 5.0 ±7.0 45 Years Old or More 41 ±11 2 6 92 ±13 8.0 ±12.0
RACE/ETHNICITY Non-Hispanic White 39 ±3 1 1 99 ±1 1.0 ±1.0 Total Minority 35 ±3 1 2 98 ±2 2.0 ±2.0
GENDER Male 52 ±6 1 1 97 ±4 3.0 ±4.0 Female 36 ±2 1 1 99 ±1 1.0 ±1.0
PROXIMITY TO VOTING RESIDENCE Absent 47 ±3 1 1 98 ±1 2.0 ±1.0 Not Absent 26 ±3 1 1 98 ±3 2.0 ±3.0
VOTER REGISTRATION STATUS Registered to Vote 37 ±2 1 1 98 ±1 2.0 ±1.0 Not Registered to Vote 41 ±5 1 1 99 ±4 1.0 ±3.0
Note. Percent responding are active duty spouses who answered the question; who definitely voted by mail, e-mail/fax, or online in the November 2, 2010 election or who definitely did not vote (Q17); and who had access to a fax between September 13 and November 2, 2010 (Q47). NR: Not reportable
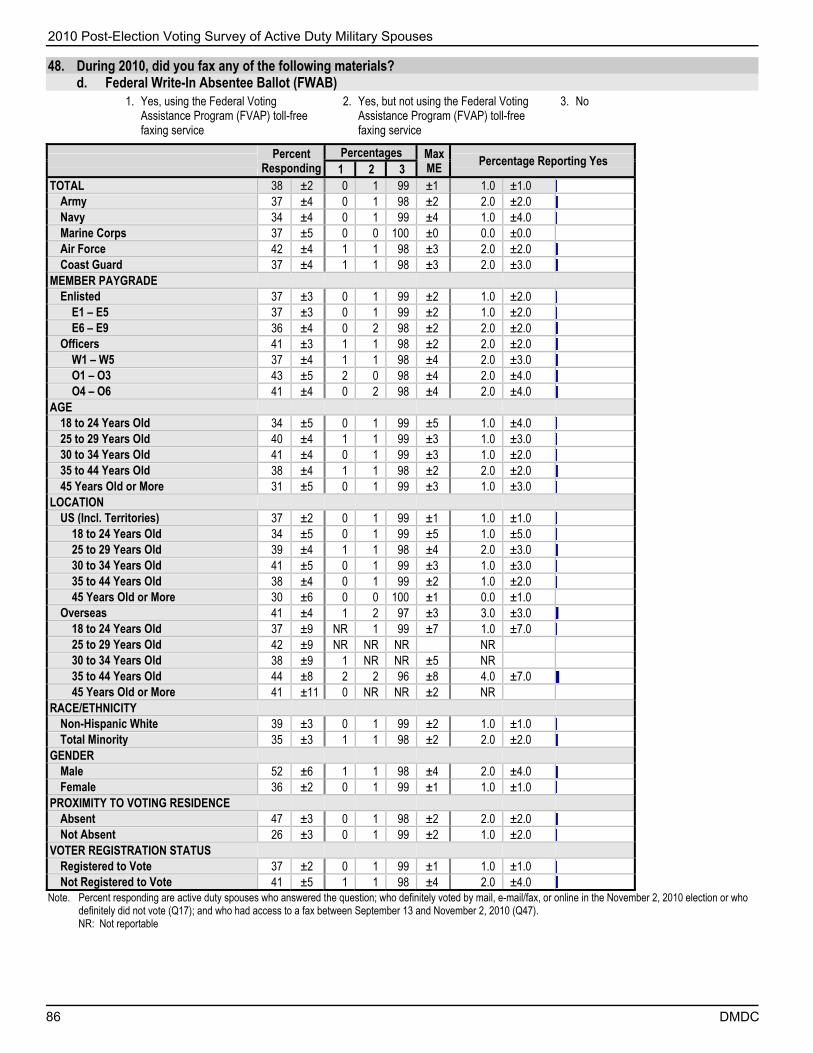
2010 Post-Election Voting Survey of Active Duty Military Spouses
86 DMDC
48. During 2010, did you fax any of the following materials? d. Federal Write-In Absentee Ballot (FWAB)
1. Yes, using the Federal Voting Assistance Program (FVAP) toll-free faxing service
2. Yes, but not using the Federal Voting Assistance Program (FVAP) toll-free faxing service
3. No
Percent Responding
Percentages Max ME
Percentage Reporting Yes 1 2 3
TOTAL 38 ±2 0 1 99 ±1 1.0 ±1.0 Army 37 ±4 0 1 98 ±2 2.0 ±2.0 Navy 34 ±4 0 1 99 ±4 1.0 ±4.0 Marine Corps 37 ±5 0 0 100 ±0 0.0 ±0.0 Air Force 42 ±4 1 1 98 ±3 2.0 ±2.0 Coast Guard 37 ±4 1 1 98 ±3 2.0 ±3.0
MEMBER PAYGRADE Enlisted 37 ±3 0 1 99 ±2 1.0 ±2.0
E1 – E5 37 ±3 0 1 99 ±2 1.0 ±2.0 E6 – E9 36 ±4 0 2 98 ±2 2.0 ±2.0
Officers 41 ±3 1 1 98 ±2 2.0 ±2.0 W1 – W5 37 ±4 1 1 98 ±4 2.0 ±3.0 O1 – O3 43 ±5 2 0 98 ±4 2.0 ±4.0 O4 – O6 41 ±4 0 2 98 ±4 2.0 ±4.0
AGE 18 to 24 Years Old 34 ±5 0 1 99 ±5 1.0 ±4.0 25 to 29 Years Old 40 ±4 1 1 99 ±3 1.0 ±3.0 30 to 34 Years Old 41 ±4 0 1 99 ±3 1.0 ±2.0 35 to 44 Years Old 38 ±4 1 1 98 ±2 2.0 ±2.0 45 Years Old or More 31 ±5 0 1 99 ±3 1.0 ±3.0
LOCATION US (Incl. Territories) 37 ±2 0 1 99 ±1 1.0 ±1.0
18 to 24 Years Old 34 ±5 0 1 99 ±5 1.0 ±5.0 25 to 29 Years Old 39 ±4 1 1 98 ±4 2.0 ±3.0 30 to 34 Years Old 41 ±5 0 1 99 ±3 1.0 ±3.0 35 to 44 Years Old 38 ±4 0 1 99 ±2 1.0 ±2.0 45 Years Old or More 30 ±6 0 0 100 ±1 0.0 ±1.0
Overseas 41 ±4 1 2 97 ±3 3.0 ±3.0 18 to 24 Years Old 37 ±9 NR 1 99 ±7 1.0 ±7.0 25 to 29 Years Old 42 ±9 NR NR NR NR 30 to 34 Years Old 38 ±9 1 NR NR ±5 NR 35 to 44 Years Old 44 ±8 2 2 96 ±8 4.0 ±7.0 45 Years Old or More 41 ±11 0 NR NR ±2 NR
RACE/ETHNICITY Non-Hispanic White 39 ±3 0 1 99 ±2 1.0 ±1.0 Total Minority 35 ±3 1 1 98 ±2 2.0 ±2.0
GENDER Male 52 ±6 1 1 98 ±4 2.0 ±4.0 Female 36 ±2 0 1 99 ±1 1.0 ±1.0
PROXIMITY TO VOTING RESIDENCE Absent 47 ±3 0 1 98 ±2 2.0 ±2.0 Not Absent 26 ±3 0 1 99 ±2 1.0 ±2.0
VOTER REGISTRATION STATUS Registered to Vote 37 ±2 0 1 99 ±1 1.0 ±1.0 Not Registered to Vote 41 ±5 1 1 98 ±4 2.0 ±4.0
Note. Percent responding are active duty spouses who answered the question; who definitely voted by mail, e-mail/fax, or online in the November 2, 2010 election or who definitely did not vote (Q17); and who had access to a fax between September 13 and November 2, 2010 (Q47). NR: Not reportable
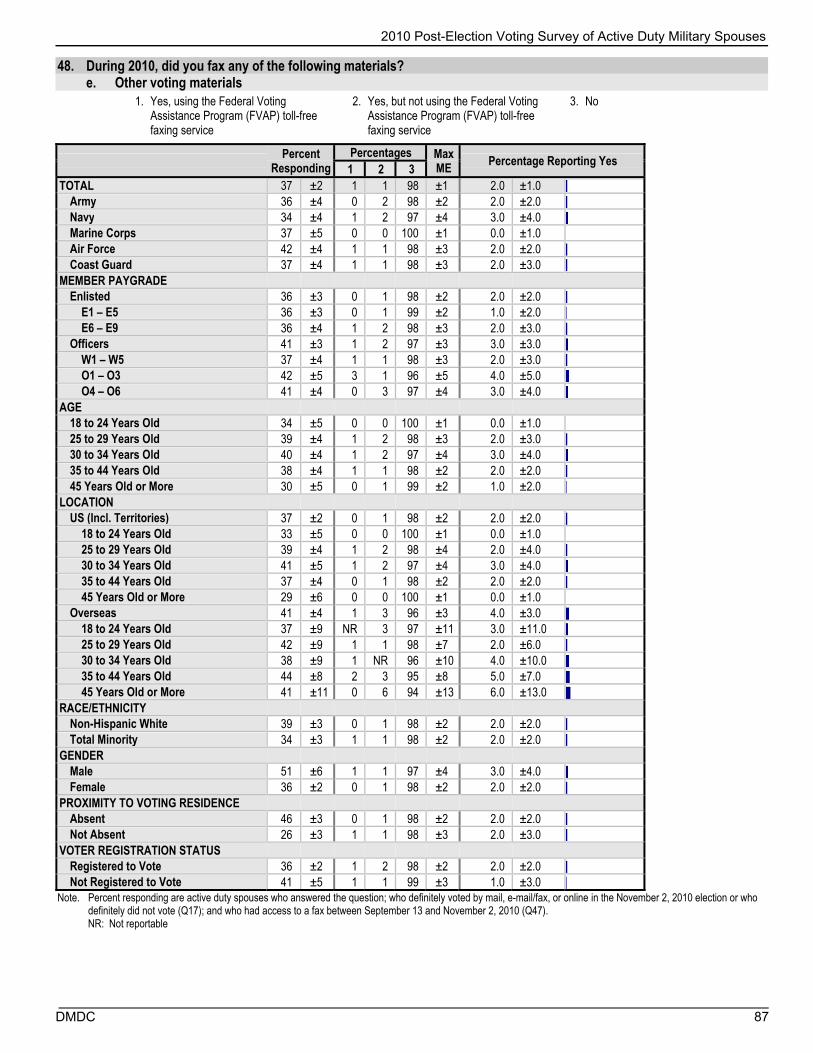
2010 Post-Election Voting Survey of Active Duty Military Spouses
DMDC 87
48. During 2010, did you fax any of the following materials? e. Other voting materials
1. Yes, using the Federal Voting Assistance Program (FVAP) toll-free faxing service
2. Yes, but not using the Federal Voting Assistance Program (FVAP) toll-free faxing service
3. No
Percent Responding
Percentages Max ME
Percentage Reporting Yes 1 2 3
TOTAL 37 ±2 1 1 98 ±1 2.0 ±1.0 Army 36 ±4 0 2 98 ±2 2.0 ±2.0 Navy 34 ±4 1 2 97 ±4 3.0 ±4.0 Marine Corps 37 ±5 0 0 100 ±1 0.0 ±1.0 Air Force 42 ±4 1 1 98 ±3 2.0 ±2.0 Coast Guard 37 ±4 1 1 98 ±3 2.0 ±3.0
MEMBER PAYGRADE Enlisted 36 ±3 0 1 98 ±2 2.0 ±2.0
E1 – E5 36 ±3 0 1 99 ±2 1.0 ±2.0 E6 – E9 36 ±4 1 2 98 ±3 2.0 ±3.0
Officers 41 ±3 1 2 97 ±3 3.0 ±3.0 W1 – W5 37 ±4 1 1 98 ±3 2.0 ±3.0 O1 – O3 42 ±5 3 1 96 ±5 4.0 ±5.0 O4 – O6 41 ±4 0 3 97 ±4 3.0 ±4.0
AGE 18 to 24 Years Old 34 ±5 0 0 100 ±1 0.0 ±1.0 25 to 29 Years Old 39 ±4 1 2 98 ±3 2.0 ±3.0 30 to 34 Years Old 40 ±4 1 2 97 ±4 3.0 ±4.0 35 to 44 Years Old 38 ±4 1 1 98 ±2 2.0 ±2.0 45 Years Old or More 30 ±5 0 1 99 ±2 1.0 ±2.0
LOCATION US (Incl. Territories) 37 ±2 0 1 98 ±2 2.0 ±2.0
18 to 24 Years Old 33 ±5 0 0 100 ±1 0.0 ±1.0 25 to 29 Years Old 39 ±4 1 2 98 ±4 2.0 ±4.0 30 to 34 Years Old 41 ±5 1 2 97 ±4 3.0 ±4.0 35 to 44 Years Old 37 ±4 0 1 98 ±2 2.0 ±2.0 45 Years Old or More 29 ±6 0 0 100 ±1 0.0 ±1.0
Overseas 41 ±4 1 3 96 ±3 4.0 ±3.0 18 to 24 Years Old 37 ±9 NR 3 97 ±11 3.0 ±11.0 25 to 29 Years Old 42 ±9 1 1 98 ±7 2.0 ±6.0 30 to 34 Years Old 38 ±9 1 NR 96 ±10 4.0 ±10.0 35 to 44 Years Old 44 ±8 2 3 95 ±8 5.0 ±7.0 45 Years Old or More 41 ±11 0 6 94 ±13 6.0 ±13.0
RACE/ETHNICITY Non-Hispanic White 39 ±3 0 1 98 ±2 2.0 ±2.0 Total Minority 34 ±3 1 1 98 ±2 2.0 ±2.0
GENDER Male 51 ±6 1 1 97 ±4 3.0 ±4.0 Female 36 ±2 0 1 98 ±2 2.0 ±2.0
PROXIMITY TO VOTING RESIDENCE Absent 46 ±3 0 1 98 ±2 2.0 ±2.0 Not Absent 26 ±3 1 1 98 ±3 2.0 ±3.0
VOTER REGISTRATION STATUS Registered to Vote 36 ±2 1 2 98 ±2 2.0 ±2.0 Not Registered to Vote 41 ±5 1 1 99 ±3 1.0 ±3.0
Note. Percent responding are active duty spouses who answered the question; who definitely voted by mail, e-mail/fax, or online in the November 2, 2010 election or who definitely did not vote (Q17); and who had access to a fax between September 13 and November 2, 2010 (Q47). NR: Not reportable

2010 Post-Election Voting Survey of Active Duty Military Spouses
88 DMDC
49. During 2010, did you e-mail any of the following materials?
a. Federal Post Card Application (FPCA) b. Non-Federal Post Card Application request for absentee ballot
c. Ballot
d. Federal Write-In Absentee Ballot (FWAB)
e. Other voting materials
Percent
Responding Percentages Max
ME a b c d e TOTAL 67 ±2 1 1 1 1 1 ±1
Army 66 ±3 1 1 1 0 1 ±2 Navy 64 ±4 2 2 2 1 2 ±3 Marine Corps 69 ±5 0 1 1 1 0 ±3 Air Force 72 ±4 2 3 2 1 1 ±2 Coast Guard 65 ±4 1 2 1 0 1 ±2
MEMBER PAYGRADE Enlisted 67 ±3 1 1 1 1 1 ±1
E1 – E5 70 ±3 1 1 1 0 1 ±2 E6 – E9 63 ±4 2 1 1 1 1 ±2
Officers 68 ±3 2 2 2 1 2 ±2 W1 – W5 63 ±4 2 2 3 1 2 ±2 O1 – O3 69 ±5 3 3 2 1 3 ±3 O4 – O6 67 ±4 2 2 2 0 2 ±3
AGE 18 to 24 Years Old 69 ±5 1 1 1 0 0 ±2 25 to 29 Years Old 73 ±4 1 1 1 1 2 ±2 30 to 34 Years Old 69 ±4 2 2 1 0 1 ±2 35 to 44 Years Old 63 ±4 2 2 3 1 2 ±2 45 Years Old or More 54 ±6 2 2 2 1 0 ±4
LOCATION US (Incl. Territories) 66 ±2 1 1 1 1 1 ±1
18 to 24 Years Old 69 ±5 1 1 1 0 0 ±2 25 to 29 Years Old 72 ±4 1 1 1 1 2 ±2 30 to 34 Years Old 68 ±4 2 1 1 0 1 ±2 35 to 44 Years Old 61 ±4 2 1 3 1 2 ±2 45 Years Old or More 52 ±6 2 2 2 0 0 ±4
Overseas 81 ±4 2 3 2 2 2 ±3 18 to 24 Years Old 75 ±11 1 1 1 NR 1 ±6 25 to 29 Years Old 80 ±9 2 3 1 0 1 ±4 30 to 34 Years Old 78 ±8 0 3 1 1 1 ±5 35 to 44 Years Old 88 ±6 5 3 4 4 2 ±8 45 Years Old or More 76 ±10 2 3 1 NR 2 ±8
RACE/ETHNICITY Non-Hispanic White 71 ±3 1 2 1 1 1 ±1 Total Minority 62 ±3 2 1 2 1 1 ±2
GENDER Male 66 ±6 3 2 2 2 2 ±4 Female 68 ±2 1 1 1 1 1 ±1
PROXIMITY TO VOTING RESIDENCE Absent 82 ±2 2 2 2 1 1 ±1 Not Absent 49 ±3 1 1 1 0 1 ±2
VOTER REGISTRATION STATUS Registered to Vote 64 ±2 2 2 2 1 1 ±1 Not Registered to Vote 80 ±4 1 0 0 0 1 ±2
Note. Percent responding are active duty spouses who answered the question; who definitely voted by mail, e-mail/fax, or online in the November 2, 2010 election or who definitely did not vote (Q17); and who had access to a DoD e-mail address or a personal e-mail between September 13 and November 2, 2010 (Q47). NR: Not reportable

2010 Post-Election Voting Survey of Active Duty Military Spouses
DMDC 89
50. What was the MAIN reason you did not vote in the November 2, 2010 election?
1. I was not interested in voting. 2. I was not registered to vote. 3. I was too busy to vote. 4. I forgot to vote. 5. I could not register to vote. 6. I had no candidate preference. 7. I did not think my vote would matter. 8. The absentee voting process was too
complicated. 9. I was concerned about federal or state
income tax liability. 10. I missed the state deadline for voter
registration. 11. I tried to vote but did not or could not
complete the process. 12. Some other reason.
Percent Responding
Percentages Max ME 1 2 3 4 5 6 7 8 9 10 11 12
TOTAL 60 ±2 26 10 7 6 1 13 3 6 0 6 4 17 ±3 Army 62 ±3 25 11 8 7 1 12 3 8 0 5 4 17 ±4 Navy 55 ±4 25 10 7 6 1 13 3 6 1 5 4 20 ±6 Marine Corps 64 ±5 31 10 5 6 3 11 2 5 0 5 6 15 ±7 Air Force 58 ±4 27 7 9 6 1 15 4 5 0 7 4 15 ±5 Coast Guard 53 ±4 22 10 8 8 1 11 2 8 1 5 5 20 ±5
MEMBER PAYGRADE Enlisted 63 ±3 28 11 7 6 1 12 3 5 0 5 4 17 ±3
E1 – E5 71 ±3 29 10 7 6 1 12 4 5 0 4 4 17 ±4 E6 – E9 52 ±4 25 11 8 6 1 13 2 6 0 6 4 16 ±5
Officers 47 ±3 17 7 7 7 2 15 2 12 1 9 4 17 ±4 W1 – W5 52 ±4 19 10 7 7 2 14 3 8 0 9 4 16 ±5 O1 – O3 52 ±5 20 7 8 7 1 15 2 14 0 9 2 15 ±6 O4 – O6 40 ±4 14 7 7 7 3 16 2 10 1 8 7 19 ±6
AGE 18 to 24 Years Old 74 ±4 30 11 8 8 1 12 2 5 0 5 4 16 ±5 25 to 29 Years Old 66 ±4 27 10 6 6 1 11 4 6 1 5 5 17 ±5 30 to 34 Years Old 59 ±4 25 9 8 7 1 13 4 7 0 6 4 16 ±5 35 to 44 Years Old 47 ±4 20 9 8 5 1 15 2 9 0 7 5 20 ±5 45 Years Old or More 38 ±6 21 12 8 3 1 14 3 5 0 10 5 18 ±9
LOCATION US (Incl. Territories) 59 ±2 27 10 8 6 1 13 3 6 0 6 4 17 ±3
18 to 24 Years Old 74 ±5 31 11 7 8 1 12 2 4 0 5 3 16 ±6 25 to 29 Years Old 66 ±4 27 11 6 6 1 12 5 6 1 5 5 16 ±5 30 to 34 Years Old 58 ±5 26 9 8 6 0 13 4 7 0 6 4 16 ±6 35 to 44 Years Old 45 ±4 21 9 9 5 1 16 2 8 0 6 4 20 ±5 45 Years Old or More 37 ±6 21 13 9 3 0 14 3 4 0 10 5 18 ±10
Overseas 69 ±4 20 7 7 10 2 11 2 11 0 6 6 19 ±5 18 to 24 Years Old 77 ±11 20 5 10 15 NR 12 1 11 NR 3 6 16 ±11 25 to 29 Years Old 75 ±7 28 5 7 9 1 7 2 11 0 4 4 22 ±12 30 to 34 Years Old 68 ±9 21 7 8 9 4 12 4 7 NR 6 4 18 ±11 35 to 44 Years Old 66 ±8 12 11 4 8 2 13 3 13 0 9 8 18 ±8 45 Years Old or More 48 ±12 11 13 4 6 2 8 3 NR 0 3 10 15 ±13
RACE/ETHNICITY Non-Hispanic White 60 ±3 25 8 7 6 1 14 4 8 0 5 5 17 ±3 Total Minority 60 ±3 27 13 8 7 1 11 1 4 1 7 4 17 ±4
GENDER Male 56 ±6 34 8 9 6 1 11 5 5 0 6 2 13 ±8 Female 60 ±2 25 10 7 6 1 13 3 6 0 6 5 17 ±3
PROXIMITY TO VOTING RESIDENCE Absent 69 ±3 26 9 5 6 1 11 3 9 1 5 5 20 ±3 Not Absent 47 ±3 27 10 13 8 1 16 3 1 0 7 2 12 ±4
VOTER REGISTRATION STATUS Registered to Vote 52 ±2 23 2 9 8 0 16 2 8 0 5 5 20 ±3 Not Registered to Vote 91 ±3 33 28 3 2 2 5 5 3 0 7 3 9 ±5
Note. Percent responding are active duty spouses who answered the question and who definitely did not vote (Q17). NR: Not reportable

2010 Post-Election Voting Survey of Active Duty Military Spouses
90 DMDC
51. Did you vote in the 2008 Presidential, U.S. Senate, and U.S. House of Representatives election?
1. Yes, I voted in person. 2. Yes, I voted by mail, e-mail, fax, or online.
3. No, I did not vote.
4. Not sure.
Percent Responding
Percentages Max ME
Percentage Reporting Yes 1 2 3 4
TOTAL 97 ±1 40 21 35 4 ±2 61.0 ±2.0 Army 97 ±1 41 18 36 5 ±4 59.0 ±4.0 Navy 98 ±2 41 22 34 4 ±4 63.0 ±4.0 Marine Corps 97 ±2 41 20 36 3 ±6 61.0 ±6.0 Air Force 97 ±2 36 26 34 3 ±4 63.0 ±4.0 Coast Guard 98 ±1 44 23 29 4 ±4 67.0 ±4.0
MEMBER PAYGRADE Enlisted 97 ±1 39 17 39 4 ±3 56.0 ±3.0
E1 – E5 97 ±1 37 13 46 4 ±3 50.0 ±3.0 E6 – E9 97 ±2 43 23 30 4 ±4 66.0 ±4.0
Officers 98 ±1 43 36 18 3 ±3 79.0 ±3.0 W1 – W5 98 ±2 42 27 28 2 ±4 70.0 ±4.0 O1 – O3 98 ±2 45 30 23 2 ±5 75.0 ±5.0 O4 – O6 99 ±1 40 44 12 3 ±5 84.0 ±4.0
AGE 18 to 24 Years Old 98 ±2 37 8 50 5 ±5 45.0 ±5.0 25 to 29 Years Old 97 ±2 35 19 41 5 ±4 54.0 ±4.0 30 to 34 Years Old 98 ±2 41 23 32 3 ±5 64.0 ±4.0 35 to 44 Years Old 97 ±2 44 31 22 3 ±4 75.0 ±3.0 45 Years Old or More 99 ±1 48 29 21 3 ±6 76.0 ±6.0
LOCATION US (Incl. Territories) 98 ±1 41 20 35 4 ±2 61.0 ±2.0
18 to 24 Years Old 98 ±2 37 7 50 5 ±5 45.0 ±5.0 25 to 29 Years Old 97 ±2 36 18 41 5 ±5 54.0 ±5.0 30 to 34 Years Old 98 ±2 42 22 32 3 ±5 65.0 ±5.0 35 to 44 Years Old 97 ±2 46 29 22 3 ±4 75.0 ±4.0 45 Years Old or More 99 ±1 49 28 20 3 ±6 77.0 ±6.0
Overseas 95 ±2 28 32 36 4 ±5 60.0 ±5.0 18 to 24 Years Old 93 ±7 39 12 46 3 ±11 51.0 ±10.0 25 to 29 Years Old 94 ±5 28 25 41 6 ±10 53.0 ±9.0 30 to 34 Years Old 92 ±5 26 36 34 4 ±9 62.0 ±9.0 35 to 44 Years Old 99 ±2 22 46 28 3 ±8 68.0 ±8.0 45 Years Old or More 97 ±4 32 37 28 2 ±14 70.0 ±11.0
RACE/ETHNICITY Non-Hispanic White 98 ±1 41 23 32 4 ±3 64.0 ±3.0 Total Minority 97 ±2 39 17 40 5 ±4 56.0 ±4.0
GENDER Male 95 ±3 28 25 43 3 ±6 53.0 ±6.0 Female 98 ±1 41 21 34 4 ±2 62.0 ±2.0
PROXIMITY TO VOTING RESIDENCE Absent 97 ±1 29 29 38 4 ±3 58.0 ±3.0 Not Absent 98 ±1 54 11 30 4 ±3 66.0 ±3.0
VOTER REGISTRATION STATUS Registered to Vote 97 ±1 47 26 23 4 ±3 73.0 ±2.0 Not Registered to Vote 98 ±2 10 3 84 3 ±4 13.0 ±4.0
Note. Percent responding are active duty spouses who answered the question.
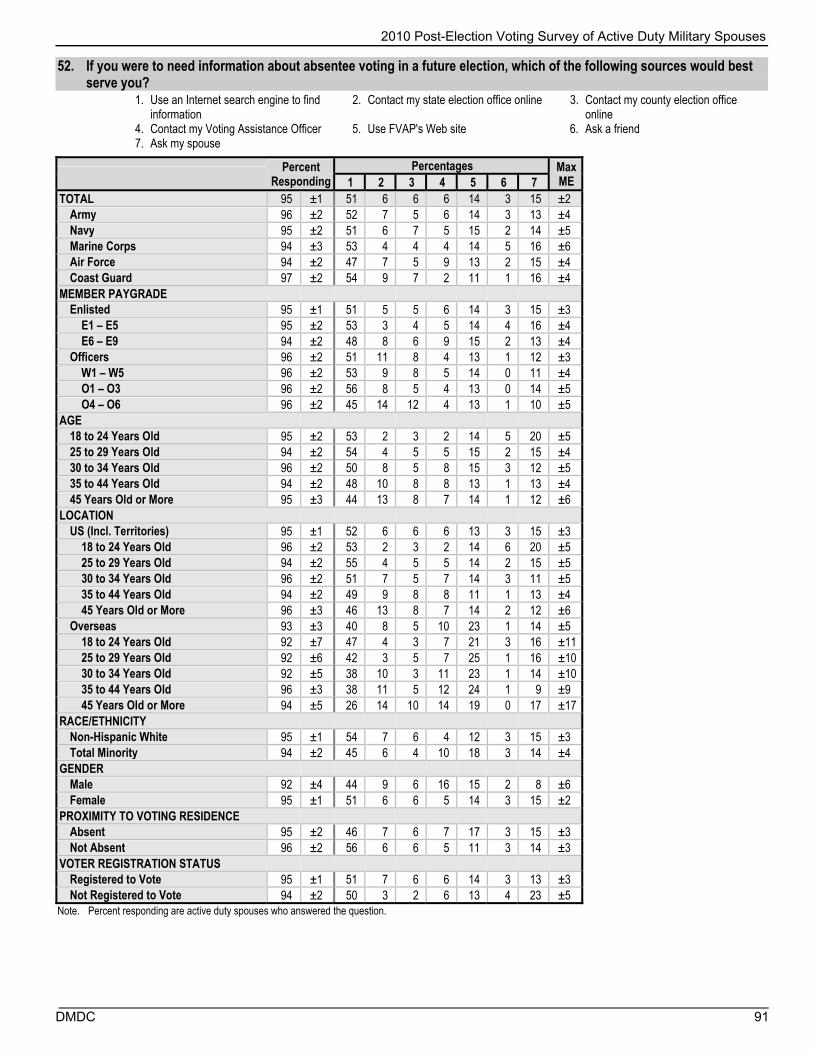
2010 Post-Election Voting Survey of Active Duty Military Spouses
DMDC 91
52. If you were to need information about absentee voting in a future election, which of the following sources would best serve you?
1. Use an Internet search engine to find information
2. Contact my state election office online 3. Contact my county election office online
4. Contact my Voting Assistance Officer 5. Use FVAP's Web site 6. Ask a friend 7. Ask my spouse
Percent Responding
Percentages Max ME 1 2 3 4 5 6 7
TOTAL 95 ±1 51 6 6 6 14 3 15 ±2 Army 96 ±2 52 7 5 6 14 3 13 ±4 Navy 95 ±2 51 6 7 5 15 2 14 ±5 Marine Corps 94 ±3 53 4 4 4 14 5 16 ±6 Air Force 94 ±2 47 7 5 9 13 2 15 ±4 Coast Guard 97 ±2 54 9 7 2 11 1 16 ±4
MEMBER PAYGRADE Enlisted 95 ±1 51 5 5 6 14 3 15 ±3
E1 – E5 95 ±2 53 3 4 5 14 4 16 ±4 E6 – E9 94 ±2 48 8 6 9 15 2 13 ±4
Officers 96 ±2 51 11 8 4 13 1 12 ±3 W1 – W5 96 ±2 53 9 8 5 14 0 11 ±4 O1 – O3 96 ±2 56 8 5 4 13 0 14 ±5 O4 – O6 96 ±2 45 14 12 4 13 1 10 ±5
AGE 18 to 24 Years Old 95 ±2 53 2 3 2 14 5 20 ±5 25 to 29 Years Old 94 ±2 54 4 5 5 15 2 15 ±4 30 to 34 Years Old 96 ±2 50 8 5 8 15 3 12 ±5 35 to 44 Years Old 94 ±2 48 10 8 8 13 1 13 ±4 45 Years Old or More 95 ±3 44 13 8 7 14 1 12 ±6
LOCATION US (Incl. Territories) 95 ±1 52 6 6 6 13 3 15 ±3
18 to 24 Years Old 96 ±2 53 2 3 2 14 6 20 ±5 25 to 29 Years Old 94 ±2 55 4 5 5 14 2 15 ±5 30 to 34 Years Old 96 ±2 51 7 5 7 14 3 11 ±5 35 to 44 Years Old 94 ±2 49 9 8 8 11 1 13 ±4 45 Years Old or More 96 ±3 46 13 8 7 14 2 12 ±6
Overseas 93 ±3 40 8 5 10 23 1 14 ±5 18 to 24 Years Old 92 ±7 47 4 3 7 21 3 16 ±11 25 to 29 Years Old 92 ±6 42 3 5 7 25 1 16 ±10 30 to 34 Years Old 92 ±5 38 10 3 11 23 1 14 ±10 35 to 44 Years Old 96 ±3 38 11 5 12 24 1 9 ±9 45 Years Old or More 94 ±5 26 14 10 14 19 0 17 ±17
RACE/ETHNICITY Non-Hispanic White 95 ±1 54 7 6 4 12 3 15 ±3 Total Minority 94 ±2 45 6 4 10 18 3 14 ±4
GENDER Male 92 ±4 44 9 6 16 15 2 8 ±6 Female 95 ±1 51 6 6 5 14 3 15 ±2
PROXIMITY TO VOTING RESIDENCE Absent 95 ±2 46 7 6 7 17 3 15 ±3 Not Absent 96 ±2 56 6 6 5 11 3 14 ±3
VOTER REGISTRATION STATUS Registered to Vote 95 ±1 51 7 6 6 14 3 13 ±3 Not Registered to Vote 94 ±2 50 3 2 6 13 4 23 ±5
Note. Percent responding are active duty spouses who answered the question.
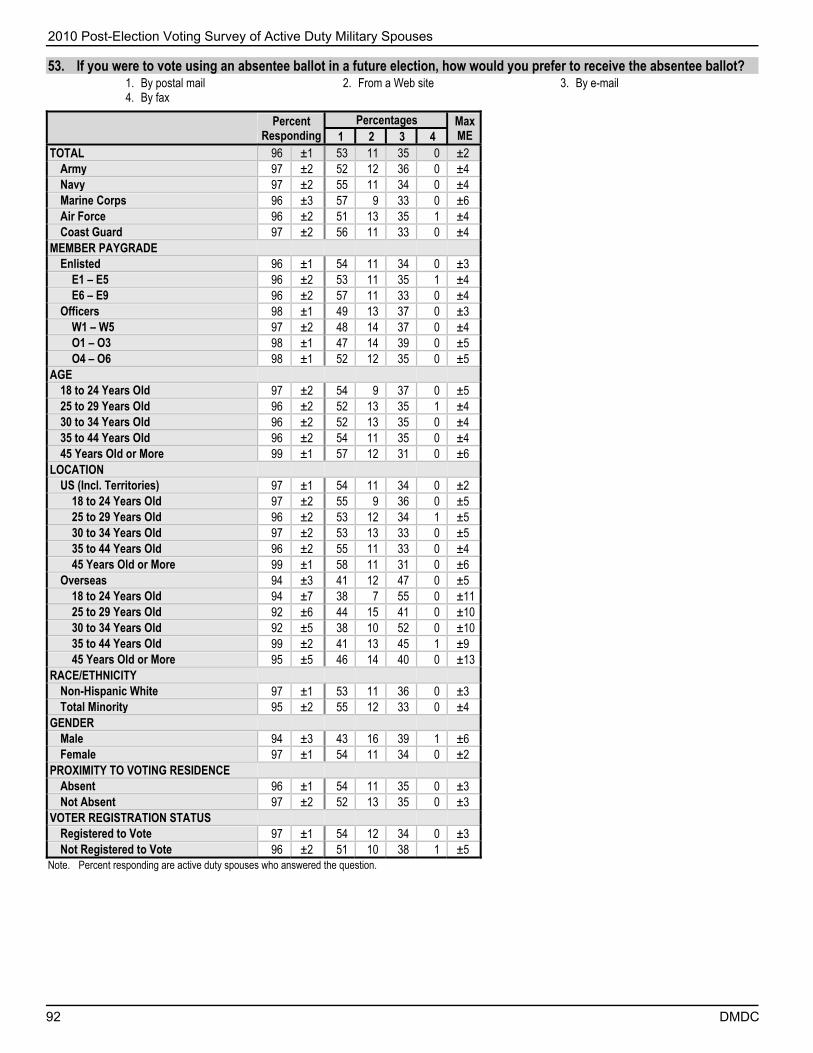
2010 Post-Election Voting Survey of Active Duty Military Spouses
92 DMDC
53. If you were to vote using an absentee ballot in a future election, how would you prefer to receive the absentee ballot?
1. By postal mail 2. From a Web site 3. By e-mail 4. By fax
Percent
Responding Percentages Max
ME 1 2 3 4 TOTAL 96 ±1 53 11 35 0 ±2
Army 97 ±2 52 12 36 0 ±4 Navy 97 ±2 55 11 34 0 ±4 Marine Corps 96 ±3 57 9 33 0 ±6 Air Force 96 ±2 51 13 35 1 ±4 Coast Guard 97 ±2 56 11 33 0 ±4
MEMBER PAYGRADE Enlisted 96 ±1 54 11 34 0 ±3
E1 – E5 96 ±2 53 11 35 1 ±4 E6 – E9 96 ±2 57 11 33 0 ±4
Officers 98 ±1 49 13 37 0 ±3 W1 – W5 97 ±2 48 14 37 0 ±4 O1 – O3 98 ±1 47 14 39 0 ±5 O4 – O6 98 ±1 52 12 35 0 ±5
AGE 18 to 24 Years Old 97 ±2 54 9 37 0 ±5 25 to 29 Years Old 96 ±2 52 13 35 1 ±4 30 to 34 Years Old 96 ±2 52 13 35 0 ±4 35 to 44 Years Old 96 ±2 54 11 35 0 ±4 45 Years Old or More 99 ±1 57 12 31 0 ±6
LOCATION US (Incl. Territories) 97 ±1 54 11 34 0 ±2
18 to 24 Years Old 97 ±2 55 9 36 0 ±5 25 to 29 Years Old 96 ±2 53 12 34 1 ±5 30 to 34 Years Old 97 ±2 53 13 33 0 ±5 35 to 44 Years Old 96 ±2 55 11 33 0 ±4 45 Years Old or More 99 ±1 58 11 31 0 ±6
Overseas 94 ±3 41 12 47 0 ±5 18 to 24 Years Old 94 ±7 38 7 55 0 ±11 25 to 29 Years Old 92 ±6 44 15 41 0 ±10 30 to 34 Years Old 92 ±5 38 10 52 0 ±10 35 to 44 Years Old 99 ±2 41 13 45 1 ±9 45 Years Old or More 95 ±5 46 14 40 0 ±13
RACE/ETHNICITY Non-Hispanic White 97 ±1 53 11 36 0 ±3 Total Minority 95 ±2 55 12 33 0 ±4
GENDER Male 94 ±3 43 16 39 1 ±6 Female 97 ±1 54 11 34 0 ±2
PROXIMITY TO VOTING RESIDENCE Absent 96 ±1 54 11 35 0 ±3 Not Absent 97 ±2 52 13 35 0 ±3
VOTER REGISTRATION STATUS Registered to Vote 97 ±1 54 12 34 0 ±3 Not Registered to Vote 96 ±2 51 10 38 1 ±5
Note. Percent responding are active duty spouses who answered the question.

2010 Post-Election Voting Survey of Active Duty Military Spouses
DMDC 93
54. If you were to vote using an absentee ballot in a future election, how would you prefer to return the absentee ballot?
1. Return by mail 2. Return online 3. Return via fax
Percent
Responding Percentages Max
ME 1 2 3 TOTAL 97 ±1 53 46 1 ±2
Army 97 ±2 51 48 2 ±4 Navy 97 ±2 56 43 1 ±4 Marine Corps 96 ±3 54 44 1 ±6 Air Force 96 ±2 51 48 1 ±4 Coast Guard 97 ±2 54 45 1 ±4
MEMBER PAYGRADE Enlisted 96 ±1 54 45 1 ±3
E1 – E5 96 ±2 53 46 1 ±4 E6 – E9 96 ±2 56 43 1 ±4
Officers 98 ±1 48 51 1 ±3 W1 – W5 97 ±2 46 53 1 ±4 O1 – O3 98 ±1 44 55 1 ±5 O4 – O6 98 ±1 52 48 1 ±5
AGE 18 to 24 Years Old 97 ±2 54 44 2 ±5 25 to 29 Years Old 96 ±2 52 47 1 ±4 30 to 34 Years Old 97 ±2 49 50 1 ±5 35 to 44 Years Old 96 ±2 54 45 1 ±4 45 Years Old or More 99 ±1 56 42 2 ±6
LOCATION US (Incl. Territories) 97 ±1 54 45 1 ±2
18 to 24 Years Old 97 ±2 55 43 2 ±5 25 to 29 Years Old 96 ±2 53 46 1 ±5 30 to 34 Years Old 97 ±2 50 49 1 ±5 35 to 44 Years Old 96 ±2 55 44 1 ±4 45 Years Old or More 99 ±1 57 41 2 ±6
Overseas 94 ±3 40 59 1 ±5 18 to 24 Years Old 93 ±7 32 67 1 ±10 25 to 29 Years Old 92 ±6 41 57 2 ±9 30 to 34 Years Old 92 ±5 40 60 0 ±10 35 to 44 Years Old 98 ±3 43 56 1 ±9 45 Years Old or More 96 ±4 43 55 1 ±11
RACE/ETHNICITY Non-Hispanic White 97 ±1 52 46 1 ±3 Total Minority 96 ±2 53 46 1 ±4
GENDER Male 95 ±3 41 57 2 ±6 Female 97 ±1 54 45 1 ±2
PROXIMITY TO VOTING RESIDENCE Absent 97 ±1 53 46 2 ±3 Not Absent 97 ±2 52 47 1 ±3
VOTER REGISTRATION STATUS Registered to Vote 97 ±1 53 46 1 ±3 Not Registered to Vote 96 ±2 49 48 3 ±5
Note. Percent responding are active duty spouses who answered the question.

2010 Post-Election Voting Survey of Active Duty Military Spouses
94 DMDC
55. To what extent do you agree or disagree with the following statement? I am confident that completing and sending a ballot online via the Internet is safe, secure, and reliable.
1. Strongly disagree 2. Disagree 3. Neither agree nor disagree 4. Agree 5. Strongly agree
Percent
Responding Percentages Max
ME Average Agreement
1 2 3 4 5 TOTAL 97 ±1 8 14 25 34 18 ±2 3.4 ±0.1
Army 97 ±1 8 13 25 34 19 ±4 3.4 ±0.1 Navy 97 ±2 9 14 27 33 18 ±4 3.4 ±0.1 Marine Corps 97 ±3 10 15 27 34 14 ±6 3.3 ±0.2 Air Force 97 ±2 6 15 23 36 19 ±4 3.5 ±0.1 Coast Guard 98 ±2 7 13 26 35 19 ±4 3.5 ±0.1
MEMBER PAYGRADE Enlisted 97 ±1 8 14 27 34 18 ±3 3.4 ±0.1
E1 – E5 97 ±1 8 12 27 35 17 ±3 3.4 ±0.1 E6 – E9 97 ±2 8 15 27 32 18 ±4 3.4 ±0.1
Officers 98 ±1 7 16 20 37 21 ±3 3.5 ±0.1 W1 – W5 98 ±1 7 16 28 33 17 ±4 3.4 ±0.1 O1 – O3 99 ±1 8 14 19 38 22 ±5 3.5 ±0.2 O4 – O6 98 ±1 6 17 19 36 22 ±4 3.5 ±0.1
AGE 18 to 24 Years Old 98 ±2 7 14 27 37 15 ±5 3.4 ±0.2 25 to 29 Years Old 96 ±2 7 14 28 35 17 ±4 3.4 ±0.1 30 to 34 Years Old 97 ±2 9 12 26 32 21 ±4 3.4 ±0.1 35 to 44 Years Old 97 ±2 9 16 22 34 20 ±4 3.4 ±0.1 45 Years Old or More 99 ±1 6 14 21 39 20 ±6 3.5 ±0.2
LOCATION US (Incl. Territories) 97 ±1 8 14 25 34 18 ±2 3.4 ±0.1
18 to 24 Years Old 98 ±2 8 15 27 36 15 ±5 3.4 ±0.2 25 to 29 Years Old 97 ±2 7 14 28 34 17 ±4 3.4 ±0.1 30 to 34 Years Old 98 ±2 9 12 27 31 21 ±5 3.4 ±0.2 35 to 44 Years Old 97 ±2 9 16 22 32 20 ±4 3.4 ±0.1 45 Years Old or More 99 ±1 5 14 21 39 20 ±6 3.5 ±0.2
Overseas 95 ±3 5 11 25 40 20 ±5 3.6 ±0.1 18 to 24 Years Old 94 ±7 4 10 32 40 13 ±12 3.5 ±0.2 25 to 29 Years Old 92 ±6 5 12 24 40 18 ±10 3.5 ±0.2 30 to 34 Years Old 93 ±5 4 9 25 38 23 ±10 3.7 ±0.2 35 to 44 Years Old 99 ±2 2 11 23 41 22 ±9 3.7 ±0.2 45 Years Old or More 97 ±4 13 11 21 33 22 ±16 3.4 ±0.4
RACE/ETHNICITY Non-Hispanic White 98 ±1 8 15 24 35 18 ±3 3.4 ±0.1 Total Minority 96 ±2 8 11 29 34 19 ±4 3.5 ±0.1
GENDER Male 95 ±3 7 11 25 34 23 ±6 3.5 ±0.2 Female 97 ±1 8 14 25 35 18 ±2 3.4 ±0.1
PROXIMITY TO VOTING RESIDENCE Absent 97 ±1 7 14 26 34 18 ±3 3.4 ±0.1 Not Absent 98 ±1 9 14 24 35 18 ±3 3.4 ±0.1
VOTER REGISTRATION STATUS Registered to Vote 97 ±1 8 15 23 35 19 ±2 3.4 ±0.1 Not Registered to Vote 97 ±2 7 12 34 32 15 ±5 3.4 ±0.1
Note. Percent responding are active duty spouses who answered the question.
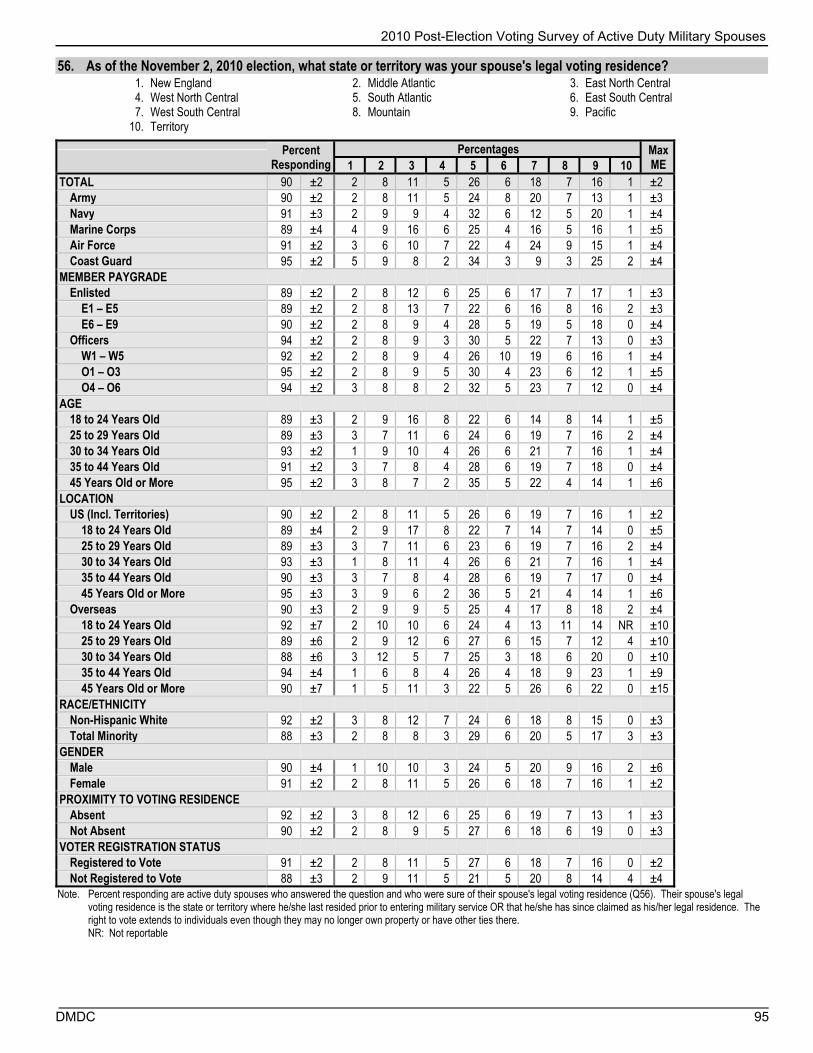
2010 Post-Election Voting Survey of Active Duty Military Spouses
DMDC 95
56. As of the November 2, 2010 election, what state or territory was your spouse's legal voting residence?
1. New England 2. Middle Atlantic 3. East North Central 4. West North Central 5. South Atlantic 6. East South Central 7. West South Central 8. Mountain 9. Pacific
10. Territory
Percent
Responding Percentages Max
ME 1 2 3 4 5 6 7 8 9 10 TOTAL 90 ±2 2 8 11 5 26 6 18 7 16 1 ±2
Army 90 ±2 2 8 11 5 24 8 20 7 13 1 ±3 Navy 91 ±3 2 9 9 4 32 6 12 5 20 1 ±4 Marine Corps 89 ±4 4 9 16 6 25 4 16 5 16 1 ±5 Air Force 91 ±2 3 6 10 7 22 4 24 9 15 1 ±4 Coast Guard 95 ±2 5 9 8 2 34 3 9 3 25 2 ±4
MEMBER PAYGRADE Enlisted 89 ±2 2 8 12 6 25 6 17 7 17 1 ±3
E1 – E5 89 ±2 2 8 13 7 22 6 16 8 16 2 ±3 E6 – E9 90 ±2 2 8 9 4 28 5 19 5 18 0 ±4
Officers 94 ±2 2 8 9 3 30 5 22 7 13 0 ±3 W1 – W5 92 ±2 2 8 9 4 26 10 19 6 16 1 ±4 O1 – O3 95 ±2 2 8 9 5 30 4 23 6 12 1 ±5 O4 – O6 94 ±2 3 8 8 2 32 5 23 7 12 0 ±4
AGE 18 to 24 Years Old 89 ±3 2 9 16 8 22 6 14 8 14 1 ±5 25 to 29 Years Old 89 ±3 3 7 11 6 24 6 19 7 16 2 ±4 30 to 34 Years Old 93 ±2 1 9 10 4 26 6 21 7 16 1 ±4 35 to 44 Years Old 91 ±2 3 7 8 4 28 6 19 7 18 0 ±4 45 Years Old or More 95 ±2 3 8 7 2 35 5 22 4 14 1 ±6
LOCATION US (Incl. Territories) 90 ±2 2 8 11 5 26 6 19 7 16 1 ±2
18 to 24 Years Old 89 ±4 2 9 17 8 22 7 14 7 14 0 ±5 25 to 29 Years Old 89 ±3 3 7 11 6 23 6 19 7 16 2 ±4 30 to 34 Years Old 93 ±3 1 8 11 4 26 6 21 7 16 1 ±4 35 to 44 Years Old 90 ±3 3 7 8 4 28 6 19 7 17 0 ±4 45 Years Old or More 95 ±3 3 9 6 2 36 5 21 4 14 1 ±6
Overseas 90 ±3 2 9 9 5 25 4 17 8 18 2 ±4 18 to 24 Years Old 92 ±7 2 10 10 6 24 4 13 11 14 NR ±10 25 to 29 Years Old 89 ±6 2 9 12 6 27 6 15 7 12 4 ±10 30 to 34 Years Old 88 ±6 3 12 5 7 25 3 18 6 20 0 ±10 35 to 44 Years Old 94 ±4 1 6 8 4 26 4 18 9 23 1 ±9 45 Years Old or More 90 ±7 1 5 11 3 22 5 26 6 22 0 ±15
RACE/ETHNICITY Non-Hispanic White 92 ±2 3 8 12 7 24 6 18 8 15 0 ±3 Total Minority 88 ±3 2 8 8 3 29 6 20 5 17 3 ±3
GENDER Male 90 ±4 1 10 10 3 24 5 20 9 16 2 ±6 Female 91 ±2 2 8 11 5 26 6 18 7 16 1 ±2
PROXIMITY TO VOTING RESIDENCE Absent 92 ±2 3 8 12 6 25 6 19 7 13 1 ±3 Not Absent 90 ±2 2 8 9 5 27 6 18 6 19 0 ±3
VOTER REGISTRATION STATUS Registered to Vote 91 ±2 2 8 11 5 27 6 18 7 16 0 ±2 Not Registered to Vote 88 ±3 2 9 11 5 21 5 20 8 14 4 ±4
Note. Percent responding are active duty spouses who answered the question and who were sure of their spouse's legal voting residence (Q56). Their spouse's legal voting residence is the state or territory where he/she last resided prior to entering military service OR that he/she has since claimed as his/her legal residence. The right to vote extends to individuals even though they may no longer own property or have other ties there. NR: Not reportable
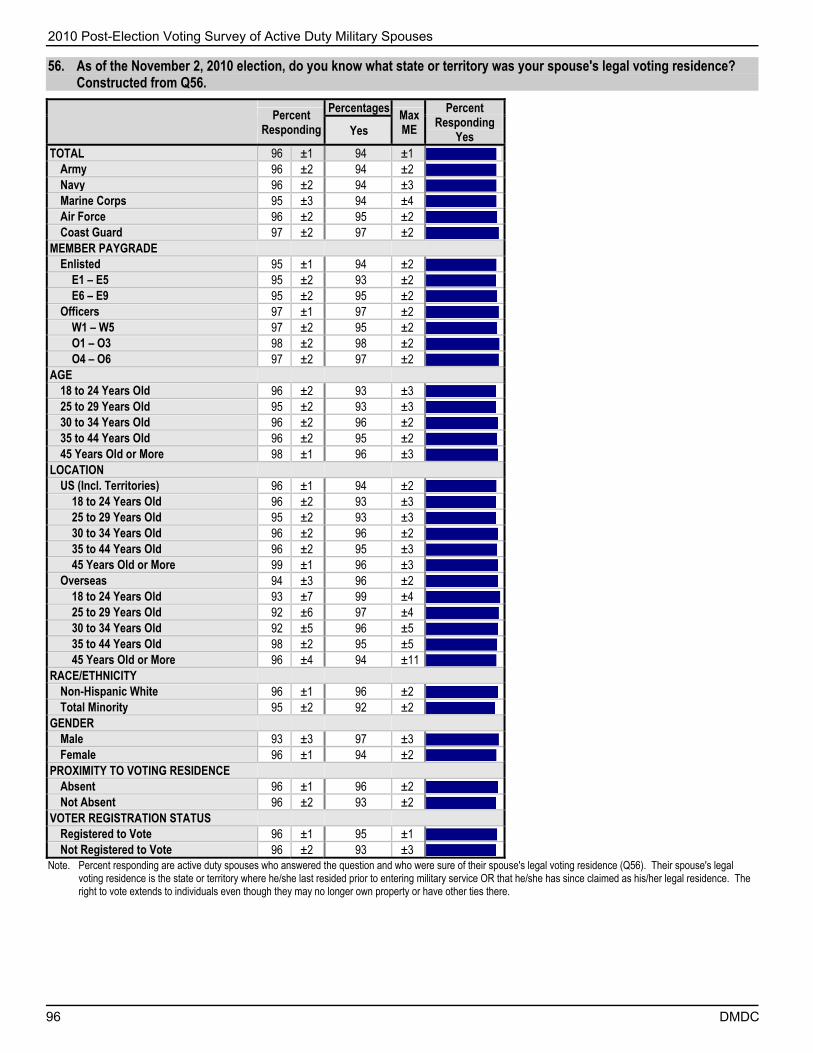
2010 Post-Election Voting Survey of Active Duty Military Spouses
96 DMDC
56. As of the November 2, 2010 election, do you know what state or territory was your spouse's legal voting residence? Constructed from Q56.
Percent
Responding
Percentages Max ME
Percent Responding
Yes Yes
TOTAL 96 ±1 94 ±1 Army 96 ±2 94 ±2 Navy 96 ±2 94 ±3 Marine Corps 95 ±3 94 ±4 Air Force 96 ±2 95 ±2 Coast Guard 97 ±2 97 ±2
MEMBER PAYGRADE Enlisted 95 ±1 94 ±2
E1 – E5 95 ±2 93 ±2 E6 – E9 95 ±2 95 ±2
Officers 97 ±1 97 ±2 W1 – W5 97 ±2 95 ±2 O1 – O3 98 ±2 98 ±2 O4 – O6 97 ±2 97 ±2
AGE 18 to 24 Years Old 96 ±2 93 ±3 25 to 29 Years Old 95 ±2 93 ±3 30 to 34 Years Old 96 ±2 96 ±2 35 to 44 Years Old 96 ±2 95 ±2 45 Years Old or More 98 ±1 96 ±3
LOCATION US (Incl. Territories) 96 ±1 94 ±2
18 to 24 Years Old 96 ±2 93 ±3 25 to 29 Years Old 95 ±2 93 ±3 30 to 34 Years Old 96 ±2 96 ±2 35 to 44 Years Old 96 ±2 95 ±3 45 Years Old or More 99 ±1 96 ±3
Overseas 94 ±3 96 ±2 18 to 24 Years Old 93 ±7 99 ±4 25 to 29 Years Old 92 ±6 97 ±4 30 to 34 Years Old 92 ±5 96 ±5 35 to 44 Years Old 98 ±2 95 ±5 45 Years Old or More 96 ±4 94 ±11
RACE/ETHNICITY Non-Hispanic White 96 ±1 96 ±2 Total Minority 95 ±2 92 ±2
GENDER Male 93 ±3 97 ±3 Female 96 ±1 94 ±2
PROXIMITY TO VOTING RESIDENCE Absent 96 ±1 96 ±2 Not Absent 96 ±2 93 ±2
VOTER REGISTRATION STATUS Registered to Vote 96 ±1 95 ±1 Not Registered to Vote 96 ±2 93 ±3
Note. Percent responding are active duty spouses who answered the question and who were sure of their spouse's legal voting residence (Q56). Their spouse's legal voting residence is the state or territory where he/she last resided prior to entering military service OR that he/she has since claimed as his/her legal residence. The right to vote extends to individuals even though they may no longer own property or have other ties there.

2010 Post-Election Voting Survey of Active Duty Military Spouses
DMDC 97
57. As of November 2, 2010, did your spouse live more than 50 miles from his/her legal voting residence?
Percent
Responding Percentages Max
ME Percentage
Reporting Yes Yes TOTAL 90 ±2 76 ±2
Army 89 ±3 75 ±4 Navy 90 ±3 75 ±4 Marine Corps 89 ±4 82 ±5 Air Force 91 ±2 77 ±4 Coast Guard 94 ±2 68 ±4
MEMBER PAYGRADE Enlisted 89 ±2 75 ±3
E1 – E5 88 ±2 77 ±3 E6 – E9 90 ±2 71 ±4
Officers 94 ±2 80 ±3 W1 – W5 91 ±2 76 ±4 O1 – O3 95 ±2 79 ±5 O4 – O6 94 ±2 82 ±4
AGE 18 to 24 Years Old 88 ±3 81 ±5 25 to 29 Years Old 88 ±3 80 ±4 30 to 34 Years Old 92 ±2 72 ±4 35 to 44 Years Old 90 ±2 72 ±4 45 Years Old or More 93 ±3 74 ±6
LOCATION US (Incl. Territories) 90 ±2 75 ±2
18 to 24 Years Old 88 ±4 80 ±5 25 to 29 Years Old 88 ±3 79 ±4 30 to 34 Years Old 93 ±3 70 ±5 35 to 44 Years Old 90 ±3 70 ±4 45 Years Old or More 93 ±3 72 ±6
Overseas 89 ±3 91 ±4 18 to 24 Years Old 92 ±7 92 ±6 25 to 29 Years Old 84 ±8 93 ±7 30 to 34 Years Old 88 ±6 92 ±10 35 to 44 Years Old 94 ±4 89 ±9 45 Years Old or More 90 ±7 97 ±3
RACE/ETHNICITY Non-Hispanic White 92 ±2 78 ±3 Total Minority 87 ±3 72 ±4
GENDER Male 87 ±5 77 ±6 Female 90 ±2 76 ±2
PROXIMITY TO VOTING RESIDENCE Absent 91 ±2 92 ±2 Not Absent 89 ±2 55 ±3
VOTER REGISTRATION STATUS Registered to Vote 90 ±2 76 ±2 Not Registered to Vote 88 ±3 78 ±5
Note. Percent responding are active duty spouses who answered the question and who knew where their spouse is legally registered to vote (Q56).

2010 Post-Election Voting Survey of Active Duty Military Spouses
98 DMDC
58. As of November 2, 2010, was your spouse deployed or away from his/her permanent duty station?
1. Yes, deployed 2. Yes, away from his/her permanent duty station, but not deployed
3. No
Percent
Responding Percentages Max
ME Percentage Whose Spouse Was
Deployed/Away 1 2 3 TOTAL 96 ±1 18 9 73 ±2 27.0 ±2.0
Army 96 ±2 21 8 71 ±4 29.0 ±4.0 Navy 97 ±2 18 11 72 ±4 28.0 ±4.0 Marine Corps 96 ±3 20 11 69 ±6 31.0 ±6.0 Air Force 96 ±2 13 7 80 ±3 20.0 ±3.0 Coast Guard 98 ±1 8 8 84 ±4 16.0 ±4.0
MEMBER PAYGRADE Enlisted 96 ±1 19 9 72 ±3 28.0 ±3.0
E1 – E5 96 ±2 20 9 72 ±3 28.0 ±3.0 E6 – E9 96 ±2 17 9 73 ±4 27.0 ±4.0
Officers 98 ±1 14 8 77 ±3 23.0 ±3.0 W1 – W5 97 ±2 23 9 68 ±4 32.0 ±4.0 O1 – O3 98 ±2 16 8 76 ±5 24.0 ±5.0 O4 – O6 98 ±1 11 8 81 ±4 19.0 ±4.0
AGE 18 to 24 Years Old 96 ±2 22 10 68 ±5 32.0 ±5.0 25 to 29 Years Old 95 ±2 18 10 73 ±4 27.0 ±4.0 30 to 34 Years Old 97 ±2 17 7 76 ±4 24.0 ±4.0 35 to 44 Years Old 96 ±2 16 8 75 ±3 25.0 ±3.0 45 Years Old or More 98 ±2 13 9 77 ±5 23.0 ±5.0
LOCATION US (Incl. Territories) 96 ±1 18 9 74 ±2 26.0 ±2.0
18 to 24 Years Old 96 ±2 22 10 68 ±5 32.0 ±5.0 25 to 29 Years Old 96 ±2 18 9 73 ±4 27.0 ±4.0 30 to 34 Years Old 97 ±2 17 7 76 ±4 24.0 ±4.0 35 to 44 Years Old 96 ±2 16 8 76 ±4 24.0 ±4.0 45 Years Old or More 98 ±2 13 10 77 ±6 23.0 ±6.0
Overseas 94 ±3 20 10 71 ±5 29.0 ±5.0 18 to 24 Years Old 93 ±7 25 12 64 ±13 36.0 ±11.0 25 to 29 Years Old 90 ±8 21 11 68 ±10 32.0 ±10.0 30 to 34 Years Old 93 ±4 17 7 77 ±8 23.0 ±8.0 35 to 44 Years Old 98 ±2 17 10 73 ±8 27.0 ±8.0 45 Years Old or More 97 ±4 19 7 73 ±12 27.0 ±12.0
RACE/ETHNICITY Non-Hispanic White 97 ±1 17 8 75 ±3 25.0 ±3.0 Total Minority 95 ±2 19 10 71 ±3 29.0 ±3.0
GENDER Male 91 ±4 14 5 82 ±5 18.0 ±5.0 Female 97 ±1 18 9 73 ±2 27.0 ±2.0
PROXIMITY TO VOTING RESIDENCE Absent 95 ±2 16 9 75 ±3 25.0 ±3.0 Not Absent 97 ±1 20 9 71 ±3 29.0 ±3.0
VOTER REGISTRATION STATUS Registered to Vote 96 ±1 17 9 73 ±2 27.0 ±2.0 Not Registered to Vote 96 ±2 20 7 73 ±5 27.0 ±5.0
Note. Percent responding are active duty spouses who answered the question.

2010 Post-Election Voting Survey of Active Duty Military Spouses
DMDC 99
59. Did you relocate while your spouse was deployed?
Percent
Responding Percentages Max
ME Percentage
Reporting Yes Yes TOTAL 17 ±2 21 ±4
Army 20 ±3 18 ±6 Navy 17 ±3 22 ±10 Marine Corps 19 ±5 37 ±13 Air Force 12 ±3 16 ±9 Coast Guard 8 ±3 8 ±11
MEMBER PAYGRADE Enlisted 18 ±2 22 ±5
E1 – E5 19 ±3 28 ±7 E6 – E9 17 ±3 12 ±7
Officers 14 ±2 15 ±7 W1 – W5 22 ±3 10 ±6 O1 – O3 15 ±4 24 ±13 O4 – O6 11 ±3 6 ±8
AGE 18 to 24 Years Old 21 ±4 39 ±11 25 to 29 Years Old 17 ±3 19 ±8 30 to 34 Years Old 16 ±3 16 ±8 35 to 44 Years Old 16 ±3 11 ±7 45 Years Old or More 13 ±4 NR
LOCATION US (Incl. Territories) 17 ±2 21 ±5
18 to 24 Years Old 21 ±4 40 ±11 25 to 29 Years Old 17 ±4 18 ±9 30 to 34 Years Old 16 ±4 15 ±9 35 to 44 Years Old 16 ±3 10 ±7 45 Years Old or More 13 ±4 NR
Overseas 18 ±4 20 ±10 18 to 24 Years Old 23 ±11 NR 25 to 29 Years Old 19 ±8 NR 30 to 34 Years Old 16 ±7 NR 35 to 44 Years Old 17 ±6 NR 45 Years Old or More 19 ±10 8 ±12
RACE/ETHNICITY Non-Hispanic White 17 ±2 21 ±6 Total Minority 18 ±3 21 ±7
GENDER Male 13 ±4 16 ±17 Female 18 ±2 22 ±5
PROXIMITY TO VOTING RESIDENCE Absent 16 ±2 23 ±6 Not Absent 19 ±3 20 ±6
VOTER REGISTRATION STATUS Registered to Vote 17 ±2 19 ±5 Not Registered to Vote 19 ±4 29 ±11
Note. Percent responding are active duty spouses who answered the question and who indicated his/her spouse was deployed as of November 2, 2010 (Q58). NR: Not reportable
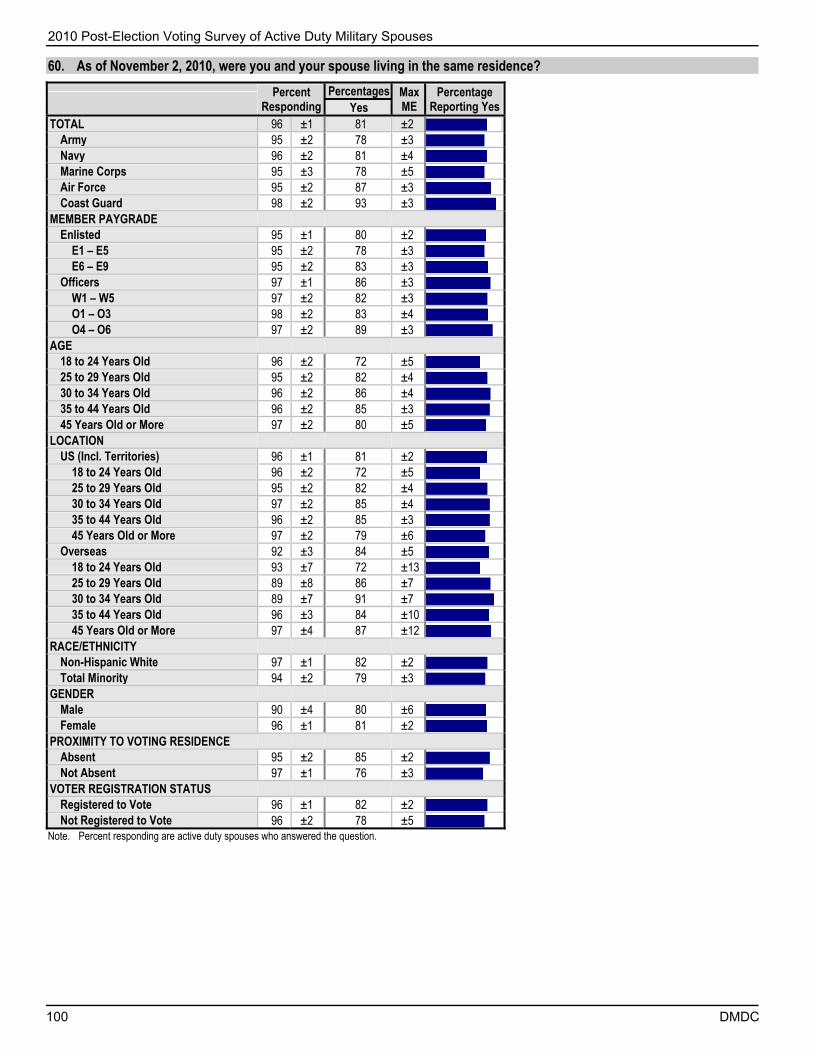
2010 Post-Election Voting Survey of Active Duty Military Spouses
100 DMDC
60. As of November 2, 2010, were you and your spouse living in the same residence?
Percent
Responding Percentages Max
ME Percentage
Reporting Yes Yes TOTAL 96 ±1 81 ±2
Army 95 ±2 78 ±3 Navy 96 ±2 81 ±4 Marine Corps 95 ±3 78 ±5 Air Force 95 ±2 87 ±3 Coast Guard 98 ±2 93 ±3
MEMBER PAYGRADE Enlisted 95 ±1 80 ±2
E1 – E5 95 ±2 78 ±3 E6 – E9 95 ±2 83 ±3
Officers 97 ±1 86 ±3 W1 – W5 97 ±2 82 ±3 O1 – O3 98 ±2 83 ±4 O4 – O6 97 ±2 89 ±3
AGE 18 to 24 Years Old 96 ±2 72 ±5 25 to 29 Years Old 95 ±2 82 ±4 30 to 34 Years Old 96 ±2 86 ±4 35 to 44 Years Old 96 ±2 85 ±3 45 Years Old or More 97 ±2 80 ±5
LOCATION US (Incl. Territories) 96 ±1 81 ±2
18 to 24 Years Old 96 ±2 72 ±5 25 to 29 Years Old 95 ±2 82 ±4 30 to 34 Years Old 97 ±2 85 ±4 35 to 44 Years Old 96 ±2 85 ±3 45 Years Old or More 97 ±2 79 ±6
Overseas 92 ±3 84 ±5 18 to 24 Years Old 93 ±7 72 ±13 25 to 29 Years Old 89 ±8 86 ±7 30 to 34 Years Old 89 ±7 91 ±7 35 to 44 Years Old 96 ±3 84 ±10 45 Years Old or More 97 ±4 87 ±12
RACE/ETHNICITY Non-Hispanic White 97 ±1 82 ±2 Total Minority 94 ±2 79 ±3
GENDER Male 90 ±4 80 ±6 Female 96 ±1 81 ±2
PROXIMITY TO VOTING RESIDENCE Absent 95 ±2 85 ±2 Not Absent 97 ±1 76 ±3
VOTER REGISTRATION STATUS Registered to Vote 96 ±1 82 ±2 Not Registered to Vote 96 ±2 78 ±5
Note. Percent responding are active duty spouses who answered the question.

2010 Post-Election Voting Survey of Active Duty Military Spouses
DMDC 101
61. Not counting your spouse, do you have any family members, who were at least 18 years old on November 2, 2010?
Percent
Responding Percentages Max
ME Percentage
Reporting Yes Yes TOTAL 96 ±1 19 ±2
Army 95 ±2 19 ±3 Navy 97 ±2 20 ±4 Marine Corps 95 ±3 18 ±5 Air Force 96 ±2 19 ±3 Coast Guard 98 ±1 17 ±4
MEMBER PAYGRADE Enlisted 95 ±1 19 ±2
E1 – E5 95 ±2 18 ±3 E6 – E9 96 ±2 20 ±3
Officers 98 ±1 19 ±3 W1 – W5 97 ±2 26 ±4 O1 – O3 98 ±2 13 ±4 O4 – O6 98 ±2 24 ±4
AGE 18 to 24 Years Old 96 ±2 22 ±5 25 to 29 Years Old 95 ±2 12 ±3 30 to 34 Years Old 96 ±2 9 ±3 35 to 44 Years Old 96 ±2 23 ±3 45 Years Old or More 98 ±2 49 ±6
LOCATION US (Incl. Territories) 96 ±1 19 ±2
18 to 24 Years Old 96 ±2 22 ±5 25 to 29 Years Old 96 ±2 12 ±3 30 to 34 Years Old 97 ±2 9 ±3 35 to 44 Years Old 96 ±2 24 ±4 45 Years Old or More 98 ±2 48 ±6
Overseas 92 ±3 19 ±4 18 to 24 Years Old 92 ±7 26 ±10 25 to 29 Years Old 89 ±8 11 ±6 30 to 34 Years Old 89 ±7 13 ±9 35 to 44 Years Old 97 ±3 20 ±7 45 Years Old or More 97 ±4 48 ±12
RACE/ETHNICITY Non-Hispanic White 97 ±1 17 ±2 Total Minority 94 ±2 23 ±3
GENDER Male 91 ±4 18 ±5 Female 97 ±1 19 ±2
PROXIMITY TO VOTING RESIDENCE Absent 95 ±2 17 ±2 Not Absent 97 ±1 22 ±3
VOTER REGISTRATION STATUS Registered to Vote 96 ±1 19 ±2 Not Registered to Vote 96 ±2 20 ±4
Note. Percent responding are active duty spouses who answered the question. Respondents were instructed to include anyone, other than their spouse, of voting age (18 years old and older) who is related to them by blood, marriage, or adoption, and depends on them for more than half of their support. Respondents who had no family members are excluded from the bar chart.

2010 Post-Election Voting Survey of Active Duty Military Spouses
102 DMDC
62. Did any of these family members live more than 50 miles from their legal voting residence on November 2, 2010, as a result of your spouse's active duty service?
1. Yes 2. No 3. Don't know
Percent Responding
Percentages Max ME
Percentage Reporting Yes 1 2 3
TOTAL 18 ±2 19 71 9 ±4 Army 18 ±3 25 66 9 ±7 Navy 19 ±4 13 77 10 ±8 Marine Corps 17 ±4 8 82 10 ±11 Air Force 18 ±3 21 69 9 ±8 Coast Guard 17 ±3 16 77 7 ±9
MEMBER PAYGRADE Enlisted 18 ±2 17 72 11 ±5
E1 – E5 17 ±3 13 74 13 ±7 E6 – E9 19 ±3 23 69 8 ±7
Officers 19 ±2 27 69 4 ±6 W1 – W5 25 ±3 23 67 9 ±7 O1 – O3 13 ±3 15 80 5 ±11 O4 – O6 23 ±3 33 64 2 ±8
AGE 18 to 24 Years Old 21 ±4 6 85 10 ±9 25 to 29 Years Old 11 ±3 16 66 18 ±12 30 to 34 Years Old 9 ±3 25 60 15 ±14 35 to 44 Years Old 22 ±3 21 72 6 ±7 45 Years Old or More 47 ±6 33 63 4 ±8
LOCATION US (Incl. Territories) 18 ±2 18 72 10 ±5
18 to 24 Years Old 21 ±4 6 85 10 ±10 25 to 29 Years Old 11 ±3 17 65 18 ±13 30 to 34 Years Old 8 ±3 27 59 14 ±16 35 to 44 Years Old 22 ±3 18 75 7 ±7 45 Years Old or More 46 ±6 32 64 4 ±8
Overseas 17 ±3 33 58 10 ±10 18 to 24 Years Old 23 ±9 7 85 8 ±15 25 to 29 Years Old 10 ±5 NR NR NR 30 to 34 Years Old 11 ±7 NR NR NR 35 to 44 Years Old 19 ±6 59 37 NR ±17 45 Years Old or More 46 ±12 NR 38 3 ±17
RACE/ETHNICITY Non-Hispanic White 16 ±2 16 76 8 ±5 Total Minority 21 ±3 23 65 12 ±7
GENDER Male 16 ±4 21 58 20 ±14 Female 18 ±2 19 73 8 ±4
PROXIMITY TO VOTING RESIDENCE Absent 16 ±2 27 65 8 ±6 Not Absent 21 ±3 12 77 11 ±6
VOTER REGISTRATION STATUS Registered to Vote 18 ±2 20 73 7 ±5 Not Registered to Vote 19 ±4 17 64 19 ±10
Note. Percent responding are active duty spouses who answered the question and who had family members, not counting spouses, who were at least 18 years old on November 2, 2010 (Q61). NR: Not reportable
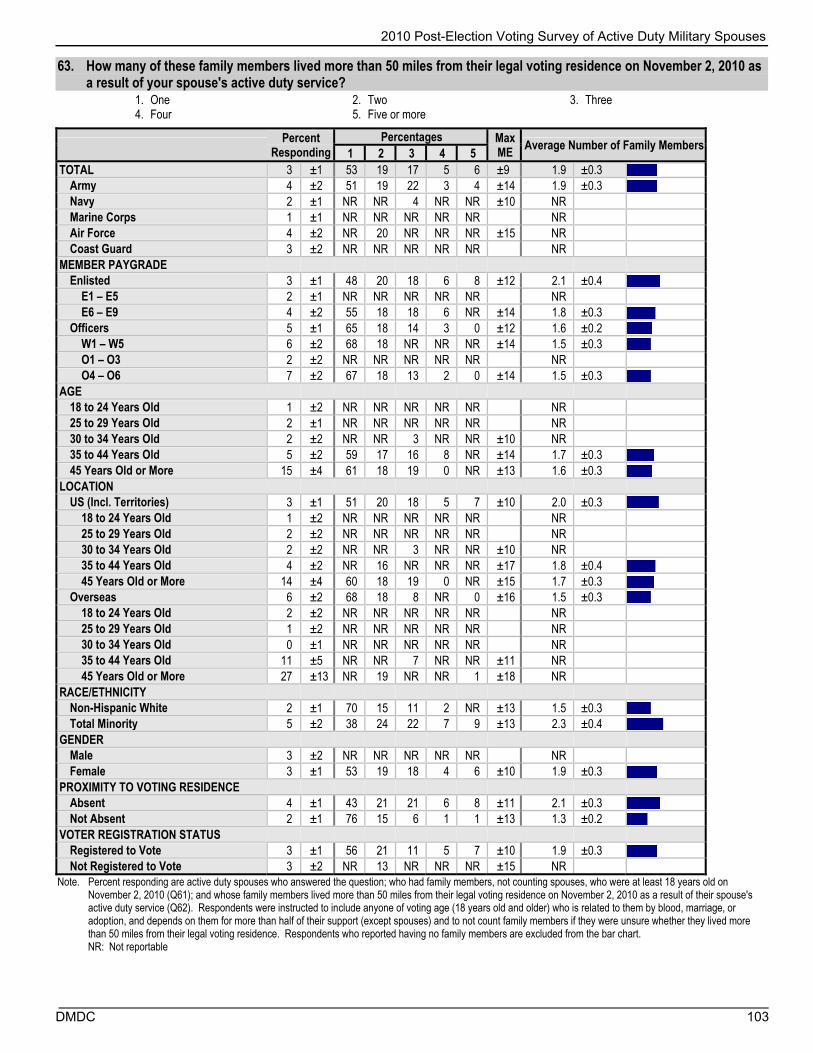
2010 Post-Election Voting Survey of Active Duty Military Spouses
DMDC 103
63. How many of these family members lived more than 50 miles from their legal voting residence on November 2, 2010 as a result of your spouse's active duty service?
1. One 2. Two 3. Three 4. Four 5. Five or more
Percent
Responding Percentages Max
ME Average Number of Family Members
1 2 3 4 5 TOTAL 3 ±1 53 19 17 5 6 ±9 1.9 ±0.3
Army 4 ±2 51 19 22 3 4 ±14 1.9 ±0.3 Navy 2 ±1 NR NR 4 NR NR ±10 NR Marine Corps 1 ±1 NR NR NR NR NR NR Air Force 4 ±2 NR 20 NR NR NR ±15 NR Coast Guard 3 ±2 NR NR NR NR NR NR
MEMBER PAYGRADE Enlisted 3 ±1 48 20 18 6 8 ±12 2.1 ±0.4
E1 – E5 2 ±1 NR NR NR NR NR NR E6 – E9 4 ±2 55 18 18 6 NR ±14 1.8 ±0.3
Officers 5 ±1 65 18 14 3 0 ±12 1.6 ±0.2 W1 – W5 6 ±2 68 18 NR NR NR ±14 1.5 ±0.3 O1 – O3 2 ±2 NR NR NR NR NR NR O4 – O6 7 ±2 67 18 13 2 0 ±14 1.5 ±0.3
AGE 18 to 24 Years Old 1 ±2 NR NR NR NR NR NR 25 to 29 Years Old 2 ±1 NR NR NR NR NR NR 30 to 34 Years Old 2 ±2 NR NR 3 NR NR ±10 NR 35 to 44 Years Old 5 ±2 59 17 16 8 NR ±14 1.7 ±0.3 45 Years Old or More 15 ±4 61 18 19 0 NR ±13 1.6 ±0.3
LOCATION US (Incl. Territories) 3 ±1 51 20 18 5 7 ±10 2.0 ±0.3
18 to 24 Years Old 1 ±2 NR NR NR NR NR NR 25 to 29 Years Old 2 ±2 NR NR NR NR NR NR 30 to 34 Years Old 2 ±2 NR NR 3 NR NR ±10 NR 35 to 44 Years Old 4 ±2 NR 16 NR NR NR ±17 1.8 ±0.4 45 Years Old or More 14 ±4 60 18 19 0 NR ±15 1.7 ±0.3
Overseas 6 ±2 68 18 8 NR 0 ±16 1.5 ±0.3 18 to 24 Years Old 2 ±2 NR NR NR NR NR NR 25 to 29 Years Old 1 ±2 NR NR NR NR NR NR 30 to 34 Years Old 0 ±1 NR NR NR NR NR NR 35 to 44 Years Old 11 ±5 NR NR 7 NR NR ±11 NR 45 Years Old or More 27 ±13 NR 19 NR NR 1 ±18 NR
RACE/ETHNICITY Non-Hispanic White 2 ±1 70 15 11 2 NR ±13 1.5 ±0.3 Total Minority 5 ±2 38 24 22 7 9 ±13 2.3 ±0.4
GENDER Male 3 ±2 NR NR NR NR NR NR Female 3 ±1 53 19 18 4 6 ±10 1.9 ±0.3
PROXIMITY TO VOTING RESIDENCE Absent 4 ±1 43 21 21 6 8 ±11 2.1 ±0.3 Not Absent 2 ±1 76 15 6 1 1 ±13 1.3 ±0.2
VOTER REGISTRATION STATUS Registered to Vote 3 ±1 56 21 11 5 7 ±10 1.9 ±0.3 Not Registered to Vote 3 ±2 NR 13 NR NR NR ±15 NR
Note. Percent responding are active duty spouses who answered the question; who had family members, not counting spouses, who were at least 18 years old on November 2, 2010 (Q61); and whose family members lived more than 50 miles from their legal voting residence on November 2, 2010 as a result of their spouse's active duty service (Q62). Respondents were instructed to include anyone of voting age (18 years old and older) who is related to them by blood, marriage, or adoption, and depends on them for more than half of their support (except spouses) and to not count family members if they were unsure whether they lived more than 50 miles from their legal voting residence. Respondents who reported having no family members are excluded from the bar chart. NR: Not reportable


Survey Instrument


DMDC
10
07
2010 Post-Election Voting Survey of Active Duty Military Spouses
108 DMDC
PRIVACY ACT STATEMENT & INFORMED CONSENT INFORMATION
In accordance with the Privacy Act, this notice informs you of the purpose of the survey and how the findings of these surveys will be used. It also provides information about the Privacy Act and about informed consent. Please read it carefully.
AUTHORITY: The authority to solicit the information requested in this survey is contained in the Uniformed and Overseas Citizens Absentee Voting Act of 1986, Section 101.b (1), 42 USC §1973ff (UOCAVA) and the Military and Overseas Voter Empowerment Act (MOVE Act), a subtitle of the National Defense Authorization Act for Fiscal Year 2010.
PRINCIPAL PURPOSE: Information collected in this survey will be used to evaluate the effectiveness of assistance under UOCAVA, as amended in November 2009 by the MOVE Act, in the 2010 election. Reports will be provided to Federal Voting Assistance Program (FVAP). Previous survey results have affected decisions in critical areas such as establishing advertising campaigns geared towards 18-21 year old uniformed service members, utilizing social networking sites to encourage voter participation, and developing online Federal Post Card Application and Federal Write-In Absentee Ballot wizards. Survey results are also the basis for the Legislative Initiative scoring index that annually measures FVAP's success in convincing States to adopt their recommendations. Some findings may be published by the Defense Manpower Data Center (DMDC) or in professional journals, or presented at conferences, symposia, and scientific meetings. Data could be used in future research. Datasets without any identifying information may be analyzed by researchers outside of DMDC. Briefings and reports on results from these surveys will be posted on the Web: http://www.dmdc.osd.mil/surveys/
ROUTINE USES: None.
DISCLOSURE: Providing information on this survey is voluntary. Most people can complete the survey in 20 minutes. There is no penalty or loss of benefits to which you are entitled if you choose not to respond. However, maximum participation is encouraged so that the data will be complete and representative. Your survey responses will be treated as confidential. Identifying information will be used only by government and contractor staff engaged in, and for purposes of, the survey research. For example, the research oversight office of the Office of the Under Secretary of Defense (Personnel and Readiness) and representatives of the U.S. Army Medical Research and Materiel Command are eligible to review research records as a part of their responsibility to protect human subjects in research. This survey is being conducted for research purposes. In no case will individual identifiable survey responses be reported. If you answer any items and indicate distress or being upset, etc., you will not be contacted for follow-up purposes. However, if you indicate a direct threat to harm yourself or others within responses or communications about the survey, because of concern for your welfare, DMDC will notify an office in your area for appropriate action.
SURVEY ELIGIBILITY AND POTENTIAL BENEFITS: DMDC uses well-established, scientific procedures to randomly select a sample that represents the Defense community based on combinations of demographic characteristics (e.g., location, gender). This is your chance to be heard on issues that directly affect you, including sources of voting information and assistance, satisfaction with voting information and assistance, and voting in the 2010 election. While there is no direct benefit for your individual participation, your responses on this survey make a difference.
STATEMENT OF RISK: The data collection procedures are not expected to involve any risk or discomfort to you. The only risk to you is accidental or unintentional disclosure of the data you provide. However, the government and its contractors have a number of policies and procedures to ensure that survey data are safe and protected. For example, no identifying information (name, address, Social Security Number) is ever stored in the same file as survey responses. Survey data may be shared with organizations doing research on DoD personnel but only after minimizing detailed demographic data (for example, paygrade and detailed location information) that could possibly be used to identify an individual. A confidentiality analysis is performed to reduce the risk of there being a combination of demographic variables that can single out an individual. Government and contractor staff members have been trained to protect client identity and are subject to civil penalties for violating your confidentiality.
If you experience any difficulties taking the survey, please contact the Survey Processing Center by sending an e-mail to [email protected] or call, toll-free, 1-800-881-5307. If you have concerns about your rights as a research participant, please contact: Ms. Caroline Miner, Human Research Protection Program Manager for the Office of the Under Secretary of Defense (P&R), [email protected] (703) 575-2677.
Once you start answering the survey, if you desire to withdraw your answers, please notify the Survey Processing Center prior to March 15, 2011. Please include in the e-mail or phone message your name, Ticket Number, and the PIN that you selected when you started this survey. Unless withdrawn, partially completed survey data may be used after that date.
Click Continue if you agree to do the survey.

2010 Post-Election Voting Survey of Active Duty Military Spouses
DMDC 109
HOW TO CONTACT US
If you have questions or concerns about this survey, you have three ways to contact the Survey Operations Center:
Call: 1-800-881-5307 E-mail: [email protected] Fax: 1-763-268-3002
FREQUENTLY ASKED QUESTIONS
What is Defense Manpower Data Center (DMDC)?
DMDC maintains the largest archive of personnel, manpower, training, and financial data in Department of Defense (DoD). DMDC also conducts Joint-Service surveys including the Status of Forces Surveys, QuickCompass, and Human Relations Surveys for the Department of Defense. To learn more, visit the DMDC Web site.
http://www.dmdc.osd.mil/
What are the Post-Election Voting (PEV) Surveys?
Post-Election Voting (PEV) surveys are sponsored by the Director of the Federal Voting Assistance Program (FVAP) as the Presidential designee to administer the Overseas Citizens Absentee Voting Act (UOCAVA). UOCAVA, as amended in 2010, requires FVAP to report to Congress how effective programs are for assisting overseas citizens to vote in Federal elections. The PEV surveys are designed to assist FVAP in administering UOCAVA and are used to develop ways to make absentee voting easier for military personnel and overseas citizens.
What is the UOCAVA?
The Uniformed and Overseas Citizens Absentee Voting Act (UOCAVA) was enacted in 1986. UOCAVA law permits members of the Uniformed Services and Merchant Marines, their eligible family members, and U.S. citizens residing overseas, to vote in general elections. The Federal Voting Assistance Program (FVAP) has been charged with administering UOCAVA law and works on behalf of all UOCAVA citizens to ensure their right to vote, no matter where in the world they may be residing.
How do I know this is an official, approved DoD survey?
In accordance with DoD Instruction 8910.01, all data collection in the Department must be licensed and show that license as a Report Control Symbol (RCS) with an expiration date. The RCS for this survey is RCS# DD-P&R(AR)1918, expiring 09/30/2011.
How did you pick me?
DMDC uses well-established, scientific procedures to randomly select a sample that represents the Defense community based on combinations of demographic characteristics (e.g., location, gender).
Why should I participate?
This is your chance to be heard on issues that directly affect you, including sources of voting information and assistance, satisfaction with voting information and assistance, and voting in the 2010 election.
Your responses on this survey make a difference.
How do I participate?
The survey will be available at this Web site around December 20, 2010. At the present time, you may (1) verify contact information, and (2) provide a postal and e-mail address so we can notify you when the survey opens.
What is [email protected]?
The official e-mail address for communicating with Active duty military spouses about Post-Election Voting PEV surveys. "ADMSSurvey" is short for Active Duty Military Spouses.
Why am I being asked to use the Web?
Web administration enables us to get survey results to senior Defense leaders faster.
Why are you using a .net instead of a .mil domain to field your survey?
The survey is administered by our contractor, Data Recognition Corporation, an experienced survey operations company. The survey collection tool starts on a .mil site within DMDC. Once you enter your ticket number you are redirected to a contractor site which uses a .net domain. This allows everyone to access the survey, even from a non-government computer.

2010 Post-Election Voting Survey of Active Duty Military Spouses
110 DMDC
Do I have to take the survey in one sitting?
No, it is not necessary to complete the survey in one sitting. From any survey item, just click the Save and Return Later button. All of your responses are saved. When you return to the Web site, enter your Ticket Number and PIN. You will re-start the survey at the point you stopped.
Why does the survey ask personal questions?
DMDC reports overall results, as well as by other characteristics, such as location, gender, etc. To complete these analyses, we must ask respondents for these types of demographic information.
Analyzing results in this way provides Defense leaders information about the attitudes and concerns of all subgroups of personnel so that no groups are overlooked.
Sometimes sensitive questions are asked in order to improve personnel policies, programs, and practices. As with all questions on the surveys, your responses will be held in confidence.
Will my answers be kept private?
Your privacy will be safeguarded in accordance with the Privacy Act of 1974 (Public Law 93-579). All data will be reported in the aggregate and no individual data will be reported.
Can I withdraw my answers once I have started the survey?
If you wish to withdraw your answers, please notify the Survey Processing Center prior to March 15, 2011 by sending an e-mail to [email protected] or calling, toll-free 1-800-881-5307. Include your name, Ticket Number and PIN.
Will I ever see the results of the survey?
DMDC posts survey results on the following Web site:
http://www.dmdc.osd.mil/surveys/

DM
1.
2.
3.
4.
5.
6.
7.
DC
BAC
What is yo
Married
Separat
Divorced
Widowe
Never m
Was your sNovember
Yes
No
Were you a
Yes
No
Your legal territory theven thougor have oth2010 electilegal votinlist below oRico, or a U
As of Nove50 miles fr
Yes
No
Are you Sp
No, not
Yes, MePuerto RHispanic
What is yoindicate wh
White
Black or
America
Asian (eJapanes
Native HSamoan
CKGROUND I
ur marital st
ed
d
ed
married
spouse serv2, 2010?
a U.S. citizen
voting residhat you claimgh you may nher ties thereion, what stag residence?one of the 50U.S. territory
ember 2, 201rom your lega
panish/Hispa
Spanish/Hispa
exican, MexicanRican, Cuban, c/Latino
ur race? Mahat race you
r African Ameri
an Indian or Ala
e.g., Asian Indiase, Korean, Vie
Hawaiian or othn, Guamanian o
INFORMATIO
tatus?
ing on active
n on Novemb
dence is the sm as your leg
no longer owe. As of the ate or territor? Please sel0 states, D.Cy or possess
0, did you lival voting res
anic/Latino?
anic/Latino
n-American, Chor other Spanis
ark one or mou consider yo
can
aska Native
an, Chinese, Fetnamese)
her Pacific Islanor Chamorro)
ON
e duty on
ber 2, 2010?
state or al residence
wn property November 2ry was your lect from the
C., Puerto sion.
ve more thansidence?
hicano, sh/
ore races to ourself to be.
ilipino,
nder (e.g.,
2010 Post-El
e
,
e
n
.
8.
9.
10.
11.
12.
13.
lection Voting
What was y
17 years
18 to 24
25 to 29
30 to 34
35 to 44
45 years
On NovembUnited Stat
United S
Oversea
[Ask if Q9 =2010, how country?
Less tha
6 months
1 year to
2 years t
3 years o
Some stateverificationvoting resid
Yes
No
Don't kn
In 2010, weUnited Stat
Yes
No
How intereU.S. electio
Very inte
Somewh
Neither i
Somewh
Very uni
g Survey of Ac
your age on
s old or younge
years old
years old
years old
years old
s old or older
ber 2, 2010, wtes/territorie
States/territories
as
= "Overseaslong had you
an 6 months
s to less than 1
o less than 2 ye
to less than 3 y
or more
2010 ELE
es provide von Web sites. dence provid
ow
ere you registes?
ested or uninons held on N
erested
hat interested
interested or un
hat uninterested
nterested
ctive Duty Mil
November 2
er
were you livs or oversea
s
"] As of Novu been living
1 year
ears
years
ECTION
oter registrat Did your stade this type
stered to vote
terested werNovember 2,
ninterested
d
litary Spouse
11
2, 2010?
ing in the as?
vember 2, g in this
tion ate of legal of Web site?
e in the
re you in the, 2010?
s
1
?

2010
112
14.
15.
16.
17.
0 Post-Electio
A lot of peopthey weren'tdid not haveto prevent thpeople who to vote forgehappened oprevented ththink about 2010 and pavoted. Durinvote in natiodid you usua
Usually vo
Usually di
[Ask if Q14 =vote in… Ma
a. State and
b. National e
During the mheld on Novvoting plans
I planned
I did not p
In the electioyou definitedefinitely coe-mail/fax, o2010, definitcompletely selection?
Definitely
Definitely
Definitely
Not sure
[Ask if Q17 =unsure whet2010 electio
n Voting Surv
ple were not t registered, e time, or somhem from voUSUALLY voet that somen election dahem from vothe election
ast elections ng the past 6onal, state, aally not vote
oted
d not vote
= "Usually voark “Yes” or
local elections
elections? .......
months leadivember 2, 201s?
to vote.
plan to vote.
on held on Nly vote in pe
omplete an aor online on otely not vote,sure whethe
voted in perso
voted by mail,
did not vote
= "Not sure"]ther you voten?
vey of Active
able to votethey were simething elseting. And soote or who Pthing UNUSUay this year tting THIS timheld on Novin which you
6 years, did ynd local elec?
oted"] Do yor “No” for ea
s? ....................
.......................
ng up to the10, what wer
November 2, rson on elecbsentee ballor before Nov, or are you nr you voted i
n
e-mail, fax, or
] What makeed in the Nov
Duty Military
because ck, they
e happened ometimes, PLANNED UAL that me. Please vember 2, u may have you usually ctions, or
ou usually ch item.
No
Yes
..........
..........
e election re your
2010, did ction day, ot by mail, vember 2, not in that
online
es you vember 2,
Spouses
o
18. [tae
19. [ffNtty
M
D
20. [fCaosaAbae
21. [fDAeM
a
b
c
d
e
A
[Ask if Q17 =though you dabsentee baelection?
Yes
No
[Ask if Q17 =fax, or onlinefirst request November 2,the exact dathink it was eyou think it w
I cannot re
Month
Day
[Ask if Q17 =fax, or onlineCard Applicaa request foropposed to bstates requirabsentee to Application (ballot. Did yabsentee baelection?
Yes
No
[Ask if Q17 =fax, or onlineDid you obtaApplication (election fromMark “Yes” o
a. A printableFVAP Web
b. FVAP's authe FPCA
c. From FVAWeb site ..
d. From a sta
e. From my s
BSENTEE BA
= "Definitely did not vote,llot for the N
= "Definitely e" or Q18 = "your absent
, 2010 electiote, enter youearly in the mwas late in th
ecall well enoug
= "Definitely e" or Q18 = "ation (FPCA;r registrationback-up) absre eligible vouse the Fede(FPCA) to re
you use the Fllot for the N
= "Definitely e" or Q18 = "ain your Fede(FPCA) for th
m any of the or “No” for e
e FPCA downlob site that you utomated assisonline .............
AP, but not thro.......................
ate or local elec
spouse ............
ALLOTS
did not vote, did you req
November 2,
voted by ma"Yes"] Whentee ballot foron? If you dur best guessmonth, seleche month, se
gh to even gue
voted by ma"Yes"] The F; Standard Fon and a regusentee ballototers who voeral Post Ca
equest an absFPCA to requNovember 2,
voted by ma"Yes" and Q2eral Post Cahe Novembefollowing so
each item.
oaded from thefilled out by ha
stant for filling o.......................
ough the FVAP .......................
ction official ....
.......................
DMDC
e"] Even quest an 2010
ail, e-mail, n did you r the
do not recall s. If you ct “1”, if elect “28”.
ess
ail, e-mail, Federal Post orm 76) is lar (as t. Some
ote rd sentee uest your 2010
ail, e-mail, 20 = "Yes"] rd
er 2, 2010 ources?
No
Yes
e and .....out ..........
..........
..........
..........

DM
22.
23.
24.
DC
f. Some ot
[Ask if Q17fax, or onliDid you recelection ofApplicationanswer in
a. Receive
b. Rejected
c. Accepte
[Ask if Q17fax, or onliyour regula2, 2010 ele
Yes
No
Do not r
[Ask if Q17fax, or onliHow did yoballot in 20item.
a. Mail ......
b. Fax .......
c. E-mail ...d. Downloa
site .......e. Downloa
FVAP wf. Downloa
another
g. From my
h. Other ....
ther source ....
7 = "Definiteline" or Q18 =ceive notificfficial that yon (FPCA) hadeach row.
ed? ..................
d? ...................
ed? ..................
7 = "Definiteline" or Q18 =ar absentee
ection?
recall
7 = "Definiteline" or Q18 =ou obtain yo010? Mark “
.......................
.......................
.......................aded ballot from.......................aded ballot from
website ............aded ballot fromwebsite .........
y spouse ........
.......................
.......................
ly voted by m= "Yes" and Qation from a
our Federal Pd been... Ma
.......................
.......................
.......................
ly voted by m= "Yes"] Did ballot for the
ly voted by m= "Yes" and Qur regular abYes” or “No
.......................
.......................
.......................m state voting W.......................m State link on.......................m State link at .......................
.......................
.......................
N
Yes
.............
mail, e-mail, Q20 = "Yes"]local
Post Card ark one
Do not reca
No
Yes
.....
.....
.....
mail, e-mail, you receive
e November
mail, e-mail, Q23 = "Yes"]bsentee ” for each
N
Yes
.............
.............
.............Web ............. the .............
.............
.............
.............
2010 Post-El
No
]
all
]
No
25.
26.
27.
28.
lection Voting
[Ask if Q17fax, or onliWhen did yballot for thyou do notbest guessmonth, selemonth, sele
I cannot
Month
Day
[Ask if Q17fax, or onliDid you coabsentee belection?
Yes
No
[Ask if Q17fax, or onliand Q26 = return yourNovember the exact dthink it wasyou think it
I cannot
Month
Day
[Ask if Q17fax, or onlidissatisfiedMark one a
a. Process vote? ....
b. Process absentee
g Survey of Ac
7 = "Definitelne" or Q18 =you receive yhe Novembet recall the exs. If you thinect “1”, if yoect “28”.
recall well eno
7 = "Definitelne" or Q18 =mplete and r
ballot for the
7 = "Definitelne" or Q18 ="Yes"] Whenr regular abs2, 2010 elect
date, enter yos early in thet was late in
recall well eno
7 = "Definitelne" or Q18 =d were you, ianswer for ea
Neither satisf
Very
of registering t.......................of requesting a
e ballot? ..........
ctive Duty Mil
y voted by m= "Yes" and Qyour regular
er 2, 2010 elexact date, en
nk it was earlou think it wa
ough to even gu
y voted by m= "Yes" and Qreturn your rNovember 2
y voted by m= "Yes" and Qn did you comsentee ballottion? If you our best guee month, selethe month, s
ough to even gu
y voted by m= "Yes"] Howin general, wach item.
Ve
D
ied nor dissat
Satisfied
y satisfied
to ............an ............
litary Spouse
11
mail, e-mail, Q23 = "Yes"]absentee ction? If
nter your ly in the as late in the
uess
mail, e-mail, Q23 = "Yes"]regular 2, 2010
mail, e-mail, Q23 = "Yes" mplete and t for the do not recal
ess. If you ect “1”, if select “28”.
uess
mail, e-mail, w satisfied orwith the...
ery dissatisfie
Dissatisfied
tisfied
d
s
3
]
]
ll
r
ed
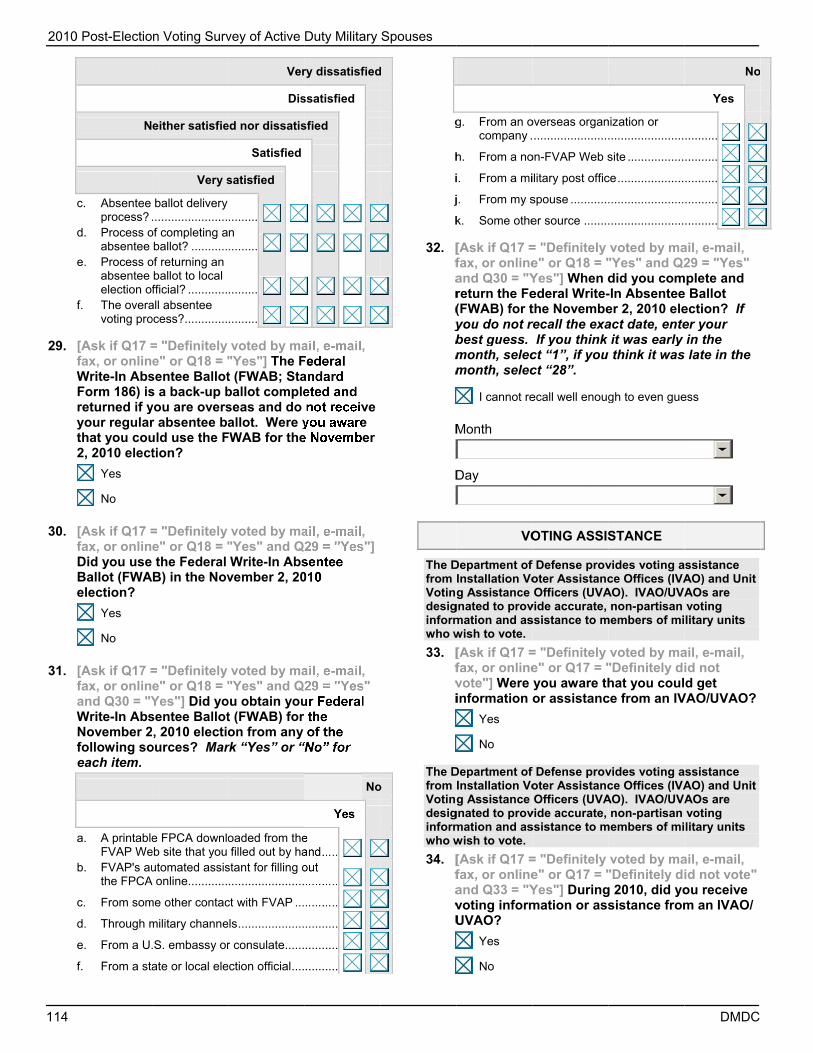
2010
114
29.
30.
31.
0 Post-Electio
N
c. Absentee process? .
d. Process oabsentee
e. Process oabsentee election of
f. The overavoting pro
[Ask if Q17 =fax, or onlinWrite-In AbsForm 186) isreturned if yyour regularthat you cou2, 2010 elect
Yes
No
[Ask if Q17 =fax, or onlinDid you use Ballot (FWAelection?
Yes
No
[Ask if Q17 =fax, or onlinand Q30 = "YWrite-In AbsNovember 2following soeach item.
a. A printableFVAP We
b. FVAP's authe FPCA
c. From som
d. Through m
e. From a U.
f. From a sta
n Voting Surv
either satisfie
Very s
ballot delivery .......................
of completing aballot? ...........
of returning an ballot to local fficial? ............
all absentee ocess?.............
= "Definitely e" or Q18 = "
sentee Ballots a back-up byou are oversr absentee bauld use the Ftion?
= "Definitely e" or Q18 = "the Federal
B) in the Nov
= "Definitely e" or Q18 = "Yes"] Did yosentee Ballot, 2010 electio
ources? Mar
e FPCA downloeb site that you utomated assis
A online............
me other contac
military channe
.S. embassy or
ate or local ele
vey of Active
Ver
Dis
ed nor dissatis
Satisfied
satisfied
......... n .........
.........
.........
voted by ma"Yes"] The Ft (FWAB; Staballot compleseas and do allot. Were y
FWAB for the
voted by ma"Yes" and QWrite-In Abs
vember 2, 20
voted by ma"Yes" and Q
ou obtain yout (FWAB) for on from any
rk “Yes” or “
oaded from thefilled out by ha
stant for filling o.......................
ct with FVAP ...
els ....................
r consulate ......
ection official ....
Duty Military
ry dissatisfied
ssatisfied
sfied
ail, e-mail, Federal andard eted and not receive you aware e November
ail, e-mail, 29 = "Yes"] sentee 010
ail, e-mail, 29 = "Yes"
ur Federal the of the
“No” for
No
Yes
e and .....out ..........
..........
..........
..........
..........
Spouses
d
o
g
h
i
j
k
32. [far(ybmm
M
D
The Dfrom Votindesiginformwho w
33. [fvi
The Dfrom Votindesiginformwho w
34. [favU
g. From an ocompany .
h. From a no
i. From a mi
j. From my s
k. Some othe
[Ask if Q17 =fax, or onlineand Q30 = "Yreturn the Fe(FWAB) for tyou do not rbest guess. month, selecmonth, selec
I cannot re
Month
Day
VO
Department of Installation Vog Assistance
gnated to provmation and aswish to vote.
[Ask if Q17 =fax, or onlinevote"] Were information
Yes
No
Department of Installation Vog Assistance
gnated to provmation and aswish to vote.
[Ask if Q17 =fax, or onlineand Q33 = "Yvoting informUVAO?
Yes
No
overseas organ.......................
on-FVAP Web s
ilitary post offic
spouse ............
er source ........
= "Definitely e" or Q18 = "Yes"] When dederal Write-the Novemberecall the exa
If you think ct “1”, if you ct “28”.
ecall well enoug
OTING ASSIS
f Defense provoter AssistancOfficers (UVA
vide accurate, ssistance to m
= "Definitely e" or Q17 = "you aware thor assistanc
f Defense provoter AssistancOfficers (UVA
vide accurate, ssistance to m
= "Definitely e" or Q17 = "Yes"] Duringmation or ass
nization or .......................
site .................
ce ....................
.......................
.......................
voted by ma"Yes" and Q2did you com-In Absenteeer 2, 2010 eleact date, enteit was early
u think it was
gh to even gue
STANCE
vides voting ace Offices (IVA
AO). IVAO/UVAnon-partisan
members of mi
voted by ma"Definitely dihat you coul
ce from an IV
vides voting ace Offices (IVA
AO). IVAO/UVAnon-partisan
members of mi
voted by ma"Definitely dig 2010, did yosistance from
DMDC
No
Yes
..........
..........
..........
..........
..........
ail, e-mail, 29 = "Yes"
mplete and e Ballot ection? If er your in the
s late in the
ess
assistance AO) and Unit AOs are voting litary units
ail, e-mail, id not d get
VAO/UVAO?
assistance AO) and Unit AOs are voting litary units
ail, e-mail, id not vote"ou receive m an IVAO/

DM
ThefromVotdesinfowho
35.
36.
37.
DC
e Department m Installation ting Assistancsignated to proormation and ao wish to vote
[Ask if Q17fax, or onliand Q33 = is the MAINinformatioMark one.
I did notassistan
I was no
I did not
I did not
My IVAOneeded
My IVAOassistan
My IVAOinformat
I receive
Some ot
[Ask if Q17fax, or onliand Q33 = "Some othreason for IVAO/UVAO
[Ask if Q17fax, or onlivote"] The (FVAP) Wevoting-relaWere you a
Yes
No
[Ask if Q17fax, or onliand Q36 = primaries athis Web s
Yes
No
of Defense prVoter Assista
ce Officers (UVovide accurateassistance to
e.
7 = "Definiteline" or Q17 ="Yes" and Q
N REASON yn or assistan
t need any votinnce.
ot interested in
t have an IVAO
t know how to c
O/UVAO was nassistance.
O/UVAO was nnce.
O/UVAO did notion I needed.
ed my voting as
ther reason
7 = "Definiteline" or Q17 ="Yes" and Q
her reason"] not receivin
O.
7 = "Definiteline" or Q17 =Federal Vot
eb site, wwwated informataware of this
7 = "Definiteline" or Q17 ="Yes"] In pre
and general ite?
rovides votingance Offices (IVAO). IVAO/Ue, non-partisamembers of m
ly voted by m= "Definitely Q34 = "No"] Iyou did not rence from an
ng information
voting.
O/UVAO.
contact my IVA
not available wh
not helpful whe
ot have the mat
ssistance elsew
ly voted by m= "Definitely Q34 = "No" anPlease expla
ng assistance
ly voted by m= "Definitely ing Assistan.fvap.gov, prtion and resos Web site?
ly voted by m= "Definitely eparation forelection, did
g assistance IVAO) and Uni
UVAOs are an voting military units
mail, e-mail, did not voten 2010, whateceive votingIVAO/UVAO?
or
AO/UVAO.
hen I
n I needed
terials or
where.
mail, e-mail, did not votend Q35 = ain your maine from an
mail, e-mail, did not
nce Program rovides ources.
mail, e-mail, did not voter the 2010
d you visit
2010 Post-El
it
e" t g ?
e"
n
e"
38.
39.
40.
lection Voting
[Ask if Q17fax, or onliand Q36 = is the MAINFederal VoWeb site.
I did not assistan
I was no
I did not
I did not
I receive
I did not
Some ot
[Ask if Q17fax, or onliand Q36 = "Some othereason for
[Ask if Q17fax, or onlivote"] The Voting Assby-state infand requesaware the V
Yes
No
[Ask if Q17fax, or onliand Q39 = primaries athe 2010-11informationrequesting
Yes
No
g Survey of Ac
7 = "Definitelne" or Q17 ="Yes" and Q
N REASON yoting Assista
Mark one. need any votince.
ot interested in
have Internet a
know the Web
ed my voting as
think it would b
ther reason
7 = "Definitelne" or Q17 ="Yes" and Qer reason"] Pnot visiting
7 = "Definitelne" or Q17 =Department
sistance Guidformation absting an abseVAG was ava
7 = "Definitelne" or Q17 ="Yes"] In pre
and general e1 Voting Assn about regis an absentee
ctive Duty Mil
y voted by m= "Definitely Q37 = "No"] Inyou did not vnce Program
ng information
voting.
access.
b site address.
ssistance elsew
be useful.
y voted by m= "Definitely Q37 = "No" anPlease explathe FVAP We
y voted by m= "Definitely
of Defense 2de (VAG) probout registerentee ballot. ailable to you
y voted by m= "Definitely eparation forelection, did
sistance Guidstering to voe ballot?
litary Spouse
11
mail, e-mail, did not voten 2010, whatisit the
m (FVAP)
or
where.
mail, e-mail, did not votend Q38 = ain your maineb site.
mail, e-mail, did not 2010-11 ovides state-ring to vote Were you
u?
mail, e-mail, did not voter the 2010 you refer tode (VAG) for
ote or
s
5
" t
"
n
"
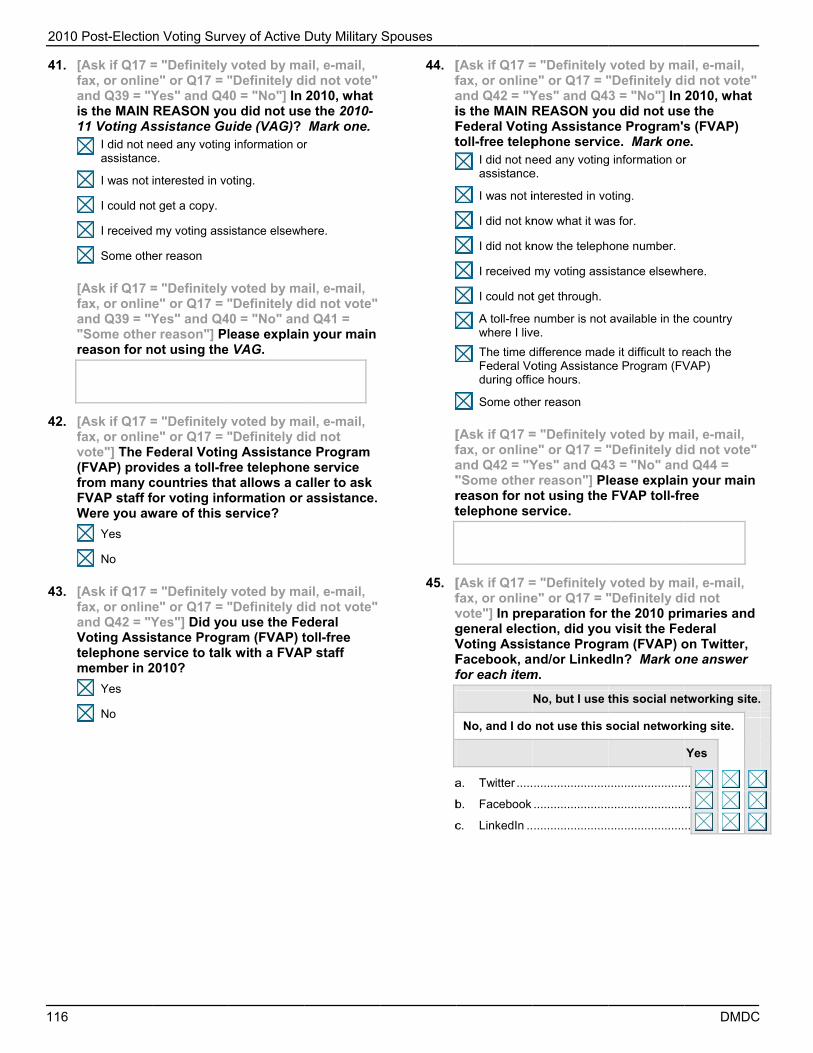
2010
116
41.
42.
43.
0 Post-Electio
[Ask if Q17 =fax, or onlinand Q39 = "Yis the MAIN 11 Voting As
I did not nassistance
I was not
I could no
I received
Some oth
[Ask if Q17 =fax, or onlinand Q39 = "Y"Some otherreason for n
[Ask if Q17 =fax, or onlinvote"] The F(FVAP) provfrom many cFVAP staff fWere you aw
Yes
No
[Ask if Q17 =fax, or onlinand Q42 = "YVoting Assistelephone semember in 2
Yes
No
n Voting Surv
= "Definitely e" or Q17 = "Yes" and Q4REASON yossistance Gu
need any votinge.
interested in vo
t get a copy.
my voting ass
er reason
= "Definitely e" or Q17 = "Yes" and Q4r reason"] Pl
not using the
= "Definitely e" or Q17 = "
Federal Votinvides a toll-frcountries thafor voting infware of this s
= "Definitely e" or Q17 = "Yes"] Did yostance Progrervice to talk2010?
vey of Active
voted by ma"Definitely d
40 = "No"] In u did not us
uide (VAG)? g information or
oting.
sistance elsewh
voted by ma"Definitely d
40 = "No" andlease explain
e VAG.
voted by ma"Definitely d
ng Assistancree telephoneat allows a caformation or service?
voted by ma"Definitely d
ou use the Feram (FVAP) tk with a FVA
Duty Military
ail, e-mail, id not vote"2010, what e the 2010- Mark one. r
here.
ail, e-mail, id not vote"d Q41 = n your main
ail, e-mail, id not e Program e service aller to ask assistance.
ail, e-mail, id not vote"
ederal toll-free P staff
Spouses
44. [faiFt
[fa"rt
45. [fvgVFf
a
b
c
[Ask if Q17 =fax, or onlineand Q42 = "Yis the MAIN RFederal Votintoll-free telep
I did not neassistance
I was not i
I did not kn
I did not kn
I received
I could not
A toll-free where I liv
The time dFederal Voduring offic
Some othe
[Ask if Q17 =fax, or onlineand Q42 = "Y"Some otherreason for ntelephone se
[Ask if Q17 =fax, or onlinevote"] In pregeneral electVoting AssisFacebook, afor each item
No, and I do
a. Twitter .....
b. Facebook
c. LinkedIn ..
= "Definitely e" or Q17 = "Yes" and Q4REASON yong Assistancphone serviceed any votinge.
interested in vo
now what it wa
now the teleph
my voting ass
t get through.
number is not ve.
difference madoting Assistancce hours.
er reason
= "Definitely e" or Q17 = "Yes" and Q4r reason"] Plot using the ervice.
= "Definitely e" or Q17 = "
eparation for tion, did you
stance Progrnd/or Linked
m.
No, but I use t
not use this s
.......................
.......................
.......................
voted by ma"Definitely di3 = "No"] In u did not usece Program'sce. Mark oneg information or
oting.
as for.
one number.
istance elsewh
available in the
e it difficult to rce Program (FV
voted by ma"Definitely di3 = "No" andease explainFVAP toll-fr
voted by ma"Definitely dithe 2010 pri
u visit the Feram (FVAP) odIn? Mark on
this social net
social network
.......................
.......................
.......................
DMDC
ail, e-mail, id not vote"2010, what e the s (FVAP) e. r
here.
e country
reach the VAP)
ail, e-mail, id not vote"d Q44 = n your main ree
ail, e-mail, id not maries and deral on Twitter, ne answer
tworking site.
king site.
Yes
..
..
..

DM
46.
47.
DC
OTHER SOU
[Ask if Q17fax, or onlivote"] Did any of the one answe
a. State orb. Local te
media ...
c. Armed Fd. Other U
magazine. Internati
print me
f. My spoug. Family m
spouse)
h. The Inte
i. Voting A
ELECTRO
[Ask if Q17fax, or onlivote"] Manrequire accinformatio13 to Novethe followi
a. GovernmFVAP (e.mil sites
b. Non-gov.com site
c. Fax .......
d. Printer ..
e. Scanner
f. DoD e-m
g. Persona
URCES OF V
7 = "Definiteline" or Q17 =you receive following so
er for each ite
r local election levision, radio,.......................
Forces Radio/T.S. civilian new
nes, radio, or Tional television
edia .................
use .................members (othe) or friends ......
ernet ...............
Assistance Offic
NIC TRANSMMATER
7 = "Definiteline" or Q17 =ny of the toolcess to e-man technology
ember 2, 2010ng? Mark on
Yes, bu
Yes
ment Web sitese.g., state or Fes) ....................vernment Web es) .................
.......................
.......................
r .....................
mail address ...
al e-mail addres
OTING INFO
ly voted by m= "Definitely voting inform
ources in 201em.
official ............ or print .......................
TV ...................wspapers, TV ....................
, radio, and .......................
.......................er than .......................
.......................
cers (VAOs) ...
MISSION OF RIALS
ly voted by m= "Definitely ls available fail, the Interny tools. From0 did you havne answer fo
ut not on a reg
s, on a regular
s other than ederal .gov or .......................sites (e.g., .......................
.......................
.......................
.......................
.......................
ss ...................
ORMATION
mail, e-mail, did not mation from 10? Mark
Not availab
No
Yes
.....
.....
.....
.....
.....
.....
.....
.....
.....
VOTING
mail, e-mail, did not
for voters net, or other m Septembeve access to
or each item.
N
gular basis
basis
.....
.....
.....
.....
.....
.....
.....
2010 Post-El
ble
r o .
No
48.
49.
lection Voting
[Ask if Q17fax, or onliand Q47 c any of the fanswer for
Yes, b
Yes, using
a. Federal (FPCA) .
b. Non-Fedrequest f
c. Ballot ....d. Federal
(FWAB)
e. Other vo
[Ask if Q17fax, or onliand Q47 f-gmail any of“Yes” or “N
a. Federal b. Non-Fed
request f
c. Ballot ....
d. Federal
e. Other vo
g Survey of Ac
7 = "Definitelne" or Q17 =<> "No"] Dufollowing ma
r each item.
ut not using t
the FVAP toll-
Post Card App.......................
deral Post Cardfor absentee b
.......................Write-In Absen.......................
oting materials .
7 = "Definitelne" or Q17 =g <> "No"] Df the followinNo” for each
Post Card Appderal Post Cardfor absentee b
.......................
Write-In Absen
oting materials .
ctive Duty Mil
y voted by m= "Definitely ring 2010, diaterials? Ma
the FVAP toll-f
-free faxing se
plication .......................d Application allot ...............
.......................ntee Ballot .......................
.......................
y voted by m= "Definitely
During 2010, dng materials?h item.
plication (FPCAd Application allot ...............
.......................
ntee Ballot (FW
.......................
litary Spouse
11
mail, e-mail, did not voteid you fax ark one
N
free faxing service
ervice
.....
.....
.....
.....
.....
mail, e-mail, did not votedid you e-? Mark
N
Yes
A) ..........
.............
.............
WAB)......
.............
s
7
"
No
"
No
2010
118
RE
50.
51.
0 Post-Electio
EASONS FOR
[Ask if Q17 =was the MAINovember 2
I was not
I was not
I was too
I forgot to
I could no
I had no c
I did not th
The absencomplicate
I was conctax liability
I missed t
I tried to vthe proces
Some oth
[Ask if Q17 == "Someothemain reason2010 electio
Elections fothe U.S. Hou2008. A lot obecause thesick, or theyyou – did yo
Yes, I vote
Yes, I vote
No, I did n
Not sure
n Voting Surv
R NOT VOTIN
= "Definitely IN reason yo, 2010 electio
interested in vo
registered to vo
busy to vote.
vote.
t register to vo
candidate prefe
hink my vote w
ntee voting proed.
cerned about fey.
he state deadli
vote but did notss.
er reason
= "Definitely er reason"] P
n for not votin.
2008 ELEC
r President, use of Repreof responden
ey weren't regy just did notou vote in tha
ed in person.
ed by mail, e-m
not vote.
vey of Active
NG IN 2010 E
did not voteou did not voon. Mark on
oting.
ote.
te.
erence.
would matter.
ocess was too
ederal or state
ine for voter re
t or could not c
did not votePlease explang in the No
CTION
the U.S. Sensentatives wnts did not ggistered, thet have time. at election?
mail, fax, or onli
Duty Military
ELECTION
e"] What te in the
ne.
income
gistration.
omplete
e" and Q50 ain your ovember 2,
nate, and were held in get to vote ey were How about
ine.
Spouses
52. Ivfo
53. Iar
54. Iar
55. TtcI
L
If you were tvoting in a fufollowing soone.
Use an Intinformation
Contact m
Contact m
Contact m
Use FVAP
Ask a frien
Ask my sp
If you were ta future elecreceive the a
By postal m
From a We
By e-mail
By fax
If you were ta future elecreturn the ab
Return by
Return onl
Return via
To what extethe followingcompleting aInternet is sa
Strongly a
Agree
Neither ag
Disagree
Strongly d
OOKING FO
to need inforuture electio
ources would
ternet search en
my state election
my county electi
my Voting Assis
P's Web site
nd
pouse
to vote usingction, how woabsentee bal
eb site
to vote usingction, how wobsentee ballo
line
a fax
ent do you agg statement?and sending afe, secure, a
agree
gree nor disagr
isagree
RWARD
rmation abouon, which of td best serve y
engine to find
n office online
ion office online
stance Officer
g an absenteould you prelot? Mark on
g an absenteould you preot? Mark on
gree or disag? I am confid
a ballot onliand reliable.
ree
DMDC
ut absentee the you? Mark
e
e ballot in efer to ne.
e ballot in efer to e.
gree with dent that ine via the

DM
56.
57.
58.
59.
60.
ForinclvotbloospoeligPrivenrSys
61.
DC
FAM
Your spoustate or terprior to enhas since cThe right tothough thehave other2010 electispouse's lefrom the lisPuerto Ric
As of Novemore than residence?
Yes
No
As of Novedeployed ostation?
Yes, dep
Yes, awbut not d
No
[Ask if Q58while your
Yes
No
As of Novespouse liv
Yes
No
r the next quesludes anyone,ing age (18 yeod, marriage,
ouse for more gible to have, avilege card (alrolled in the Destem (DEERS)
Not countifamily memon Novemb
Yes
No
MILY VOTING
se's legal vorritory wheretering militarclaimed as ho vote exteney may no lor ties there. Aion, what staegal voting rst below one
co, or a U.S. t
ember 2, 20150 miles fro
?
ember 2, 201or away from
ployed
way from his/hedeployed
8 = "Yes, depspouse was
ember 2, 201ing in the sa
stion, the defi, other than yoears old and oor adoption; dthan half of th
a Uniformed Slso called a mefense Enrollm.
ng your spombers, who wber 2, 2010?
G PATTERNS
oting residene he/she last ry service O
his/her legal rds to individnger own prAs of the No
ate or territorresidence? Pe of the 50 stterritory or p
0, did your sm his/her leg
0, was your m his/her perm
r permanent du
ployed"] Did s deployed?
0, were you ame residenc
nition of familour spouse, w
older); related depends on yheir support; aServices Identilitary ID cardment Eligibilit
use, do you were at least
S
nce is the resided
R that he/sheresidence.
duals even operty or
ovember 2, ry was your Please selectates, D.C., possession.
spouse live gal voting
spouse manent duty
uty station
you relocate
and your ce?
ly members who is of
to you by ou/your and/or is tification and ); or is
ty Reporting
have any t 18 years old
2010 Post-El
e
ct
y
e
d
62.
63.
64.
65.
lection Voting
[Ask if Q61members lilegal votinga result of y
Yes
No
Don't kn
[Ask if Q61many of the50 miles froNovember active dutymembers ifmore than residence.
1
2
3
4
5 or mor
Thank you Voting Survon this surand where surveys are(http://www(http://wwwcomments to express enter themcomments policy delibyou make oconfidentiataken in resYour feedb
Based on yyou are inefeel you haerror, clickanswers. Ifor concern
g Survey of Ac
= "Yes"] Didive more thag residence your spouse
ow
= "Yes" andese family mom their lega2, 2010 as a
y service? Df you are uns50 miles from
re
COMME
for participavey. There a
rvey. If you wthe results oe available, f
w.facebook.cw.twitter.com
or concernsin answerin in the spacewill be view
berations takon this quesal, and no folsponse to an
back is usefu
your answerseligible to takave encountek the Back buf you have anns, please en
ctive Duty Mil
d any of thesan 50 miles fron Novembe
e's active dut
d Q62 = "Yesmembers liveal voting resresult of you
Do not includsure whethem their legal
ENTS
ating in the Pare no more would like toof this and ofollow DMDCcom/go2dmdm/dmdc). If ys that you weg this surveye provided. Yed and conske place. Antionnaire willlow-up actiony specifics ul and apprec
s to previouske this surveered this mesutton and cheny additionater them bel
litary Spouse
11
se family rom their er 2, 2010, asty service?
s"] How ed more thanidence on ur spouse's
de family er they lived l voting
Post-Electionquestions
o know whenther DMDC
C Facebook dc) or Twitteryou have ere not able y, please Your
sidered as ny commentsll be kept on will be reported. ciated.
s questions, ey. If you ssage in eck your l comments ow.
s
9
s
n
r
s


This page is reserved for insertion of Standard Form 298, page 1 -- this is best accomplished by replacing this page after the document has been converted to PDF

This page is reserved for insertion of Standard Form 298, page 2 -- this is best accomplished by replacing this page after the document has been converted to PDF