Embed Size (px)
Citation preview

Intraday spot foreign exchange market.
Analysis of efficiency, liquidity and volatility.
Anna Serbinenko*
Svetlozar T. Rachev†
Abstract
Spot foreign exchange market today is the most volatile and liquid of all financial markets in the
world. The present paper addresses in details the efficiency, liquidity and risk seen by a trader,
particularly concentrating on analysis of high frequency data for intraday trading. The main
findings of the research include the fact that the market was found to be efficient in weak form,
which in particular means that technical analysis cannot be successfully applied to systematically
get an above average profit from speculative trades, but fundamental analysis may increase the
expected income. Carry trades were not found to be consistently profitable or generating non
negative profit. Spot foreign exchange market was proven to be extremely liquid, and its
liquidity is being independent from regional trading sessions. We also found no evidence on the
spot forex market of hot potato trading that usually follows news announcements. Finally, five
different risk measures have shown that the trading based on high frequency data, e.g. minute
data, is more risky than the trading using low frequency data, like daily data. The volatility of the
market was shown to be increased in the first and the last thirty minutes of the corresponding
regional equity trading session(s).
Keywords: foreign exchange market, spot market, market efficiency, expected tail loss,
STARR ratio, R-ratio.
JEL classification: G14, G15
* Chair of Statistics, Econometrics and Mathematical Finance, School of Economics and Business Engineering, University of Karlsruhe and KIT. Kollegium am Schloss, Bau II, 20.12, R210, Postfach 6980, D-76128, Karlsruhe, Germany. E-mail: [email protected] and [email protected]. † Chair-Professor, Chair of Statistics, Econometrics and Mathematical Finance, School of Economics and Business Engineering, University of Karlsruhe and KIT, and Department of Statistics and Applied Probability, University of California, Santa Barbara, and Chief-Scientist, FinAnalytica INC. Kollegium am Schloss, Bau II, 20.12, R210, Postfach 6980, D-76128, Karlsruhe, Germany. E-mail: [email protected].

Introduction
Today the spot forex market is the most liquid and volatile of all financial markets. News
announced in the United States are incorporated in London and Hong Kong market quotes within
less than ten seconds. The market efficiency characterizes how fast and precise those news are
reflected in the exchange rate on the market. Virtually any financial asset can be bought or sold
within seconds during trading sessions. Foreign Exchange market with its 24 hours trading, is
considered to be the most liquid of all financial markets. Liquidity influences the attractiveness
of an investment and the market efficiency. Finally, the volatility of financial markets is a
headache for corporate managers and the source of gain for speculators. It differs greatly
between sectors and geographical regions.
The present paper addresses the three major market characteristics, efficiency, liquidity and
volatility, of the spot foreign exchange market. For each hypothesis, tests on extensive high
frequency data are made. The main focus is places on the application of the derived conclusions
to intraday forex trading.
The remainder of the paper is organized as follows. Chapter 1 analyzed the market efficiency.
Market liquidity is discussed and tested in the chapter 2. Chapter 3 presents different measures of
volatility and compares risks associated with different time horizons for trading. Chapter 4
concludes.
Chapter 1. Market Efficiency
Market efficiency is defined by how fast and how accurately all the relevant information is
absorbed by the market, in particular in the price and the traded volume. In 1970, Fama (Fama,
1970) introduced the concept of three forms of the market efficiency: weak, semi-strong and
strong. The source of market imperfections and reduced efficiency is multiple: inaccurate public
information (Frenkel et al., 2002), actions of more informed participants like Central Banks or
market makers.
Interest Rate Parity and Carry Trades
Interest rate parity refers to the relationship between interest rates of two currencies and a
corresponding forward exchange rate. Say, and are interest rates of two different currencies, , and , are respectively the present and the forward exchange rates. Then the relationship
1 + = , (1 + ) ,
has to hold if the market is efficient. This relationship is also called covered interest rate parity.
The market efficiency however has been put in a serious doubt, also in the aspects concerning
the interest rates parity (Nguyen, 2000).
An arbitrage attempt is sometimes made through the so called carry trades. It consists in
borrowing currency generating low interest rate and investing in high yielding currency,
assuming the exchange rate does not change over time or at least change less than necessary to
turn a potential profit into a realized loss. To test how profitable carry trades can be, we take an
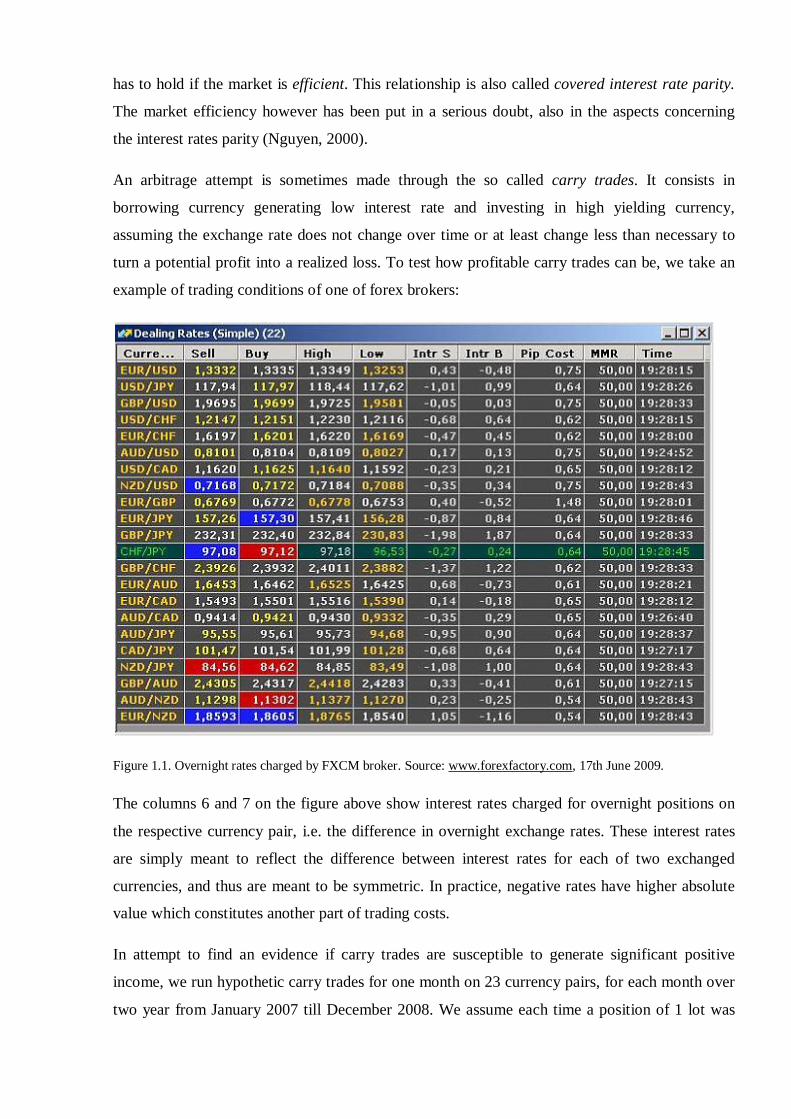
example of trading conditions of one of forex brokers:
Figure 1.1. Overnight rates charged by FXCM broker. Source: www.forexfactory.com, 17th June 2009.
The columns 6 and 7 on the figure above show interest rates charged for overnight positions on
the respective currency pair, i.e. the difference in overnight exchange rates. These interest rates
are simply meant to reflect the difference between interest rates for each of two exchanged
currencies, and thus are meant to be symmetric. In practice, negative rates have higher absolute
value which constitutes another part of trading costs.
In attempt to find an evidence if carry trades are susceptible to generate significant positive
income, we run hypothetic carry trades for one month on 23 currency pairs, for each month over
two year from January 2007 till December 2008. We assume each time a position of 1 lot was

placed the first day of the month and closed the first day of the next month. Each time the carry
position is taken in the direction that generates positive overnight rate. All pip values are
converted in USD at the average rate, and thus the generated profit is also expressed in US
dollars. The monthly generated income is calculated as = + ℎ = 30 ∗ ∗ + ℎ ∗
The results of calculations are shown in the table below.
Currency
pair
Pip value
(USD)
Monthly profits in 2007
01/07 02/07 03/07 04/07 05/07 06/07 07/07 08/07 09/07 10/07 11/07 12/07
EURUSD 10.00 -1471 2079 1589 2839 -1761 1009 1519 -351 6569 2079 1839 -371
USDJPY 9.02 1972 -1842 -634 1963 2369 1476 -3898 -2212 -589 782 -3636 836
GBPUSD 10.00 509 -141 659 3049 -1931 2799 2169 -1251 2999 3339 -2531 -6821
USDCHF 8.76 2218 -2057 -287 -384 1719 -200 -1619 834 -3844 -138 -2258 361
EURCHF 8.76 1205 -626 1029 2238 232 574 -854 530 1283 1581 -1765 -57
AUDUSD 10.00 -1221 1129 2259 2039 -211 2269 69 -3361 7309 4359 -4851 -641
USDCAD 9.38 1213 -579 -1639 -3890 -3684 -588 472 -1067 -5832 -4472 5237 -607
NZDUSD 10.00 -1388 1162 1592 2642 -298 3662 -1138 -5828 6082 1372 -988 622
EURGBP 13.64 -1242 1624 887 600 -232 -546 123 396 3165 -82 2401 3206
EURJPY 9.02 507 -377 597 5411 976 2869 -3974 -3623 5718 3013 -3740 579
GBPJPY 9.02 4464 -3750 -657 7151 2534 6150 -5652 -5796 1822 5014 -10115 -5210
CHFJPY 9.02 -314 155 -278 1931 471 1426 -1928 -2550 2716 822 -1161 380
GBPCHF 8.76 5104 -4226 67 2493 1372 2581 -1020 382 -4734 3001 -7292 -6022
EURAUD 8.51 659 284 -2218 -422 -1316 -2507 1450 5339 -5238 -4422 9092 812
EURCAD 9.38 -251 1428 -645 -2428 -6958 68 1925 -1902 -1987 -4716 9101 -1405
AUDCAD 9.38 -359 870 1123 -1044 -3323 1751 485 -4158 2014 -134 363 -1175
AUDJPY 9.02 171 -171 1884 3760 3985 1370 -3210 -5383 7051 5193 -8259 45
CADJPY 9.02 606 -1107 840 5204 5736 1958 -4119 -1098 5601 6070 -9799 1444
NZDJPY 9.02 -126 0 1199 4193 1343 5211 -4391 -7826 5933 1984 -3787 1208
GBPAUD 8.51 4271 -3192 -5073 -1703 -1235 -2392 2075 7190 -14271 -5958 8117 -4996
AUDNZD 7.30 401 7 583 -825 262 -1671 1444 3523 218 2750 -3335 -1204
EURNZD 7.30 0 0 0 0 -354 -5453 3951 10910 -4789 -142 3754 -1215
Currency
pair
Pip value
(USD)
Monthly profits in 2008 Average
01/08 02/08 03/08 04/08 05/08 06/08 07/08 08/08 09/08 10/08 11/08

EURUSD 10.00 2719 3579 5809 389 -2081 1989 -1461 -16341 1759 -13521 989 -26
USDJPY 9.02 -4475 -2221 -3095 3523 2053 818 1864 -751 -372 -8234 -3140 -758
GBPUSD 10.00 179 39 -541 449 -1321 1909 -981 -17151 -2841 -17491 -6941 -1819
USDCHF 8.76 -4317 -3529 -3809 3725 711 -1619 2498 4619 2131 3410 5170 145
EURCHF 8.76 -3964 -2265 -898 4367 521 -1047 2387 -1529 -2799 -9185 5944 -135
AUDUSD 10.00 2009 3759 -1901 2999 1159 439 -1671 -8431 -6201 -12591 -1591 -560
USDCAD 9.38 950 -1498 3877 -1789 -992 2442 312 3680 162 13830 2648 356
NZDUSD 10.00 2042 1392 -1348 -278 232 -1998 -2768 -3228 -2828 -8458 -3868 -592
EURGBP 13.64 1869 2483 4380 -1105 518 423 -382 3643 -2592 300 4571 1061
EURJPY 9.02 -4227 -278 263 4645 1796 2968 1210 -7842 -8491 -21312 -3776 -1178
GBPJPY 9.02 -8781 -4534 -6563 8179 2174 3202 2733 -15408 -6004 -26921 -9953 -2866
CHFJPY 9.02 -124 1264 768 92 831 2445 -810 -3866 -3569 -8392 -5832 -675
GBPCHF 8.76 -8440 -6986 -8028 7723 364 -1642 4044 -7319 995 -11629 960 -1663
EURAUD 8.51 -490 -2303 8402 -5698 -2022 1339 1271 5237 5305 11381 3501 1193
EURCAD 9.38 3820 949 11249 -4201 -2165 5630 -1124 -3234 -5645 3932 2713 181
AUDCAD 9.38 2746 2089 1779 1217 110 2689 -1260 -4946 -6044 -3352 -68 -375
AUDJPY 9.02 -2029 1470 -4616 6329 2633 1118 144 -7628 -7519 -16274 -2984 -996
CADJPY 9.02 -5534 -783 -6832 5538 2571 -1621 1489 -2892 -1928 -16200 -3722 -808
NZDJPY 9.02 -1524 -469 -3760 2777 1479 -1307 -1289 -2678 -3994 -11802 -4797 -975
GBPAUD 8.51 -3992 -7345 3326 -5277 -3226 1097 2331 791 11138 13997 -4017 -363
AUDNZD 7.30 -125 1998 -88 3187 940 2881 1984 -4349 -2839 -3101 4019 290
EURNZD 7.30 -770 1091 8124 -405 -544 6110 4534 -1652 449 5643 11129 1755
Table 1.1. Monthly income generated by carry trades.
In equilibrium, the result of carry trades should be close to zero, i.e. investing in one currency
should not produce more income than investing in another. Taking into account trading costs, the
result might be expected to be below zero, approximately equal to the encountered trading costs.
However, the empirical result vary from several thousands a month of profit to several thousands
loss. The average monthly profit is positive for 7 out of 23 currency pairs, and the average of all
the trades gives a significant loss. With this quick test, we confirm that we do not find any
evidence of profitability or at least stability of carry trades.
Effect of News Announcements on Foreign Exchange Trades. Testing for Market Efficiency.
Official announcements about macro-fundamentals are usually scheduled in advance. Evans and
Lyons (Evans, Lyons, 2001 and 2004) address daily data and are paying particular attention at
moments of news announcements over a period of six years. They point out that it is difficult to
distinguish rational trades following the news announcement, and those that are non rational and
have to be rather studied using market psychology.
Contrary to strong form of market efficiency, semi-strong and weak forms of this hypothesis are
less restrictive. Semi-strong form claims that all public information is incorporated in prices,
which exclude any privately known information. In other words, if a market is proved to be
efficient in semi-strong form, neither fundamental nor technical analysis can consistently
produce abnormal returns. The weak form of market efficiency states that all past prices are
reflected in the today's price on the market. This basically means that is it not possible to get any
significant advantage on the market by analyzing pas prices only, as it is done in the case of
technical analysis. However, fundamental analysis can be successfully applied.
Tools used to test market efficiency are dependent on the form of efficiency to be tested. Weak
form may be detected using unit root tests. Semi-strong form is analyzed using cointegration,
Granger causality and variance decomposition analysis. To define whether the foreign exchange
market is efficient in semi-strong form, we are going to test:
• If the spot exchange rate behaves as a random walk, and
• If there is cointegration among a set of spot rates.
If this analysis does not provide us with a positive answer, we will run a unit root test to check if
the foreign exchange market is efficient in a weak form over short period of time.
Methodology. To test if there is cointegration among spot rates, we do a two step analysis:
1. We find the order of integration of the variables, i.e. the number of times is differentiated
before becoming stationary. For this, we use the Augmented Dickey-Fuller (ADF) test,
which we expect to be confirmed by Phillips-Perron (PP) test. The reason of this step is
that the test for cointegration should be done only among variables with the same degree
of integration.
2. We apply Engle and Granger method to define if variables are cointegrated. In this
method, one variable is regressed on the other, and we test if the residuals are stationary.
Again, the Augmented Dickey-Fuller and Phillips-Perron tests are used to test for
stationarity.
Data. The analysis is first run on the minute-by-minute exchange rates on a set of currency pairs
for the period from 1st March 2009 until 31st May 2009. Because of the extensive second step of
the analysis, our attention is restricted to only the exchange rates of USD vs. major currencies:
EUR, GBP, CHF, JPY, CAD, AUD, NZD.
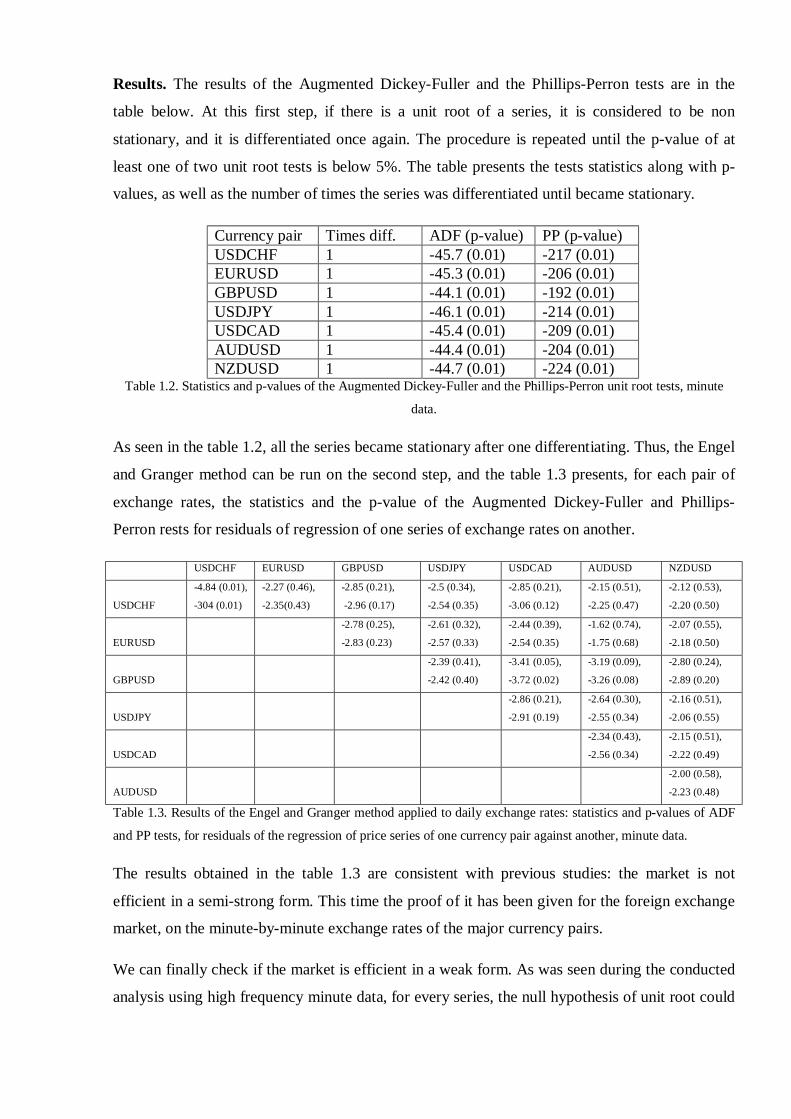
Results. The results of the Augmented Dickey-Fuller and the Phillips-Perron tests are in the
table below. At this first step, if there is a unit root of a series, it is considered to be non
stationary, and it is differentiated once again. The procedure is repeated until the p-value of at
least one of two unit root tests is below 5%. The table presents the tests statistics along with p-
values, as well as the number of times the series was differentiated until became stationary.
Currency pair Times diff. ADF (p-value) PP (p-value) USDCHF 1 -45.7 (0.01) -217 (0.01) EURUSD 1 -45.3 (0.01) -206 (0.01) GBPUSD 1 -44.1 (0.01) -192 (0.01) USDJPY 1 -46.1 (0.01) -214 (0.01) USDCAD 1 -45.4 (0.01) -209 (0.01) AUDUSD 1 -44.4 (0.01) -204 (0.01) NZDUSD 1 -44.7 (0.01) -224 (0.01)
Table 1.2. Statistics and p-values of the Augmented Dickey-Fuller and the Phillips-Perron unit root tests, minute
data.
As seen in the table 1.2, all the series became stationary after one differentiating. Thus, the Engel
and Granger method can be run on the second step, and the table 1.3 presents, for each pair of
exchange rates, the statistics and the p-value of the Augmented Dickey-Fuller and Phillips-
Perron rests for residuals of regression of one series of exchange rates on another.
USDCHF EURUSD GBPUSD USDJPY USDCAD AUDUSD NZDUSD
USDCHF
-4.84 (0.01),
-304 (0.01)
-2.27 (0.46),
-2.35(0.43)
-2.85 (0.21),
-2.96 (0.17)
-2.5 (0.34),
-2.54 (0.35)
-2.85 (0.21),
-3.06 (0.12)
-2.15 (0.51),
-2.25 (0.47)
-2.12 (0.53),
-2.20 (0.50)
EURUSD
-2.78 (0.25),
-2.83 (0.23)
-2.61 (0.32),
-2.57 (0.33)
-2.44 (0.39),
-2.54 (0.35)
-1.62 (0.74),
-1.75 (0.68)
-2.07 (0.55),
-2.18 (0.50)
GBPUSD
-2.39 (0.41),
-2.42 (0.40)
-3.41 (0.05),
-3.72 (0.02)
-3.19 (0.09),
-3.26 (0.08)
-2.80 (0.24),
-2.89 (0.20)
USDJPY
-2.86 (0.21),
-2.91 (0.19)
-2.64 (0.30),
-2.55 (0.34)
-2.16 (0.51),
-2.06 (0.55)
USDCAD
-2.34 (0.43),
-2.56 (0.34)
-2.15 (0.51),
-2.22 (0.49)
AUDUSD
-2.00 (0.58),
-2.23 (0.48)
Table 1.3. Results of the Engel and Granger method applied to daily exchange rates: statistics and p-values of ADF
and PP tests, for residuals of the regression of price series of one currency pair against another, minute data.
The results obtained in the table 1.3 are consistent with previous studies: the market is not
efficient in a semi-strong form. This time the proof of it has been given for the foreign exchange
market, on the minute-by-minute exchange rates of the major currency pairs.
We can finally check if the market is efficient in a weak form. As was seen during the conducted
analysis using high frequency minute data, for every series, the null hypothesis of unit root could

not be rejected. Thus it is assumed the forex market market displays weak form of efficiency
over short term.
Chapter 2. Market Liquidity
Market liquidity characterizes how easy and fast the assets can be exchanged, moved, bought or
sold, without effecting price and incurring significant costs. Forex market in general is extremely
liquid and it operates the daily volume of 3.2 trillion USD (state April 2007, Bank for
International Settlements, 2007), 24 hours a day, actively five days a week and even with some
transactions over the weekend.
Measures of Liquidity
Potential measures of liquidity include:
1. Frequency with which transactions take place - how often assets are bought and sold.
2. Probability that the next transaction will be executed at the same price as the previous
one – a measure of both the frequency of transactions and the possibility to buy or sell at
the current market price.
3. How much trades influence the price. On a less liquid market trades are more susceptible
to move the market price.
Market makers contribute greatly to the liquidity of the market, by translating the illiquidity of
an asset into cost, usually in the form of the spread. The table figure below shows an example of
trading conditions of one of foreign exchange market makers, offering trades on seventy
currency pairs. As it can be observed, majors have a tight spread of two to three basic points,
while exotic currency pairs, traded with a spread higher than 100 points. Translating spread into
money, it means if one buys and immediately sells one lot of EURUSD, i.e. 100 000 EUR, with
no price change in the meanwhile, he loses 20 USD as trading costs, in the form of the spread.
The same operation on USDZAR will cost him 1250 USD!

Figure 2.1. Spreads on currency pairs of MIG Investments SA, www.migfx.com, 20th June 2009.
Time-Varying Liquidity
The trading on the foreign exchange market is not uniform over time. Central Banks
interventions decrease forex market liquidity and increase costs borne by traders (Pasquariello,
2002). Evans, Lyons (Evans, Lyons, 2004) investigate if trades have more influence on the price
around the moments of news announcements, and come to a positive conclusion.
During the day, the level of trading activity is variable. If we schematically split the 24-hour
period of trade into "Japanese", "European" and "American" sessions, corresponding to business
hours in each respective part of the world, we can expect significant movements of currencies in

periods of business hours of its home region. For example, the EURUSD currency pair would
most move during the European and American session, but very little during Japanese business
hours.
Figure 2.2. Calendar of news announcements affecting the foreign exchange market, www.fx360.com/calendar,
22nd June 2009.
The figure 2.2 shows an example of forex news announcements calendar. The announcements of
medium to high importance are susceptible to temporarily affect market operations. To test it, we
will compare the market liquidity between the time around a news announcement and all the
other trading time. We analyze the announcements of medium and high importance as indicated
and scheduled on publicly available calendars, e.g. www.fx360.com or www.dailyfx.com.
Following statistics will be analyzed:

• Percentage of trades that were made at the same price as the previous trade, for
evaluating regional sessions activity,
• Time between trader's request and the moment when the transaction is completed, for
evaluating the impact of news announcements.
Percentage of trades executed at the same price. We analyze the order flow on 70 currency
pairs over three months from 1st March 2009 till 31st May 2009. Each order is decomposed into
two transactions - opening and closing. We additionally consider that the currency may be more
volatile as the equity market trading session is opened and as news about the relative macro
fundamentals are arriving. We account for the next trading sessions:
1. Japanese session (Tokyo Exchange): 9.00am till 3.00pm JST (GMT+9), for JPY, AUD,
NZD, HKD, SGD;
2. European session (Frankfurt Exchange): 9.00am till 5.30pm CET (GMT + 1)/ CEST
(GMT + 2), for EUR, CHF, GBP, DKK, NOK, SEK, PLN, HUF, CZK, TRY, ZAR;
3. American session (New York Stock Exchange): 9.00am till 4.00pm EST (GMT-5)/ EDT
(GMT-4), for USD, CAD, MXN.
For each currency pair, we calculate the number of transactions for each quadrant as shown in
the table 2.1.
Regional session opened
Regional session closed
Execution at same price as previous trade
Execution at different price from previous trade
Table 2.1. Classification of counted transactions
After the analysis and in order to have meaningful comparison, only those currency pairs were
kept, for which there was in average at least one transaction per hour for the whole three months
of analysis. The statistics is presented in the table 2.2.
Currency pair Same price, session(s) opened, %
Same price, session(s) closed, %
AUDCAD 42.6 46.9 AUDJPY 39.6 38.3 AUDNZD 10.7 21.4 AUDUSD 37.5 29.4 CADCHF 69.9 56.6 CADJPY 37.5 31.8 CADSGD 69.2 55.7

CHFJPY 41.0 42.0 CHFSGD 62.5 58.2 EURAUD 15.6 17.3 EURCAD 75.7 72.8 EURCHF 44.3 51.2 EURGBP 57.6 48.3 EURJPY 31.5 41.9 EURNZD 33.3 16.3 EURTRY 10.6 12.6 EURUSD 40.6 46.2 GBPAUD 14.5 12.7 GBPCAD 61.0 59.2 GBPCHF 25.4 38.1 GBPJPY 22.2 33.6 GBPUSD 37.0 35.9 NZDCAD 1.0 3.0 NZDUSD 40.3 25.9 USDCAD 30.2 33.6 USDCHF 67.5 51.5 USDJPY 44.2 51.8 USDTRY 27.3 23.7
Table 2.2. Part of transactions executed at the same price as the previous trade depending if the regional sessions are
opened for either of currencies
Observing the results of calculations, we do not find any signs an increased percentage of trades
executed at the same price as the previous one. The difference between the values calculated for
periods when regional sessions are opened and when they are closed, differ very slightly. For
some currency pairs, like AUDCAD, AUDNZD, EURJPY, USDCAD, the relationship even
showed to be the inverse.
Time between trader’s request and the completion of a transaction. The same transactions
flow is analyzed under a magnifying glass, considering each transactions as a sequence of
electronic information exchanges. At every occurrence, we measure the total time elapsed
between the moment the trader generates the initial request and the moment the position is
placed on the market. We compare the average time required 3 minutes prior and 10 minutes
after major and medium news announcements, and all other trading time. The results are shown
in the table 2.3.
Average time, s Standard deviation News time (major news) 3.24 4.76 News time (medium news) 3.21 4.65 Non news time 3.21 4.47
Table 2.3. Time required to complete a market transaction.

It is a common practice that small orders are typically processed automatically, while important
trades can be verified by a dealer before they are being approved. If we assume that trading
system can automatically handle any volume the market generated at any conditions without
changing the processing time, we narrow the analysis to positions processed after a dealer's
approval. The results are presented in the table 2.4.
Average time, s Standard deviation News time (major news) 4.62 8.35 News time (medium news) 4.60 8.10 Non news time 4.48 7.68 Table 2.4. Time required to complete a market transaction (manual order processing only).
The results above do not witness for any significant difference between the processing time. We
attempt to make only the distinction between major news and no news, as well as restrict the
definition of news time to 1 minute prior and 5 minutes after the news announcement. The
results are in the table 2.5.
Average time, s Standard deviation All transactions
News time (major news) 3.23 4.69 Non news time 3.21 4.48
Manual processing only News time (major news) 4.71 8.32 Non news time 4.49 7.70
Table 2.5. Time required to complete a market transaction (important news only).
From the results above, we conclude that the orders processing time as a measure of forex
market liquidity does not change in the period of news announcements.
Hot Potato Trading
Evans and Lyons (Evans, Lyons, 2001) analyze the market liquidity using the orders flow. A
particular attention is paid to the “hot potato" trading, when positions are passed many times
between traders and dealers, for risk management purposes. Hot potato trading generates
increases the number of transactions, i.e. a certain volume of demand and supply. On the other
hand, repetitive transactions in both directions are susceptible to compensate themselves, thus
having the resulting signed order flow to remain the same.
The model is described by two equations below: ∆ = ( + ) − ∆ + ∆ = + ∆ +

where ∆ is the price change in the moment , is the order flow in the moment , = ∆ , = ( + ) , > 0, = 1 … 8, ∆ is the payoff increment in the moment , is aggregated order flow in the moment , indicates a proximity of news announcements.
Evans and Lyons (Evans, Lyons, 2005) found evidence of a clear impact of news announcements
on market liquidity, as well as some evidence of potato trading using hourly data. To test for
presence of hot potato trading activity on minute data on forex, we are going to estimate the
model for the major currency pairs using unsigned orders flow. A dummy variable takes the
value of 1 one minute prior and ten minute after major and medium news announcements, 0
otherwise. The , its p-value and of the model are presented in the table 2.6.
Currency pair (p-value) EURUSD 0.0 (0.122) 13.53% USDCHF 0.0 (0.002) 10.26% GBPUSD 0.0 (0.137) 18.34% USDJPY 0.0 (0.729) 11.02% USDCAD 0.0 (0.358) 10.83% AUDUSD 0.0 (0.201) 14.53% NZDUSD 0.0 (0.546) 9.35%
Table 2.6. , p-value and of the estimated hot potato trading model, minute data.
All the coefficients differentiating between news announcements time, i.e. expected time of hot
potato trading, and all the other time, are at zero. We thus find no evidence of hot potato trading
on the foreign exchange market.
Chapter 3. Volatilit and Risk
Market volatility is a characteristic that describes how often and how much the market, in
particular the price, changes. Market volatility is perceived differently by different market
participants: it is desirable for active speculators, but tends to be avoided by long term investors.

Measures of Volatility and Risk
Volatility is traditionally measured using basic statistical tools, like variance and standard
deviation. According to Mandelbrot (Mandelbrot, Hudson, 2004, p. 48) this measure only
reflects one part of the real market risk, "benign risk". The remaining "wild risk" is often
neglected by researches, unless they use stable Pareto distributions. An alternative measure of
volatility could be the number of price ticks arriving per unit of time – useful information for
speculators.
Value-at-Risk, or VaR, at the 100(1− )% confidence level is generally defined by the upper 100 percentile of the loss distribution and is denoted as ( ) , where is the random
variable of loss. The VaR is a rather simplistic measure that only gives the level of loss. The
investor does not know anything from VaR about the potential loss beyond this limit. An
investment with VaR of 10 000 USD is not necessarily less risky than that with the VaR at 20
000 USD, if its potential maximum loss is 100 000 USD vs. 50 000 USD of the second asset.
This type of risk if often referred as tail risk.
An extension of the VaR definition is the Expected Shortfall measure, otherwise called Expected
Tail Loss. While using this measure, one assumes the loss is already beyond the VaR level. The
Expected Shortfall measures the expected loss under these conditions, i.e. is the conditional
expectation of loss, when the loss exceeds the VaR level (Arztner et al., 2007, 2009). In other
words, it calculates how severe the average loss is, if VaR exceeded (Rachev et al., 2006): %( ) = ( | > ( ) %( ))
where is the return given over time horizon, = − is the loss. %( ) is also denoted ( ) %( ) meaning conditional .
Three ratios are commonly used to evaluate the risk of an investment:
1. Sharpe Ratio (Sharpe, 1966) is a measure of risk-adjusted performance of an investment
asset or a trading strategy. It is defined as:
= ( − )
The major shortcoming of this ratio is the underlying assumption of a normal distribution
of residuals.

2. Stable-Tail Adjusted Return Ratio (STARR) (Rachev, 2006) is the ratio between
expected return and its conditional value at risk: = ( − ) ( ) % − ≔ ( ) %
3. Rachev ratio (R-ratio) (rachev et al., 2007) with parameters and is defined as:
= %( ) %( ) = − ( , )
where and are in [0,1]. The idea of this ratio is to maximize the level of return and
get insurance for the maximum loss. It thus, out of three presented ratios, provides the
most flexibility in terms of underlying distribution and desired levels of confidence,
For both STARR and R-ratio, a lower absolute value negative result indicates a higher risk. The
table below compares the risk of trading different currencies, on minute and daily data for the
period from 1st March 2009 till 31st May 2009. ETL is calculated based on the assumption that
the errors follow an -stable distribution.
Currency
Pair
Daily data Minute data
Sharpe
ratio
VaR
(10%)
ETL
(10%)
STARR
(90%)
R (0.1,0.8) Sharpe
ratio
VaR
(10%)
ETL
(10%)
STARR
(90%)
R (0.1,0.8)
AUDCAD 0.0015 0.8302 -0.0800 -1.1155 -8.5090 0.0445 0.8079 -0.0785 -1.1150 -8.5512
AUDCHF 0.0015 0.6884 0.0137 -1.1913 50.9403 0.0167 0.6630 0.0359 -1.2166 19.7107
AUDJPY 0.0000 -9.0034 1.0615 -0.7443 -0.9814 0.0000 -8.4068 1.0241 -0.7589 -1.0888
AUDNZD 0.0010 1.1733 -0.0628 -1.1403 -16.486 0.0235 1.1674 -0.0606 -1.1396 -17.034
AUDUSD 0.0016 0.6591 -0.0637 -1.1242 -9.1601 0.0088 -7.5920 1.0057 0.5165 1.8564
CADCHF 0.0013 0.8034 -0.0029 -1.1654 -270.04 0.0435 0.8101 0.0189 -1.1971 42.2920
CADJPY 0.0000 -5.6208 0.9071 -1.4413 4.8332 0.0000 -3.9164 0.8565 -1.3543 5.3709
CHFJPY 0.0000 -3.5578 0.9135 -1.1781 9.3900 0.0000 -8.3454 1.0974 -1.2331 7.1522
CHFSGD 0.0009 0.3692 0.3481 -1.6275 3.8032 0.1338 0.1529 0.4332 -1.8940 3.3520
EURAUD 0.0006 1.7325 -0.1430 -1.1726 -11.181 0.0082 1.7489 -0.1398 -1.1753 -11.457
EURCAD 0.0007 1.5410 -0.0250 -1.2415 -58.668 0.0160 1.5743 -0.0973 -1.1951 -14.518
EURCHF 0.0009 1.4886 -0.1413 -1.1141 -8.5906 0.1075 1.4941 -0.1427 -1.1157 -8.5254
EURGBP 0.0014 0.8767 -0.0652 -1.1830 -11.923 0.0236 0.8786 -0.0442 -1.2259 -18.251
EURJPY 0.0000 -4.3413 0.8341 -1.3445 5.6189 0.0000 -5.5108 0.8959 -1.4584 4.7270
EURNZD 0.0005 2.2083 -0.2169 -1.1198 -8.6620 0.0064 0.0103 0.5711 -1.5590 4.4859
EURSGD 0.0006 1.9573 -0.0753 -1.2119 -23.420 0.0733 1.8094 -0.0624 -1.1453 -26.111
EURUSD 0.0009 -6.2869 0.9386 4.3122 2.1823 0.0220 1.0741 -0.1048 -1.1208 -8.8516
GBPCHF 0.0008 -0.3937 0.5056 -1.7512 3.3735 0.0242 -0.5833 0.5545 -1.8589 3.2106
GBPJPY 0.0000 -9.2981 1.0793 -0.7307 -0.8056 0.0000 -9.5146 1.0922 -0.7231 -0.7294
GBPUSD 0.0008 12.5331 - - - 0.0119 1.5575 -0.1555 -1.1257 -8.5345
NZDCAD 0.0018 0.6622 -0.0556 -1.1290 -10.132 0.0531 0.6810 -0.0677 -1.1180 -8.2825
NZDCHF 0.0019 0.6152 -0.0592 -1.1199 -8.9276 0.0747 0.5869 0.0174 -1.2117 32.6655
NZDJPY 0.0000 -4.1983 0.6461 0.5975 1.8360 0.0000 -6.3214 0.8338 -0.7178 -0.5423
NZDUSD 0.0020 0.5309 -0.0454 -1.1315 -10.255 0.0113 0.5257 -0.0413 -1.1327 -11.326

USDCAD 0.0010 -1.2897 0.5613 -3.2237 2.4629 0.0118 -1.1467 0.5521 -2.9630 2.5018
USDCHF 0.0011 1.0003 -0.0949 -1.1158 -8.9029 0.0400 1.1056 -0.1063 -1.1195 -8.6786
USDJPY 0.0000 -8.1169 1.0273 -0.5349 0.4751 0.0000 -7.8630 1.0093 -0.6059 0.1148
USDZAR 0.0001 1.6547 0.7582 -1.1781 9.7922 0.0005 6.2553 0.5250 -1.1665 -26.586
Table 2.7. Volatility evaluated on daily and minute data: Sharpe ratio, % , % , % , − . , . .
As can be observed, the risk increases as one uses higher frequency data. This is an important
remark, because it shows that the foreign exchange market does not display fractal properties as
suggested by Mandelbrot (Mandelbrot, 2004), even if the charts are visually very similar. Low
frequency daily data and high frequency minute data on the same underlying currency pair do
not have the same properties. The practical conclusion is however as expected: the trading on
high frequency data is more risky than using longer term information.
Time-Varying Volatility
On the equity market, volatility is known to follow an U-shape (Lyden, 2007), as the intensity
and the volume of trades are higher towards the beginning and the end of the trading day. On the
24-hour forex market however there is no formal trading day, but rather regional sessions that
correspond to the trading day on the equity market of the respective region: Japanese, European
and American.
According to the Glosten-Milgrom-Harris model (Glosten et al., 1988), changes in observed
transaction prices have permanent part , affecting future trades, and temporary component
which reflects the influence on the current trade only. The size of effects equals , indicated
whether the trader takes a long or a short position. The exogenous term is the non explained
part of the price variation. The model is expressed by the following equation: ∆ = ( ) + ( )∆ +
Lyden (Lyden, 2007) find evidence of the temporary impact is higher during the first half-hour
of trading day.
We modify the initial equation of the model. Instead of the price change, we evaluate the number
of ticks per unit of time as a measure of price volatility. As an indicator of specific period of
time, we introduce the variable having the value of
= 0, ,2, ,1, ℎ . We thus estimate the equation:

= ( ) + ( ) + where ( ) and ( ) are assumed to be constants. The model is estimated on the minute data.
The estimated values of the coefficient along with its p-value for major currency pairs are
presented in the table below. The result for cross and exotic currency pairs are of the same order.
Currency pair p-value EURUSD 4.41 0.00 USDCHF 4.18 0.00 GBPUSD 5.71 0.00 USDJPY 0.63 0.14 USDCAD 1.63 0.00 AUDUSD 0.15 0.55 NZDUSD 0.15 0.32
Table 2.8. and p-value for the Glosten-Milgrom-Harris model.
For four currency pairs out of seven, there is a non negligible evidence of an increased volatility
during the first and the last 30 minutes of either regional equity trading session.
Chapter 4. Conclusion
The present research studied such crucial properties of the spot foreign exchange market over the
short term as efficiency, liquidity and volatility. In particular, it was found on minute data that
the forex market market is efficient in weak form. Foreign exchange is also being extremely
liquid, and its liquidity is not affected by regional equity trading sessions and news
announcements. Finally, the forex market is exceptionally volatile, especially on the high
frequency data. Additionally, it was noted that forex data, in spite of apparent fractals pattern,
does not have same properties at different scales, in particular in terms of market volatility. The
main conclusion for short term intraday trading is that investors should be particularly cautious
and use specified models only, as traditional equity and long term forex models are not
appropriate. In terms of future research, the intraday spot forex trading is definitely a vast
domain that is still to be explored and new adequate models are still to come.
Bibliography
Artzner P., Delbaen F., Eber J.M., Heath D. (1997), Thinking Coherently // Risk, Vol. 10 (11),
pp. 68-71.
Artzner P., Delbaen F., Eber J.M., Heath D. (1999), Coherent Measures of Risk // Mathematical
Finance, Vol. 9 (3), pp. 203-28.
Bank for International Settlements (2007), Triennal Central Bank Survey. Foreign Exchange and
Derivatives Market Activity in 2007 // December 2007.

Beine M., Laurent S., Palm F. (2003), "Central Bank FOREX Interventions Assessed Using
Realized Moments // Journal of International Financial Markets, Institutions and Money,
available at SSRN: http://ssrn.com/abstract=563721.
Beine M., Lecourt Ch. (2004), Reported and Secret Interventions in the Foreign Exchange
Markets // Finance Research Letters, 1(4), pp. 215-225.
Evans M.D.D., Lyons R.K. (2001), Time-Varying Liquidity in Foreign Exchange // October
2001.
Evans M.D.D., Lyons R.K. (2004), Do Currency Markets Absorb News Quickly? // Cass
Business School Research Paper, June 2004, available at SSRN:
http://ssrn.com/abstract=942805.
Evans M.D.D., Lyons R.K. (2005), Meese-Rogoff Redux: Micro-Based Exchange Rate
Forecasting // January 2005.
Fama E. (1970), Efficient Capital Markets: A Review of Theory and Empirical Work // Journal
of Finance 25, pp. 383-417.
Frenkel M., Pierdzioch Ch., Stadtmann G (2002), The Accuracy of Press Reports Regarding the
Foreign Interventions of the Bank of Japan // March 2002.
Glosten L., Harris L. (1988), Estimating the Components of the Bid/Ask Spread // Journal of
Financial Economics 21 (1988), pp. 123-142.
Lyden S. (2007), Time of Day and Market Impact // The Journal of Trading, Summer 2007.
Lyons R.K. (2002), The Future of the Foreign Exchange Market // 5th Annual Brookings-
Wharton Papers on Financial Services Conference, January 2002.
Mandelbrot, B., Hudson R.L. (2004), The (mis)behavior of markets: a fractal view of risk, ruin,
and reward // New York: Basic Books.
Nguyen T. (2000), Foreign Exchange Market Efficiency, Speculators, Arbitrageurs and
International Capital Flows // Centre for International Economic Studies, Adelaide University,
Policy Discussion Paper No 0033, March 2002.
Pasquariello P. (2002), Informative Trading or Just Noise? An Analysis of Currency Returns,
Market Liquidity, and Transaction Costs in Proximity of Central Bank Interventions // May
2002.

Rachev S.T., Stoyanov S., and Fabozzi F.J. (2007), Advanced Stochastic Models, Risk
Assessment, and Portfolio Optimization: The Ideal Risk, Uncertainty, and Performance
Measures // Wiley, July 2007.
Rachev, S., Martin D., Racheva-Iotova B. and Stoyanov S. (2006), Stable ETL optimal portfolios
and extreme risk management // Decisions in Banking and Finance, Springer/Physika, 2007.
Rachev, S.T. et al. (2006), Risk and Return in Momentum Strategies: Profitability from
Portfolios based on Risk-Adjusted Stock Ranking Criteria // Technical Report, UCSB, 2006.
Sharpe W. F. (1966), Mutual Fund Performance // Journal of Business 39 (S1), pp. 119–138.