Embed Size (px)
Citation preview

Sport, Recreation
and Fitness
EnvironmEntal Scan 2012

contentsIntroduction 3
Service Skills australia 3
objectives 3
Key messages 4
Sector Profiles 5
Sport 5
recreation 5
Fitness 6
industry classifications 6
Latest Industry Intelligence 8
Participation in Sport, Fitness and recreation 8
Factors affecting Participation 8
ageing Population 14
technology Developments: Social media and the national Broadband network 16
Workforce Development Needs 17
Paid Employment 17
Employment outlook 19
Qualifications Profile 20
age Profile 21
retention 22
volunteers 22
Developing career Pathways 22
adequate Support for volunteers 23
Workforce Planning 24
Quality implementation: User Guides and Right Way 24
Discuss, Display, Do: a new model for the recognition of Prior learning 25

Current Impact of Training Packages 27
Fitness 28
outdoor recreation 30
Sport and recreation 32
Sport 34
community recreation 38
Future Directions for Endorsed Components of Training Packages 40
Appendices 42
appendix a – report of continuous improvement of SiS10 Sport and recreation training Package 42
appendix B – occupations in Sport and recreation 45
appendix c – Sport, Fitness, and outdoor and community recreation occupations and Qualifications in Demand 46
appendix D – alignment of the Sport, Fitness, and outdoor and community recreation industries to the anZSic Framework 49
Endnotes 50

Service Skills australia
Service Skills australia (SSa) is the industry Skills council (iSc) for the service industries. Skills councils are the recognised national bodies providing advice on industry training and skills development needs to government and industry.
SSa works with businesses and workers across sectors including retail and wholesale, sport, fitness, community recreation, outdoor recreation, tourism, meetings and events, hospitality, restaurants and catering, caravans, hairdressing, beauty, floristry, community pharmacy and funeral services.
SSa supports skills development for these industries by:
• providing industry intelligence and advice to Skills australia, government and enterprises on workforce development and skills needs;
• actively supporting the development, implementation and continuous improvement of high quality training and workforce development products and services, including training packages. SSa currently manages 10 industry training packages;
• working to develop a culture within the service industries which promotes and enhances the skills development of its workforce;
• providing independent skills and training advice to enterprises, including matching identified training needs with appropriate training solutions; and working with enterprises, employment service providers, training providers and government to allocate training places.
objectives
this Environmental Scan provides an overview of current and emerging trends in the sport, fitness and recreation industries. these trends are highly relevant to workforce development and vocational education and training (vEt).
this scan has been produced with information primarily collected between February and December 2011. the key issues included in this scan have been identified in partnership with industry (employers and unions) and supported with available statistics. SSa obtains its industry intelligence from SSa’s industry advisory committees, state and territory industry training advisory bodies and SSa’s consultation with industry and other key stakeholders.
the trends outlined in the scan provide information on current and future skill demands of industry and individuals and their wider context. consequently, the Environmental Scan informs continuous improvement of SSa’s skills and workforce development strategies, which includes the development of training packages.
introduction
3Sport, recreation and Fitness Environmental Scan 2012

4 Environmental Scan 2012 Sport, recreation and Fitness
Key messages
the sport and recreation industries have experienced a renewed level of interest from policy makers in recognition of the significant contribution these industries make to society and the economy.
in 2011 the commonwealth Government began the implementation of its strategy for sport and recreation— Australian Sport: the Pathway to Success. this strategy brings unprecedented levels of funding to sports. Furthermore, its development led to the National Sport and Active Recreation Policy Framework, which aims to bring cooperation across all levels of government, developing clear targets for a range of objectives including community participation, international success and sustainability of the australian sport system.
Furthermore, the council of australian Government’s (coaG) national Partnership agreement on Preventive Health (nPaPH) is also at the implementation stage; physical activity, and a role for exercise professionals, is a key part of the strategy. Subsequently, these policy initiatives see a growing role for this sector.
the work of volunteers is also receiving greater recognition as a result of the initiatives around the 10th anniversary of the international Year of volunteers.
Introduction continued

5Sport, recreation and Fitness Environmental Scan 2012
Sport
Sport is defined as activities that involve physical exertion and involve organised competition based on formal rules or patterns of behaviour.
Employment in sport is organised at a variety of levels and most organisations within sport operate on a not-for-profit basis. Sport administrative organisations undertake the administration and determination of the policies, rules and regulations governing the conduct of an individual sporting discipline. these associations and organisations exist at the national, state and regional/district level.
Beyond the administrative level, the actual undertaking of organised sport occurs in clubs. individual sports clubs are involved in the performance of sport at the level of general participation up to elite level.
Sports administration organisations are generally not-for-profit organisations that are listed as public companies limited by guarantee under the corporations act (2001). Sporting clubs are generally incorporated as associations under a state associations incorporation act. this implies that the club or sporting organisation is a legal entity separated from its members, requiring governance structures, such as a committee or board.
However, sport and recreation is also supported by the work involved in maintaining the indoor and outdoor venues and facilities. in addition, participation in sport is facilitated at all levels by the coaching and officiating of sports.
as a significant public service, a considerable amount of the administrative component of sports is also delivered through state government departments. Finally, the australian Sports commission is the central administrative and advocacy body at the national level.
recreation
recreation is defined as activities that require physical exertion, but are predominantly engaged in for the purpose of enjoyment. However, it should be noted that the australian Bureau of Statistics (aBS) does not differentiate between sport and recreation.
SSa also makes the distinction between community and outdoor recreation. outdoor recreation involves physical activity that is undertaken in the outdoors, and as such, has unique requirements. this includes activities such as kayaking, bushwalking, skiing and mountain bike riding. as a result, this has links with what could be termed ‘adventure’ activities.
conversely, community recreation refers to the administrative and operational roles involved in recreation at the community level. this covers the activities in community-managed recreation facilities or clubs, often run by not-for-profit organisations, such as the Ymca, or by local councils. a significant proportion of the activity in this sector occurs in aquatics and for this reason, the recently revised training package distinguishes this area.
as a community activity, recreation also receives a great deal of support from local and state government departments.
Sector Profiles

6 Environmental Scan 2012 Sport, recreation and Fitness
Fitness
the fitness industry is responsible for the provision of fitness and exercise services in a broad range of settings including health clubs, fitness centres, fitness studios, outdoor and community facilities. Fitness also encompasses the provision of personal training in a variety of settings. a key feature of the recent diversification of services has been the tailoring of products and services to a broader mainstream market.
it is estimated that the industry caters to 2.5 million participants and that annual growth of the sector will be at 3.6 percent per annum over the next five years. a recognized differentiator between the fitness sector and the sport and recreation sectors is that the former contains a greater proportion of commercial enterprises.
industry classifications
the sport, recreation and fitness industries are unique in the way they are captured across a variety of industry classifications. the australian and new Zealand Standard industrial classification (anZSic) system categorises the activities in this area across three broad divisions. Sport and physical recreation instruction and coaching are captured under ‘education and training’. However, the operation of fitness centres, and similar facilities, sporting and recreation clubs, sports professional teams, sporting grounds and venues and sport associations are captured under ‘arts and recreation services’. the provision of personal fitness training services is captured under ‘personal and other services’1. a breakdown of the anZSic framework for the sport, fitness and recreation industries is detailed in appendix D.
Other Services
Arts and Recreation
Services
Education and Training
Health Care and Social Assistance
Share of Employment (%)
0 5 10 15 20 25 30 35 40 45
42.8
40.1
13.8
3
Sector Profiles continued
Figure 1. main Employing industries of Exercise Professionals (2010)
Source: Job Outlook, ABS Labour Force Survey, annual average 2010

7Sport, recreation and Fitness Environmental Scan 2012
Some occupations are employed across a number of these industries. For example, exercise professionals are found predominantly across ‘other services’ and ‘arts and recreation services’ and ‘education and training’, and sports coaches and officials are also found predominantly across ‘education and training’ and ‘arts and recreation services’. this is detailed below in Figures 1 and 2.
Figure 2. main Employing industries of Sports coaches, instructors and officials (2010)
Source: Job Outlook, ABS Labour Force Survey, annual average 2010
Educationand Training
Arts and Recreation
Services
Other Services
Public Administration
and Safety
0 5 10 15 20 25 30 35 40 45
Share of Employment (%)
49
44.2
2.2
1.9

8 Environmental Scan 2012 Sport, recreation and Fitness
Participation in Sport, Fitness and recreation
the participation levels in sport, fitness and recreation are obviously a significant driver of the demand for employment in these industries. However, the sport, recreation and fitness sectors also compete with each other for a share of both available ‘leisure time’ and disposable income. in addition, these sectors compete with non-organised physical activity.
in 2009–10, 63.6 percent of persons aged 15 and over reported that they had participated in sport and physical recreation at least once in the prior year. this represented a decline on 2005–06, where 65.9 percent of the population reported participation2. of this group, 51 percent are frequent participators who participate, on average, at least twice a week.
the highest rates of participation by australians aged over 15 are in physical activities without any form of formal organisation. However, high levels are also seen in some organised sports.
Figure 3. Participation in Sport and Physical recreation in Selected activities (2009–2010)
Physical Activity Number of Participants (‘000s) Participation Rate
Walking for Exercise 4004.9 22.9%
aerobics/Fitness/Gym 2448.9 14.0%
cycling/BmXing 1292.9 6.5%
Jogging/running 1135.9 6.5%
Golf 786.3 4.5%
tennis 702.4 4.0%
netball 445.8 2.6%
Bush Walking 412.3 2.4%
outdoor Soccer 401.0 2.3%
Source: ABS Survey of Participation in Sport and Physical Recreation 2009–10
latest industry intelligence
Factors affecting Participation
Consumption and Leisure Time Trends
australian households are increasingly spending a greater proportion of their income on recreation. in the 12 months to June 2010, the average weekly household consumption on recreation increased by 41 percent, or $47, since 2003–043. this is largely a by-product of increasing household income and subsequent higher levels of disposable income. over this period, the mean gross household income per week increased by 50 percent4.
Since 2003–04, expenditure on recreational and educational services has increased by 50 percent5. this includes sport and fitness fees and charges, charges for physical recreation and recreation courses and lessons. it also includes other recreational expenditure such as cultural expenditure and internet and pay tv fees.
the main driver of this growth has been in expenditure on pay tv and internet services, however sport and recreation is also significant part of this category. in 2009–10, average weekly household expenditure relating to sport and recreation totalled $10.74 out of the $43.52 spent,

9Sport, recreation and Fitness Environmental Scan 2012
averaged across all recreational and educational services6. this represents an increase on $7.02 per week spent on average in 2003–047. therefore, sport and physical activity expenditure currently accounts for approximately a quarter of the category and is increasing. However, this also draws attention to the fact that competing forms of recreation are increasingly important in this segment.
this competition is also evident when analysing changes spent on leisure activities. average daily time spent in sport and outdoor activities in 2006 was 21 minutes, which was a decrease of 6 minutes compared to 19978. conversely, the average time spent daily on audio/visual media activities for leisure increased by 8 minutes per day to 2 hours and 10 minutes9.
Consumer Preferences for Sport, Recreational and Fitness Activities
Physical activity is increasingly moving away from sports and recreation and towards fitness activities. Participation in aerobics, fitness or gym activities, increased from 12.6 percent of the population to 14 percent in 2009–10. this increase means that the participation levels enjoyed by aerobics, fitness or gym activities are only exceeded by walking for exercise. However, this also coincided with decreases in participation rates in many sports over the same period. these changes in participation are detailed below in Figure 4. Participation rates have remained stable for the remaining sports and recreation activities, with some experiencing modest changes that are not statistically significant.
Figure 4. changes in Participation by Sport and recreation type (2005–06 to 2009–10)
Physical ActivityParticipation Rate (%)
Change2005–06 2009–2010
Physical activities experiencing increasing participation rates
aerobics/Fitness/Gym 12.6 14.0 + 1.4
Jogging/running 4.3 6.5 + 1.2
Weight training 1.1 1.6 + 0.5
Badminton 0.4 0.8 + 0.4
Kayaking/canoeing 0.4 0.6 + 0.2
Physical activities experiencing decreasing participation rates
Walking for Exercise 24.7 22.9 - 1.8
Swimming /Diving 9.0 7.4 - 1.6
Golf 5.5 4.5 - 1.0
tennis 4.8 4.0 - 0.8
Bushwalking 3.2 2.4 - 0.8
outdoor cricket 2.1 1.5 - 0.6
volleyball 0.9 0.4 - 0.5
australian rules Football 1.7 1.4 - 0.3
Source: ABS Survey of Participation in Sport and Physical Recreation 2009–10

10 Environmental Scan 2012 Sport, recreation and Fitness
However, it is participation in organised sport that is most relevant for understanding skill and labour requirements. organised sport and recreation is defined as activities arranged through recreation or sporting clubs and associations or non-sport or recreation clubs, associations or organisations. in 2010, it was estimated that 26 percent of all persons aged 15 and over in australia were involved in organised sport and recreation. this compares with 52.2 percent involved in non-organised sport and recreation. However, this includes 14.8 percent that participate in both organised and non-organised sport and recreation.
these levels of participation equate to an equal decrease in participation in both organised and non-organised physical activities. organised activity participation rates fell from 27.5 percent of the population aged 15 and over in 2005–06 to 26 percent in 2009–10. Participation rates in non-organised activities fell from 53.7 percent to 52.2 percent over the same period. However, industry feedback has suggested that competition with non-organised forms of physical activity is increasing. in particular, it has been noted that initiatives to encourage cycling have been a key factor. victoria, new South Wales, the australian capital territory, Western australia and South australia now all have bicycle strategies, with many capital cities implementing dedicated bike lanes. melbourne also recently adopted a bike share program.
an additional factor that industry reports as an important determinant of decreasing participation in organised activity is the advent of social networking sites and smart phone applications. this is because smart phone applications, which offer personalised fitness programs, are substituting for organised forms of sport and recreation.
Sporting Event Attendance
there is a general belief within the industry that spectator participation and physical participation in sport are not strongly connected. in particular, sporting organisations believe that major events produce small increases; however this does not deliver a sustained increase in participation.
changes in sporting event attendance have been recorded for a select few sports over 2005–06 to 2009–10. outdoor cricket and rugby union experienced decreases in attendance over this period, yet increases have been seen in soccer attendance10. While this is not entirely inconsistent with changes in sport participation, the correlation is not strong. outdoor cricket has experienced a decrease in both participation and attendance, yet outdoor soccer has experienced an increase in attendance without an increase in participation.
However, the participation and attendance surveys conducted by the aBS did indicate that people who participated in sport and physical recreation were more likely to attend sporting events than non-participants. Fifty-two percent of people who participated in sport and physical recreation had attended at least one sporting event as a spectator in 2009–10, compared with 28 percent of non-participants.
Latest industry intelligence continued

11Sport, recreation and Fitness Environmental Scan 2012
State and Territory Participation Trends
as may be seen in Figure 5 below, the highest participation rate is in the australian capital territory at 77.1 percent. However, the lowest participation rate is in South australia at 61.7 percent.
Figure 5. Participation rate by State and territory (2009–10)
Source: ABS Survey of Participation in Sport and Physical Recreation 2009–10
the change in the participation rate across the states and territories between 2005–06 and 2009–10 has been variable. Western australia, Queensland and South australia all recorded statistically significant decreases in their participation rates. However, the northern territory witnessed a significantly large increase in the participation rate for physical activity. While tasmania, the australian capital territory, victoria and new South Wales recorded a decrease, the aBS reported that this was not a statistically significant change.
NSW
QLD
VIC
SA
WA
TAS
NT
ACT
AUS
0 10 20 30 40 50 60 70 80 90
Participation Rate (%)
2005-06
2009-10
64.1
62.7
67.1
62.1
64.8
64.6
65.8
61.7
70.5
65.4
65.2
64.4
58.3
71.2
79.5
77.1
65.9
63.6

12 Environmental Scan 2012 Sport, recreation and Fitness
Latest industry intelligence continued
School Programs and Children’s Participation in Physical Activity
the participation of children in sport and recreation is a significant determinant of the likelihood of further participation into adulthood. Exposure to sport and recreation within education is a key determinant of the sports likely to be taken up by children.
However, the current proportion of children engaging in sport outside of school hours is decreasing. During the 12 months to april 2009, 1 million children aged 5 to 14 did not participate in any organised sport outside of school hours. in addition to this, there are many reports that the quality and quantity of sport and physical education in schools has deteriorated over recent decades. most notably, this was highlighted in the 2009 crawford report11.
the decline in children’s participation in sport and the simultaneous increase in the number of australian children that are overweight or obese is attracting the attention of policy makers. in 2007–08, 25 percent of australian children were overweight or obese, while in 1995, this figure was 21 percent12.
as a result there is a renewed push from the Government to increase rates of children’s participation in physical activity in order to improve health outcomes. coaG’s national Partnership agreement on Preventative Health places a significant emphasis on the role increased physical activity plays in achieving improved health among children. a component of the Government’s response to the crawford report included a national Sport and Education Strategy which seeks to increase the prominence of sport and recreation education in the curriculum and to improve the skills of teachers delivering physical education in schools. Part of this strategy also includes additional funding being made available to develop or repair sport and recreation facilities in schools. as a result, these efforts should see greater participation from the younger cohort as these programs are advanced.
The Health Agenda
However, the health agenda extends across all age groups. in 2007–08, 61.4 percent of the australian population was recorded as either overweight or obese13. as a result, the coaG national Partnership agreement on Preventive Health also specifically focuses on strategies to improve physical activity and other healthy lifestyle factors in communities and workplaces.
this involves grants being made directly to communities to subsidise participation in physical activity or to run healthy lifestyle programs. an example of this is the ‘lift for life’ program which is run by Fitness australia in conjunction with the Baker iDi Heart and Diabetes institute. the lift for life program is a resistance training program designed to assist those at risk of type 2 diabetes and other chronic diseases. the program is to be provided through licensed health and fitness businesses and other community organisations, such as fitness centres, personal training studios and physiotherapy clinics. Significantly, the program will be run by personal trainers holding certificate iv and Exercise Physiologists, as well as Physiotherapists who undertake further training in the specific program.
the importance of these developments includes the recognition of the role fitness professionals can play in preventative health and the way in which fitness services can better connect with allied health services. the development of a pre-exercise screening tool by Exercise and Sport Science australia, Fitness australia and Sports medicine australia, which includes a section to determine suitability for an exercise prescription, is further evidence of this shift. this is also likely to lead to the future development of GP referrals for exercise. as a result, the demand for higher level trained fitness professionals is likely to increase.

13Sport, recreation and Fitness Environmental Scan 2012
Availability of Facilities and Venues
as mentioned above, the availability and state of facilities or venues at schools has been noted as a barrier to participation in sport and recreation. However, this has also been cited more generally by stakeholders.
in the capital cities, population density is increasing and land available for development is becoming a scarce resource. Provisions are generally made for open spaces in ‘greenfield’ sites (undeveloped land). However, within densely populated urban centres, there is little scope to increase the availability of open spaces that can be used for sport and recreation. Furthermore, some of the open spaces created in greenfield sites are not necessarily designed for undertaking sport and recreation.
as a result, there is an emerging emphasis on maximising the use of the available spaces we have. this includes a new trend in scoping the potential of ‘shared use’ agreements between schools that have sporting facilities and sporting fields, where maintenance costs are shared between local councils and schools. While this is still in the early stages of use, there is potential for these facilities to be more fully utilised.
another potential way to further increase usage of available sporting fields involves innovations to increase ‘usability’. this includes developments in synthetic turf which is less affected by weather. it is reported that the prolonged drought over the past decade has affected many fields, reducing available playing spaces. Subsequently, planning and design to allow for multi-purpose use is a new key consideration. this includes the sizing of fields and courts and the appropriate boundary markings to ensure that they can accommodate a variety of sport and recreation types.
a recent factor in relation to venue availability has been the increased regulation of public spaces utilised for fitness training. an increasing number of local councils have imposed, or are considering, bans or caps on the use of public spaces for group fitness. this has been driven by complaints of noise and of the monopolisation of the space and equipment available for other park users. Some local councils also believe that fees should be collected by users of community space for commercial businesses. as a result, new legislation is likely to reduce the supply of micro-business personal trainers who rely on public spaces and low overhead costs.
Furthermore, the aquatics industry has noted that council owned olympic-sized swimming pools in need of repair are increasingly being converted to 25m pools. industry believes that as this trend continues, it will have an effect on participation in water sports such as water polo and diving.
However, construction works for recreation purposes has been increasing. the total value of work done on recreation projects (excluding landscaping) in 2009–10 was $1,342.9 million, representing an increase from 2005–06, in which $662 million of works were completed14.
a key trend contributing to the increased availability of gym facilities in regional areas has been the introduction of the ‘24 hour fitness’ model. this significantly lower cost structure has meant that it is now economically viable to set up gyms in regional areas where ‘full service’ gyms had not been. For example, anytime Fitness, a key franchiser of the 24 hour fitness model, has 60 percent of its recently opened facilities in regional areas15. this model is characterised by lower staff ratios, relying on swipe card access and cctv supervision to monitor the premises, and basic gym equipment provision. While some contend that this reduces the demand for fitness professionals, others see that it

14 Environmental Scan 2012 Sport, recreation and Fitness
Latest industry intelligence continued
is broadening the take up of fitness regimes in new areas, which may lead to increased demand for fitness services in the long run.
Customer Service
a counter-model to the ‘basic’ gyms exemplified by anytime and Jetts Fitness is the heightened focus on customer service in full-service gyms. industry noted that the introduction of virgin into the fitness arena was significant for its novel approach to customer service. in particular, the recruitment practices, which were transposed from its practices in the airline sector, have gained the attention of the industry. virgin active approached recruitment of its staff with customer service as the key criterion and subsequently focussed on the personality and attitude of candidates. this practice is contrary to standard industry practice of recruiting based on qualifications and experience. However, industry feedback has indicated that the provision of customer service is increasingly important in order to successfully compete in a highly competitive market and in order to have a point of difference from low cost models.
ageing Population
Population ageing is occurring globally, with a substantial demographic shift towards older ages. the median age of australia’s population (36.8 years at June 2010) is projected to increase to between 38.7–40.7 years in 2026 and to between 41.9–45.2 years in 205616. Furthermore, over the last two decades, the median age has increased by 4.8 years, from 32.1 years at 30 June 199017.
tasmania is forecast to have the fastest ageing population in australia, which will result in australia’s highest median age of 45.7 in 2056, compared to an australia-wide median age of 42.418. this trend is mainly based on the fact that tasmania traditionally experiences a loss to interstate
migration in younger age groups and a gain in older age groups19. By 2056, South australia is forecast to have the second highest median age in australia (43.9 years)20.
the population of the northern territory is the youngest of any australian state or territory, and will continue to be so in the future. in mid-2007, the northern territory had australia’s lowest median age at 31.1, followed by the australian capital territory with 34.5. By 2056, the median age in the northern territory will have only increased to 34.5, while the australia-wide median age is forecast to be 42.4. Hence, the effect of its ageing population, while still noticeable, may not be felt as much in the northern territory and the australian capital territory as in other australian states.
the ageing population is a factor relevant to future trends in participation in physical activities. the greatest proportion of physical activity participation occurs in the 15–17 year old age group at 79.1 percent and declines steadily across the age groups to 48.2 percent among those aged 65 and over. as the result of an ageing population there is the potential that the demand for organised sport and recreation could decrease.
Population ageing is one of the significant reasons for the renewed focus on stimulating ‘grass roots’ participation. as a result of this, sports development officers are in greater demand. consultation undertaken by the australian Sports commission for the national community coaching Strategy indicated industry support for improvement in the standards of community coaches in order to generate increased participation in sport.
in addition to actively encouraging participation, the adaptation of sport formats to older age groups is another necessity required in order to maintain participation levels in this growing market. currently, participation among older age groups is predominantly found in lower impact forms of

15Sport, recreation and Fitness Environmental Scan 2012
activity. the greatest participation rates for those aged 65 and over are in walking (26.7 percent), golf (6.2 percent), aerobics/fitness (7 percent), lawn bowls (4.7 percent) and swimming (3.5 percent).
industry reports that some sections within the fitness industry are increasingly looking to cater to this industry by developing seniors fitness programs. additionally, Fitness australia’s industry profile report indicated that 39 percent of fitness organisations ran age-specific classes21. a long-standing example of adapting to the needs of seniors is the development of aquarobics classes. However, it is expected that a more diverse offering is required. Since 1993, participation in the 65 and over group has already increased mildly from 16.522 to 17.7 percent23.
Figure 6. Participation rate by age in organised Sport and Physical activity in australia (1993—2010)
Age Group (Years)
1993 1997 2001 2004 2007 2010
15–24 49.2% 50.5% 40.9% 38.8% 39.3% 39.0%
25–34 39.0% 36.9% 29.7% 30.4% 29.2% 25.5%
35–44 35.1% 33.4% 28.5% 29.0% 29.6% 29.3%
45–54 25.7% 26.0% 23.1% 24.4% 26.3% 23.9%
55–64 20.2% 22.0% 18.7% 19.4% 19.7% 18.5%
65 and over 16.5% 17.8% 16.8% 18.3% 17.7% 17.7%
Total 31.0% 31.0% 27.1% 27.2% 27.3% 26.0%
Source: ABS Cat. No.6285.0, Involvement in Organised Sport and Physical Activity, April 2010
in order to engage the growing senior population in sport and recreation services it is important for offerings to adapt to the needs of the group, similar to the rationale for adapted game developments made for young age groups. in order for this to occur, it is increasingly important that sport, recreation and exercise professionals have an understanding of the unique needs of the senior population as pertaining to engagement with physical activity.
Finally, the ageing australian population, coupled with the low birth rate, has had an impact on the talent pool for elite sport. as a result, this is driving higher skill requirements for coaches charged with developing high performers. consequently, skills such as performance analysis and skill acquisition are gaining importance. Skill acquisition involves conducting research to design training programs that give athletes a competitive edge, while performance analysis focuses on coaches’ use of information and communications technology to develop athlete performance in training and competition environments.
16 Environmental Scan 2012 Sport, recreation and Fitness
Latest industry intelligence continued
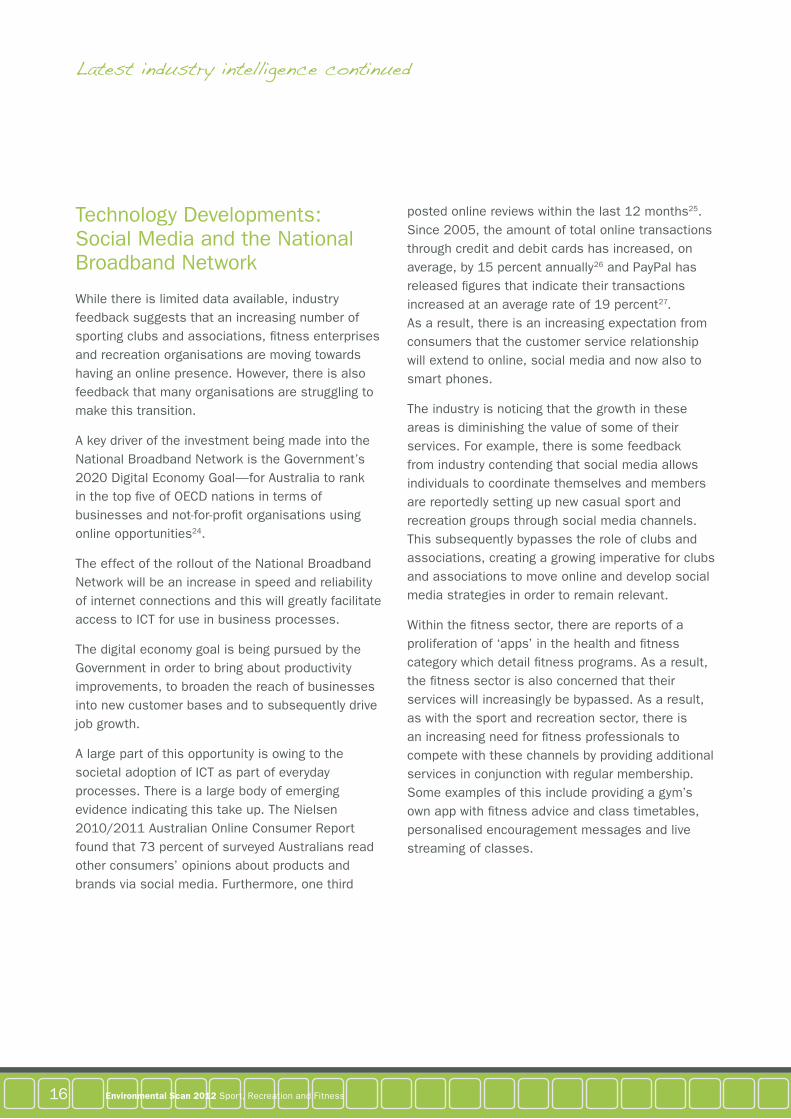
technology Developments: Social media and the national Broadband network
While there is limited data available, industry feedback suggests that an increasing number of sporting clubs and associations, fitness enterprises and recreation organisations are moving towards having an online presence. However, there is also feedback that many organisations are struggling to make this transition.
a key driver of the investment being made into the national Broadband network is the Government’s 2020 Digital Economy Goal—for australia to rank in the top five of oEcD nations in terms of businesses and not-for-profit organisations using online opportunities24.
the effect of the rollout of the national Broadband network will be an increase in speed and reliability of internet connections and this will greatly facilitate access to ict for use in business processes.
the digital economy goal is being pursued by the Government in order to bring about productivity improvements, to broaden the reach of businesses into new customer bases and to subsequently drive job growth.
a large part of this opportunity is owing to the societal adoption of ict as part of everyday processes. there is a large body of emerging evidence indicating this take up. the nielsen 2010/2011 australian online consumer report found that 73 percent of surveyed australians read other consumers’ opinions about products and brands via social media. Furthermore, one third
posted online reviews within the last 12 months25. Since 2005, the amount of total online transactions through credit and debit cards has increased, on average, by 15 percent annually26 and PayPal has released figures that indicate their transactions increased at an average rate of 19 percent27. as a result, there is an increasing expectation from consumers that the customer service relationship will extend to online, social media and now also to smart phones.
the industry is noticing that the growth in these areas is diminishing the value of some of their services. For example, there is some feedback from industry contending that social media allows individuals to coordinate themselves and members are reportedly setting up new casual sport and recreation groups through social media channels. this subsequently bypasses the role of clubs and associations, creating a growing imperative for clubs and associations to move online and develop social media strategies in order to remain relevant.
Within the fitness sector, there are reports of a proliferation of ‘apps’ in the health and fitness category which detail fitness programs. as a result, the fitness sector is also concerned that their services will increasingly be bypassed. as a result, as with the sport and recreation sector, there is an increasing need for fitness professionals to compete with these channels by providing additional services in conjunction with regular membership. Some examples of this include providing a gym’s own app with fitness advice and class timetables, personalised encouragement messages and live streaming of classes.

17Sport, recreation and Fitness Environmental Scan 2012
Paid Employment
Paid employment in the sport, recreation and fitness sectors is dominated by the occupation categories of sport coaches, officials and instructors and exercise professionals28.
as detailed in appendix D, the employment within the ‘sports and physical recreation activities’ classification includes:
• Health and Fitness centres and Gymnasia operation
• Sports and Physical recreation clubs and Sports Professionals
• Sports and Physical recreation venues, Grounds and Facilities
• Sports and Physical recreation administrative Service
this includes some of the employment of sports coaches, instructors and officials and some exercise professionals; however, further employment is also recorded in other industries and this excludes the employment of personal trainers. most notably, the unpaid employment of volunteers is not recorded in these figures; however, estimates are given further below.
Figure 7 below indicates that employment in this sector has been steadily increasing. However, there has been a greater level of volatility in levels of employment in recent years.
Figure 7. Employment levels in Sport and Physical recreation (1993–2011)
Source: SkillsInfo, ABS Labour Force Survey, Cat. No. 6291.0.55.003
Workforce Development needs
0 10,000 20,000 30,000 40,000 50,000 60,000 70,000 80,000 90,000 100,000
1993
1994
1995
1996
1997
1998
1999
2000
2001
2002
2003
2004
2005
2006
2007
2008
2009
2010
2011
Employment Level
25,600
31,700
37,200
36,200
36,800
39,400
43,400
50,100
43,600
51,900
53,600
61,200
60,800
70,700
76,800
73,700
84,500
76,500
87,800
18 Environmental Scan 2012 Sport, recreation and Fitness
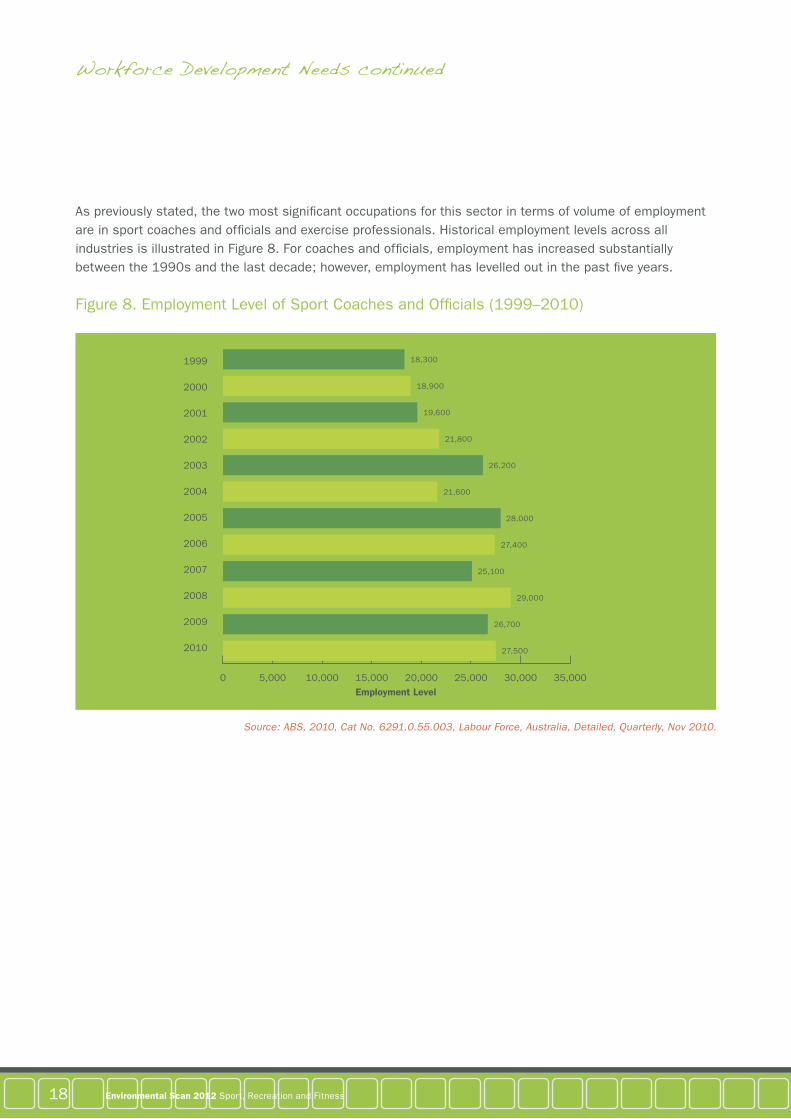
as previously stated, the two most significant occupations for this sector in terms of volume of employment are in sport coaches and officials and exercise professionals. Historical employment levels across all industries is illustrated in Figure 8. For coaches and officials, employment has increased substantially between the 1990s and the last decade; however, employment has levelled out in the past five years.
Figure 8. Employment level of Sport coaches and officials (1999–2010)
Source: ABS, 2010, Cat No. 6291.0.55.003, Labour Force, Australia, Detailed, Quarterly, Nov 2010.
0 5,000 10,000 15,000 20,000 25,000 30,000 35,000Employment Level
1999
2000
2001
2002
2003
2004
2005
2006
2007
2008
2009
2010
18,300
18,900
19,600
21,800
26,200
21,600
28,000
27,400
25,100
29,000
26,700
27,500
Workforce Development Needs continued
19Sport, recreation and Fitness Environmental Scan 2012
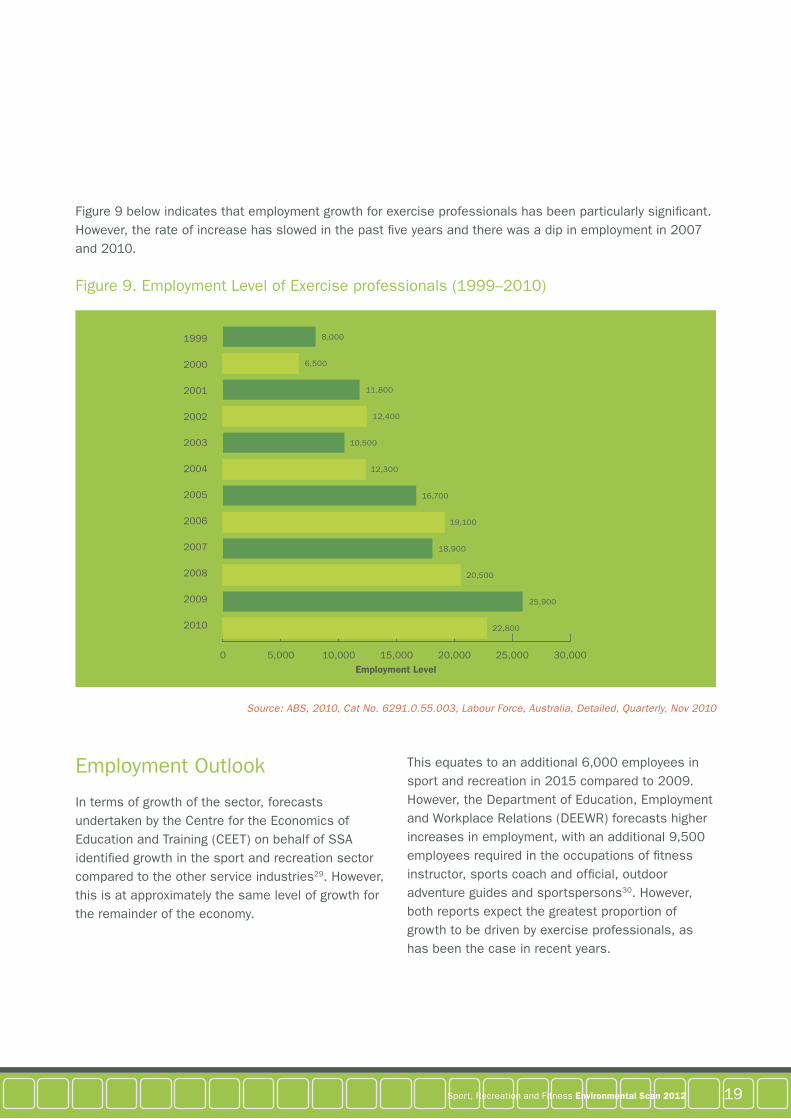
Figure 9 below indicates that employment growth for exercise professionals has been particularly significant. However, the rate of increase has slowed in the past five years and there was a dip in employment in 2007 and 2010.
Figure 9. Employment level of Exercise professionals (1999–2010)
Source: ABS, 2010, Cat No. 6291.0.55.003, Labour Force, Australia, Detailed, Quarterly, Nov 2010
0 5,000 10,000 15,000 20,000 25,000 30,000Employment Level
1999
2000
2001
2002
2003
2004
2005
2006
2007
2008
2009
2010
8,000
6,500
11,800
12,400
10,500
12,300
16,700
19,100
18,900
20,500
25,900
22,800
Employment outlook
in terms of growth of the sector, forecasts undertaken by the centre for the Economics of Education and training (cEEt) on behalf of SSa identified growth in the sport and recreation sector compared to the other service industries29. However, this is at approximately the same level of growth for the remainder of the economy.
this equates to an additional 6,000 employees in sport and recreation in 2015 compared to 2009. However, the Department of Education, Employment and Workplace relations (DEEWr) forecasts higher increases in employment, with an additional 9,500 employees required in the occupations of fitness instructor, sports coach and official, outdoor adventure guides and sportspersons30. However, both reports expect the greatest proportion of growth to be driven by exercise professionals, as has been the case in recent years.

20 Environmental Scan 2012 Sport, recreation and Fitness
Qualifications Profile
Figure 10. Highest Educational attainment of Workers in the Sports and Physical recreation Workforce (2010)
Source: ABS Survey of Education and Work, May 2010 Cat. No. 6227.0.
the current profile of educational attainment in the sport, recreation and fitness industries indicates that there is a relatively high proportion of individuals that hold a Bachelor degree or higher, compared to the other industries covered by SSa’s training packages. However, there is still a substantial amount of employees without a non-school qualification.
However, the cEEt report forecasts this profile to move towards higher level qualifications. in 2015, there will be 11,000 more people with qualifications and 5,000 less without qualifications in the sector, compared with 2009 levels. Part of this is from the increase in employment in roles that require qualifications, but the remainder will come from skills deepening and/or upgrading.
as a result, the proportion of workers with qualifications will increase from 59 percent in 2008 to 72 percent in 2015. this increase is forecast to be predominantly driven by the increase in the number of exercise professionals and the higher level skills that are being demanded from this occupation.
However, the estimates of qualification requirements presented should be interpreted as the lower bound of requirements. this is predominantly because it excludes volunteers and people who have a second job in the service industries.
Workforce Development Needs continued
0 10 20 30 40 50 60 70Share of Employment (%)
With a Non-School Qualification
Post Graduate Qualification
Bachelor Degree
Diploma/Advanced Diploma
Certificate III/IV
Certificate I/II
Certificate or Level Not Defined
Without a Non-School Qualification
Year 12
Year 10 or 11
Below Year 10
57.2
3.9
16.9
9.2
20.3
2.5
3.3
42.8
26.4
12
4.4

21Sport, recreation and Fitness Environmental Scan 2012
age Profile
For employment within ‘sport and physical recreation activities’, Figure 11 indicates that employment is predominantly from younger age groups. in fact, 40.3 percent of industry employment is from the 15–24 years age group, compared to 16.9 percent across all industries31.
Figure 11. Percentage Share of Sport and Physical recreation Employment by age (2010)
Source: Job Outlook, DEEWR Special Order based on ABS Labour Force, Australia, Cat no: 6291.0.55.003 – Calendar Year Average)
this is even more pronounced for sport coaches and officials, in which 50 percent of employees are aged 24 and under. among exercise professionals, the age profile is disproportionately skewed towards younger workers. However, due to the greater higher education requirements, there is very little employment of those aged 15–19.
as previously noted, population ageing is set to increase in the coming decades. a significant effect of the ageing population is the intensification of competition for workers as the working age population diminishes. the working age population is projected to decline from 67 percent in 2004 to between 57–59 percent in 205132.
15-19
20-24
25-34
35-44
45-54
55-64
65 and over
0 5 10 15 20 25 30
Participation Rate (%)
Sport and Physical Recreation Occupations
All Occupations
15.7
6.2
24.6
10.7
20.6
22.2
19.2
22.4
12
21.9
5.8
13.7
2
2.8

22 Environmental Scan 2012 Sport, recreation and Fitness
the reliance on a younger workforce will have an acute effect on the sport, fitness and recreation sectors. as a result, it is particularly important for employers to increase their adoption of employment practices that attract older workers.
For example, it has been noted that the seasonality associated with the outdoor recreation sector of the industry lends itself to utilising a casual workforce to manage the variable demand. However, this is a practice that is not suitable for older workers who tend to require greater stability.
retention
the sport, fitness and recreation sectors also report high levels of staff turnover. DEEWr estimates of the replacement rate in the industries reflect low levels of retention. it is estimated that 24 percent of exercise professionals in the workforce require replacement33. the estimate is also given for coaches, instructors and officials34. this compares to 13.1 percent across all occupations. However, this does not capture mobility between employers, which may add to the recruitment requirements.
industry feedback cites a variety of systemic issues as the cause of this. most commonly, the lack of industry accepted career pathways, a high reliance on a casual workforce and the perception of the industry as lacking in prestige, are seen as the core determinants of retention issues.
volunteers
While the above figures outline the paid workforce, the sport, and recreation workforce cannot be understood in its entirety without considering the volunteer workforce. We can estimate that potentially over 80 percent of the sport and recreation workforce is unpaid. the aBS estimated that of the 4.5 million people involved in organised
sport and physical activity in the 12 months prior to april 2010, only 18.6 percent received some type of payment for their involvement in non-playing roles35.
in 2010, there were a total of 2.27 million sport and recreation volunteers36. this represented 37.3 percent of all volunteers, which was the highest share of any sector. these figures are also likely to be underestimated given that many people do not self-identify as a volunteer. in sport, this could include senior players who assist in skill development, or parents who informally assist with junior sport.
according to the aBS, 72.1 percent of volunteer-utilising sport and physical recreation organisations are fully staffed by volunteers37. in addition, governance positions in most sporting and recreational clubs and associations are usually filled by volunteers. it is estimated that management and committee work accounts for 32 percent of the sector’s volunteering roles, equating to 544,100 management or committee positions filled by volunteers. However, the majority of total sport volunteers (54 percent or 925,900) were involved in coaching, refereeing or judging. Finally, a significant proportion of total sport volunteers were also involved in administrative and clerical roles (37 percent or 637,200)38.
overall, Frontier Economics has estimated that the monetary value of volunteer input to the sector in 2006 was $3.9 billion39.
Developing career Pathways
there is a great deal of industry support to build a consensus for an accepted career pathway that spans a variety of occupations and sectors.
Given its diversity, the industry is interconnected with a range of cross-sector agendas and community goals, such as health and wellbeing, community development and social capital. as a result, there is support to increase the
Workforce Development Needs continued

23Sport, recreation and Fitness Environmental Scan 2012
movement of workers and skills in between the sport, fitness and recreation sectors. this support was also reflected in the merging of the four training packages managed by SSa that covered sport, fitness and recreation.
Within the fitness industry, career pathways are facilitated through industry associations. these bodies provide professional registration for individuals, with each registration category aligned to industry vocational roles.
adequate Support for volunteers
as indicated in the above figures for volunteers, not only is there a high dependence upon volunteers in the sport and recreation sector, but the volunteer sector is also called upon to do much of the crucial roles of coaching and governance.
Despite this, industry reports that training is not often provided to volunteers. often this is because training of volunteers is not publicly-funded. there is a strong case for at least some basic training to be provided to volunteers and funded publicly as the social returns from any such investment is likely to exceed the costs.
there are an estimated 6.08 million people providing voluntary work in australia, of which approximately 71 percent are also in part-time or full-time work40. Within the sport and recreation sector, it is estimated that 82.7 percent of its volunteers are also employed in paid work41.
this highlights the reality that the knowledge and skills held and applied by australians in a voluntary capacity are not limited to being utilised as ‘volunteer skills’. in essence, those who work and volunteer are ‘recycling’ their base of skills and knowledge by applying these attributes in at least two different working roles to the benefit of society and the economy.
SSa’s work indicates that the culture of managing volunteers needs to change significantly and reflect more of the practices and behaviours that are commonplace in the commercial working environment. on some level, organisations that utilise volunteers need to make greater use of contemporary human resources practices.
it is apparent that paid employees and unpaid volunteers have many similarities in their motivations and expectations for their positions—the provisions they require in order to fulfil those positions, and the quality of skills necessary in order to satisfactorily perform the duties of those positions.
in the absence of financial recognition or reward for one’s commitment and performance in a volunteer role, an understanding of the motivations for volunteering is crucial to ensure retention. While the nature and the outcomes of the work performed is generally a significant factor for volunteering, organisations that rely on—and truly value—the contributions of volunteers cannot afford to be complacent. volunteer-utilising organisations (vUos) need to make a concerted effort to retain their unpaid workers and provide a functioning, co-operative and worthwhile experience for all parties involved (i.e. employees, volunteers and the community).
Sport and recreation volunteers are more likely to be employed and have dependent children aged up to 17. approximately 46.8 percent of volunteers in the sport and recreation sector have dependent children aged 0–1742. Furthermore, 82.7 percent of sport and recreation volunteers are also employed in paid work. the median hours spent working for sport and physical recreation organisations were 48 hours per year—higher than for all other types of organisations43. as a result, volunteers are highly likely to be time constrained, making this group particularly at risk of leaving. therefore, work-life balance issues are particularly significant for volunteers.

24 Environmental Scan 2012 Sport, recreation and Fitness
as a result, SSa supports the greater adoption of the practices outlined in volunteering australia’s national Standards for involving volunteers in not-for-Profit organisations as the basis for using volunteers.
Workforce Planning
SSa’s Environmental Scans have previously reported that greater levels of workforce planning are required in the sport, fitness and recreation industries. this need is based on the retention issues that are evident for its paid and unpaid workers. Workforce planning ensures that strategic objectives can be achieved through appropriate skill needs now and into the future.
Past scans have identified low awareness of workforce planning, in addition to undeveloped skills in this area. these issues are largely responsible for the low levels of workforce planning across the sport, fitness and recreation industries.
However, there is an increasing level of recognition of this need within the industry. this is evident in the australian Sports commission’s new role in providing advice on workforce planning in its workforce capability division. Furthermore, the northern territory Department of Sport and recreation has indicated that organisations are increasingly communicating an interest in the courses delivered in this area.
in order to assist in capability building for undertaking workforce planning, the australian Sports commission (aSc) and SSa have partnered with seven national sporting organisations to plan for the development of their paid and unpaid workforce. the outcomes of these pilot programs will be used to determine a suitable approach to consider for all sports.
additionally, Fitness australia has commissioned Deloitte access Economics to undertake a study to develop workforce planning strategies for the fitness industry. the results of this study will be available in early 2012.
Quality implementation: User Guides and Right Way
industry continues to hold concerns about the inconsistent levels of quality in training provision, in which graduates are consequently not ‘job ready’. as a result, industry representatives are keen to become more involved in the implementation of training to support the national training system and build the nation’s productivity.
a range of services and products, underpinned by a set of policies and procedures, have been developed that will underpin the work that the iSc undertakes in implementing its training packages on a sustainable basis. this quality implementation framework consists of two parts:
• training Package User Guides
• the Right Way Program.
the training Package User Guides can include:
• minimum recommended duration and assessment requirements for delivery of units and/or qualifications
• required assessor/trainer qualifications and experiences above and beyond those required by regulation
• professional development requirements for trainers and assessors
• requirements around work placement and/or experience
• guidelines for selecting and recruiting students.
the right Way Program is an industry recognition system for quality training providers delivering in the Service Skills training Package areas.
Workforce Development Needs continued

25Sport, recreation and Fitness Environmental Scan 2012
this program, which forms part of SSa’s strategic work to achieve quality skills outcomes throughout the service industries, focuses on three key areas: quality training and assessment facilities; quality trainers and assessors; and quality learning resources.
consequently, through the right Way program, SSa seeks to facilitate industry recognition of facilities, trainers, assessors and learning resources.
Participants in this industry recognition system must adhere to standards and provide evidence of quality through an application and assessment process operated by SSa and its network of agencies.
Effective outcomes of training and assessment are inextricably linked to the quality of these core components of the vEt system. through this program, SSa aims to:
• Ensure and recognise the provision of quality training and assessment by registered training organisations (rtos)
• Build the capability of trainers and assessors who work in the service industries
• Promote the development of, and recognise, effective learning resources which align to training package content
• achieve quality skills outcomes throughout the service industries44.
Discuss, Display, Do: a new model for the recognition of Prior learning
the recognition of prior learning offers an opportunity to link skill development that occurs in workplaces and organisations with the formal education system. as a result, individuals’ existing skills are recognised and validated, enabling individuals to credibly promote the skills they have obtained through their paid and unpaid roles. With this also comes greater empowerment of individuals, as well as encouragement to consider further investment in skill development.
the sport and recreation sector, with its high use of volunteer staff, enables many individuals to undergo learning experiences in new areas, which are generally unrecognised. as a result, recognition of prior learning could be seen to be of value to volunteer-utilising organisations. However, the education and training of volunteers is often overlooked or ignored, due to the fact that public funds are generally not available.
Feedback to SSa had indicated that employees across all the service industries found the existing rPl processes and procedures too demanding, requiring an unrealistic investment in time and effort.
critical barriers identified were:
• lack of understanding by assessors
• lack of resources for assessors
• inequitable funding mechanisms and australian Qualification Framework requirements
• compliance risks as a result of inconsistencies in audit practices.

26 Environmental Scan 2012 Sport, recreation and Fitness
the SSa project ‘Discuss, Display, Do’ subsequently aimed to develop and pilot an rPl model suitable to the needs of workers and employers in the service industries by being more efficient and effective. Furthermore, it sought to demonstrate the value of recognising skills obtained through volunteering activities.
the project piloted the new rPl model by creating an assessor network within a volunteer utilising organisation, the nSW Federation of Parents & citizens associations. the assessor network was formed by training a combination of 86 volunteers as lead assessors, regional assessors and assessor advocates. the assessor network then assessed an original 100 unemployed volunteers, followed by a further 50 employed volunteers. the project outcomes also reported increased self-esteem, a sense of empowerment and the Federation’s public acknowledgment of volunteers’ contributions.
Workforce Development Needs continued

27Sport, recreation and Fitness Environmental Scan 2012
Enrolments in sport, fitness, and community and outdoor recreation qualifications in 2010 continued to centre at the certificate ii and certificate iii levels.
the high number of enrolments at certificate ii and iii levels reflects the fact that certificates ii and iii are the entry level qualifications for the majority of the workforce. they also reflect participation in vocational Education and training in Schools (vEtiS) activity.
Enrolments are generally increasing, with strong growth seen in fitness, community recreation and coaching qualifications. However, enrolments in sport and recreation qualifications have particularly declined and outdoor recreation enrolments are being constrained by a lack of rtos delivering these courses.
the sport sector is gradually increasing its involvement with vocational education and training; however use of the system remains low. industry feedback suggests that the system is complicated and cumbersome45.
a significant part of the skill development system—outside of the vEt system—for australian Sports is the australian Sports commission’s national coaching accreditation Scheme (ncaS) and national officiating accreditation Scheme (noaS). as at June 2011, a total of 70 national sporting organisations participated in the ncaS46 and over 40 in noaS47.
the australian Sports commission’s online entry level training in coaching and officiating is also highly used in the sport sector. over 100,000 learners undertook the online entry level training in coaching and 20,000 learners undertook the training in officiating from June 2010 to June 2011. this shows strong growth from the previous year, in which the figures were 70,660 for coaching and 13,555 for officiating48. Seven skill sets have currently been identified within the SiS10 training Package to align with the ncaS and noaS.
the australian Sports commission also conducts community coach training programs in order for individuals to provide coaching in after school care activities. in 2010–11, 7,451 individuals attended one of the 1,041 community coach training Programs49. Furthermore, most state and territory departments of sport and recreation offer a large number of short courses to assist in skill development within the sector. there is also feedback that these courses are of variable quality and do not align with accredited training.
it is also possible to undertake sport, fitness, community and outdoor recreation studies at university. However links between the tertiary and vEt system, and possible realistic career pathways, are not yet fully developed.
information publicly available on vEt enrolments and completions is currently limited to publicly-funded training and accredited training delivered to international students as part of immigration requirements. SSa is aware that the existing data only provides part of the picture and is looking forward to the implementation of the national vEt Data Strategy.
Skill sets are also not captured in the data collection, which is particularly significant for the sport and recreation industry. While enrolments are captured, they are not identified as enrolling in a skill set. Furthermore, at the completion of their skill set, they will be counted as a non-completion towards a qualification. currently, there are 88 skill sets identified within the SiS10 training Package, of which many align with industry accreditation schemes.
Please note, enrolment and completion figures have not been finalised for the 2010 year and are being continually updated. these figures are correct as at august 2011.
current impact of training Packages

28 Environmental Scan 2012 Sport, recreation and Fitness
Fitness
Enrolments in fitness qualifications are predominantly at the certificate iii level. However, enrolments are experiencing growth at all levels.
Figure 12. vocational course Enrolments by Fitness Qualification (2007–10)
Source: NCVER
0 1,000 2,000 3,000 4,000 5,000 6,000 7,000 8,000 9,000Enrolments
Certificate III in Fitness
Certificate IV in Fitness
Diploma of Fitness
2007
2008
2009
2010
5,778
6,006
6,876
8,459
2,137
2,189
2,671
4,055
550
570
912
1,188
Current impact of training packages continued

29Sport, recreation and Fitness Environmental Scan 2012
Figure 13. vocational course completions by Fitness Qualification (2007–2010)
Source: NCVER
0 500 1,000 1,500 2,000 2,500Completions
Certificate III in Fitness
Certificate IV in Fitness
Diploma of Fitness
2007
2008
2009
2010
1,724
2,180
2,419
441
904
1,265
1,129
254
75
110
156
0

30 Environmental Scan 2012 Sport, recreation and Fitness
outdoor recreation
the majority of enrolments in outdoor recreation qualifications continue to be at the certificate ii level. this is likely to be due to the significant numbers undertaking pathway training through vEtiS delivery. However, as can be seen in Figure 14 below, enrolments in this qualification level have been decreasing since 2007. this can be partly attributed to the decreasing numbers of rtos delivering courses in outdoor recreation. the revised training package endorsed in 2010, SiS10, no longer contains the certificate ii and iii in outdoor recreation (multiple activities).
Figure 14. vocational course Enrolments by outdoor recreation Qualification (2007–2010)
Source: NCVER
0 500 1,000 1,500 2,000 2,500Enrolments
Certificate II in Outdoor Recreation
Certificate II in Outdoor Recreation (Multiple Activities)
Certificate III in Outdoor Recreation
Certificate III in Outdoor Recreation (Multiple Activities)
Certificate IV in Outdoor Recreation
Diploma of Facility Management
Diploma of Outdoor Recreation
2007
2008
2009
2010
2,1321,930
1,4621,539
116122
201374
568385
8291,679
179241
155145
478453
490884
00511
193199
179288
Current impact of training packages continued

31Sport, recreation and Fitness Environmental Scan 2012
Figure 15. vocational course completions by outdoor recreation Qualification (2007–2010)
Source: NCVER
0 70 140 210 280 350
Completions
Certificate II in Outdoor Recreation
Certificate II in Outdoor Recreation (Multiple Activities)
Certificate III in Outdoor Recreation
Certificate III in Outdoor Recreation (Multiple Activities)
Certificate IV in Outdoor Recreation
Diploma of Facility Management
Diploma of Outdoor Recreation
2007
2008
2009
2010
139286
10311
618
150
87137
7059
746
1028
4599
6841
1563
260

32 Environmental Scan 2012 Sport, recreation and Fitness
Sport and recreation
Students in sport and recreation courses are increasingly enrolling in higher level qualifications. Since 2007, enrolments in certificate i and ii have decreased by 50 and 60 percent respectively; however, enrolments at the certificate iv level have increased by 83 percent. the revised training package endorsed in 2010, SiS10, no longer contains the advanced Diploma of Sport and recreation.
Figure 16. vocational course Enrolments by Sport and recreation Qualification (2007–2010)
Source: NCVER
0 200 400 600 800 1,000 12,00 14,00 16,00 18,00Enrolments
Certificate I inSport and Recreation
Certificate II inSport and Recreation
Certificate III inSport and Recreation
Certificate IV in Sport and Recreation
Diploma ofSport and Recreation
Advanced Diploma of Sport and Recreation
2007
2008
2009
2010
541407430
271
1,2661,035
781503
970962
1,036
951
309294
476567
549493
554480
86568
0
Current impact of training packages continued

33Sport, recreation and Fitness Environmental Scan 2012
Figure 17. course completions by Sport and recreation Qualification (2007–10)
Source: NCVER
0 100 200 300 400 500 600 700 800Completions
Certificate I inSport and Recreation
Certificate II inSport and Recreation
Certificate III inSport and Recreation
Certificate IV in Sport and Recreation
Diploma ofSport and Recreation
Advanced Diploma of Sport and Recreation
2007
2008
2009
2010
2723
740
137202
15295
144186
235687
4165
35239
92163
540
3000

34 Environmental Scan 2012 Sport, recreation and Fitness
Sport
the sport industry’s engagement with the vEt system has historically been low. However, between 2007 and 2010 enrolments have increased, reflecting a growing movement towards the usage of vEt qualifications. However, these large percentage increases have come from a low base. the revised training package endorsed in 2010, SiS10, no longer contains the certificate iv or Diploma of Sport (athlete Support Services) or the certificate i, ii, iii, iv or Diploma of Sport (officiating). the officiating qualifications are now skill sets.
Figure 18. vocational course Enrolments by Sport Qualification (2007–10)
Source: NCVER
0 100 200 300 400 500 600 700 800Enrolments
Certificate II in Sport (Career Oriented Participation)
Certificate II in Sport (Officiating)
Certificate III in Sport (Officiating)
Certificate III in Sport (Career Oriented Participation)
Certificate III in Sport (Athlete Support Services)
Certificate IV in Sport (Athlete Support Services)
Certificate IV in Sport (Development)
Diploma of Sport(Development)
Diploma of Sport(Athlete Support Services)
2007
2008
2009
2010
8675
128155
50205
155137
010
2854
383433
387364
288434
159129
4321
4468
367391
491460
498426
583703
139148152
113
Current impact of training packages continued

35Sport, recreation and Fitness Environmental Scan 2012
Figure 19. vocational course completions by Sport Qualification (2007–10)
Source: NCVER
0 50 100 150 200 250 300Completions
Certificate II in Sport (Career Oriented Participation)
Certificate II in Sport (Officiating)
Certificate III in Sport (Officiating)
Certificate III in Sport (Career Oriented Participation)
Certificate III in Sport (Athlete Support Services)
Certificate IV in Sport (Athlete Support Services)
Certificate IV in Sport (Development)
Diploma of Sport(Development)
Diploma of Sport(Athlete Support Services)
2007
2008
2009
2010
92323
67
01817
22
0000
406666
263
1336
410
101
380
84105
16732
59144
750
2861
380

36 Environmental Scan 2012 Sport, recreation and Fitness
Figure 20. vocational course Enrolments by coaching Qualification (2007–10)
Source: NCVER
0 500 1,000 1,500 2,000 2,500 3,000Enrolments
Certificate II in Sport(Coaching)
Certificate III in Sport(Coaching)
Certificate IV in Sport(Coaching)
Diploma of Sport(Coaching)
2007
2008
2009
2010
2,588
1,228
1,021
2,055
146
131
132
81
110
86
91
140
9
0
0
4
Current impact of training packages continued

37Sport, recreation and Fitness Environmental Scan 2012
Figure 21. vocational course completions by coaching Qualification (2007–10)
Source: NCVER
0 50 100 150 200 250 300 350Completions
Certificate II in Sport(Coaching)
Certificate III in Sport(Coaching)
Certificate IV in Sport(Coaching)
Diploma of Sport(Coaching)
2007
2008
2009
2010
199
311
189
10
17
55
7
57
2
28
5
1
0
0
0
0

38 Environmental Scan 2012 Sport, recreation and Fitness
community recreation
Enrolments in community recreation continue to be predominantly at the certificate ii level. this is partly based on industry requirements for the royal life Saving Society australia (rlSSa) Pool lifeguard and aUStSWim Swimming teacher industry accreditation schemes, which use these qualifications. However, enrolments have been increasing at all levels since 2007, although this has mostly been from a low base. the revised training package endorsed in 2010, SiS10, has restructured the community recreation courses into separate qualifications for community activities and for aquatics. this sector is also known for its high use of skill sets. these are not, however, captured in the statistics presented below.
Figure 22. vocational course Enrolments by community recreation Qualification (2007–10)
Source: NCVER
0 500 1,000 1,500 2,000 2,500 3,000 3,500 4,000 4,500Enrolments
Certificate I in Community Recreation
Certificate II in Community Recreation
Certificate III in Community Recreation
Certificate IV in Community Recreation
2007
2008
2009
2010
95
57
80
205
2,796
3,273
4,111
3,923
297
479
636
714
33
91
88
75
Current impact of training packages continued

39Sport, recreation and Fitness Environmental Scan 2012
Figure 23. vocational course completions by community recreation Qualification (2007–10)
Source: NCVER
0 100 200 300 400 500 600 700Completions
Certificate I in Community Recreation
Certificate II in Community Recreation
Certificate III in Community Recreation
Certificate IV in Community Recreation
2007
2008
2009
2010
25
42
41
10
35
40
79
139
275
685
556
217
49
46
54
0
40 Environmental Scan 2012 Sport, recreation and Fitness
the SiS10 Sport, Fitness and recreation training Package was endorsed on 21 December 2010 and released on ntiS on 6 June 2011. training Packages are subject to continuous improvement which allows for changes to be made so as to keep up to date with the needs and changing circumstances of industry.
Following the initial release of SiS10, a version 1.3 iSc upgrade was then released on training.gov.au on 28 november 2011. this iSc upgrade included the correction of editorial and typographical errors, in addition to adjustments to community recreation and outdoor recreation skill sets.
transition workshops to assist stakeholders in implementing the new package were held across most states and territories during april and may 2011. Based on the survey responses of 140 attendees, 128 found the workshop to be useful or very useful.
most of the issues impacting on the continuous improvement of SiS10 came from these transition workshops.
Development of the sport-specific and generic sport and recreation qualifications within SiS10 was completed by the end of 2008. they were part of a four year review process that saw the four superseded training packages rolled into one.
the first priority for the continuous improvement of SiS10 is to update the sport-specific and generic sport and recreation qualifications in order to reflect contemporary industry practices. in addition, these qualifications will be reviewed in light of the revised ncaS and noaS schemes, particularly tennis, basketball, golf, equestrian, officiating units and skill sets. this will result in a version 2 of SiS10.
in summary these issues include:
• improving the sport qualification structures to better reflect industry needs and coverage on sport working environments
• Workplace Health and Safety
• risk analysis
• inclusion of sport content in the core of the generic qualifications
• Diplomas need to include missing units such as finance, marketing, Hr, it, sponsorship, facility management and sports development
• the re-inclusion of officiating
• inclusion of introductory knowledge on sports law
• Entry requirements
• inclusion of units on governance and how to work with a Board.
to address the shortcomings in the sport, and sport and recreation qualifications, industry representatives were invited to two think tanks to consider the issues and identify the current skill requirements. these were held in late november 2011, in which the Sydney meeting focused on the sport-specific qualifications and the melbourne meeting focused on the generic qualifications.
Future Directions for Endorsed components of training Packages

41Sport, recreation and Fitness Environmental Scan 2012
the participants were provided with a preliminary draft of proposed changes, to which they indicated in principle agreement or suggested further amendments. Participating organisations in the thinks tanks included:
• aquatics and recreation victoria
• australian canoeing association
• australian Sports commission
• aUStSWim
• Basketball australia
• cHarttES industry training advisory council, nt
• Dangerous minds
• Department of Education, newcastle
• Equestrian australia
• Gordon taFE (the Gordon)
• Gymnastics australia
• Gymnastics nSW
• north melbourne institute of technology
• nSW Sports Federation
• nSW taFE
• Professional Golfers association of australia
• royal life Saving australia
• Seams, Sports and Education management Specialist
• SkillsHub victoria
• Smart connections training company
• Surf life Saving australia
• Swimming coaches and teachers association
• taFE Sa
• tennis australia
• vicSport
• victorian Fitness academy
it is planned that the SiS10 version 2 endorsement submission to the national Skills Standards council (nSSc) will be made in mid-2012. version 2 will mainly encompass changes to the Sport, and Sport and recreation qualification and units.
thereafter, continuous improvement will be made in the outdoor recreation, fitness and community recreation qualifications, units or skills sets which may result in further iSc upgrades or endorsement.
consultation and feedback mechanisms for SiS10 continuous improvement will be available through the SSa feedback register for all stakeholders.
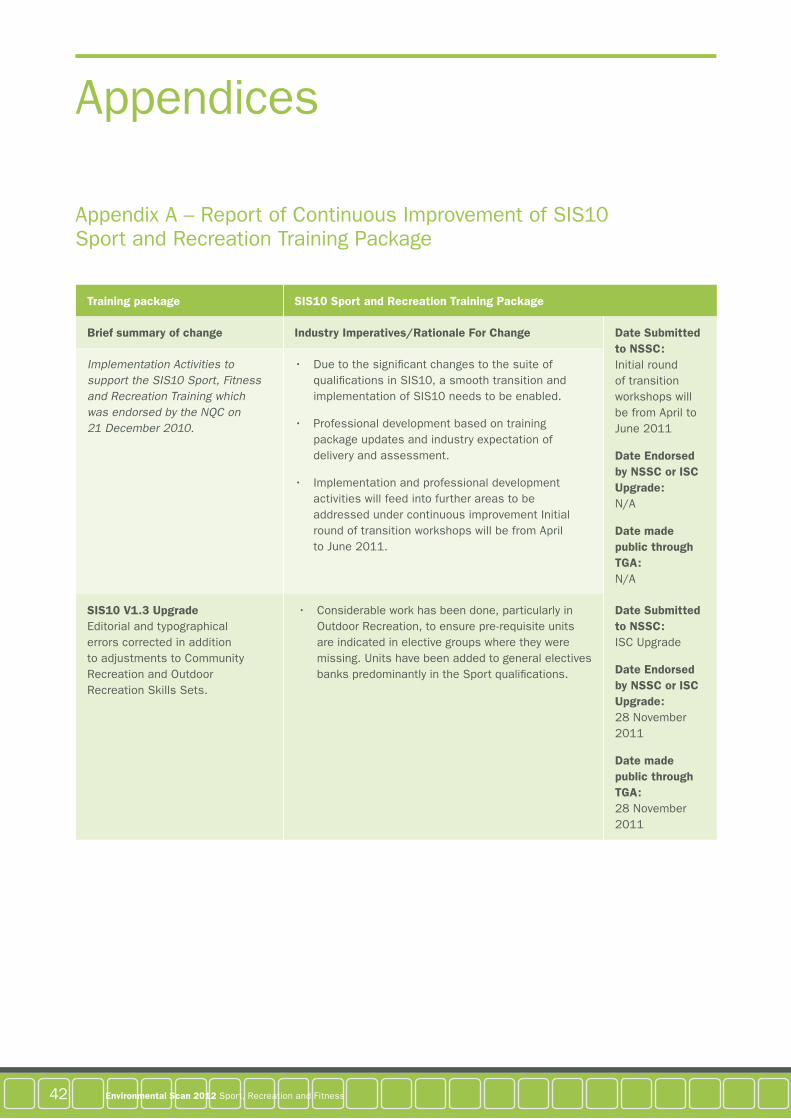
42 Environmental Scan 2012 Sport, recreation and Fitness
appendix a – report of continuous improvement of SiS10 Sport and recreation training Package
Training package SIS10 Sport and Recreation Training Package
Brief summary of change Industry Imperatives/Rationale For Change Date Submitted to NSSC: initial round of transition workshops will be from april to June 2011
Date Endorsed by NSSC or ISC Upgrade: n/a
Date made public through TGA: n/a
Implementation Activities to support the SIS10 Sport, Fitness and Recreation Training which was endorsed by the NQC on 21 December 2010.
• Duetothesignificantchangestothesuiteofqualifications in SiS10, a smooth transition and implementation of SiS10 needs to be enabled.
• Professionaldevelopmentbasedontrainingpackage updates and industry expectation of delivery and assessment.
• Implementationandprofessionaldevelopmentactivities will feed into further areas to be addressed under continuous improvement initial round of transition workshops will be from april to June 2011.
SIS10 V1.3 Upgrade Editorial and typographical errors corrected in addition to adjustments to community recreation and outdoor recreation Skills Sets.
• Considerableworkhasbeendone,particularlyinoutdoor recreation, to ensure pre-requisite units are indicated in elective groups where they were missing. Units have been added to general electives banks predominantly in the Sport qualifications.
Date Submitted to NSSC: iSc Upgrade
Date Endorsed by NSSC or ISC Upgrade: 28 november 2011
Date made public through TGA: 28 november 2011
appendices

43Sport, recreation and Fitness Environmental Scan 2012
Training package SIS10 Sport and Recreation Training Package
Brief summary of change Industry Imperatives/Rationale For Change Date Submitted to NSSC: 11 may 2012
Date Endorsed by NSSC or ISC Upgrade: nSSc meeting date 28 June 2012
Date made public through TGA: Post June 2012 – tBc
SIS10 Version 2 endorsement Major changes to Sport specific and generic Sport and Recreation qualifications in the training package
Development of the sports qualifications within SiS10 was completed by the end of 2008, and need to be further updated to meet industry needs.
review the structure of all of the sport, and sport and recreation qualifications to meet industry needs and the review of these qualifications against the ncaS and ncoS schemes, particularly tennis, Basketball, Golf, Equestrian, and officiating units and skill sets.
Development of governance units and /or skill sets.
• Industryconcernedaboutthedeletionofcertainofficiating units, particularly where they link to existing vEtiS programs.
• Improvingthesportqualificationstructuresto reflect better industry needs and coverage on sport working environments.
• Givenincreasedcomplianceobligations,OHS,legalobligations and risk need better coverage.
• Genericqualificationsdonothaveenoughindustryspecific content in the core and also need to include event management competencies in electives.
• Higher-levelqualificationsdonothavesufficientdepth and are missing core management skills,
• SportqualificationsneedtoalignwiththeNCASornoaS, and must reflect the real scope of practice at each aQF level - they need more industry specific units, while the removal of officiating units is seen as a loss.
• Conflictresolution,clientserviceandpeoplemanagement skills need enhancing.
SIS10 Version 2 endorsement Flexibility, recognition and convergence of skills across all sectors.
review all 38 cross-sector units to ensure their applicability across all sectors.
• Identifyingclearerpathwaysandportabilityofskillsacross the industry sectors.
• Greatersimplificationofskillsrecognitionacrossthe industry.
Dates as above

44 Environmental Scan 2012 Sport, recreation and Fitness
Training package SIS10 Sport and Recreation Training Package
Brief summary of change Industry Imperatives/Rationale For Change Date Submitted to NSSC: to be submitted 19 october 2012
Date Endorsed by NSSC or ISC Upgrade: Proposed endorsement 6 December 2012
Date made public through TGA: Post December 2012
SIS10 ISC Upgrades or Version 3 Endorsement
Scope and prioritise improvements to individual units and qualifications in Fitness, community recreation and outdoor recreation.
• Reviewanddevelopnewskillssetsinalignmentwith industry registration schemes.
Appendices continued
appendix a continued

45Sport, recreation and Fitness Environmental Scan 2012
appendix B – occupations in Sport and recreation
the list below is taken from aBS 4148.0 Employment in Sport.
121316 Horse Breeder
139915 Sports administrator
149112 Fitness centre manager
149113 Sports centre manager
272612 recreation officer
323312 Gunsmith
361111 Dog Handler or trainer
361112 Horse trainer
362311 Greenkeeper
393111 canvas Goods maker
393113 Sail maker
452111 Fitness instructor
452211 Bungy Jump master
452212 Fishing Guide
452213 Hunting Guide
452214 mountain or Glacier Guide
452215 outdoor adventure instructor
452216 trekking Guide
452217 Whitewater rafting Guide
452299 outdoor adventure Guides
452311 Diving instructor (open Water)
452312 Gymnastics coach or instructor
452313 Horse riding coach or instructor
452314 Snowsport instructor
452315 Swimming coach or instructor
452316 tennis coach
452317 other Sports coach or instructor
452318 Dog or Horse racing official
452321 Sports Development officer
452322 Sports Umpire
452323 other Sports official
452499 Sportspersons
452411 Footballer
452412 Golfer
452413 Jockey
452414 lifeguard
841516 Stablehand
450000 other Sports and Fitness Workers

46 Environmental Scan 2012 Sport, recreation and Fitness
appendix c – Sport, Fitness, and outdoor and community recreation occupations and Qualifications in Demand
ANZSCO Code
OccupationTraining Package Qualification
Justification /Evidence
452315 Swimming coach /instructor
certificate iii in aquatics
there are widespread reports from industry that there is a shortage of qualified swimming coaches/instructors. this is jeopardising the development of significant life skills.
Furthermore, 315 people drowned in australian waterways in the 12 months to 30 June 2011. this represented the third year in a row in which this figure increased.
452414 lifeguard certificate iii in aquatics
there are widespread industry reports of a shortage of staff, however it is reported that this is particularly acute in regional and remote locations.
the industry needs key staff like lifeguards and customer service personnel in order to keep facilities open and have sufficient staffing levels to comply with oHS requirements and rlSSa Guidelines for Safe Pool operations.
4523 Sports coach or instructor
certificate ii in Sport coaching
certificate iii in Sport coaching
certificate iv in Sport coaching
Diploma of Sport coaching
DEEWr forecasts growth in employment for sports coaches and officials to increase by 2.1 percent annually to 2015–16.
the quality and professionalism of community coaches has been raised as a significant strategy to ensure greater community participation in physical activity.
Appendices continued

47Sport, recreation and Fitness Environmental Scan 2012
ANZSCO Code
OccupationTraining Package Qualification
Justification /Evidence
45211 Gym instructor
Group Exercise instructor
Personal trainer
certificate iii in Fitness
certificate iv in Fitness
Diploma of Fitness
High levels of growth are forecast for the employment of fitness trainers. DEEWr forecasts annual growth of 4.1 percent to 2015-16 and the cEEt report forecasts average annual growth of 3.1 percent to 2015. this excludes potential demand for personal trainers.
However, this growth is a lower bound forecast. Further demand for fitness professionals may be generated by the emerging link between fitness and the health sector and improvements in coordinated service delivery across sectors. Fitness professionals may play a greater role in the prevention and management of chronic disease. this role is currently being recognised within the coaG Preventative Health initiatives. Demand for Personal training services in a variety of settings will most likely continue to increase.
this also requires demand for exercise professionals with more advanced skills. the cEEt report forecast that 26 percent of exercise professionals will hold a Diploma or advanced Diploma in 2015.
in particular, shortages have been reported in the niche area of aqua instructors.
452321 or 139915
Sports development officer or sports administrator (program coordinator)
certificate iv in Sport Development
Diploma of Sport Development
certificate iii in Sport and recreation
certificate iv in Sport and recreation
Diploma of Sport and recreation administration
the decline in national participation rates has focussed sport’s attention to increasing community participation in sport. this sees greater demand for sports development officers.

48 Environmental Scan 2012 Sport, recreation and Fitness
appendix c continued
ANZSCO Code
OccupationTraining Package Qualification
Justification /Evidence
1491 amusement, fitness and sports centre manager (facility manager)
certificate iii in aquatics
Diploma of Facility management
the aquatics industry has continued to experience recruitment difficulties and reports increasing reliance on casual staff, often University students who have no desire to remain in the industry.
this has a flow on effect for the availability of staff for aquatics facilities managers’ roles.
Within these positions there is also a shortage of technical skills, such as water quality management.
139915 Sports administrator (board and committee members)
Sport units at Diploma level ‘Promote compliance with laws and legal principles’ and ‘manage organisational risks’
the sport and recreation industries often rely on volunteers as members of their governance structures. there is ongoing feedback from industry that many volunteers do not hold an adequate understanding for undertaking these roles. this also coincides with reports of increasing numbers of insolvency among clubs.
139915 Sports administrator
certificate iv in Sport (Development)
certificate iv in outdoor recreation
certificate iv in community recreation
certificate iv in Sport and recreation
Diploma of Fitness
Diploma of outdoor recreation
Diploma of Sport Development
Diploma of Facility management
Diploma of Sport and recreation administration
there are reports of increasing insolvency rates among sport and recreation clubs. as a result, there is a need to support increased professionalism and improved management skills, including business planning, budgeting, human resources, leadership and governance.
Appendices continued

49Sport, recreation and Fitness Environmental Scan 2012
appendix D – alignment of the Sport, Fitness, and outdoor and community recreation industries to the anZSic Framework
Sport, Recreation and Fitness industries
Division R
Arts and Recreation Services
Division S
Other Services
Division P
Education and Training
Subdivision 91
Sport and recreation activities
Subdivision 82
adult, community and other Education
Subdivision 95 Personal and other Services
Group 913 amusement and other recreation activities
class 9111 Health and Fitness centres and Gymnasia operation
class 9112 Sports and Physical recreation clubs and Sports Professionals
class 9113 Sports and Physical recreation
venues, Grounds and Facilities operation
class 9114 Sports and Physical recreation
administrative Services
class 9139 amusement and other recreational
activities n.e.c.
class 8211 Sports and Physical recreation
instruction
class 9539 other Personal Services n.e.c.
Group 911 Sport and Physical recreation activities
Group 821 adult, community and other Education
Group 953 other Personal Services
Source: Australia and New Zealand Standard Industrial Classification (ANZSIC) 2006 (Revision 1.0)

50 Environmental Scan 2012 Sport, recreation and Fitness
1 aBS, 2006, cat. no. 1292.0, Australia and New Zealand Standard Industrial Classification (ANZSIC) 2006 (revision 1.0).
2 aBS, 2010, cat. no. 4177.0, Participation in Sport and Physical Recreation 2009-10.
3 aBS, 2011, cat. no. 6530.0, Household Expenditure Survey, Australia: Summary of Results, 2009-10.
4 ibid.
5 ibid.
6 aBS, 2011, cat. no. 6530.0, Household Expenditure Survey, Australia: Summary of Results, 2009-10.
7 aBS, 2011, cat. no. 4156.0, Sports and Physical Recreation: A Statistical Overview, Australia, 2011.
8 aBS, 2010, cat. no. 4173.0, Time Use on Recreation and Leisure Activities, 2006.
9 ibid.
10 aBS, 2010, cat. no. 4174.0, Spectator Attendance at Sporting Events, 2009-10.
11 independent Sport Panel, 2009, The Future of Australian Sport (Crawford Report).
12 aBS, 2011, cat. no. 4156.0.55.001, Perspectives on Sport, November 2011.
13 aBS, 2008, cat. no. 4364.0, National Health Survey 2007-08.
14 aBS, 2011, cat. no. 4156.0, Sports and Physical Recreation: A Statistical Overview, Australia, 2011.
15 Gardner, J. 31 august 2011, ‘the Gloves are off’, BRW, retrieved from http://www.brw.com.au/Page/Uuid/33f69a88-adaf-11e0-97df-2f7cb9a1748d
16 aBS, 2008, cat. no. 3222.0, Population Projections Australia, 2006 to 2101.
17 aBS, 2010, cat. no. 3201.0, Population by Age and Sex, Australian States and Territories, Jun 2010.
18 aBS, 2008, cat. no. 3222.0, Population Projections, Australia, 2006 to 2101, Series B.
19 aBS, 2011, cat. no. 3412.0, Migration Australia, 2006-07.
20 aBS, 2008, cat. no. 3222.0, Population Projections, Australia, 2006 to 2101, Series B.
21 Sweeney research, 2009, 2008 Fitness Industry Profile Report, prepared for Fitness australia.
22 aBS, 1996, cat. no. 4177.0, Participation in Sport and Physical Activities, Australia, 1995-96 .
23 aBS, 2010, cat. no. 4177.0, Participation in Sport and Physical Recreation 2009-10.
24 Department of Broadband, communications and the Digital Economy, 2011, Digital Economy Goals, retrieved 12 october, 2011, from http://www.nbn.gov.au/the-vision/digital-economy-goals
25 the nielsen company, 2011, Media Release, Nielsen’s State of the Online Market: Evolution or Revolution?, retrieved 15 September, 2011, from http://au.nielsen.com/site/documents/australianonlineconsumersreport mediarelease.pdf.
26 reserve Bank of australia, 2011, Statement on Monetary Policy, February 2011, retrieved 28 october, 2011, from http://www.rba.gov.au/ publications/smp/boxes/2011/feb/b.pdf.
Endnotes

51Sport, recreation and Fitness Environmental Scan 2012
27 PayPal, 2010, eCommerce Secure Insight Australia, November 2010.
28 centre for the Economics of Education and training, 2010, Forecasts of Labour and Skill Requirements in the Service Industries 2010–2015, prepared for Service Skills australia, p. 55.
29 ibid., p. 6.
30 Department of Education, Employment and Workplace relations, 2011, DEEWR Annual Employment Projections to 2015-16, retrieved 12 December, 2011, from http://www.skillsinfo.gov.au/skills/industryreportscharts/
31 Skillsinfo, 2010, DEEWR Employment Outlook for Arts and Recreation Services, retrieved 2 november, 2011, from http://www.skillsinfo.gov.au/nr/rdonlyres/9005cBcF- a59F-48D3-Ba3B-D235D8E1592a/0/outlookartsandrecreationServices.pdf
32 aBS, 2008, cat. no. 3222.0, Population Projections, Australia, 2006 to 2101, Series B.
33 Job outlook, 2011, Fitness Instructors: Statistics, retrieved 3 november, 2011, from http://joboutlook.gov.au/pages/occupation.aspx?search=alpha&code=4521
34 Job outlook, 2011, Sports Coaches, Instructors and Officials: Statistics, retrieved 3 november, 2011,http://joboutlook.gov.au/Pages/occupation.aspx?search=alpha&tab=stats&cluster=&code=4523
35 aBS, 2010, cat. no. 6285.0, Involvement in Organised Sport and Physical Activity, Australia, april 2010.
36 aBS, 2011, cat. no. 4441.0, Voluntary Work, Australia, 2010.
37 ibid.
38 aBS, 2011, cat. no. 4156.0, Sports and Physical Recreation: A Statistical Overview, Australia, 2011.
39 Frontier Economics, 2009, The Economic Contribution of Sport to Australia, prepared for the australian Sports commission.
40 aBS, 2011, cat. no. 4441.0, Voluntary Work, Australia, 2010.
41 aBS, 2011, cat. no. 4156.0, Sports and Physical Recreation: A Statistical Overview, Australia, 2011.
42 aBS, 2011, cat. no. 4441.0, Voluntary Work, Australia, 2010.
43 ibid.
44 For further information on the right Way program, please refer to: http://www.serviceskills.com.au/rightway
45 Dangerous minds, 2011, Review of the National Coaching and Officiating Accreditation Scheme, prepared for the australian Sports commission.
46 australian Sports commission, 2011, Annual Report 2010-11.
47 australian Sports commission, 2011, Education and Accreditation, retrieved on 10 october 2011 from http://www.ausport.gov.au/participating/officials/education
48 australian Sports commission, 2010, Annual Report 2009-10.
49 australian Sports commission, 2011, Annual Report 2010-11.

this page has been left intentionally blank

53 Environmental Scan 2012 Sport, recreation and Fitness

www.serviceskills.com.au