Embed Size (px)
Citation preview

Sport Participation in Victoria and the Contribution of Sport to Physical Activity Levels
Report prepared for
Sport and Recreation Victoria
RM Eime
JT Harvey
MJ Charity
MM Casey
December 2014


Sport Participation in Victoria and the Contribution of Sport to Physical Activity Levels
Table of Contents Executive summary ........................................................................................................... 3
Research Summary and Recommendations ................................................................... 6
Part 1. Sport Participation Rates: Victoria 2010-2012 ................................................... 10
Summary .................................................................................................................................. 10
Methods, limitations and caveats ............................................................................................................. 10
Results ...................................................................................................................................................... 10
Introduction .............................................................................................................................. 12
Methods .................................................................................................................................... 12
Technical issues, limitations and caveats ................................................................................................ 12
Results ..................................................................................................................................... 13
Overall ...................................................................................................................................................... 13
Age ........................................................................................................................................................... 13
Gender ...................................................................................................................................................... 13
Metropolitan and non-metropolitan Victoria ............................................................................................. 14
Part 2. Sport Participant Age Profiles: Victoria 2010-2012 ........................................... 19
Summary .................................................................................................................................. 19
Methods, limitations and caveats ............................................................................................................. 19
Results ...................................................................................................................................................... 19
Introduction .............................................................................................................................. 20
Methods .................................................................................................................................... 20
Technical issues, limitations and caveats ................................................................................................ 20
Results ..................................................................................................................................... 20
Age ........................................................................................................................................................... 20
Gender ...................................................................................................................................................... 21
Region ...................................................................................................................................................... 21
Part 3. Longitudinal Sport Participation Patterns: Victoria 2010-2012 ........................ 26
Summary .................................................................................................................................. 26
Methods, limitations and caveats ............................................................................................................. 26
Results ...................................................................................................................................................... 26
Introduction .............................................................................................................................. 28
Methods .................................................................................................................................... 28
Technical issues, limitations and caveats ................................................................................................ 28
Results ..................................................................................................................................... 29
All persons ................................................................................................................................................ 29
Gender ...................................................................................................................................................... 29
1

Sport Participation in Victoria and the Contribution of Sport to Physical Activity Levels
Region ...................................................................................................................................................... 30
Region and Gender .................................................................................................................................. 31
Part 4. The Contribution of Sport to Physical Activity Levels: Australia 2010 ........... 36
Summary .................................................................................................................................. 36
Introduction .............................................................................................................................. 38
Aim............................................................................................................................................ 39
Methods .................................................................................................................................... 39
Sampling ................................................................................................................................................... 39
Measures .................................................................................................................................................. 39
Analysis .................................................................................................................................................... 40
Results ..................................................................................................................................... 42
Discussion ............................................................................................................................... 51
Conclusion ............................................................................................................................... 53
References ....................................................................................................................... 54
Publication Details ........................................................................................................... 57
2

Sport Participation in Victoria and the Contribution of Sport to Physical Activity Levels
Executive summary
This report integrates the results of four separate research studies, three based on annual Victorian player registration data for five popular sports (Australian Rules Football, Basketball, Cricket, Hockey and Netball) for the period 2010-2012, and the fourth based on national data from the 2010 Exercise, Recreation and Sport Survey (ERASS) commissioned by the Australian Sports Commission. The Sport and Recreation Spatial team combines extensive research and technical skills in behavioural epidemiology, public health, health promotion and sports management, underpinned by a strong data management and statistical analysis capability. Through its established partnerships with a number of the largest state sporting associations, Sport and Recreation Spatial is able to conduct geographical, cross-sectional and longitudinal analyses of sport participation rates, patterns of participation and provision of sports facilities in Victoria, providing an unprecedented body of objective evidence to inform and underpin strategic planning and policy development in the sports sector, as well as aiding investigation of the health benefits of sport for individuals and communities.
The four parts of this report are:
• Part 1. Sport Participation Rates: Victoria 2010-2012 • Part 2. Sport Participation Age Profiles: Victoria 2010-2012 • Part 3. Longitudinal Sport Participation Patterns: Victoria 2010-2012 • Part 4. Contribution of Sport to Physical Activity Levels: Australia 2010
Six key themes emerged from these studies. Some key points regarding each theme follow, together with recommendations for further study and/or development
Overall, sport participation in Victoria increased between 2010 and 2012
• Across Victoria throughout the period 2010-2012 there were over 460,000 registered participants in the five popular sports examined.
• This amounted to approximately 8% of Victorians being registered participants in these five popular sports.
• Approximately 36% of Victorians aged 10-14 were registered participants in the five sports. • Registrations increased by over 50,000, or 12%, in the two years from 2010 to 2012.
Recommendations regarding increased sport participation
1. Broaden the base of the analysis of participation by incorporating a wider range of data from a wider range of sports.
2. Identify the characteristics of new participants and investigate influences on increasing participation.
Participation in club sport is dominated by young people
• Participation in sport is dominated by children and adolescents. • There is a high proportion of very young participants (4-6 years), especially among males. • However, many 4-year-olds only participate for a single year in a given sport. • Over 90% of sport participants are aged less than 35 years.
3
Sport Participation in Victoria and the Contribution of Sport to Physical Activity Levels
Recommendations regarding young children
3. Investigate modified sports products to better understand the different patterns in participation, retention and drop-out and the factors influencing these patterns.
4. Investigate whether children participating in a modified sport program at a very early age leads to higher or lower participation in organised competitive sport later in childhood.
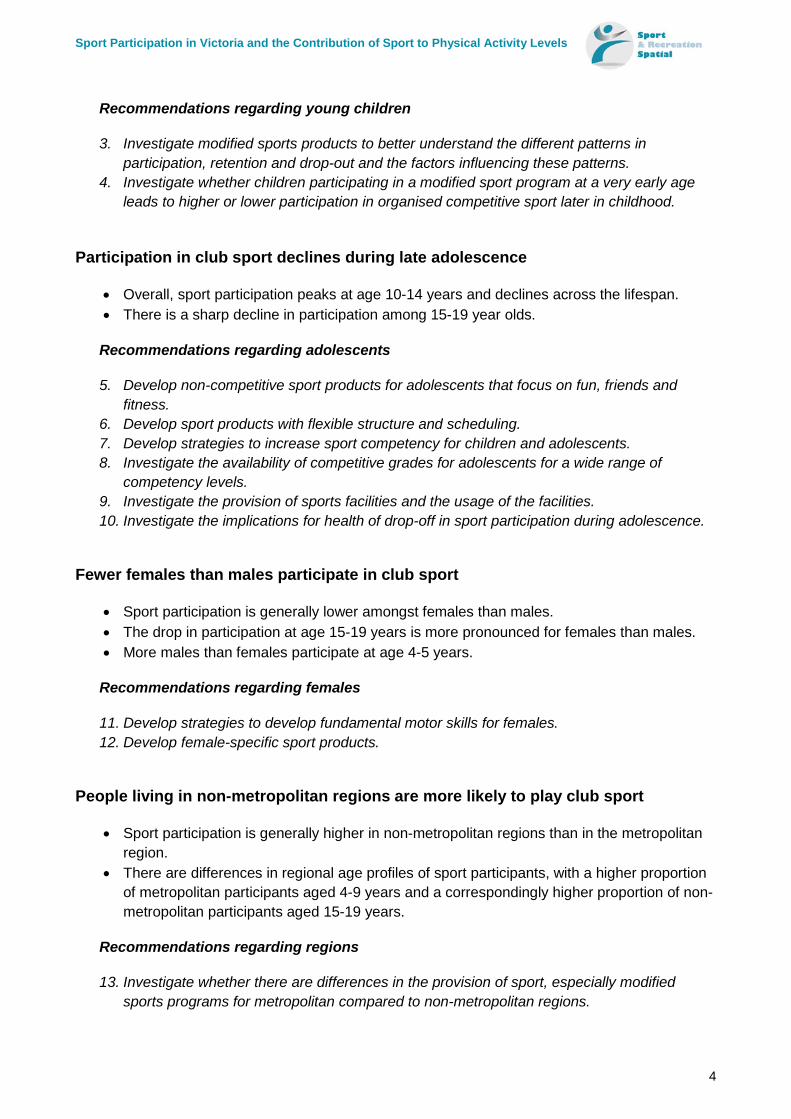
Participation in club sport declines during late adolescence
• Overall, sport participation peaks at age 10-14 years and declines across the lifespan. • There is a sharp decline in participation among 15-19 year olds.
Recommendations regarding adolescents
5. Develop non-competitive sport products for adolescents that focus on fun, friends and fitness.
6. Develop sport products with flexible structure and scheduling. 7. Develop strategies to increase sport competency for children and adolescents. 8. Investigate the availability of competitive grades for adolescents for a wide range of
competency levels. 9. Investigate the provision of sports facilities and the usage of the facilities. 10. Investigate the implications for health of drop-off in sport participation during adolescence.
Fewer females than males participate in club sport
• Sport participation is generally lower amongst females than males. • The drop in participation at age 15-19 years is more pronounced for females than males. • More males than females participate at age 4-5 years.
Recommendations regarding females
11. Develop strategies to develop fundamental motor skills for females. 12. Develop female-specific sport products.
People living in non-metropolitan regions are more likely to play club sport
• Sport participation is generally higher in non-metropolitan regions than in the metropolitan region.
• There are differences in regional age profiles of sport participants, with a higher proportion of metropolitan participants aged 4-9 years and a correspondingly higher proportion of non-metropolitan participants aged 15-19 years.
Recommendations regarding regions
13. Investigate whether there are differences in the provision of sport, especially modified sports programs for metropolitan compared to non-metropolitan regions.
4

Sport Participation in Victoria and the Contribution of Sport to Physical Activity Levels
The role of sport in promoting health
• Club-based sport participation contributes considerably to leisure-time physical activity. • Club-based sport participation contributes to nearly a fifth of all health enhancing levels of
leisure-time physical activity. • Nearly all sport participation is at health-enhancing levels of intensity. • Club sport plays an important role as a setting for leisure-time physical activity and health.
Recommendations regarding health
14. Promote the health benefits of participation in sport across the lifespan. 15. Develop a ‘health through sport’ policy agenda. 16. Investigate the effects of the drop-off in participation in sport during late adolescence and
the effect this has on physical, social and psychological health. 17. Investigate the effect on participation rates of program and policy developments in Healthy
Sporting Environments within clubs.
5

Sport Participation in Victoria and the Contribution of Sport to Physical Activity Levels
Research Summary and Recommendations The findings of the research studies on sport participation in five popular Victorian sports largely reflect international trends in sport participation, whereby males have higher participation rates than females and sport participation declines with age, especially during adolescence. This section integrates the key findings of the sport participation research in Victoria and identifies recommendations for future sport participation research and development in six key areas: overall participation levels, young children, adolescents, females, geographic regions and health.
1. Increased sport participation Across Victoria throughout the period 2010-2012 there were over 460,000 registered participants in the five popular sports examined. This amounted to approximately 8% of Victorians being registered participants in these five popular sports. Approximately 36% of Victorians aged 10-14 were registered participants in the five sports. Registrations increased by over 50,000, or 12%, in the two years from 2010 to 2012.
Recommendations regarding increased sport participation
1. Broaden the base of the analysis of participation by incorporating a wider range of data from a wider range of sports.
2. Identify the characteristics of new participants and investigate influences on increasing participation.
2. Young children
Sport is doing well to engage children, and increasingly very young children (4-5 year olds) in organised sport, particularly through modified sports programs. However the rate of ongoing participation over three years is relatively low amongst these children, with many withdrawing from modified sports programs after a single year. High withdrawal rates from modified sports programs are perhaps to be expected considering that children’s socialisation into sport follows a general pattern of sampling and then specialising 1. During the sampling phase (generally under 13 years), children may try out several different sports. As they grow older (13+), they tend to focus their participation and specialise in one or two sports. As such, withdrawal from a sport at young ages may be indicative of sampling and hence may not be a problem.
In modified sports programs, essentially the sport is modified to match the developmental capabilities of children by adapting games and activities through changes to the rules, equipment, and/or physical space to encourage inclusion and maximise participation 2. The fundamental focus of modified sport programs is often on learning, development and fun, and not on competition. The number of children playing in modified sports has increased in recent times 3 and is likely to have been influenced by deliberate strategies by State and Commonwealth governments and health promotion organisations to encourage sport participation in general, but also by sport governing bodies offering modified sport to encourage more young people to participate in organised sport 4, 5.
Sport organisations are to be commended on developing modified sports programs for children and appear to doing quite well at marketing and engaging young children in sport. However it can be asked whether children are becoming involved in organised sport at a too young an age. There is a risk that early specialisation can lead to increased drop out 2. Conversely, some less developmentally equipped children may have to stay participating for several years in
6

Sport Participation in Victoria and the Contribution of Sport to Physical Activity Levels
modified sport before being able to participate in club-based competition. Perhaps some of these drop out without ever making the transition to the standard form of the sport.
Recommendations regarding young children
3. Investigate modified sports products to better understand the different patterns in participation, retention and drop-out and the factors influencing these patterns.
4. Investigate whether children participating in a modified sport program at a very early age leads to higher or lower participation in organised competitive sport later in childhood.
3. Adolescents
Participation in sport is very popular for children aged 10-14 years. This is the age group with the highest participation rates. However, there is a considerable drop off in participation for those aged 15-19, especially among females.
There is some recent research to suggest that during adolescence females tend to shift their participation in from organised, competitive and club sport towards non-organised and non-competitive and individual types of physical activity 6. There is also a similar trend towards increased adult participation in general leisure-time physical activity, while participation in organised and/or club sport has remained relatively stable in Australia over the past decade . This trend away from organised sport to non-organised physical activity may have implications for health, including both mental and physical health, as social engagement through sport diminishes 6.
Key factors that have been reported to affect reduced participation in sport include: sport delivery that focuses on competition rather than fun and enjoyment; a lack of flexibility in scheduling of traditional club sport participation opportunities; teams organised on the basis of ability rather than friendship groups; limited opportunities for those with less sports competency 7 8; and self-consciousness amongst adolescents embarrassed by their lack of sporting ability 9. Other factors influencing participation during adolescence include family support, socio-economic status, access to sports facilities 10, and a lack of time and/or other priorities including education and work 11 8. Most notably however, as young people age, sport participation opportunities are increasingly limited, fewer grades of competition available, especially in rural and regional areas 11. We also know that the underlying motivation for many sports participants, and especially for young people, is to have fun and to socialise 11, 12.
Recommendations regarding adolescents
5. Develop non-competitive sport products for adolescents that focus on fun, friends and fitness.
6. Develop sport products with flexible structure and scheduling. 7. Develop strategies to increase sport competency for children and adolescents. 8. Investigate the availability of competitive grades for adolescents for a wide range of
competency levels. 9. Investigate the provision of sports facilities and the usage of the facilities. 10. Investigate the implications for health of drop-off in sport participation during adolescence.
4. Females
Females have much lower rates of sport participation than males, and this is consistent across the lifespan. It also appears that boys participate in organised sport much earlier than girls.
7
Sport Participation in Victoria and the Contribution of Sport to Physical Activity Levels
There was a much higher proportion of young male participants (5.5%) compared to females (1.9%) aged 4-5 years in the five sports studied. While it is acknowledged that three of the five sports examined are predominantly played by males, this alone is not sufficient to explain the discrepancy, which has also been reported in many other studies. The reasons for the discrepancy have not been definitively identified, however one potential factor is young boys being more likely than young girls to be encouraged to participate in sport. There is some evidence that in families with male and female children, fathers tend to be more involved with their sons’ sport than their daughters’ 13. Furthermore parents influence children’s sport participation 10 and this is shaped by the parents’ own sporting backgrounds 13. Since adult males are more likely to participate in sport than females 14, this may be a contributing inter-generational factor that helps to explain why more young boys than young girls enter organised sport early.
Males also exhibit much higher sport participation rates throughout the lifespan. Some of the reasons for lower rates of participation for females have been previously highlighted. It may be that sporting organisations fail to deliver opportunities for girls in the same way that they cater for boys through the availability of programs or targeted marketing efforts. Males are also more likely to participate continuously for 3 years than females.
It is important that girls are provided with opportunities to develop their motor coordination early, as the critical developmental period for motor development is before the age of five and six 15.
Recommendations regarding females
11. Develop strategies to develop fundamental motor skills for females. 12. Develop female-specific sport products.
5. Regions
In addition to age-related differences there were some notable regional differences in sport participation. A higher proportion of metropolitan children aged 4-13 participated in sport compared to non-metropolitan children. The peak metropolitan participation age was younger, at age 10-11 years, compared to non-metropolitan which peaked at 11-12 years. This may be related to the earlier provision of modified sports programs in metropolitan regions, but further research is required.
For adults and older adults the pattern of differences changes with non-metropolitan adults showing a higher participation rate than their metropolitan counterparts. This may relate to the central role of community sport in Australian regional communities, where sport can be considered the ‘social cement’ of these communities 16, contributing to local identity 17, being considered a marker of the health of country communities 18, and held to be ‘everything’ for increasing social connections and cohesion in rural communities 11.
Recommendations regarding regions
13. Investigate whether there are differences in the provision of sport, especially modified sports programs for metropolitan compared to non-metropolitan regions.
8

Sport Participation in Victoria and the Contribution of Sport to Physical Activity Levels
6. Health
Club based sport participation contributes considerably to total levels of leisure-time physical activity and health. Research demonstrates the important role that sports clubs play as a setting for physical activity and health.
There is evidence that sport participation is associated with greater health benefits compared to other less organised or more individual forms of physical activity19, 20. Specifically, sport participation has been associated with better psychological and social health outcomes, particularly due to the social nature of sport participation, for children and adolescents, as well as for adults19, 20. For instance, one study showed that women who participated in club-based sport (netball or tennis) had significantly higher scores on most health-related quality of life measures than those who participated in individual physical activities (gym and walking) 21.
Studies associated with children and adolescents predominantly report the social health aspects associated with participation in sport, including: improved social interaction/integration and social skills and improved self-esteem; whereas studies in adults mainly highlighted psychological health aspects of well-being and reduced stress and distress19, 20. Researchers have therefore suggested that sport participation is advocated as a form of leisure-time physical activity for children, adolescents and adults to help reduce the incidence of chronic conditions associated with low physical activity levels and to enhance other psychological and social health outcomes 19, 20.
In terms of the ‘dose-response’ of PA or sport on health, evidence suggests the level of physical health is positively associated with the level of leisure-time PA 22. Furthermore, the context and setting is also important, with club sport participation contributing to greater benefits at low to moderate levels than participation in gymnasium or walking activities for adult women 22.
With regard to specific health conditions, the following ecological associations have been found with participation in sport in Victorian metropolitan local government areas 23:
• Participation in sport by children aged 5-9 years is associated with lower overall (all-age) prevalence of overweight and obesity.
• Participation in sport is associated with lower prevalence of diabetes. • Participation in sport is associated with lower prevalence of child development vulnerability
in the domains of physical health and wellbeing, social competence, emotional maturity, language and cognitive, and communication and general knowledge.
• Participation in sport is associated with lower prevalence of psychological distress. • The association between participation in and sport and better overall (all-age) health
outcomes was stronger for participation among younger age groups (<20 years) than for participation among older age groups.
Recommendations regarding health
14. Promote the health benefits of participation in sport across the lifespan. 15. Develop a ‘health through sport’ policy agenda. 16. Investigate the effects of the drop-off in participation in sport during late adolescence and
the effect this has on physical, social and psychological health. 17. Investigate the effect on participation rates of program and policy developments in Healthy
Sporting Environments within clubs.
9

Sport Participation in Victoria and the Contribution of Sport to Physical Activity Levels
Part 1. Sport Participation Rates: Victoria 2010-2012 Summary
Methods, limitations and caveats
• This report provides a breakdown of participation across the lifespan in five major sports, for the state of Victoria for the calendar years 2010-2012.
• The measure of participation used is the total number of membership registrations in the five sports.
• There are unavoidable biases due to the limited number of sports included, and the multiple counting of those who participate in more than one of the five sports.
• In particular, of the five sports included, three are predominantly played by males and only one is predominantly played by females, so it is to be expected that participation rates will be higher for males than females.
Results
• Overall, the sport participation rate peaked at 10-14 years and declined across the lifespan. Across the lifespan, participation in the five sports was generally higher among males and in non-metropolitan regions. Increases in registrations in these sports since 2010 were more likely to be male and in non-metropolitan regions.
• Across Victoria, there were over 460,000 registrations in these popular sports in 2012.
• There were over 50,000 more registrations in these sports in 2012 compared to 2010.
• The rate of registrations rose from 7.5% of all Victorians in 2010 to 8.3% in 2012.
• The highest age-specific registration rate was 40% for age 10-14 years in 2012.
• The second highest age-specific registration rate was 30% for age 5-9 years in 2012.
• There was a considerable decline in participation rate between age 10-14 (40%) and age 15-19 (23%) in 2012.
• Males had higher registration rates than females across the lifespan. While this is to some extent attributable to the fact that of the five sports for which data were available, three are predominantly played by males and only one is predominantly played by females, it is notable that the difference was greatest among the youngest age groups. The largest proportional difference was for 4 year-olds, where registrations represented a six-fold difference in the proportion of boys (18%) and girls (3%) in 2012.
• The largest absolute difference was for the 5-9 age category with the participation rate for males being a factor of three times as high (around 26 percentage points higher) than that for females, consistently over the three years.
• The difference in participation rates for males and females increased from 2010-2012 for ages 10-19 years.
• The participation rate was considerably higher in the non-metropolitan region than in metropolitan Melbourne for both males and females. This difference was greatest for the 10-14 year age group, and the difference increased from 2010 through to 2012. In 2012 the participation rate in non-metropolitan areas was 20 percentage points higher than that of the metropolitan area for this age group.
10

Sport Participation in Victoria and the Contribution of Sport to Physical Activity Levels
• The highest participation rate observed throughout the 2010-2012 data was 64% among non-metropolitan males aged 10-14 years in 2012.
11

Sport Participation in Victoria and the Contribution of Sport to Physical Activity Levels
Introduction This report provides a breakdown of participation across the lifespan in five major sports, for the state of Victoria for the calendar years 2010-2012.
Breakdowns are provided by gender, 5-year age cohorts and region. The regions are: metropolitan – 31 local government areas (LGAs) designated by the Victorian government as the Melbourne metropolitan area; and non-metropolitan – the remaining 48 LGAs in Victoria.
Methods A participant is generally defined as a registered member of a club affiliated with one of five State Sporting Associations (SSAs) in Victoria, in 2010, 2011 or 2012. The sports included are: Australian Rules Football, Basketball, Cricket, Hockey, and Netball.
Estimated resident populations (ERPs), produced quarterly by the Australian Bureau of Statistics (ABS), have been used to calulate participation rates.
Technical issues, limitations and caveats
• The registration data provided by SSAs are de-identified but are geographically encoded by residential postcode. In obtaining estimates for other geographical regions such as LGAs, two sources of uncertainty come into play. First, the boundaries of residential postcode areas can be complex, and are not explicitly defined by Australia Post, but ABS has produced a well-defined set of approximately corresponding postal areas (POAs). Second, the data are redistributed from POAs to LGAs according to the overlapping proportions of the two sets of regions. This implicitly assumes that the registered participants are evenly distributed throughout the postal area. This is never exactly true, and so the resulting estimates are not exact. However, at the level of the regions in this report (metropolitan and non-metropolitan Victoria), the inaccuracy is negligible.
• The measure of participation used is the total number of registrations in the five sports. The number of registrations per 100 persons in the population or relevant subpopulation is referred to in this report as the participation rate. However, because individuals can participate in more than one sport, this is not strictly a participation rate or a percentage. It can be regarded as a weighted participation rate, with each person’s participation weighted by the number of sports for which they are registered. Because the registration data are de-identified, the proportion registered in more than one sport cannot be determined exactly, but based on spatial demographic analysis it is estimated to be around 12% across Victoria. If the rate of participation in multiple sports is consistent across years, genders, regions and age-groups, then the comparisons between participation rates are unaffected.
• When interpreting gender comparisons, it must be borne in mind that of the five sports included, three are predominantly played by males and only one is predominantly played by females, so it is to be expected that participation rates would be higher for males than females.
12

Sport Participation in Victoria and the Contribution of Sport to Physical Activity Levels
Results Most of the results cited below are illustrated graphically in Figures 1-11. Numerical details can be found in the spreadsheet Sport Participation Rates: Victoria 2010-2012.
Overall
• The number of registrations in these five sports participants rose from 417,975 in 2010 to 468,944 in 2012, an increase of 12.2%.
• The rate of registrations in these sports among Victorians aged 4-100 rose from 2010-2012: 7.5% in 2010, 7.9% in 2011, 8.3% in 2012.
• The highest registration rate was amongst males from non-metropolitan Victoria aged 10-14; 47% in 2010, 55% in 2011, 64% in 2012.
Age
• The highest proportion of registered sport participants was within the 10-14 year age range, and this increased slightly from 2010 to 2012. These rates corresponded to over a third of the Victorian population within this age group being registered participants in these sports: 36% in 2010, 39% in 2011, 40% in 2012 (Figure 1).
• The second highest proportion of registered sport participants was within the 5-9 year age range, and this proportion remained fairly stable 2010-2012. Registrations within this age group represented around one third of the Victorian population within this age group participating in sport: 29% in 2010, 30% in 2011, 30% in 2012 (Figure 1).
• Compared to the 10-14 year participation rate, there was a considerable decline in participation in the 15-19 age group, down 17-19 percentage points compared to the 10-14 year-old participation rate (Figure 1).
• The rate of registered sport participation for 4 year olds corresponded to around 10% of the Victorian population aged 4, and this rate rose slightly from 2010-2012: 9% in 2010, 9% in 2011, 10% in 2012 (Figure 1).
• Fewer than 1% of the population aged 55+ participated in these sports (Figure 1).
Gender
• The following gender comparisons are to some extent attributable to the fact that of the five sports for which data were available, three are predominantly played by males and only one is predominantly played by females.
• More males than females were registered sport participants, and this was a consistent finding across each age range and for each year 2010-2012. Male participation ranged from 10-12% of the total population compared to 5% for females (Figures 2-6).
• The largest absolute difference was for the 5-9 age category with the participation rate for males being a factor of three times as high (around 26 percentage points higher) than that for females, consistently over the three years (Figures 2-6).
• The second highest difference in participation rates between males and females was for the 10-14 age category, with a difference rising from 16 percentage points in 2010 to 19 percentage points in 2012 (Figures 2-6).
13

Sport Participation in Victoria and the Contribution of Sport to Physical Activity Levels
• The largest proportional difference was for 4 year-olds, where registrations represented a six- to seven-fold difference in the proportion of boys (15% in 2010 and 18% in 2012) and girls (2% in 2010 and 3% in 2012) (Figures 2-6).
• The magnitude of the difference of higher male participation compared to female participation increased from 2010-2012 for ages 10-19 years (Figures 2-6).
Metropolitan and non-metropolitan Victoria
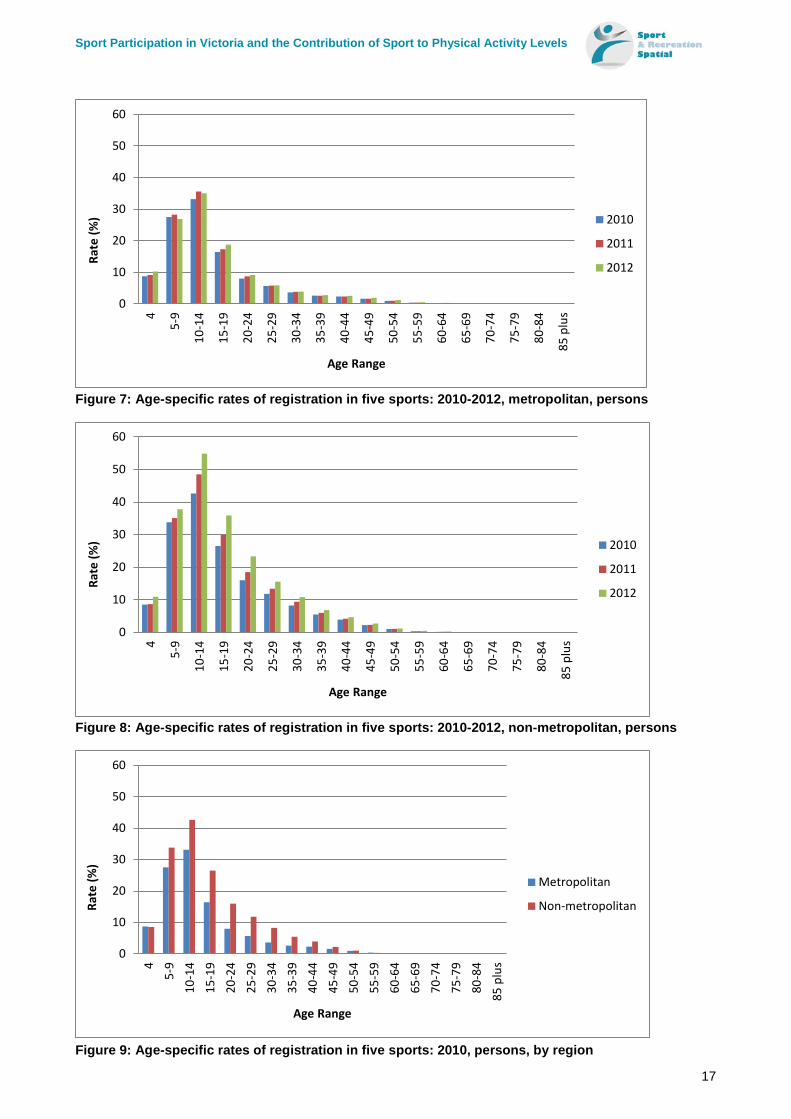
• The proportion of registered sport participants was consistently higher for non-metropolitan compared to metropolitan areas for both males and females and across the lifespan. The only exception was a higher proportion of metropolitan 4 year olds, compared to non-metropolitan 4 year olds playing sport in 2010 and 2011. In 2012 the proportion was slightly higher for non-metropolitan (10.9%) compared to metropolitan 4 year olds (10.3%) (Figures 7-11).
• The biggest differences between non-metropolitan and metropolitan participation rates were for the 10-14 age group. The registration rates indicated that nearly half of all non-metropolitan persons aged 10-14 participated, and this rose from 43% in 2010 to 49% in 2011 and 55% in 2012; metropolitan rates were 33% in 2010, 36% in 2011 and 35% in 2012 (Figures 7-11).
• In 2010 the largest differences for non-metropolitan compared to metropolitan were for 10-14 years and 15-19 years (10 percentage points) followed by 20-24 years (8 percentage points). The differences declined considerably with increasing age, reflecting the lower rates of participation for adults (Figures 7-11).
• In 2011 a similar pattern to 2010 was evident, however the difference between non-metropolitan and metropolitan registration rates were slightly smaller in 2011. The largest differences were for 10-14 years and 15-19 years (13 percentage points), and 20-24 years (10 percentage points) (Figures 7-11).
• In 2012 the difference between non-metropolitan and metropolitan registration rates amongst young people was even more pronounced. The largest differences were amongst the 10-14 age group (20 percentage points – double the 2010 figure) followed by 15-19 years (17 percentage points), and then followed by 20-24 years (14 percentage points) (Figures 7-11).
14

Sport Participation in Victoria and the Contribution of Sport to Physical Activity Levels
Figure 1: Age-specific rates of registration in five sports: 2010-2102, Victoria, persons
Figure 2: Age-specific rates of registration in five sports: 2010-2012, Victoria, females
Figure 3: Age-specific rates of registration in five sports: 2010-2012, Victoria, males
0
10
20
30
40
50
60
4
5-9
10-1
4
15-1
9
20-2
4
25-2
9
30-3
4
35-3
9
40-4
4
45-4
9
50-5
4
55-5
9
60-6
4
65-6
9
70-7
4
75-7
9
80-8
4
85 p
lus
Rate
(%)
Age Range
2010
2011
2012
0
10
20
30
40
50
60
4
5-9
10-1
4
15-1
9
20-2
4
25-2
9
30-3
4
35-3
9
40-4
4
45-4
9
50-5
4
55-5
9
60-6
4
65-6
9
70-7
4
75-7
9
80-8
4
85 p
lus
Rate
(%)
Age Range
2010
2011
2012
0
10
20
30
40
50
60
4
5-9
10-1
4
15-1
9
20-2
4
25-2
9
30-3
4
35-3
9
40-4
4
45-4
9
50-5
4
55-5
9
60-6
4
65-6
9
70-7
4
75-7
9
80-8
4
85 p
lus
Rate
(%)
Age Range
2010
2011
2012
15

Sport Participation in Victoria and the Contribution of Sport to Physical Activity Levels
Figure 4: Age-specific rates of registration in five sports: 2010, Victoria, by gender
Figure 5: Age-specific rates of registration in five sports: 2011, Victoria, by gender
Figure 6: Age-specific rates of registration in five sports: 2012, Victoria, by gender
0
10
20
30
40
50
60
4
5-9
10-1
4
15-1
9
20-2
4
25-2
9
30-3
4
35-3
9
40-4
4
45-4
9
50-5
4
55-5
9
60-6
4
65-6
9
70-7
4
75-7
9
80-8
4
85 p
lus
Rate
(%)
Age Range
Female
Male
0
10
20
30
40
50
60
4
5-9
10-1
4
15-1
9
20-2
4
25-2
9
30-3
4
35-3
9
40-4
4
45-4
9
50-5
4
55-5
9
60-6
4
65-6
9
70-7
4
75-7
9
80-8
4
85 p
lus
Rate
(%)
Age Range
Female
Male
0
10
20
30
40
50
60
4
5-9
10-1
4
15-1
9
20-2
4
25-2
9
30-3
4
35-3
9
40-4
4
45-4
9
50-5
4
55-5
9
60-6
4
65-6
9
70-7
4
75-7
9
80-8
4
85 p
lus
Rate
(%)
Age Range
Female
Male
16
Sport Participation in Victoria and the Contribution of Sport to Physical Activity Levels
Figure 7: Age-specific rates of registration in five sports: 2010-2012, metropolitan, persons
Figure 8: Age-specific rates of registration in five sports: 2010-2012, non-metropolitan, persons
Figure 9: Age-specific rates of registration in five sports: 2010, persons, by region
0
10
20
30
40
50
60
4
5-9
10-1
4
15-1
9
20-2
4
25-2
9
30-3
4
35-3
9
40-4
4
45-4
9
50-5
4
55-5
9
60-6
4
65-6
9
70-7
4
75-7
9
80-8
4
85 p
lus
Rate
(%)
Age Range
2010
2011
2012
0
10
20
30
40
50
60
4
5-9
10-1
4
15-1
9
20-2
4
25-2
9
30-3
4
35-3
9
40-4
4
45-4
9
50-5
4
55-5
9
60-6
4
65-6
9
70-7
4
75-7
9
80-8
4
85 p
lus
Rate
(%)
Age Range
2010
2011
2012
0
10
20
30
40
50
60
45-
910
-14
15-1
920
-24
25-2
930
-34
35-3
940
-44
45-4
950
-54
55-5
960
-64
65-6
970
-74
75-7
980
-84
85 p
lus
Rate
(%)
Age Range
Metropolitan
Non-metropolitan
17

Sport Participation in Victoria and the Contribution of Sport to Physical Activity Levels
Figure 10: Age-specific rates of registration in five sports: 2011, persons, by region
Figure 11: Age-specific rates of registration in five sports: 2012 persons, by region
0
10
20
30
40
50
60
45-
910
-14
15-1
920
-24
25-2
930
-34
35-3
940
-44
45-4
950
-54
55-5
960
-64
65-6
970
-74
75-7
980
-84
85 p
lus
Rate
(%)
Age Range
Metropolitan
Non-metropolitan
0
10
20
30
40
50
60
45-
910
-14
15-1
920
-24
25-2
930
-34
35-3
940
-44
45-4
950
-54
55-5
960
-64
65-6
970
-74
75-7
980
-84
85 p
lus
Rate
(%)
Age Range
Metropolitan
Non-metropolitan
18

Sport Participation in Victoria and the Contribution of Sport to Physical Activity Levels
Part 2. Sport Participant Age Profiles: Victoria 2010-2012 Summary
Methods, limitations and caveats
• This report provides a breakdown of participation across the lifespan in five major sports, for the state of Victoria for the calendar years 2010-2012.
• The measure of participation used is membership registration in any of the five sports.
• There are unavoidable biases due to the limited number of sports included, and the multiple counting of those who participate in more than one of the five sports.
• In particular, of the five sports included, three are predominantly played by males and only one is predominantly played by females, so it is to be expected that the reported overall participation profiles predominantly reflect male age profiles.
Results
• Participation in sport was dominated by children and adolescents. Over half of all sport participants were aged less than 15 years.
• Over 90% all sport participants were aged less than 35 years.
• Of all age categories, the highest proportion of participants was in the 10-14 year age group, followed by a sharp drop in participation for 15-19 years. This drop in participation was even more pronounced among females, with a higher proportion of participants aged 10-14 years than for males, but similar proportions of female and male participants aged 15-19 years.
• The age profiles exhibited by metropolitan and non-metropolitan participants were quite similar for most age groups, in all three years. The two notable exceptions were a higher proportion of metropolitan participants aged 4-9 years and a correspondingly higher proportion of non-metropolitan participants aged 15-19 years.
19

Sport Participation in Victoria and the Contribution of Sport to Physical Activity Levels
Introduction This report provides age profiles (in 5-year age cohorts, with 4-year-olds as a separate cohort) of participants in five major sports, for the state of Victoria for the calendar years 2010-2012.
Breakdowns are provided by gender and region. The regions are: metropolitan – 31 local government areas (LGAs) designated by the Victorian government as the Melbourne metropolitan area; and non-metropolitan – the remaining 48 LGAs in Victoria.
Methods A participant is generally defined as a registered member of a club affiliated with one of five State Sporting Associations (SSAs) in Victoria, in 2010, 2011 or 2012. The sports included are: Australian Rules Football, Basketball, Cricket, Hockey, and Netball.
Technical issues, limitations and caveats
• The registration data provided by SSAs are de-identified but are geographically encoded by residential postcode. In obtaining estimates for other geographical regions such as LGAs, two sources of uncertainty come into play. First, the boundaries of residential postcode areas can be complex, and are not explicitly defined by Australia Post, but ABS has produced a well-defined set of approximately corresponding postal areas (POAs). Second, the data are redistributed from POAs to LGAs according to the overlapping proportions of the two sets of regions. This implicitly assumes that the registered participants are evenly distributed throughout the postal area. This is never exactly true, and so the resulting estimates are not exact. However, at the level of the regions in this report (metropolitan and non-metropolitan Victoria), the inaccuracy is negligible.
• The measure of participation used is the total number of registrations in the five sports. However, individuals can participate in more than one sport, and the proportion registered in more than one sport cannot be determined exactly, but based on spatial demographic analysis it is estimated to be around 12% across Victoria. The rate of participation in multiple sports is considered unlikely to be consistent across years, genders, regions and age-groups, which may result in some relatively minor distortion in age profiles and comparisons between genders and regions.
• When interpreting gender comparisons, it must be borne in mind that of the five sports included, three are predominantly played by males and only one is predominantly played by females, so it is to be expected that the reported overall age profiles predominantly reflect the male profiles.
Results Most of the results cited below are illustrated graphically in Figures 1-11. Numerical details can be found in the spreadsheet Sport Participant Age Profiles: Victoria 2010-2012.
Age
• Participation in sport is dominated by children and adolescents. Over half of all sport participants were aged less than 15 years: 53% in 2010, 54% in 2011, 52% in 2012 (Figure 1).
• Around 80% of sport participants were aged less than 25 years: 80% in in 2010, 81% in 2011, 80% in 2012 (Figure 1).
• Nearly all sport participants were aged less than 35 years: 91% in 2010, 92% in 2011, 91% in 2012 (Figure 1).
20

Sport Participation in Victoria and the Contribution of Sport to Physical Activity Levels
• Of all age categories, the most prominent was 10-14 years: 29% in 2010, 30% in 2011, 28% in 2012 (Figure 1).
• The second most prominent age category for participation is 5-9 years: 23% in 2010, 23% in 2011, 22% in 2012 (Figure 1).
• There was a considerable drop in the proportion of sport participants from age 10-14 to 15-19 years: 12 percentage points in 2010, 13 percentage points in 2011, 11 percentage points in 2012 (Figure 1).
• From ages 10-14 years to 20-24 years there was an approximately 20 percentage point drop in participation from around 30% to around 10%. This rate difference was: 19 percentage points in 2010, 20 percentage points in 2011, 18 percentage points in 2012 (Figure 1).
• The proportion of participants aged 5-14 trended downwards form 2010 to 2012, whereas the proportion of participants aged 15-34 was equal or higher in 2012 compared to 2010 and 2011 (Figure 1).
Gender
• The proportion of male participants who were young (aged 4-9 years) was considerably higher than the corresponding proportion of female participants. However, this difference diminished from an 8 percentage point difference in 2010, to 7 percentage points in 2011 and 6 percentage points in 2012 (Figures 4-6).
• The proportions of male participants aged 5-9 and 10-14 were reasonably similar: 23% v 26% in 2012 (Figure 4-6).
• The proportions of female participants aged 5-19 and 10-14 were quite different: 19% v 34% in 2012 (Figure 4-6).
• The proportion of female participants aged 10-14 was considerably higher than the corresponding proportion of male participants: a 7 percentage point difference in 2010 and 2011, and an 8 percentage point difference in 2012 (Figure 4-6).
• Over a third of all female participation was by those aged 10-14 years: 34% in 2010, 35% in 2011, 34% in 2012 (Figure 4-6).
• Over a quarter of all male participation was by those aged 10-14 years: 27% in 2010 and 2011, 26% in 2012 (Figure 4-6).
• The drop in the proportion of participants aged 10-14 to 15-19 was larger for females (16-17 percentage points) than males (9-11 percentage points) (Figure 4-6).
Region
• The age profiles exhibited by metropolitan and non-metropolitan participants were quite similar for most age groups, in all three years (Figure 9-11).
• The two notable exceptions were a higher proportion of metropolitan participants aged 4-9 years (4-5 percentage points difference) and a correspondingly higher proportion (3 percentage points in each year) of non-metropolitan participants aged 15-19 years (Figure 9-11).
21

Sport Participation in Victoria and the Contribution of Sport to Physical Activity Levels
Figure 1: Age-specific percentages of all registrations: 2010-2102, Victoria, persons
Figure 2: Age-specific percentages of all registrations: 2010-2012, Victoria, females
Figure 3: Age-specific percentages of all registrations: 2010-2012, Victoria, males
0
5
10
15
20
25
30
35
4
5-9
10-1
4
15-1
9
20-2
4
25-2
9
30-3
4
35-3
9
40-4
4
45-4
9
50-5
4
55-5
9
60-6
4
65-6
9
70-7
4
75-7
9
80-8
4
85 p
lus
%
Age Range
2010
2011
2012
0
5
10
15
20
25
30
35
4
5-9
10-1
4
15-1
9
20-2
4
25-2
9
30-3
4
35-3
9
40-4
4
45-4
9
50-5
4
55-5
9
60-6
4
65-6
9
70-7
4
75-7
9
80-8
4
85 p
lus
%
Age Range
2010
2011
2012
0
5
10
15
20
25
30
35
4
5-9
10-1
4
15-1
9
20-2
4
25-2
9
30-3
4
35-3
9
40-4
4
45-4
9
50-5
4
55-5
9
60-6
4
65-6
9
70-7
4
75-7
9
80-8
4
85 p
lus
%
Age Range
2010
2011
2012
22

Sport Participation in Victoria and the Contribution of Sport to Physical Activity Levels
Figure 4: Age-specific percentages of all registrations: 2010, Victoria, by gender
Figure 5: Age-specific percentages of all registrations: 2011, Victoria, by gender
Figure 6: Age-specific percentages of all registrations: 2012, Victoria, by gender
0
5
10
15
20
25
30
35
4
5-9
10-1
4
15-1
9
20-2
4
25-2
9
30-3
4
35-3
9
40-4
4
45-4
9
50-5
4
55-5
9
60-6
4
65-6
9
70-7
4
75-7
9
80-8
4
85 p
lus
%
Age Range
Female
Male
0
5
10
15
20
25
30
35
4
5-9
10-1
4
15-1
9
20-2
4
25-2
9
30-3
4
35-3
9
40-4
4
45-4
9
50-5
4
55-5
9
60-6
4
65-6
9
70-7
4
75-7
9
80-8
4
85 p
lus
%
Age Range
Female
Male
0
5
10
15
20
25
30
35
4
5-9
10-1
4
15-1
9
20-2
4
25-2
9
30-3
4
35-3
9
40-4
4
45-4
9
50-5
4
55-5
9
60-6
4
65-6
9
70-7
4
75-7
9
80-8
4
85 p
lus
%
Age Range
Female
Male
23

Sport Participation in Victoria and the Contribution of Sport to Physical Activity Levels
Figure 7: Age-specific percentages of all registrations: 2010-2012, metropolitan, persons
Figure 8: Age-specific percentages of all registrations: 2010-2012, non-metropolitan, persons
0
5
10
15
20
25
30
354
5-9
10-1
4
15-1
9
20-2
4
25-2
9
30-3
4
35-3
9
40-4
4
45-4
9
50-5
4
55-5
9
60-6
4
65-6
9
70-7
4
75-7
9
80-8
4
85 p
lus
%
Age Range
2010
2011
2012
0
5
10
15
20
25
30
35
4
5-9
10-1
4
15-1
9
20-2
4
25-2
9
30-3
4
35-3
9
40-4
4
45-4
9
50-5
4
55-5
9
60-6
4
65-6
9
70-7
4
75-7
9
80-8
4
85 p
lus
%
Age Range
2010
2011
2012
0
5
10
15
20
25
30
35
45-
910
-14
15-1
920
-24
25-2
930
-34
35-3
940
-44
45-4
950
-54
55-5
960
-64
65-6
970
-74
75-7
980
-84
85 p
lus
%
Age Range
Metropolitan Melbourne
Country Victoria
24

Sport Participation in Victoria and the Contribution of Sport to Physical Activity Levels
Figure 9: Age-specific percentages of all registrations: 2010, persons, by region
Figure 10: Age-specific percentages of all registrations: 2011, persons, by region
Figure 11: Age-specific percentages of all registrations: 2012 persons, by region
0
5
10
15
20
25
30
354
5-9
10-1
415
-19
20-2
425
-29
30-3
435
-39
40-4
445
-49
50-5
455
-59
60-6
465
-69
70-7
475
-79
80-8
485
plu
s
%
Age Range
Metropolitan Melbourne
Country Victoria
0
5
10
15
20
25
30
35
45-
910
-14
15-1
920
-24
25-2
930
-34
35-3
940
-44
45-4
950
-54
55-5
960
-64
65-6
970
-74
75-7
980
-84
85 p
lus
%
Age Range
Metropolitan Melbourne
Country Victoria
25

Sport Participation in Victoria and the Contribution of Sport to Physical Activity Levels
Part 3. Longitudinal Sport Participation Patterns: Victoria 2010-2012 Summary
Methods, limitations and caveats
• This report provides a breakdown of longitudinal patterns of participation across the lifespan in five major sports, for the state of Victoria for the calendar years 2010-2012.
• The measure of participation used is membership registration in any of the five sports.
• There are unavoidable biases due to the limited number of sports included, and the multiple counting of those who participate in more than one of the five sports.
• In particular, of the five sports included, three are predominantly played by males and only one is predominantly played by females, so it is to be expected that the reported overall participation profiles predominantly reflect male age profiles.
Results
• For most age groups, a majority (between a half and two thirds) of 2010 participants participated continuously over the three years 2010-2012. The exceptions were among the very youngest and very oldest participants, for whom the rate of continuous participation was lower.
• The rate of continuous participation was low for those aged 4 (42%), before a peak amongst the 10-14 year age group (66%), which also represented the largest group of participants (n=128,399). Continuous participation dropped to 55% at age 15-19. From 15-19 there was a gradual increasing trend in the proportion of continuous participation through to age 70-79 (69%).
• The rate of discontinuous participation was highest for those aged 4 (26%). The rate of discontinuous participation was relatively stable between the ages 5-74 years, ranging from 18%-23%.
• The rate of single-year participation rate was also relatively high for those aged 4 (33%). The rate of single-year participation was quite stable for ages 5-54 (20%-23%), with the exception of a lower rate for those aged 10-14 years (15%). This corresponds with the high continuous participation rate for this age group.
• Overall males had a more stable participation pattern across the age groupings than did females.
• Both males and females had a peak of continuous participation at 10-14 years: 66% for males and 68% for females.
• Females exhibited a low of 50% continuous participation at ages 20-30, followed by an upward trend reaching a second higher peak (70+%) at around age 70. This did not occur for males, whose continuous participation rate remained stable at just under 60% from age 15 to 70.
• There was a much higher proportion of males participating continuously from age 4 (44%) than females (21%).
• Males had higher rates of continuous participation than females for all ages 15-44.
26

Sport Participation in Victoria and the Contribution of Sport to Physical Activity Levels
• The highest rate of discontinuous participation for both females and males was amongst the 4-year-olds (both 26%). The rates of discontinuous participation were similar for females and males for ages 5-14 years, but higher for females than males for ages 15-44 years.
• There were broadly similar longitudinal patterns of participation in metropolitan Melbourne and non-metropolitan areas. However, rates of continuous participation were slightly higher among metropolitan than non-metropolitan participants in the early years (4-14) and in later adulthood (35-74 years), and slightly higher among non-metropolitan than metropolitan participants in the intervening age groups (15-34 years).
• In both regions, males had a more stable participation pattern across the age groupings than did females, although the profiles for each gender were not identical in the two regions. The most marked difference was the direction of the trend in continuous participation for males aged 15-64 years: upward in the metropolitan region and downward in the non-metropolitan region, resulting in a flat profile for Victorian males overall.
27

Sport Participation in Victoria and the Contribution of Sport to Physical Activity Levels
Introduction This report provides a breakdown of longitudinal patterns of participation across the lifespan in five major sports, for the state of Victoria for the calendar years 2010-2012.
Breakdowns are provided by 5-year age cohorts (with 4-year-olds as a separate cohort), gender and region. The regions are: Metropolitan – 31 local government areas (LGAs) designated by the Victorian government as the Melbourne metropolitan area; and Non-metropolitan – the remaining 48 LGAs in Victoria.
Methods A participant is generally defined as a registered member of a club affiliated with one of five State Sporting Associations (SSAs) in Victoria, in 2010, 2011 or 2012. The sports included are: Australian Rules Football, Basketball, Cricket, Hockey, and Netball.
For each of the five sports, the unique membership identifiers provided by each SSA were used to track all 2010 members through the 3-year period 2010-2012. The age profiles presented are based on the age of each member in 2010. For each 2010 member, longitudinal participation was classified as one of:
• single year – membership in 2010 only. • discontinuous – membership in 2010 and either 2011 or 2012, but not both. • continuous – continuous membership for the 3-year period 2010-12.
Each of figures 1-9 shows the percentage of each age category who were classified as single year, discontinuous and continuous participants, together with a table of numbers of members in each age category in 2010.
Technical issues, limitations and caveats
• The registration data provided by SSAs are de-identified but are geographically encoded by residential postcode. In obtaining estimates for other geographical regions such as LGAs, two sources of uncertainty come into play. First, the boundaries of residential postcode areas can be complex, and are not explicitly defined by Australia Post, but ABS has produced a well-defined set of approximately corresponding postal areas (POAs). Second, the data are redistributed from POAs to LGAs according to the overlapping proportions of the two sets of regions. This implicitly assumes that the registered participants are evenly distributed throughout the postal area. This is never exactly true, and so the resulting estimates are not exact. However, at the level of the regions in this report (metropolitan and non-metropolitan Victoria), the inaccuracy is negligible.
• Individuals can participate in more than one sport. Because the data are de-identified, the proportion registered in more than one sport cannot be determined exactly, but based on spatial demographic analysis it is estimated to be around 12% across Victoria. The rate of participation in multiple sports is considered unlikely to be consistent across years, genders, regions and age-groups, which may result in some relatively minor distortion in age profiles and comparisons between genders and regions.
• When interpreting gender comparisons, it must be borne in mind that of the five sports included, three are predominantly played by males and only one is predominantly played by females, so it is to be expected that the reported overall age profiles predominantly reflect the male profiles.
28

Sport Participation in Victoria and the Contribution of Sport to Physical Activity Levels
Results
All persons
Figure 1 shows that for most age groups, a majority (between a half and two thirds) of 2010 participants participated continuously over the three years 2010-2012. The exceptions were among the very youngest and very oldest participants, for whom the rate of continuous participation was lower.
Continuous participation
• For most age groups, more than 50% of 2010 participants participated continuously for the three years.
• The highest rate of continuous participation was amongst the 75-79 year age group (69%); however this represented a very small number of participants (n=13).
• The rate of continuous participation was low for those aged 4 (42%), before a peak amongst the 10-14 year age group (66%), which also represented the largest group of participants (n=128,399). Continuous participation dropped to 55% at age 15-19. From 15-19 there was a gradual increasing trend in the proportion of continuous participation through to age 70-79 (69%).
Discontinuous participation
• The rate of discontinuous participation was highest for those aged 4 (26%).
• The rate of discontinuous participation was relatively stable between the ages 5-74 years, ranging from 18%-23%.
Single year participation
• There was a higher single-year participation rate amongst those aged 75+ (31-53%) which would be expected due to ageing participants’ less stable physical and mental capacities.
• The rate of single-year participation rate was also relatively high for those aged 4 (33%)
• The rate of single-year participation was quite stable for ages 5-54 years (20%-23%), with the exception of a lower rate for those aged 10-14 years (15%). This corresponds with the high continuous participation rate for this age group.
Gender
Figures 3 and 4 show that overall, males had a more stable participation pattern across the age groupings than did females.
Continuous participation
• Both males and females had a peak of continuous participation at 10-14 years: 66% for males and 68% for females.
• Females exhibited a low of 50% continuous participation at ages 20-30, followed by an upward trend reaching a second higher peak (70+%) at around age 70. This did not occur
29

Sport Participation in Victoria and the Contribution of Sport to Physical Activity Levels
for males, whose continuous participation rate remained stable at just under 60% from age 15 to 70.
• There was a much higher proportion of males participating continuously from age 4 (44%) than females (21%).
• Males had higher rates of continuous participation than females for all ages 15-44.
Discontinuous participation
• The highest rate of discontinuous participation for both females and males was amongst the 4-year-olds (both 26%).
• The rates of discontinuous participation were similar for females and males for ages 5-14 years, ranging from 18-19%.
• The rates of discontinuous participation were higher for females than males for ages 15-44 years.
Single year
• Apart from the oldest categories where numbers were very small, the highest rate of single-year participation was amongst the 4-year-olds for both genders; however it was much higher for females (52%) than for males (30%).
• The rates of single-year participation were slightly higher for males aged 5-14 years than females; this trend reversed from ages 15-34 years.
Region
Figures 4 and 5 show that there were broadly similar longitudinal patterns of participation in metropolitan Melbourne and non-metropolitan areas, except for the very small numbers of participants aged 75+ years. There were however some subtle differences between metropolitan and non-metropolitan regions.
Single year participation
• The profiles of rates of single-year participation were very similar for metropolitan and non-metropolitan participants.
Continuous participation
• Rates of continuous participation were slightly higher among metropolitan than non-metropolitan participants for in the early years (4-14) and in later adulthood (35-74 years), and slightly higher among non-metropolitan than metropolitan participants in the intervening age groups (15-34 years).
Discontinuous participation
• The pattern of differences between the rates of discontinuous participation among metropolitan and non-metropolitan participants was opposite to that for continuous participation. That is, rates of discontinuous participation were slightly lower among metropolitan than non-metropolitan participants for in the early years (4-14) and in later
30

Sport Participation in Victoria and the Contribution of Sport to Physical Activity Levels
adulthood (35-74 years), and slightly higher among non-metropolitan than metropolitan participants in the intervening ages (15-34 years).
Region and Gender
Figures 6-9 show that:
• In accordance with the lack of major differences between metropolitan and non-metropolitan regions with regard to longitudinal patterns of participation (see previous section), the gender differences outlined above for Victoria as a whole were also apparent in both metropolitan and non-metropolitan regions, albeit with some subtle differences between the regions.
• In both regions, males had a more stable participation pattern across the age groupings than did females, although the profiles for each gender were not identical in the two regions.
• Perhaps the most marked difference was the direction of the trend in continuous participation for males aged 15-64 years: upward in the metropolitan region and downward in the non-metropolitan region, resulting in a flat profile for Victorian males overall.
Age 4 5-9 10-14 15-19 20-24 25-29 30-34 35-39 40-44 n 6,365 103,476 128,399 73,860 43,031 30,533 18,779 13,960 11,163 Age 45-49 50-54 55-59 60-64 65-69 70-74 75-79 80-84 85 plus n 7,196 3,613 1,243 599 199 112 13 14 17 Figure 1: Age-specific longitudinal participation patterns: 2010-2102, Victoria, persons
0
10
20
30
40
50
60
70
80
90
100
4
5-9
10-1
4
15-1
9
20-2
4
25-2
9
30-3
4
35-3
9
40-4
4
45-4
9
50-5
4
55-5
9
60-6
4
65-6
9
70-7
4
75-7
9
80-8
4
85 p
lus
%
Age Range
Single year
Discontinuous
Continuous
31

Sport Participation in Victoria and the Contribution of Sport to Physical Activity Levels
Age 4 5-9 10-14 15-19 20-24 25-29 30-34 35-39 40-44 n 5,617 75,686 79,171 48,094 29,268 20,886 12,829 8,725 6,965 Age 45-49 50-54 55-59 60-64 65-69 70-74 75-79 80-84 85 plus n 4,521 2,532 844 435 132 71 7 9 12 Figure 2: Age-specific longitudinal participation patterns: 2010-2102, Victoria, males
Age 4 5-9 10-14 15-19 20-24 25-29 30-34 35-39 40-44 n 747 27,522 48,299 24,609 12,286 8,656 5,491 5,060 4,125 Age 45-49 50-54 55-59 60-64 65-69 70-74 75-79 80-84 85 plus n 2,649 1,068 396 164 66 41 6 5 4 Figure 3: Age-specific longitudinal participation patterns: 2010-2102, Victoria, females
0
10
20
30
40
50
60
70
80
90
100
4
5-9
10-1
4
15-1
9
20-2
4
25-2
9
30-3
4
35-3
9
40-4
4
45-4
9
50-5
4
55-5
9
60-6
4
65-6
9
70-7
4
75-7
9
80-8
4
85 p
lus
%
Age Range
Single year
Discontinuous
Continuous
0
10
20
30
40
50
60
70
80
90
100
%
Age Range
Single year
Discontinuous
Continuous
32

Sport Participation in Victoria and the Contribution of Sport to Physical Activity Levels
Age 4 5-9 10-14 15-19 20-24 25-29 30-34 35-39 40-44 n 4,732 70,460 83,440 45,160 28,017 20,069 11,757 8,565 7,148 Age 45-49 50-54 55-59 60-64 65-69 70-74 75-79 80-84 85 plus n 4,760 2,520 894 454 145 76 9 10 11 Figure 4: Age-specific longitudinal participation patterns: 2010-2102, metropolitan, persons
Age 4 5-9 10-14 15-19 20-24 25-29 30-34 35-39 40-44 n 1,633 33,008 44,953 28,698 15,012 10,464 7,021 5,395 4,015 Age 45-49 50-54 55-59 60-64 65-69 70-74 75-79 80-84 85 plus n 2,436 1,093 349 145 54 36 4 4 6 Figure 5: Age-specific longitudinal participation patterns: 2010-2102, non-metropolitan, persons
0
10
20
30
40
50
60
70
80
90
100
4
5-9
10-1
4
15-1
9
20-2
4
25-2
9
30-3
4
35-3
9
40-4
4
45-4
9
50-5
4
55-5
9
60-6
4
65-6
9
70-7
4
75-7
9
80-8
4
85 p
lus
%
Age Range
Single year
Discontinuous
Continuous
0
10
20
30
40
50
60
70
80
90
100
4
5-9
10-1
4
15-1
9
20-2
4
25-2
9
30-3
4
35-3
9
40-4
4
45-4
9
50-5
4
55-5
9
60-6
4
65-6
9
70-7
4
75-7
9
80-8
4
85 p
lus
%
Age Range
Single year
Discontinuous
Continuous
33

Sport Participation in Victoria and the Contribution of Sport to Physical Activity Levels
Age 4 5-9 10-14 15-19 20-24 25-29 30-34 35-39 40-44 n 4,246 53,848 54,036 29,437 19,142 13,901 8,189 5,401 4,492 Age 45-49 50-54 55-59 60-64 65-69 70-74 75-79 80-84 85 plus n 3075 1846 623 340 97 50 5 5 7 Figure 6: Age-specific longitudinal participation patterns: 2010-2102, metropolitan, males
Age 4 5-9 10-14 15-19 20-24 25-29 30-34 35-39 40-44 n 485 16,360 28,555 14,684 7,472 5,208 3,130 2,997 2,590 Age 45-49 50-54 55-59 60-64 65-69 70-74 75-79 80-84 85 plus n 1,663 665 269 114 47 26 4 5 3 Figure 7: Age-specific longitudinal participation patterns: 2010-2102, metropolitan, females
0
10
20
30
40
50
60
70
80
90
100
4
5-9
10-1
4
15-1
9
20-2
4
25-2
9
30-3
4
35-3
9
40-4
4
45-4
9
50-5
4
55-5
9
60-6
4
65-6
9
70-7
4
75-7
9
80-8
4
85 p
lus
%
Age Range
Single year
Discontinuous
Continuous
0
10
20
30
40
50
60
70
80
90
100
4
5-9
10-1
4
15-1
9
20-2
4
25-2
9
30-3
4
35-3
9
40-4
4
45-4
9
50-5
4
55-5
9
60-6
4
65-6
9
70-7
4
75-7
9
80-8
4
85 p
lus
%
Age Range
Single year
Discontinuous
Continuous
34

Sport Participation in Victoria and the Contribution of Sport to Physical Activity Levels
Age 4 5-9 10-14 15-19 20-24 25-29 30-34 35-39 40-44 n 1,371 21,832 25,132 18,657 10,125 6,985 4,639 3,324 2,473 Age 45-49 50-54 55-59 60-64 65-69 70-74 75-79 80-84 85 plus n 1,446 686 221 95 35 21 2 4 5 Figure 8: Age-specific longitudinal participation patterns: 2010-2102, non-metropolitan, males
Age 4 5-9 10-14 15-19 20-24 25-29 30-34 35-39 40-44 n 262 11,160 19,741 9,923 4,813 3,448 2,361 2,063 1,535 Age 45-49 50-54 55-59 60-64 65-69 70-74 75-79 80-84 85 plus n 986 403 127 50 19 15 2 0 1 Figure 9: Age-specific longitudinal participation patterns: 2010-2102, non-metropolitan, females
0
10
20
30
40
50
60
70
80
90
100
4
5-9
10-1
4
15-1
9
20-2
4
25-2
9
30-3
4
35-3
9
40-4
4
45-4
9
50-5
4
55-5
9
60-6
4
65-6
9
70-7
4
75-7
9
80-8
4
85 p
lus
%
Age Range
Single year
Discontinuous
Continuous
0
10
20
30
40
50
60
70
80
90
100
4
5-9
10-1
4
15-1
9
20-2
4
25-2
9
30-3
4
35-3
9
40-4
4
45-4
9
50-5
4
55-5
9
60-6
4
65-6
9
70-7
4
75-7
9
80-8
4
85 p
lus
%
Age Range
Single year
Discontinuous
Continuous
35

Sport Participation in Victoria and the Contribution of Sport to Physical Activity Levels
Part 4. The Contribution of Sport to Physical Activity Levels: Australia 2010 Summary This research summary reports on an analysis of data from the national 2010 Exercise Recreation
and Sport Survey (ERASS) regarding the contribution of sport to total levels of leisure-time
physical activity (LTPA) and health enhancing leisure-time physical activity (HELPA), defined as
activities typically performed at an intensity of at least 3.5 metabolic units (METs).
With regard to LTPA and HELPA undertaken during the 12 months prior to the survey, some key
findings are:
• Overall, club based sport participation contributes considerably to LTPA.
• The results of this study demonstrate the important role that sports clubs play as a setting for
LTPA and fostering good health.
• Of all 95 activities participated in, nearly all (94%) were classified as HELPA.
• Nearly all sport participation is at a health enhancing level (88%).
• Club based sport participation contributes one third of HELPA sport activity (33%).
• Club based sport participation contributes to nearly a fifth of all HELPA activity (18%).
• For all HELPA, 71% of reported activities were undertaken in non-organised contexts, and 29%
were in organised contexts.
• Of all HELPA sport activities, 56% were non-organised and 44% were organised.
The association between participation in club sport and four physical activities which might be
associated with club sport participation through training for the sport - aerobics/fitness, running,
weight training and walking - was also investigated, with the following findings:
• Of all club sport participants, 21% had participated in aerobics/fitness, and 22% had walked,
15% had run and 3% had done weight-training in the 12 months prior to the survey.
• Males were more likely than females to do weight training, and females were more likely than
males to do aerobics/fitness training or walk.
• Aerobics/fitness training, running and weight training were more prevalent among club sport
participants in the metropolitan region, whereas walking was more prevalent in the non-
metropolitan region.
• Sport participants were significantly less likely than non-sport participants to participate in
aerobics/fitness training and walking. This suggests that these non-sport activities are done
instead of sport participation rather than as an additional activity for the purpose of sport
36

Sport Participation in Victoria and the Contribution of Sport to Physical Activity Levels
training. However sport participants were significantly more likely than non-sport participants to
run, suggesting that running is used as a training activity for sport. This may be related to the
higher intensity of running than walking and in many instances than aerobics/fitness training.
37

Sport Participation in Victoria and the Contribution of Sport to Physical Activity Levels
Introduction Regular participation in physical activity (PA) is imperative for good health 24. Furthermore, physical
inactivity is a leading cause of death 25. Guidelines stipulate the necessary PA requirements to
achieve these health benefits 26. However research suggests that 31% of the world’s population is
not meeting the minimum PA guidelines 27.
People can be active through a range of PA domains, including active transport, domestic,
occupational and leisure-time physical activity (LTPA) 28. There are a range of studies indicating
unique health benefits of LTPA compared to other PA domains 21, 28-31. A study of PA for adult
women in the domains of occupational (including household chores), active commuting, and LTPA,
reported a negative association between depressiveness and PA, for theLTPA domain only 30.
Furthermore, LTPA compared to no LTPA has been found to be associated with self-reported
health and inversely with obesity 28. More specifically sport has been associated with higher quality
of life (HRQoL) for adults 21, 31 and reduction in all-cause mortality compared with non-participation 29.
Although a settings approach is a central approach to health promotion, leisure settings such as
sports clubs remain underutilised for health promotion 32. However, initiatives utilising health
promotion programs and policies through sports clubs as a strategy for increasing participation
have been reported 33. It has recently been reported that sport is associated with additional health
benefits compared other forms of PA 21, 30, 31. Specifically, club sport participation has been found
to contribute to greater physical health benefits at low to moderate exposures than participation in
other settings 21 or at low and high (rather than moderate) levels in another study 31.
It also seems that the social nature of organised sport participation may play a role of improving
social and mental health 19, 21 A systematic review of the psychological and social health benefits
of participation in sport reported that sport may be associated with improved psychosocial health in
addition to those attributed to participation in general PA 19. The Health through Sport conceptual
model 19 provides a representation of the specific improved health outcomes of club based or
team-based sport due to the social nature of participation.
However, whilst these additional health benefits of sport over other forms of PA have been
reported, the mechanisms, such as the actual contribution of participation in sport to levels of PA
identified as health-enhancing, are not well understood. There is some evidence that participation
in sport compared to non-sport is associated with individuals being more likely to exceed the daily
step recommendations of 10,000 steps/day 34. Furthermore, sport has been reported to contribute
to 23% of moderate and vigorous physical activity 35; however this study was limited to young boys
and little is known regarding adult participation.
38

Sport Participation in Victoria and the Contribution of Sport to Physical Activity Levels
Aim The aims of this study were twofold: 1) to investigate the direct contribution of sport to health-
enhancing LTPA (HELPA); and ii) to investigate the indirect contribution of sport to LTPA through
the association between sport participation and participation in other modes of HELPA.
Methods Data from the 2010 Exercise, Recreation and Sport Survey (ERASS) 36 were obtained from the
Australian Sports Commission (ASC). The usefulness of the ERASS survey as a national
surveillance of habitual PA behaviours has been established 37, 38.
Sampling Quarterly survey samples for ERASS were selected from all persons aged 15 years and over,
living in occupied private dwellings using computer-assisted telephone interviewing. In each
quarter approximately 3,400 persons were sampled Australia-wide from all states and territories.
Verbal informed consent was indicated by the respondents’ willingness to participate in the
telephone survey. De-identified data from calendar year 2010 were analysed in this investigation.
Ethics approval was granted by the Human Research Ethics Committee of Federation University
Australia.
Measures After explaining the purpose and format of the ERASS questionnaire, interviewers asked
respondents if they had participated in any LTPA for exercise, recreation or sport in the last 12
months (as opposed to PA associated with work, household or garden chores). If the response
was ‘yes’, respondents were then asked to report what types of activity they had participated in
during this period (up to a maximum of 10 types of activity). Activities were categorised into 95
types. Respondents were then requested, for each reported activity type, to indicate whether any
of the activity had been organised by a club, association or any other type of organisation. If the
activity had been organised, a further question then inquired as to what type of club, association or
organisation had organised the activity (Fitness, leisure or indoor sports centre that required
payment for participation; Sport or recreation club or association that required payment of
membership, fees or registration; work; school; other). From responses to the above questions
three dichotomous measures were derived in this study, indicating: (1) whether there was any
participation in PA for exercise, recreation or sport in the past 12 months (yes / no); (2) for each
type of activity, whether any of the activity was organised (yes / no); and (3) if so, was the activity
organised by a sport or recreation club or association that required payment of membership fees or
registration (herein referred to as club) (yes / no). Because a person can engage in a particular type of
PA in more than one setting, the three dichotomies are not mutually exclusive. For each reported type of
activity, respondents were assigned to one of three mutually exclusive categories in accordance with the
hierarchical precedence of participation settings articulated by Eime et al. 21. All persons who participated in
a club setting were classified as club participants, regardless of whether they also participated in other
39

Sport Participation in Victoria and the Contribution of Sport to Physical Activity Levels
settings. Of those remaining, persons who participated in an organised non-club setting were classified as
organised non-club participants, regardless of whether they also participated in non-organised settings.
Those remaining participated in only non-organised settings, and were classified as such.
Breakdowns by the sex, and age group (15-34, 35-54, 55-74 and 75+ years) of respondents were
also included. Respondents were also asked how many times they had participated in each type of
activity during the last 12 months, from which, after consultation with peak sport bodies, a further
dichotomous variable was generated in this study for each activity: frequency >=12 times,
notionally representing ‘regular’ participation (at least once per week for a 12 week season); and
frequency <12 times, representing a less regular level of participation.
Of the up to 10 types of activity nominated, respondents were then asked to nominate up to three
‘top activities’. For these, they were asked how many times they had participated in each type of
activity during the previous two weeks, from which a further dichotomous variable was generated in
this study for each activity: frequency >=2 times, notionally representing ‘regular’ participation (at
once each week); and frequency <2 times, representing a less regular level of participation.
In this study, each of the 95 ERASS PA types was designated as either a HELPA non-HELPA
activity, according to the MET (metabolic equivalent of task) of the activity. A MET value of 3.5 or
more was classified as HELPA, in accordance with the specification of Merom et al. 38. Each of the
78 PAs classified as HELPA was further classified as being a ‘HELPA sport’ if it was administered
by a state sporting association (SSA) and/or national sporting organisation (NSO) recognised as
such by the ASC 39. Both HELPA PAs and HELPA sports were then split according to level of
organisation of participation (club-based/ other organised/ non-organised).
Analysis As for all large national surveys, for various operational and organisation reasons, the ERASS
sample is not proportionally representative of all segments of the Australian population. To
compensate for that fact, we employed the standard practice of using ERASS data weighted at the
state, region (metropolitan, rest of state), age-group and gender levels. Analyses were conducted
using SPSS Version 19.
Reported physical activity, in both the previous 12 months and the previous two weeks, was
apportioned into various categories (HELPA/non-HELPA; sport/non-sport; level of organisation,
and profiles of percentages were produced.
Analysis was also undertaken of the association between playing club sport and participation in
four selected physical activities which might be undertaken as preparation or training for club sport
- aerobics/fitness training, running, weight training and walking. Participation in each of these four
types of PA was cross-tabulated with club sport participation, and a measure of concordance (the 40

Sport Participation in Victoria and the Contribution of Sport to Physical Activity Levels
gamma statistic) was calculated. Further, those who participated in both the selected type of PA
and in any sport at club level, were compared to the total number of people participating in the
particular type of PA and to the total number of people participating in any sport at club level.
These analyses were conducted for the whole ERASS sample and also for subsamples based on
gender, age and region of residence.
41

Sport Participation in Victoria and the Contribution of Sport to Physical Activity Levels
Results Table 1 shows that of the 95 ERASS LTPA activity types, 78 were classified as HELPA, 50 were
classified as sports, and 50 were both i.e. HELPA sports.
Table 1: Classification of LTPA types
n % All LTPA activities 95 HELPA 78 82.1 Sport 57 60.0 HELPA sport 50 52.6
Table 2 shows a summary of the results of a hierarchical sequence of analyses. The counts in
Table 2 are not counts of participants, but of their reported activities. An ‘activity’ refers to one of
the 95 ERASS activity types – not to a specific instance/episode of activity. Table 2 is based on all
respondents’ nominated activities; the left hand column is based on the (up to 10) activities
reported for the previous 12 months and the right hand column is based on the (up to 3) activities
reported for the previous two weeks. Table 2 includes breakdowns of: reported activities by
HELPA category (section 1); HELPA activities by context, frequency and sport category (sections
2-4); and HELPA sport activities by context and frequency (sections 5-6).
Figures 1-6 are graphical representations of each section of Table 2.
Table 2 and Figures 1a-6a show that while HELPA activities represented 78 of 95 ERASS activity
types (82%), they represented 94% of all activities reported in the 12 months prior to participation
in the 2010 ERASS (Figure 1a). Of all HELPA activities reported, over two thirds (71%) were
undertaken in non-organised settings, around one fifth (18%) in organised non-club settings, and
around one tenth (11%) in club settings (Figure 2a). Regarding frequency, 85% of HELPA
activities were undertaken regularly (>=12 times) (Figure 3a). While HELPA sport activities
represented 28 of 78 HELPA activity types (36%), they represented over half (52%) of all HELPA
activities reported (Figure 4a), indicating that on average HELPA sports were more popular than
HELPA non-sports. Of all HELPA sport activities reported, over half (56%) were undertaken in non-
organised settings, one third (33%) in organised non-club settings, and around one tenth (11%) in
club settings (Figure 5a). Regarding frequency, 78% of HELPA sport activities were undertaken
regularly (>=12 times) (Figure 6a). Table 2 and Figures 1b-6b show very similar patterns for
reported activities in the two weeks prior to the survey.
42

Sport Participation in Victoria and the Contribution of Sport to Physical Activity Levels
Table 2: Summary of reported physical activities
Previous 12 months
Previous 2 weeks
n1,2 % n1,2 %
1. All LTPA activities: by HELPA category 37,020
26,834
HELPA (78 types) 34,790 94.0 25,263 94.1 Non-HELPA (17 types) 2,230 6.0 1,572 5.9
2. HELPA activities: by context 34,790 25,263
Non-organised 24,830 71.4 18,348 72.6 Organised non-club 3,717 10.7 2,650 10.5 Organised club 6,243 17.9 4,265 16.9
3. HELPA activities: by frequency 34,662 21,559
< 12 times per year 5,253 15.2 >= 12 times per year 29,409 84.8
< 2 times per 2 weeks 3,208 14.9 >= 2 times per 2 weeks 18,351 85.1
4. HELPA activities: by sport category 34,790 25,263
HELPA sport (50 types) 17,991 51.7 11,732 46.4 HELPA non-sport (28 types) 16,799 48.3 13,531 53.6
5. HELPA sport activities: by context 17,991 11,732
Non-organised 10,052 55.9 6,313 53.8 Organised non-club 2,063 11.5 1,419 12.1 Organised club 5,876 32.7 4,000 34.1
6. HELPA sport activities: by frequency 17,928 8,910
< 12 times per year 3,907 21.8 >= 12 times per year 14,021 78.2
< 2 times per 2 weeks 2,011 22.6 >= 2 times per 2 weeks 6,899 77.4
1 Total number of activity types nominated by respondents 2 Discrepancies in counts are due to non-response
43

Sport Participation in Victoria and the Contribution of Sport to Physical Activity Levels
a. Previous 12 months
b. Previous 2 weeks
Figure 1: All LTPA activities: by HELPA category
a. Previous 12 months
b. Previous 2 weeks
Figure 2: HELPA activities: by context of participation
a. Previous 12 months
b. Previous 2 weeks
Figure 3: HELPA activities: by frequency of participation
a. Previous 12 months
b. Previous 2 weeks
Figure 4: HELPA activities: by sport category
94%
6%
HELPA (78types)
Non-HELPA(17 types) 94%
6%
HELPA (78types)
Non-HELPA(17 types)
71%
11%
18% Non-organised
Organisednon-club
Organisedclub
73%
10%
17% Non-organised
Organisednon-club
Organisedclub
15%
85%
< 12 times
>= 12 times
15%
85%
< 2 times
>= 2 times
52% 48%
HELPA sport(50 types)
HELPA non-sport (28types)
46%
54%
HELPA sport(50 types)
HELPA non-sport (28types)
44

Sport Participation in Victoria and the Contribution of Sport to Physical Activity Levels
a. Previous 12 months
b. Previous 2 weeks
Figure 5: HELPA sport activities: by context of participation
a. Previous 12 months
b. Previous 2 weeks
Figure 6: HELPA sport activities: by frequency of participation
Tables 3 and 4 show the association between playing club sport and participation in four selected
physical activities which might be undertaken as preparation or training for club sport -
aerobics/fitness, running, weight training and walking. Table 2 is based on responses regarding
the 12 months prior to the survey, and Table 3 is based on responses regarding the two weeks
prior to the survey. Both tables show results for all ERASS respondents who reported any
participation, together with breakdowns by gender, region and age.
For each of the four activities in turn, three counts have been extracted from a 2×2 crosstabulation
of club sport participation v participation in the particular activity. The three counts are: the number
who participated in the particular activity (a), the number who participated in sport at the club level
(b, which is constant across all four activities) and the number who did both (c). The number who
did both is then expressed as a percentage of those who participated in the particular activity (d),
and of those who participated in club sport (e). Column d indicates the percentage of those who
undertook the particular physical activity who also played club sport. Conversely, column e
indicates the percentage of those who played club sport who also undertook the particular physical
activity.
Focusing first on the ‘e’ percentages, Table 3 shows that overall just over one fifth (20.5%) of club
sport participants had done aerobics/fitness training and a similar proportion (21.6%) had walked in
the 12 months prior to the survey. Around one in six (15.4%) had run, and a small proportion
56% 11%
33%
Non-organised
Organisednon-club
Organisedclub
54%
12%
34%
Non-organised
Organisednon-club
Organisedclub
22%
78%
< 12 times
>= 12 times
23%
77%
< 2 times
>= 2 times
45
Sport Participation in Victoria and the Contribution of Sport to Physical Activity Levels
(2.8%) had done weight training. Males were more likely than females to run or do weight training,
and females were more likely than males to do aerobics/fitness training or walk. Over the life
cycle, the prevalence of aerobics/fitness training diminished slightly. Both running and weight
training increased a little between the youngest group and the middle-aged group then diminished
sharply in the oldest age group. The prevalence of walking among club sport participants
increased steadily with increasing age. Aerobics/fitness training, running and weight training were
more prevalent among club sport participants in the metropolitan region, whereas walking was
more prevalent in the non- metropolitan region.
Table 4 shows that for reported activity in the two weeks prior to the survey, while all prevalences
were lower than for the 12-month period, the patterns of variation according to gender, age and
region were very similar.
Turning to the ‘d’ percentages in Tables 3 and 4, these provide a measure of the relative
prevalence of sport participation among participants in each type of physical activity. Each
percentage is either higher or lower than the corresponding ‘e’ percentage according to whether
the number of participants in the activity (a) is lower or higher than the number of club sport
participants (b).
The 2×2 crosstabulations from which the counts a, b and c are extracted also include counts of
non-participants in both club sport and in the particular activity. Columns f and g show the gamma
statistic for each crosstabulation, and its associated p-value. Gamma is a measure of concordance
– it indicates the extent to which participation in club sport was associated with participation in the
particular activity. Like a correlation coefficient, gamma can take values between -1 and +1.
Positive values of gamma indicate that sport participants were more likely than non-sport
participants to participate in the particular activity, and negative values of gamma indicate that
sport participants were less likely than non-sport participants to participate in the particular activity.
Tables 3 and 4 indicate that participation in weight training was significantly related to club sport
participation in only three subsamples, although because the numbers involved were relatively
small, the power to detect relationships was correspondingly low. The relationship was negative
for 15-29 year olds and for non-metropolitan (both 12-month and 2-week timeframes) and positive
for metropolitan (2-week timeframe only).
Participation in aerobics/fitness training was in general significantly related to club sport
participation. The only two exceptions were 50+ age group (both 12-month and 2-week
timeframes) and females (2-week timeframe only). All the significant relationships were negative.
Participation in walking was in general significantly related to club sport participation. The only
exception was the 50+ age group (2-week timeframe only). All the significant relationships were
negative.
46

Sport Participation in Victoria and the Contribution of Sport to Physical Activity Levels
Participation in running was in general significantly related to club sport participation. The
exceptions were the 15-29 age group (both 12-month and 2-week timeframes), and males and
non-metropolitan (2-week timeframe only). All the significant relationships were positive.
The final two columns of Tables 3 and 4 further quantify the strength of these relationships.
Column h shows the percentage of non-club sport participants who participated in the particular
activity, and column i shows the difference between the percentages of club sport participants and
non-club sport participants who participated in the particular activity.
47

Sport Participation in Victoria and the Contribution of Sport to Physical Activity Levels
Table 3: Participation in selected sport-related physical activity types in the past 12 months a b c d e f g h i
Group/ PA type
Number of participants in
‘PA type’
Number of participants in
any type of club sport
Number of participants in
both PA type
and any type of club sport
Percentage of ‘PA type’ participants
who also participate in
club sport
Percentage of club sport participants
who also participate in
‘PA type’
Concordance between
participation in ‘PA type’
and club sport p-value
Percentage of non-club sport
participants who also
participate in ‘PA type’
Difference (percentage
points)
= c/a (%) = c/b (%) (Gamma) (%) = e-h
All participants Aerobics/fitness 5080 4710 964 19.0 20.5 -0.112 <0.001 24.4 -3.9 Running 2291 4710 724 31.6 15.4 0.280 <0.001 9.3 6.1 Weight training 636 4710 133 20.9 2.8 -0.027 0.575 3.0 -0.2 Walking 7750 4710 1018 13.1 21.6 -0.412 <0.001 39.8 -18.2 Males Aerobics/fitness 1999 2948 502 25.1 17.0 -0.078 0.005 19.3 -2.3 Running 1372 2948 480 35.0 16.3 0.198 <0.001 11.5 4.8 Weight training 413 2948 99 24.0 3.4 -0.096 0.086 4.1 -0.7 Walking 2799 2948 432 15.4 14.7 -0.439 <0.001 30.6 -15.9 Females Aerobics/fitness 3081 1762 462 15.0 26.2 -0.060 0.038 28.6 -2.4 Running 919 1762 244 26.6 13.8 0.338 <0.001 7.3 6.5 Weight training 223 1762 34 15.2 1.9 -0.037 0.686 2.0 -0.1 Walking 4950 1762 586 11.8 33.3 -0.293 <0.001 47.7 -14.4 Aged 15-29 Aerobics/fitness 1420 2052 456 32.1 22.2 -0.209 <0.001 30.4 -8.2 Running 834 2052 331 39.7 16.1 0.011 0.785 15.8 0.3 Weight training 204 2052 57 28.0 2.8 -0.259 <0.001 4.7 -1.9 Walking 740 2052 146 19.7 7.1 -0.501 <0.001 18.7 -11.6 Aged 30-49 Aerobics/fitness 2055 1597 312 15.2 19.5 -0.236 <0.001 28.1 -8.6 Running 1125 1597 315 28.0 19.7 0.239 <0.001 13.1 6.6 Weight training 269 1597 54 20.1 3.4 -0.015 0.848 3.5 -0.1 Walking 2853 1597 407 14.3 25.5 -0.314 <0.001 39.6 -14.1
48

Sport Participation in Victoria and the Contribution of Sport to Physical Activity Levels
Aged 50+ Aerobics/fitness 1552 1026 186 12.0 18.1 -0.022 0.599 18.8 -0.7 Running 313 1026 72 23.0 7.0 0.375 <0.001 3.3 3.7 Weight training 156 1026 22 14.1 2.1 0.072 0.554 1.8 0.3 Walking 4015 1026 448 11.2 43.7 -0.110 0.001 49.2 -5.5 Metropolitan Aerobics/fitness 3634 2844 653 18.0 23.0 -0.097 <0.001 26.6 -3.6 Running 1656 2844 500 30.2 17.6 0.300 <0.001 10.3 7.3 Weight training 422 2844 93 22.0 3.3 0.056 0.359 3.0 0.3 Walking 4999 2844 569 11.4 20.0 -0.445 <0.001 39.5 -19.5 Non-metropolitan Aerobics/fitness 1446 1866 312 21.6 16.7 -0.109 0.001 20.0 -3.3 Running 634 1866 223 35.2 11.9 0.270 <0.001 7.2 4.7 Weight training 213 1866 40 18.7 2.1 -0.182 0.023 3.0 -0.9 Walking 2751 1866 448 16.3 24.0 -0.368 <0.001 40.6 -16.6
Table 4: Participation in selected sport-related physical activity types in the last two weeks
a b c d e f g h i
Group/ PA type
Number of participants in
‘PA type’
Number of participants in
any type of club sport
Number of participants in
both PA type
and any type of club sport
Percentage of ‘PA type’ participants
who also participate in
club sport
Percentage of club sport participants
who also participate in
‘PA type’
Concordance between
participation in ‘PA type’
and club sport p-value
Percentage of non-club sport
participants who also
participate in ‘PA type’ Difference
= c/a (%) = c/b (%) (Gamma) (%) = e-h
All participants Aerobics/fitness 3687 3087 450 12.2 14.6 -0.108 <0.001 17.5 -2.9 Running 1573 3087 319 20.3 10.3 0.227 <0.001 6.7 3.6 Weight training 488 3087 73 15.0 2.4 0.029 0.660 2.3 0.1 Walking 6718 3087 525 7.8 17.0 -0.421 <0.001 33.4 -16.4 Males Aerobics/fitness 1518 1997 245 16.1 12.3 -0.102 0.004 14.7 -2.4 Running 943 1997 197 20.9 9.9 0.076 0.081 8.6 1.3 Weight training 349 1997 62 17.8 3.1 -0.032 0.643 3.3 -0.2 Walking 2453 1997 237 9.7 11.9 -0.435 <0.001 25.5 -13.6
49

Sport Participation in Victoria and the Contribution of Sport to Physical Activity Levels
Females Aerobics/fitness 2169 1089 204 9.4 18.7 -0.040 0.317 20.0 -1.3 Running 629 1089 122 19.4 11.2 0.396 <0.001 5.2 6.0 Weight training 139 1089 12 8.6 1.1 -0.081 0.569 1.3 -0.2 Walking 4265 1089 288 6.8 26.4 -0.308 <0.001 40.4 -14.0 Aged 15-29 Aerobics/fitness 1023 1354 229 22.4 16.9 -0.119 0.003 20.5 -3.6 Running 599 1354 152 25.4 11.2 -0.016 0.748 11.5 -0.3 Weight training 159 1354 30 18.9 2.2 -0.207 0.024 3.3 -1.1 Walking 614 1354 58 9.4 4.3 -0.579 <0.001 14.4 -10.1 Aged 30-49 Aerobics/fitness 1425 970 108 7.6 11.1 -0.313 <0.001 19.3 -8.2 Running 725 970 128 17.7 13.2 0.226 <0.001 8.8 4.4 Weight training 205 970 32 15.6 3.3 0.131 0.218 2.6 0.7 Walking 2430 970 162 6.7 16.7 -0.427 <0.001 33.3 -16.6 Aged 50+ Aerobics/fitness 1200 745 110 9.2 14.8 0.013 0.815 14.5 0.3 Running 234 745 38 16.2 5.1 0.337 0.003 2.6 2.5 Weight training 118 745 12 10.2 1.6 0.069 0.669 1.4 0.2 Walking 3541 745 297 8.4 39.9 -0.064 0.097 43.0 -3.1 Metropolitan Aerobics/fitness 2643 1923 334 12.6 17.4 -0.055 0.077 19.1 -1.7 Running 1159 1923 248 21.4 12.9 0.291 <0.001 7.5 5.4 Weight training 316 1923 58 18.3 3.0 0.178 0.030 2.1 0.9 Walking 4359 1923 302 6.9 15.7 -0.459 <0.001 33.4 -17.7 Non-metropolitan Aerobics/fitness 1044 1163 115 11.0 9.9 -0.217 <0.001 14.6 -4.7 Running 413 1163 71 17.2 6.1 0.069 0.328 5.4 0.7 Weight training 172 1163 15 8.7 1.3 -0.315 0.003 2.5 -1.2 Walking 2359 1163 223 9.5 19.2 -0.359 <0.001 33.5 -14.3
50

Sport Participation in Victoria and the Contribution of Sport to Physical Activity Levels
Discussion This study identifies the contribution of participation in health enhancing LTPA (HELPA) in both
an organised and non-organised context. In this study, almost three quarters (71.4%) of reported
HELPA activities were conducted in the non-organised context, and over a quarter (28.6%) were
in an organised context.
Activities were classified as sport if the activity had a State Sporting Association that governed
the activity, and all remaining activities were classified as non-sport. Overall, club based sport
participation contributed considerably to LTPA. Club based sport participation contributed to
nearly a fifth of all HELPA LTPA (18%), and a third of all HELPA sport participation was
conducted in a club based setting. Furthermore most (78%) of HELPA sport participation was at a
frequency of more than 12 times in previous year.
Little attention has been focused on how sport can be managed as a means to promote active
lifestyles and serve as interventions to promote healthy PA behaviour 40. This is despite evidence
of additional health benefits of participation in organised sport, above and beyond physical health,
whereby club sport participation has been shown to have greater health benefits at low to
moderate exposures than activities such as walking or participating at a gymnasium 20, 21.
Similarly, Vella and colleagues 41 reported that participation in organised sport was associated
with an increased likelihood of meeting physical activity guidelines. Furthermore, there are
indications that sport participation for males is related to significantly higher health-related
physical fitness 42. Another measure of PA and associated health is the measurement of meeting
10,000 steps daily. Participation in organised PA, which is often sport, increases the number of
steps taken compared to non-participation in organised PA 34. The results from this current
research supports the notion that club based sport contributes considerably to LTPA, and at a
health enhancing level.
The results of this study demonstrate the important role that sports clubs play as a setting for
LTPA with a fifth of all LTPA and over a third of all HELPA sport experienced within a sports club.
Sporting organisations have been identified as a setting for promoting health, including PA
promotion 43; particularly in Australia 33, 44-49, and also Scandinavian countries 50-52. For example,
sporting organisations in Australia have been funded to implement health promotion policies and
practices to create healthy sporting environments as a mechanism to increase community
participation in sport 33. Indeed, research is growing in this area – generating consensus on
priority health promotion objectives for community sports clubs 53 and exploring the contribution of
sport club participation to health-related quality of life 21. The focus on sport in health promotion
initiatives to promote PA, however, has been limited to facilitating changes in the sporting
environment and has not focused on facilitating organisational changes such as the way sport is
organised and structured. This is despite evidence that the competitive nature and time demands
51

Sport Participation in Victoria and the Contribution of Sport to Physical Activity Levels
of sport have been reported as a factor influencing sport participation dropout. In particular,
many adolescent girls perceive that club-based sport is so competitive that they cannot gain a
position on a team 12. Further, as adolescent girls age their participation in PA moves away from
organised competitive activities to individual-based PA due to increasing demands of study and
part-time or casual work 11. Sports clubs will continue to be an important setting for the provision
of LTPA. However given the population changes towards more unstructured LTPA 14,
consideration will need to be given to the structure and flexibility of sport through clubs.
The foundations of sport are deeply embedded within a traditional structure, with sport commonly
organised around a competition fixture rather than opportunities for recreational participation.
This is likely to be influenced by the fact that investment in sport has tended to prioritise elite
performance rather than community participation 54. In particular, many sports governing bodies
are funded based on their elite level performances, and there are few incentives for directing
resources to non-organised and/or recreational sport participation. The role and contribution of
sport to PA promotion may be under-recognised for community wellbeing purposes 40, 55. As
such, building capacity to use sport as a setting for health promotion and specifically PA
promotion has been identified as a challenge going forward that will require continued investment
and resources to help sustainable PA promotion through sport 43.
In addition to the overall contribution of sport to LTPA, this study investigated more specifically
the relationship between participation in sport and other PA types that may be associated with
training for their given sport. With regard to the four putative ancillary types of PA, we focused
initially on the percentage of club sport players who also participated in each activity, because we
postulated that these four types of physical activity are more likely to be undertaken in order to
support participation in club sport than the reverse. To the extent that the participation in the
‘other’ activity is for the purpose of preparing and enhancing the capacity for the sporting activity,
then these percentages would notionally represent an extra quantum of physical activity indirectly
attributable at least in part to club sport, over and above the activity directly associated with club
sport.
Of course, it is unlikely that all of this ‘other’ activity is driven entirely by sport participation.
Furthermore, it is not possible to calculate from ERASS data a measure of the dosage or volume
of activity (frequency × duration × intensity) associated with each particular reported activity, and
so the percentages do not precisely represent a percentage increase in the dosage of physical
activity. Notwithstanding these limitations, these percentages may provide a broad indication of
the extent of a hidden benefit of sport in the form of preparatory or ancillary physical activity.
Turning to the converse percentages – the percentage of participants in each activity who also
played club sport – these may be regarded as providing a measure of the relative importance of
sport participation in driving participation in each type of physical activity. This is most clearly
52

Sport Participation in Victoria and the Contribution of Sport to Physical Activity Levels
demonstrated in the case of weight training. Only 2.8% of club sport participants undertook
weight training in the 12 months prior to the survey, but they represented 20.9% of all those who
did weight training. Conversely, 21.6% of club sport participants walked in the 12 months prior to
the survey, but they represented only 13.1% of all those who walked.
However, to complete the picture, we must also consider participation in these four activities
among non-sport club participants. When we do this, we see that overall, participation in
aerobics/fitness training and walking were negatively associated with club sport participation.
From this perspective, these two activities may be seen as providing alternatives to club sport
participation, rather than being promoted by club sport participation. Further, relatively small
numbers participate in weight training, and there was little discernible evidence of any
relationship with club sport participation. Only in the case of running was the proportion of
participants higher among club sport participants than non-club sport participants, indicating a
tendency for club sport to promote extra running activity.
Conclusion Overall, club based sport participation contributes considerably to LTPA in general. Furthermore,
nearly all sport participation is at a health enhancing level. Therefore, sports clubs play an
important role as a setting for LTPA and more broadly health promotion through sport. The
structure of the provision of sport through clubs will continually require consideration given the
changing nature of the population’s desires when it comes to structure and flexibility of LTPA
pursuits.
Sport participants were significantly less likely than non-sport participants to participate in
aerobics/fitness training and walking. This suggests that these non-sport activities are done
instead of sport participation rather than as an additional activity for the purpose of sport training.
However sport participants were significantly more likely than non-sport participants to run,
suggesting that running is used as a training activity for sport. This may be related to the higher
intensity of running than walking and in many instances than aerobics/fitness training.
Health promotion and more specifically PA policy should consider the role that sport can provide
for health.
53
Sport Participation in Victoria and the Contribution of Sport to Physical Activity Levels
References 1. Côté, J.,J. Hay, Children's involvement in sport: A developmental perspective, in
Psychological foundations of sport, J.M. Silva and D.E. Stevens, Editors. 2002, Allyn & Bacon: Boston, MA. p. 503-519.
2. Côté, J., R. Lidor,D. Hackfort. ISSP position stand: To sample or to specialize? Seven postulates about youth sport activities that lead to continued participation and elite performance. International Journal of Sport and Exercise Psychology 2009; 7(1):7-17.
3. Eime, R., W. Payne,J. Harvey. Trends in organised sport membership: Impact on sustainability. Journal of Science and Medicine in Sport 2009; 12(1):123-129.
4. Commonwealth of Australia, Backing Australia's Sporting Ability: A more active Australia, 2001, Department for Sport and Tourism: Canberra.
5. VicHealth, Partnerships for Health Scheme (2003-2006), funding guidelines, 2003: Melbourne, Australia.
6. Eime, R., J. Harvey, N. Sawyer, M. Craike, C. Symons, R. Polman,W. Payne. Understanding the contexts of adolescent female participation in sport and physical activity. Research Quarterly for Exercise and Sport 2013; 84(2):157-166.
7. Côté, J.,M. Vierimaa. The developmental model of sport participation: 15 years after its first conceptualization. Science & Sports in press; (0).
8. Eime, R., M. Casey, J. Harvey, N.S. Sawyer, CM,W. Payne. Socioecological factors potentially associated with participation in physical activity and sport: A longitudinal study of adolescent girls. Journal of Science and Medicine in Sport 2014; In Press.
9. Australian Sports Commission, Market segmentation for sport participation- adults, 2013, Australian Sports Commission: Canberra.
10. Eime, R., J. Harvey, M. Craike, C. Symons,W. Payne. Family support and ease of access link socio-economic status and sports club membership in adolescent girls: A mediation study. International Journal of Behavioral Nutrition and Physical Activity 2013; 10(50).
11. Eime, R., W. Payne, M. Casey,J. Harvey. Transition in participation in sport and unstructured physical activity for rural living adolescent girls. Health Education Research 2010; 25(2):282-293.
12. Casey, M., R. Eime, W. Payne,J. Harvey. Using a socioecological approach to examine participation in sport and physical activity among rural adolescent girls. Qualitative Health Research 2009; 19(7):881-893.
13. Wheeler, S. The significance of family culture for sports participation. International Review for the Sociology of Sport 2012; 47(2):235-252.
14. Eime, R., N. Sawyer, J. Harvey, M. Casey, H. Westerbeek,W. Payne. Integrating Public Health and Sport Management: Sport participation trends 2001-2010. Sport Management Review 2014; In press.
15. Gabbard, C., Lifelong motor development. 5th ed2008, San Francisco, CA: Pearson Benjamin Cummings.
16. Mugford, S., The status of sport in rural and regional Australia: Literature, research and policy options, 2001, Qualitative and Quantitative Social Research, Adelaide, Australia.
17. Tonts, M. Competitive sport and social capital in rural Australia. Journal of Rural Studies 2005; 21:137-149.
18. Gard, M. Sport, physical education and country towns: Diverse enough? Education in Rural Australia 2001; 11:19-26.
19. Eime, R., J. Young, J. Harvey, M. Charity,W. Payne. A systematic review of the psycyhological and social benefits of participation in sport for adults: Informing development of a conceptual model of health through sport. International Journal of Behavioral Nutrition & Physical Activity 2013; 10(135):14.
20. Eime, R., J. Young, J. Harvey, M. Charity,W. Payne. A systematic review of the psychological and social benefits of participation in sport for children and adolescents: informing development of a conceptual model of health through sport. International Journal of Behavioral Nutrition & Physical Activity 2013; 10(98).
54

Sport Participation in Victoria and the Contribution of Sport to Physical Activity Levels
21. Eime, R., J. Harvey, W. Brown,W. Payne. Does sports club participation contribute to health-related quality of life? Medicine and Science in Sports and Exercise 2010; 42(5):1022-1028.
22. Eime, R., J. Harvey,W. Payne. Dose-response of women's Health-Related Quality of Life (HRQoL) and life satisfaction to physical activity. Journal of Physical Activity and Health 2014; 11:330-338.
23. Eime, R., J. Harvey, M. Charity,M. Casey, Physical activity, sport and health in the City of Brimbank: A report to Mitchell Institute for Health and Educaiton Policy, 2014, Federation University, Victoria University.
24. US Department of Health and Human Services, Physical activity guidelines advisory committee report, 2008.
25. Lee, I.M., E.J. Shiroma, F. Lobelo, P. Puska, S.N. Blair,P.T. Katzmarzyk. Effect of physical inactivity on major non-communicable diseases worldwide: an analysis of burden of disease and life expectancy. The Lancet 380(9838):219-229.
26. US Department of Health and Human Services, 2008 Physical Activity Guidelines for Americans, 2008.
27. Hallal, P., L. Andersen, F. Bull, R. Guthold, W. Haskell,U. Ekelund. Global physical activity levels: surveillance progress, pitfalls, and prospects. The Lancet 2012; 380:247-257.
28. Abu-Omar, K.,A. Rütten. Relation of leisure time, occupational, domestic, and commuting physical activity to health indicators in Europe. Preventive Medicine 2008; 47(3):319-323.
29. Khan, K., A. Thompson, S. Blair, J. Sallis, K. Powell, F. Bull,A. Bauman. Sport and exercise as contributors to the health of nations. The Lancet 2012; 380:59-64.
30. Kull, M., M. Ainsaar, E. Kiive,L. Raudsepp. Relationship between low depressiveness and domain specific physical activity in women. Health Care Women Int 2012; 33(5):457-72.
31. Omorou, Y., M. Erpelding, H. Escalon,A. Vuillemin. Contribution of taking part in sport to the association between physical activity and quality of life. Quality of Life Research 2013; 22(2021-2029).
32. Kokko, S., L. Green,L. Kannas. A review of settings-based health promotion with applications to sports clubs. Health Promotion International 2013; Advanced Access.
33. Eime, R., W. Payne,J. Harvey. Making sporting clubs healthy and welcoming environments: A strategy to increase participation. Journal of Science and Medicine in Sport 2008; 11(2):146-154.
34. Sigmundova, D., J. Zacpal,E. Sigmund. The level of influence of organised physical activity on meeting the healthy criterion of 10,000 steps daily: Application of regression and formal concept analysis. Acta Univ. Palacki. Olomuc., Gymn 2010; 40(4):15-23.
35. Wickel, E.,J. Eisenmann. Contribution of youth sport to total daily physical activity ampong 6- to 12-yr-old boys. Medicine and Science in Sports and Exercise 2007; 39(9):1493-1500.
36. Australian Sports Commission, Participation in Exercise, Recreation and Sport. Annual report 2010, 2010, Australian Sports Commission: Canberra.
37. Bauman, A., N. Curac, L. King, K. Venugopal,D. Merom. Active, healthy cities- how does population physical activity vary between Australian cities? Health Promotion Journal of Australia 2012; 23(3):201-207.
38. Merom, D., A. Bauman,I. Ford. The public health usefulness of the exercise recreation and sport survey (ERASS) surveillance system. Journal of Science and Medicine in Sport 2004; 7:32-37.
39. Commonwealth of Australia, National sport and active recreation policy framework, 2011, Commonwealth of Australia: Canberra.
40. Henderson, K. A paradox of sport management and physical activity interventions. Sport Management Review 2009; 12(2):57-65.
41. Vella, S., D. Cliff, A. Okely, M. Scully,B. Morley. Associations between sports participation, adiposity and obesity-related health behaviors in Australian adolescents. International Journal of Behavioral Nutrition and Physical Activity 2013; 10(1):113.
42. Renfrow, M., J. Caputo, S. Otto, R. Farley,B. Eveland-Sayers. The relationship between sports participation and Health-Related Physical Fitness in Middle School and High School students. Physical Educator 2011; 68(3):118-123.
55

Sport Participation in Victoria and the Contribution of Sport to Physical Activity Levels
43. Donaldson, A.,C.F. Finch. Sport as a setting for promoting health. British Journal of Sports Medicine 2012; 46(1):4-5.
44. Corti, B., C. D'Arcy, J. Holman, R. Donovan, S. Frizzell,A. Carroll. Using sponsorship to create healthy environments for sport, racing and arts venues in Western Australia. Health Promotion International 1995; 10(3):185-197.
45. Crisp, B.R.,H. Swerissen. Critical processes for creating health-promoting sporting environments in Australia. Health Promotion International 2003; 18(2):145-151.
46. Dobbinson, S.J., J.A. Hayman,P.M. Livingston. Prevalence of health promotion policies in sports clubs in Victoria, Australia. Health Promotion International 2006; 21(2):121-129.
47. Casey, M., W. Payne,R. Eime. Building the health promotion capacity of sport and recreation organisations: A case study of Regional Sports Assemblies. Managing Leisure 2009; 14:112-124.
48. Casey, M., W. Payne,R. Eime. Organisational readiness and capacity building strategies of sporting organisations to promote health. Sport Management Review 2012; 15(1):109-124.
49. Kelly, B., L. Baur, A. Bauman, B. Smith, S. Saleh, L. King,K. Chapman. Health promotion in sport: An analysis of peak sporting organisations’ health policies. Journal of Science and Medicine in Sport 2010; 13(6):56-567.
50. Kokko, S., L. Kannas,J. Villberg, Health promotion profile of youth sports clubs: Club officials' and coaches' perceptions, in Health Promotion International2009. p. 1-10.
51. Kokko, S., L. Kannas, J. Villberg,M. Ormshaw. Health promotion guidance activity of youth sports clubs. Health Education 2011; 111(6).
52. Simonsen-Rehn, N., J. Øvretveit, R. Laamanen, S. Suominen, J. Sundell,M. Brommels. Determinants of health promotion action: comparative analysis of local voluntary associations in four municipalities in Finland. Health promotion international 2006; 21(4):274-283.
53. Kelly, B., L. King, A.E. Bauman, L.A. Baur, R. Macniven, K. Chapman,B.J. Smith Identifying important and feasible policies and actions for health at community sports clubs: A consensus-generating approach. Journal of Science and Medicine in Sport, In press.
54. Commonwealth of Australia, Australian Sport: The pathway to success, 2010. 55. Rowe, K., D. Shilbury, L. Ferkins,E. Hinckson. Sport development and physical activity
promotion: An integrated model to enhance collaboration and understanding. Sport Management Review 2013; 16(3): 364-377.
56

Sport Participation in Victoria and the Contribution of Sport to Physical Activity Levels
Publication Details This report was prepared by Rochelle Eime, Jack Harvey, Melanie Charity and Meghan Casey.
Contact Associate Professor Rochelle Eime VicHealth Research Practice Fellow- Physical Activity
Victoria University and Federation University, Australia [email protected] (03) 5327 9687 Data accuracy
This report is based on membership data provided by state sporting associations (SSAs) for each calendar year, together with data from the 2010 Exercise, Recreation and Sport Survey (ERASS). Data screening checks have led to anomalies being identified in a small proportion of the SSA data records. To the extent that it was possible to do so, these have been resolved after consultation with the SSAs. The results in this report are based on the datasets as they stand at the date of publication.
57